
Comparative Analysis of the Impact of Two Common Residue Burning Parameters on Urban Air Quality Indicators


Northeast Institute of Geography and Agroecology, CAS, Changchun 130102, China
*
Author to whom correspondence should be addressed.
Remote Sens. 2023, 15(15), 3911; https://doi.org/10.3390/rs15153911
Submission received: 19 June 2023
/
Revised: 14 July 2023
/
Accepted: 1 August 2023
/
Published: 7 August 2023
(This article belongs to the Section Remote Sensing in Agriculture and Vegetation)
Abstract
:Crop residue burning produces a lot of polluting gases and fine particles, endangering human health, damaging soil structure, and causing fire accidents. In addition to the impact of residue burning on the local environment, pollutants can spread with the wind to more distant areas and impact their air quality. Nevertheless, a comparative analysis of the impact of two common residue burning parameters, the number of residue fire points, and residue burned area on urban air quality indicators has not been reported. In this study, the correlation between these two different residue burning parameters on air quality in Daqing City (Western Heilongjiang Province, China) was investigated comparatively using the Visible Infrared Imaging Radiometer Suite (VIIRS) fire point product, the Moderate-resolution Imaging Spectroradiometer (MODIS) burned area product, and buffer zone analysis. The association between MODIS burned area products and air quality index (AQI) was found to be around 0.8. Meanwhile, it was found that the correlation between the number of residue fire points extracted from the VIIRS active fire products and air quality was above 0.6, again with a maximum of 0.75 at a buffer radius of 50 km. Within other levels of buffer zones, the correlation between residue burned area and AQI was consistently higher than that between residue fire points and AQI. By comparing the correlation between VIIRS fire points, MODIS burned area, and the concentration of each AQI pollutant, it can be found that the correlation between the concentration of each AQI pollutant and the residue burned area was higher than that and the fire points number. MODIS burned area monitoring, on the other hand, detects changes in the time series of images taken by satellite at two transit moments to obtain a new burned area and cumulative burned area during this period, allowing the monitoring of fire traces caused by fire points at non-transit moments. From analyzing the correlation between residue fire points, residue burned area, and the concentration of each pollutant (PM2.5, PM10, CO, NO2, SO2, and O3), we found significant correlations between residue burning and PM2.5, PM10, CO, and NO2 concentrations, with the highest correlation (R2) of 0.81 for PM2.5. Moreover, the correlation between residue burned area and PM2.5, PM10, CO, and NO2 concentrations was significantly higher than that between the number of residue fire points and their concentrations.
1. Introduction
Crop residue burning is the process of eliminating residue left in fields by fire after crop harvesting, in which a large number of pollutants such as Carbon Monoxide (CO), Carbon Dioxide (CO2), Nitrogen Dioxide (NO2), Sulfur Dioxide (SO2), Ammonia (NH3), Methane (CH4), Ozone (O3), and dust are produced [1,2,3,4] and emitted into the atmosphere [5,6]. The practice endangers human health, affects traffic, and causes fire accidents [7]. Also, crop residue burning severely damages soil structure and microflora for agricultural production, causing soil fertility to decline [8,9]. In addition to the impact of residue burning on the local environment, pollutants can spread with the wind to more distant areas and impact the air quality of surrounding areas, especially cities [10,11], which show a random and scattered spatial distribution. Crop residue burning in northeast China is mainly concentrated in late October (the harvest season) to May before the following year’s plowing [12] and shows a random and scattered spatial distribution. In addition, the process is complicated by crop residue burning being significantly affected by the weather. Furthermore, farmers usually burn crop residue under good atmospheric diffusion conditions to burn it more fully and better for subsequent cultivation operations [13]. Because of the spatial–temporal heterogeneity of crop residue burning, manual monitoring is not the best approach because it requires much time and human and financial resources.
With the development of satellite remote sensing, many research scholars began to notice the efficiency of remote sensing satellite images for residue fire points monitoring [14,15,16]. These studies found that remote sensing technology can provide dynamic macro monitoring of residue fire information. Using remote sensing images with high spatio-temporal resolution, we can accurately obtain crop residue burning information such as the spatial information of residue fire points [17] and burned area [18]. Schroeder et al. provide a new active fire detection method for the Visible Infrared Imaging Radiometer Suite (VIIRS) that is primarily generated by 375 m thermal infrared remotely sensed data. Increased performance was achieved by utilizing the 375 m active fire data in comparison to the VIIRS 750 m baseline fire product, resulting in 3-fold and 25-fold increases in the absolute number of fire pixels recorded using daytime and nighttime data, respectively. The VIIRS 375 m fire data demonstrated much higher mapping capabilities compared to the original MODIS fire detection product [19]. Vadrevu et al. compared the performance of several methodologies for predicting total particulate matter emissions based on the VIIRS 375 m active fire product and the MODIS 1 km fire product. Compared to the MODIS Aqua and Terra sensors, the number of fires observed by the VIIRS was 4.8 times greater. Additionally, VIIRS recorded 6.5 times as many fires as Aqua [20].
At the same time, many scholars have also started to study the impact of crop residue burning on urban air quality. Jain et al. studied the emissions of pollutants from crop residue burning and the effect on the rate of change of air pollutant emissions [21]. Using ground observation and MODIS active fire data, Zhuang et al. investigated the fluctuations and characteristics of PM10 (particulate matter with an aerodynamic diameter of less than 10 μm) and PM2.5 (particulate matter with an aerodynamic diameter of less than 2.5 μm) [22,23] concentrations and the associations with variations in crop residue burning [24]. Li et al. investigated crop residue open burning emissions in central China using a statistical technique. Using the VIIRS 375 m active fire product and observed emission factors, the open burning proportion of residue was utilized to improve the precision of estimated emissions [25]. The MODIS products MOD14A1/MYD14A1 were employed to better understand the long-term spatial and temporal variations of crop residue burning in China [26]. There have been many studies on the positive correlation between the number of residue-burning fires and air quality. However, because satellite remote sensing can only monitor residue-burning fires at the moment of transit, and not when the satellite is not in transit, there is a significant limitation in its usage. In contrast, no such limitation exists in studying the correlation between residue burned area extracted by satellite and in situ air quality.
Based on remote sensing images taken by satellites at two transit times, the time-series change in burning index is detected to extract a new residue burned area. Based on remote sensing images taken during satellite transit, a new residue burned area was extracted using time series change detection from the burning index [26,27]. Roteta et al. built a locally adapted multitemporal two-phase burned area method employing Sentinel-2 short- and near-infrared waveband data and MODIS active fire products [27]. When 13 remotely sensed indices were compared based on ranked correlations, the Normalized Burn Ratio (NBR) was highest for both the post-burn and pre-/post-burn approaches. In addition, according to research by Epting et al., high correlations existed between the NBR and field-based Composite Burn Index values [28]. These burned area extraction methods provide a solid foundation for establishing the relationship between residue burning and air quality. Nevertheless, a comparative analysis of the impact of two common residue burning parameters, the number of residue fire points, and residue burned area on urban air quality indicators has not been reported.
Yang et al. integrated satellite and in situ observations with regional spatial quality to construct a model for assessing the impact of open-air biomass burning on surface PM2.5 concentrations in the context of severe haze in northeast China. Simulation outcomes revealed that open-air biomass burning accounted for 52.7% of PM2.5 concentrations in northeast China [29]. Li et al. conducted an analysis of air quality pollution characteristics, causes of haze formation, and the effects of the straw burning ban on local air quality in Suihua City, utilizing air quality data, aerosol optical depth (AOD) data, and fire point products. The findings revealed that seasonal crop residue burning was a significant contributor to air pollution in Suihua City during late autumn and early spring [30]. Cui et al. examined the spatial and temporal patterns of straw burning in northeast China between 2013 and 2017. The research demonstrated that the gaseous emissions resulting from the combustion of straw had a noteworthy effect on the quality of air, particularly during the autumn and winter periods. A strong correlation was observed between PM2.5 and straw burning, with a statistical significance of p < 0.05 [17].
To address the problems raised in previous studies on the correlation between fire points and urban air quality, the objectives of the present research were (i) to analyze the correlation among the number of residue fire points, residue burned area, air quality index (AQI), and the concentration of each pollutant (PM2.5, PM10, SO2, CO, NO2, and O3) using the fire point product of VIIRS/MODIS and the area burned product of MOD64; and (ii) to discuss the effects of crop residue burning on the air quality of typical industrial cities in northeast China using wind direction data.
2. Methods
2.1. Overview of the Study Area
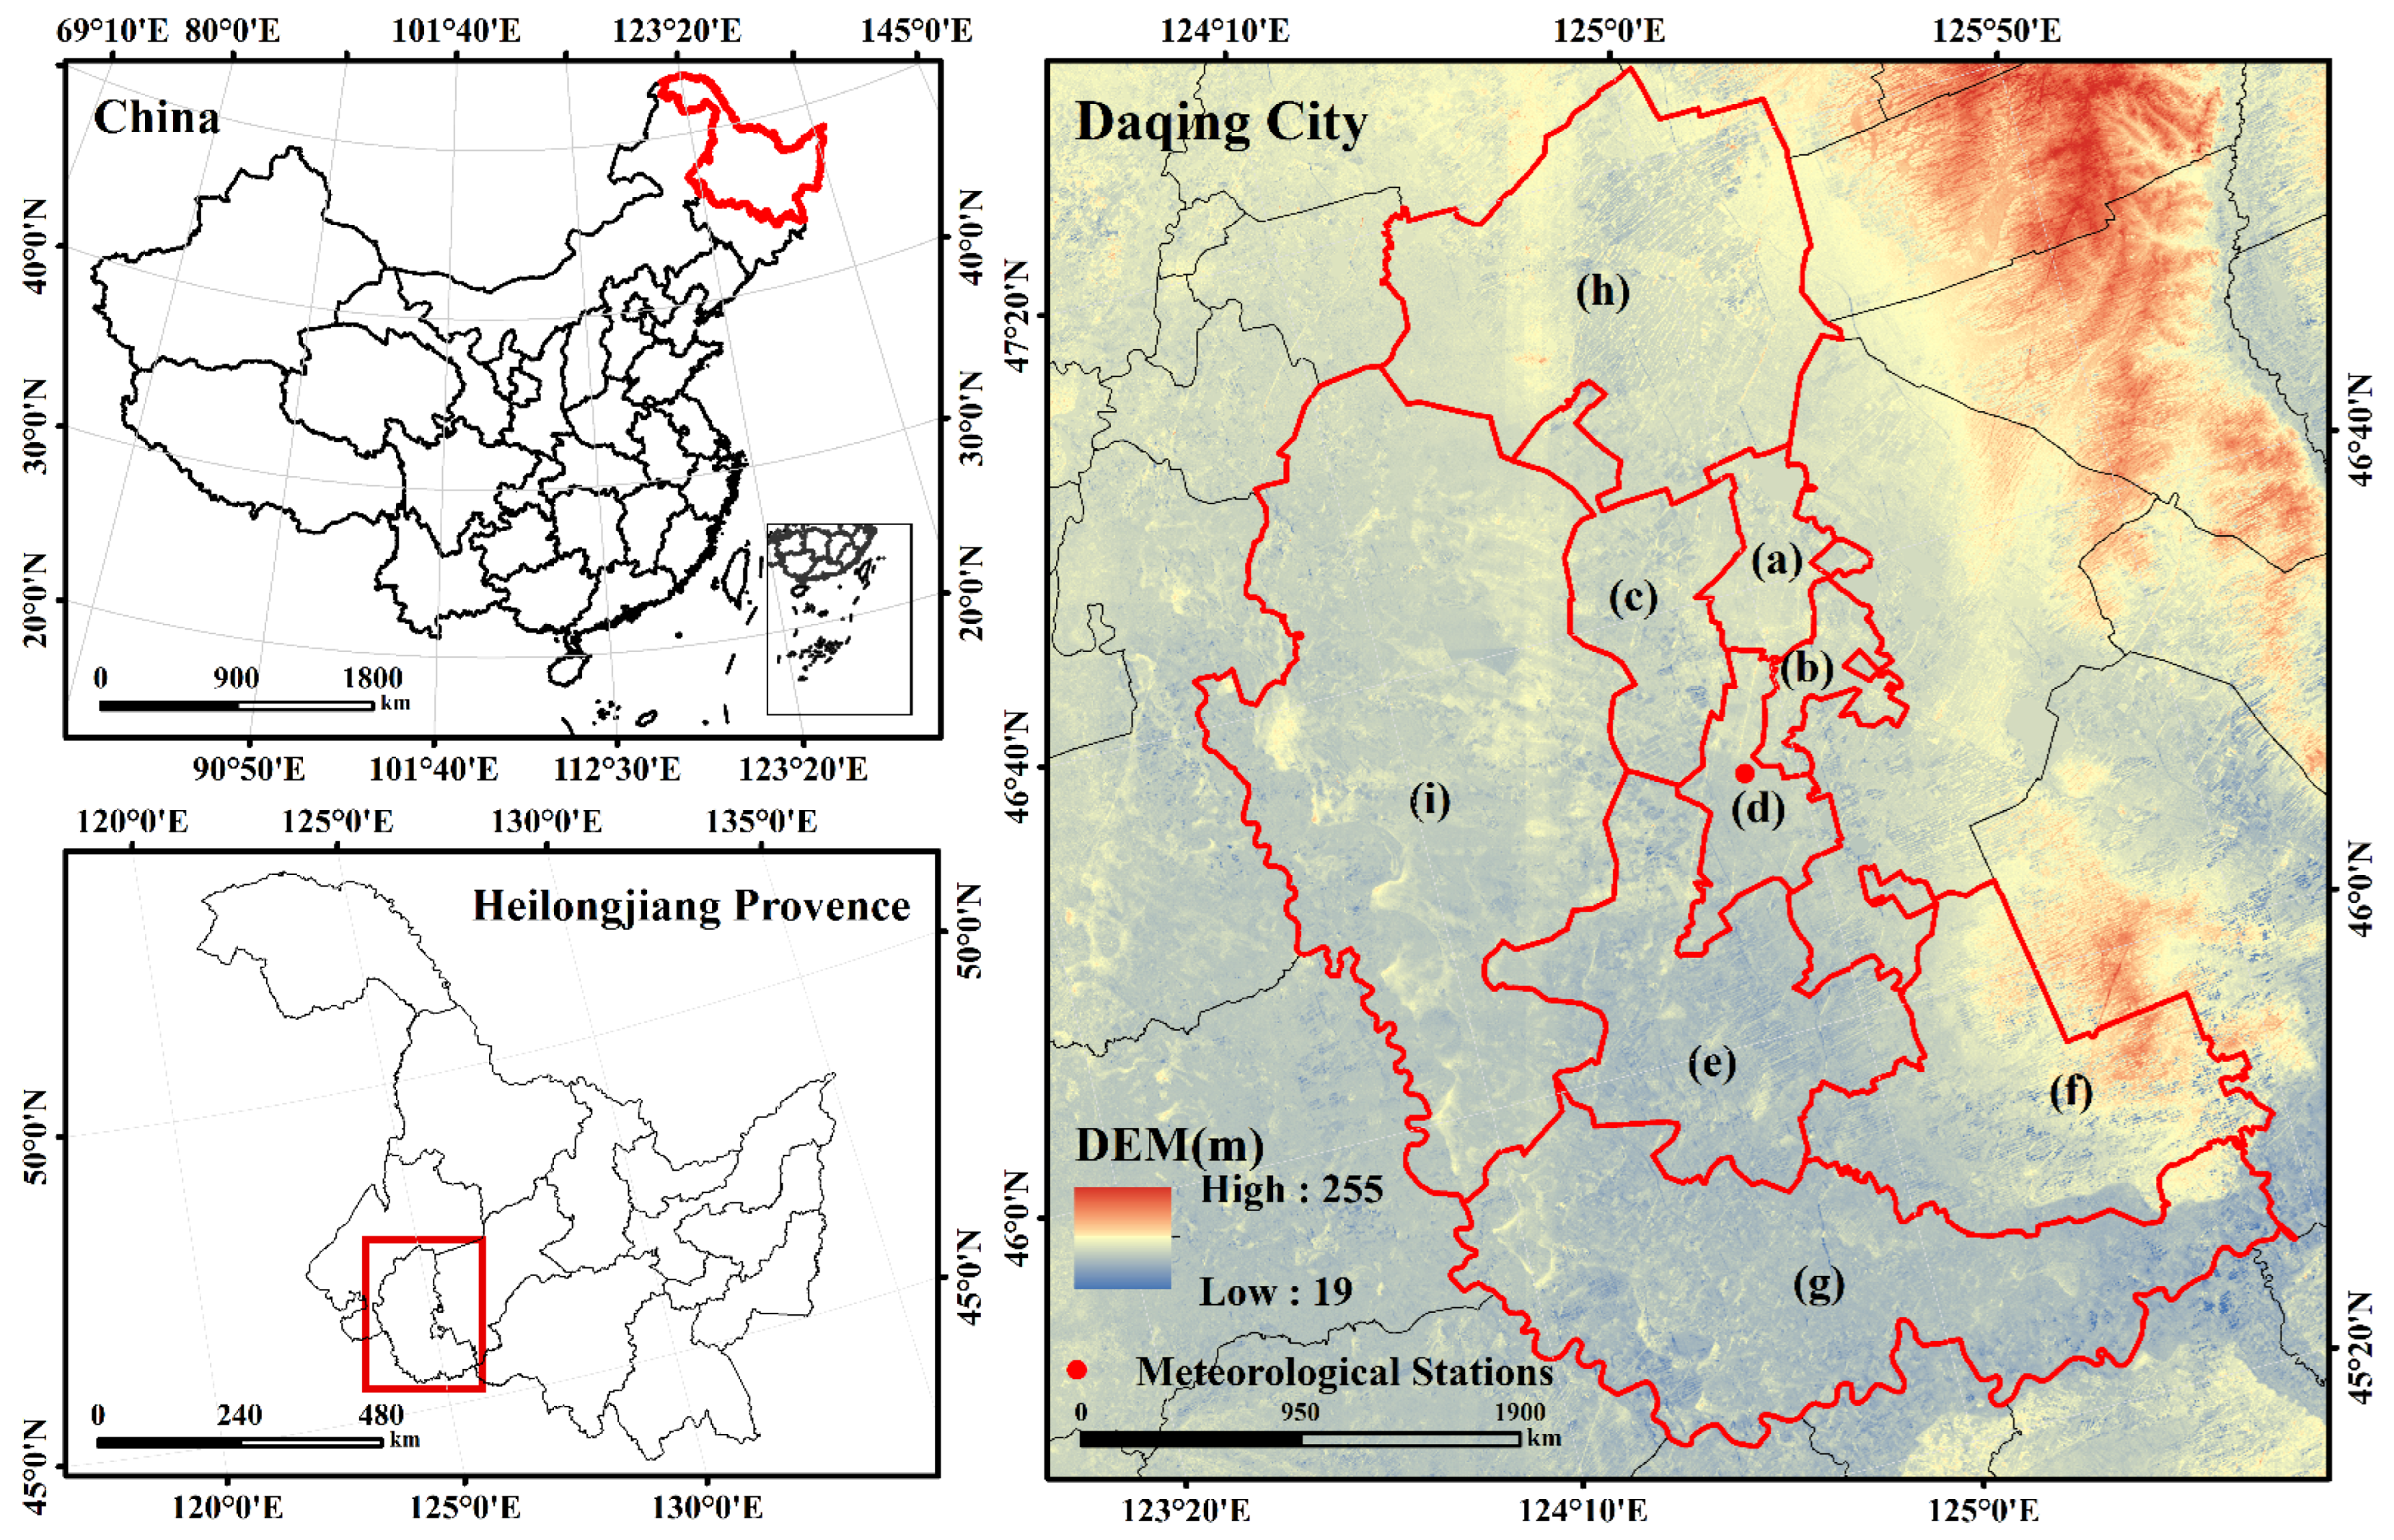
In this study, Daqing City and its surrounding areas in Heilongjiang Province were used as the study area. Daqing City is located in the middle of the Songnen Plain in northeast China, in western Heilongjiang Province, adjacent to Jilin Province in the south, connected to Suihua City in the east, and connected to Qiqihar City in the west and north, with a geographical range of 45°46′ to 46°55′N latitude and 124°19′ to 125°12′E longitude (as shown in Figure 1). Daqing is located in the north temperate continental monsoon climate zone. Influenced by the cold air inland from Inner Mongolia and the warm monsoon from the ocean, the average annual precipitation is about 600 mm. The average temperature in winter is −16.3 °C, and the average temperature in summer is about 20.5 °C [31]. Consequently, the four seasons are distinct, with a windy spring and autumn, a cold winter, and summer bringing the bulk of the rainfall. There is a significant temperature difference between day and night, and a short frost-free period throughout the year, with rain and heat in the same season. Daqing, one of the typical industrial cities in Heilongjiang Province, is the tenth largest oil field in the world and the base of China’s most significant oil production and petrochemical products industries, with annual crude oil production reaching over 40 million tons. Meanwhile, Daqing is also a sizeable food-producing city in Heilongjiang Province, with 621,800 hectares of farmland in 2019, accounting for 29.3% of the land area. The crops planted in Daqing are mainly corn, rice, soybeans, and other crops, of which maize dominates the grain crops, with a planting area of 412,800 hectares, accounting for 66.4% of the total farmland area. The total grain production in 2019 was also as high as 4.5 million tons, so a large amount of residue will inevitably be produced in the agricultural process [32]. According to the air quality historical data, Daqing City has had a higher AQI in February–March in the last decade, which may be related to crop residue burning in its surrounding area, so we take February–March 2019 as an example for the crop residue burning study.
2.2. Data Acquisition
2.2.1. MODIS and VIIRS Data
MODIS is one of the sensors on board the Terra and Aqua satellites developed by NASA. MODIS has 36 bands with a spectral range of 0.4–14.4 μm and a high temporal resolution of 1–2 days to complete global observations. The MCD64A1 [33] burned area product was estimated from the 500 m MODIS surface reflectance and 1 km active fire observation products [34]. The MCD64A1 product contains five data layers (Burn Date, Burn Date Uncertainty, QA, First Day, and Last Day). We only need the Burn Date data layer and then can extract the area burned within each day for the time range of 1 February to 31 March 2019.
VIIRS is one of the sensors of the SUOMI National Polar-orbiting Partnership (NPP) satellite system. The VIIRS sensor has 22 spectral bands in the 0.41–12.5 μm wavelength range, with a broader radiation detection range. It provides more than 20 environmental products, including cloudiness, ocean surface temperature, polar winds, vegetation index, aerosols, fire, ice, snow, and vegetation. This study uses the latest fire monitoring product from the VIIRS active fire product: Fire Information for Resource Management System (FIRMS) [35], whose algorithm is based on an improved MODIS Fire and Thermal Anomaly (MOD14/MYD14) algorithm. The higher spatial resolution of the VIIRS active fire data product (375 m, higher than MODIS) not only enhances the monitoring capability of smaller fire-burned areas but also strengthens the ability to monitor dynamic changes in fires. It also reduces the possibility of misclassifying false fire points with similar spectral characteristics. The data are available from (https://firms.modaps.eosdis.nasa.gov/map/, accessed on 11 July 2023) [36] and were downloaded for this study from 1 February to 31 March 2019.
Based on the VIIRS fire point data product and 30 m land cover data (http://www.resdc.cn/, accessed on 11 July 2023) [37], the Clip function module in ArcGIS 10.1 was used to extract information on residue fire points from farmland. In addition, the Zonal Statistics module was employed to estimate the number of residue fire points in the surrounding areas of Daqing City daily. For the MODIS burned area data, we first needed to convert the projection coordinates and image stitching and resampling with the help of the MRT processing tool. Then, ArcGIS 10.1 and the land cover data were applied to extract the residue burned area.
2.2.2. Air Quality Data
To accurately analyze the air pollution conditions caused by residue burning, we compiled the daily average AQI for the study area using the website of the Air Quality Historical Data Query (https://www.aqistudy.cn/historydata/, accessed on 11 July 2023) [38]. AQI is a dimensionless index that quantifies air quality conditions and is suitable for indicating short-term air quality conditions and trends in cities. As Figure 1 shows, the Daqing air monitoring station belongs to the national air quality/meteorological observing station network; its location is 125.08° longitude and 46.34° latitude, and the altitude of the observation point is 147.20 m above sea level. This study’s air quality monitoring method is the β-ray absorption method or the micro-oscillation balance method specified in the Chinese Specifications and Test Procedures for Ambient Air Quality Continuous Automated Monitoring System for PM10 and PM2.5 (HJ653-2013). AQI is calculated from six criteria for air pollutants: fine particulate matter, respirable particulate matter, SO2, NO2, CO, and O3. Therefore, the higher the AQI value, the worse the corresponding air quality, indicating more severe air pollution. The spatial position of the air quality site coincided with the meteorological station located in the center area of Daqing City, as shown in Figure 2.
2.2.3. Land Cover Data
Land cover is essential information for climate change studies and ecological assessments. The cropland data used in this study are the Global 30 m Fine Land Cover 2020 product (GLC_FCS30-2020) [39], which contains 30 surface coverage types and provides practical data support for global fine ground cover applications. It is based on the Global Fine Land Cover 2015 product (GLC_FCS30-2015), 2019–2020 time series Landsat surface reflectance data, Sentinel-1 SAR data, DEM data, global thematic auxiliary datasets, and a priori knowledge datasets to generate the product. In addition, the product’s accuracy was assessed using the globally integrated multi-source validation dataset (containing 45,000 validation sample points). The results showed that the overall accuracy of GLC_FCS30-2015 was 82.5% with a kappa coefficient of 0.78 under the validation system consisting of 10 primary classes and 68.7% with a kappa coefficient of 0.68 under the validation system consisting of 24 fine classes. Therefore, these data are sufficient for the needs of this study.
2.2.4. Meteorological Data
Meteorological data are an essential factor influencing pollutant dispersion. Therefore, meteorological data in the study area needed to be collected. The location of the air monitoring site in Daqing is 125.08° longitude and 46.34° latitude. The dataset of daily values of Chinese surface climate information used in this study was obtained from the China Meteorological Data Network (http://data.cma.cn, accessed on 11 July 2023) [40]. This dataset is derived from each province’s national daily ground surface data by the National Meteorological Information Center (NMIC) of the China Meteorological Administration [41]. We selected data that affect the dispersion of pollutants, including the average wind speed and prevailing wind direction. These data were quality controlled by the National Meteorological Administration, and changes were made to the records where errors were identified. According to the National Meteorological Administration statistics, the average error rate of wind direction and wind speed was 1.6%, and the data reliability was high enough to meet the requirements of this experiment.
2.3. Research Methods
A city’s air quality can be affected not only by factors such as production and daily life within the city but also by the input of air pollutants from its surrounding regions. Furthermore, the diffusion and spread of atmospheric pollutants are affected by meteorological factors such as wind direction, wind speed, humidity, atmosphere boundary layer height, and precipitation. Therefore, it is necessary to analyze the correlation between the number of residual fires in different buffer zones centered in the city and the burned area and the AQI of the city to discuss the influence of residue burning on AQI. In this study, the air quality monitoring station of Daqing City was taken as the center of the buffer zone. First, buffer zones with radii of 25 km, 50 km, 75 km, and 100 km were defined. Then the number of residue fire points and burned area in each buffer zone layer were measured separately using the statistic tool in ArcGIS 10.1.
Based on the remote sensing monitoring information of residue burning, we conducted correlation analysis between it and air quality using SPSS25 software. First, we used the Pearson analysis module in SPSS25 to investigate the correlations between the number of residue fire points, burned area, and AQI and the concentrations of six pollutants, respectively. In addition, we divided wind direction into 16 directions to investigate how they affected the concentration of the six possible air pollutants (PM2.5, PM10, SO2, CO, NO2, and O3) from residue burning.
The Pearson product-moment correlation coefficient (PPMCC) quantifies the degree of correlation between two variables, with a range between −1 and 1 [42]. In general, the correlation strength of variables is determined by the following correlation coefficient value ranges: 0.8–1.0 for a very high correlation; 0.6–0.8 for a strong correlation; 0.4–0.6 for a moderate correlation; 0.2–0.4 for a weak correlation; and 0.0–0.2 for a very weak correlation.
3. Results
3.1. Spatial—Temporal Distribution Characteristics of Fire Points and Burned Area of Crop Residue
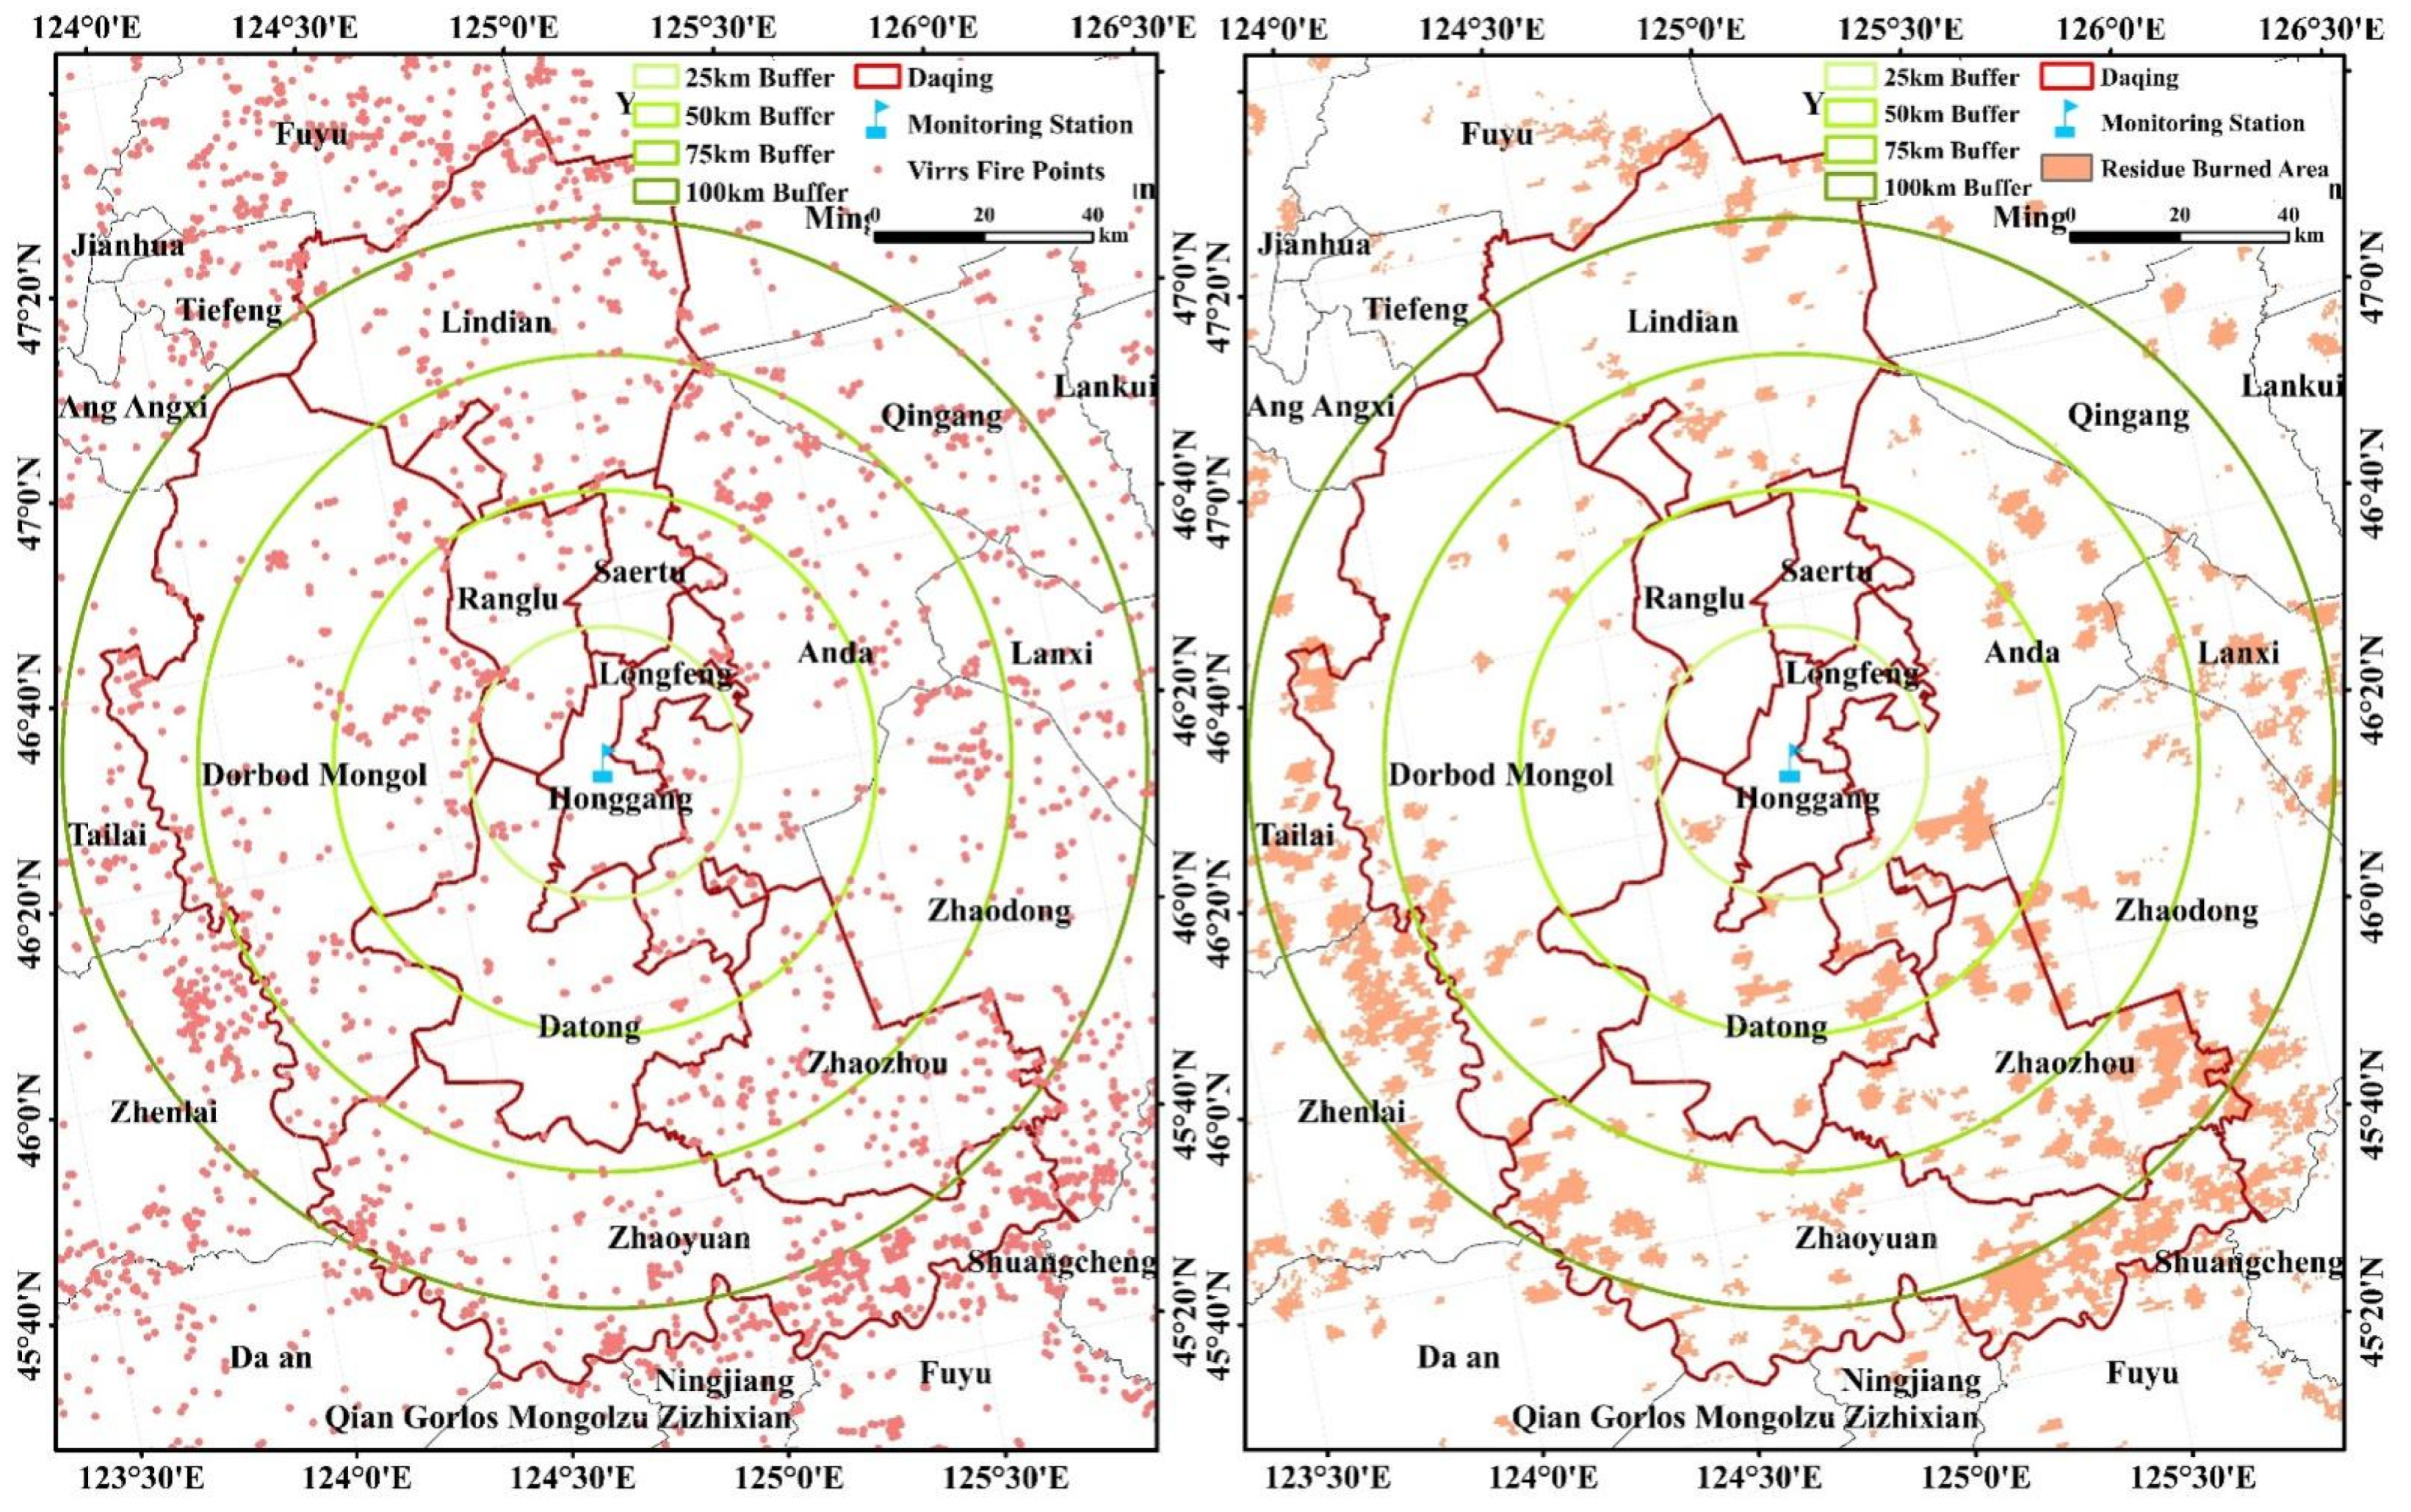
By processing with the VIIRS active fire product and MCD64A1 burned area product, we obtained the spatial–temporal distribution of fire points and burned area of crop residue around Daqing City in February–March 2019, as shown in Figure 2. Based on geometric analysis, we found that the spatial–temporal distribution characteristics of fire points and burned area of crop residue are the same and mainly concentrated in Zhaozhou County, Zhaoyuan County, Dorbud County, and Lindian County, as shown in Table 1.
Zonal statistics of the VIIRS fire point data, MODIS burned area data using the Zonal Statistics module, and the land cover data in ArcGIS 10.1 are shown in Table 1. It can be concluded that the areas in Daqing where there is more residue burning are Zhaozhou County, Zhaoyuan County, Dorbud County, and Lindian County, where the number of residue fire points is greater than 100 and the burned area is greater than 40 km2. The number of residue fire points in Zhaozhou County is the highest at 633, followed by 584 in Zhaoyuan County and 538 and 374 in Dorbud County and Lindian County. In contrast, the number of residue fire points in other areas is minimal. The spatial distribution of residue burned area is the same as the residue fire point. Among them, the residue burned area is larger in Zhaoyuan County, Zhaozhou County, Dorbud County, and Lindian County. The residue burned area in Zhaoyuan County reached 631.74 km2, followed by 218.46 km2 in Dorbud County, whereas the residue burned area in Lindian County, Datong District, and Zhaozhou County reached 128.27 km2, 75.99 km2, and 47.70 km2, respectively. With residue fire points showing the same spatial distribution characteristics, the area of crop residue burning is also minimal in those urban areas of Honggang District, Saltu District, Longfeng District, and Ranghu District.
To further study the correlation between residue burning information and farmland area, we conducted a Pearson correlation analysis between farmland area and the number of residue fire points and burned area in each county, as shown in Table 2. The results showed a significant correlation (p < 0.05) of 0.75 between residue fire points and farmland area, whereas a highly significant correlation (p < 0.01) of 0.85 was found between residue burned area and farmland area. These results indicated that there was indeed a significant correlation between residue fire points and burned area and the area of farmland, and the correlation between residue burned area and farmland area was higher than that between the number of residue fire points and farmland area.
3.2. Correlation Analysis between Residue Burning Indicators and Air Pollutant Concentration
3.2.1. Correlation Analysis between Residue Burning Indicators and AQI
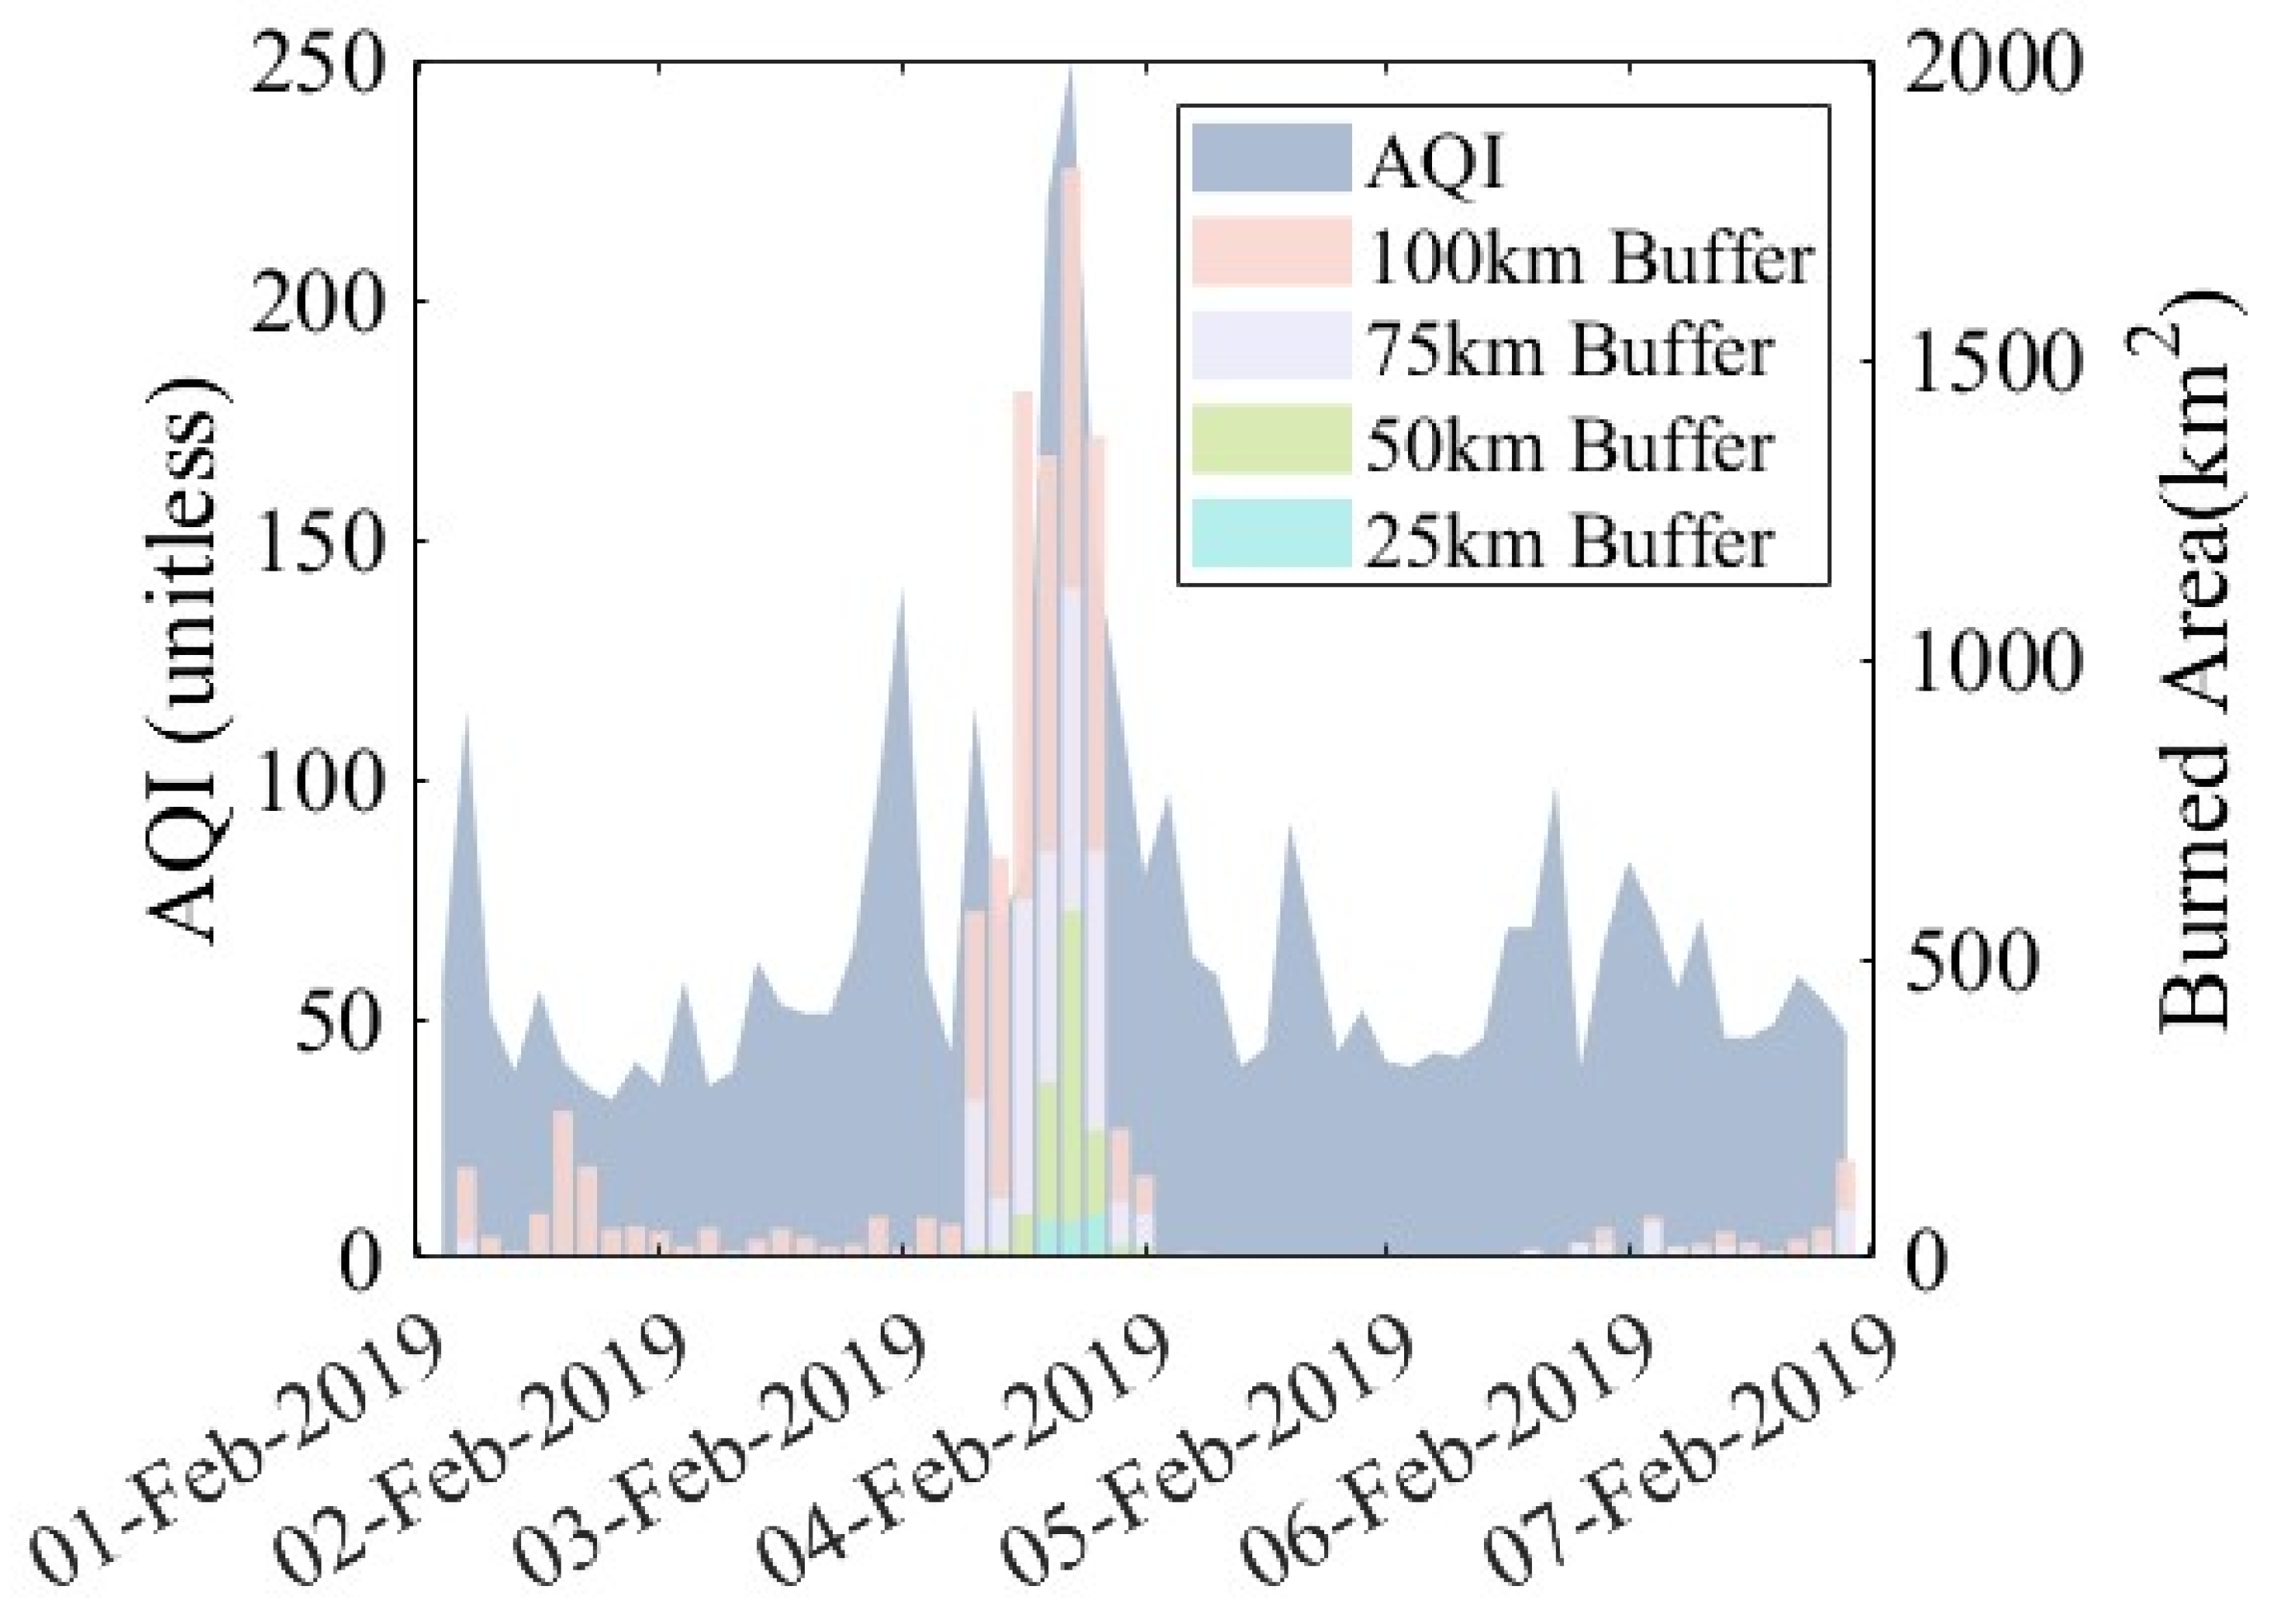
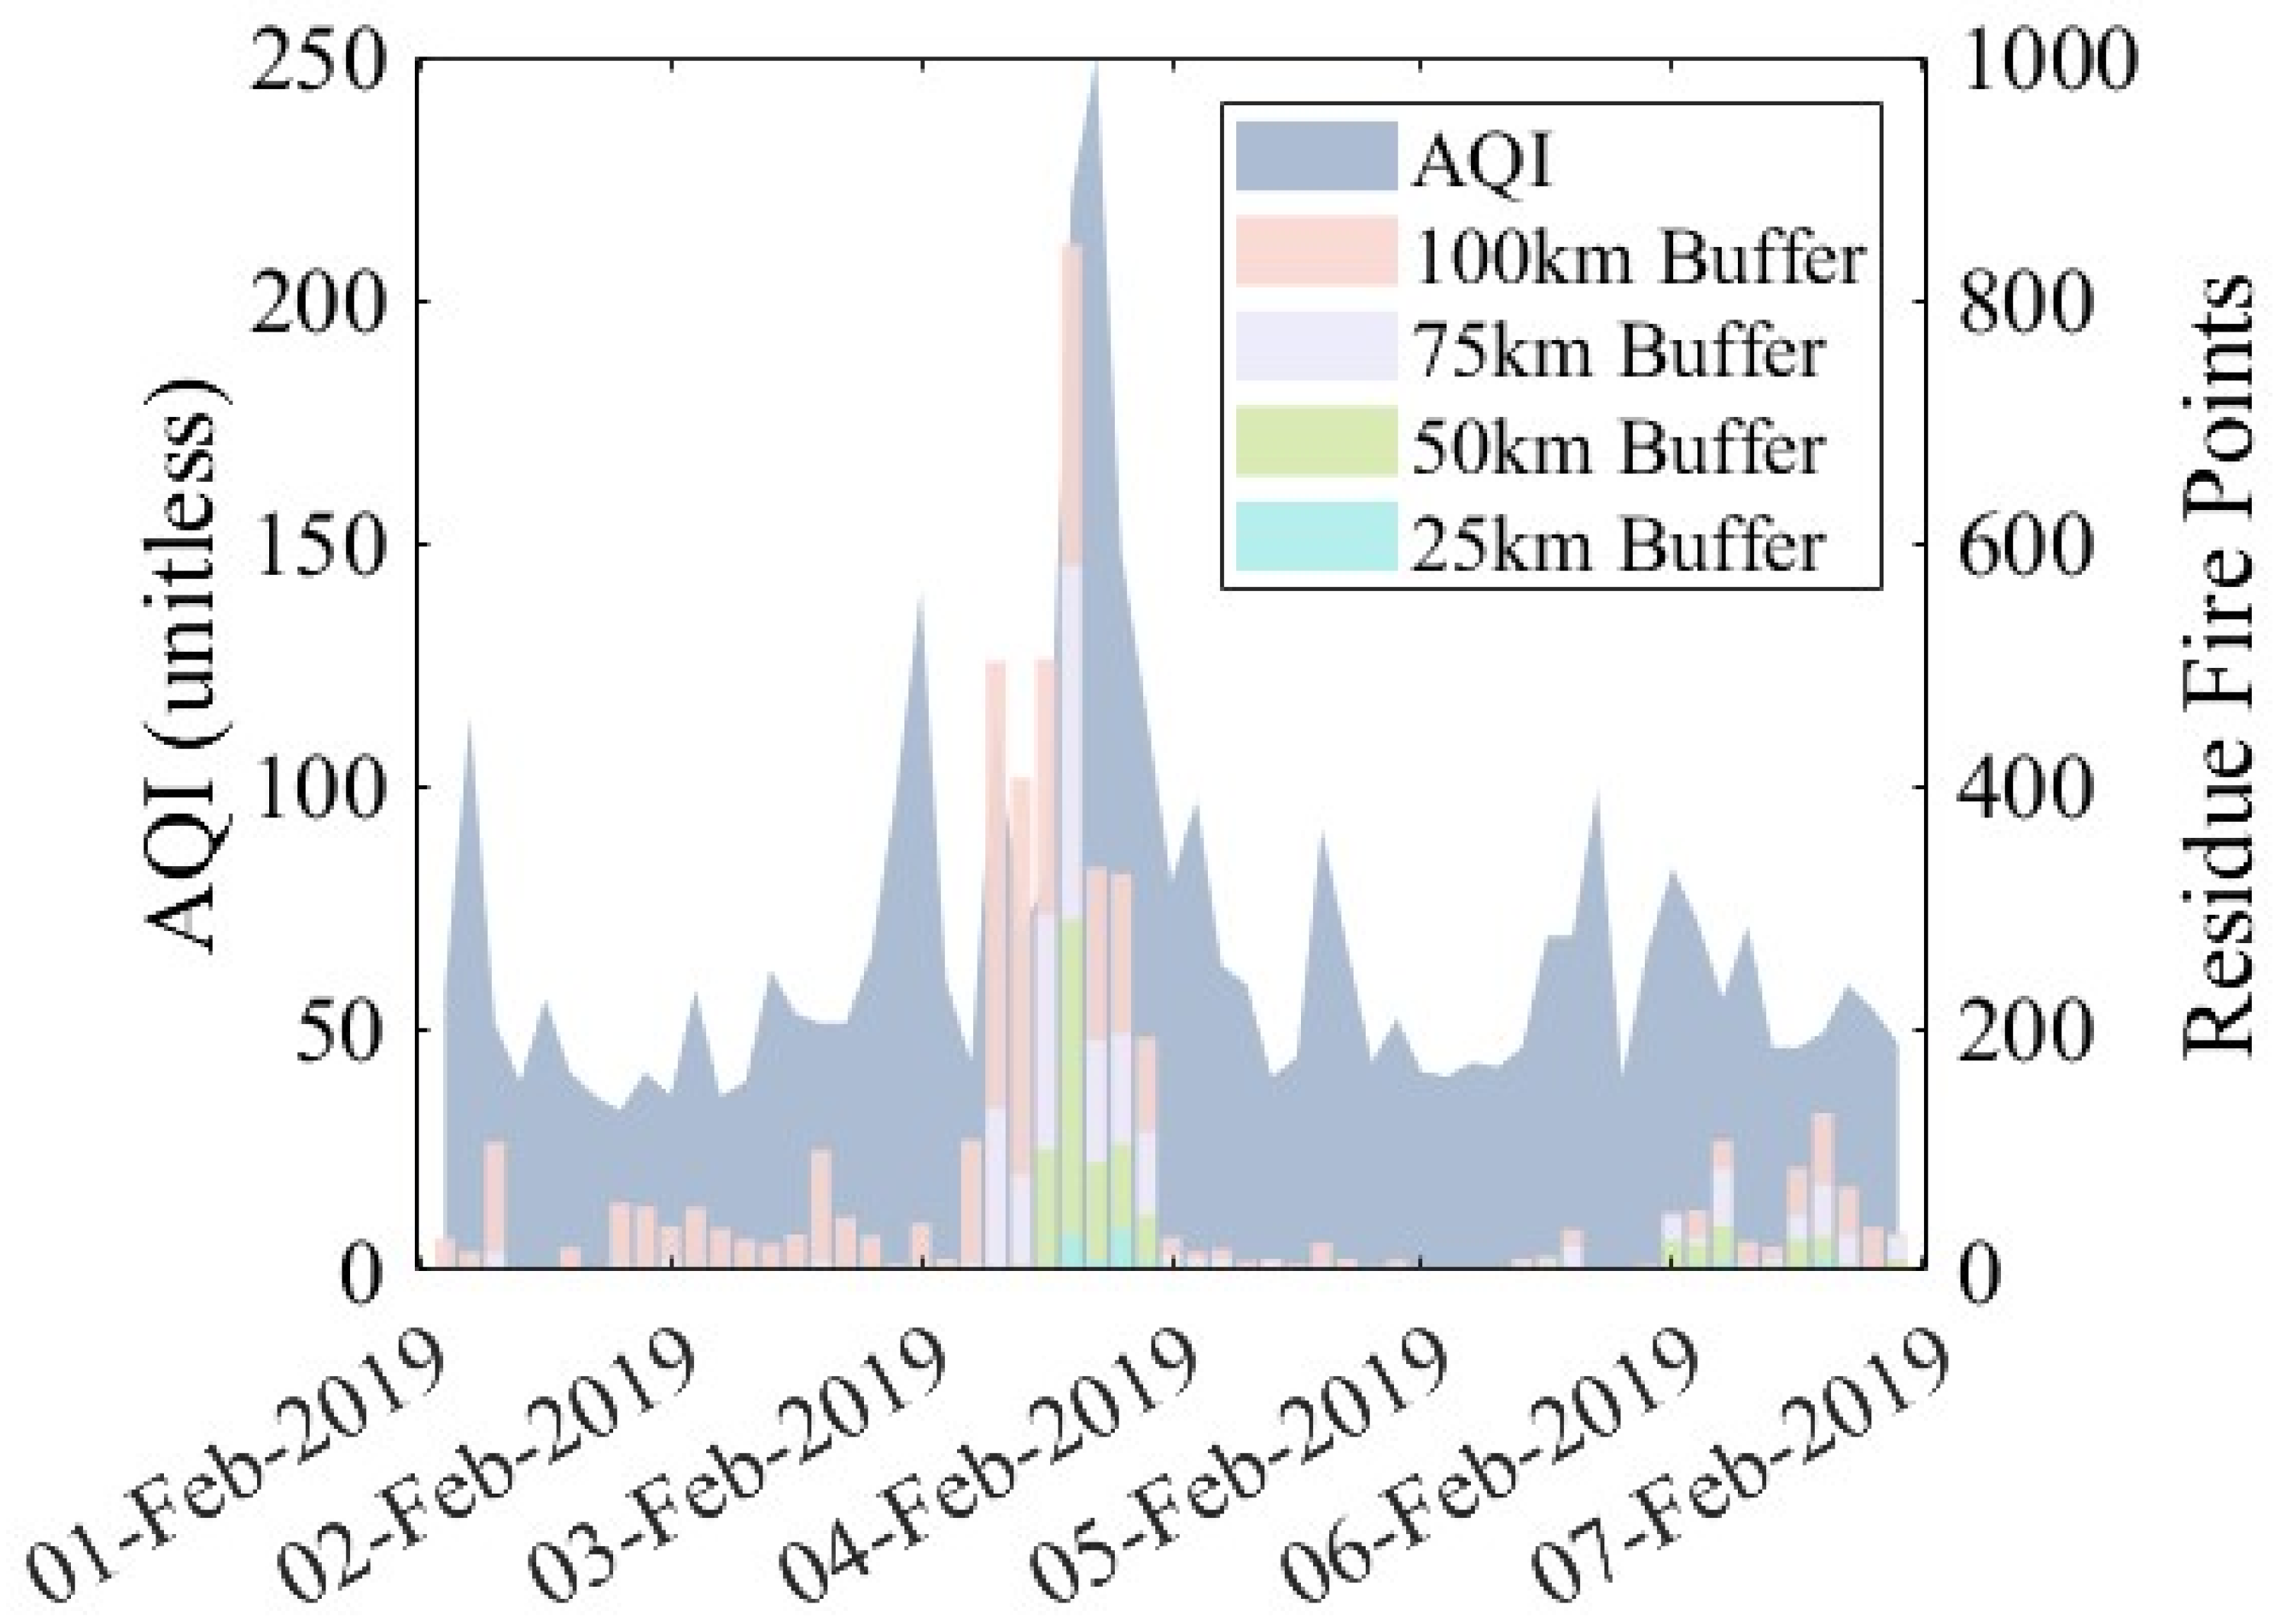
According to the Air Quality Historical Data Query website (https://www.aqistudy.cn/istorydata/, accessed on 2 August 2023) [38], AQI reached 221 on 26 February 2019 and PM2.5 content reached 171 μg/m3 on that day, whereas AQI reached 250 on 27 February 2019, the highest in February 2019, and PM2.5 content reached 200 μg/m3. Both days reached heavy pollution levels according to Ambient Air Quality Standards. In order to further analyze the pollution characteristics, a statistics tool in ArcGIS 10.1 was used to extract information such as residue fire points number and burned area, respectively. Through geostatistical analysis, we found that the number of residue fire points within the 100 km buffer zone reached 845 and 332 on 26 February and 27 February, and the corresponding burned areas were 256 km2 and 336 km2, respectively. We analyzed the correlation between AQI, the number of residue fire points, and the area burned in Daqing on a daily time scale from February to March, as shown in Figure 3 and Figure 4. We found that the number of residue fire points, burned area, and AQI showed a good correlation in the time series within each layer buffer zone in Daqing. The number of residue fires points and burned area were high between 20 February and 1 March, and the corresponding AQI was also significantly higher, most likely due to the severe air pollution caused by residue burning during this period.
In this study, the correlation between the number of residue fire points, burned area, and AQI in February and March of 2019 was analyzed on a daily scale using the Pearson correlation module in SPSS, as shown in Table 3. The correlation coefficients between the number of residue fire spots and AQI in different buffer zones in Daqing were significant at a confidence level of less than 0.01 on both sides, with correlation coefficients above 0.6 (0.61–0.75). The correlation between residue burned area and AQI was significant at a confidence level of less than 0.01 on both sides, with correlation coefficients above 0.7 (0.75–0.82). The correlation between residue burn area and AQI was significantly higher than that between the number of residue fire points and AQI, but the trends were the same. The correlation coefficients were highest at a radius of 50 km, and then the correlation coefficients decreased as the radius increased. Clearly, the impact of residue burning on urban air quality was more substantial within the 50 km zone, and then the impact decreased. However, the correlation coefficient between residue fire points and AQI was still above 0.6 when the buffer zone radius reached 100 km, indicating that the impact is still strong in the 100 km range. At the same time, further research is needed to determine at what buffer zone radius residue fire has almost no impact on AQI.
Through the statistical analysis in the above paragraph, we found that the correlation between residue burned area and AQI was significantly higher than that between the number of residue fire points and AQI. Because satellites have a specific revisit cycle, in the case of the VIIRS sensor carried on the NPP Earth observation satellite, the revisit frequency is twice per day—once during the day and once during the night—passing the target monitoring area. Therefore, if there is a residue fire during the non-transit time of the satellite, it will not be able to monitor the fire. For burned area monitoring, we used the remote sensing images before and after the residue fire through the time series change monitoring method to obtain the newly burned area during this period, even if the residue burning occurred during the satellite non-transit period and does not show in the satellite monitoring results. However, the spatial resolutions of residue fire points and burned area data are 375 m and 500 m, respectively, and monitoring omission will occur for some small areas of residue burning. At the same time, Daqing is an industrial city that emits many pollutants every day, affecting AQI. Together with the transmission of pollutants from surrounding areas, these factors have led to the correlation between residue burning and AQI being lower than expected. However, the correlation between AQI and residue burned area is significantly higher than that between AQI and the number of residue fire points. This result also indicates that the effect of residue burning can be studied using the residue burned area instead of the number of residue fire points.
3.2.2. Correlation Analysis between Residue Burning Indicators and Pollutant Concentration
As a measure of air pollution, the primary pollutants involved in AQI for air quality evaluation include PM2.5, PM10, CO, NO2, O3, and SO2. Residue burning usually produces some polluting toxic and harmful gases. The correlation between the number of residue fire points and the concentration of each pollutant extracted from MODIS remote sensing data was established by Zhuang et al. [26]. Li et al. estimated the source intensity of PM10 and CO of residue burning in Harbin City based on meteorological data, real-time ground measurements of pollutants, and satellite fire distribution. As a result, they validated the effect of residue burning on PM10 and CO levels [43]. The Pearson correlation coefficient was used in this study to compare the degree of correlation between residue burning and the concentration of various pollutants and thus determine which pollutant concentration is mainly increased by residue burning. Table 4 shows correlation analysis between the number of residue fire points; burned area; and PM2.5, PM10, CO, NO2, O3, and SO2 concentrations within different buffer zones in Daqing City in February–March 2019. Through correlation analysis, we found that the number of residue fire points and burned area within each buffer zone were highly significantly correlated with PM2.5, PM10, CO, and NO2.
In contrast, the confidence levels with O3 and SO2 did not reach significant correlation levels above 0.01. The correlation between the concentration of each pollutant and the number of residue fire points and burned area first increased with an increase in buffer zone radius. The correlation was best when the buffer zone radius reached 50 km and gradually decreased when the buffer zone radius exceeded 50 km. Among all the indicators, PM2.5 had the highest correlation with the number of residue fire points and burned area, with correlation coefficients reaching 0.68 and 0.81, respectively, followed by PM10, CO, NO2, O3, and SO2 in descending order of correlation. For all the pollution indicators, the correlation between residue burned area and pollutant concentration was significantly higher than the correlation between the number of residue fire points and pollutant concentration. This result illustrates the use of residue burned area to study the effect on the concentration of each pollutant more precisely. Because residue fire points are not monitored at non-transit moments by satellite, this would result in a lower correlation between the number of residue fire points and pollutant concentrations. However, this problem does not exist for the burned area. Therefore, the results show that the correlation between residue burning and each pollutant by residue fire points is limited, and the study of residue burned area is more accurate.
In terms of the chemical composition of residue, it is primarily organic carbohydrates, consisting of elements such as C, H, and O. Residue burning produces a large amount of smoke, which is generally composed of small-diameter particles, carbon oxides, nitrogen oxides, and water [1,33]. Therefore, residue burning is significantly associated with PM2.5, PM10, CO, and NO2. In comparison, sulfides are generally produced mainly in industrial processes. Daqing, a big industrial city, is the largest oil producer in China annually. Therefore, there is no correlation between residue burning and SO2. Ozone is usually a secondary pollutant produced under the photochemical reaction of atmospheric nitrogen oxides (NOx) and volatile organic compounds (VOCs) by UV irradiation when the temperature is high and UV irradiation from sunlight is relatively strong [34,35]. The temperature in February and March in northeast China is generally below 0 °C, and the UV intensity is weak. Therefore, although residue burning produces NOx but does not reach the conditions to produce O3, there is no significant correlation between residue burning and O3.
4. Discussion
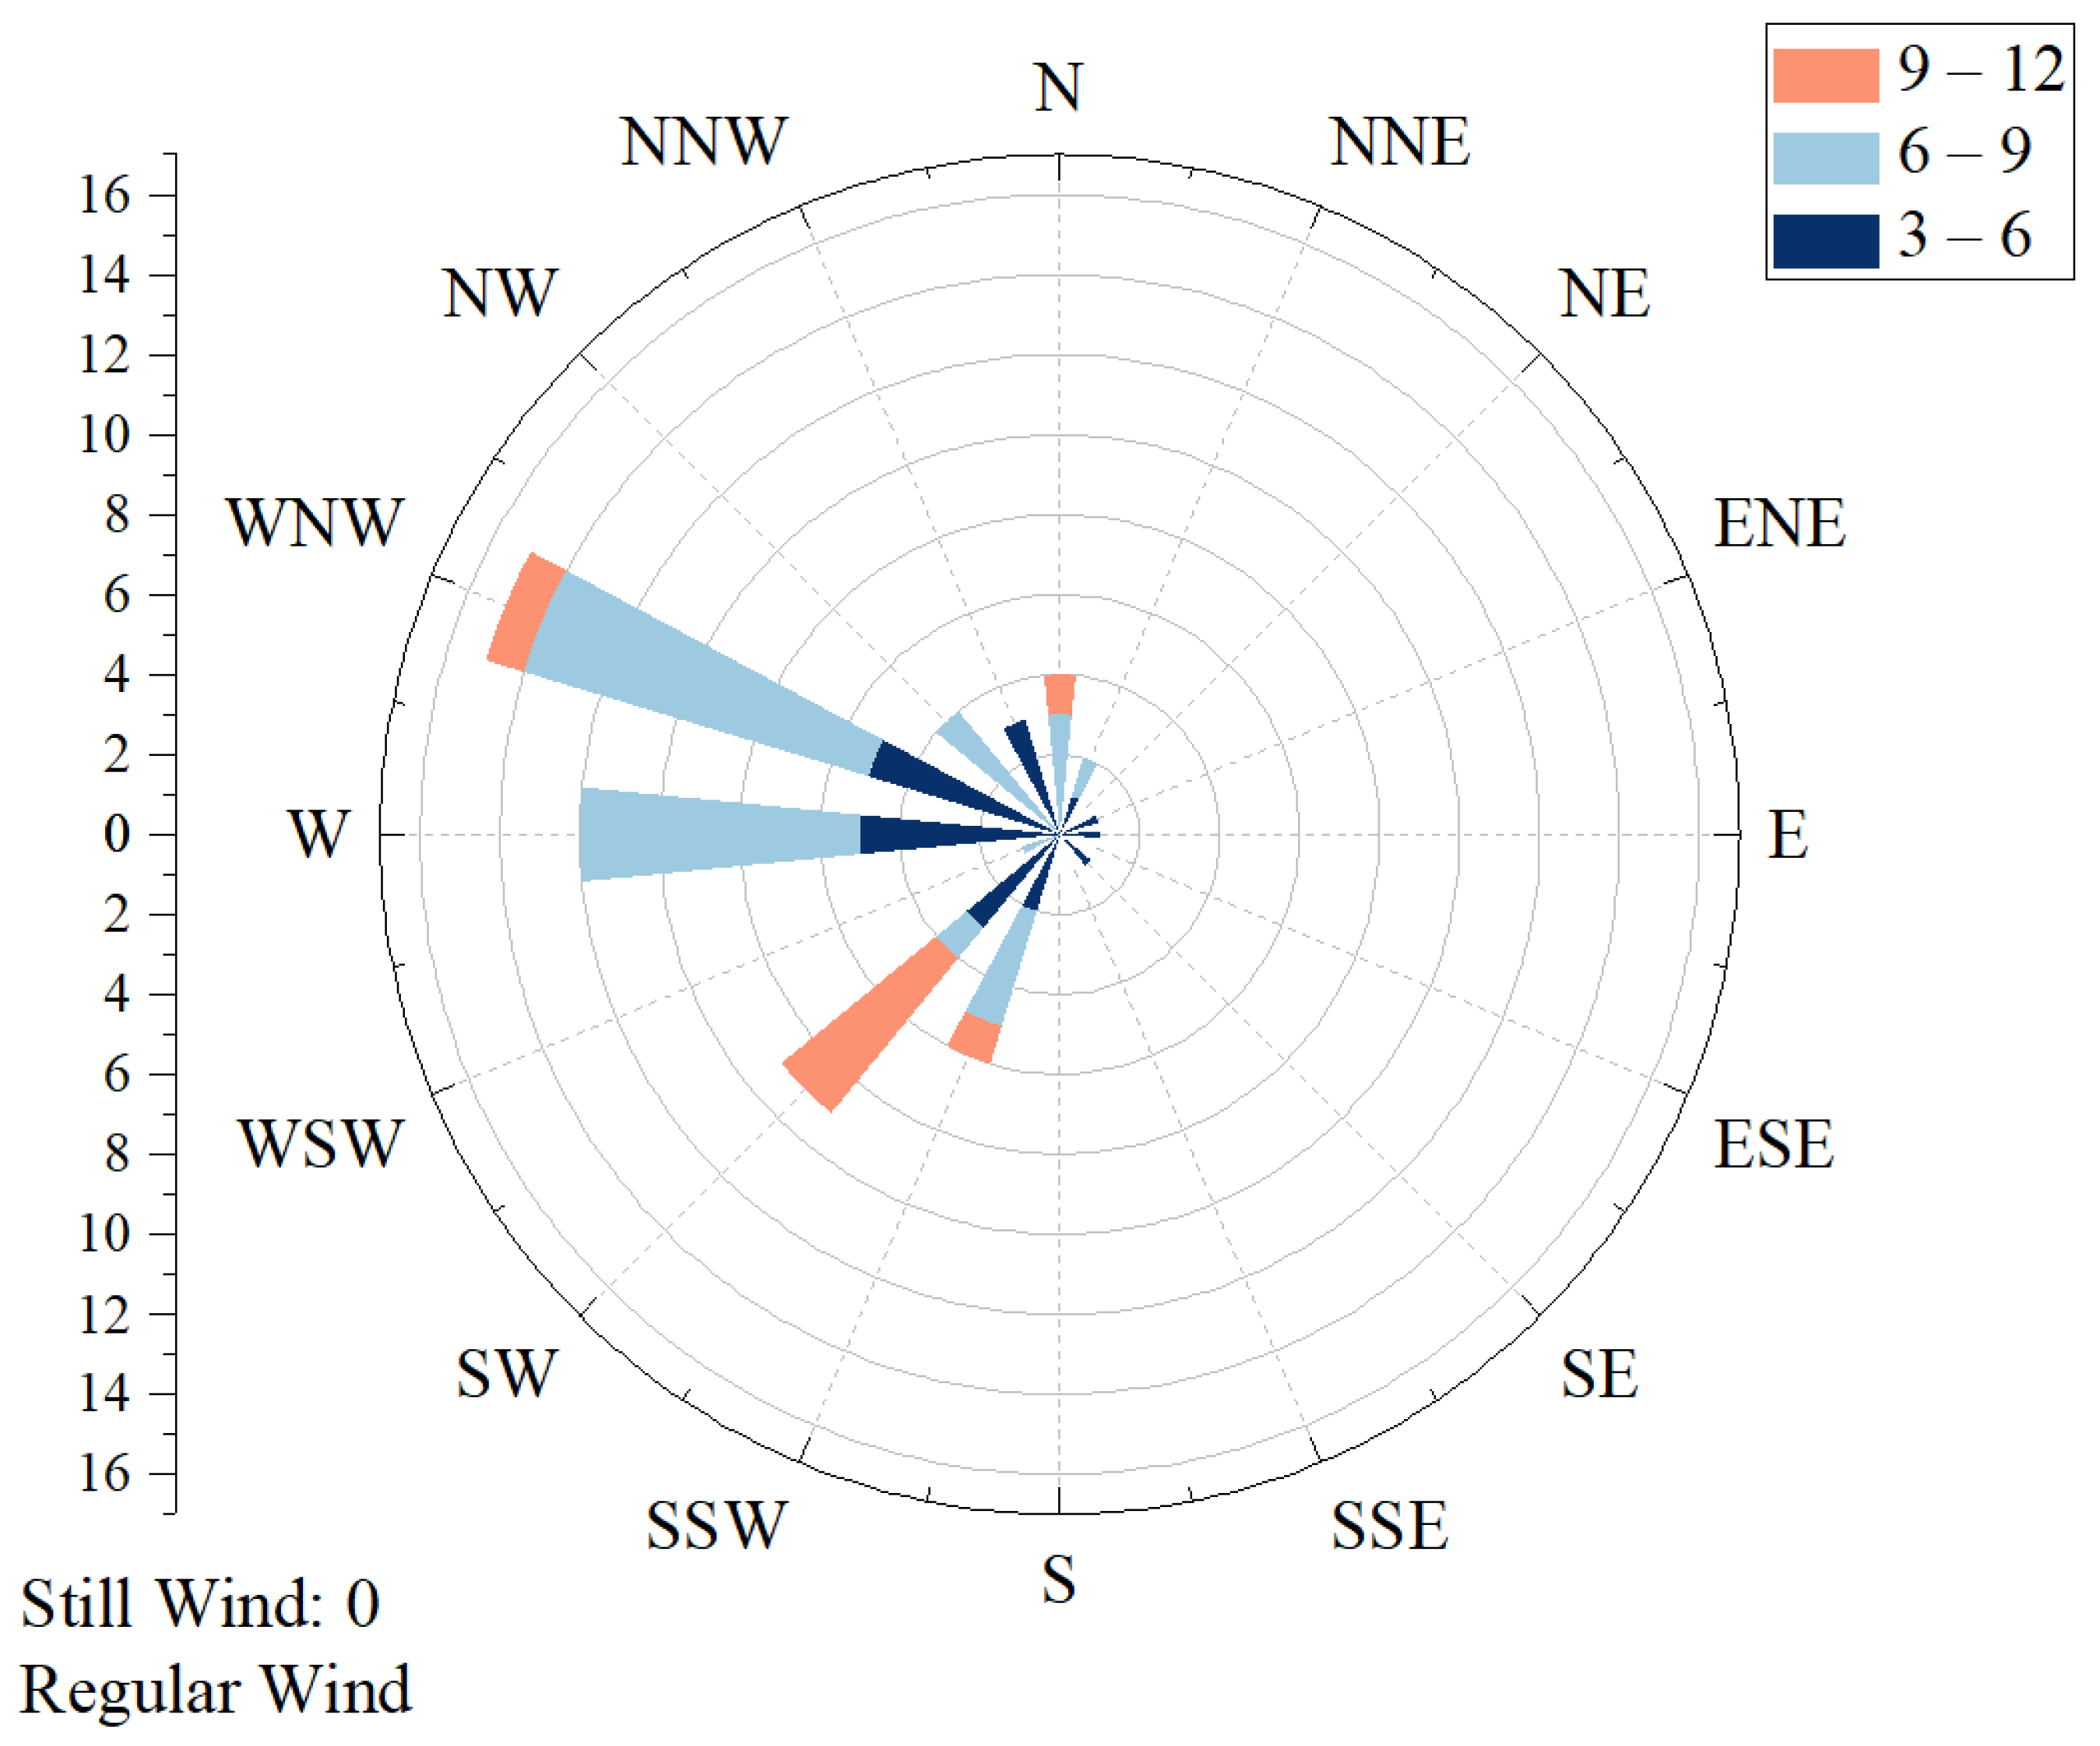
Yang et al. compared the effects of geographical, pollution, and meteorological conditions on the spatial and temporal distribution of PM2.5 concentrations over China [44]. In response to the results above, we added wind direction to analyze its effect on the number of residue fire points, residue burn area, and AQI. The main effect of wind direction on air pollution is the direction of horizontal transport of pollutants, where the direction downwind of the pollution source is the pollution area and the wind direction and wind speed determine the extent and intensity of the appearance of air pollution [44]. To discuss the role of wind direction on atmospheric pollutant transport, in this study, we divided the wind direction into 16 directions, namely, N, NNE, NE, ENE, E, ESE, SE, SSE, S, SSW, SW, WSW, W, WNW, NW, and NNW. Figure 5 shows the wind direction distribution in Daqing City from 1 to 8 March 2019, where the circle’s radius represents the wind speed magnitude. We found that the wind in Daqing is mainly from the west–northwest, west, and southwest, with an average wind speed of 6–9 m/s.
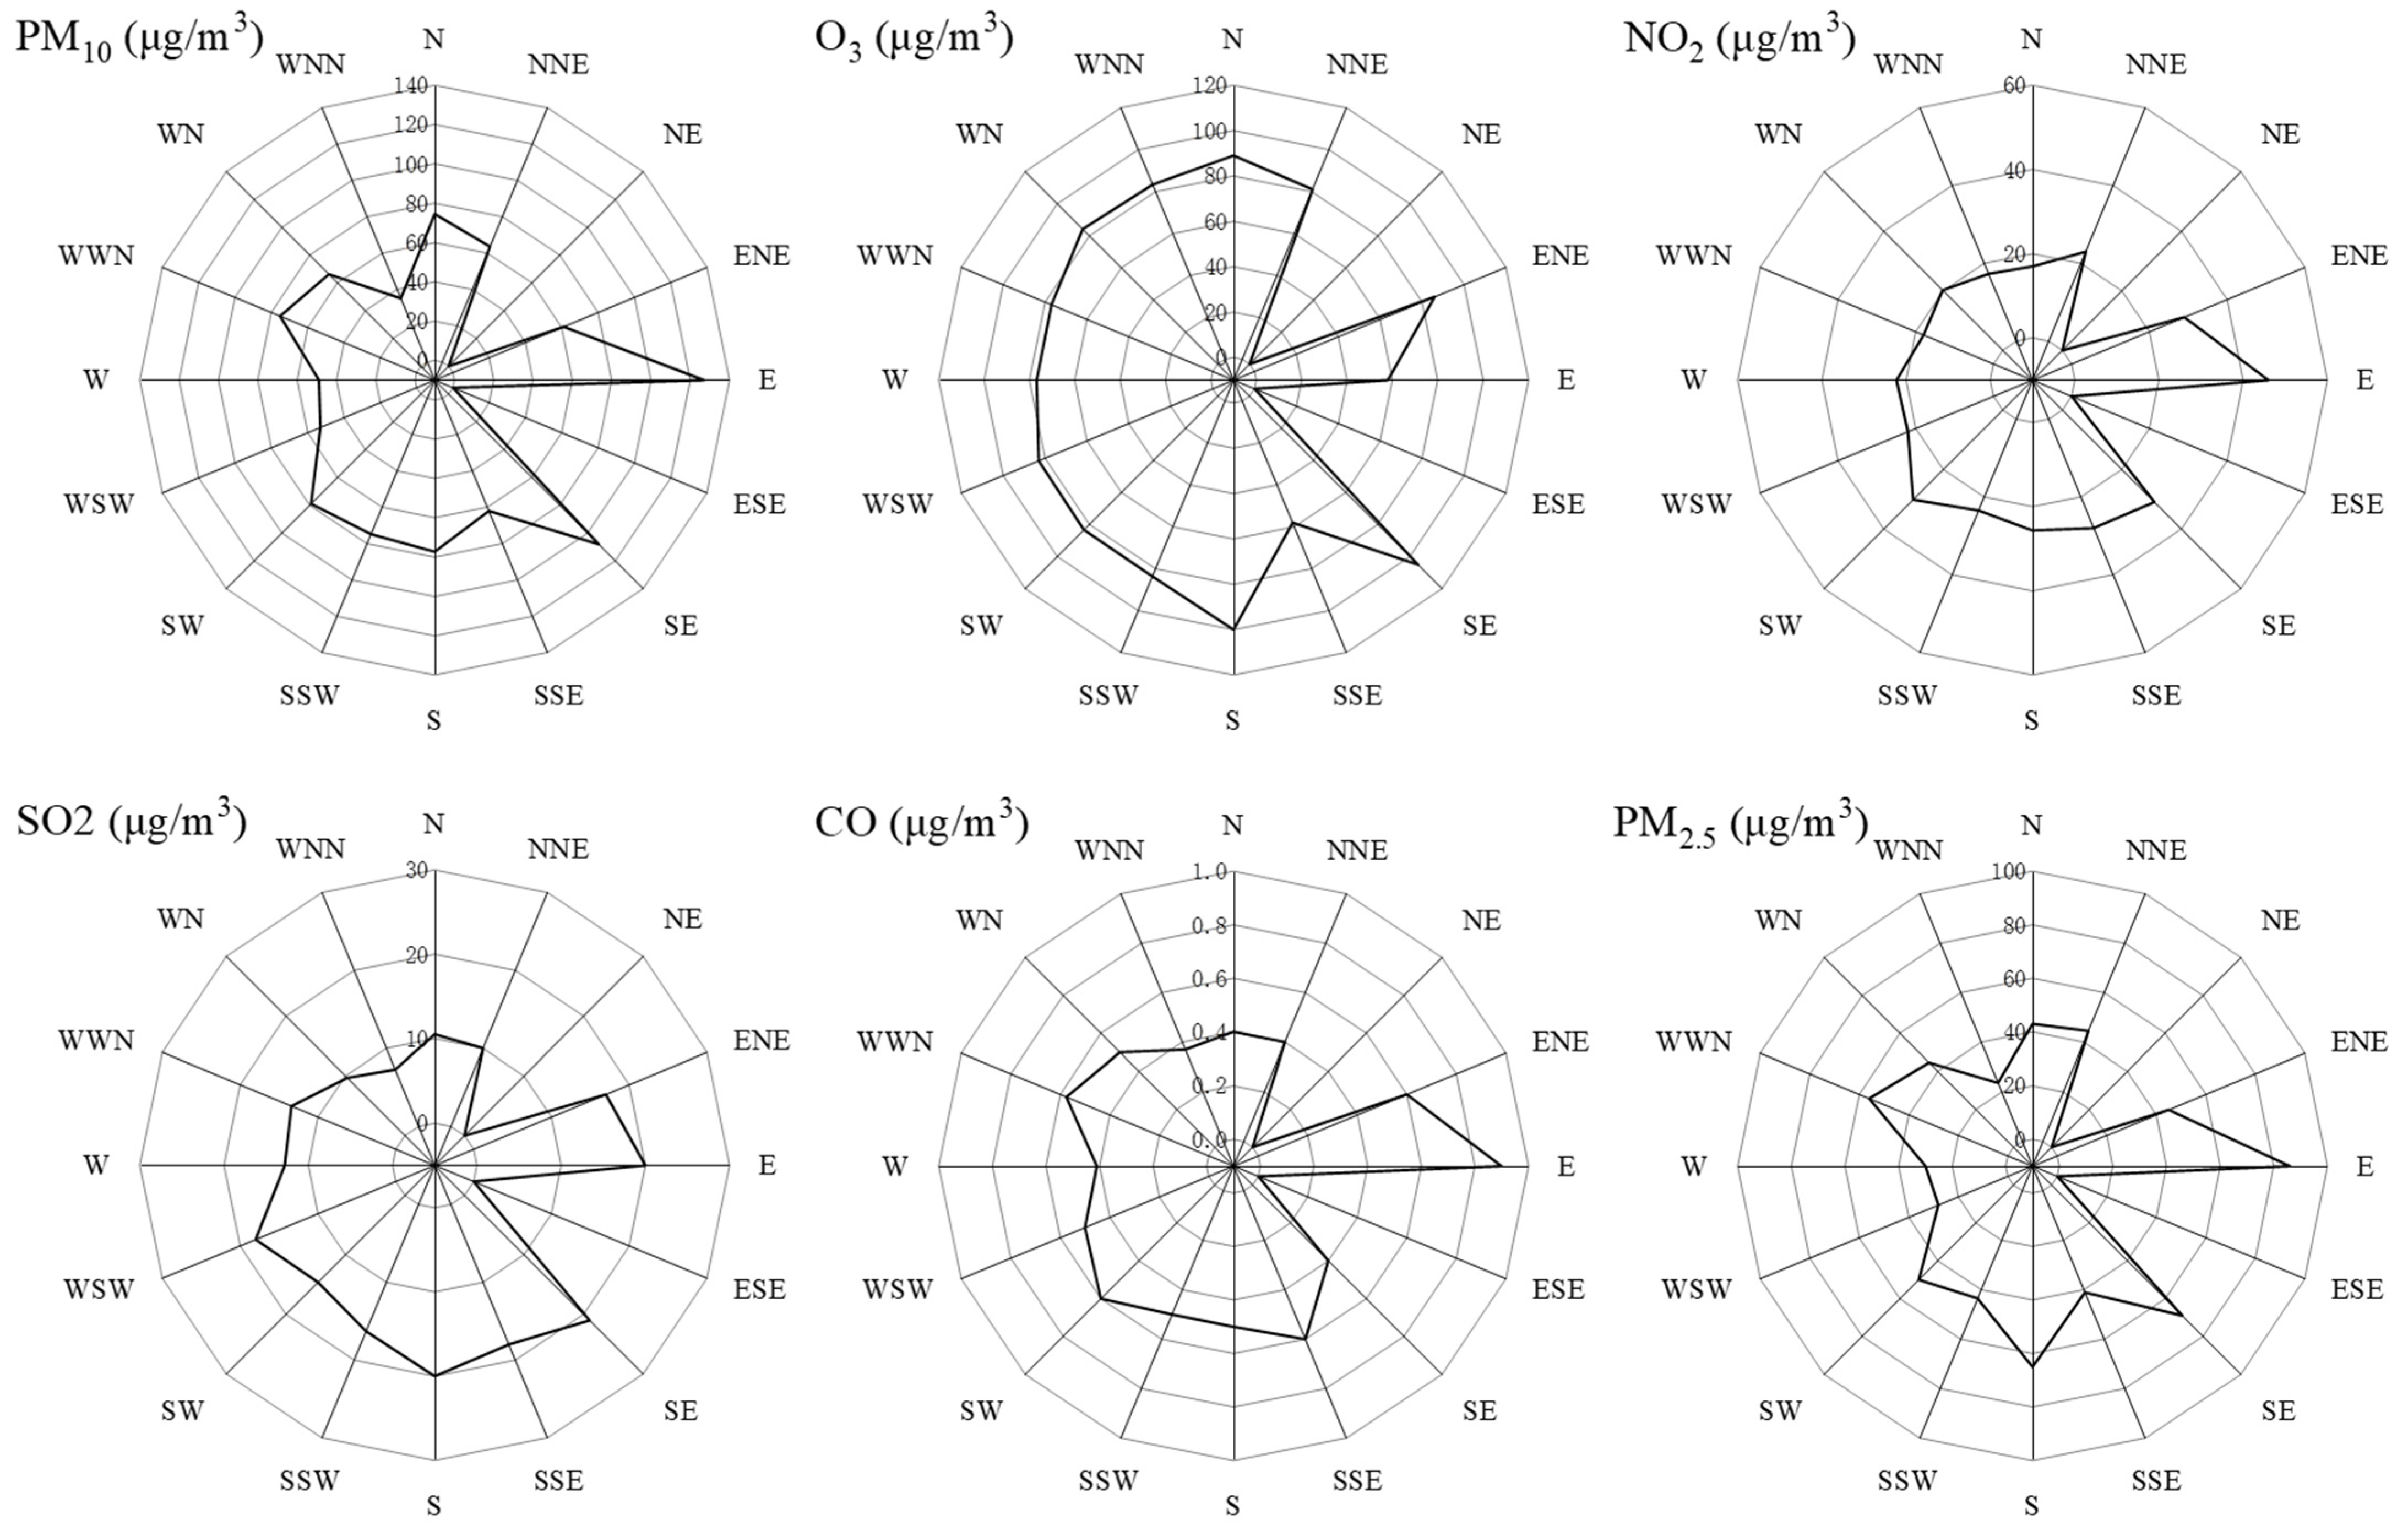
The concentration distributions of PM2.5, PM10, CO, NO2, O3, and SO2 in each wind direction are shown in Figure 6, which were generated in Origin 2018 using meteorological data and air pollution monitoring data [45]. The distribution of atmospheric pollutant concentrations showed an almost identical consistent spatial distribution of each pollutant, but there were extreme values of pollutant concentrations in particular wind directions. The distributions of PM2.5 and PM10 were similar, with the highest concentrations occurring in the wind direction of WNW, followed by higher concentrations in the wind directions of SE and SSW. NO2 and CO also showed concentration maxima in the WNW wind direction, followed by higher concentrations in the SE wind direction, which may be related to the diffusion of pollutants in the surrounding areas.
As a primary driver of air pollutant dispersion, it is widely accepted that wind direction can strongly influence the direction of air pollutant dispersion. Different wind directions can lead to different urban areas being polluted by crop residue burning. In this study, the effect of wind direction on AQI was considered. We conducted correlation analyses using the number of residue fire points and burned area in the upwind buffer zone with urban AQI, respectively, as shown in Table 5. Comparing Table 3 and Table 6, we found that the correlation between the number of fire points and AQI in each buffer zone upwind of Daqing was higher than that without considering the wind correlation, and the correlation coefficients were all above 0.6 (0.66, 0.77, 0.66, and 0.64 at 25, 50, 75, and 100 km buffer, respectively). The correlation coefficient between the burned area and AQI in the adjoining wind direction also improved, reaching over 0.8 except for the 100 km buffer, with the 50 km buffer having the highest correlation coefficient of 0.88. These results may be due to only areas in the downwind path of the burned area being affected by crop residue burning. In contrast, urban areas in the other directions are rarely affected. Similar to Section 3.2, the correlation coefficient between the residue burned area and the air quality index in each buffer zone upwind of Daqing was higher than that between the number of fire points and the air quality index, as shown in Table 4 and Table 5. Nonetheless, there are numerous causes for their correlation not reaching higher levels.
As an industrial city, industrial emissions in Daqing also account for a significant proportion of all atmospheric pollutants, resulting in air pollution from industrial emissions as well as residue burning. In addition, meteorological conditions including wind speed, temperature, humidity, rainfall, and air pressure all affect air pollution caused by residue burning [46,47,48]. According to Zhang et al., a reduction in PM10 was found to occur under stronger wind and higher precipitation conditions [49]. In addition, emissions from residue burning vary depending on the residue type and moisture content, and the phase of burning [50]. The effect of various combinations of meteorological conditions on air pollution is complex, so the impact of residue burning on air quality in industrial cities needs further analysis.
5. Conclusions
In this study, the correlation between different residue burning parameters on air quality in Daqing City was investigated comparatively using the VIIRS active fire point product, the MODIS burned area product, and buffer zone analysis. The association between MODIS burned area products and AQI was found to be around 0.8, with a maximum of 0.82 at a buffer zone radius of 50 km. Meanwhile, it was found that the correlation between the number of residue fire points extracted from VIIRS active fire products and air quality was above 0.6, again with a maximum of 0.75 at a buffer radius of 50 km. Within other levels of buffer zones, the correlation between residue burned area and AQI was consistently higher than that between residue fire points and AQI.
By comparing the correlation between VIIRS fire points, MODIS burned area, and AQI and the concentration of each pollutant, we found that the correlation between residue burned area and AQI and the concentration of each pollutant is higher than that between the number of residue fire points and AQI and the concentration of each pollutant. MODIS burned area monitoring, on the other hand, detects changes in the time series of images taken by satellite at two transit moments to obtain the new burned area and cumulative burned area during this period, allowing the monitoring of fire traces caused by fire points at non-transit moments.
From analyzing the correlation between residue fire points, residue burned area, and the concentration of each pollutant (PM2.5, PM10, CO, NO2, SO2, and O3), we found significant correlations between crop residue burning and PM2.5, PM10, CO, and NO2 concentrations, with the highest correlation seen with PM2.5 at an R2 of 0.81. Moreover, the correlation between residue burned area and PM2.5, PM10, CO, and NO2 concentrations was significantly higher than the correlation between the number of residue fire points and their concentrations.
In this study, the correlation between straw fire point and burned area and AQI are mainly determined by using the fire point product of VIIRS/MODIS and the area burned product of MOD64. However, in the future, there is a desire to use geostationary satellites to establish the correlation between straw fire points, burned area, and AQI at a lower temporal resolution to find further better indicators to characterize the impact of straw burning on the surrounding regional air quality.
Author Contributions
Conceptualization, J.D. and K.S.; methodology, J.D. and K.S.; software, D.L. and Z.Z.; validation, J.D., D.L. and Z.Z.; formal analysis, D.L. and Y.W.; investigation, J.D. and D.L.; resources, D.L. and Y.W.; data curation, D.L. and Z.Z.; writing—original draft preparation, J.D. and D.L.; writing—review and editing, J.D.; visualization, Y.W. and Z.Z.; supervision, J.D. and K.S.; project administration, J.D. and K.S.; funding acquisition, J.D. and K.S. All authors have read and agreed to the published version of the manuscript.
Funding
This research was funded by the National Key Research and Development Program of China (No. 2021YFD1500103), the Science and Technology Project for Black Soil Granary (No. XDA28080501) and the National Science & Technology Fundamental Resources Investigation Program of China (No. 2018FY100300).
Data Availability Statement
Not applicable.
Acknowledgments
The authors would like to thank the anonymous reviewers for their valuable comments on the manuscript, which helped improve the quality of the paper.
Conflicts of Interest
The authors declare no conflict of interest. The funders had no role in the design of the study; in the collection, analyses, or interpretation of data; in the writing of the manuscript; or in the decision to publish the results.
References
- Wang, L.; Xin, J.; Li, X.; Wang, Y. The Variability of Biomass Burning and Its Influence on Regional Aerosol Properties during the Wheat Harvest Season in North China. Atmos. Res. 2015, 157, 153–163. [Google Scholar] [CrossRef]
- Li, J.; Bo, Y.; Xie, S. Estimating Emissions from Crop Residue Open Burning in China Based on Statistics and MODIS Fire Products. J. Environ. Sci. 2016, 44, 158–170. [Google Scholar] [CrossRef]
- Zhang, Y.; Shao, M.; Lin, Y.; Luan, S.; Mao, N.; Chen, W.; Wang, M. Emission Inventory of Carbonaceous Pollutants from Biomass Burning in the Pearl River Delta Region, China. Atmos. Environ. 2013, 76, 189–199. [Google Scholar] [CrossRef]
- Chen, J.; Li, C.; Ristovski, Z.; Milic, A.; Gu, Y.; Islam, M.S.; Wang, S.; Hao, J.; Zhang, H.; He, C.; et al. A Review of Biomass Burning: Emissions and Impacts on Air Quality, Health and Climate in China. Sci. Total Environ. 2017, 579, 1000–1034. [Google Scholar] [CrossRef] [PubMed] [Green Version]
- Zhao, H.; Zhang, X.; Zhang, S.; Chen, W.; Tong, D.; Xiu, A. Effects of Agricultural Biomass Burning on Regional Haze in China: A Review. Atmosphere 2017, 8, 88. [Google Scholar] [CrossRef] [Green Version]
- Andini, A.; Bonnet, S.; Rousset, P.; Hasanudin, U. Impact of Open Burning of Crop Residues on Air Pollution and Climate Change in Indonesia. Curr. Sci. 2018, 115, 2259. [Google Scholar] [CrossRef]
- He, G.; Liu, T.; Zhou, M. Straw Burning, PM2.5, and Death: Evidence from China. J. Dev. Econ. 2020, 145, 102468. [Google Scholar] [CrossRef] [Green Version]
- Guo, L.; Zhao, J. Effect of Burning Straw in Rural Areas on Ecological Environment Quality. Arab. J. Geosci. 2021, 14, 1357. [Google Scholar] [CrossRef]
- Hesammi, E.; Talebi, A.B.; Hesammi, A. A Review on the Burning of Crop Residue on the Soil Properties. WALIA J. 2014, 30, 192–194. [Google Scholar]
- Aouizerats, B.; van der Werf, G.R.; Balasubramanian, R.; Betha, R. Importance of Transboundary Transport of Biomass Burning Emissions to Regional Air Quality in Southeast Asia during a High Fire Event. Atmos. Chem. Phys. 2015, 15, 363–373. [Google Scholar] [CrossRef] [Green Version]
- Li, L.; Wang, Y.; Zhang, Q.; Li, J.; Yang, X.; Jin, J. Wheat Straw Burning and Its Associated Impacts on Beijing Air Quality. Sci. China Ser. Earth Sci. 2008, 51, 403–414. [Google Scholar] [CrossRef]
- Chen, W.; Tong, D.Q.; Dan, M.; Zhang, S.; Zhang, X.; Pan, Y. Typical Atmospheric Haze during Crop Harvest Season in Northeastern China: A Case in the Changchun Region. J. Environ. Sci. 2017, 54, 101–113. [Google Scholar] [CrossRef]
- McCarty, J.L.; Korontzi, S.; Justice, C.O.; Loboda, T. The Spatial and Temporal Distribution of Crop Residue Burning in the Contiguous United States. Sci. Total Environ. 2009, 407, 5701–5712. [Google Scholar] [CrossRef]
- Zhang, N.; Sun, L.; Sun, Z. GF-4 Satellite Fire Detection With an Improved Contextual Algorithm. IEEE J. Sel. Top. Appl. Earth Obs. Remote Sens. 2022, 15, 163–172. [Google Scholar] [CrossRef]
- Liu, J.; Wang, D.; Maeda, E.E.; Pellikka, P.K.E.; Heiskanen, J. Mapping Cropland Burned Area in Northeastern China by Integrating Landsat Time Series and Multi-Harmonic Model. Remote Sens. 2021, 13, 5131. [Google Scholar] [CrossRef]
- Lin, Y.; Rong, Y.; Yu, J.; Zhang, H.C.; Li, L. An Optimized Remote Sensing Recognition Approach for Straw Burning in Henan Province, China. Int. Arch. Photogramm. Remote Sens. Spat. Inf. Sci. 2022, 43, 127–134. [Google Scholar] [CrossRef]
- Cui, S.; Song, Z.; Zhang, L.; Shen, Z.; Hough, R.; Zhang, Z.; An, L.; Fu, Q.; Zhao, Y.; Jia, Z. Spatial and Temporal Variations of Open Straw Burning Based on Fire Spots in Northeast China from 2013 to 2017. Atmos. Environ. 2021, 244, 117962. [Google Scholar] [CrossRef]
- Zhang, S.; Zhao, H.; Wu, Z.; Tan, L. Comparing the Ability of Burned Area Products to Detect Crop Residue Burning in China. Remote Sens. 2022, 14, 693. [Google Scholar] [CrossRef]
- Schroeder, W.; Oliva, P.; Giglio, L.; Csiszar, I.A. The New VIIRS 375 m Active Fire Detection Data Product: Algorithm Description and Initial Assessment. Remote Sens. Environ. 2014, 143, 85–96. [Google Scholar] [CrossRef]
- Vadrevu, K.; Lasko, K. Intercomparison of MODIS AQUA and VIIRS I-Band Fires and Emissions in an Agricultural Landscape—Implications for Air Pollution Research. Remote Sens. 2018, 10, 978. [Google Scholar] [CrossRef]
- Jain, N.; Bhatia, A.; Pathak, H. Emission of Air Pollutants from Crop Residue Burning in India. Aerosol Air Qual. Res. 2014, 14, 422–430. [Google Scholar] [CrossRef] [Green Version]
- Kelly, F.J.; Fussell, J.C. Size, Source and Chemical Composition as Determinants of Toxicity Attributable to Ambient Particulate Matter. Atmos. Environ. 2012, 60, 504–526. [Google Scholar] [CrossRef]
- Morakinyo, O.; Mokgobu, M.; Mukhola, M.; Hunter, R. Health Outcomes of Exposure to Biological and Chemical Components of Inhalable and Respirable Particulate Matter. Int. J. Environ. Res. Public. Health 2016, 13, 592. [Google Scholar] [CrossRef] [PubMed] [Green Version]
- Zhuang, Y.; Chen, D.; Li, R.; Chen, Z.; Cai, J.; He, B.; Gao, B.; Cheng, N.; Huang, Y. Understanding the Influence of Crop Residue Burning on PM2.5 and PM10 Concentrations in China from 2013 to 2017 Using MODIS Data. Int. J. Environ. Res. Public. Health 2018, 15, 1504. [Google Scholar] [CrossRef] [Green Version]
- Li, R.; He, X.; Wang, H.; Wang, Y.; Zhang, M.; Mei, X.; Zhang, F.; Chen, L. Estimating Emissions from Crop Residue Open Burning in Central China from 2012 to 2020 Using Statistical Models Combined with Satellite Observations. Remote Sens. 2022, 14, 3682. [Google Scholar] [CrossRef]
- Zhuang, Y.; Li, R.; Yang, H.; Chen, D.; Chen, Z.; Gao, B.; He, B. Understanding Temporal and Spatial Distribution of Crop Residue Burning in China from 2003 to 2017 Using MODIS Data. Remote Sens. 2018, 10, 390. [Google Scholar] [CrossRef] [Green Version]
- Roteta, E.; Bastarrika, A.; Padilla, M.; Storm, T.; Chuvieco, E. Development of a Sentinel-2 Burned Area Algorithm: Generation of a Small Fire Database for Sub-Saharan Africa. Remote Sens. Environ. 2019, 222, 1–17. [Google Scholar] [CrossRef]
- Epting, J.; Verbyla, D.; Sorbel, B. Evaluation of Remotely Sensed Indices for Assessing Burn Severity in Interior Alaska Using Landsat TM and ETM+. Remote Sens. Environ. 2005, 96, 328–339. [Google Scholar] [CrossRef]
- Yang, G.; Zhao, H.; Tong, D.Q.; Xiu, A.; Zhang, X.; Gao, C. Impacts of Post-Harvest Open Biomass Burning and Burning Ban Policy on Severe Haze in the Northeastern China. Sci. Total Environ. 2020, 716, 136517. [Google Scholar] [CrossRef]
- Li, L.; Wang, K.; Chen, W.; Zhao, Q.; Liu, L.; Liu, W.; Liu, Y.; Jiang, J.; Liu, J.; Zhang, M. Atmospheric Pollution of Agriculture-Oriented Cities in Northeast China: A Case in Suihua. J. Environ. Sci. 2020, 97, 85–95. [Google Scholar] [CrossRef]
- Climate Bulletin of Heilongjiang Province (2020). Available online: http://hl.cma.gov.cn/zfxxgk/zwgk/qtxx/202101/t20210122_2638629.html (accessed on 12 July 2023).
- Statistical Bulletin on National Economic and Social Development of Daqing City, 2019. Available online: https://www.hlj.gov.cn/hlj/c107858/202005/c00_30588932.shtml (accessed on 12 July 2023).
- Combined Level 3 Direct Broadcast Burned Area Monthly Global 500 m SIN Grid-LAADS DAAC. Available online: https://ladsweb.modaps.eosdis.nasa.gov/missions-and-measurements/products/MCD64A1 (accessed on 11 July 2023).
- Giglio, L.; Boschetti, L.; Roy, D.; Hoffmann, A.A.; Humber, M.; Hall, J.V. Collection 6 MODIS Burned Area Product User’s Guide Version 1.3. 34; NASA: Washington, DC, USA, 2016.
- Schroeder, W.; Giglio, L. NASA VIIRS Land Science Investigator Processing System (SIPS) Visible Infrared Imaging Radiometer Suite (VIIRS) 375 m & 750 m Active Fire Products: Product User’s Guide Version 1.4; NASA: Washington, DC, USA, 2018.
- NASA-FIRMS. Available online: https://firms.modaps.eosdis.nasa.gov/map/ (accessed on 11 July 2023).
- Resource and Environment Science and Data Center, Chinese Academy of Sciences. Available online: https://www.resdc.cn/ (accessed on 11 July 2023).
- Air Quality Online Testing and Analysing Platform. Available online: https://www.aqistudy.cn/historydata/ (accessed on 11 July 2023).
- Zhang, X.; Liu, L.; Chen, X.; Gao, Y.; Xie, S.; Mi, J. GLC_FCS30: Global Land-Cover Product with Fine Classification System at 30 m Using Time-Series Landsat Imagery. Earth Syst. Sci. Data 2021, 13, 2753–2776. [Google Scholar] [CrossRef]
- China Meteorologlcal Data Service Center-National Meteorological Information Center. Available online: http://data.cma.cn/ (accessed on 11 July 2023).
- China Meteorological Administration. Ground Surface Meteorological Observation; China Meteorological Press: Beijing, China, 2003; Volume 200, ISBN 978-7-5029-3690-7.
- Abdel-Megeed, S.M. Accuracy of Correlation Coefficient with Limited Number of Points. J. Exp. Educ. 1984, 52, 188–191. [Google Scholar] [CrossRef]
- Wu, H.H.; Liu, Y.P.; Liu, L.; Ling, J.; Liu, Y.H.; Liu, B.; Zheng, T.; Wang, P. Estimation method of air pollution load of straw burning in Harbin. Acta Sci. Circumstantiae 2020, 40, 3803–3812. [Google Scholar]
- Yang, Q.; Yuan, Q.; Yue, L.; Li, T. Investigation of the Spatially Varying Relationships of PM2.5 with Meteorology, Topography, and Emissions over China in 2015 by Using Modified Geographically Weighted Regression. Environ. Pollut. 2020, 262, 114257. [Google Scholar] [CrossRef] [PubMed]
- Moberly, J.G.; Bernards, M.T.; Waynant, K.V. Key Features and Updates for Origin 2018. J. Cheminformatics 2018, 10, 5. [Google Scholar] [CrossRef] [Green Version]
- Keshtkar, H.; Ashbaugh, L.L. Size Distribution of Polycyclic Aromatic Hydrocarbon Particulate Emission Factors from Agricultural Burning. Atmos. Environ. 2007, 41, 2729–2739. [Google Scholar] [CrossRef]
- Kim Oanh, N.T.; Ly, B.T.; Tipayarom, D.; Manandhar, B.R.; Prapat, P.; Simpson, C.D.; Sally Liu, L.-J. Characterization of Particulate Matter Emission from Open Burning of Rice Straw. Atmos. Environ. 2011, 45, 493–502. [Google Scholar] [CrossRef] [PubMed] [Green Version]
- Sanchis, E.; Ferrer, M.; Calvet, S.; Coscollà, C.; Yusà, V.; Cambra-López, M. Gaseous and Particulate Emission Profiles during Controlled Rice Straw Burning. Atmos. Environ. 2014, 98, 25–31. [Google Scholar] [CrossRef] [Green Version]
- Zhang, B.; Jiao, L.; Xu, G.; Zhao, S.; Tang, X.; Zhou, Y.; Gong, C. Influences of Wind and Precipitation on Different-Sized Particulate Matter Concentrations (PM2.5, PM10, PM2.5–10). Meteorol. Atmos. Phys. 2018, 130, 383–392. [Google Scholar] [CrossRef]
- Wang, Q.; Wang, L.; Li, X.; Xin, J.; Liu, Z.; Sun, Y.; Liu, J.; Zhang, Y.; Du, W.; Jin, X.; et al. Emission Characteristics of Size Distribution, Chemical Composition and Light Absorption of Particles from Field-Scale Crop Residue Burning in Northeast China. Sci. Total Environ. 2020, 710, 136304. [Google Scholar] [CrossRef]
Figure 1.
Topographic map of Daqing City: (a) Saltu District, (b) Longfeng District, (c) Janhulu District, (d) Honggang District, (e) Datong District, (f) Zhaozhou County, (g) Zhaoyuan County, (h) Lindian County, and (i) Dorbud County.
Figure 1.
Topographic map of Daqing City: (a) Saltu District, (b) Longfeng District, (c) Janhulu District, (d) Honggang District, (e) Datong District, (f) Zhaozhou County, (g) Zhaoyuan County, (h) Lindian County, and (i) Dorbud County.

Figure 2.
Spatial distribution of residue fire points and residue burned area from 1 February to 31 March 2019.
Figure 2.
Spatial distribution of residue fire points and residue burned area from 1 February to 31 March 2019.

Figure 3.
The burned area of each buffer zone and AQI value in Daqing City.

Figure 4.
Number of residue fire points of each buffer zone and AQI value in Daqing City.

Figure 5.
Wind direction distribution in February and March of 2019 in Daqing City.

Figure 6.
Concentration distribution of various pollutants in different wind directions in Daqing City in 2019.
Figure 6.
Concentration distribution of various pollutants in different wind directions in Daqing City in 2019.


Table 1.
Statistics of farmland area, residue fire points, and residue burned area in Daqing City (1 February–31 March 2019).
Table 1.
Statistics of farmland area, residue fire points, and residue burned area in Daqing City (1 February–31 March 2019).
| Farmland Area (km2) | Residue Burning Fire Point | Residue Burned Area (km2) | |
|---|---|---|---|
| Zhaoyuan District | 2530 | 584 | 631.74 |
| Dorbud County | 2505 | 538 | 218.46 |
| Lindian County | 1250 | 374 | 128.27 |
| Datong District | 1091 | 150 | 75.99 |
| Zhaozhou County | 667 | 633 | 47.7 |
| Honggang District | 359 | 1 | 0.09 |
| Ranghu District | 331 | 53 | 1.58 |
| Saltu District | 226 | 13 | 0 |
| Longfeng District | 173 | 3 | 0.09 |
| Total | 9132 ** | 2349 ** | 1103.92 ** |
Where ** means that a t test with a significance of 0.05 is passed.
Table 2.
Correlation between farmland area and crop residue burning in each county and district of Daqing City.
Table 2.
Correlation between farmland area and crop residue burning in each county and district of Daqing City.
| Residue Fire Points | Residue Burned Area | ||
|---|---|---|---|
| Farmland area | Pearson correlation | 0.75 * | 0.85 ** |
| sig. (two-tailed) | 0.02 | 0.00 | |
| N | 9 | 9 |
Note: * Significant correlation at a confidence level (two-tailed) of 0.05 and ** significant correlation at a confidence level (two-tailed) of 0.01.
Table 3.
Correlation analysis of the number of residue fire points, burned area, and AQI in each buffer zone of Daqing City.
Table 3.
Correlation analysis of the number of residue fire points, burned area, and AQI in each buffer zone of Daqing City.
| 25 km Buffer | 50 km Buffer | 75 km Buffer | 100 km Buffer | ||
|---|---|---|---|---|---|
| Buffer zone fire points | Pearson correlation | 0.64 ** | 0.75 ** | 0.61 ** | 0.61 ** |
| sig. (two-tailed) | 0.00 | 0.00 | 0.00 | 0.00 | |
| Buffer zone burned area | Pearson correlation | 0.79 ** | 0.82 ** | 0.80 ** | 0.75 ** |
| sig. (two-tailed) | 0.00 | 0.00 | 0.00 | 0.00 | |
| N | 59 | 59 | 59 | 59 | |
Note: ** Significant correlation at a confidence level (two-tailed) of 0.01.
Table 4.
Correlation analysis of the number of residue fires and the concentration of PM2.5, PM10, CO, NO2, O3, and SO2 in the buffer zones of Daqing City.
Table 4.
Correlation analysis of the number of residue fires and the concentration of PM2.5, PM10, CO, NO2, O3, and SO2 in the buffer zones of Daqing City.
| 25 km Buffer | 50 km Buffer | 75 km Buffer | 100 km Buffer | ||
|---|---|---|---|---|---|
| PM2.5 | Pearson correlation | 0.56 ** | 0.68 ** | 0.59 ** | 0.59 ** |
| sig. (two-tailed) | 0.00 | 0.00 | 0.00 | 0.00 | |
| PM10 | Pearson correlation | 0.49 ** | 0.53 ** | 0.45 ** | 0.44 ** |
| sig. (two-tailed) | 0.00 | 0.00 | 0.00 | 0.00 | |
| CO | Pearson correlation | 0.44 ** | 0.49 ** | 0.44 ** | 0.49 ** |
| sig. (two-tailed) | 0.00 | 0.00 | 0.00 | 0.00 | |
| NO2 | Pearson correlation | 0.43 ** | 0.48 ** | 0.40 ** | 0.39 ** |
| sig. (two-tailed) | 0.00 | 0.00 | 0.00 | 0.00 | |
| O3 | Pearson correlation | 0.16 | 0.19 | 0.16 | 0.12 |
| sig. (two-tailed) | 0.23 | 0.15 | 0.23 | 0.364 | |
| SO2 | Pearson correlation | 0.06 | 0.14 | 0.09 | 0.09 |
| sig. (two-tailed) | 0.67 | 0.31 | 0.49 | 0.49 | |
| N | 59 | 59 | 59 | 59 | |
Note: ** Significant correlation at a confidence level (two-tailed) of 0.01.
Table 5.
Correlation analysis of straw burning area and the concentration of PM2.5, PM10, CO, NO2, O3, and SO2 in the buffer zone of Daqing City.
Table 5.
Correlation analysis of straw burning area and the concentration of PM2.5, PM10, CO, NO2, O3, and SO2 in the buffer zone of Daqing City.
| 25 km Buffer | 50 km Buffer | 75 km Buffer | 100 km Buffer | ||
|---|---|---|---|---|---|
| PM2.5 | Pearson correlation | 0.79 ** | 0.81 ** | 0.80 ** | 0.75 ** |
| sig. (two-tailed) | 0.00 | 0.00 | 0.00 | 0.00 | |
| PM10 | Pearson correlation | 0.64 ** | 0.67 ** | 0.67 ** | 0.63 ** |
| sig. (two-tailed) | 0.00 | 0.00 | 0.00 | 0.00 | |
| CO | Pearson correlation | 0.54 ** | 0.59 ** | 0.54 ** | 0.51 ** |
| sig. (two-tailed) | 0.00 | 0.00 | 0.00 | 0.00 | |
| NO2 | Pearson correlation | 0.49 ** | 0.54 ** | 0.49 ** | 0.45 ** |
| sig. (two-tailed) | 0.00 | 0.00 | 0.00 | 0.00 | |
| O3 | Pearson correlation | 0.10 | 0.15 | 0.14 | 0.07 |
| sig. (two-tailed) | 0.44 | 0.27 | 0.29 | 0.61 | |
| SO2 | Pearson correlation | 0.20 | 0.22 | 0.17 | 0.15 |
| sig. (two-tailed) | 0.14 | 0.10 | 0.20 | 0.25 | |
| N | 59 | 59 | 59 | 59 | |
Note: ** Significant correlation at a confidence level (two-tailed) of 0.01.
Table 6.
Correlation analysis of the number of residue fire points, burned area, and AQI in the buffer zones of Daqing City.
Table 6.
Correlation analysis of the number of residue fire points, burned area, and AQI in the buffer zones of Daqing City.
| 25 km Buffer | 50 km Buffer | 75 km Buffer | 100 km Buffer | ||
|---|---|---|---|---|---|
| Buffer zone fire point | Pearson correlation | 0.66 ** | 0.77 ** | 0.66 ** | 0.64 ** |
| sig. (two-tailed) | 0.00 | 0.00 | 0.00 | 0.00 | |
| Buffer zone area | Pearson correlation | 0.83 ** | 0.88 ** | 0.84 ** | 0.79 ** |
| sig. (two-tailed) | 0.00 | 0.00 | 0.00 | 0.00 | |
Note: ** Significant correlation at a confidence level (two-tailed) of 0.01.
Disclaimer/Publisher’s Note: The statements, opinions and data contained in all publications are solely those of the individual author(s) and contributor(s) and not of MDPI and/or the editor(s). MDPI and/or the editor(s) disclaim responsibility for any injury to people or property resulting from any ideas, methods, instructions or products referred to in the content. |
© 2023 by the authors. Licensee MDPI, Basel, Switzerland. This article is an open access article distributed under the terms and conditions of the Creative Commons Attribution (CC BY) license (https://creativecommons.org/licenses/by/4.0/).
Share and Cite
MDPI and ACS Style
Du, J.; Li, D.; Song, K.; Zheng, Z.; Wang, Y. Comparative Analysis of the Impact of Two Common Residue Burning Parameters on Urban Air Quality Indicators. Remote Sens. 2023, 15, 3911. https://doi.org/10.3390/rs15153911
AMA Style
Du J, Li D, Song K, Zheng Z, Wang Y. Comparative Analysis of the Impact of Two Common Residue Burning Parameters on Urban Air Quality Indicators. Remote Sensing. 2023; 15(15):3911. https://doi.org/10.3390/rs15153911
Chicago/Turabian StyleDu, Jia, Dianjia Li, Kaishan Song, Zhi Zheng, and Yan Wang. 2023. "Comparative Analysis of the Impact of Two Common Residue Burning Parameters on Urban Air Quality Indicators" Remote Sensing 15, no. 15: 3911. https://doi.org/10.3390/rs15153911
Note that from the first issue of 2016, this journal uses article numbers instead of page numbers. See further details here.