


GCMTN: Low-Overlap Point Cloud Registration Network Combining Dense Graph Convolution and Multilevel Interactive Transformer


1
Key Laboratory of Optoelectronic Technology and Systems of Ministry of Education, Chongqing University, Chongqing 400044, China
2
College of Optoelectronic Engineering, Chongqing University, Chongqing 400044, China
*
Author to whom correspondence should be addressed.
Remote Sens. 2023, 15(15), 3908; https://doi.org/10.3390/rs15153908
Submission received: 29 June 2023
/
Revised: 20 July 2023
/
Accepted: 4 August 2023
/
Published: 7 August 2023
(This article belongs to the Special Issue Artificial Intelligence and Machine Learning for multi-source Remote Sensing)
Abstract
:A single receptive field limits the expression of multilevel receptive field features in point cloud registration, leading to the pseudo-matching of objects with similar geometric structures in low-overlap scenes, which causes a significant degradation in registration performance. To handle this problem, a point cloud registration network that incorporates dense graph convolution and a mutilevel interaction Transformer (GCMTN) in pursuit of better registration performance in low-overlap scenes is proposed in this paper. In GCMTN, a dense graph feature aggregation module is designed for expanding the receptive field of points and fusing graph features at multiple scales. To make pointwise features more discriminative, a multilevel interaction Transformer module combining Multihead Offset Attention and Multihead Cross Attention is proposed to refine the internal features of the point cloud and perform feature interaction. To filter out the undesirable effects of outliers, an overlap prediction module containing overlap factor and matching factor is also proposed for determining the match ability of points and predicting the overlap region. The final rigid transformation parameters are generated based on the distribution of the overlap region. The proposed GCMTN was extensively verified on publicly available ModelNet and ModelLoNet, 3DMatch and 3DLoMatch, and odometryKITTI datasets and compared with recent methods. The experimental results demonstrate that GCMTN significantly improves the capability of feature extraction and achieves competitive registration performance in low-overlap scenes. Meanwhile, GCMTN has value and potential for application in practical remote sensing tasks.

1. Introduction
With the popularity of 3D scanning devices and high-precision sensors [1], the rapid development of 3D point cloud analysis has been promoted in many applications. Point cloud registration plays an important role in 3D vision as it aims to convert point cloud data from two or more camera coordinate systems to the world coordinate system and complete the stitching process. It is now widely used in various fields such as 3D reconstruction, high-precision mapping and localization [2], pose estimation [3], and Simultaneous Localization And Mapping (SLAM) [4,5], as well as in remote sensing applications. Due to significant pose variations and the potential for extensive occlusions, point cloud registration remains a challenging problem in practical applications. Additionally, practitioners aim to minimize the number of scans and maintain only a small overlap in order to reduce work costs while still achieving accurate matching. Hence, studying low-overlap point cloud registration has become an important topic receiving increasing attention in current research. To solve the point cloud registration problem, the following four steps are usually followed: (1) detecting the salient key points; (2) computing the feature descriptors of the key points; (3) matching features based on the feature descriptors to determine correspondences between the key points; and (4) estimating the rigid transformation matrix based on the correspondences, usually using Random Sample Consensus (RANSAC).
Traditional point cloud registration methods, represented by Iterative Closest Point (ICP) [6] and its variants [7,8,9,10], have been widely used in various fields. However, most of these methods are sensitive to noise, outliers, low-overlap, and initial poses. To improve this, Rusu et al. [11,12] and Salti et al. [13] designed artificially encoded features for global registration. These methods usually count geometric properties such as spatial coordinates, curvature, and normal vectors to obtain histograms, and then manually encode them to obtain geometric features. This approach is susceptible to noise, outliers, and inefficient feature matching. In the real-world point cloud data acquisition process, there is a lot of noise, outliers, and low overlap, which bring great challenges to the traditional registration methods.
In recent years, deep learning has received increasing attention in the field of point cloud registration and achieved acceptable results. A pioneering work is PointNetLK [14], which extracts the features of point cloud using PointNet [15]. In addition, the Lucas Kanade (IC-LK) [16] algorithm is applied to align point clouds, but such methods are not effective in the registration problem of low-overlap point clouds. Predator [17] is first proposed as a low-overlap point cloud registration solution that enabled the interaction of information between the source and target point clouds, focusing attention on the overlap region and thus achieving robust registration with low overlap. Motivated by Predator, a series of related works [18,19,20] were proposed, while Transformer [21] was introduced to feature learning and obtained potential results.
Although current deep learning-based works have improved the registration accuracy to some extent, it still faces the following difficulties. On the one hand, there is the extraction of key point features, which is believed to directly affect the efficiency and accuracy of registration results. Most of the existing methods have the shortcomings of a single receptive field and low resolution in feature extraction, which will aggravate the probability of mismatching objects with similar geometric structures in low-overlap scenes. On the other hand, in the determination of the overlap region, most methods have the problems of serious edge information loss and inaccurate prediction, which will greatly limit the search for accurate correspondences, resulting in matching with a high error rate. There is still much potential for improvement in the accuracy and robustness of existing point cloud registration methods.
To address the aforementioned problems, a point cloud registration network named GCMTN is proposed in this paper, which incorporates dense graph convolution and a multilevel interaction Transformer to improve registration accuracy in low-overlap scenes. A densely connected graph convolution is introduced to expand the receptive field of points and extract depth graph features. Taking inspiration from Transformer [21] in natural language processing and computer vision, the aim is to make the pointwise features more discriminative. A multilevel interactive Transformer structure is utilized, containing Multihead Offset Attention (MOA) and Multihead Cross Attention (MCA), to refine features within the point cloud. Additionally, information interaction between the source and target point clouds is facilitated. It is believed that not all points within the predicted overlap region are favorable for matching. Hence, an overlap prediction module is proposed, encompassing overlap factor and matching factor, to prevent the formation of false matching by points located in smooth areas or corners. By focusing attention on the overlap region, the aim is to enhance the accuracy of point cloud registration in low-overlap scenes. Specifically, the main contributions of this work are as follows:
- A Dense Graph Feature Aggregation (DGFA) module based on densely connected graph convolution is proposed to expand the receptive field of point clouds. In this module, the k-NN algorithm is used to update graph features with different scale neighborhoods in each layer, thus aggregating graph features at multiple scales.
- A Multilevel Interaction Transformer (MIT) module is introduced, which includes Multihead Offset Attention (MOA) and Multi-head Cross Attention (MCA). MOA carries out feature refinement inside the point cloud to extract features between point pairs, while MCA makes the feature information of source and target point clouds interact. The multilevel structure can refine the features of overlap region and generate pointwise features that contain the structural information.
- An overlap prediction module is proposed, which includes overlap factor and matching factor. The overlap factor is used to calculate the probability of the superpoints of source and target point clouds lie in the overlap region, and the matching factor is used to determine whether a point is favorable for matching, thereby predicting the distribution of the overlap region while avoiding the negative impact of unfavorable points on the registration accuracy.
The rest of this paper is organized as follows: Related work on point cloud registration is reviewed in Section 2. GCMTN network architecture is given in Section 3. Experiments and results are performed in Section 4. The research limitations are discussed in Section 5. Finally, conclusions are drawn in Section 6.
2. Related Work
2.1. Traditional Registration Methods
Most traditional point cloud registration methods aim to perform an initial transformation and find the local optimal solution near the initialization. One of the most representative methods is ICP [6], which tries to find the nearest point as the initial correspondence and find an optimal transformation matrix through least square iteration. ICP and its variants [7,8,9,10] tend to converge to local optimality, and the effect of its registration depends on good initialization. When the point cloud registration requires a large rotation translation, it is often unable to obtain good registration results.
To handle this, many works attempt to improve ICP registration performance when the initial transformation is poor, and some methods convert the point cloud to a probability distribution. Gaussian mixture models GMM [22] and HGMR [23] regard the registration problem as the matching of two probability distributions, and use the network to predict the corresponding probability of any two point pairs without finding the corresponding relationship and transformation matrix of the points. However, such methods use nonconvex objective functions, so good initialization is still needed to avoid convergence to local optimal values. Recently, a series of global optimization methods based on BnB have been proposed, such as Go-ICP [24], GOGMA [25], GOSMA [26], GoTS [27], etc., but the computational complexity is too high to be applicable to more complex scenes. Another work is that researchers try to establish correspondence directly to avoid the initial transformation, usually by extracting key features, matching features to find potential correspondence, and then using RANSAC methods to remove noise and outliers. Fast Global Registration (FGR) [28] relies on optimizing the global objective function to align two point clouds without updating the correspondence, achieving advanced performance in the correspondence based point cloud registration. In addition, handmade local features [11,12,13], such as Fast Point Feature Histograms (FPFH), are also designed to establish correspondence through feature matching. However, the registration based on correspondence is sensitive to the registration of partially overlapping point clouds, and there is a large proportion of false correspondence.
Overall, traditional point cloud registration methods have become the fundamental mainstreams with careful feature design and pipeline optimization, however, the lack of good initialization, large number of outliers, and partially overlapping point cloud registration problems remain huge challenges for traditional point cloud registration methods.
2.2. Learing-Based Registration Methods
The success of deep learning in point cloud processing has stimulated interest in applying deep learning in point cloud registration. At the early stage, the proposal of PointNet [15] and PointNet++ [29] promotes the development of point cloud deep learning, which can directly extract the features of point cloud without transforming the point cloud into other types for processing.
PointNetLK [14] pioneered the application of deep learning in the field of point cloud registration using PointNet [15] to extract the features of point clouds and applying the Lucas Kanade [16] algorithm to align the point clouds. PointNetLK Revisited (PNetLKR) [30] used analytical Jacobi to circumvent the numerical instability of PointNetLK and improve the registration accuracy. However, because PointNet cannot aggregate information from two point clouds, it is not suitable for registration of partial point clouds. The deep Gaussian mixture model DeepGMR [31] relies on neural networks to predict GMM parameters and restore optimal transformations. IDAM [32] integrates the iterative distance-aware similarity convolution module into the matching process, which can overcome the shortcoming of using the inner product to obtain pointwise similarity. RPM-Net [33] combines Sinkhorn’s method with deep learning to build soft correspondence from mixed features, thereby enhancing robustness to noise. Soft correspondence can improve robustness, but they will lead to a decrease in registration accuracy.
These deep learning-based methods can improve the accuracy of point cloud registration to a certain extent with flexible features extraction, but it is difficult to generate information interaction between source and target point clouds, so it cannot be directly applied to the registration of low-overlap point clouds.
2.3. Transformer-Based Registration Methods
Inspired by the successful applications of Transformer [21] in NLP and computer vision, researchers attempt to apply Transformer to point cloud processing to extract contextual information and some representative methods have been developed, such as Deep Closest Point (DCP) [34], Predator [17], REGTR [18], RGM [35], DIT [36], etc.
Deep Closest Point (DCP) [34] uses DGCNN [37] to extract features and applies Transformer to aggregate contextual information. In order to promote the information interaction between source point cloud and target point cloud to solve the registration problem of low-overlap point clouds. Predator [17] proposed the overlap attention module, which enables early information exchange between latent encodings of point clouds, focuses attention on overlap region, and prioritizes salient points in this region, thus enabling robust registration with low overlap. RGM [35] proposed to use of depth map matching to solve the point cloud registration problem and used node features and structure information of the graph to establish correspondence, so as to better solve the problem of outliers. In the registration of point clouds with low overlap, the self-attention and coattention mechanisms in Transformer are used to establish better correspondences for overlap region. DIT [36] is a complete point feature Transformer framework for point cloud registration, which uses a deep–narrow Transformer to establish comprehensive correlations. The richness of the feature representation is improved, and the discriminative power of the extracted features is improved by facilitating the interaction of the depth information. REGTR [18] applies multiple Transformer layers to predict clear point correspondences directly, and rigid transformation can be estimated from correspondences without further nearest neighbor feature matching or RANSAC steps. VPRNet [38] designs a self-supervised virtual point generation network (VPGnet), which utilizes the Transformer mechanism to fuse the geometric information of two local point clouds and generates missing points in combination with a Generative Adversarial Network (GAN) structure. COPRNet [39] introduces a Transformer-based feature interaction module, which combines spatial structural information to encode unique geometric embeddings, greatly enhancing feature perception. RoITr [40] proposes a rotation-invariant Transformer network for handling pose variations in point cloud matching tasks. It significantly improves feature extraction capability through the construction of a new attention-based encoder–decoder.
The Transformer-based methods have presented promising results in terms of feature extraction and ability to interact with information in point clouds, however, in the registration task in low-overlap scenes, a thorough way of feature representation and interaction is rarely investigated. For this category, there is still potential for improvement in terms of accuracy and robustness.
3. Method
3.1. Problem Statement
Given two partially overlapping point clouds and in 3D space, the point cloud registration problem is to find an optimal rigid transformation , such that X is aligned with Y after a transformation of T, where the 3D rotation parameter and the 3D translation parameter . This transformation can be solved by the following formula:
where denotes the true set of correspondences between X and Y. denotes the Euclidean norm. Since is unknown in reality, but it is necessary to establish the correspondence between two point clouds and then estimate the rigid transformation. The focus of this study shifts to the determination of overlap region in order to facilitate the search for the correct match.
3.2. Network Architecture
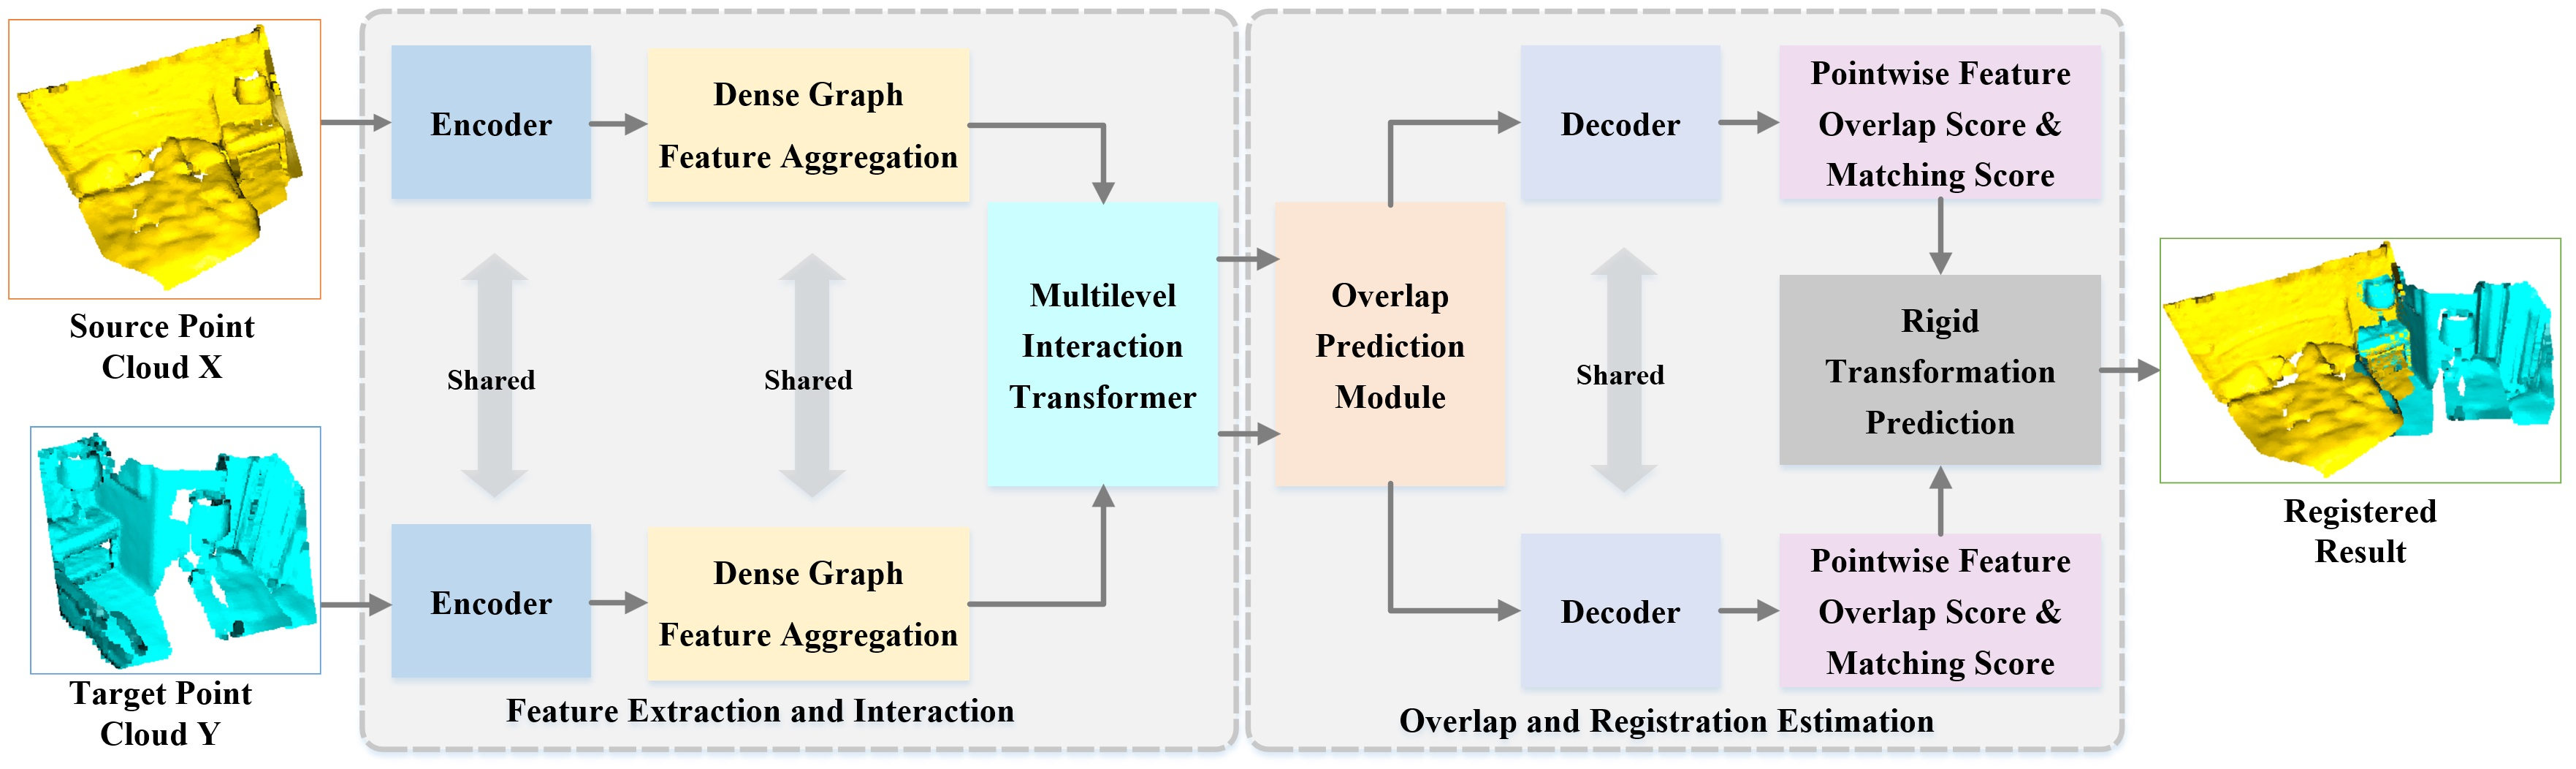
The proposed GCMTN is a dual-stream encoder–decoder network, as shown in Figure 1. In the encoder part, the input source point cloud X and the target point cloud Y are extracted and downsampled by the backbone network with KPConv, and the point cloud is encoded into a group of superpoints with associated features. In order to further expand the receptive field of point clouds, a Dense Graph Feature Aggregation (DGFA) module is proposed to construct the superpoints and extract the depth graph features. In order to enrich the context information of the point cloud and enable the information interaction between the source and target point clouds, a Multilevel Interaction Transformer (MIT) module containing Multihead Offset Attention (MOA) and Multihead Cross Attention (MCA) is proposed. MOA carries out feature refinement inside the point cloud to extract features between point pairs, while MCA can make the feature information of source and target point clouds interact to predict the overlap region. The purpose of using a multilevel structure is to perform feature refinement and generate pointwise features containing structural information. In order to predict the distribution of overlap region, the proposed overlap prediction module is used to extract the overlap factor and matching factor of superpoints. In the decoder part, the output of the overlap prediction module and the pointwise features are concatenated and decoded into feature representation, overlap score, and matching score.
3.2.1. Encoder to Sample Superpoint
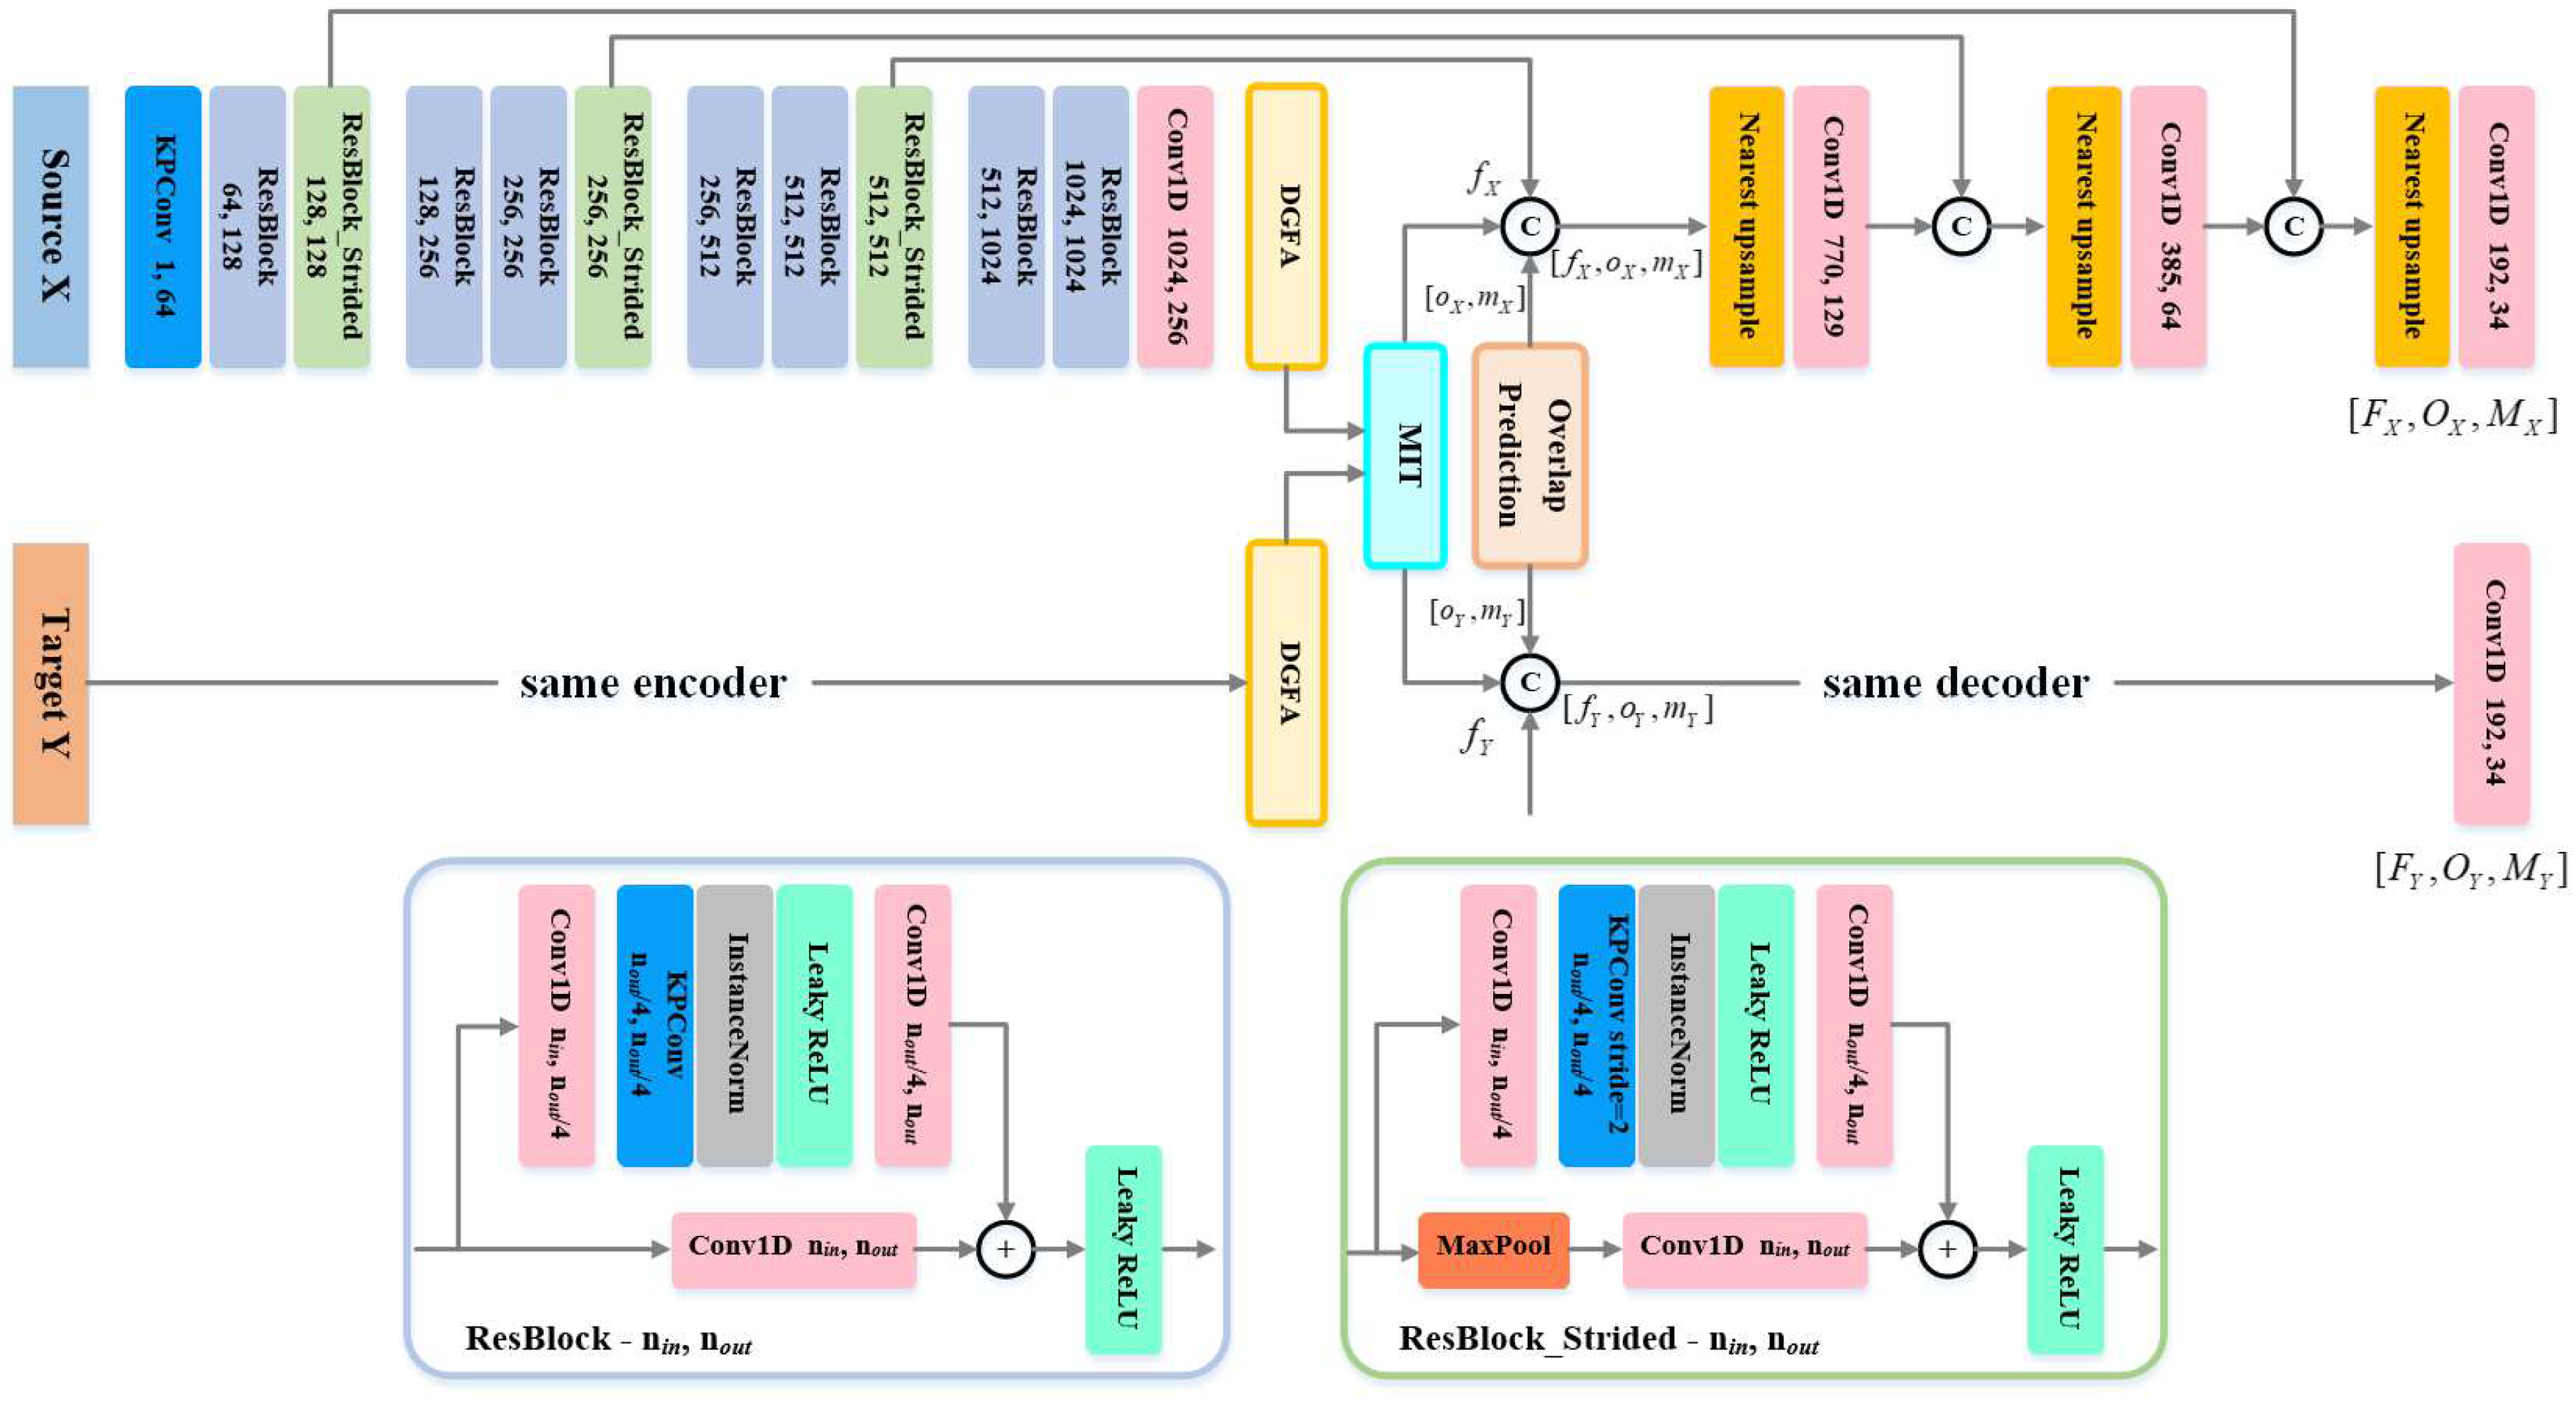
In the encoder stage, the superpoint sampling module follows [17,18,41] to use Kernel Point Convolution (KPConv) [42] for initial feature extraction and downsampling. The KPConv backbone uses a series of ResNet-like residual blocks and strided convolutions to convert the source point cloud and target point cloud into a group of simplified superpoints , , and their associated initial features , . The extracted features are used in subsequent processes and applied to the upsampling process to extract feature descriptors for the original point cloud resolution. The structure of the encoder is shown in Figure 2, which is mainly composed of two convolution layers, seven residual blocks and three downsampling residual blocks.
3.2.2. Dense Graph Feature Aggregation Module
More discriminative point features will affect the determination of overlap region. For the superpoints and initial features obtained at the encoder stage, in order to further expand the receptive field of the point cloud and enrich the context information, the Dense Graph Feature Aggregation (DGFA) module is proposed to construct the graph of the superpoints and extract the depth graph features.
Graph convolution [37] operations are performed on the source and target point clouds, respectively. Specifically, considering the points in the superpoints as the vertices of the graph. According to the Euclidean distance in 3D space, the edges of the graph are generated around the vertices using k-NN algorithm, which completes the construction of the initial graph. The features of layer l + 1 can be iteratively expressed as:
where l denotes multiple levels, denotes the initial feature of vertex i, denotes the neighbourhood points of vertex i in the graph, denotes Multilayer Perceptron (MLP) linear operation with convolution layer, instance normalization layer, and LeakyReLU activation function, and max denotes max pooling operation in dimension.
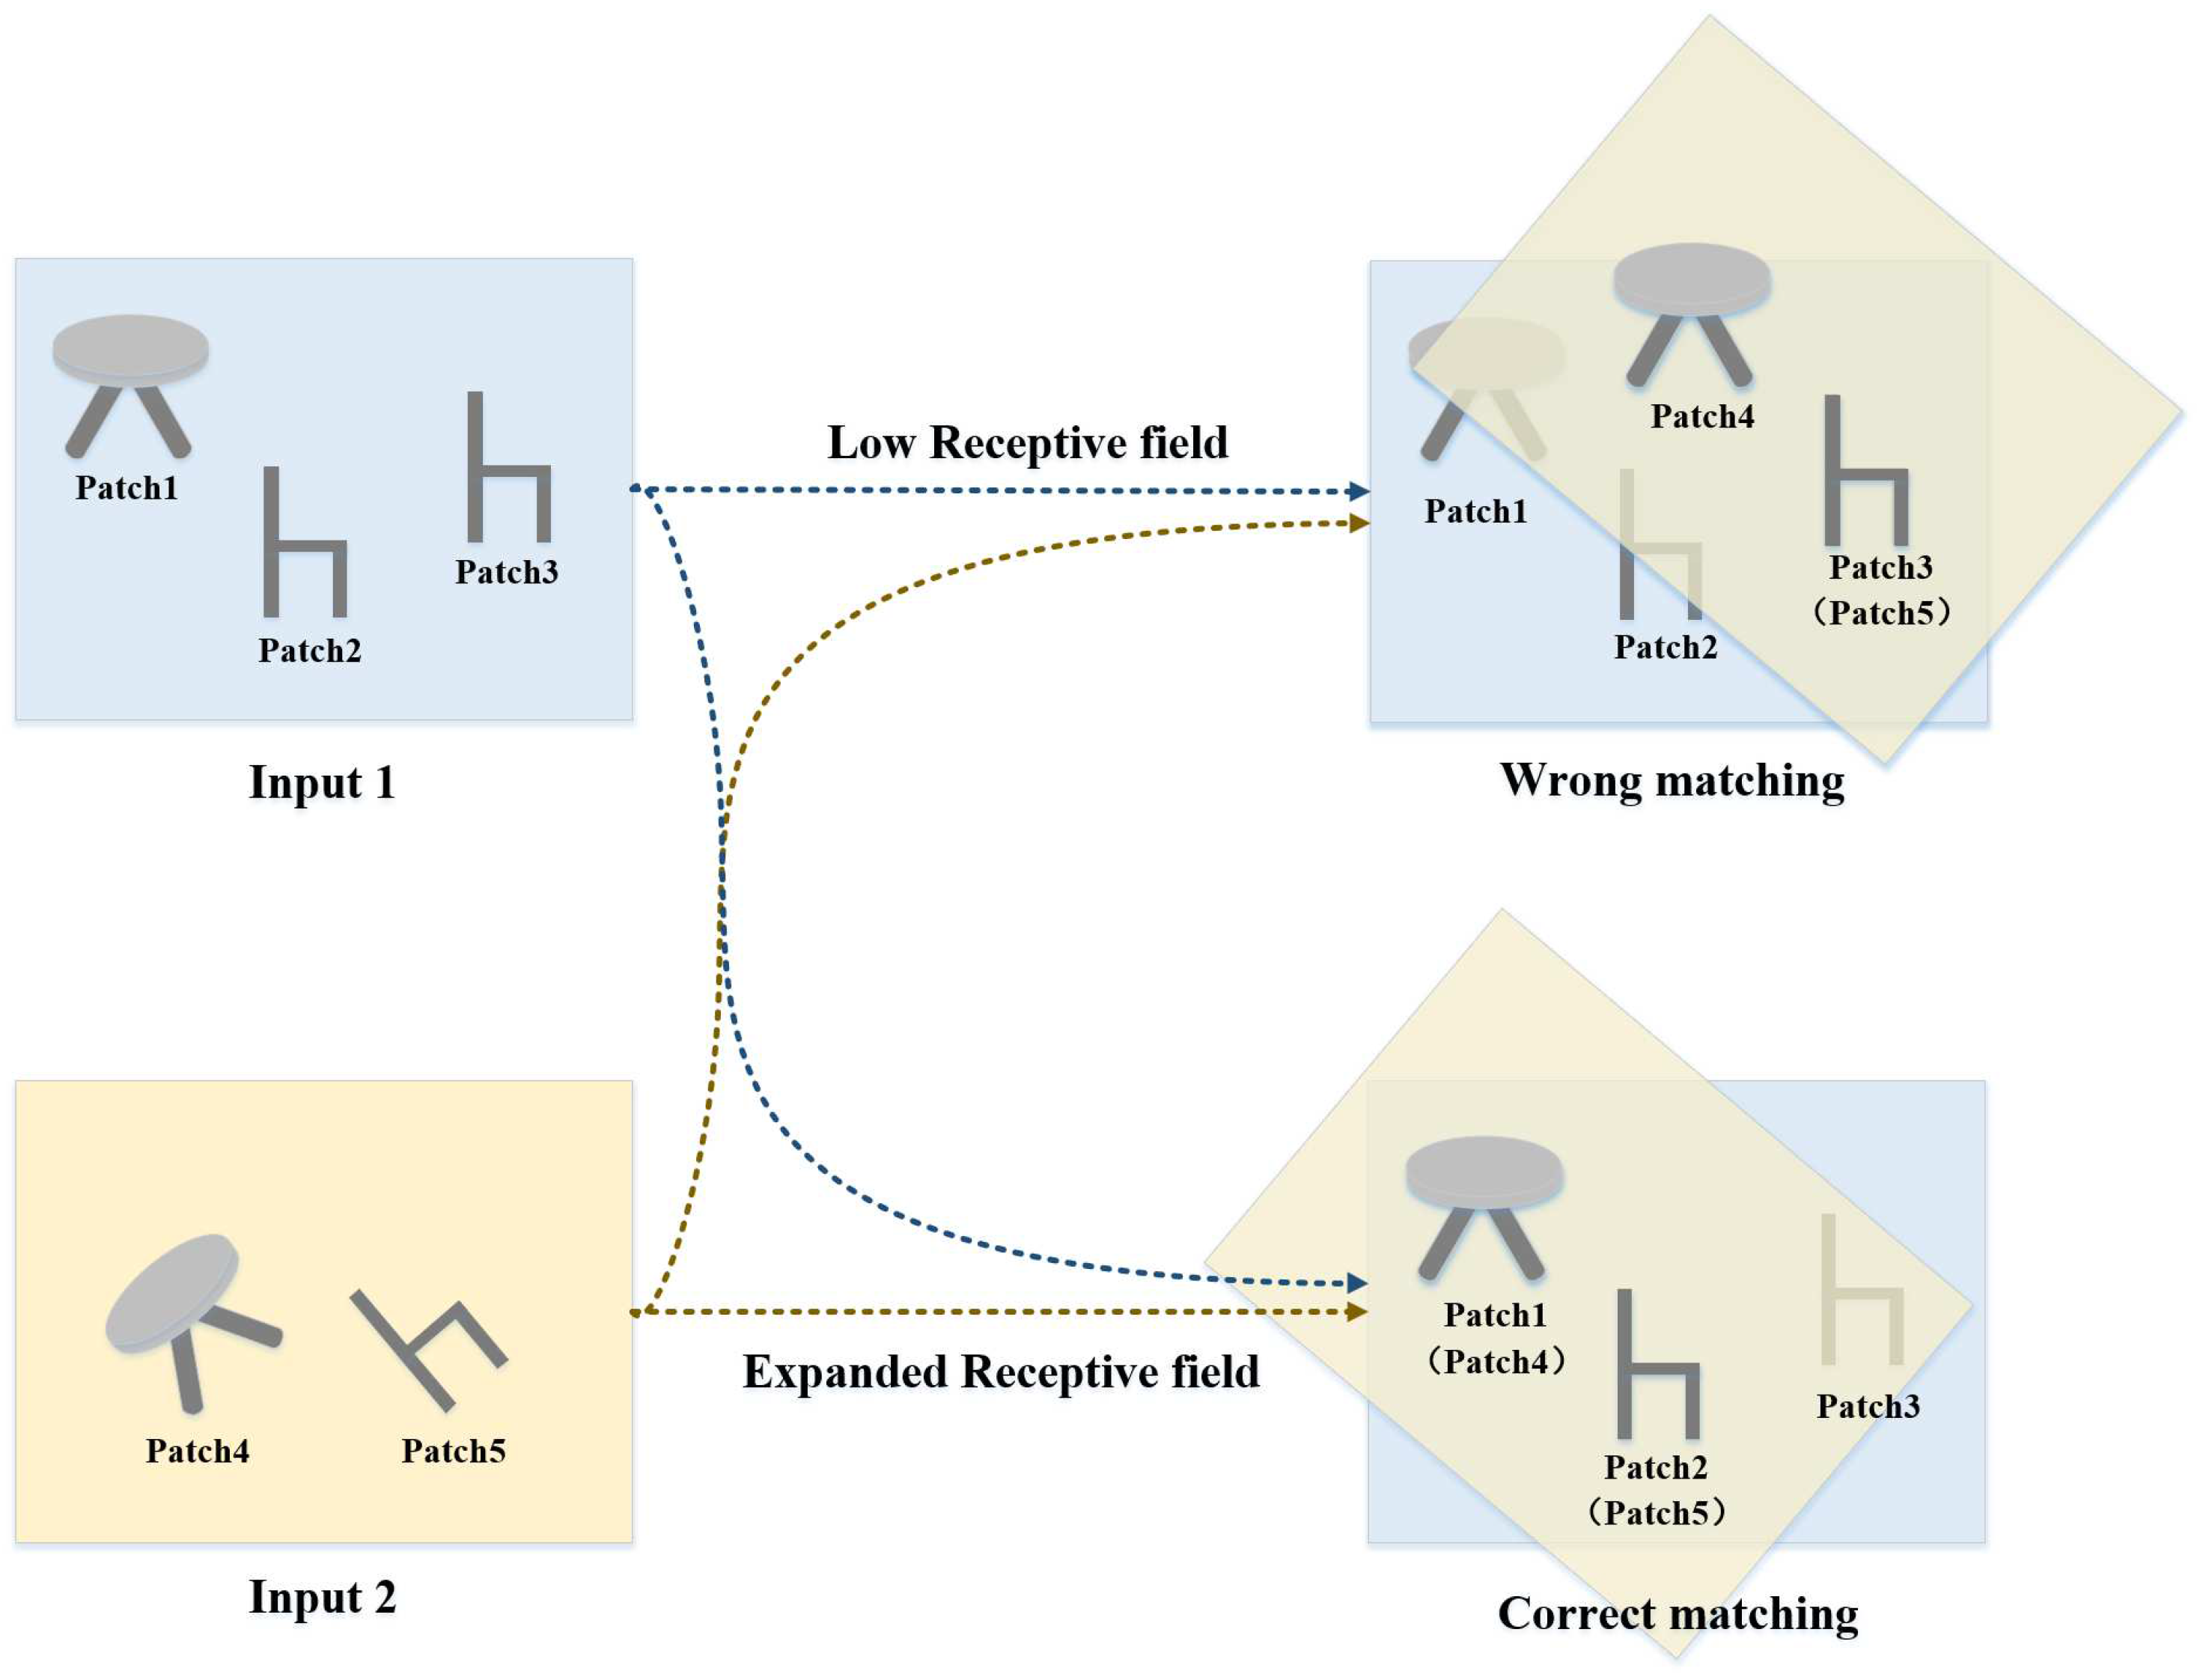
In static graphs, vertex features can only be captured according to the spatial distribution of local neighborhoods, so a single graph convolution operation will limit the receptive field information of vertices. This carries the risk of missing local geometry information, resulting in wrong matching. In order to explain this phenomenon more intuitively, the relevant schematic diagram is given in Figure 3. The inputs are two point cloud regions with partial overlap, namely Input 1 and Input 2. The Input 1 contains Patch1, Patch2, and Patch3, where Patch2 and Patch3 have highly similar geometric structures. Input 2 contains Patch4 and Patch5. In the process of matching, if the local receptive field of the scene is small, it is easy to regard Patch3 and Patch5 as the same object in the overlap region, which may cause wrong matching. If the receptive field in the scene is expanded, Patch1 and Patch4 will be judged to be the same object in the overlap region, as will Patch2 and Patch5, thus producing a correct matching. Therefore, the expanded receptive field is more conducive to the generation of correct matching relations.
In order to expand the receptive field of points, the graph features are updated at each layer using the k-NN algorithm with different scale neighborhoods in the feature space. To make the extracted pointwise features more discriminative to contain distinguishing structural information, this study refers to the structure of [43] and proposes a densely-connected graph convolution to aggregate graph features at multiple scales. This module is named Dense Graph Feature Aggregation (DGFA), and its structure is shown in Figure 1a.
The multilayer graph convolution is composed of a cascaded way, and each layer of graph convolution has different scales of neighborhood, and the range of the front and back neighborhood is gradually expanded. The input of DGFA is the original graph features composed of superpoints, and the output is obtained by aggregating graph features at multiple scales. The features obtained by each layer of graph convolution in DGFA can be expressed as:
where denotes the lth-layer graph convolution operation with the number k as the neighborhood query point at different scales, and cat denotes the concatenation operation of the output of each previous layer in dimension. Then, the output of DGFA can be expressed as:
where denotes the MLP linear operation with convolutional layer, instance normalization layer, and LeakyReLU activation function. DGFA improves the flow of structural information, avoids the problem of gradient disappearance in neural networks, and integrates multilevel receptive field information based on different resolution point sets.
3.2.3. Multilevel Interaction Transformer Module
In the above step, the multiscale graph features of the source and target point clouds are extracted, respectively, but there is no information interaction between the source and target point clouds before, and the prediction of potential overlap region can only be calculated with the mixed features of the source and target point clouds. In order to enrich the context information of the point cloud and enable the information interaction between the source and target point clouds, a Multilevel Interaction Transformer (MIT) module containing Multihead Offset Attention (MOA) and Multihead Cross Attention (MCA) is proposed. MOA carries out feature refinement inside the point cloud to extract features between point pairs. MCA can make the feature information of source point cloud and target point cloud interact to predict the overlap region. The purpose of using a multilevel structure is to enable overlap region to perform feature refinement and generate pointwise features containing structural information.
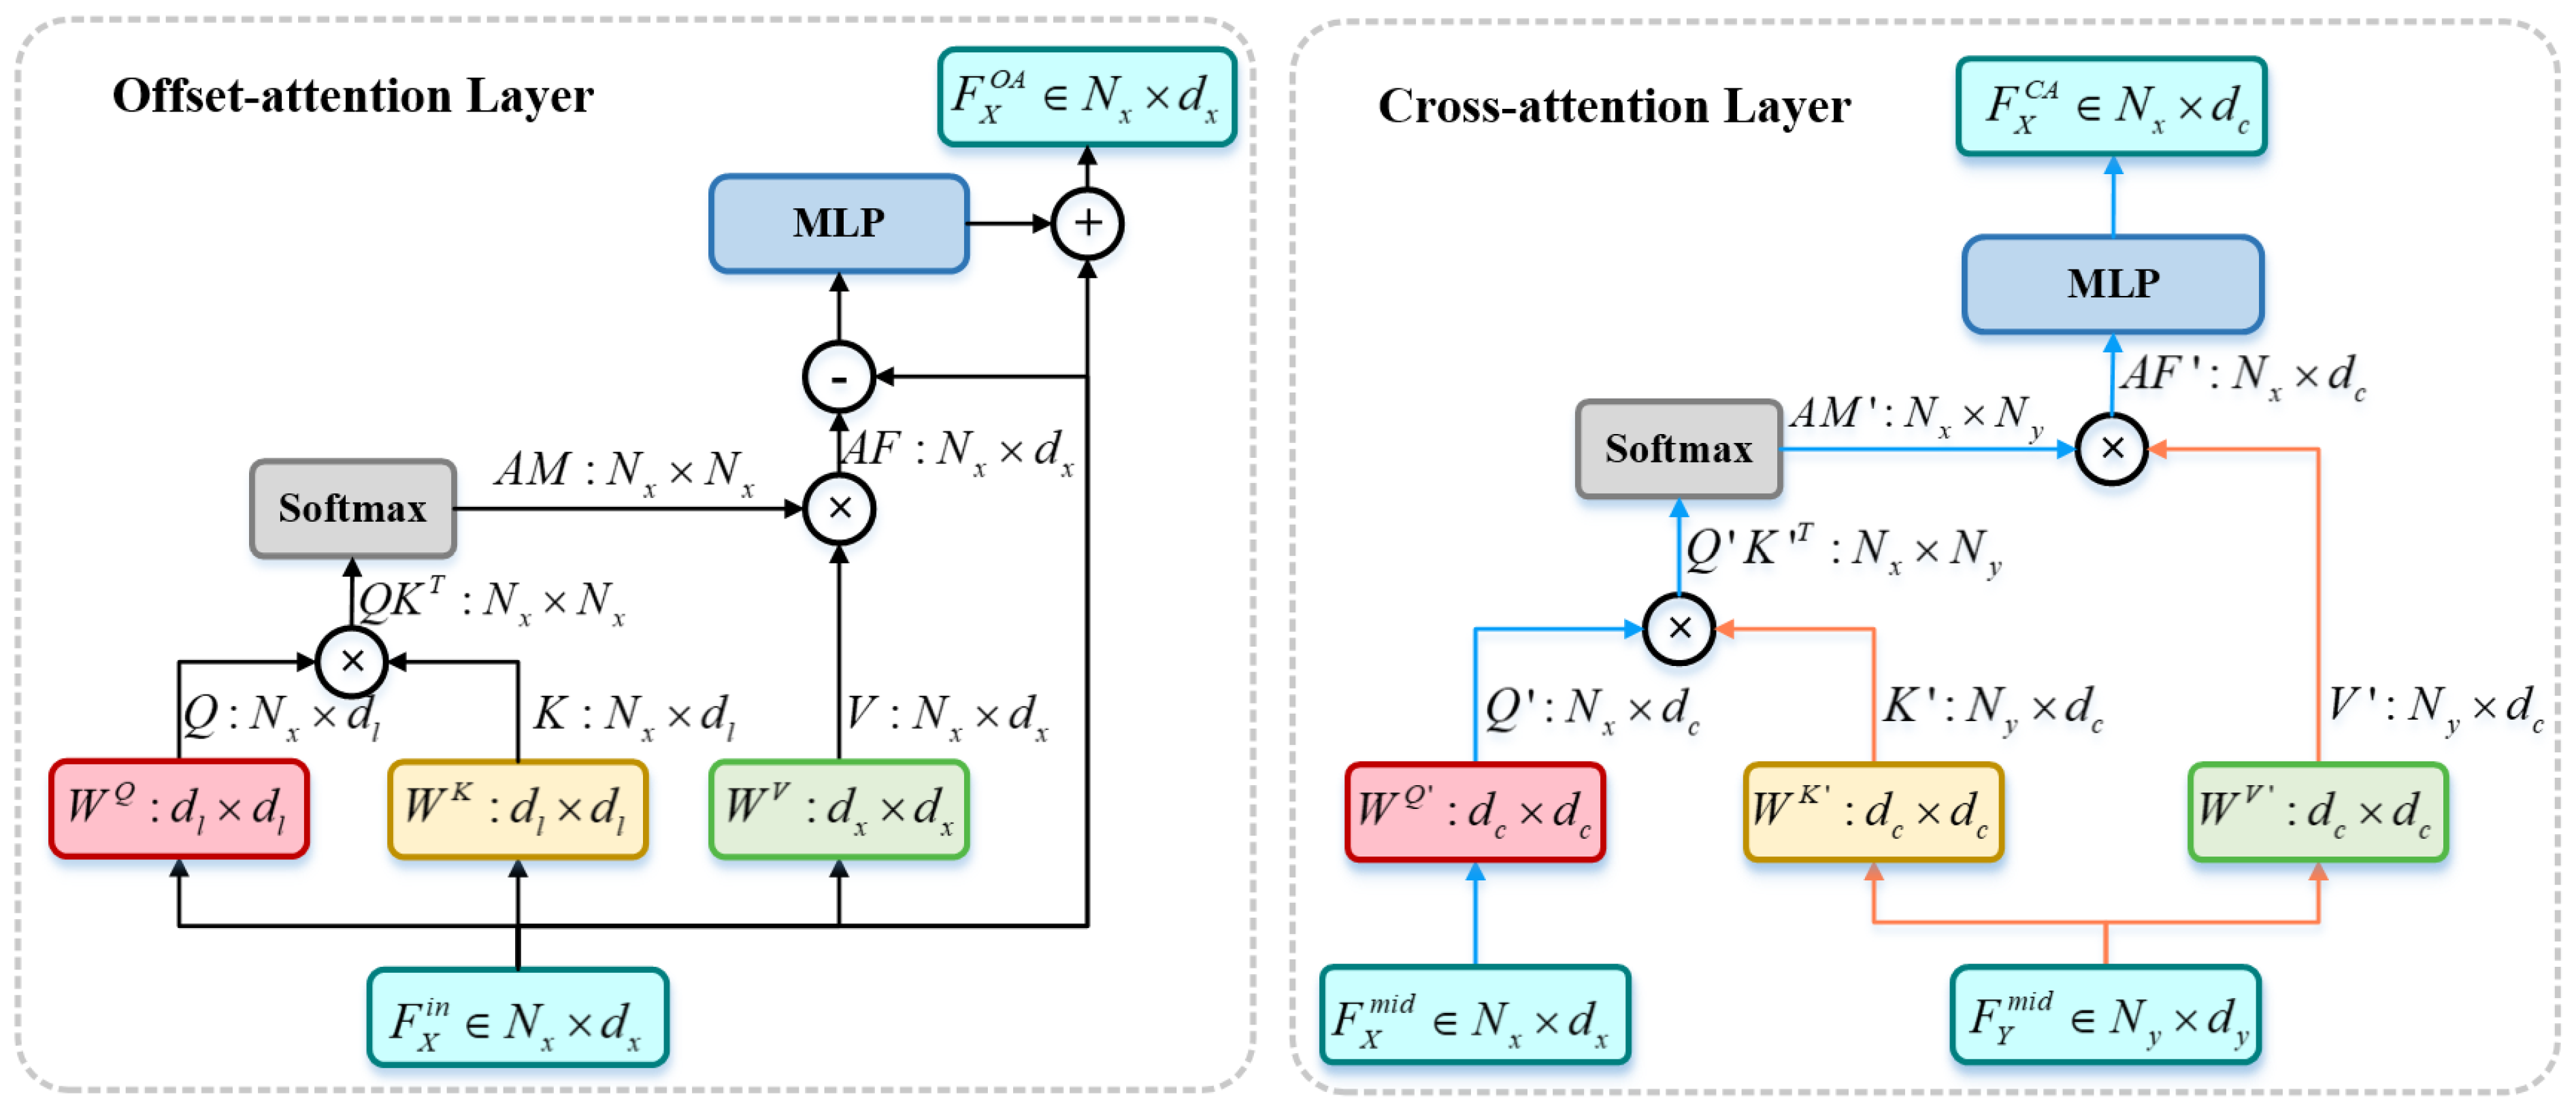
Inspired by PCT [44], when Transformer is applied to the point cloud, the Self-Attention (SA) can be replaced by Offset Attention (OA) to achieve better network performance. Therefore, this study uses Multihead Offset Attention (MOA) for feature refinement inside the point cloud to extract features between point pairs. The OA layer computes the offset between the attention feature AF and the input feature by calculating subtraction between elements, as shown in Figure 4 (left). The output of OA is defined as:
The output of MOA is defined as:
where denotes concatenation operations in channel dimensions, , and represent learnable projection matrices used to project , , and to Q, K, and V; is a projection matrix for feature concatenation, where h denotes the amount of attention performed in parallel and denotes the dimension of K.
In addition, Multihead Cross Attention (MCA) is used to interact the features of the source and target point clouds. The internal structure of Cross Attention (CA) is shown in Figure 4 (right), where Q comes from one point cloud, K and V come from another, and the output of CA is defined as:
The output of MCA is defined as:
The superpoint features of source point cloud and target point cloud are output by DGFA to obtain the multi-scale graph features and , respectively. Firstly, MLP is used for feature normalization to obtain and . In MOA, Q, K, and V come from the same point cloud. MOA operations are performed on the normalized features and of source and target point clouds, respectively, which can be expressed as:
In MCA, Q comes from one point cloud, K and V come from another. Performing MCA operations on and can be expressed as:
From this, one level of output features in the MIT module can be obtained. If this feature continues to repeat the MOA and MCA operations. MIT allows overlap region to be feature refined and generate pointwise features containing structural information.
3.2.4. Overlap Prediction Module
The superpoints located in the overlap region are an important source of computing transformation parameters. Most of existing methods generate feature descriptors for the superpoints in the overlap region and then perform matching. Huang et al. [17] proposed that the distribution of overlap region should be determined first, which would lead to a higher probability of matching in the case of low overlap. In the proposed overlap prediction module, the distribution of overlap region is also estimated firstly. Considering the multilevel interaction features extracted from source point cloud X and target point cloud Y are named and , respectively, in the MIT module, the overlap region prediction can obtain source from them directly. An overlap factor is proposed to calculate the probability of the superpoints of the source and target point clouds lying in the overlap region, also a matching factor is proposed to determine whether a point is favorable for matching.
Firstly, MLP operations are performed on and respectively, to obtain the normalized multilevel interaction features and . The MLP[C,1] operation is performed for and , respectively, and the results can be used to characterize the overlap factor between the source and target point cloud superpoints, i.e.:
where and denote the probability that the superpoints of the source and target point clouds lie in the overlap region, respectively.
Inspired by GLORN [45], not all predicted points located in the overlap region are conducive to matching. Some superpoints may be located in smooth regions or corners, which will affect the generation of the best transformation parameters. Therefore, the matching factor is used to calculate the matching score of superpoints to determine whether a point is favorable for matching, so as to avoid the influence of points with low matching score on the registration result.
The idea of calculating matching factors is given as follows. Usually there are two conditions for two points to be highly matched, one is that both points are located in the overlap region, and the other is that the features of the two points are highly similar. For the superpoints and of the source and target point clouds, then the matching factor of all points in is related to all points in , denoting the point in as and the point in as . If the overlap factor of is high, when the features of are highly similar to those of , and is distributed in the overlap region, then will provide a high matching factor for . When the similarity between the features of and is low, but is distributed in the overlap region, then can only provide a low matching factor for . When is not in the overlap region, the matching factor will be the lowest regardless of whether the feature of is similar to the feature of .
For the normalized multilevel interaction features and , the similarity matrix is calculated as:
The matching factor for superpoints and is calculated as:
where denotes matrix multiplication. and represent the degree of influence of the superpoints of source and target point clouds on matching, respectively. A larger value indicates that the point is more favorable for matching.
After obtaining the overlap factor and matching factor of superpoints, the pointwise feature of superpoints is obtained by concatenating the output of the third ResBlock_Strided and the output of the MIT module in the encode stage, which can be referred to in Figure 2 for details. Finally, the pointwise features, overlapping factors, and matching factors of the superpoints are concatenated, and the following output is obtained:
3.2.5. Decoder to Generate Descriptors
In overlap prediction module, the overlap factor and matching factor are designed for the superpoints extracted by the encoder process. For all the points in the point cloud, more detailed feature descriptors are still needed. Therefore, the purpose in decoder stage is to generate feature descriptors of all points. The structure of decoder is shown in Figure 2, where the features of encoder are passed to decoder through skip link concatenations. Then, the nearest neighbor upsampling is performed to gradually obtain the pointwise features of the original points, and the MLP is used for processing. After many similar operations, the final output is an N-dimensional vector, where the first N-2 dimensions represent pointwise features, and the last two dimensions represent overlapping scores and matching scores, respectively.
3.3. Loss Function
GCMTN adopts the end-to-end training strategy, and the total loss function is composed of three independent loss parts:
where is used to measure feature loss, denotes overlap loss, and denotes matching loss.
3.3.1. Feature Loss
Regarding feature loss, relevant criteria have been established, wherein the feature similarity between matched point pairs is higher, whereas the feature similarity between unmatched point pairs is lower. To monitor the descriptors of pointwise features, some methods [17,41,45] employ circle loss [46] to extract the feature descriptors of superpoints via metric learning. But the circle loss ignores the differences between positive samples and weights them equally, so it is difficult to match the regions with relatively low overlap. To address this issue, circle loss has been improved by referring to [19], and a feature loss has been designed. Specifically, the source point cloud X and the target point cloud Y are a partially overlapping point cloud with registration. For point located in the overlap region, there is one or more points in Y corresponding to it. The set of corresponding points in the circle with radius is defined as , and the set of noncorresponding points outside the circle with radius is defined as . The aim is for the features of to be similar to the features in while exhibiting significant differences from the features in . The feature loss for source point cloud X can be calculated as:
where denotes a randomly selected point in the overlap region of X. denotes Euclidene distance in the feature space, denotes the overlap ratio of X and Y, and are used to define the positive and negative boundaries, and and represent the weights of positive and negative samples, calculated by the following formula:
where the value of the edge hyperparameter is set to , , and is a predefined constant. The feature loss for the target point cloud Y can be calculated using a similar function. The total feature loss is .
3.3.2. Overlap Loss
The relevant guidelines have been established for overlap loss. The overlap factor approaches 1 at the point located in the overlap region and approaches 0 outside the overlap region. Therefore, the estimation of overlap probability is regarded as a binary classification problem, and the overlap loss for source point cloud X can be calculated by the following binary cross entropy loss function:
where the overlap factor of point is mapped to the ground truth label , defined as follows:
where denotes the overlap threshold, and the overlap loss for the target point cloud Y can be calculated using a similar binary cross entropy loss function. The total overlap loss is .
3.3.3. Matching Loss
Regarding the matching loss, relevant criteria have also been established. For correctly matched points, the matching factor approaches 1 and for mismatched points, the matching factor approaches 0. Therefore, the estimation of matching probability can also be regarded as a binary classification problem, and the ground truth label is generated dynamically. The matching loss for source point cloud X can be calculated using the following binary cross entropy loss function:
where the matching factor of point is mapped to the ground truth label , defined as follows:
where denotes the matching threshold, and the matching loss for the target point cloud Y can be calculated using a similar binary cross entropy loss function. The total match loss is .
4. Experiments and Results
4.1. Datasets and Platforms
4.1.1. Datasets
Extensive experiments were conducted in this part to evaluate the registration performance of GCMTN. Firstly, GCMTN was compared with other related registration methods in the publicly available datasets ModelNet [47] and ModelLoNet [17]. Comparative experiments were carried out using the 3DMatch [48] and 3DLoMatch [17] datasets on the real indoor scenes, and GCMTN was evaluated in large outdoor scenes using the odometryKITTI [49] dataset. Furthermore, ablation studies were conducted to verify the effectiveness of the proposed modules in GCMTN. Table 1 summarizes the datasets used for the experiments and the dataset partitioning settings.
4.1.2. Experimental Parameters
Table 2 presents the experimental parameters of the proposed method. L represents the number of graph convolution layers used for cascading in the DGFA module, and N represents the number of times the MOA and MCA operations are repeated in the MIT module. , , , and are parameters for the feature loss, while and represent the thresholds for corresponding point sets and noncorresponding point sets, respectively. denotes the overlap threshold in the overlap loss, and stands for the matching threshold in the matching loss.
4.1.3. Implementation Details
In the experiment, the Adam optimizer is used to train for 200 epochs on ModelNet, 40 epochs on 3DMatch, and 120 epochs on odometryKITTI, with a batch size of 1. The weight decay for all training is set to 1 × 10⁶, and the initial learning rate is set to 1 × 10⁴. The learning rate is decayed by 0.05 for every step on ModelNet and 3DMatch, and by 0.05 for every four steps on odometryKITTI. The experimental platform is 2.0 GHz Intel CPU, 48 GB RAM, NVIDIA GeForce RTX 2080Ti, and Linux/Ubuntu 64-bit PC. The programming environment includes Anaconda 5.0.1 (Python 3.6), PyTorch1.8.0, and so on.
To investigate the characteristics of the proposed GCMTN, a comparison was also made between it and the related state-of-the-art algorithms, such as DCP-v2 [34], RPM-Net [33], Predator [17], REGTR [18], PerfectMatch [50], FCGF [51], D3Feat [41], SpinNet [52], 3DFeat-Net [53], and GLORN [45]. The parameters of these methods were adopted as the original papers reported. It was noticed that the tasks of these compared methods are not identical, so not all of them were compared in all experiments.
4.2. Experiments on ModelNet40
4.2.1. Dataset and Evaluation Metrics
ModelNet40 [47] contains 12,311 CAD models of man-made objects in 40 different categories. Among them, 5112 samples are used for training, 1202 samples for validation, and 1266 samples for testing. Partial scans were generated according to [17]; in addition to ModelNet with an average of 73.5% pairwise overlap, ModelLoNet with a low average overlap rate (53.6%) was also generated following [17], which was used to verify the point cloud registration performance of GCMTN under low overlap ratio. This study follows [17] to evaluate the performance of the registration network using three metrics: Relative Rotation Error (RRE), Relative Translation Error (RTE), and Chamfer Distance (CD).
4.2.2. Registration Results
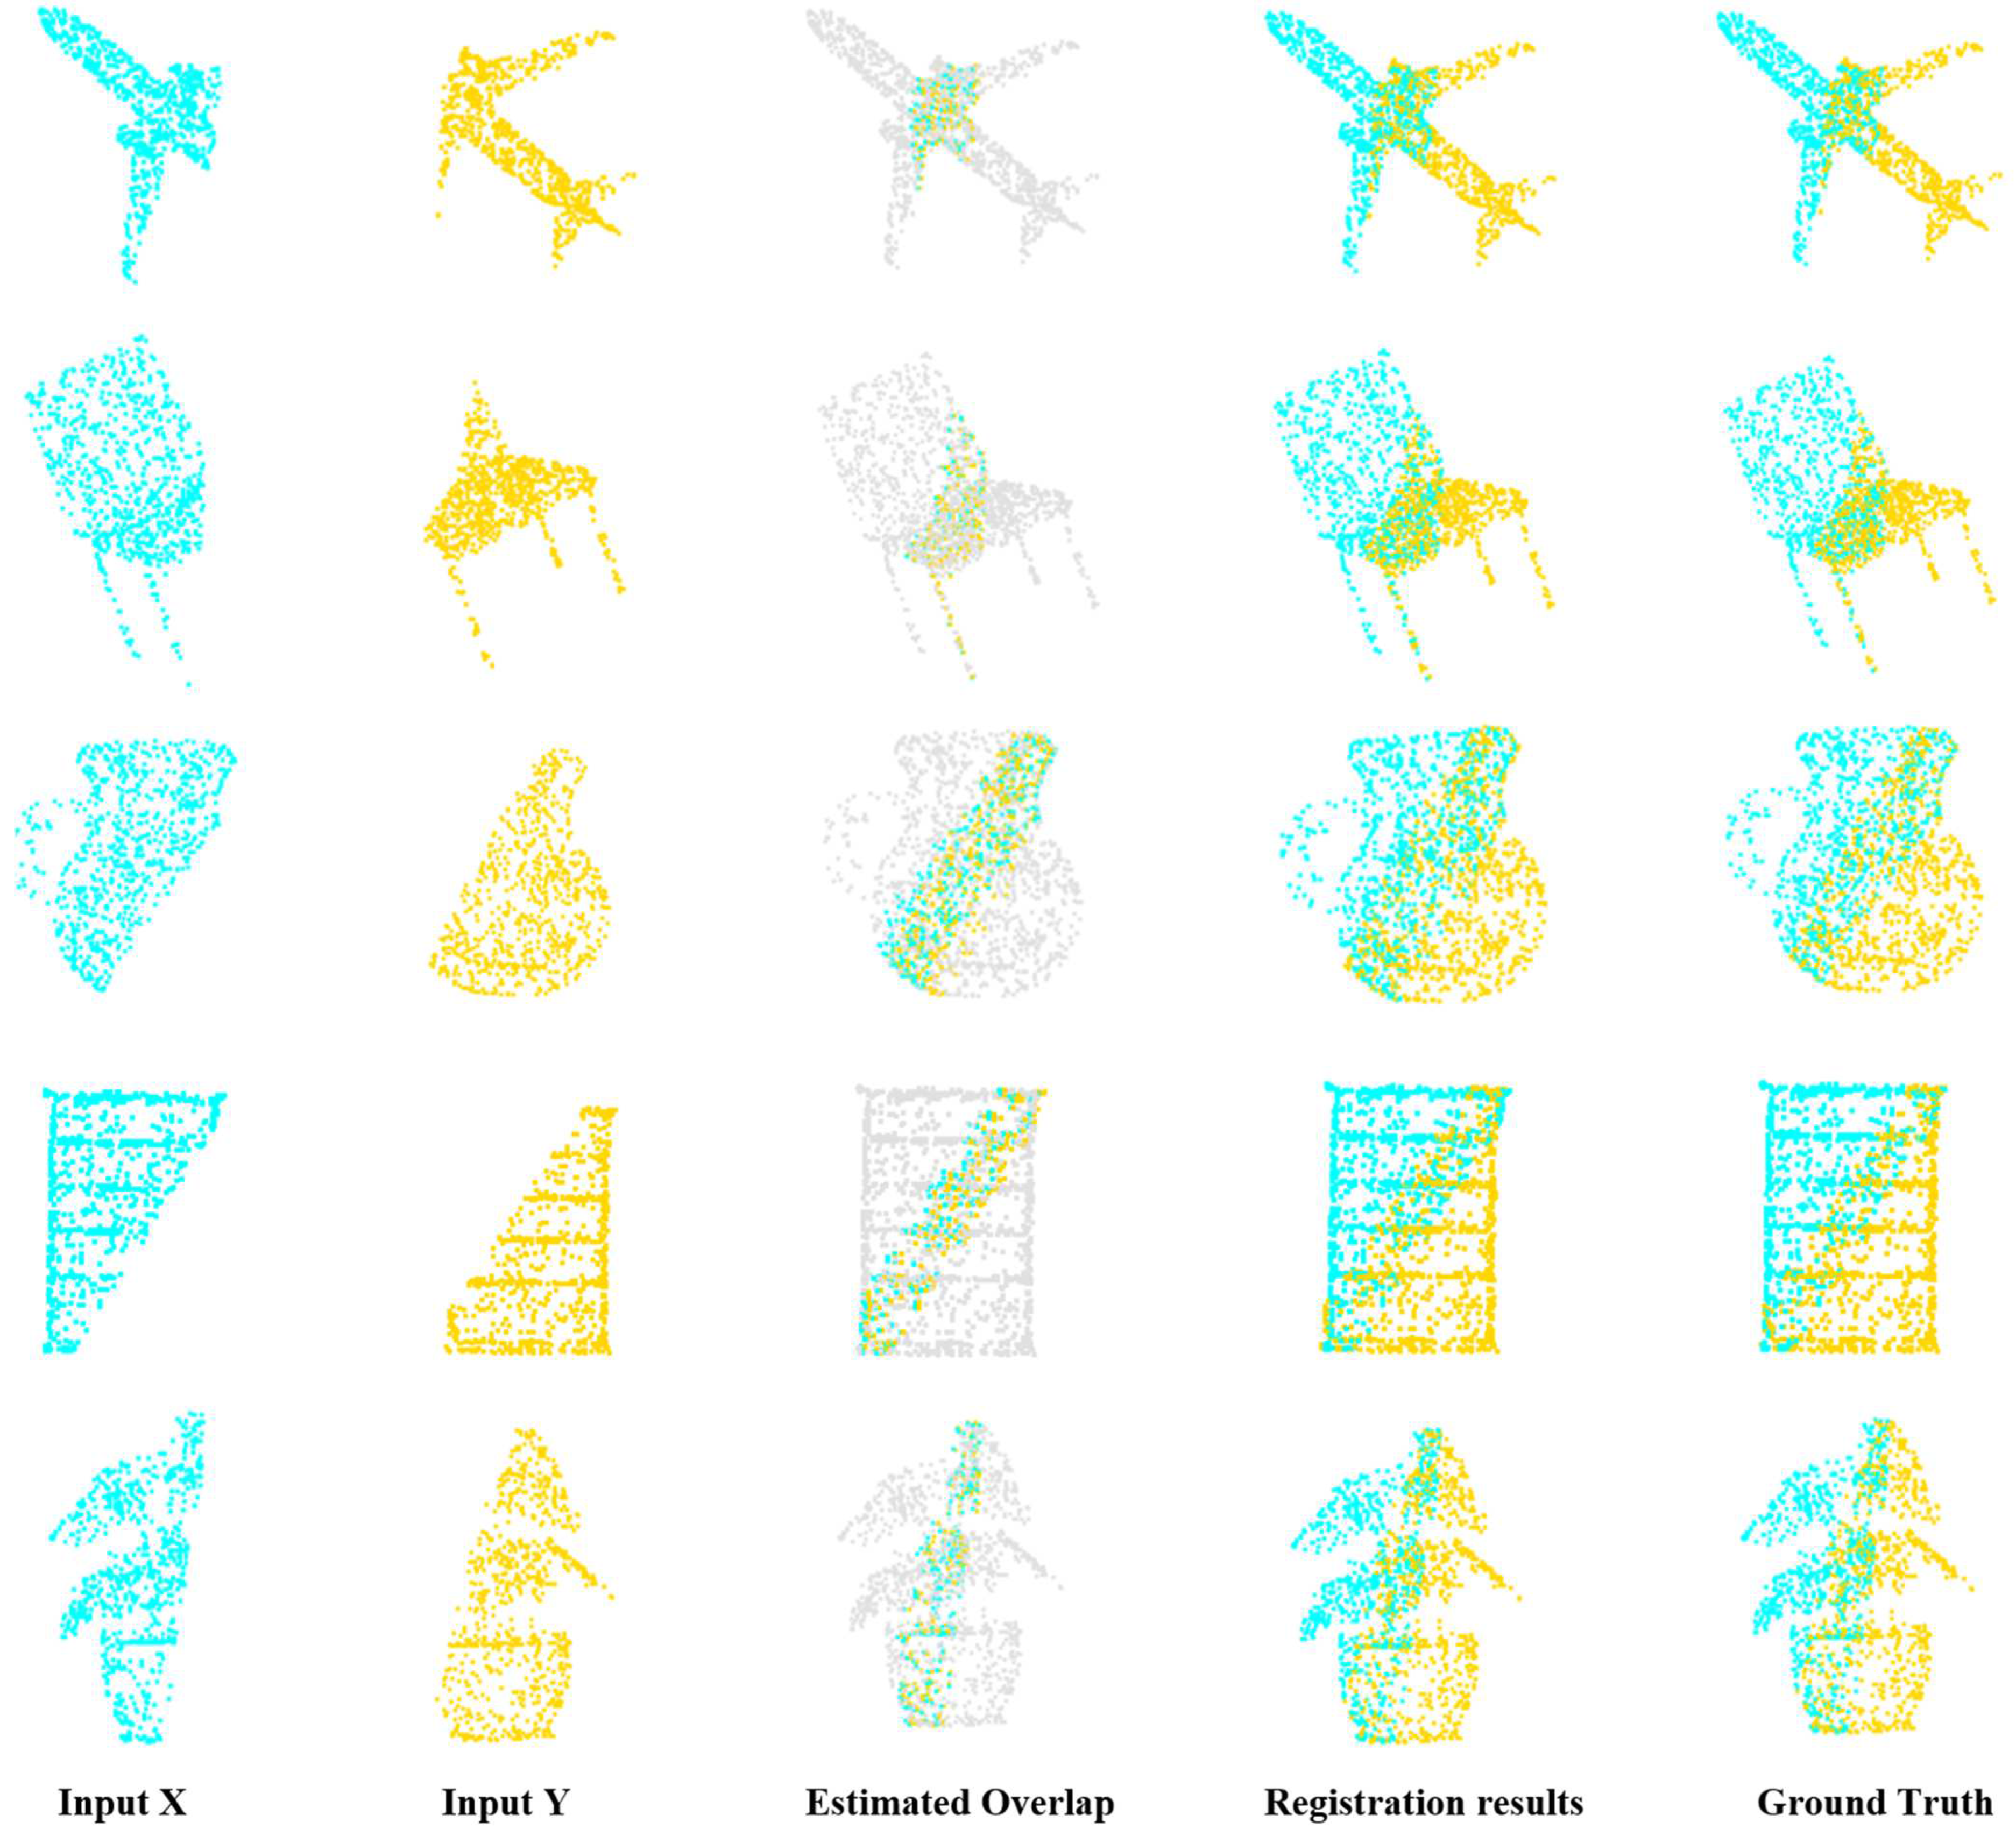
GCMTN is compared with some recent methods based on direct registration, such as DCP-v2 [34], RPM-Net [33], Predator [17], and REGTR [18], etc. Table 3 reports the quantitative results in three metrics. It can be seen that for ModelNet with high overlap, although GCMTN is inferior to REGTR on RRE, it performs best on RTE and CD compared with other comparison methods. For ModelLoNet with low overlap, although GCMTN is inferior to REGTR on RRE and CD, it performs best on RTE compared to other comparison methods. In order to visually demonstrate the registration effect of GCMTN, it is depicted in Figure 5. By randomly clipping the point cloud data in ModelNet and downsampling, the input source point cloud and target point cloud are generated, and only keep a low overlap. As can be seen from the figure, the registration result is basically close to the ground truth. It can be seen that GCMTN performs better on the synthetic dataset ModelNet with low overlap.
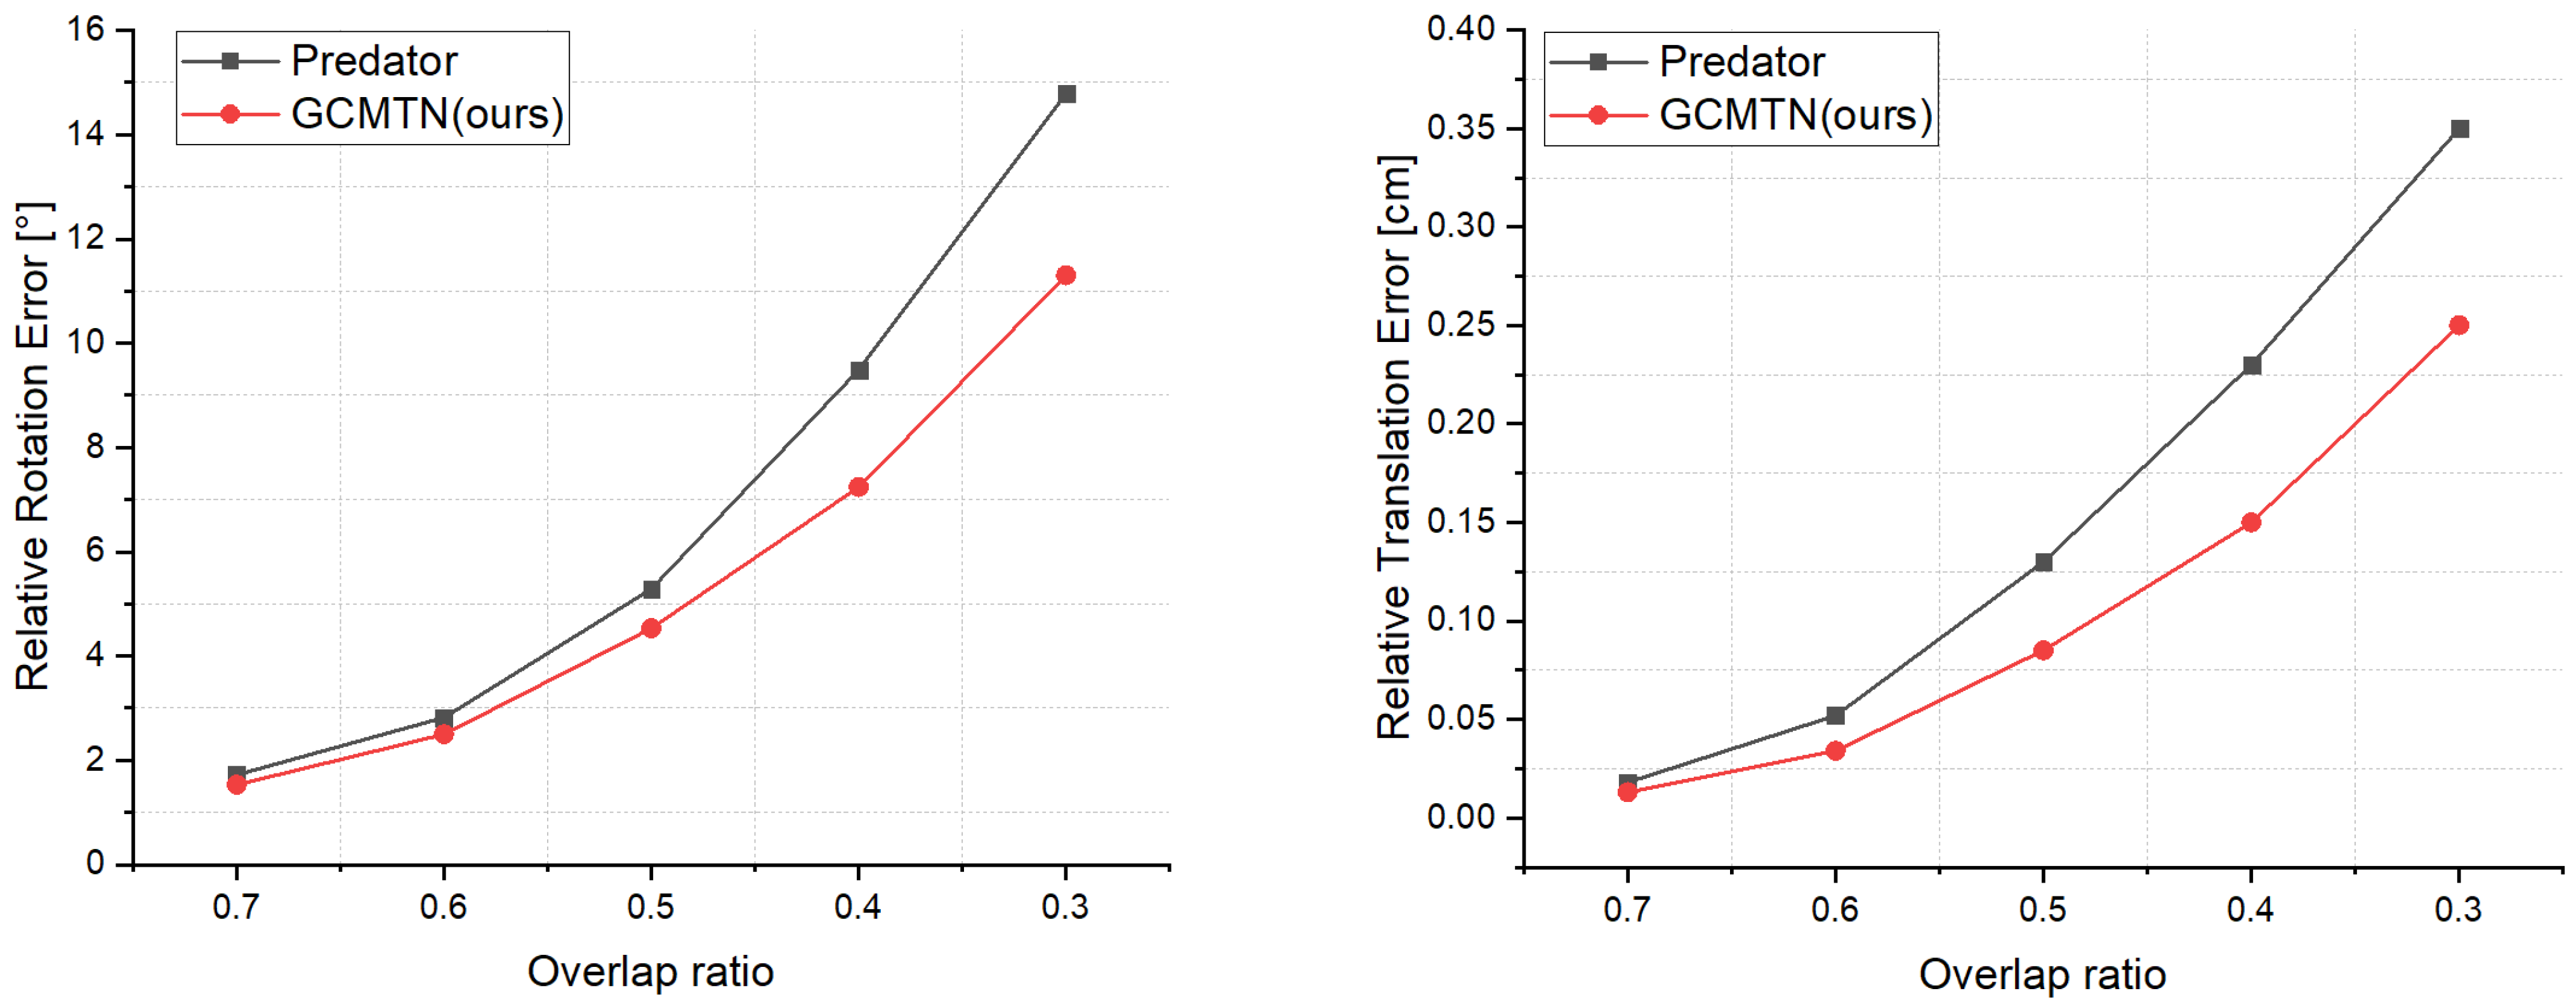
To re-evaluate whether GCMTN is focusing on overlap regions, 8862 test pairs were extracted by changing the integrity of the input point cloud from 70% to 30%. Figure 6 shows the comparison results of GCMTN and Predator at different overlap ratios. With the decrease in overlap ratio, the values of RRE and RTE increase, but the values of GCMTN in RRE and RTE are lower than those of Predator. It can also be proved that GCMTN has excellent registration performance when dealing with low overlap.
4.3. Experiments on 3DMatch
4.3.1. Dataset and Evaluation Metrics
The 3DMatch [48] dataset is a typical indoor scene cloud dataset, consisting of sixty-two indoor real scenes collected by RGB-D, in which the data of forty-six scenes are used for training, eight scenes are used for validation, and the other eight scenes are used for testing. Each scene contains overlapping fragments and ground truth transformation. Preprocessed data from the sampling point cloud containing the voxel grid in [17] was used. Scan pairs with more than 30% overlap are only considered in the official 3DMatch dataset. To verify the validity of GCMTN on the registration task with a low overlap ratio, scan pairs with an overlap between 10% and 30% (3DLoMatch) were considered following [17]. As a result, comparative experiments were conducted on the 3DMatch and 3DLoMatch datasets, respectively. This study follows [17,19] to evaluate the performance of the registration network using three metrics: Inlier Ratio (IR), Feature Match Recall (FMR), and Registration Recall (RR).
4.3.2. Registration Results
GCMTN is compared with more recent methods such as PerfectMatch [50], FCGF [51], D3Feat [41], Predator [17], SpinNet [52], and REGTR [18]. It takes the whole point cloud as input and reports the results with different numbers of correspondences, which are 5000, 2500, 1000, 500, and 250. As shown in Table 1, it presents the quantitative results for three evaluation metrics: FMR, IR, and RR.
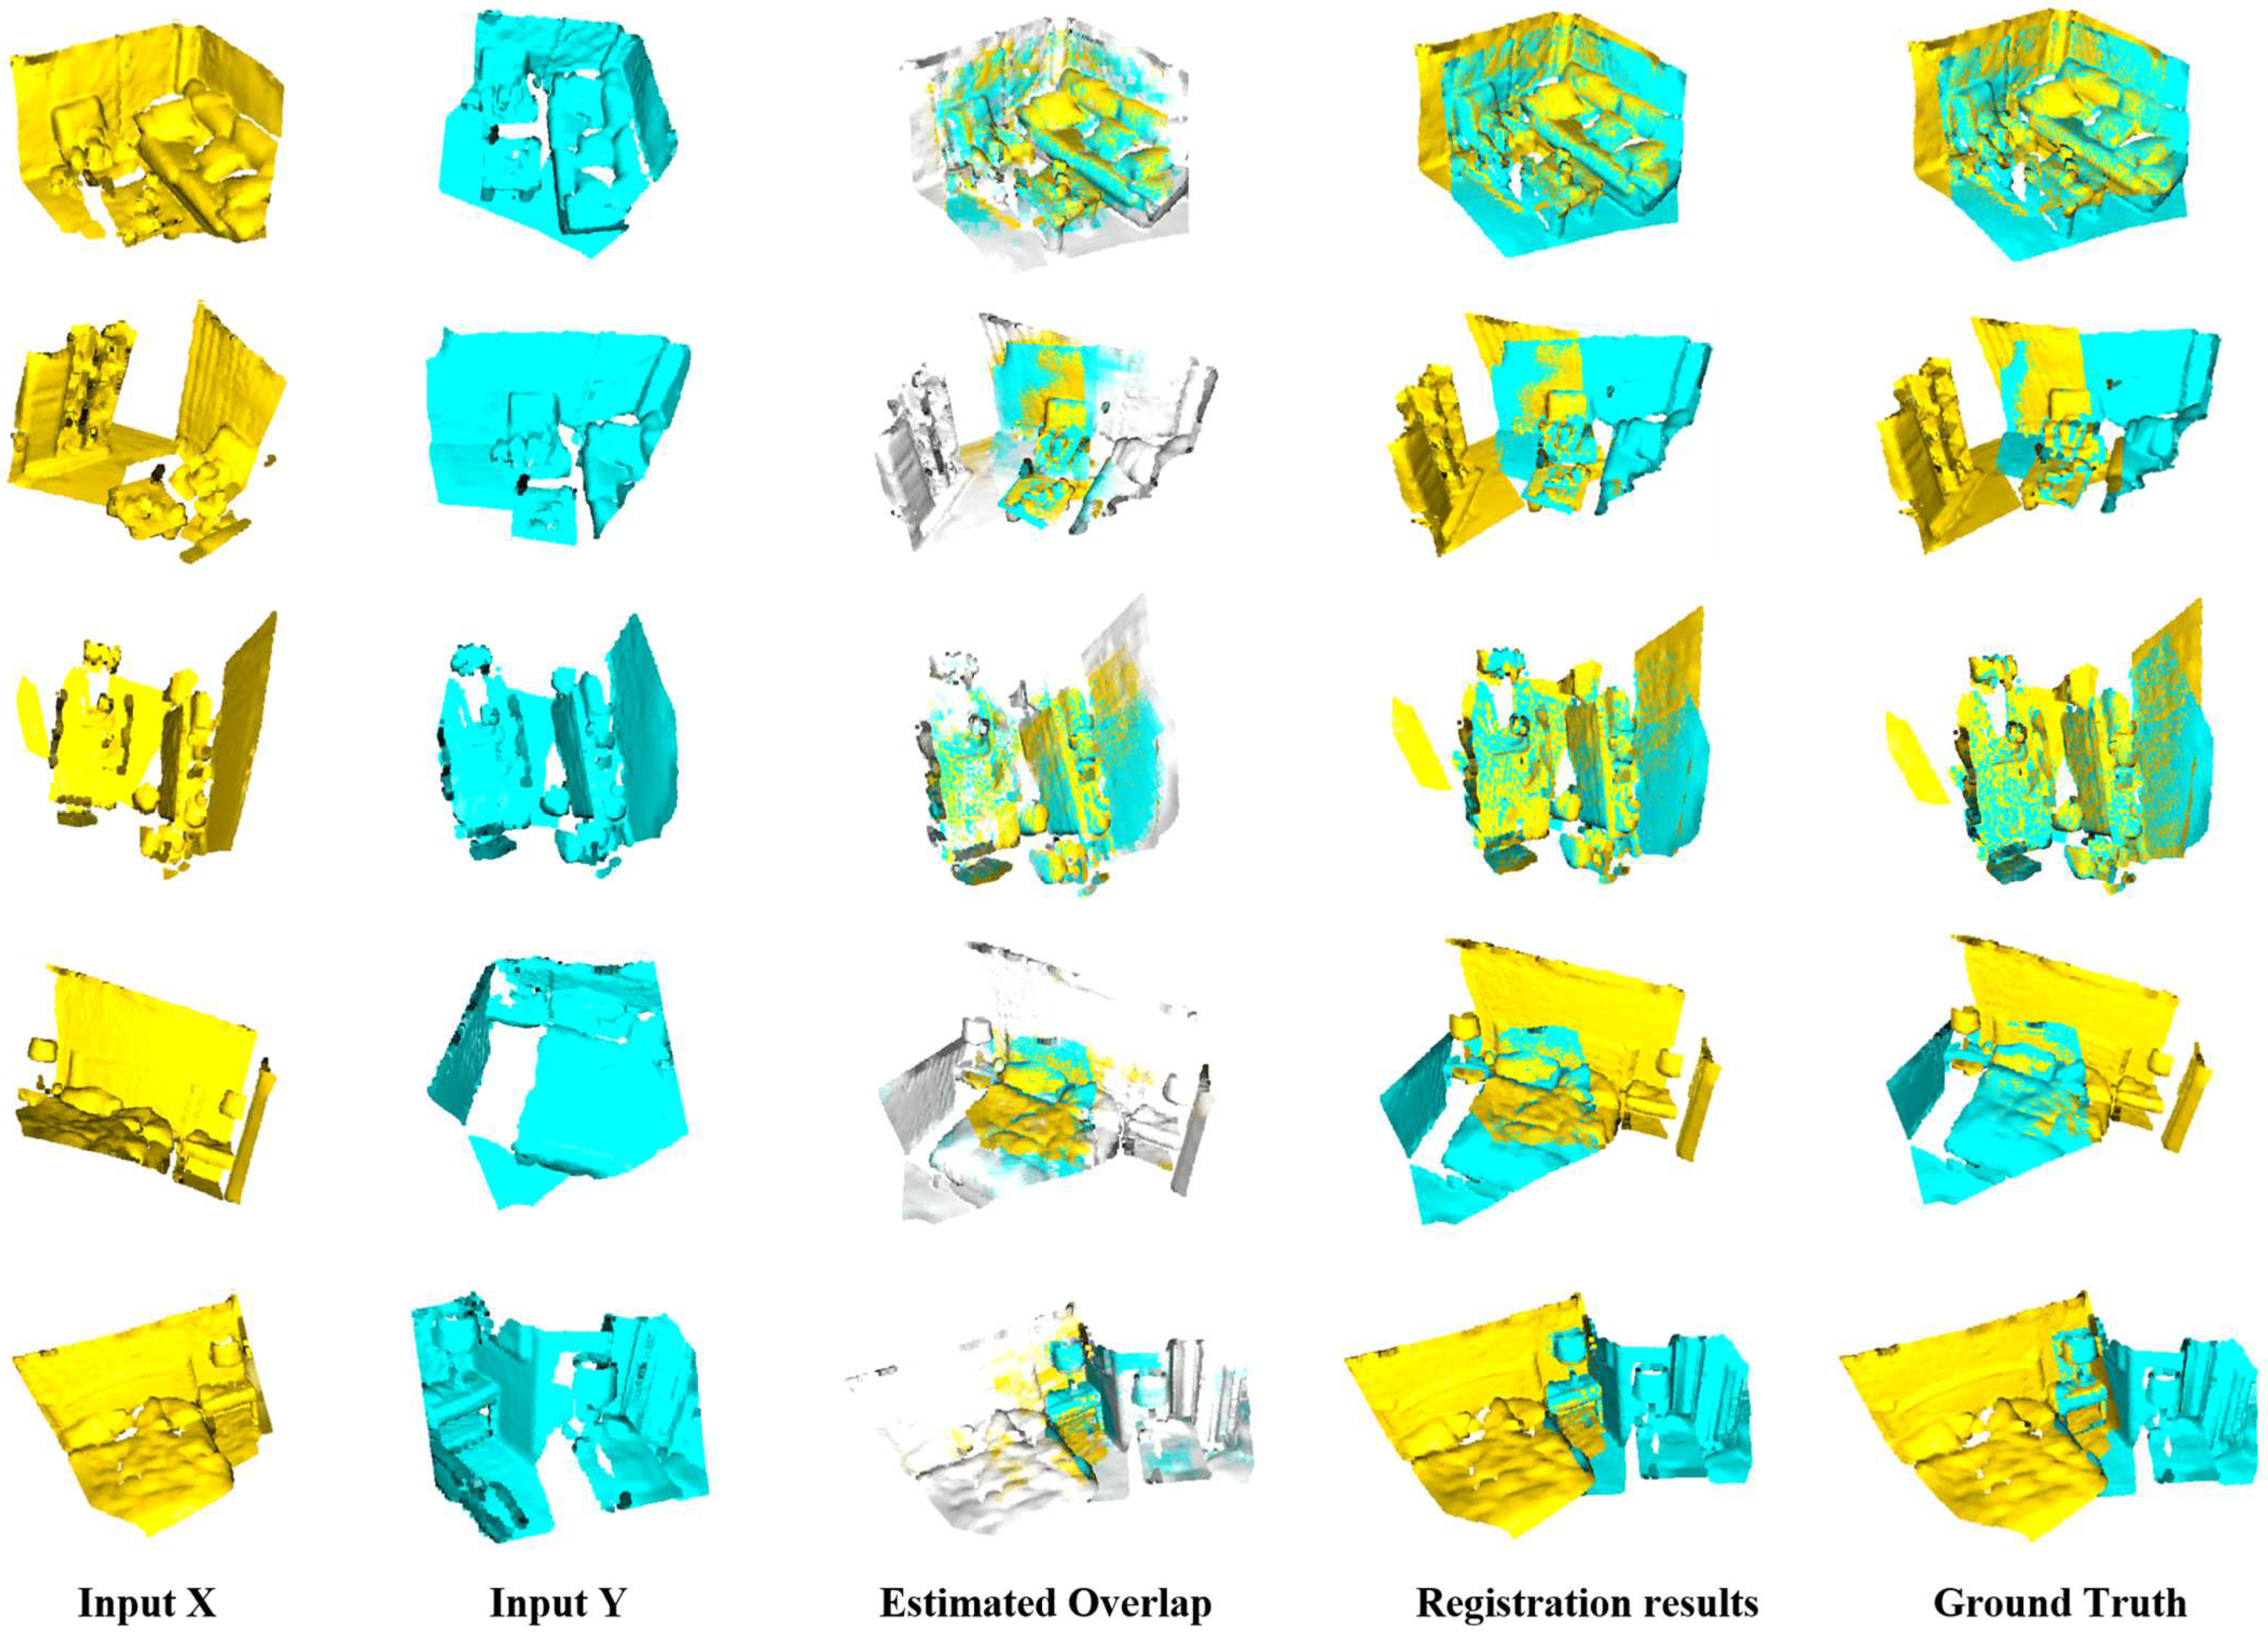
For FMR, although the performance of GCMTN is close to REGTR on 3DMatch, its performance on 3DLoMatch is significantly better than other methods, which verifies the effectiveness of the submodule designed in GCMTN for finding the corresponding in the case of low overlap. For IR, GCMTN is superior to other methods under different numbers of correspondences. For 3DLoMatch data in particular, this shows that GCMTN is capable of producing reliable correspondence in low-overlap scenes. This is related to the overlap prediction module. The coarse to fine registration strategy reduces the probability of false matching. In contrast, the performance of final registration is often of more concern and can be evaluated by the RR. The quantitative results in Table 4 show that GCMTN achieves the best performance compared with other methods on 3DLoMatch, which also indicates that GCMTN can handle low overlap registration tasks well. In order to show the reliability of the method more intuitively, Figure 7 shows some visualization results. The first three lines of input point cloud are from 3DMatch, and the last two lines are from 3DLoMatch. The first and second columns represent the input source and target point clouds, the third column denotes the overlap region estimated by GCMTN, the fourth column shows the registration result of GCMTN, and the last column denotes the ground truth. By comparing the registration results with the ground truth, it can be seen that GCMTN achieves excellent registration performance.
4.4. Experiments on OdometryKITTI
4.4.1. Dataset
OdometryKITTI [49] contains 11 lidar scanned sequences of outdoor driving scenes. The sequence 00–05 is used for training, the sequence 06–07 is used for validation, and the sequence 08–10 is used for testing. The provided ground truth pose is further refined using ICP, as suggested by [17,41], and is evaluated by only considering point cloud pairs that are up to 10m away from each other.
4.4.2. Registration Results
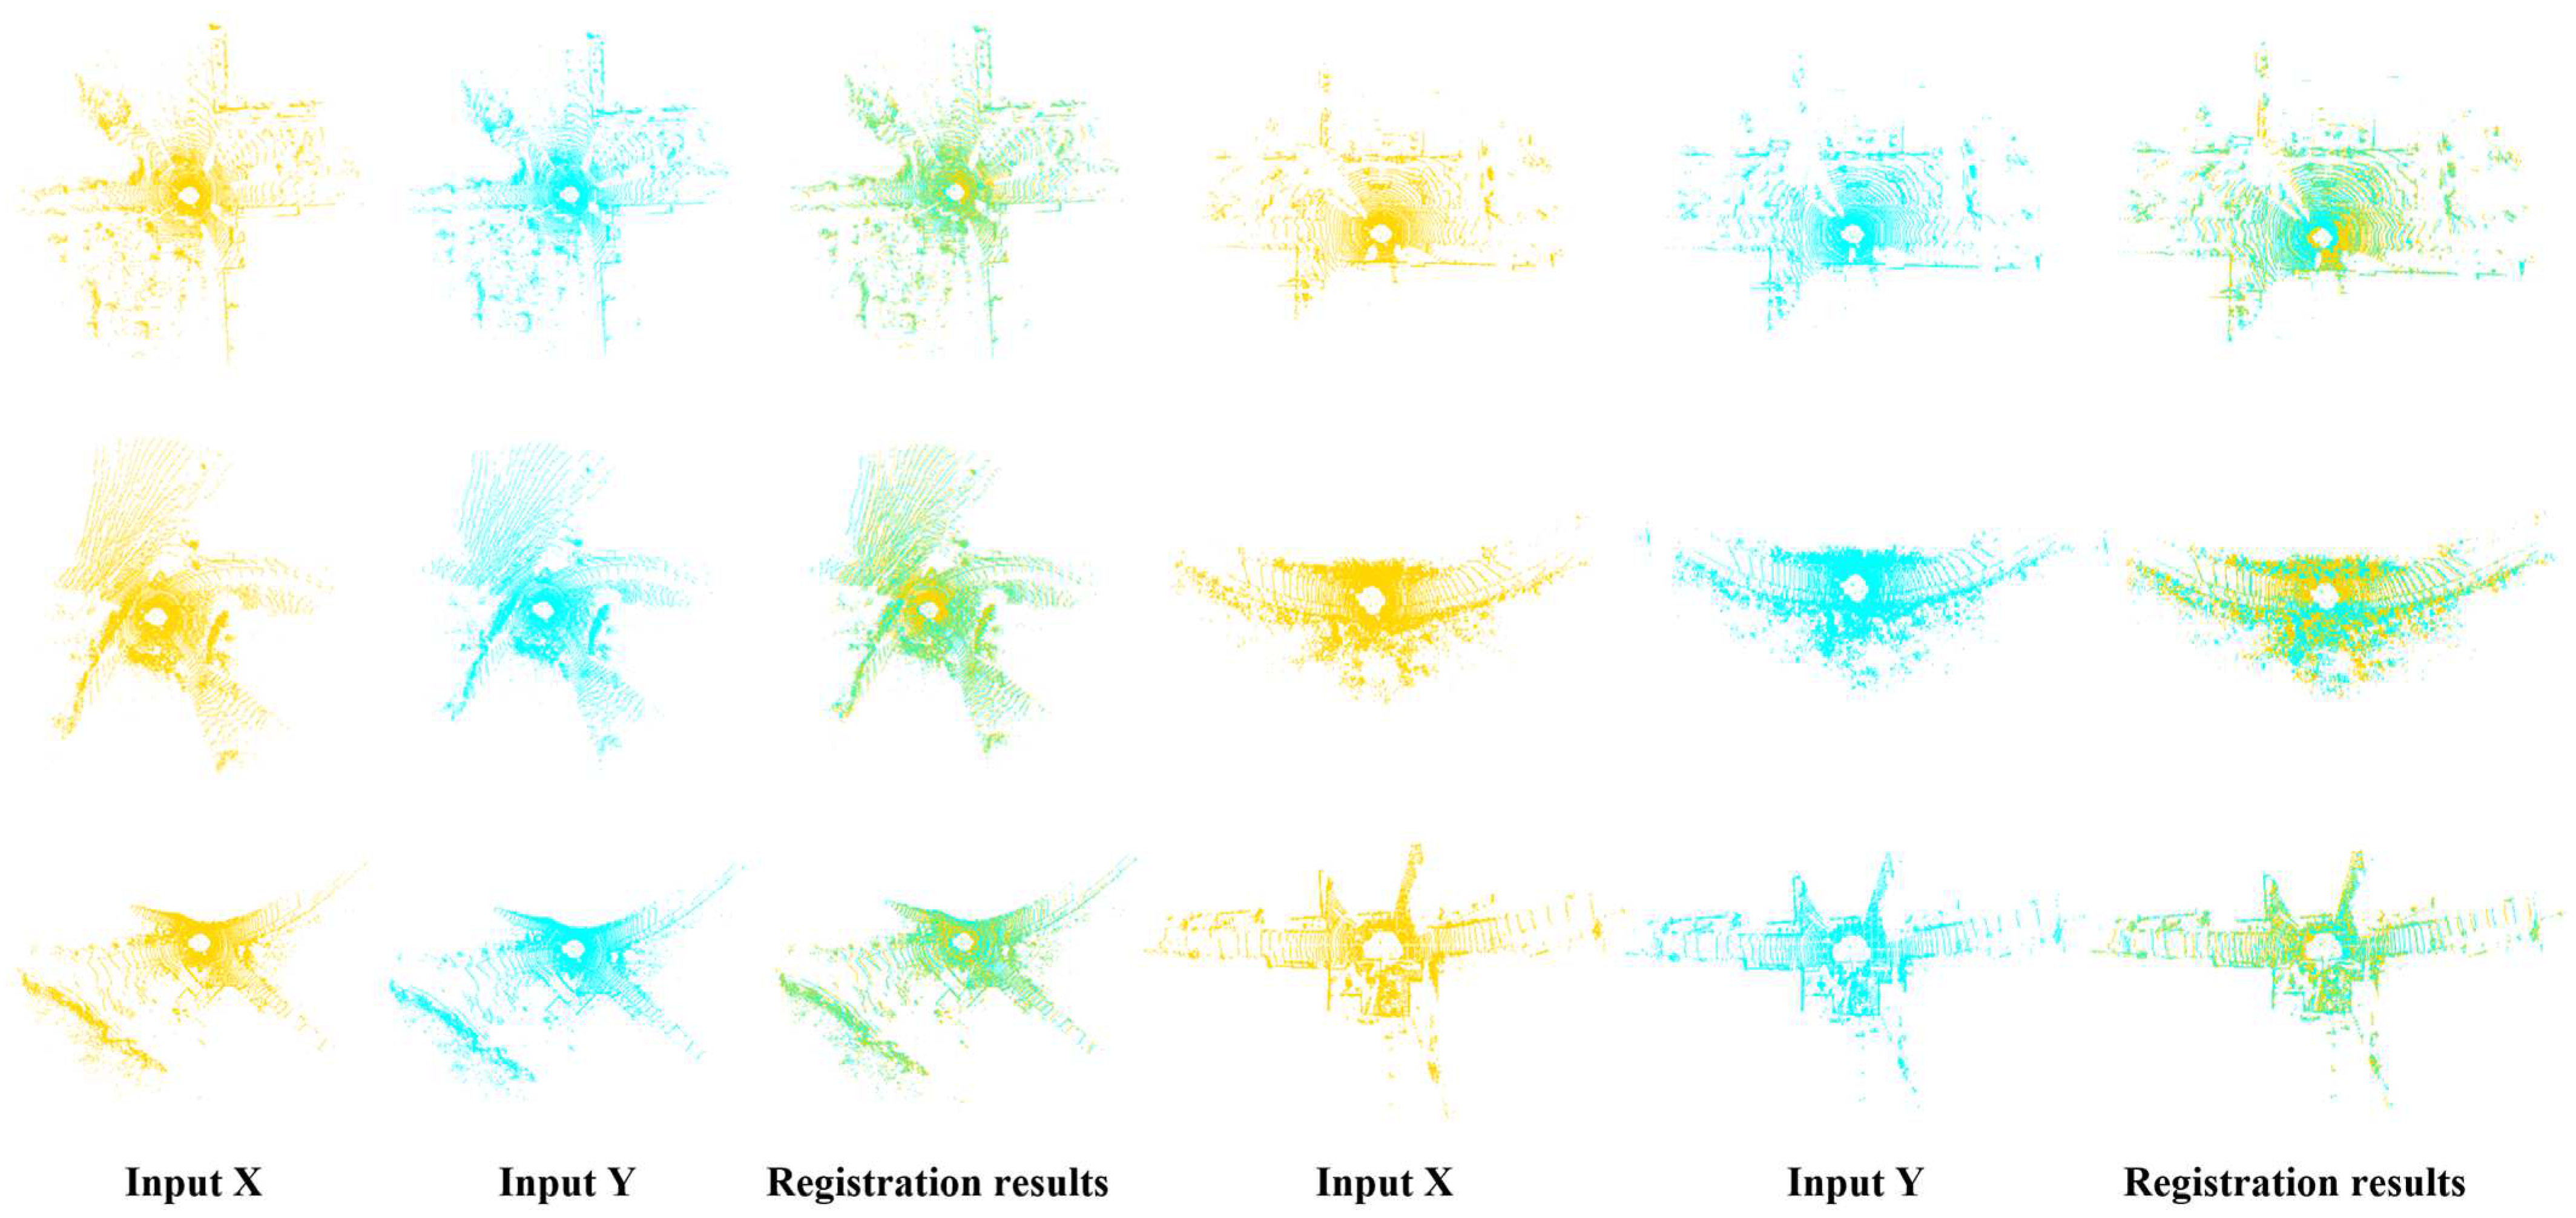
GCMTN is compared with 3DFeat-Net [53], FCGF [51], D3Feat [41], Predator[17] and GLORN [45], and evaluated on three metrics: RTE, RRE, and RR. The proportion of point cloud pairs where both RRE and RTE are below a certain threshold (RRE < 5◦, RTE < 2 m). Table 5 shows the quantitative results of GCMTN in three metrics. It can be seen that, compared with other methods, although GCMTN is inferior to GLORN in RTE index, its performance in RRE and RR is better than that of other comparison methods. Figure 8 shows the visualization result of registration on odometryKITTI, where the input point cloud comes from the sequence 08–10, the first and second columns represent the source and target point clouds, respectively, and the third column shows the registration result of GCMTN, which shows that GCMTN can well align and match the input point clouds. It can be proved that GCMTN has good applicability on large-scale outdoor scene datasets.
4.5. Ablation Study
Ablation studies were conducted on 3DMatch and 3DLoMatch to verify the effectiveness of the proposed submodules, and the results are shown in Table 6. There are three key submodules of GCMTN: Dense Graph Feature Aggregation (DGFA) module, Multilevel Interaction Transformer (MIT) module, and Overlap Prediction (OP) module. When all the submodules are unused, it means that GCMTN is compared to the baseline model [17], where the metrics are lowest, with RR of 89% and 59.8% on 3DMatch and 3DLoMatch, respectively. When only the DGFA module is used, the RR is 89.1% and 60.9%; when DGFA and MIT modules are used, the RR is 89.5% and 62.8%; and when DGFA and OP modules are used, the RR is 89.6% and 64.2%. When all modules are used, the RR is 89.6% and 64.2%, respectively, which is an increase of 2.2% and 5.8% compared to the baseline model. It can be seen that the proposed submodule has certain validity, and GCMTN performs well in the low-overlap point cloud registration task.
5. Discussion
From the above metrics and visualization results of a large number of experiments, GCMTN has great advantages in dealing with low-overlap point cloud registration problems. This part will mainly be discussed from the following aspects: the validity analysis of submodules, the performance and practicality analysis of GCMTN, the limitations of GCMTN, and the future improvement directions.
5.1. Validity Analysis of Submodules
There are three key submodules of GCMTN, namely DGFA, MIT, and OP. According to the results of ablation studies, the design of these three submodules has a positive impact on the performance of GCMTN. This is due to the fact that DGFA can effectively expand the receptive field of the point cloud, helping the network to distinguish objects with similar structures in the scene. MIT can refine features inside point clouds and promote feature interactions between point clouds to generate more resolution pointwise features, which will help to predict overlap region in the future. The overlap factor and matching factor proposed in OP are used to generate the overlap score and matching score, respectively, which are used to filter the adverse effects of outliers and generate reliable correspondence. The registration strategy from coarse to fine helps the network to predict the overlap region more accurately. When the three modules work together, the best registration performance can be achieved, which verifies the validity of the proposed submodules.
5.2. Performance and Practicality Analysis of GCMTN
The experiments were conducted on the synthetic dataset ModelNet, the indoor scene dataset 3DMatch, and the outdoor scene dataset odometryKITTI. According to the experimental results, GCMTN has achieved excellent performance on ModelNet and ModelLoNet with low overlap ratio. For 3DMatch and 3DLoMatch, GCMTN showed great improvement in FMR, IR, and RR compared with the baseline model. In addition, GCMTN also achieved excellent performance on odometryKITTI. At the same time, in order to visually demonstrate the practicability and feasibility of GCMTN, the registration results of the three datasets were visually displayed, respectively. It can be seen that GCMTN can not only handle the registration task of high overlap scenes, but also perform well in low-overlap scenes. Overall, GCMTN has value and potential for application in practical remote sensing tasks. Additionally, GCMTN helps reduce the number of scans performed by high-precision sensors in industrial settings, thereby lowering industrial costs and driving the development of social productivity and technological transformation.
5.3. Limitations of GCMTN and Future Improvement Directions
Several extensive experiments have shown that GCMTN has achieved high robustness and accuracy in low-overlap scene registration tasks, but there are some shortcomings. Firstly, due to the introduction of dense connection in DGFA modules, this feature learning approach brings a large amount of computation, which increases the complexity of the model. In the future, it can be improved by introducing dilated graph convolution.
Secondly, a rotational invariant convolution strategy can be introduced to improve the generalization ability of the model. In addition, although GCMTN shows better registration results in synthetic datasets ModelNet and ModelLoNet, indoor scene datasets 3DMatch and 3DLoMatch, and outdoor scene dataset odometryKITTI, these data come from open datasets. It is not possible to demonstrate its applicability to real data scanned by sensors in real industrial sites. Therefore, the potential of GCMTN to handle registration in real industrial scenes can be explored in the future.
6. Conclusions
In this paper, a point cloud registration network combining dense graph convolution and multilevel interaction Transformer (GCMTN) is proposed to realize point cloud registration tasks in low-overlap scenes. The proposed DGFA module in GCMTN expands the receptive field of point clouds and performs well when dealing with objects with similar geometric structures in the scene. In addition, the proposed MIT module uses Multihead Offset Attention and Multihead Cross Attention to refine features inside the point cloud and generate interactive features, which is directly related to the quality of subsequent registration. Finally, the proposed overlap prediction module can effectively remove the adverse effects of outliers and predict the overlap region. Multiple experiments on synthetic datasets ModelNet and ModelLoNet, indoor scene dataset 3DMatch and 3DLoMatch, and outdoor scene dataset odometryKITTI show that GCMTN can significantly improve the capability of feature extraction and perform well in low-overlap registration tasks. It has the value and potential to be applied to practical remote sensing tasks in the future. It is expected that GCMTN will be able to expand into a more diverse range of remote sensing-related application fields.
Author Contributions
Conceptualization, X.W.; methodology, X.W. and Y.Y.; software, X.W. and Y.Y.; validation, X.W. and Y.Y.; formal analysis, Y.Y.; investigation, Y.Y.; resources, X.W.; data curation, Y.Y.; writing—original draft preparation, X.W. and Y.Y.; writing—review and editing, X.W. and Y.Y.; visualization, X.W. and Y.Y.; supervision, X.W.; project administration, X.W.; funding acquisition, X.W. All authors have read and agreed to the published version of the manuscript.
Funding
This research was partially supported by the Natural Science Research Project of CQU (H20190254, H20200677).
Data Availability Statement
The processed data are available upon request to the corresponding author.
Acknowledgments
The authors would like to thank the anonymous reviewers for their valuable comments, suggestions, and enlightenment.
Conflicts of Interest
The authors declare no conflict of interest.
References
- Liang, Z.; Guo, Y.; Feng, Y.; Chen, W.; Qiao, L.; Zhou, L.; Zhang, J.; Liu, H. Stereo Matching Using Multi-Level Cost Volume and Multi-Scale Feature Constancy. IEEE Trans. Pattern Anal. Mach. Intell. 2021, 43, 300–315. [Google Scholar] [CrossRef] [PubMed]
- Dubé, R.; Gollub, M.G.; Sommer, H.; Gilitschenski, I.; Siegwart, R.; Cadena, C.; Nieto, J.I. Incremental-Segment-Based Localization in 3-D Point Clouds. IEEE Robot. Autom. Lett. 2018, 3, 1832–1839. [Google Scholar] [CrossRef]
- Chua, C.-S.; Jarvis, R. Point Signatures: A New Representation for 3D Object Recognition. Int. J. Comput. Vis. 1997, 25, 63–85. [Google Scholar] [CrossRef]
- Deschaud, J.-E. IMLS-SLAM: Scan-to-Model Matching Based on 3D Data. In Proceedings of the 2018 IEEE International Conference on Robotics and Automation, ICRA 2018, Brisbane, Australia, 21–25 May 2018; IEEE: New York, NY, USA, 2018; pp. 2480–2485. [Google Scholar]
- Han, L.; Xu, L.; Bobkov, D.; Steinbach, E.G.; Fang, L. Real-Time Global Registration for Globally Consistent RGB-D SLAM. IEEE Trans. Robot. 2019, 35, 498–508. [Google Scholar] [CrossRef]
- Besl, P.J.; McKay, N.D. A Method for Registration of 3-D Shapes. IEEE Trans. Pattern Anal. Mach. Intell. 1992, 14, 239–256. [Google Scholar] [CrossRef] [Green Version]
- Chetverikov, D.; Stepanov, D.; Krsek, P. Robust Euclidean alignment of 3D point sets: The trimmed iterative closest point algorithm. Image Vis. Comput. 2005, 23, 299–309. [Google Scholar] [CrossRef]
- Parkison, S.A.; Gan, L.; Jadidi, M.G.; Eustice, R.M. Semantic Iterative Closest Point through Expectation-Maximization. In Proceedings of the British Machine Vision Conference 2018, BMVC 2018, Newcastle, UK, 3–6 September 2018; BMVA Press: Durham, UK, 2018; p. 280. [Google Scholar]
- Biber, P.; Straßer, W. The normal distributions transform: A new approach to laser scan matching. In Proceedings of the 2003 IEEE/RSJ International Conference on Intelligent Robots and Systems, Las Vegas, NV, USA, 27 October–1 November 2003; IEEE: New York, NY, USA, 2003; pp. 2743–2748. [Google Scholar]
- Aiger, D.; Mitra, N.J.; Cohen-Or, D. 4-points congruent sets for robust pairwise surface registration. ACM Trans. Graph. 2008, 27, 85. [Google Scholar] [CrossRef] [Green Version]
- Rusu, R.B.; Blodow, N.; Beetz, M. Fast Point Feature Histograms (FPFH) for 3D registration. In Proceedings of the 2009 IEEE International Conference on Robotics and Automation, ICRA 2009,Kobe, Japan, 12–17 May 2009; IEEE: New York, NY, USA, 2009; pp. 3212–3217. [Google Scholar]
- Rusu, R.B.; Blodow, N.; Marton, Z.C.; Beetz, M. Aligning point cloud views using persistent feature histograms. In Proceedings of the 2008 IEEE/RSJ International Conference on Intelligent Robots and Systems, Acropolis Convention Center, Nice, France, 22–26 September 2008; IEEE: New York, NY, USA, 2008; pp. 3384–3391. [Google Scholar]
- Salti, S.; Tombari, F.; Stefano, L. Di SHOT: Unique signatures of histograms for surface and texture description. Comput. Vis. Image Underst. 2014, 125, 251–264. [Google Scholar] [CrossRef]
- Aoki, Y.; Goforth, H.; Srivatsan, R.A.; Lucey, S. PointNetLK: Robust&Efficient Point Cloud Registration Using PointNet. In Proceedings of the IEEE Conference on Computer Vision and Pattern Recognition, CVPR 2019, Long Beach, CA, USA, 16–20 June 2019; IEEE: New York, NY, USA, 2019; pp. 7163–7172. [Google Scholar]
- Qi, C.R.; Su, H.; Mo, K.; Guibas, L.J. PointNet: Deep Learning on Point Sets for 3D Classification and Segmentation. In Proceedings of the 2017 IEEE Conference on Computer Vision and Pattern Recognition, CVPR 2017, Honolulu, HI, USA, 21–26 July 2017; IEEE Computer Society: Washington, DC, USA, 2017; pp. 77–85. [Google Scholar]
- Lucas, B.D.; Kanade, T. An Iterative Image Registration Technique with an Application to Stereo Vision. In Proceedings of the 7th International Joint Conference on Artificial Intelligence, IJCAI’81, Vancouver, BC, Canada, 24–28 August; 1981; pp. 674–679. [Google Scholar]
- Huang, S.; Gojcic, Z.; Usvyatsov, M.; Wieser, A.; Schindler, K. Predator: Registration of 3D Point Clouds with Low Overlap. In Proceedings of the IEEE Conference on Computer Vision and Pattern Recognition, CVPR 2021, Virtual, 19–25 June 2021; IEEE: New York, NY, USA, 2021; pp. 4267–4276. [Google Scholar]
- Yew, Z.J.; Lee, G.H. REGTR: End-to-end Point Cloud Correspondences with Transformers. In Proceedings of the IEEE/CVF Conference on Computer Vision and Pattern Recognition, CVPR 2022, New Orleans, LA, USA, 18–24 June 2022; IEEE: New York, NY, USA, 2022; pp. 6667–6676. [Google Scholar]
- Qin, Z.; Yu, H.; Wang, C.; Guo, Y.; Peng, Y.; Xu, K. Geometric Transformer for Fast and Robust Point Cloud Registration. In Proceedings of the IEEE/CVF Conference on Computer Vision and Pattern Recognition, CVPR 2022, New Orleans, LA, USA, 18–24 June 2022; IEEE: New York, NY, USA, 2022; pp. 11133–11142. [Google Scholar]
- Zhao, H.; Zhuang, H.; Wang, C.; Yang, M. G3DOA: Generalizable 3D Descriptor with Overlap Attention for Point Cloud Registration. IEEE Robot. Autom. Lett. 2022, 7, 2541–2548. [Google Scholar] [CrossRef]
- Vaswani, A.; Shazeer, N.; Parmar, N.; Uszkoreit, J.; Jones, L.; Gomez, A.N.; Kaiser, L.; Polosukhin, I. Attention is All you Need. In Proceedings of the Advances in Neural Information Processing Systems 30: Annual Conference on Neural Information Processing Systems 2017, Long Beach, CA, USA, 4–9 December 2017; pp. 5998–6008. [Google Scholar]
- Jian, B.; Vemuri, B.C. Robust Point Set Registration Using Gaussian Mixture Models. IEEE Trans. Pattern Anal. Mach. Intell. 2011, 33, 1633–1645. [Google Scholar] [CrossRef] [PubMed]
- Eckart, B.; Kim, K.; Kautz, J. HGMR: Hierarchical Gaussian Mixtures for Adaptive 3D Registration. In Proceedings of the Computer Vision—ECCV 2018—15th European Conference, Munich, Germany, 8–14 September 2018; Ferrari, V., Hebert, M., Sminchisescu, C., Weiss, Y., Eds.; Proceedings, Part XV; Springer: Berlin/Heidelberg, Germany, 2018; Volume 11219, pp. 730–746. [Google Scholar]
- Yang, J.; Li, H.; Campbell, D.; Jia, Y. Go-ICP: A Globally Optimal Solution to 3D ICP Point-Set Registration. IEEE Trans. Pattern Anal. Mach. Intell. 2016, 38, 2241–2254. [Google Scholar] [CrossRef] [PubMed] [Green Version]
- Campbell, D.; Petersson, L. GOGMA: Globally-Optimal Gaussian Mixture Alignment. In Proceedings of the 2016 IEEE Conference on Computer Vision and Pattern Recognition, CVPR 2016, Las Vegas, NV, USA, 27–30 June 2016; IEEE Computer Society: Washington, DC, USA, 2016; pp. 5685–5694. [Google Scholar]
- Campbell, D.; Petersson, L.; Kneip, L.; Li, H.; Gould, S. The Alignment of the Spheres: Globally-Optimal Spherical Mixture Alignment for Camera Pose Estimation. In Proceedings of the IEEE Conference on Computer Vision and Pattern Recognition, CVPR 2019, Long Beach, CA, USA, 16–20 June 2019; IEEE: New York, NY, USA, 2019; pp. 11796–11806. [Google Scholar]
- Liu, Y.; Wang, C.; Song, Z.; Wang, M. Efficient Global Point Cloud Registration by Matching Rotation Invariant Features Through Translation Search. In Proceedings of the Computer Vision—ECCV 2018—15th European Conference, Munich, Germany, 8–14 September 2018; Ferrari, V., Hebert, M., Sminchisescu, C., Weiss, Y., Eds.; Proceedings, Part XII. Springer: Berlin/Heidelberg, Germany, 2018; Volume 11216, pp. 460–474. [Google Scholar]
- Zhou, Q.-Y.; Park, J.; Koltun, V. Fast Global Registration. In Proceedings of the Computer Vision—ECCV 2016—14th European Conference, Amsterdam, The Netherlands, 11–14 October 2016; Leibe, B., Matas, J., Sebe, N., Welling, M., Eds.; Proceedings, Part II; Springer: Berlin/Heidelberg, Germany, 2016; Volume 9906, pp. 766–782. [Google Scholar]
- Qi, C.R.; Yi, L.; Su, H.; Guibas, L.J. PointNet++: Deep Hierarchical Feature Learning on Point Sets in a Metric Space. In Proceedings of the Advances in Neural Information Processing Systems 30: Annual Conference on Neural Information Processing Systems 2017, Long Beach, CA, USA, 4–9 December 2017; pp. 5099–5108. [Google Scholar]
- Li, X.; Pontes, J.K.; Lucey, S. PointNetLK Revisited. In Proceedings of the IEEE Conference on Computer Vision and Pattern Recognition, CVPR 2021, Virtual, 19–25 June 2021; IEEE: New York, NY, USA, 2021; pp. 12763–12772. [Google Scholar]
- Yuan, W.; Eckart, B.; Kim, K.; Jampani, V.; Fox, D.; Kautz, J. DeepGMR: Learning Latent Gaussian Mixture Models for Registration. In Proceedings of the Computer Vision—ECCV 2020—16th European Conference, Glasgow, UK, 23–28 August 2020; Vedaldi, A., Bischof, H., Brox, T., Frahm, J.-M., Eds.; Proceedings, Part V; Springer: Berlin/Heidelberg, Germany, 2020; Volume 12350, pp. 733–750. [Google Scholar]
- Li, J.; Zhang, C.; Xu, Z.; Zhou, H.; Zhang, C. Iterative Distance-Aware Similarity Matrix Convolution with Mutual-Supervised Point Elimination for Efficient Point Cloud Registration. In Proceedings of the Computer Vision—ECCV 2020—16th European Conference, Glasgow, UK, 23–28 August 2020; Vedaldi, A., Bischof, H., Brox, T., Frahm, J.-M., Eds.; Proceedings, Part XXIV; Springer: Berlin/Heidelberg, Germany, 2020; Volume 12369, pp. 378–394. [Google Scholar]
- Kim, Y.; Choi, S.; Lee, H.; Kim, T.; Kim, C. RPM-Net: Robust Pixel-Level Matching Networks for Self-Supervised Video Object Segmentation. In Proceedings of the IEEE Winter Conference on Applications of Computer Vision, WACV 2020, Snowmass Village, CO, USA, 1–5 March 2020; IEEE: New York, NY, USA, 2020; pp. 2046–2054. [Google Scholar]
- Wang, Y.; Solomon, J. Deep Closest Point: Learning Representations for Point Cloud Registration. In Proceedings of the 2019 IEEE/CVF International Conference on Computer Vision, ICCV 2019, Seoul, Republic of Korea, 27 October–2 November 2019; IEEE: New York, NY, USA, 2019; pp. 3522–3531. [Google Scholar]
- Fu, K.; Liu, S.; Luo, X.; Wang, M. Robust Point Cloud Registration Framework Based on Deep Graph Matching. In Proceedings of the IEEE Conference on Computer Vision and Pattern Recognition, CVPR 2021, Virtual, 19–25 June 2021; IEEE: New York, NY, USA, 2021; pp. 8893–8902. [Google Scholar]
- Chen, G.; Wang, M.; Yue, Y.; Zhang, Q.; Yuan, L. Full Transformer Framework for Robust Point Cloud Registration with Deep Information Interaction. arXiv 2021, arXiv:2112.09385. [Google Scholar] [CrossRef] [PubMed]
- Wang, Y.; Sun, Y.; Liu, Z.; Sarma, S.E.; Bronstein, M.M.; Solomon, J.M. Dynamic Graph CNN for Learning on Point Clouds. ACM Trans. Graph. 2019, 38, 1–12. [Google Scholar] [CrossRef] [Green Version]
- Li, S.; Ye, Y.; Liu, J.; Guo, L. VPRNet: Virtual Points Registration Network for Partial-to-Partial Point Cloud Registration. Remote Sens. 2022, 14, 2559. [Google Scholar] [CrossRef]
- Fan, Z.; Ma, J.; Nie, T.; Wang, H.; Zhao, Y.; Sun, M.; Wen, J. COPRNet: Correspondence confidence and overlap score guided network for indoor partial point cloud registration. Int. J. Remote Sens. 2023, 44, 981–1000. [Google Scholar] [CrossRef]
- Yu, H.; Qin, Z.; Hou, J.; Saleh, M.; Li, D.; Busam, B.; Ilic, S. Rotation-invariant transformer for point cloud matching. In Proceedings of the 2023 IEEE Conference on Computer Vision and Pattern Recognition, Vancouver, BC, Canada, 18–22 June 2023; IEEE Computer Society: Washington, DC, USA, 2023; pp. 5384–5393. [Google Scholar]
- Bai, X.; Luo, Z.; Zhou, L.; Fu, H.; Quan, L.; Tai, C.-L. D3Feat: Joint Learning of Dense Detection and Description of 3D Local Features. In Proceedings of the 2020 IEEE/CVF Conference on Computer Vision and Pattern Recognition, CVPR 2020, Seattle, WA, USA, 13–19 June 2020; IEEE: New York, NY, USA, 2020; pp. 6358–6366. [Google Scholar]
- Thomas, H.; Qi, C.R.; Deschaud, J.-E.; Marcotegui, B.; Goulette, F.; Guibas, L.J. KPConv: Flexible and Deformable Convolution for Point Clouds. In Proceedings of the 2019 IEEE/CVF International Conference on Computer Vision, ICCV 2019, Seoul, Republic of Korea, 27 October–2 November 2019; IEEE: New York, NY, USA, 2019; pp. 6410–6419. [Google Scholar]
- Huang, G.; Liu, Z.; van der Maaten, L.; Weinberger, K.Q. Densely Connected Convolutional Networks. In Proceedings of the 2017 IEEE Conference on Computer Vision and Pattern Recognition, CVPR 2017, Honolulu, HI, USA, 21–26 July 2017; IEEE Computer Society: Washington, DC, USA, 2017; pp. 2261–2269. [Google Scholar]
- Guo, M.-H.; Cai, J.; Liu, Z.-N.; Mu, T.-J.; Martin, R.R.; Hu, S.-M. PCT: Point cloud transformer. Comput. Vis. Media 2021, 7, 187–199. [Google Scholar] [CrossRef]
- Xu, J.; Huang, Y.; Wan, Z.; Wei, J. GLORN: Strong Generalization Fully Convolutional Network for Low-Overlap Point Cloud Registration. IEEE Trans. Geosci. Remote Sens. 2022, 60, 1–14. [Google Scholar] [CrossRef]
- Sun, Y.; Cheng, C.; Zhang, Y.; Zhang, C.; Zheng, L.; Wang, Z.; Wei, Y. Circle Loss: A Unified Perspective of Pair Similarity Optimization. In Proceedings of the 2020 IEEE/CVF Conference on Computer Vision and Pattern Recognition, CVPR 2020, Seattle, WA, USA, 13–19 June 2020; IEEE: New York, NY, USA, 2020; pp. 6397–6406. [Google Scholar]
- Wu, Z.; Song, S.; Khosla, A.; Yu, F.; Zhang, L.; Tang, X.; Xiao, J. 3D ShapeNets: A deep representation for volumetric shapes. In Proceedings of the IEEE Conference on Computer Vision and Pattern Recognition, CVPR 2015, Boston, MA, USA, 7–12 June 2015; IEEE Computer Society: Washington, DC, USA, 2015; pp. 1912–1920. [Google Scholar]
- Zeng, A.; Song, S.; Nießner, M.; Fisher, M.; Xiao, J.; Funkhouser, T.A. 3DMatch: Learning Local Geometric Descriptors from RGB-D Reconstructions. In Proceedings of the 2017 IEEE Conference on Computer Vision and Pattern Recognition, CVPR 2017, Honolulu, HI, USA, 21–26 July 2017; IEEE Computer Society: Washington, DC, USA, 2017; pp. 199–208. [Google Scholar]
- Geiger, A.; Lenz, P.; Urtasun, R. Are we ready for autonomous driving? The KITTI vision benchmark suite. In Proceedings of the 2012 IEEE Conference on Computer Vision and Pattern Recognition, Providence, RI, USA, 16–21 June 2012; IEEE Computer Society: Washington, DC, USA, 2012; pp. 3354–3361. [Google Scholar]
- Gojcic, Z.; Zhou, C.; Wegner, J.D.; Wieser, A. The Perfect Match: 3D Point Cloud Matching with Smoothed Densities. In Proceedings of the IEEE Conference on Computer Vision and Pattern Recognition, CVPR 2019, Long Beach, CA, USA, 16–20 June 2019; IEEE: New York, NY, USA, 2019; pp. 5545–5554. [Google Scholar]
- Choy, C.B.; Park, J.; Koltun, V. Fully Convolutional Geometric Features. In Proceedings of the 2019 IEEE/CVF International Conference on Computer Vision, ICCV 2019, Seoul, Republic of Korea, 27 October–2 November 2019; IEEE: New York, NY, USA, 2019; pp. 8957–8965. [Google Scholar]
- Ao, S.; Hu, Q.; Yang, B.; Markham, A.; Guo, Y. SpinNet: Learning a General Surface Descriptor for 3D Point Cloud Registration. In Proceedings of the IEEE Conference on Computer Vision and Pattern Recognition, CVPR 2021, Virtual, 19–25 June 2021; IEEE: New York, NY, USA, 2021; pp. 11753–11762. [Google Scholar]
- Yew, Z.J.; Lee, G.H. 3DFeat-Net: Weakly Supervised Local 3D Features for Point Cloud Registration. In Proceedings of the Computer Vision—ECCV 2018—15th European Conference, Munich, Germany, 8–14 September 2018; Ferrari, V., Hebert, M., Sminchisescu, C., Weiss, Y., Eds.; Proceedings, Part XV; Springer: Berlin/Heidelberg, Germany, 2018; Volume 11219, pp. 630–646. [Google Scholar]
Figure 1.
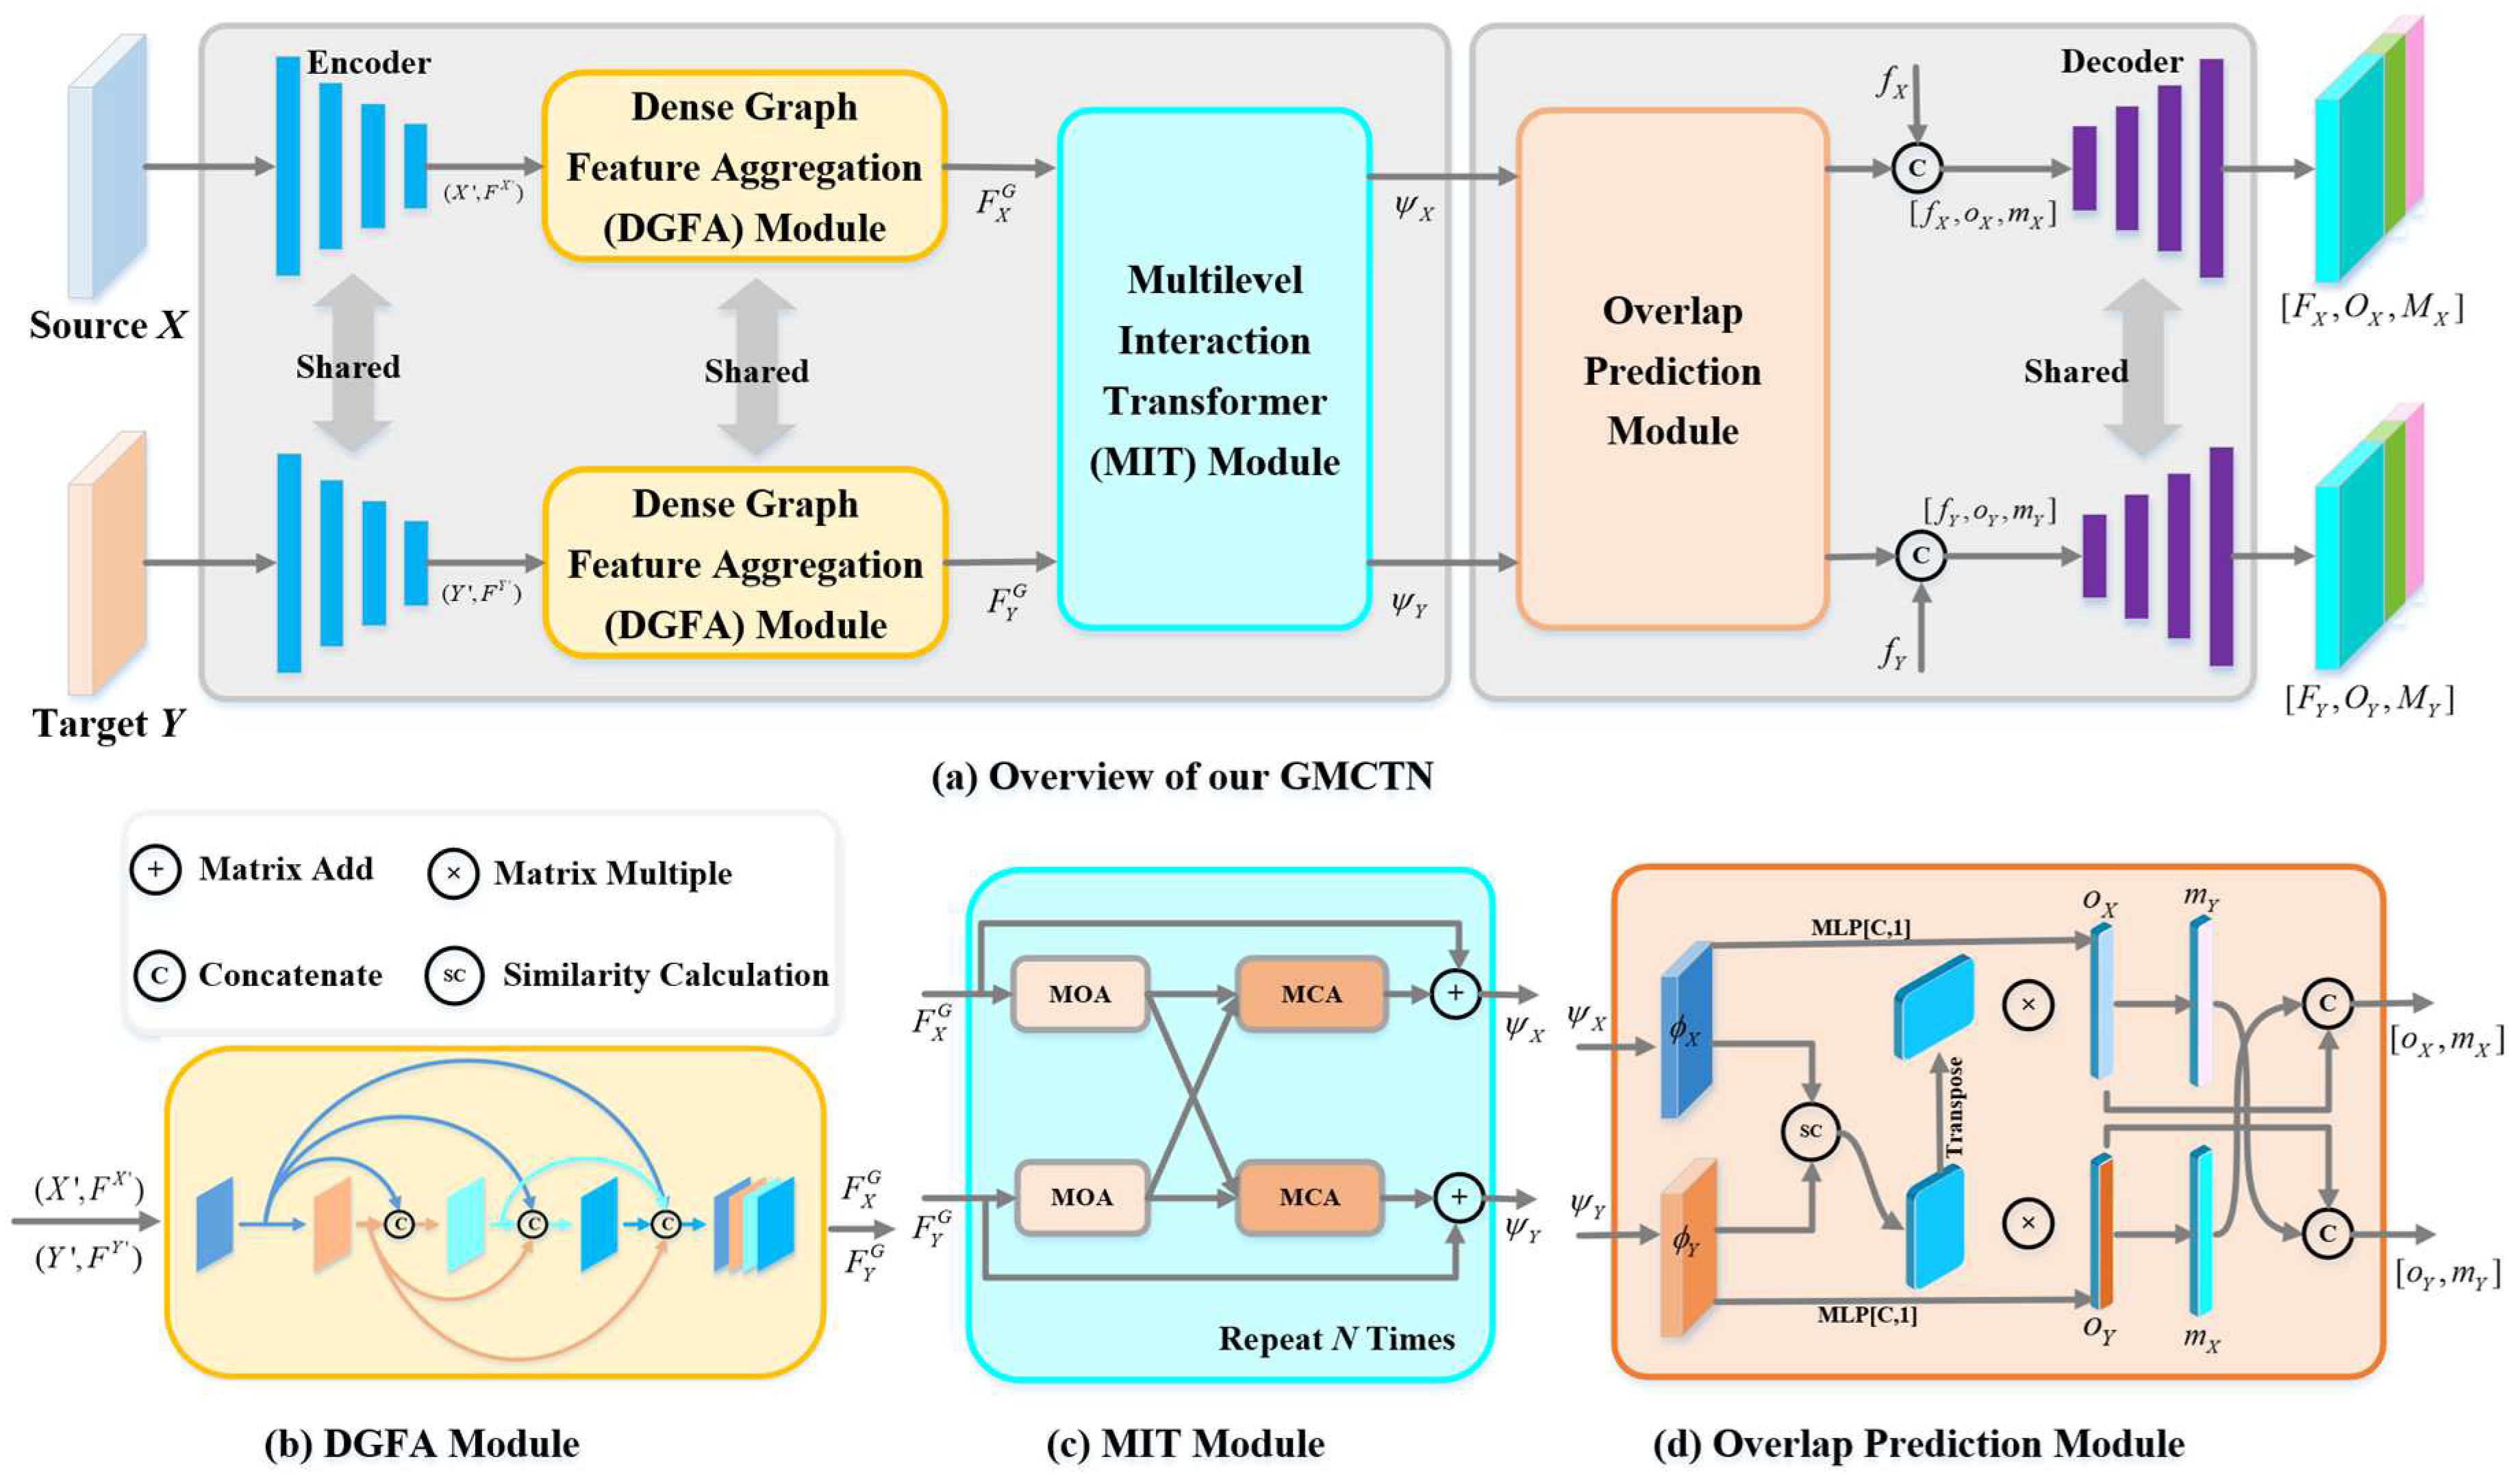
(a) GCMTN network architecture. GCMTN uses KPConv convolutional backbone to encode the input point cloud into a set of superpoints and their features, which are then fed into three key modules, namely: (b) Dense Graph Feature Aggregation (DGFA) Module, (c) Multilevel Interaction Transformer (MIT) Module, and (d) Overlap Prediction Module. The output of the overlap prediction module is concatenated with the pointwise features for decoding. MOA: Multihead Offset Attention. MCA: Multihead Cross Attention.
Figure 1.
(a) GCMTN network architecture. GCMTN uses KPConv convolutional backbone to encode the input point cloud into a set of superpoints and their features, which are then fed into three key modules, namely: (b) Dense Graph Feature Aggregation (DGFA) Module, (c) Multilevel Interaction Transformer (MIT) Module, and (d) Overlap Prediction Module. The output of the overlap prediction module is concatenated with the pointwise features for decoding. MOA: Multihead Offset Attention. MCA: Multihead Cross Attention.

Figure 2.
Structure and connection of encoder and decoder. Based on the KPConv backbone, the encoder uses a series of ResNet-like residual blocks and strided convolutions to transform the source point cloud into sparse point clouds (superpoints) with associated features. The input of the decoder contains pointwise features of the superpoints, overlap factor, and matching factor. Based on skip link concatenations and performing multiple stages of nearest neighbor upsampling and MLP operations propagate the superpoint feature descriptors back to the original point cloud.

Figure 3.
A simple diagram to illustrate the effect of the size of receptive field on matching. When the receptive field is small, it is easy to regard objects with similar structures as the same object, resulting in false matching. If the receptive field of point cloud is expanded, it will be conducive to the generation of correct matching relationship.

Figure 4.
Structure of Offset Attention (OA) and Cross Attention (CA) layer. OA is used inside the point cloud for feature refinement to extract features between point pairs, and CA is used for the interaction of information between the source and target point clouds.
Figure 4.
Structure of Offset Attention (OA) and Cross Attention (CA) layer. OA is used inside the point cloud for feature refinement to extract features between point pairs, and CA is used for the interaction of information between the source and target point clouds.

Figure 5.
Visualization of registration results on ModelNet with low overlap. The first and second columns represent the input source and target point clouds, the third column denotes the predicted overlap region, the fourth column denotes the registration result, and the fifth column denotes the ground truth.

Figure 6.
Comparison of RRE and RTE of GCMTN and Predator in ModelNet with different overlap ratio.

Figure 7.
Visualization of registration results on 3DMatch and 3DLoMatch; the first and second columns represent the input source point cloud and target point cloud, the third column denotes the predicted overlap region, the fourth column denotes the registration result, and the fifth column denotes the ground truth. The first three lines represent 3DMatch registration results with high overlap, and the last two lines represent 3DLoMatch registration results with low overlap.

Figure 8.
Visualization of registration results on odometryKITTI; the first and second columns represent the input source point cloud and target point cloud, and the third column denotes the registration results.
Figure 8.
Visualization of registration results on odometryKITTI; the first and second columns represent the input source point cloud and target point cloud, and the third column denotes the registration results.


Table 1.
Datasets used in the experiments and their partitioning settings.
| Datasets | Dataset Partition | ||
|---|---|---|---|
| Training Set | Validation Set | Testing Set | |
| ModelNet and ModelLoNet | 5112 samples | 1202 samples | 1266 samples |
| 3DMatch and 3DLoMatch | 46 scenes | 8 scenes | 8 scenes |
| OdometryKITTI | sequence 00–05 | sequence 06–07 | sequence 08–10 |
Table 2.
Experiments parameters for the proposed method.
| Datasets | DGFA L | MIT N | Loss Function | |||||||
|---|---|---|---|---|---|---|---|---|---|---|
| ModelNet | 3 | 3 | 384 | 64 | 0.1 | 1.4 | 0.018 | 0.06 | 0.04 | 0.04 |
| 3DMatch | 3 | 3 | 256 | 24 | 0.1 | 1.4 | 0.036 | 0.13 | 0.036 | 0.04 |
| odometryKITTI | 3 | 3 | 512 | 48 | 0.1 | 1.4 | 0.21 | 0.72 | 0.43 | 0.28 |
Table 3.
Evaluation results on ModelNet and ModelLoNet.
| Methods | ModelNet | ModelLoNet | ||||
|---|---|---|---|---|---|---|
| RRE | RTE | CD | RRE | RTE | CD | |
| DCP-v2 [34] | 11.975 | 0.171 | 0.0117 | 16.501 | 0.300 | 0.0268 |
| RPM-Net [33] | 1.712 | 0.018 | 0.00085 | 7.342 | 0.124 | 0.0050 |
| Predator [17] | 1.739 | 0.019 | 0.00089 | 5.235 | 0.132 | 0.0083 |
| REGTR [18] | 1.473 | 0.014 | 0.00078 | 3.930 | 0.087 | 0.0037 |
| GCMTN (ours) | 1.532 | 0.013 | 0.00075 | 4.531 | 0.085 | 0.0056 |
Table 4.
Evaluation results on 3DMatch and 3DLoMatch.
| #Samples | 3DMatch | 3DLoMatch | ||||||||
|---|---|---|---|---|---|---|---|---|---|---|
| 5000 | 2500 | 1000 | 500 | 250 | 5000 | 2500 | 1000 | 500 | 250 | |
| Feature Matching Recall (%) ↑ | ||||||||||
| PerfectMatch [50] | 95.0 | 94.3 | 92.9 | 90.1 | 82.9 | 63.6 | 61.7 | 53.6 | 45.2 | 34.2 |
| FCGF [46] | 97.4 | 97.3 | 97.0 | 96.7 | 96.6 | 76.6 | 75.4 | 74.2 | 71.7 | 67.3 |
| D3Feat [41] | 95.6 | 95.4 | 94.5 | 94.1 | 93.1 | 67.3 | 66.7 | 67.0 | 66.7 | 66.5 |
| SpinNet [52] | 97.6 | 97.2 | 96.8 | 95.5 | 94.3 | 75.3 | 74.9 | 72.5 | 70.0 | 63.6 |
| Predator [17] | 96.6 | 96.6 | 96.5 | 96.3 | 96.5 | 78.6 | 77.4 | 76.3 | 75.7 | 75.3 |
| REGTR [18] | 97.8 | 97.4 | 96.9 | 96.1 | 95.6 | 74.3 | 74.4 | 74.2 | 73.8 | 72.9 |
| GCMTN (ours) | 97.2 | 97.3 | 97.0 | 96.8 | 96.6 | 79.9 | 79.4 | 78.6 | 78.5 | 77.9 |
| Inlier Ratio (%) ↑ | ||||||||||
| PerfectMatch [50] | 36.0 | 32.5 | 26.4 | 21.5 | 16.4 | 11.4 | 10.1 | 8.0 | 6.4 | 4.8 |
| FCGF [46] | 56.8 | 54.1 | 48.7 | 42.5 | 34.1 | 21.4 | 20.0 | 17.2 | 14.8 | 11.6 |
| D3Feat [41] | 39.0 | 38.8 | 40.4 | 41.5 | 41.8 | 13.2 | 13.1 | 14.0 | 14.6 | 15.0 |
| SpinNet [52] | 47.5 | 44.7 | 39.4 | 33.9 | 27.6 | 20.5 | 19.0 | 16.3 | 13.8 | 11.1 |
| Predator [17] | 58.0 | 58.4 | 57.1 | 54.1 | 49.3 | 26.7 | 28.1 | 28.3 | 27.5 | 25.8 |
| REGTR [18] | 57.3 | 55.2 | 53.8 | 52.7 | 51.1 | 27.6 | 27.3 | 27.1 | 26.6 | 25.4 |
| GCMTN (ours) | 63.0 | 64.1 | 61.8 | 60.1 | 58.2 | 36.8 | 37.4 | 36.6 | 36.2 | 35.7 |
| Registration Recall (%) ↑ | ||||||||||
| PerfectMatch [50] | 78.4 | 76.2 | 71.4 | 67.6 | 50.8 | 33.0 | 29.0 | 23.3 | 17.0 | 11.0 |
| FCGF [46] | 85.1 | 84.7 | 83.3 | 81.6 | 71.4 | 40.1 | 41.7 | 38.2 | 35.4 | 26.8 |
| D3Feat [41] | 81.6 | 84.5 | 83.4 | 82.4 | 77.9 | 37.2 | 42.7 | 46.9 | 43.8 | 39.1 |
| SpinNet [52] | 88.6 | 86.6 | 85.5 | 83.5 | 70.2 | 59.8 | 54.9 | 48.3 | 39.8 | 26.8 |
| Predator [17] | 89.0 | 89.9 | 90.6 | 88.5 | 86.6 | 59.8 | 61.2 | 62.4 | 60.8 | 58.1 |
| REGTR [18] | 92.0 | 91.2 | 89.7 | 90.6 | 90.4 | 64.8 | 64.4 | 64.2 | 62.3 | 59.7 |
| GCMTN (ours) | 91.2 | 91.6 | 91.0 | 90.6 | 90.0 | 65.6 | 65.9 | 66.0 | 65.1 | 63.2 |
Table 5.
Evaluation results on odometryKITTI.
| Method | RTE [cm] ↓ | RRE [◦] ↓ | RR ↑ |
|---|---|---|---|
| 3DFeat-Net [53] | 25.9 | 0.57 | 96.0 |
| FCGF [51] | 9.5 | 0.30 | 96.6 |
| D3Feat [41] | 7.2 | 0.30 | 99.8 |
| Predator [17] | 6.8 | 0.27 | 99.8 |
| GLORN [45] | 6.2 | 0.27 | 99.8 |
| GCMTN (ours) | 6.7 | 0.25 | 99.8 |
Table 6.
Validity verification of key submodules.
| Key Module | 3DMatch | 3DLoMatch | ||||||
|---|---|---|---|---|---|---|---|---|
| DGFA | MIT | OP | FMR (%) | IR (%) | RR (%) | FMR (%) | IR (%) | RR (%) |
| × | × | × | 96.7 | 58.0 | 89.0 | 78.6 | 26.7 | 59.8 |
| √ | × | × | 96.6 | 59.9 | 89.5 | 78.7 | 30.8 | 60.9 |
| √ | √ | × | 96.8 | 61.4 | 90.3 | 79.2 | 33.6 | 62.8 |
| √ | × | √ | 97.0 | 62.1 | 90.7 | 79.5 | 34.9 | 64.2 |
| √ | √ | √ | 97.2 | 63.0 | 91.2 | 79.9 | 36.8 | 65.6 |
Disclaimer/Publisher’s Note: The statements, opinions and data contained in all publications are solely those of the individual author(s) and contributor(s) and not of MDPI and/or the editor(s). MDPI and/or the editor(s) disclaim responsibility for any injury to people or property resulting from any ideas, methods, instructions or products referred to in the content. |
© 2023 by the authors. Licensee MDPI, Basel, Switzerland. This article is an open access article distributed under the terms and conditions of the Creative Commons Attribution (CC BY) license (https://creativecommons.org/licenses/by/4.0/).
Share and Cite
MDPI and ACS Style
Wang, X.; Yuan, Y. GCMTN: Low-Overlap Point Cloud Registration Network Combining Dense Graph Convolution and Multilevel Interactive Transformer. Remote Sens. 2023, 15, 3908. https://doi.org/10.3390/rs15153908
AMA Style
Wang X, Yuan Y. GCMTN: Low-Overlap Point Cloud Registration Network Combining Dense Graph Convolution and Multilevel Interactive Transformer. Remote Sensing. 2023; 15(15):3908. https://doi.org/10.3390/rs15153908
Chicago/Turabian StyleWang, Xuchu, and Yue Yuan. 2023. "GCMTN: Low-Overlap Point Cloud Registration Network Combining Dense Graph Convolution and Multilevel Interactive Transformer" Remote Sensing 15, no. 15: 3908. https://doi.org/10.3390/rs15153908
Note that from the first issue of 2016, this journal uses article numbers instead of page numbers. See further details here.