
TPH-YOLOv5-Air: Airport Confusing Object Detection via Adaptively Spatial Feature Fusion


1
Department of Electrics and Information Engineering, Beihang University, Beijing 100191, China
2
UAV Industry Academy, Chengdu Aeronautic Polytechnic, Chengdu 610100, China
3
Qingdao Research Institute of Beihang University, Qingdao 266000, China
*
Author to whom correspondence should be addressed.
Remote Sens. 2023, 15(15), 3883; https://doi.org/10.3390/rs15153883
Submission received: 16 July 2023
/
Revised: 2 August 2023
/
Accepted: 3 August 2023
/
Published: 5 August 2023
(This article belongs to the Special Issue Advanced Artificial Intelligence for Remote Sensing: Methodology and Applications)
Abstract
:Airport detection in remote sensing scenes is a crucial area of research, playing a key role in aircraft blind landing procedures. However, airport detection in remote sensing scenes still faces challenges such as class confusion, poor detection performance on multi-scale objects, and limited dataset availability. To address these issues, this paper proposes a novel airport detection network (TPH-YOLOv5-Air) based on adaptive spatial feature fusion (ASFF). Firstly, we construct an Airport Confusing Object Dataset (ACD) specifically tailored for remote sensing scenarios containing 9501 instances of airport confusion objects. Secondly, building upon the foundation of TPH-YOLOv5++, we adopt the ASFF structure, which not only enhances the feature extraction efficiency but also enriches feature representation. Moreover, an adaptive spatial feature fusion (ASFF) strategy based on adaptive parameter adjustment module (APAM) is proposed, which improves the feature scale invariance and enhances the detection of airports. Finally, experimental results based on the ACD dataset demonstrate that TPH-YOLOv5-Air achieves a mean average precision (mAP) of 49.4%, outperforming TPH-YOLOv5++ by 2% and the original YOLOv5 network by 3.6%. This study contributes to the advancement of airport detection in remote sensing scenes and demonstrates the practical application potential of TPH-YOLOv5-Air in this domain. Visualization and analysis further validate the effectiveness and interpretability of TPH-YOLOv5-Air. The ACD dataset is publicly available.
1. Introduction
Typical object detection in remote sensing scene imagery is a research hotspot in the field of image processing [1,2,3]. Airports, as high-value infrastructure, play a crucial role in both military and civilian domains, encompassing aircraft takeoff and landing, communication, transportation, and energy supply, among others. The development of remote sensing technology and the increasing availability of high-spatial-resolution remote sensing scene imagery have elevated global airport detection to new level, enabling the precise identification and localization of airports through remote sensing scene imagery [3]. Performing rapid and accurate intelligent detection of airports from remote sensing scene imagery is an effective measure for reducing accident rates during the landing phase of civil aviation aircraft and a necessary component for unmanned aerial vehicles (UAVs) to accomplish autonomous landing and other critical tasks [4]. In addition, during times of war or in the aftermath of a disaster event such as a natural disaster or man-made accident, when certain navigation and communication equipment become unavailable, civil aircraft or UAVs may need to conduct blind landings by relying on onboard equipment to search for suitable airports or areas for emergency landings in unknown territories. Therefore, the automatic detection of airport objects based on remote sensing scene images holds significant application value for improving flight safety and enabling the realization of autonomous landing capabilities for unmanned aircraft.
However, airport detection also faces challenges. These include the varying shapes of airport targets and their susceptibility to interference from ground objects like urban roads and bridges [5]. Furthermore, the airport area exhibits varied sizes and diverse textural characteristics, along with a heterogeneous background environment. Moreover, due to platform constraints, remote sensing scene images may exhibit multi-scale, unpredictable weather conditions, changes in viewing angles, variations in altitude, and similar interference phenomena. Consequently, achieving airport detection quickly and accurately based on aerial and remote sensing images is an exceptionally challenging task.
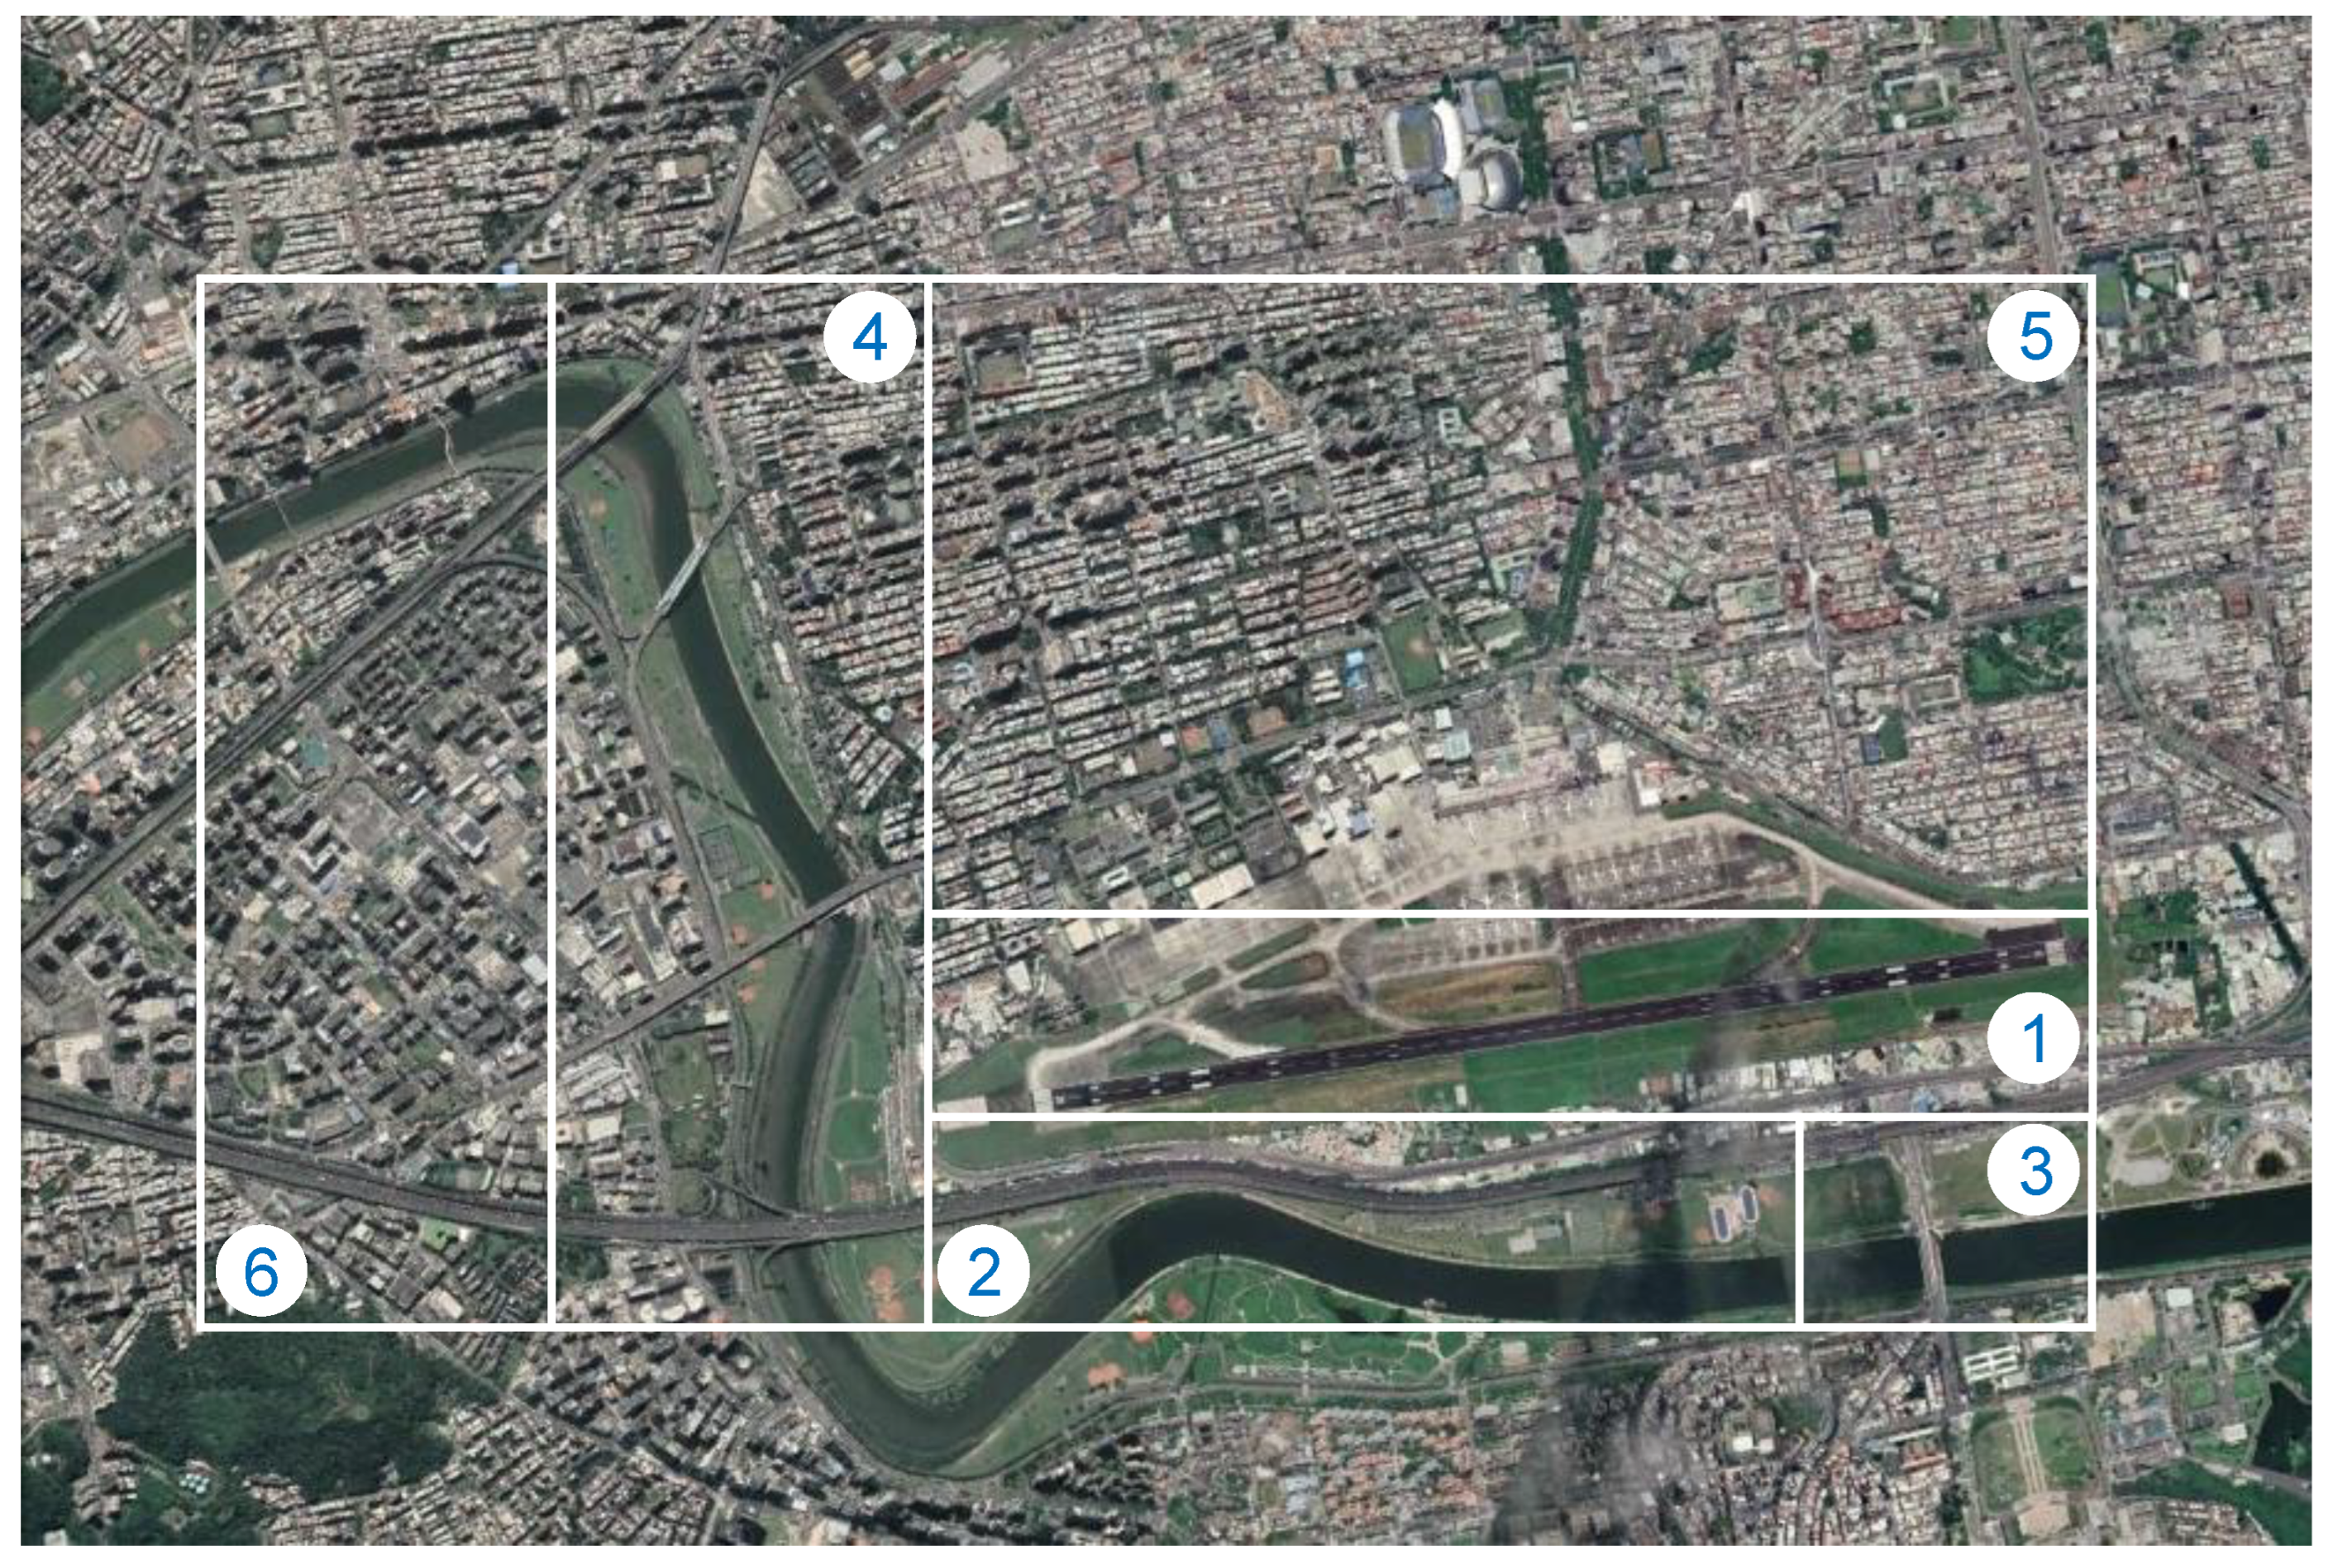
As illustrated in Figure 1, airport detection in remote sensing scene faces three main challenges: First, as indicated by markers 1, 2, 4, and 5 in Figure 1, linear geometric configurations exist in the terrain and buildings (such as roads, bridges, highways, and service areas) [6,7] that resemble airports, leading to class confusion, particularly from aerial and remote sensing perspectives. Second, markers 1, 3 and 1, 4 exhibit variations in size, textural features, as well as heterogeneous background environments. Third, as depicted by markers 1–5, airports are typically situated in intricate environments characterized by the presence of various densely packed structures, aprons, roads, and other facilities, thereby intensifying the complexity associated with the detection and recognition of airport objects.
In response to the aforementioned challenges in airport detection, based on our previous work conducted with TPH-YOLOv5++, we present an enhanced model, namely TPH-YOLOv5-Air, which builds upon the foundations of TPH-YOLOv5++ and incorporates the principles of ASFF [8]. Firstly, despite the problem of linear geometric configurations in the terrain and buildings resembling airports, it has been indicated that linear runways are the primary distinctive feature of airports, despite their diverse aspect ratios and configurations. To fully utilize this linear characteristic, we employ data augmentation, an ensemble inference strategy with multiple models, and the Convolutional Block Attention Module (CBAM) [9].
Then, to address the variations in size, orientation, and texture features of target objects, as well as the heterogeneous background environment, we incorporate the concept of ASFF, enabling the network to learn features at different scales from different layers [10]. Additionally, we introduce the adaptive parameter adjustment module (APAM) to adaptively learn the fusion spatial weights for each scale feature map, allowing for the utilization of information at different scales and improving the model’s scale invariance and detection performance. As a result of the airport targets not exhibiting a high-density distribution, the complexity of the background and dense scenes primarily poses challenges for airport target detection. To address this, we employ a Transformer Prediction Head (TPH) as an extension to the CNN-based detection model, enabling better and more efficient utilization of contextual information.
Furthermore, the unique characteristics of airports pose challenges in acquiring airport detection datasets, as they are difficult to obtain, require high annotation costs, and exhibit varying levels of data quality. However, deep learning-based detection methods rely on large-scale datasets, and both one-stage and two-stage detection models struggle to achieve satisfactory results when trained on small-scale datasets. Remarkably, up until now, there has been a lack of openly accessible datasets specifically tailored to the purpose of detecting confusing airport targets.
To enhance the detection performance of airports, we propose an Airport Confusing Object Dataset (ACD) specifically designed to address the characteristics of confusing targets at airports. The ACD consists of 6359 aerial images, encompassing 9501 instances of confusing objects in a bar-shaped configuration. The images have spatial resolutions ranging from 0.5 to 50 m, and their dimensions vary from 800 × 800 to 1024 × 1024 pixels. In comparison with other datasets, the ACD introduced in this paper exhibits the following characteristics: (1) the inclusion of annotations for confusing categories and instances; (2) the coverage of diverse scenes; (3) captured at different times and under varying weather conditions; (4) a wide range of pixel sizes; and (5) a wide range of aspect ratios [11,12,13].
Compared to TPH-YOLOv5++, TPH-YOLOv5-Air incorporates ASFF and APAM, effectively addressing challenges related to scale variations, complex geographical information, and large coverage targets in remote sensing scene imagery. To tackle the lack of publicly available large-scale datasets and the limitations of existing methods, we introduce an Airport Confusing Object Dataset (ACD) for airport target detection. Experimental results on the ACD demonstrate that TPH-YOLOv5-Air significantly improves the detection efficiency of airports.
This paper makes the following significant contributions:
- We propose an airport confusion detection dataset, named the ACD. The ACD is a publicly available airport confusion dataset with the most realistic and complex instances of data for real application scenarios. It furnishes a benchmark reference for the advancement of sophisticated airport object detection techniques or other related endeavors.
- We propose a new airport detection algorithm, TPH-YOLOv5-Air, by adding the ASFF module on the basis of TPH-YOLOv5++ for airport detection, which can effectively solve the problems caused by scale change, complex geographical information, and large coverage targets in remote sensing scene imagery.
- Extensive experiments and evaluations have demonstrated that TPH-YOLOv5-Air achieves state-of-the-art (SOTA) results on the ACD dataset, surpassing TPH-YOLOv5++ (the previous SOTA method) by an impressive margin of 2%.
2. Related Works
Within this section, we provide a succinct exposition on the detection of airport targets and the existing datasets and methodologies pertaining to airport object detection in remote sensing scene imagery.
2.1. Object Detection
The objective of object detection is to identify and classify all relevant objects in an image while accurately determining their spatial coordinates [14,15,16]. The applications of object detection span diverse domains, such as autonomous driving systems (ADSs), surveillance, robotics, and healthcare [17,18]. Classical object detection algorithms include feature-extraction-based methods (e.g., Haar features and HOG features) [19] and machine-learning-based methods [20,21]. In the past few years, notable advancements have been achieved in the domain of deep-learning-based object detection, leading to remarkable progress in this field.
Deep neural network (DNN)-based models play a crucial role in object detection tasks. These methods can be categorized into different types based on various criteria. Based on the approach of generating candidate boxes prior to detection, the models can be categorized as either one-stage detectors or two-stage detectors. A one-stage target detector is characterized by a single end-to-end feed forward network that integrates classification and regression tasks. It takes the region of interest (ROI) features obtained from the region proposal network (RPN) and utilizes them in the classification head to determine class labels and in the regression head to determine bounding box locations. Notable examples of one-stage detectors include the YOLO series by Redmon et al. In contrast, a two-stage detector employs a separate region proposal network (RPN) to perform foreground–background classification. The ROI features extracted from the RPN are then forwarded to the classification head for class label determination and to the regression head for bounding box localization. Prominent instances of two-stage detectors include the Faster R-CNN proposed by Girshick et al. [22] and the Cascade R-CNN introduced by Cai et al. [23]. Meanwhile, object detection models can also be classified based on the utilization of predefined anchors in a working pipeline. Models are divided into anchor-based detectors and anchor-free detectors. Anchor-based detectors, such as Faster R-CNN and YOLOv5, rely on predefined anchor points. On the other hand, anchor-free detectors, including YOLOX [24] and CornerNet [25], do not require anchor points for object localization.
2.2. Object Detection in Remote Sensing Scene Imagery
Object detection in remote sensing scene imagery can be broadly classified into two research directions: specific object detection and general object detection. Specific object detection focuses on identifying and localizing significant and valuable objects in remote sensing scene imagery, such as airplanes, cities, buildings, and vehicles [26]. General object detection refers to the detection of many different types of objects in remotely sensed images and is not limited to specific target classes. Meanwhile, object detection in remote sensing scenes also faces several typical technical challenges, such as class imbalance, complex background, scale variation, and the presence of small objects [27].
Class imbalance is a common issue in both natural images and remote sensing scene imagery. It refers to situations where a large number of proposals represent background regions during training, which can dominate the gradient descent and result in performance degradation. To tackle the class imbalance problem, various methods have been proposed for natural image object detection, such as focal loss [28], GHM [29], and OHEM [30].
Complex background refers to the diverse range of backgrounds present in remote sensing scene imagery compared to natural images, as the field of view in remote sensing scene images is typically wider. In natural images, the background for detecting objects like vehicles (e.g., in the Pascal VOC [31] and COCO datasets [32]) is often composed of streets, buildings, and the sky. However, in remote sensing scene imagery, the background can exhibit a high level of diversity, including urban areas, forests, grasslands, and deserts, all of which may contain vehicles. Therefore, addressing object detection in complex backgrounds is a crucial research problem.
Scale variations refer to the size variations of objects within the same category, while the issue of small objects pertains to the relative sizes of objects with respect to the entire image. Multi-scale methods have been widely explored for use in natural image object detection to handle scale variations. Common approaches involve scaling the images to create an image pyramid and extracting features at different scales to generate feature maps for each scale. Finally, individual predictions are made for each scale.
Small object detection is also a challenge in remote sensing scene images, because they are relatively small with a wide field of view. To address this challenge, TPH-YOLOv5, an extension of YOLOv5, introduces prediction heads that are capable of detecting objects at various scales. This approach leverages self-attention to explore the predictive potential and employs Transformer Prediction Heads (TPHs) as replacements for the original prediction heads. Moreover, the integration of the Convolutional Block Attention Model (CBAM) aids in identifying attention regions within dense scenes. In order to further enhance the computational efficiency and improve the detection speed, TPH-YOLOv5++ is proposed as an advanced version of TPH-YOLOv5. This upgraded model replaces the additional prediction head with a CA-Trans, while still maintaining its functionality. These advancements collectively contribute to the improved performance and efficiency of TPH-YOLOv5++.
2.3. Airport Object Detection
Due to the diverse structure and complex background of airports, it is a challenge to detect airports quickly and accurately in remote sensing scene imagery. Currently, there are four main approaches to detect airports based on remote sensing scene imagery, including line-based, image-segmentation-based [33], saliency-based [6], and deep-learning-based [19,34]. Line-based approaches leverage the presence of prominent line segments connecting the airport runway and its surrounding environment to detect the airport area. On the other hand, saliency-based methods focus on predicting saliency maps wherein the airport area exhibits high saliency values. Typically, saliency maps are computed based on line segments, frequency domain features, and geometric information derived from superpixels. Overall, these diverse approaches aim to address the challenges associated with airport detection in remote sensing scene images, with each method offering unique advantages and insights for this important task.
The rapid advancement of deep learning theory has led to increasing utilization of deep-learning-based object detection methods for airport detection. These methods adopt deep learning models specialized for object detection as their framework and incorporate additional optimizations to achieve more precise localization, such as the adjustment of anchor scales or the integration of image segmentation modules. These adaptations aim to enhance the accuracy of airport detection by leveraging the capabilities of deep learning and tailoring the models to the specific challenges and requirements of airport detection tasks.
Deep-learning-based approaches leverage robust feature extraction and representation capabilities, but their performance is heavily reliant on the data quality and quantity. As a data-driven field, the effectiveness of various deep learning methods is closely tied to the availability and characteristics of the utilized datasets. The quality of the data, including their diversity, relevance, and accuracy, directly influences the model’s ability to learn representative features and generalize well to new instances. Furthermore, the quantity of data plays a crucial role in training deep learning models, as larger datasets often lead to an improved model performance by providing more comprehensive coverage of the underlying data distribution. Thus, high-quality and sufficient data are essential for achieving an optimal performance with deep-learning-based approaches.
Currently, there are several datasets available for airport object detection:
SAD: This dataset aims to establish a standardized benchmark for airport detection in Synthetic Aperture Radar (SAR) imagery. Comprising a total of 624 SAR images, each with a resolution of 2048 × 2048 pixels, the dataset is derived from the Sentinel-1B satellite. The dataset encompasses 104 instances of airports, exhibiting diverse characteristics such as varying scales, orientations, and shapes. However, this dataset is specifically tailored to facilitate airport object detection in SAR images, offering valuable resources for algorithm evaluation and comparative analysis.
BARS: BARS is the most extensive and diverse dataset available, offering a wide range of categories and detailed instance annotations. With a collection of 10,002 images and 29,347 instances, the dataset encompasses three distinct categories. The data are captured through the employment of the X-Plane simulation platform. The dataset accounts for various factors such as different airports, aircraft views, weather conditions, and time intervals, with a primary focus on runway segmentation in airport imagery.
DIOR: DIOR serves as a comprehensive benchmark dataset that is specifically tailored for object detection in optical remote sensing scene images. It encompasses a vast collection of 23,463 images, comprising 190,288 instances across diverse object classes, while also accounting for variations in seasons and weather conditions. Some of the included classes are airplanes, airports, bridges, ships, and vehicles. The images in this study are uniformly resized to 800 × 800 pixels, and they exhibit resolutions ranging from 0.5 m to 30 m.
While the above datasets are related to airports, they do not specifically address the detection of easily confusable objects within airports. Therefore, there is a need to construct a dataset that includes structurally diverse airports, complex backgrounds, and significant scale variations to enhance the detection performance of airports in remote sensing scene imagery.
3. ACD: Airport Confusing Object Dataset
While current remote sensing scene imagery datasets include conventional targets such as aircraft and airports, they have certain limitations in terms of scale and quantity, which restricts their adequacy for use in a comprehensive analysis. Consequently, there is a pressing demand for the creation of a dataset that is specifically designed to address the challenges associated with detecting airport-confusion-prone strip targets.
This section begins by providing a detailed account of the origin and annotation process employed for the Airport Confusing Object Dataset (ACD). Subsequently, we present a comprehensive analysis of the ACD, encompassing aspects such as the target size, aspect ratio, orientation, quantity, and the intricate contextual factors influencing the identification and differentiation of these confusable targets.
3.1. Image Collection of the ACD
In this study, a comprehensive dataset was developed to improve the detection and localization accuracy of airports, specifically targeting the challenge of airport confusion objects. The dataset encompasses a total of 6359 images, containing 9501 instances of airport confusion objects. As shown in Table 1, the dataset consists of 1058 airport images, 2176 bridge images, and 1125 highway service area images extracted from the DIOR, as well as an additional 2000 images collected from Google Earth, representing 2000 different airports. The spatial resolution of the images ranges from 0.5 m to 50 m, and the size ranges from 800 × 800 to 1024 × 1024 pixels.
The images cover a wide range of seasons, weather conditions, and complex image patterns, capturing a total of 3369 airports instances, 3967 bridge instances, and 2165 highway service area instances. In addition, the images vary in terms of height, viewing angle, and lighting conditions.The diversity and richness of this dataset provide a comprehensive representation of various real-world scenarios encountered in airport object detection tasks.
3.2. Annotation Method
We utilize horizontal bounding boxes to represent airport targets, given their sparser distribution. The standard representation of a horizontal bounding box is , where c indicates the category and represents the center position of the bounding box within the image. The values of w and h correspond to the width and height of the bounding box, respectively. Figure 2 showcases several samples of the original images annotated in the Airport Confusing Object Dataset (ACD).
3.3. Dataset Splits
To accurately simulate the sample imbalance and long-tail effect observed in real-world airport and other confusable target data, we established a training and testing set ratio of 1:9. Specifically, we randomly allocated 635 images to the training set, while the remaining 5724 images were designated as the testing set. This division ensured a comprehensive evaluation of the model’s performance on diverse data samples.
3.4. Complex Background
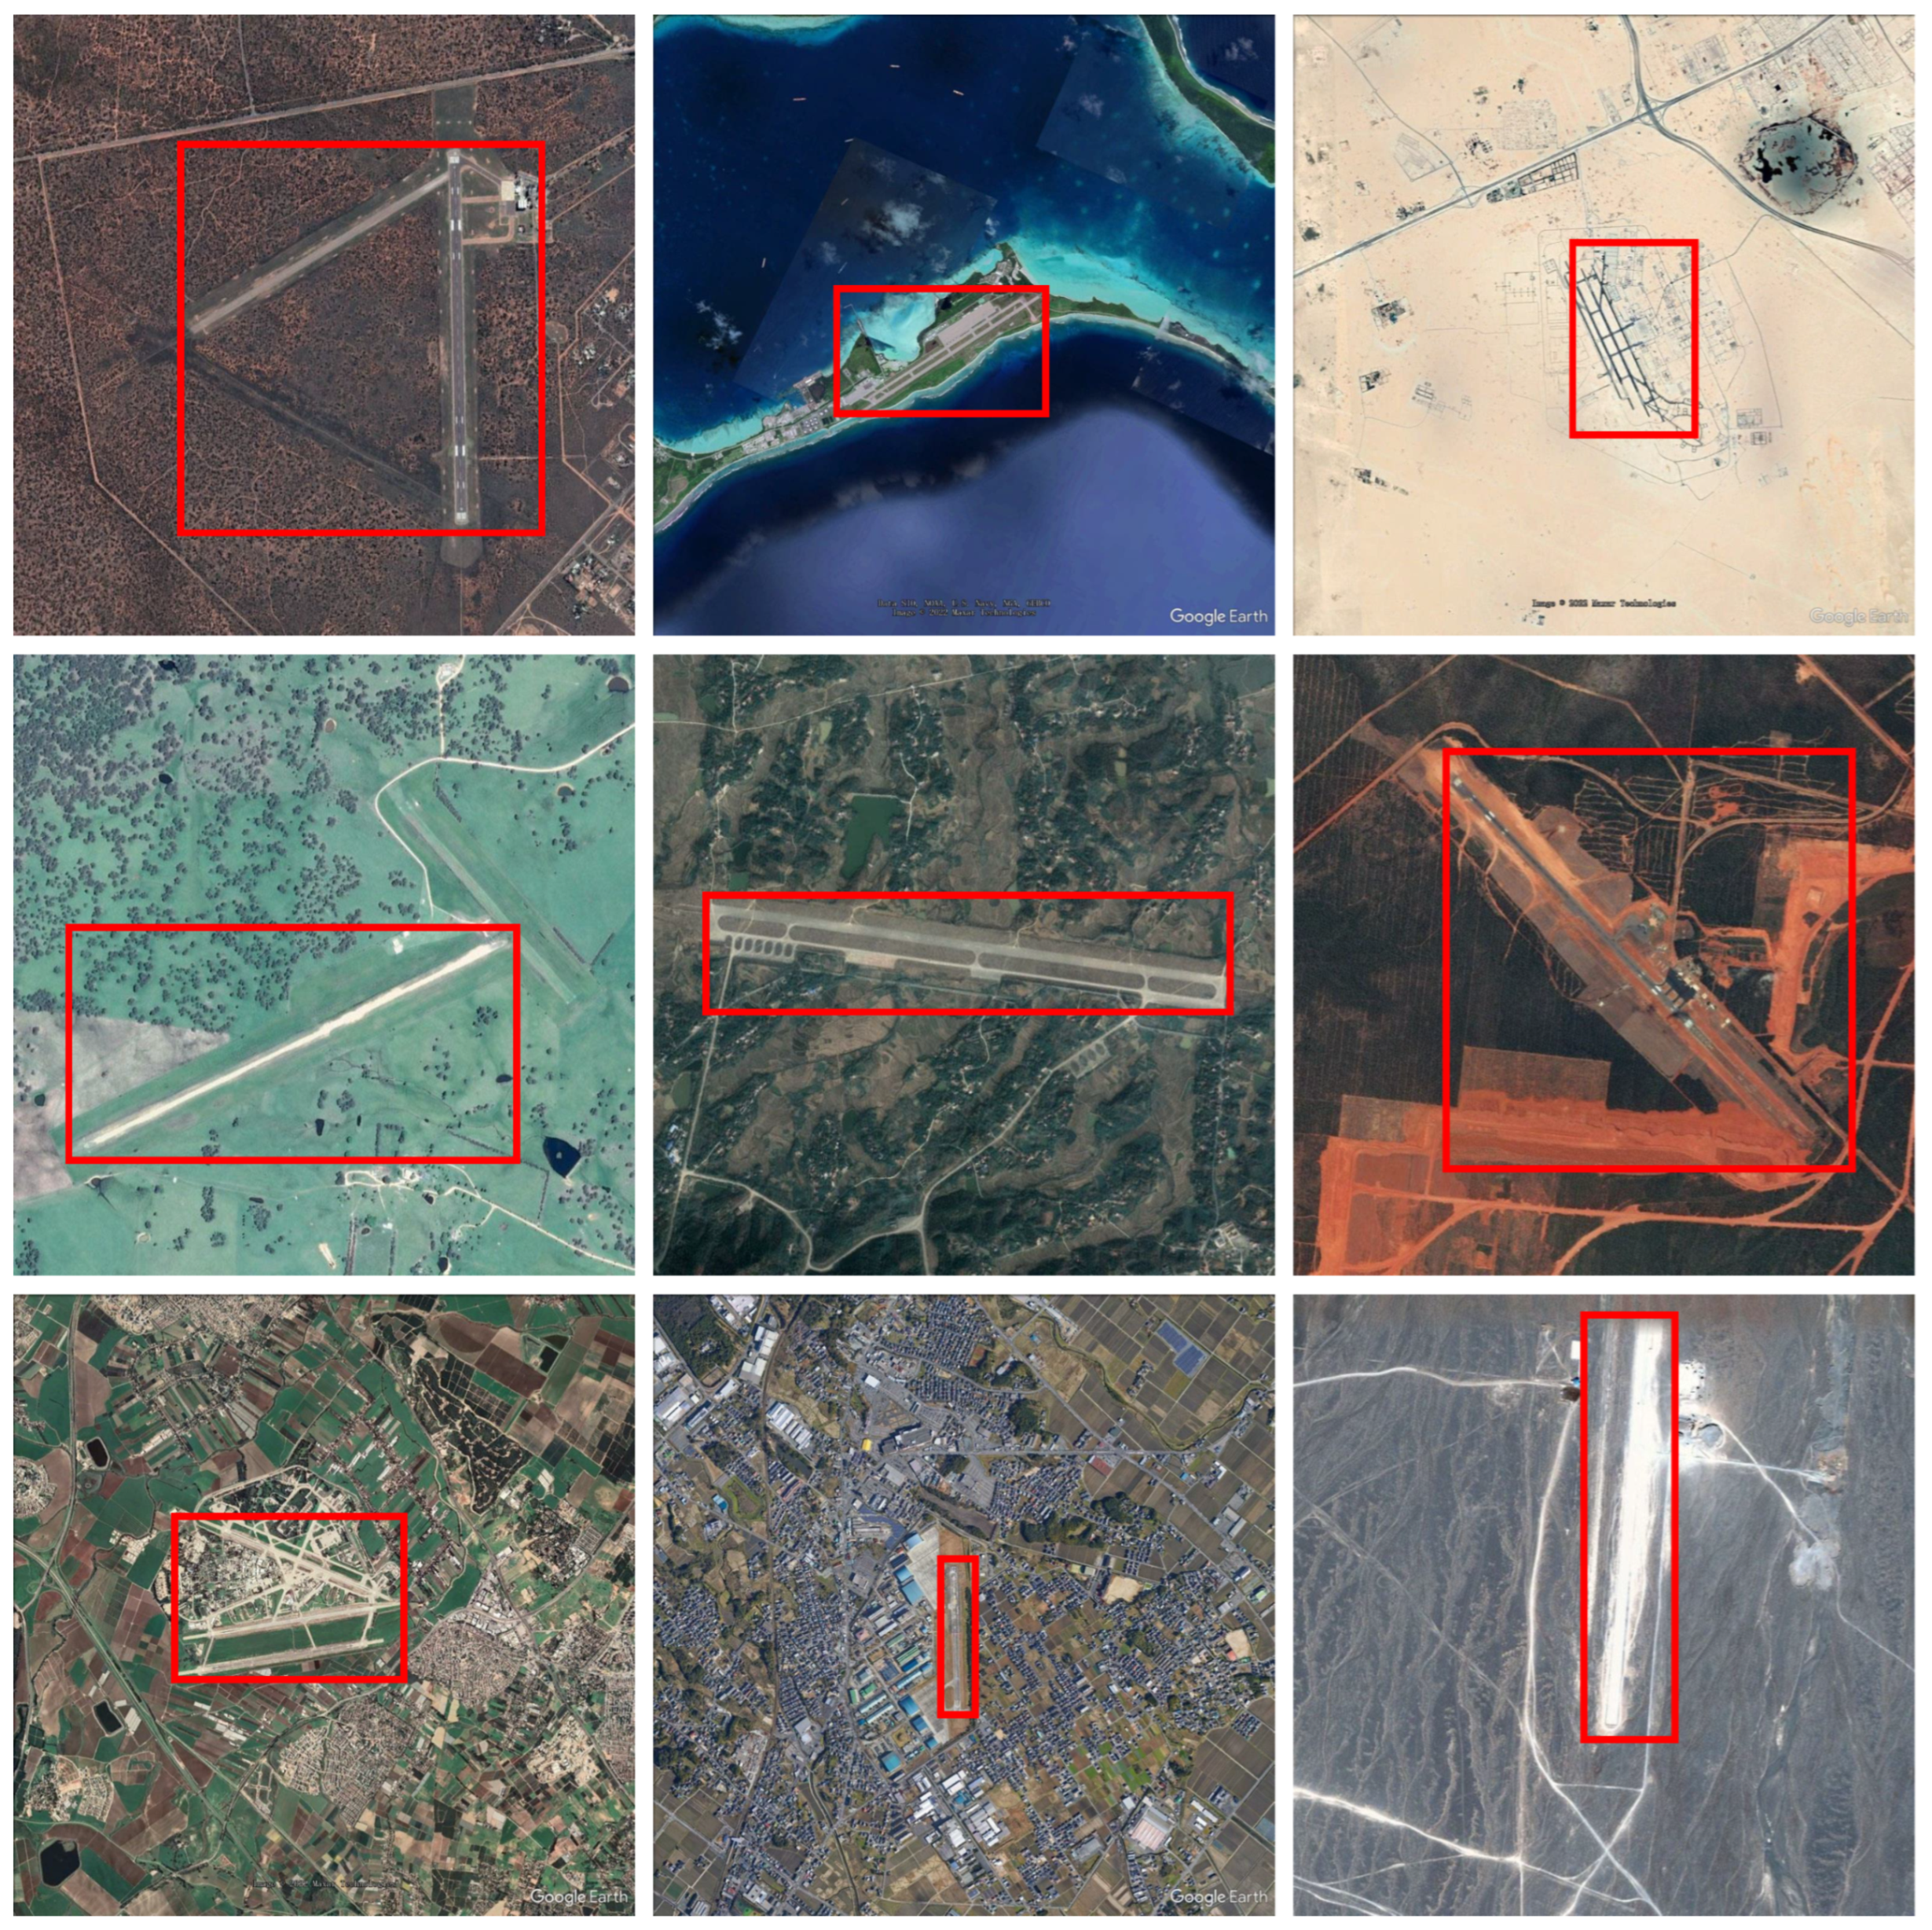
As discussed in the preceding section, one of the primary challenges encountered in airport detection is the presence of airport-like regions within real-world settings, accompanied by intricate backgrounds. Figure 2 provides a visual representation of this phenomenon, where airports are observed across a wide range of backgrounds, such as grasslands, islands, deserts, mountains, cities, and villages. Moreover, the presence of lakes, bridges, roads, coastlines, and highway service areas adds further complexity and interference to the detection process. Consequently, accurately identifying airports amidst such diverse and complex backgrounds poses a formidable task.
3.5. Various Sizes of Airport Objects
We conducted pixel size calculations for each airport by measuring the number of pixels within their respective bounding boxes. These pixel sizes were categorized into three ranges: small, indicating a pixel size between 0 and 100,000; middle, representing a pixel size between 100,001 and 200,000; and large, denoting a pixel size exceeding 200,000. In Table 2, we present the distribution of these size categories as a percentage of the 3369 airport instances found in the ACD. Notably, the pixel sizes of different airport targets exhibit significant variations and tend to concentrate around the central range. This characteristic poses a considerable challenge for existing detection methods.
However, despite the ability of this computational approach and classification method to partially indicate the size and distribution of airports, there are inherent limitations that cannot be completely avoided. For instance, in cases where the airport is elongated and oriented at a certain angle, the bounding box may encompass a significant number of background pixels, leading to the potential misclassification of airport sizes.
3.6. Various Aspect Ratios of Airports
The aspect ratios play a crucial role in determining the detection accuracy of anchor-based object detection models, and therefore, we analyzed the aspect ratios of all airport targets within the ACD. The computed aspect ratios of airport targets in the ACD range from 0.04 to 38.4. Notably, Table 3 highlights a significant number of airport targets with large aspect ratios, which greatly influences the effectiveness of airport object detection. This characteristic also contributes to the realism of our dataset, as it aligns with the real-world scenario where airport targets can have diverse aspect ratios depending on their usage. The wide distribution of aspect ratios enhances the generalized performance of the model.
3.7. Various Orientations of Airports
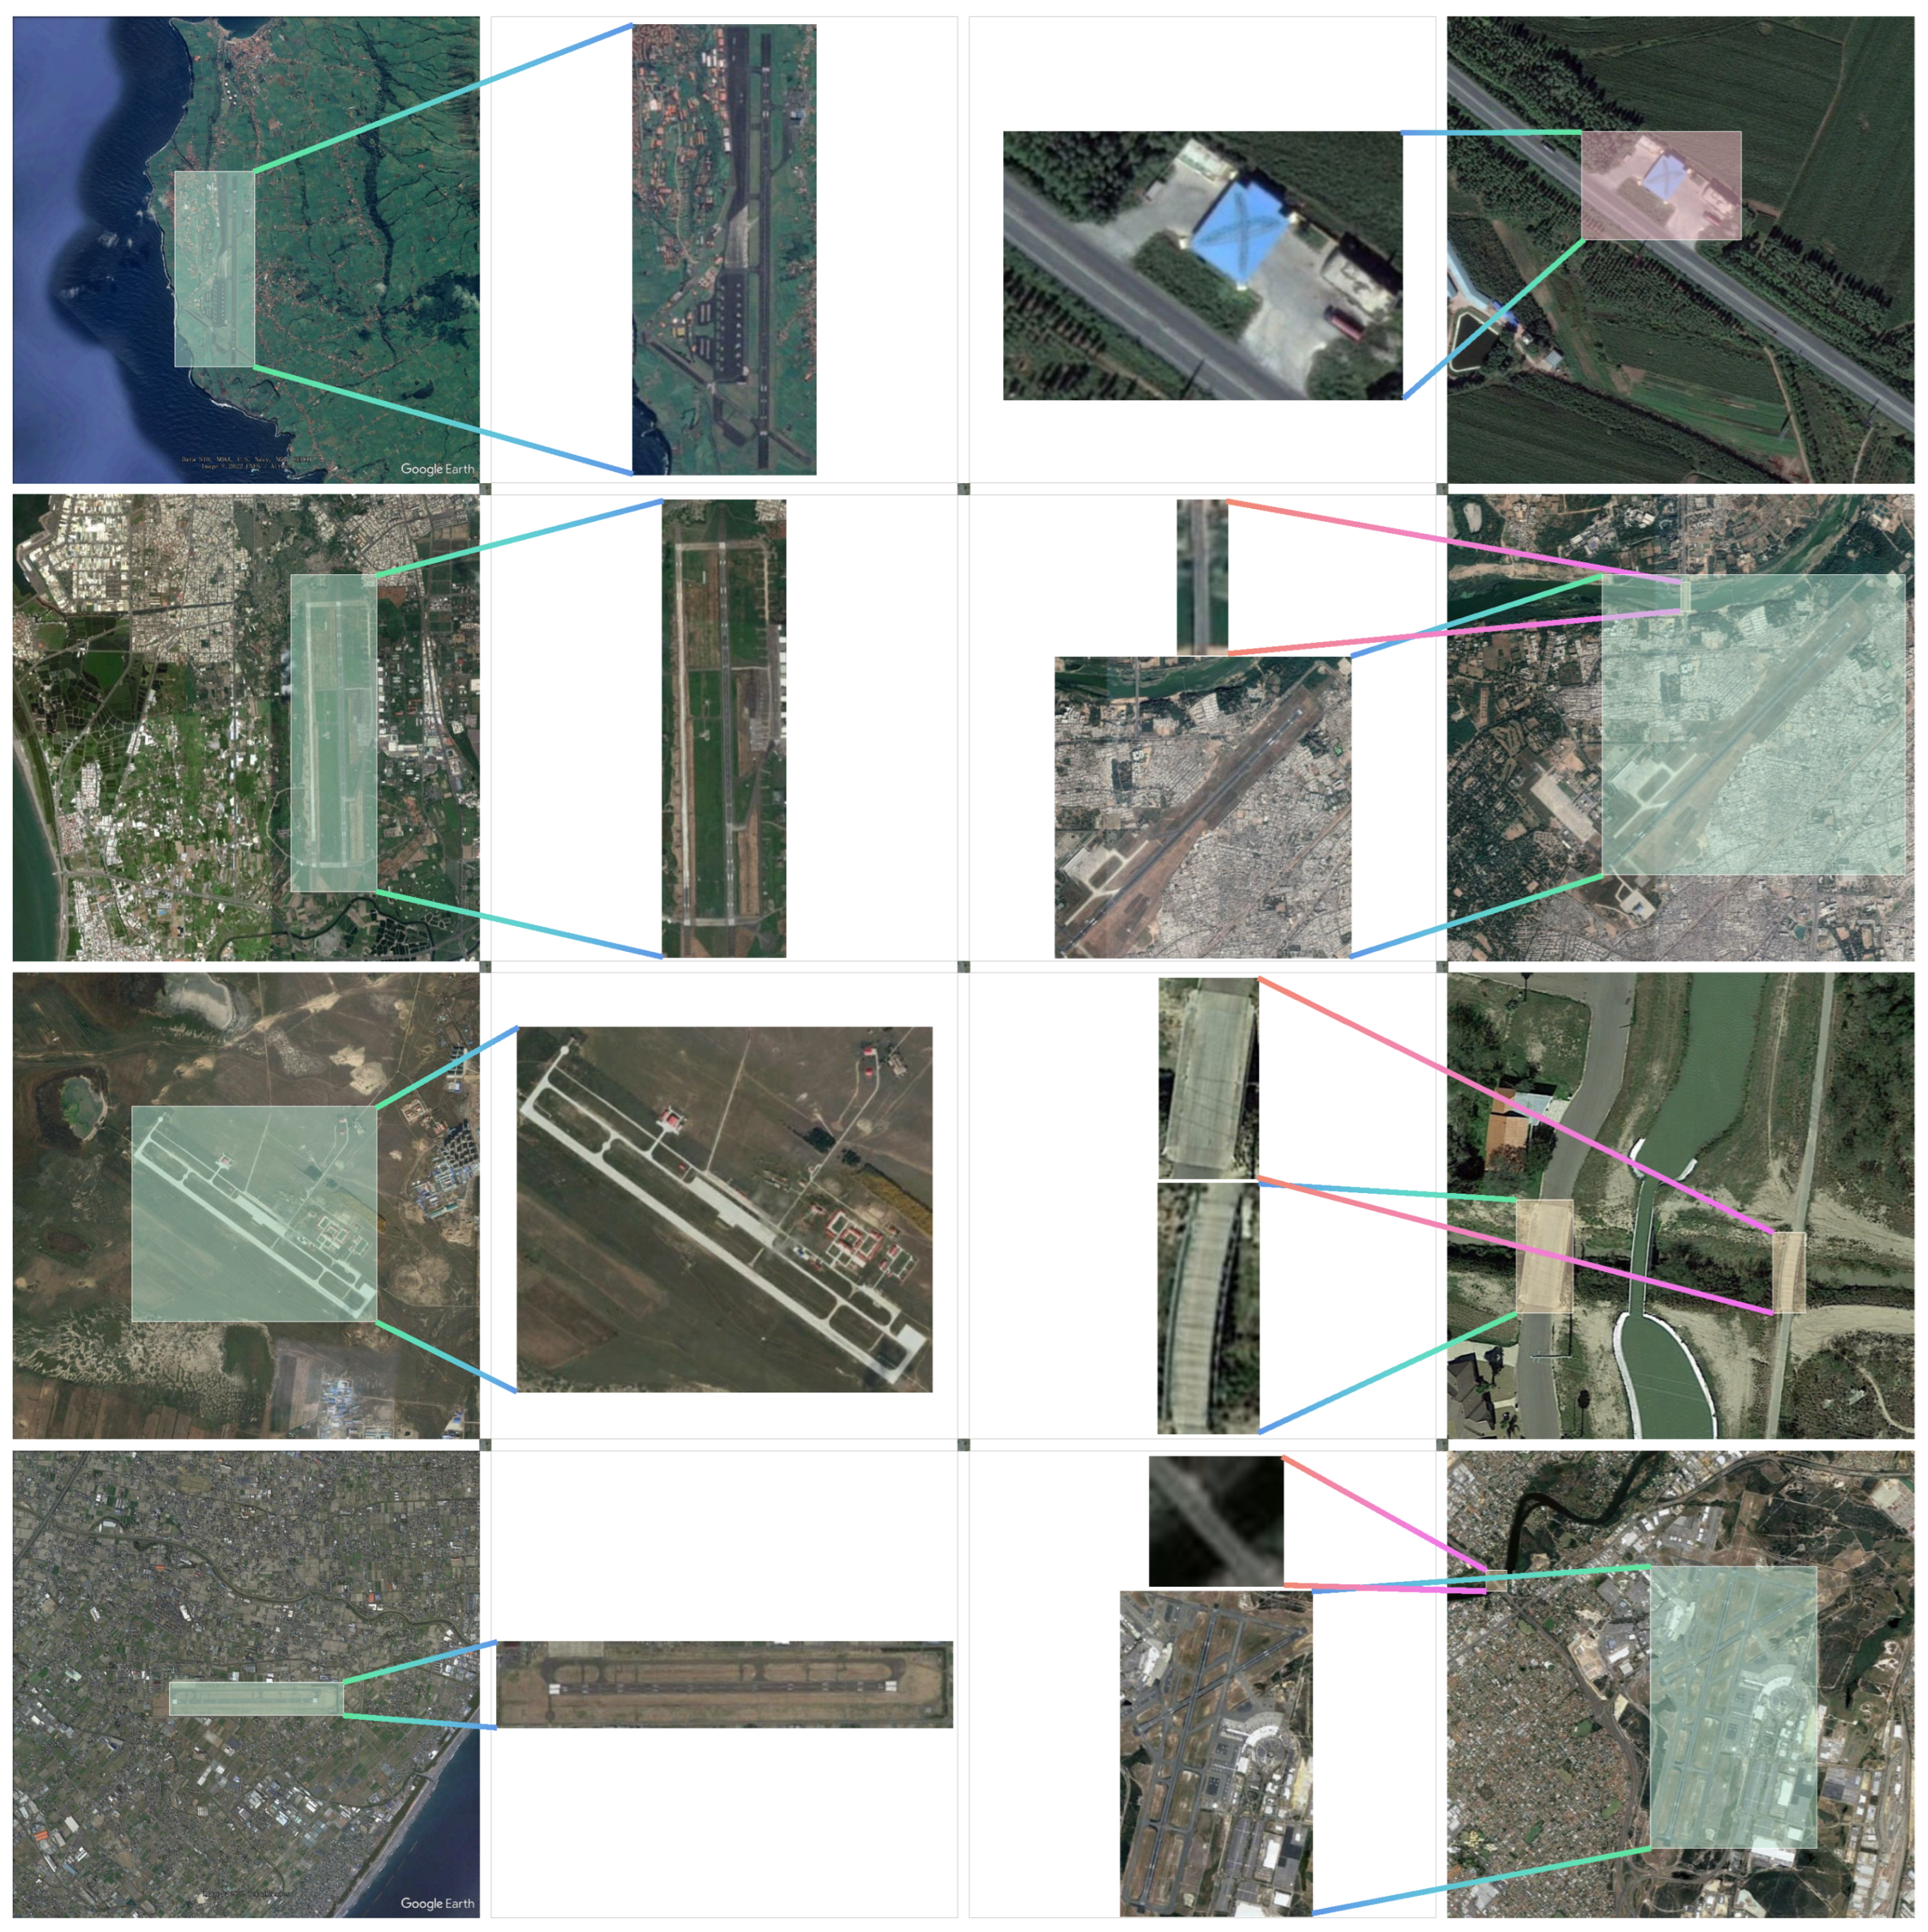
As illustrated in Figure 3, there are a large number of airports with different orientations and confusing targets, and the ACD simulates real scenarios in the real world well, but this distribution of airports with various orientations poses a challenge for airport object detection. Figure 3 illustrates the presence of numerous airports with varying orientations and their potential confusable targets, which is a common occurrence in real-world scenarios. The ACD dataset effectively captures this distribution, simulating realistic environments. The diverse orientations of airports pose a challenge for airport object detection algorithms, requiring them to handle variations in object rotation and orientation.
4. Methodology
To demonstrate the effectiveness and challenge of ACD in the field of airport detection, we tried to design a novel algorithm based on the TPH-YOLOv5 series as well as the AFSS (Adaptively Spatial Feature Fusion) mechanism.
4.1. YOLOv5
The YOLOv5 model consists of four key components: input, backbone, neck, and head. Compared to YOLOv4, it incorporates mosaic data augmentation and the adaptive anchor box calculation to enhance the network’s generalization capability. Additionally, it integrates ideas from other detection algorithms, such as the Focus structure and CSP structure, into the backbone network. Moreover, it introduces the FPN and PAN structures between the backbone and head. These advancements result in significant improvements in both speed and accuracy.
The YOLOv5 object detection network includes four versions, namely YOLOv5s, YOLOv5m, YOLOv5l, and YOLOv5x, as provided in the official code. These versions are controlled by two parameters: the depth multiple and width multiple. The depth multiple parameter determines the network depth, while the width multiple parameter determines the network width. Among the YOLOv5 series, YOLOv5s has the smallest depth and the smallest width of the feature map. The other three versions are enhanced in terms of depth and width compared to YOLOv5s.
Although YOLOv5s has the smallest network and the lowest AP accuracy, YOLOv5s is lightweight while maintaining accuracy, so we chose YOLOv5s as the benchmark.
4.2. TPH-YOLOv5 Series
4.2.1. TPH-YOLOv5
To address the major challenges in object detection for remote sensing scene imagery using YOLOv5, a general detector called TPH-YOLOv5 is proposed specifically for unmanned aerial vehicle (UAV) scenarios. The schematic diagram of TPH-YOLOv5 is presented in Figure 4, showcasing the architectural design of the model.
Prediction Head. Due to the significant variations in the pitch and height during data acquisition, objects in aerial images exhibit diverse scales and appearances. Moreover, these objects often appear in densely clustered regions. To address the challenge of detecting tiny objects, TPH-YOLOv5 extends the YOLOv5 model by incorporating an additional prediction head. Although the inclusion of the extra prediction head introduces notable computational and memory overhead, it significantly enhances the performance of tiny object detection.
Transformer Prediction Head. Moreover, in remote sensing scene images, the presence of complex scenes can lead to similarities between objects of different classes, particularly in large-scale scenarios. Therefore, it is crucial to extract comprehensive contextual information and establish relationships between objects and other instances within the scene. Drawing inspiration from the Transformer architecture, TPH-YOLOv5 replaces certain SCP bottleneck modules with a transformer encoder module. This integration allows for the exploitation of contextual information by generating attentions among pairs of pixels.
Nevertheless, with the increase in the resolution of remote sensing scene images, the utilization of transformer modules introduces significant computational and storage costs. Moreover, in order to effectively leverage the channel and spatial information within the features, TPH-YOLOv5 incorporates the convolutional block attention module (CBAM) following the CSP bottleneck and transformer encoder module. The presence of large-scale scenes in remote sensing scene images often results in the confusion of geographical elements.
Mathematical description of TPH-YOLOv5. For TPH-YOLOv5, we denote the input image as x, and consequently, the four features extracted by the backbone network can be represented as , where . As per the network architecture of TPH-YOLOv5, the formulation of can be derived as stated in Equation (1).
where , , and represent three, six, or nine CSP bottleneck modules and one SPP module respectively.
In Neck, is obtained after a series of operations to obtain another set of features, denoted as , and the last four features before convolution are defined as , .
4.2.2. TPH-YOLOv5++
Despite the remarkable performance of TPH-YOLOv5, it also exhibits high computational costs. To address this challenge and achieve significant reductions in the computational overhead while improving the detection speed, we propose an enhanced variant called TPH-YOLOv5++. TPH-YOLOv5++ builds upon the foundation of TPH-YOLOv5 and introduces innovative optimizations tailored to optimize the computational efficiency and enhance the detection speed.
TPH-YOLOv5++ incorporates a CA-Trans in place of the additional prediction heads. In the VisDrone Challenge 2021, TPH-YOLOv5 achieved a commendable fourth place, demonstrating competitive performance and closely approaching the first-ranked model with an average precision (AP) of 39.43%.
Compared to TPH-YOLOv5, TPH-YOLOv5++ uses a CA-Trans to put in and to obtain . Compared to TPH-YOLOv5, TPH-YOLOv5++ has no and , and there is a module, as shown in Equation (2):
where the symbol - represents the module.
4.3. TPH-YOLOv5-Air
The Feature Pyramid Network (FPN) is a widely adopted technique in object detection for predicting targets at various scales and addressing the common issue of scale variation. However, the inconsistency between different feature scales remains a primary limitation of FPN-based detectors. To mitigate this limitation, other researchers have proposed a data-driven pyramid feature fusion strategy known as ASFF [10]. ASFF suppresses inconsistencies by learning spatial filters to effectively filter conflicting information, thereby enhancing the scale invariance of the features.
The key to achieving ASFF lies in the ability to dynamically learn the fusion spatial weights for each scale’s feature map. This process involves two essential steps: uniformly rescaling the feature maps and adaptively fusing them.
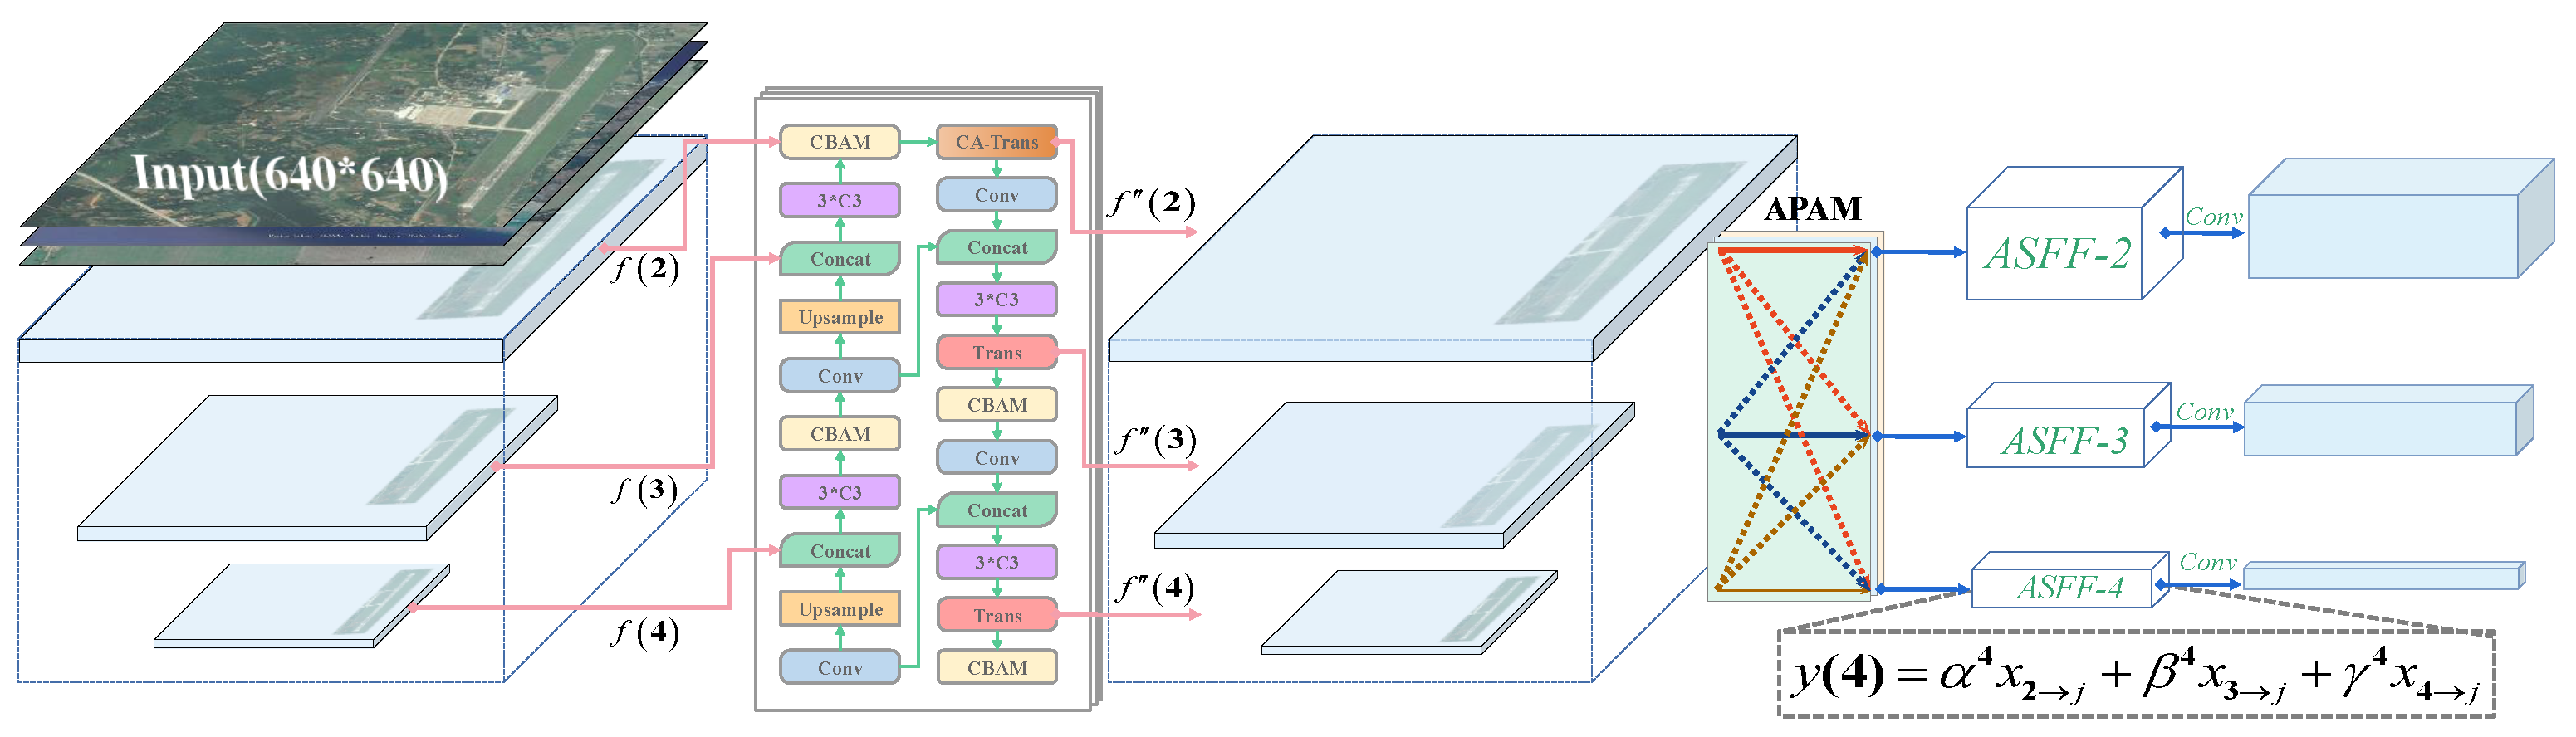
The TPH-YOLOv5-Air algorithm enhances the feature scale invariance and object detection capability by seamlessly integrating the ASFF structure into the PANet architecture. Following a similar approach as TPH-YOLOv5++, TPH-YOLOv5-Air employs the CA-Trans module to fuse feature and feature , resulting in the generation of feature . This fusion process not only achieves significant reductions in computational costs but also leads to an improved detection speed.
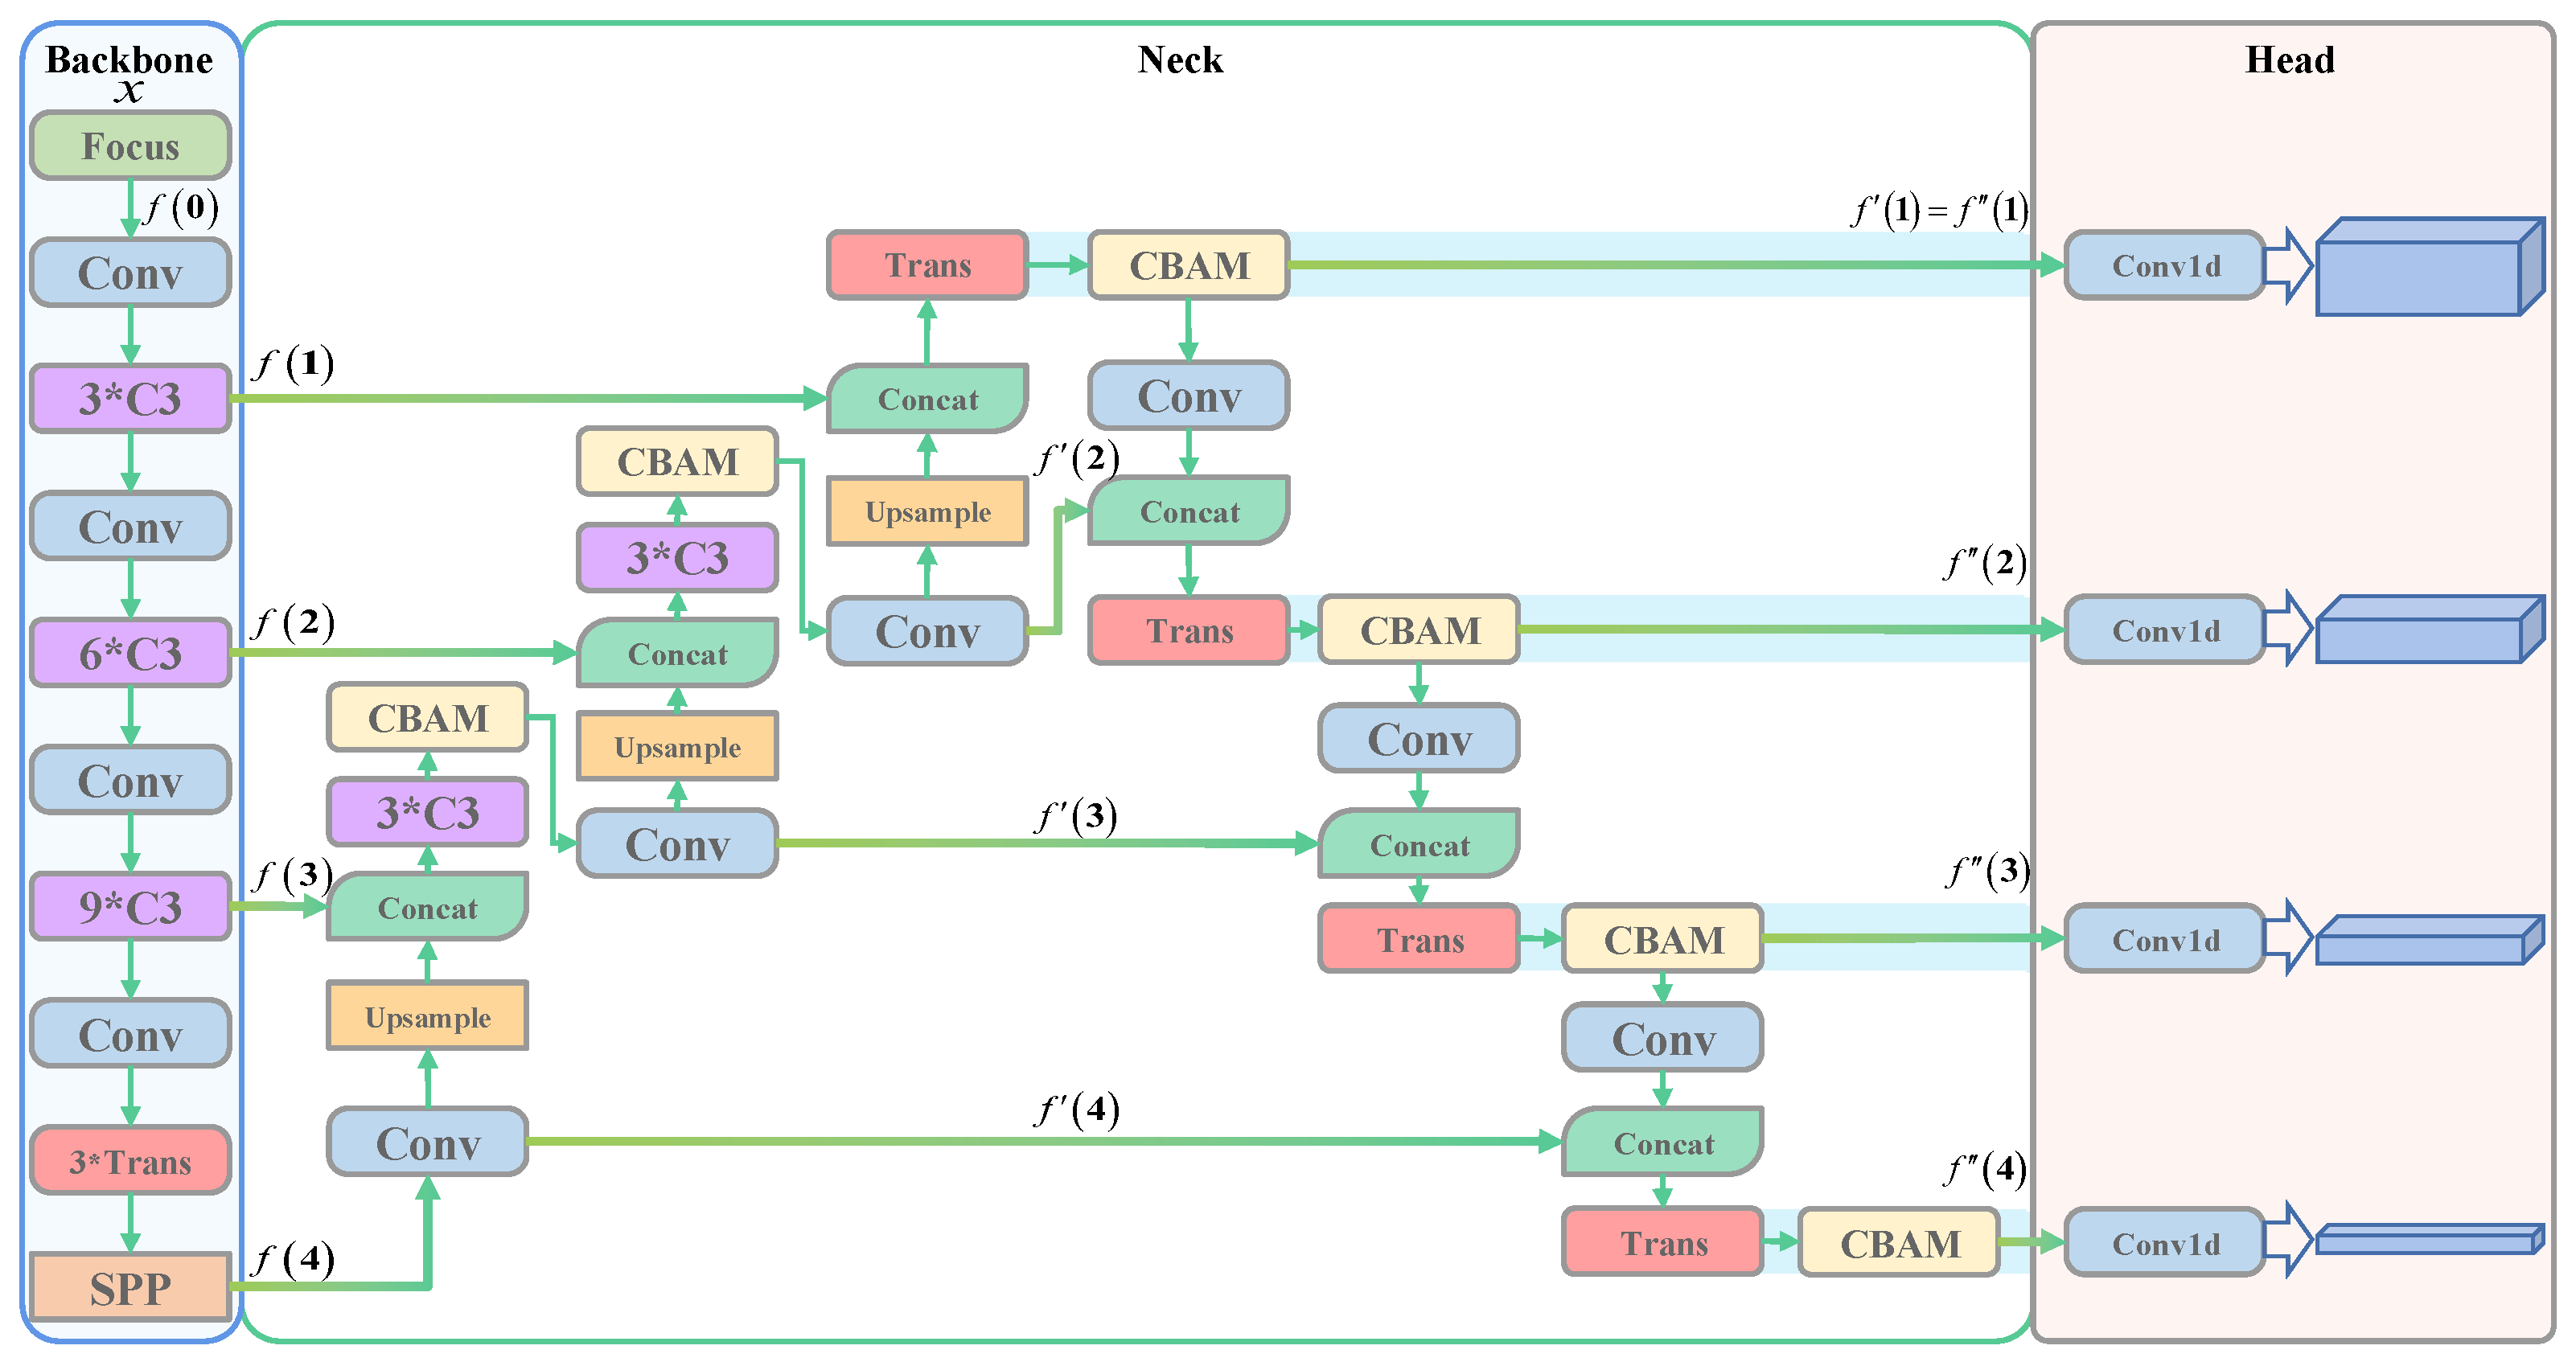
By incorporating the principles of AFSS, TPH-YOLOv5-Air introduces a redesigned PANet architecture into TPH-YOLOv5++. After the feature extraction stage within the FPN structure, the ASFF algorithm is incorporated at each layer for weighted fusion. The weight parameters are obtained using the squeeze and excitation operations from SENet, enabling channel-wise adjustments to enhance the focus on important channels and thereby improving the model’s performance. The architectural configuration of TPH-YOLOv5-Air is visually depicted in Figure 5, providing a clear representation of the model’s structure.
The squeeze operation aims to reduce the dimensionality of feature maps in each channel by applying global average pooling, resulting in a single real-valued scalar. It can be perceived as a process of extracting features for individual channels and deriving the corresponding importance coefficient. The mathematical representation of this process is depicted in Equation (3).
where denotes the Global Average Pooling () module.
The excitation operation leverages the importance coefficients obtained from the squeeze operation to weight the feature maps of each channel. It accomplishes this by applying a fully connected layer to learn the importance coefficients and obtain a weight vector. This approach captures the interdependencies between channels and provides a global description of each feature map. Finally, a fully connected layer is employed to derive spatial importance weights across different levels. Excitation can be expressed as
Here, the symbol represents the module of a fully-connected () layer, represents the ReLU function, represents the sigmoid function, and the variable i takes on values of 2, 3, and 4.
In order to simultaneously represent the features from different layers, it is necessary to combine the feature maps from each layer, as illustrated in Equation (5).
where denotes the Concat module. Thus, each layer obtains three weights , , and , denoted as feature mapping from layer l to layers 2, 3, and 4, respectively, and satisfying .
Since the three different levels of features in YOLOv5 have different resolutions and different numbers of channels, it is imperative to adjust the sampling strategies between different layers. We define as the feature vector in the feature map adjusted from the i-th level to the j-th level.
Meanwhile, in order to ensure that the original layer features can have greater weights in the detection head, we obtain the SE parameters by the softmax function with , , as the control parameter, as shown in Equation (6):
where , , and represent the feature maps obtained by convolving the input with a kernel, which satisfies .
By combining Equations (5) and (7), the final weights are obtained, as shown in Equation (7):
The following equation can be obtained from Equations (6) to (7):
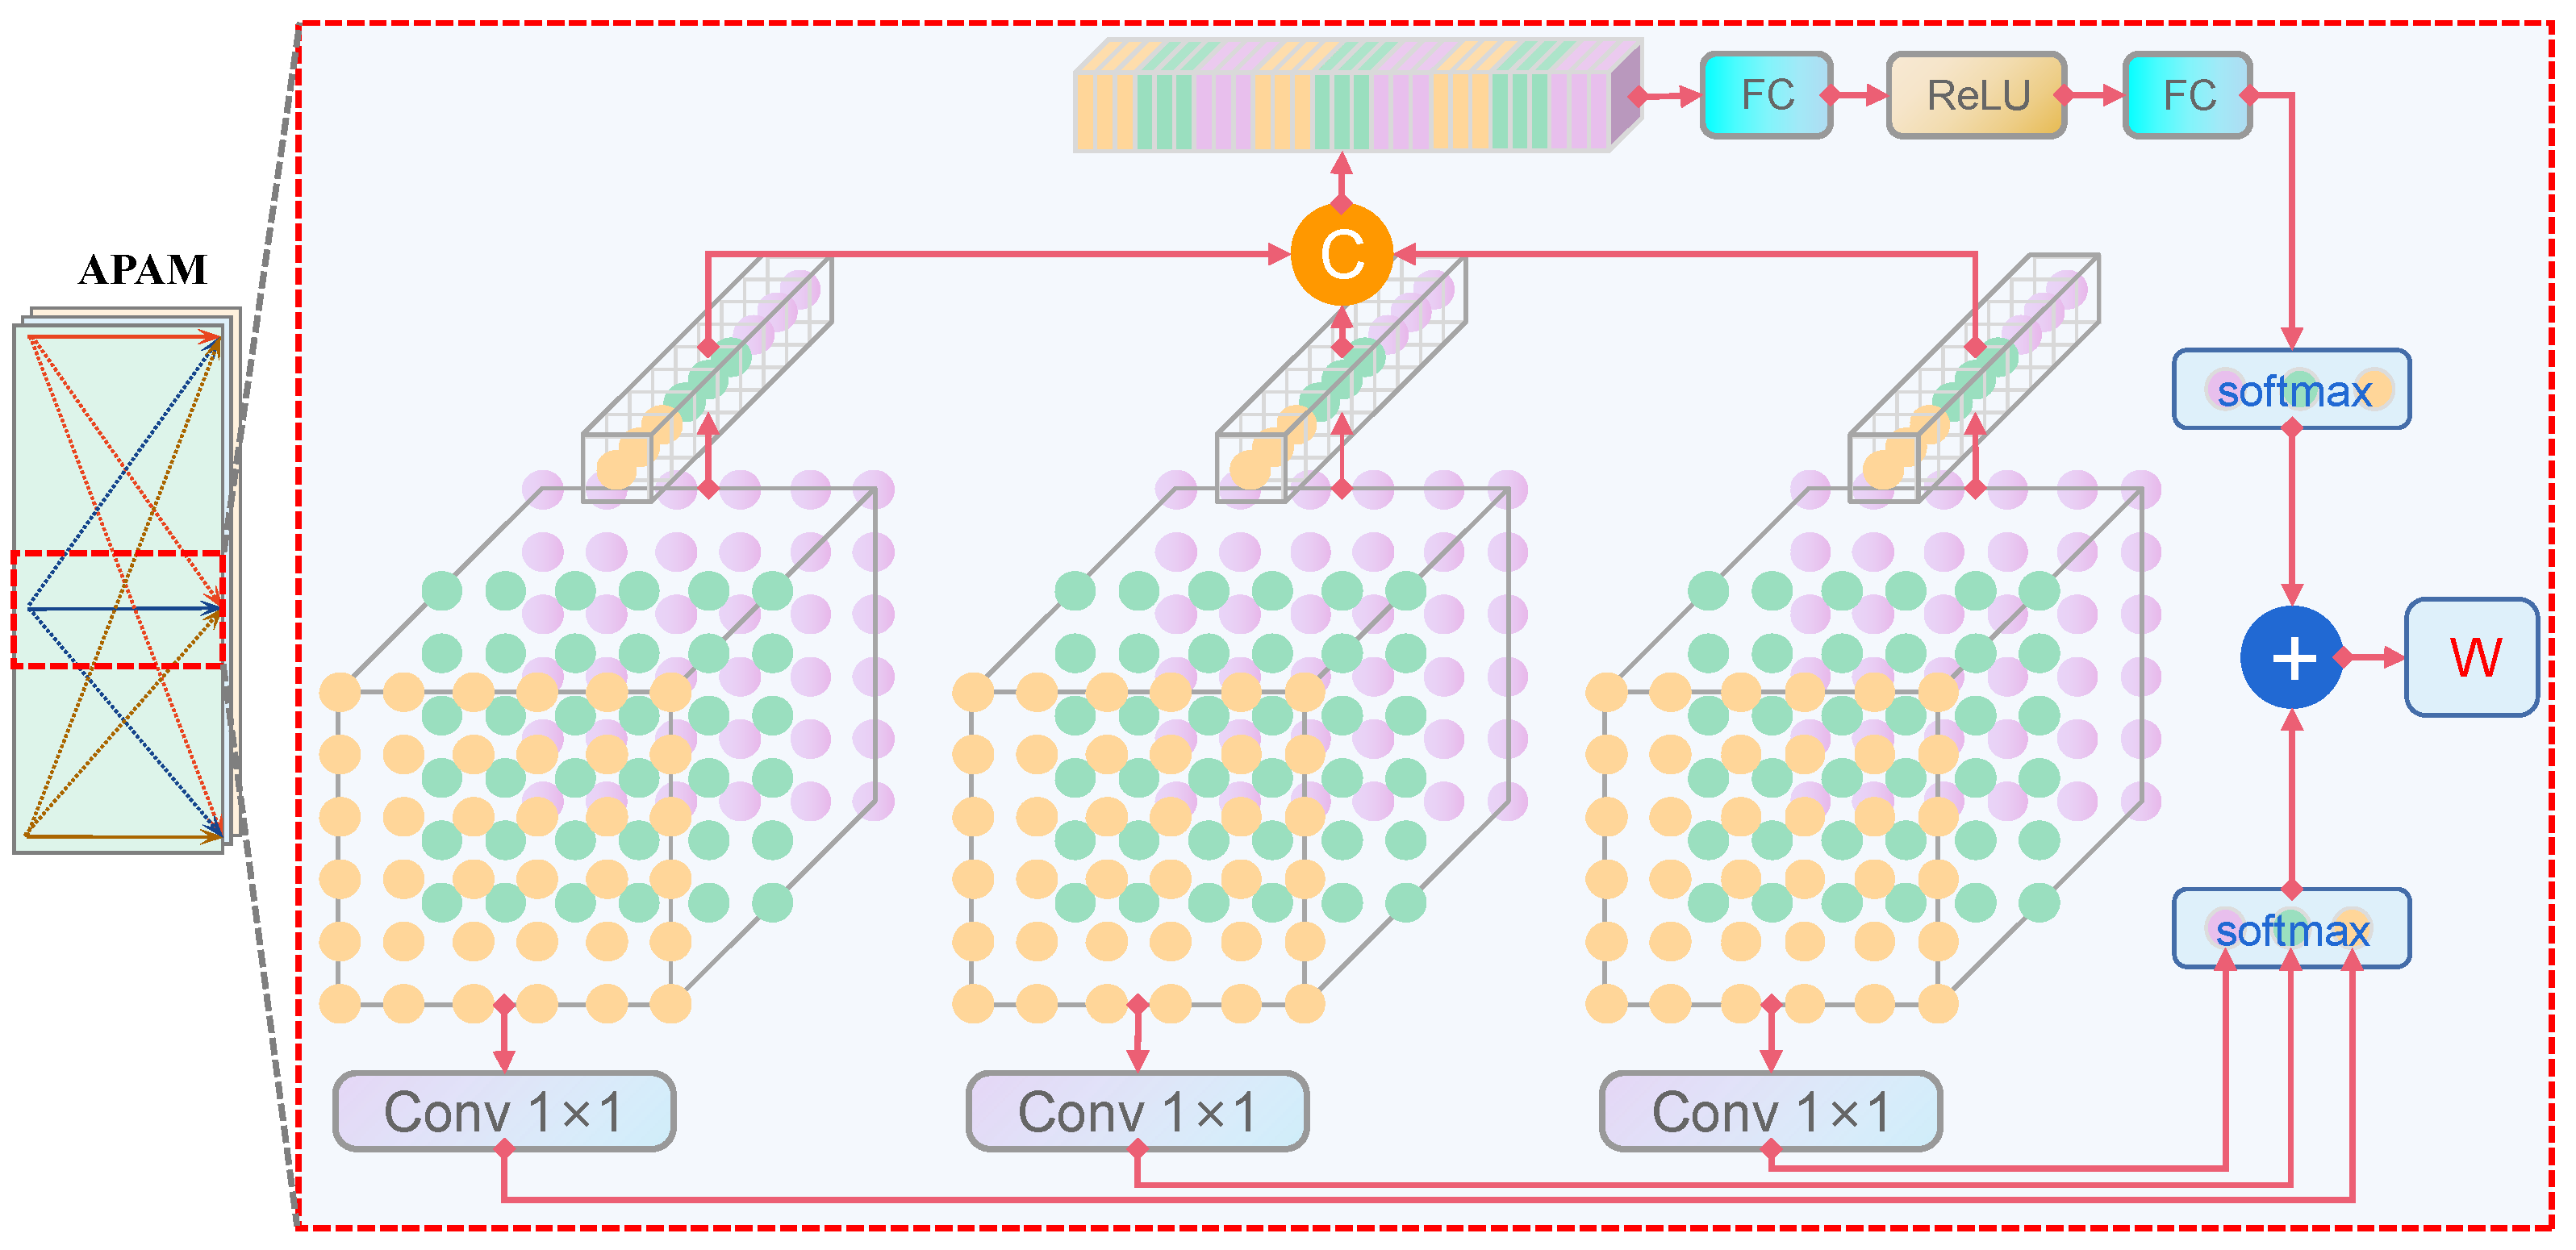
The architecture of the adaptive parameter adjustment module is illustrated in Figure 6 below.
The spatial importance weights are multiplied by the feature vectors to obtain Equation (9), which represents the feature output at the j-th layer.
As a result, the features from all levels can be adaptively aggregated across different scales. Since the aggregation is performed by addition, it is necessary to ensure that the features from different layers have the same spatial size and channel dimensions. Therefore, upsampling or downsampling, as well as channel adjustment, is required for the features from different layers.
5. Experiment
5.1. Dataset and Settings
5.1.1. Dataset
In this study, the ACD mentioned earlier was utilized. The dataset comprises 6359 images with a total of 9501 instances, covering various seasons, weather conditions, and complex image patterns. The images in the dataset exhibit a spatial resolution ranging from 0.5 to 50 m, while their dimensions span from 800 × 800 to 1024 × 1024 pixels. The ACD dataset is divided into 636 training images, 5087 validation images, and 636 testing images.
5.1.2. Evaluation Metrics
In this study, we employed the evaluation metrics of , , and . The first metric, , represents the AP computed over a range of IoU thresholds ( to with a step size of ). In addition, we considered other performance evaluation metrics, such as precision, recall, the model parameter size (Params), the number of floating-point operations per second (FLOPs), and the number of frames per second (fps).
5.1.3. Experimental Setup
We implemented our method on the Windows operating system and conducted all experiments on an NVIDIA RTX3080ti GPU with 12 GB of memory. These methods were developed using PyTorch 1.10.1, conda 4.12.0, and CUDA 11.7, with pretraining performed on the COCO dataset.
For the training of these methods on the ACD dataset, a total of one hundred iterations were conducted, where the initial three iterations were dedicated to the warm-up. To validate the effectiveness of the algorithm, we used uniform hyperparameters based on the default hyperparameters of YOLOv5 across different comparison models and our TPH-YOLOv5-Air, including an initial learning rate of 0.01, a momentum of 0.937, and a weight attenuation of 0.0005 with the input image size adjusted to 640 × 640 and a batch size of 16.
To assess the efficacy of the algorithm, we adopted the following hyperparameters: an initial learning rate of 0.01, a momentum of 0.937, a weight decay of 0.0005, an input image size resized to 640 × 640, and a batch size of 16. These hyperparameters were determined through multiple comparative experiments, and they proved to be nearly optimal choices for all models selected in this study.
5.2. Comparison with State-of-the-Art Methods on the ACD
To evaluate the effectiveness of the ACD dataset in the domain of airport detection and assess the performance of our proposed algorithm, we conducted experiments to compare our model with the current SOTA methods on the ACD dataset. As presented in Table 4, our TPH-YOLOv5-Air surpasses existing methods and achieves new SOTA results across all three evaluation metrics. Building upon TPH-YOLOv5++, our TPH-YOLOv5-Air further enhances the performance of these metrics, achieving SOTA results of 49.4%, 80.5%, and 53.8% for AP, AP50, and AP75, respectively. This represents improvements of 2%, 1.6%, and 2.4% compared to the previous best-performing method. In addition to the aforementioned metrics, the results demonstrate that TPH-YOLOv5-Air maintains a competitive fps rate, ensuring real-time processing capabilities suitable for practical applications in remote sensing scenarios. Moreover, our algorithm achieves excellent precision and recall scores, indicating its proficiency for accurate detection while minimizing false positives and negatives. Regarding the computational efficiency, TPH-YOLOv5-Air showcases promising results with relatively low Params and GFLOPs, making it a cost-effective solution for airport detection tasks.
Based on the results presented in Table 4, we observed that YOLOv5 exhibited a superior performance compared to YOLOv7 and TPH-YOLOv5. A closer analysis reveals that our ACD validation set encompasses diverse instances of confusing objects with varying spatial resolutions and sizes. It is likely that the architectural design and feature representation capabilities of YOLOv5 contributed to its exceptional performance in this context. These factors enable YOLOv5 to effectively capture the nuanced features and variations present in the challenging task of airport object detection.
However, it is important to highlight that our proposed TPH-YOLOv5-Air algorithm surpassed YOLOv5 in terms of its performance on the ACD validation set. This observation emphasizes the algorithm’s effectiveness in addressing the specific challenges associated with airport object detection in remote sensing scenes.
Furthermore, we extended our experiments to the publicly available remote sensing dataset NWPU VHR-10 [35]. The results, as presented in Table 5, demonstrate the effectiveness of our method with AP, AP50, and AP75 values of 62.0%, 89.8%, and 71.2%, respectively. These results surpass those of YOLOv5 and are comparable with those of YOLOv8. Moreover, we also observed slight improvements over other SOTA methods, such as the Faster R-CNN. These results highlight the generalization and robustness of our proposed method across various datasets and its competitive performance compared to SOTA methods.
5.3. Ablation Study
5.3.1. ASFF
To assess the effectiveness of the proposed algorithm, we conducted ablation experiments on the ASFF and SE modules, using TPH-YOLOv5++ as the baseline. The results of these experiments are presented in Table 6.
The performance of the TPH-YOLOv5-Air approach was validated on the remote sensing scene image datasets. Notably, a significant improvement in AP was observed, increasing from 47.4% to 49.4%. Further analysis revealed that the majority of this improvement can be attributed to the ASFF and APAM modules.
5.3.2. Loss Function
Various loss functions were experimented with to enhance the object detection performance. The CIoU loss considers overlap, size, and aspect ratio differences between the predicted and ground truth bounding boxes, resulting in a better localization accuracy and convergence speed. However, the imbalanced training sample distribution posed a challenge with fewer high-quality anchor boxes and more low-quality samples with significant errors. To address this, alternative loss functions such as EIOU loss, Focal loss, and Focal EIOU loss were explored. Table 7 shows that the Focal EIOU loss outperformed the others.
5.3.3. Fusion Method
In order to enhance the target detection effectiveness, we conducted ablation experiments on various post-processing methods. Weighted Box Fusion (WBF) is a post-processing technique used in object detection algorithms, which aims to fuse the detection results from multiple models to enhance the detection accuracy [36]. In Table 8, the results demonstrate that WBF exhibits a slightly better performance compared to NMS and Soft-NMS.
5.4. Visualization Experiment
This section encompasses the comprehensive findings derived from the visualization experiment conducted on the integrated model, which incorporates all of the employed techniques and methodologies.
5.4.1. Visualization of Heatmaps
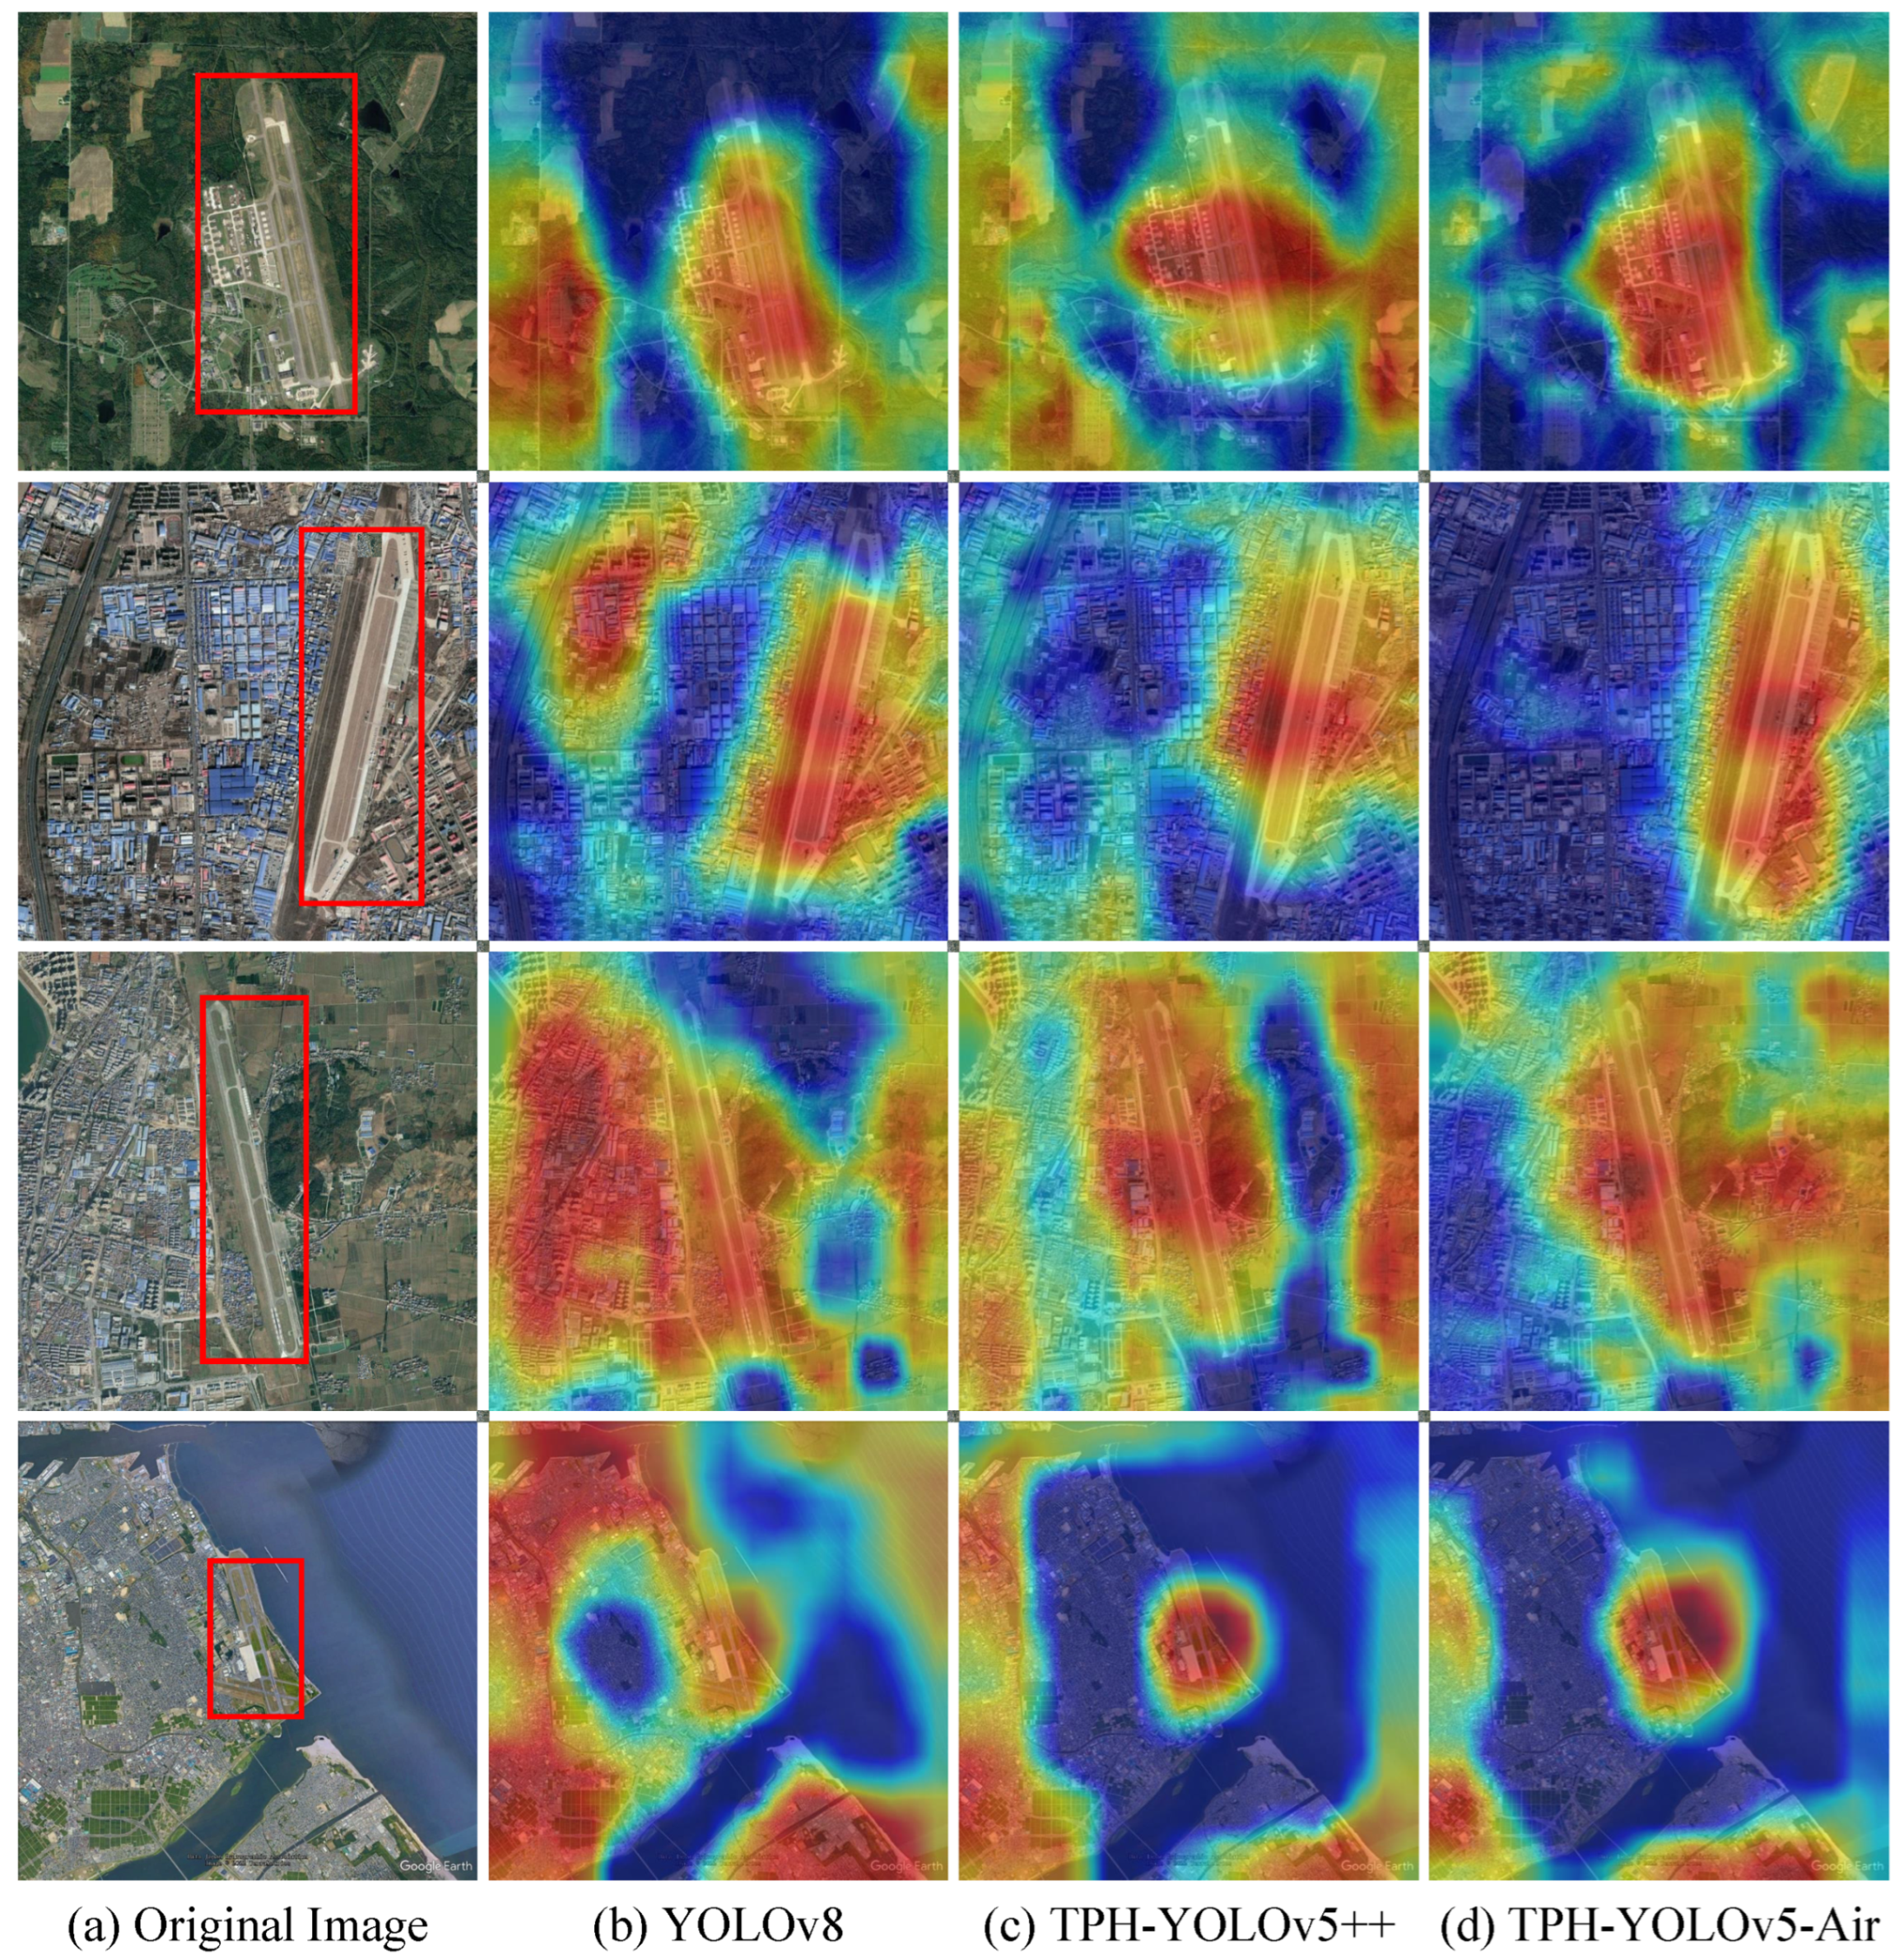
The generated heatmaps effectively capture and highlight the salient features of detected objects, providing a valuable tool for accurate object analysis and understanding. As illustrated in Figure 7, (a) represents the original image, while (b), (c), and (d) display the heatmaps generated by YOLOv8, TPH-YOLOv5++, and TPH-YOLOv5-Air, respectively. The heatmaps generated by YOLOv8 indicate the presence of a significant amount of background in the regions of interest. On the other hand, the heatmaps produced by TPH-YOLOv5++ demonstrate a strong focus on local regions but lack global attention. In contrast, TPH-YOLOv5-Air exhibits a superior performance in terms of both local and global attention.
5.4.2. Visualization between TPH-YOLOv5++ and TPH-YOLOv5-Air
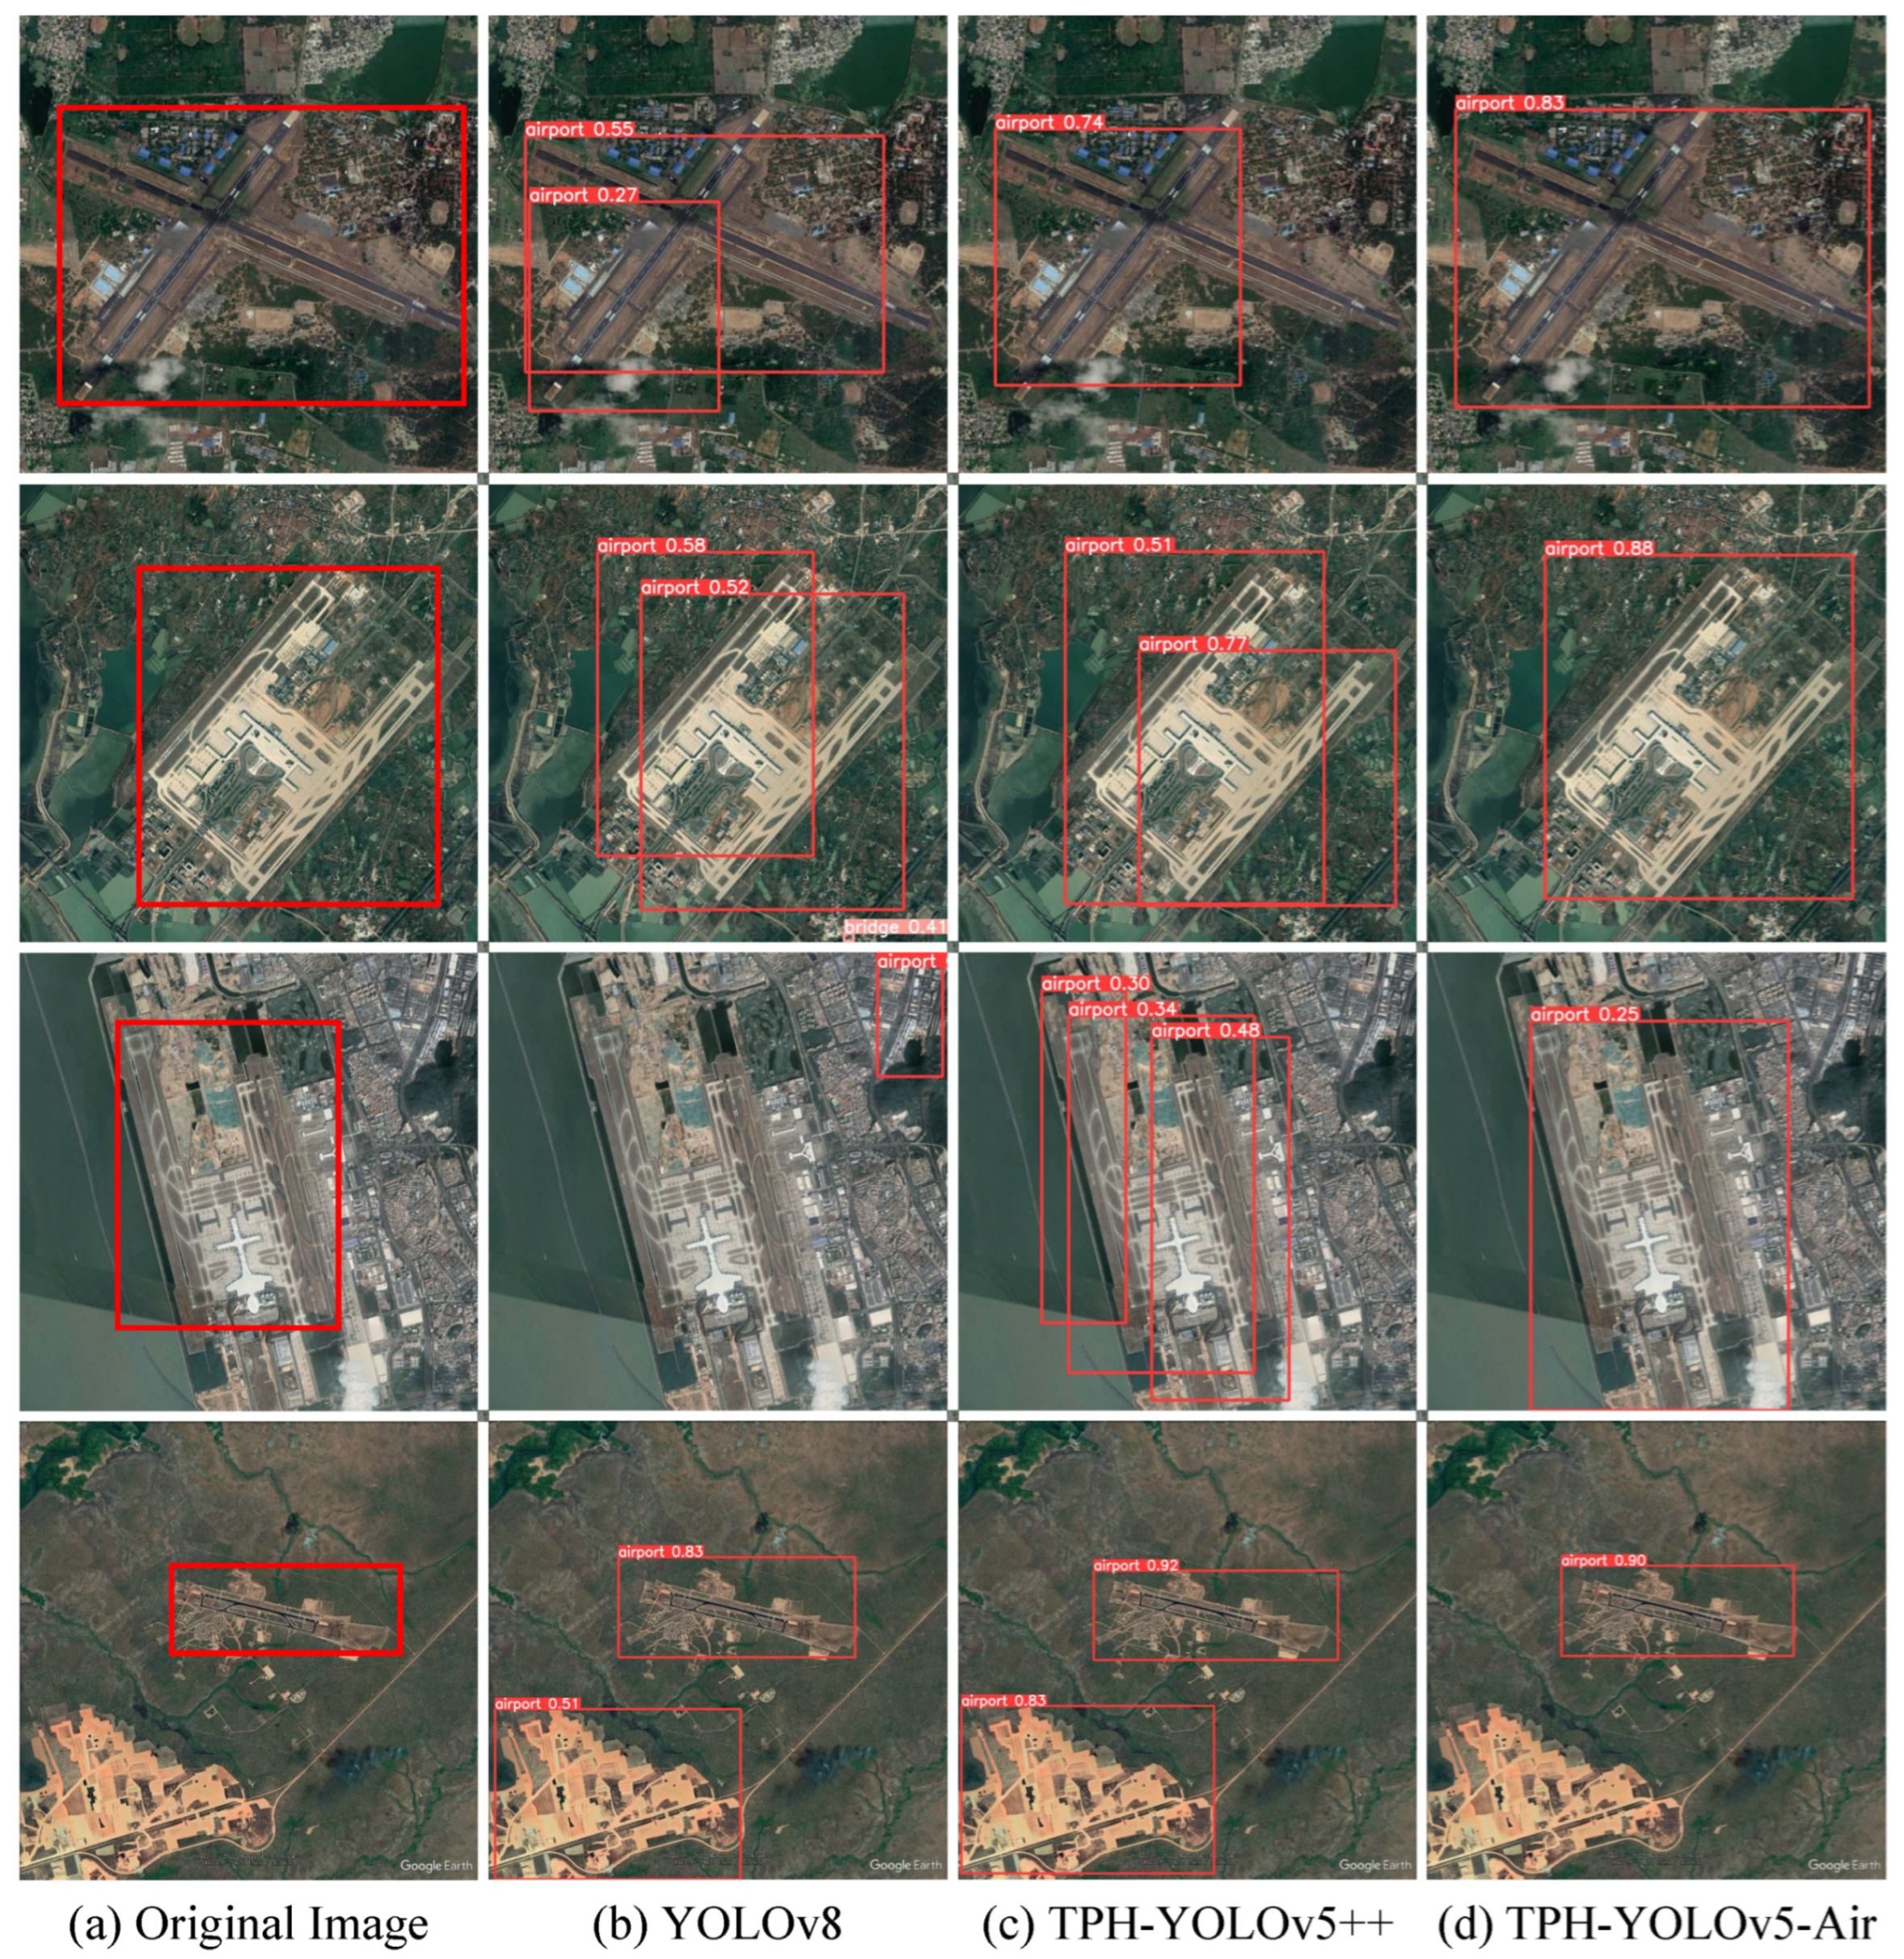
In order to provide a visual assessment of the effectiveness of TPH-YOLOv5-Air, we present visualizations of the predicted outcomes generated by both models on the ACD dataset. These visualizations are displayed in Figure 8. The visualization results vividly demonstrate the superiority, robustness, and adaptability of TPH-YOLOv5-Air in tackling the challenging task of airport target detection in complex remote sensing scenarios.
The experimental results clearly demonstrate the outstanding performance and quality of our method in handling challenging object detection tasks with complex backgrounds, diverse scales, and unique viewpoints. Notably, TPH-YOLOv5-Air excels in accurately localizing the objects of interest while providing a comprehensive portrayal of their spatial extent and intensity, thereby presenting a comprehensive characterization of their intrinsic attributes. These findings validate the efficacy and superiority of our methodology in addressing the intricacies inherent in remote sensing scene imagery, contributing to enhanced object detection and analysis in this domain.
As illustrated in Figure 8, (a) represents the original image, (b) displays the predictions from YOLOv8, (c) displays the predictions from TPH-YOLOv5++, and (d) showcases the predictions from TPH-YOLOv5-Air. The first comparison indicates that TPH-YOLOv8 exhibits false positive detections in complex backgrounds, while TPH-YOLOv5++ lacks precision in bounding box placement. The second comparison reveals that both YOLOv8 and TPH-YOLOv5++ mistakenly identify one airport as multiple instances. The third and fourth comparisons demonstrate the presence of various confusing objects in complex backgrounds, such as coastlines, roads, and bridges. In this scenario, TPH-YOLOv5-Air demonstrates higher robustness, whereas YOLOv8 and TPH-YOLOv5++ exhibit instances of missed detections. Additionally, TPH-YOLOv5-Air achieves higher confidence levels for target identification.
The visualized results provide compelling evidence of TPH-YOLOv5-Air’s superior performance, showcasing its ability to effectively handle the complexities associated with airport target detection in remote sensing scene imagery. These findings underscore the significant advancements achieved by our proposed model in terms of accuracy, robustness, and adaptability in this specific domain.
6. Conclusions
In this paper, we propose TPH-YOLOv5-Air, a novel airport detection network based on ASFF. We started by constructing the ACD, specifically designed for remote sensing scenarios, comprising 9501 instances of airport confusion objects. Based on our previous work on TPH-YOLOv5++, we incorporated the ASFF structure, which not only improved the feature extraction efficiency but also enriched the feature representation.Furthermore, we introduced an ASFF strategy based on the APAM, enhancing the feature scale invariance and improving the airport detection performance.
When evaluating TPH-YOLOv5-Air on the ACD dataset, it achieved a mean average precision (mAP) of 49.4%, demonstrating a 2% improvement over the previous TPH-YOLOv5++ and a 3.6% improvement over the original YOLOv5 network. Comparative experiments and ablation studies provided empirical evidence supporting the effectiveness of the proposed method in addressing detection errors and omissions of airport targets in airport scenes and thereby enhancing the detection accuracy of airport objects in complex backgrounds.These findings highlight its ability to handle the complexity associated with airport object detection in remote sensing scene imagery. The visualizations and analyses further validate the effectiveness and interpretability of TPH-YOLOv5-Air.
However, this method also has certain limitations. The experiments focused on only three types of confusing elements. Future work will expand the dataset to encompass a broader range of confounding objects for automatic identification and detection. Additionally, the model exhibits omissions in detecting extremely small-sized objects, necessitating further enhancements to improve its detection capabilities.
Author Contributions
Conceptualization, Q.W. and W.F.; methodology, Q.W., W.F. and B.L.; validation, Q.W. and W.F.; formal analysis, W.F. and Q.W.; writing—original draft preparation, W.F. and Q.W.; writing—review and editing, L.Y., B.L. and C.Z.; visualization, W.F., Q.W. and L.C.; supervision, Q.W., L.Y. and L.C.; funding acquisition, C.Z. All authors have read and agreed to the published version of the manuscript.
Funding
This work was supported by the National Natural Science Foundation of China (Grant No. 61901015) and the Sichuan Province Science and Technology Achievement Transformation Demonstration Project (Grant No. 2022ZHCG0060).
Data Availability Statement
Data are openly available in a public repository. The ACD dataset is available at ACD Dataset, accessed on 1 June 2023.
Acknowledgments
We express our sincere gratitude to the researchers behind TPH-YOLOv5 and TPH-YOLOv5++ for generously sharing their algorithm codes, which greatly facilitated the execution of our comparative experiments.
Conflicts of Interest
The authors declare no conflict of interest.
References
- Li, Z.; Wang, Y.; Zhang, N.; Zhang, Y.; Zhao, Z.; Xu, D.; Ben, G.; Gao, Y. Deep Learning-Based Object Detection Techniques for Remote Sensing Images: A Survey. Remote Sens. 2022, 14, 2385. [Google Scholar] [CrossRef]
- Siddiqui, Z.A.; Park, U. A Drone Based Transmission Line Components Inspection System with Deep Learning Technique. Energies 2020, 13, 3348. [Google Scholar] [CrossRef]
- Chen, F.; Ren, R.; Van de Voorde, T.; Xu, W.; Zhou, G.; Zhou, Y. Fast automatic airport detection in remote sensing images using convolutional neural networks. Remote Sens. 2018, 10, 443. [Google Scholar] [CrossRef] [Green Version]
- Song, G.; Wang, Z.; Bai, L.; Zhang, J.; Chen, L. Detection of oil wells based on Faster R-CNN in optical satellite remote sensing images. In Proceedings of the Conference on Image and Signal Processing for Remote Sensing, Online Only, UK, 21–25 September 2020. [Google Scholar]
- Wu, W.; Gao, X.; Fan, J.; Xia, L.; Luo, J.; Zhou, Y. Improved mask R-CNN-based cloud masking method for remote sensing images. Int. J. Remote Sens. 2020, 41, 8910–8933. [Google Scholar] [CrossRef]
- Wang, X.; Lv, Q.; Wang, B.; Zhang, L. Airport detection in remote sensing images: A method based on saliency map. Cogn. Neurodyn. 2013, 7, 143–154. [Google Scholar] [CrossRef] [Green Version]
- Xu, Y.; Zhu, M.; Li, S.; Feng, H.; Ma, S.; Che, J. End-to-End Airport Detection in Remote Sensing Images Combining Cascade Region Proposal Networks and Multi-Threshold Detection Networks. Remote Sens. 2018, 10, 1516. [Google Scholar] [CrossRef] [Green Version]
- Zhao, Q.; Liu, B.; Lyu, S.; Wang, C.; Zhang, H. TPH-YOLOv5++: Boosting Object Detection on Drone-Captured Scenarios with Cross-Layer Asymmetric Transformer. Remote Sens. 2023, 15, 1687. [Google Scholar] [CrossRef]
- Woo, S.; Park, J.; Lee, J.Y.; Kweon, I.S. Cbam: Convolutional block attention module. In Proceedings of the European Conference on Computer Vision (ECCV), Munich, Germany, 8–14 September 2018; pp. 3–19. [Google Scholar]
- Liu, S.; Huang, D.; Wang, Y. Learning Spatial Fusion for Single-Shot Object Detection. arXiv 2019, arXiv:1911.09516. [Google Scholar]
- Li, K.; Wan, G.; Cheng, G.; Meng, L.; Han, J. Object Detection in Optical Remote Sensing Images: A Survey and A New Benchmark. ISPRS J. Photogramm. Remote Sens. 2019, 159, 296–307. [Google Scholar] [CrossRef]
- Zhao, H.; Wang, B.; Feng, C.; Yu, J.; Li, X.; Gao, J. SAD: A Large-scale Dataset towards Airport Detection in Synthetic Aperture Radar Image. Remote Sens. 2021, 13, 2859. [Google Scholar]
- Chen, W.; Zhang, Z.; Yu, L.; Tai, Y. BARS: A benchmark for airport runway segmentation. Appl. Intell. 2023, 1. [Google Scholar] [CrossRef]
- Redmon, J.; Farhadi, A. YOLOv3: An incremental improvement. arXiv 2018, arXiv:1804.02767. [Google Scholar]
- Liu, S.; Huang, D.; Wang, Y. Receptive field block net for accurate and fast object detection. In Proceedings of the European Conference on Computer Vision (ECCV), Munich, Germany, 8–14 September 2018; pp. 385–400. [Google Scholar]
- Zhu, X.; Su, W.; Lu, L.; Li, B.; Dai, J. Deformable DETR: Deformable Transformers for End-to-End Object Detection. arXiv 2020, arXiv:2010.04159. [Google Scholar]
- Lecrosnier, L.; Khemmar, R.; Ragot, N.; Decoux, B.; Rossi, R.; Kefi, N.; Ertaud, J.Y. Deep learning-based object detection, localisation and tracking for smart wheelchair healthcare mobility. Int. J. Environ. Res. Public Health 2021, 18, 91. [Google Scholar] [CrossRef]
- Xu, G.; Khan, A.S.; Moshayedi, A.J.; Zhang, X.; Shuxin, Y. The Object Detection, Perspective and Obstacles In Robotic: A Review. EAI Endorsed Trans. Robot. 2022, 1, e13. [Google Scholar] [CrossRef]
- Luo, W.; Yang, B.; Urtasun, R. Fast and Furious: Real Time End-to-End 3D Detection, Tracking and Motion Forecasting with a Single Convolutional Net. In Proceedings of the 2018 IEEE/CVF Conference on Computer Vision and Pattern Recognition (CVPR), Salt Lake City, UT, USA, 18–22 June 2018. [Google Scholar]
- Lin, T.-Y.; Dollar, P.; Girshick, R.; He, K.; Hariharan, B.; Belongie, S. Feature Pyramid Networks for Object Detection. arXiv 2017, arXiv:1612.03144. [Google Scholar]
- Chen, K.; Pang, J.; Wang, J.; Xiong, Y.; Li, X.; Sun, S.; Feng, W.; Liu, Z.; Shi, J.; Ouyang, W.; et al. Hybrid task cascade for instance segmentation. In Proceedings of the IEEE/CVF Conference on Computer Vision and Pattern Recognition, Long Beach, CA, USA, 15–20 June 2019; pp. 4974–4983. [Google Scholar]
- Girshick, R. Fast R-CNN. In Proceedings of the IEEE International Conference on Computer Vision (ICCV), Santiago, Chile, 7–13 December 2015. [Google Scholar]
- Cai, Z.; Vasconcelos, N. Cascade r-cnn: Delving into high quality object detection. In Proceedings of the IEEE Conference on Computer Vision and Pattern Recognition, Salt Lake City, UT, USA, 18–23 June 2018; pp. 6154–6162. [Google Scholar]
- Ge, Z.; Liu, S.; Wang, F.; Li, Z.; Sun, J. YOLOX: Exceeding YOLO Series in 2021. arXiv 2021, arXiv:2107.08430. [Google Scholar]
- Law, H.; Deng, J. Cornernet: Detecting objects as paired keypoints. In Proceedings of the European Conference on Computer Vision, Munich, Germany, 8–14 September 2018. [Google Scholar]
- Liang, W.; Wu, Y.; Li, M.; Cao, Y.; Hu, X. High-Resolution SAR Image Classification Using Multi-Scale Deep Feature Fusion and Covariance Pooling Manifold Network. Remote Sens. 2021, 13, 328. [Google Scholar] [CrossRef]
- Ye, T.; Qin, W.; Li, Y.; Wang, S.; Zhang, J.; Zhao, Z. Dense and Small Object Detection in UAV-Vision Based on a Global-Local Feature Enhanced Network. IEEE Trans. Instrum. Meas. 2022, 71. [Google Scholar] [CrossRef]
- Lin, T.Y.; Goyal, P.; Girshick, R.; He, K.; Dollár, P. Focal Loss for Dense Object Detection. In Proceedings of the 2017 IEEE International Conference on Computer Vision (ICCV), Venice, Italy, 22–29 October 2017; pp. 2999–3007. [Google Scholar]
- Li, B.; Liu, Y.; Wang, X. Gradient Harmonized Single-Stage Detector. Proc. Aaai Conf. Artif. Intell. 2020, 33, 8577–8584. [Google Scholar] [CrossRef] [Green Version]
- Shrivastava, A.; Gupta, A.; Girshick, R. Training Region-based Object Detectors with Online Hard Example Mining. In Proceedings of the Conference on Computer Vision and Pattern Recognition (CVPR), Las Vegas, NV, USA, 27–30 June 2016; pp. 761–769. [Google Scholar]
- Everingham, M.; Van Gool, L.; Williams, C.K.I.; Winn, J.; Zisserman, A. The Pascal Visual Object Classes (VOC) Challenge. Int. J. Comput. Vis. 2009, 88, 303–338. [Google Scholar] [CrossRef] [Green Version]
- Lin, T.Y.; Maire, M.; Belongie, S.; Hays, J.; Zitnick, C.L. Microsoft COCO: Common Objects in Context; Springer International Publishing: Berlin/Heidelberg, Germany, 2014. [Google Scholar]
- Wang, Y.; Pan, L. Automatic Airport Recognition Based on Saliency Detection and Semantic Information. ISPRS Int. J. -Geo-Inf. 2016, 5, 115. [Google Scholar] [CrossRef] [Green Version]
- Wang, X.; Wang, B.; Zhang, L. Airport detection in remote sensing images based on visual attention. In Proceedings of the Neural Information Processing: 18th International Conference, ICONIP 2011, Shanghai, China, 13–17 November 2011; Proceedings, Part III. Springer: Berlin/Heidelberg, Germany, 2011; pp. 475–484. [Google Scholar]
- Cheng, G.; Han, J.; Zhou, P.; Guo, L. Multi-class geospatial object detection and geographic image classification based on collection of part detectors. ISPRS J. Photogramm. Remote Sens. 2014, 98, 119–132. [Google Scholar] [CrossRef]
- Solovyev, R.; Wang, W.; Gabruseva, T. Weighted boxes fusion: Ensembling boxes from different object detection models. Image Vis. Comput. 2021, 107, 104117. [Google Scholar] [CrossRef]
Figure 1.
The task of detecting objects in airport scenes using remote sensing scene imagery poses significant challenges.
Figure 1.
The task of detecting objects in airport scenes using remote sensing scene imagery poses significant challenges.

Figure 2.
Samples of annotated images in the ACD.

Figure 3.
Samples of complex backgrounds in the ACD. The red box shows the labeled location of the airport.
Figure 3.
Samples of complex backgrounds in the ACD. The red box shows the labeled location of the airport.

Figure 4.
Network structure diagram of TPH-YOLOv5.

Figure 5.
The network structure diagram of TPH-YOLOv5-Air. It is noteworthy that TPH-YOLOv5-Air omits the additional probe head introduced in TPH-YOLOv5.
Figure 5.
The network structure diagram of TPH-YOLOv5-Air. It is noteworthy that TPH-YOLOv5-Air omits the additional probe head introduced in TPH-YOLOv5.

Figure 6.
Adaptive parameter adjustment module.

Figure 7.
Comparison of original images and heatmaps for complex background and scale-variant images. The red box shows the labeled location of the airport.
Figure 7.
Comparison of original images and heatmaps for complex background and scale-variant images. The red box shows the labeled location of the airport.

Figure 8.
A visualization of the prediction results obtained by TPH-YOLOv5++ and TPH-YOLOv5-Air on the ACD dataset is presented for analysis. The red box shows the labeled location of the airport.
Figure 8.
A visualization of the prediction results obtained by TPH-YOLOv5++ and TPH-YOLOv5-Air on the ACD dataset is presented for analysis. The red box shows the labeled location of the airport.


Table 1.
Image Collection of the ACD.
| Dataset | Source | Number of Images | Instance | Image Size | Resolution |
|---|---|---|---|---|---|
| ACD | DIOR | 4359 | 7501 | 800 × 800 | 0.5∼30 m |
| Google Earth | 2000 | 2000 | 800 × 800∼1024 × 1024 | 20∼50 m |
Table 2.
Various Sizes of Airport Targets.
| Intervals | Small | Middle | Large |
|---|---|---|---|
| Proportion | 47.7% | 37.5% | 14.8% |
Table 3.
Various Aspect Ratios of Airports.
| Range | (0, 1) | [1, 2) | [2, 3) | [3, 38.4] |
|---|---|---|---|---|
| Proportion | 44.3% | 34.2% | 12.3% | 9.2% |
Table 4.
The results of our method and the current SOTA method on the ACD validation set.
| Method | AP [%] | AP50 [%] | AP75 [%] | Precision [%] | Recall [%] | Params | GFLOPs | fps |
|---|---|---|---|---|---|---|---|---|
| RetinaNet | 42.6 | 61.7 | 27.8 | 77.8 | 65.7 | 38.0 M | 150.0 | 17.0 |
| Faster R-CNN | 40.2 | 59.6 | 25.5 | 75.5 | 67.9 | 41.4 M | 134.0 | 5.0 |
| YOLOv5 | 45.8 | 77.9 | 50.2 | 81.8 | 72.6 | 7.0 M | 16.0 | 25.1 |
| YOLOv7 | 40.4 | 70.9 | 41.5 | 75.3 | 65.1 | 37.2 M | 105.1 | 18.3 |
| YOLOv8 | 47.1 | 77.9 | 48.1 | 81.9 | 72.2 | 11.1 M | 28.7 | 48.8 |
| TPH-YOLOv5 | 44.6 | 77.4 | 49.1 | 80.6 | 70.2 | 7.3 M | 25.2 | 20.3 |
| TPH-YOLOv5++ | 47.4 | 78.9 | 51.4 | 83.8 | 75.6 | 15.4 M | 16.5 | 27.6 |
| TPH-YOLOv5-Air | 49.4 | 80.5 | 53.8 | 85 | 74.4 | 15.8 M | 16.7 | 24.4 |
Table 5.
Results of our method and current SOTA methods on NWPU VHR-10.
| Method | AP [%] | AP50 [%] | AP75 [%] |
|---|---|---|---|
| Faster R-CNN | 56.5 | 86.5 | 66.9 |
| YOLOv5 | 57.1 | 88.2 | 69.7 |
| YOLOv8 | 62.7 | 90.5 | 72.3 |
| TPH-YOLOv5-Air | 62.0 | 89.8 | 71.2 |
Table 6.
Comparison of ASFF and other fusion methods.
| Methods | AP [%] | AP50 [%] | AP75 [%] | Params | GFLOPs |
|---|---|---|---|---|---|
| Baseline | 47.4 | 78.9 | 51.4 | 15.4 M | 16.5 |
| Baseline+ASFF | 48.5 | 79.2 | 51.3 | 15.6 M | 16.6 |
| Baseline+same weight | 48.7 | 79.5 | 51.2 | 15.4 M | 16.5 |
| Baseline+ASFF+APAM | 49.4 | 80.5 | 53.8 | 15.8 M | 16.7 |
Table 7.
Different loss functions.
| Loss Function | AP [%] | AP50 [%] | AP75 [%] |
|---|---|---|---|
| CIoU Loss | 48.5 | 79.4 | 52.6 |
| EIOU Loss | 49.2 | 79.5 | 52.7 |
| Focal Loss | 49.1 | 79.8 | 53.1 |
| Focal EIOU Loss | 49.4 | 80.5 | 53.8 |
Table 8.
Different post-processing methods.
| Fusion Function | AP [%] | AP50 [%] | AP75 [%] |
|---|---|---|---|
| NMS | 49.3 | 79.8 | 52.9 |
| Soft NMS | 49.1 | 80.2 | 53.5 |
| WBF | 49.4 | 80.5 | 53.8 |
Disclaimer/Publisher’s Note: The statements, opinions and data contained in all publications are solely those of the individual author(s) and contributor(s) and not of MDPI and/or the editor(s). MDPI and/or the editor(s) disclaim responsibility for any injury to people or property resulting from any ideas, methods, instructions or products referred to in the content. |
© 2023 by the authors. Licensee MDPI, Basel, Switzerland. This article is an open access article distributed under the terms and conditions of the Creative Commons Attribution (CC BY) license (https://creativecommons.org/licenses/by/4.0/).
Share and Cite
MDPI and ACS Style
Wang, Q.; Feng, W.; Yao, L.; Zhuang, C.; Liu, B.; Chen, L. TPH-YOLOv5-Air: Airport Confusing Object Detection via Adaptively Spatial Feature Fusion. Remote Sens. 2023, 15, 3883. https://doi.org/10.3390/rs15153883
AMA Style
Wang Q, Feng W, Yao L, Zhuang C, Liu B, Chen L. TPH-YOLOv5-Air: Airport Confusing Object Detection via Adaptively Spatial Feature Fusion. Remote Sensing. 2023; 15(15):3883. https://doi.org/10.3390/rs15153883
Chicago/Turabian StyleWang, Qiang, Wenquan Feng, Lifan Yao, Chen Zhuang, Binghao Liu, and Lijiang Chen. 2023. "TPH-YOLOv5-Air: Airport Confusing Object Detection via Adaptively Spatial Feature Fusion" Remote Sensing 15, no. 15: 3883. https://doi.org/10.3390/rs15153883
Note that from the first issue of 2016, this journal uses article numbers instead of page numbers. See further details here.