Article

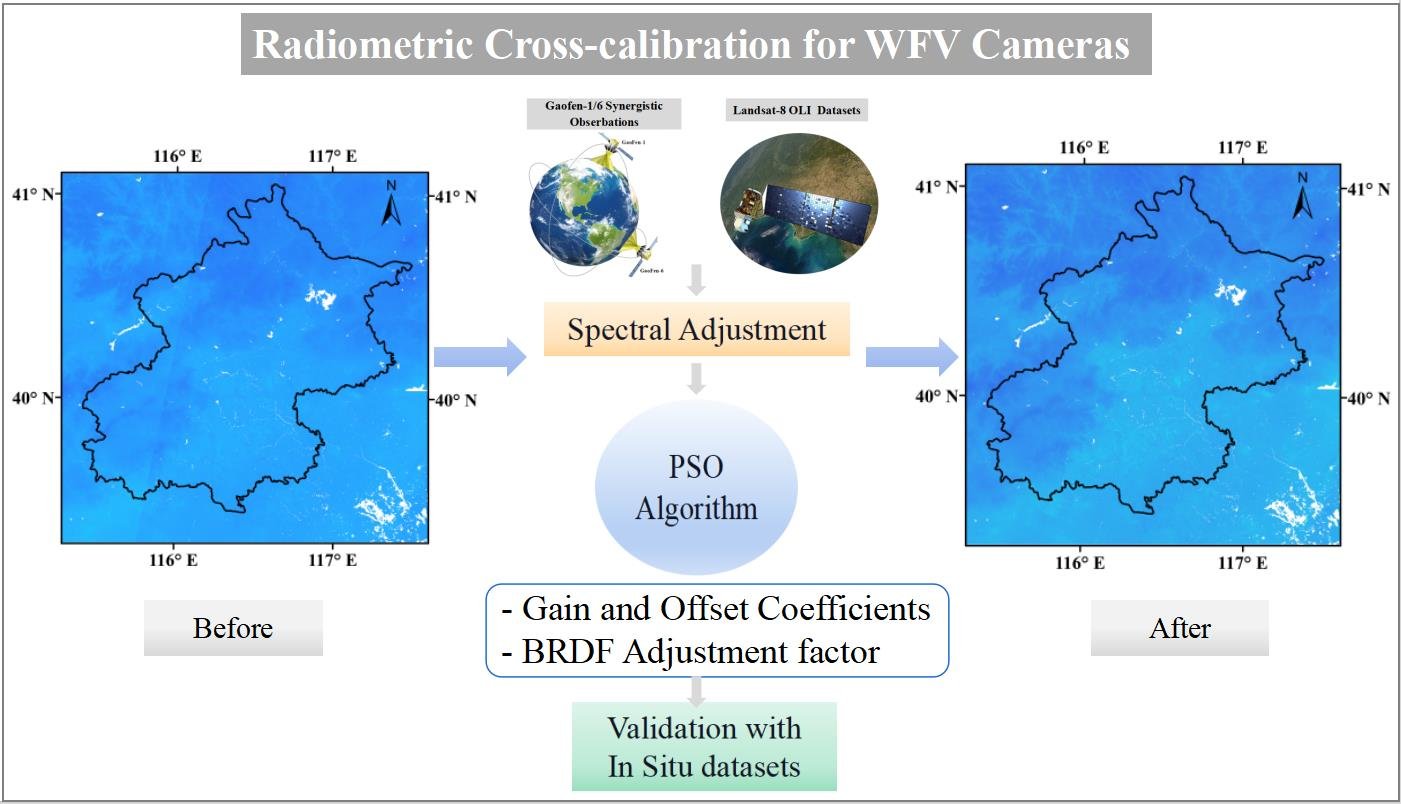
Radiometric Cross-Calibration of Wide-Field-of-View Cameras Based on Gaofen-1/6 Satellite Synergistic Observations Using Landsat-8 Operational Land Imager Images: A Solution for Off-Nadir Wide-Field-of-View Associated Problems

1
State Key Laboratory of Information Engineering in Surveying, Mapping and Remote Sensing, Wuhan University, Wuhan 430079, China
2
School of Computer Science, Hubei University of Technology, Wuhan 430068, China
3
The Northwest Institute of Eco-Environment and Resources (NIEER), Chinese Academy of Sciences (CAS), Lanzhou 730000, China
*
Author to whom correspondence should be addressed.
Remote Sens. 2023, 15(15), 3851; https://doi.org/10.3390/rs15153851
Submission received: 3 July 2023 / Revised: 30 July 2023 / Accepted: 31 July 2023 / Published: 2 August 2023

Abstract

:
The Gaofen-1 satellite is equipped with four wide-field-of-view (WFV) instruments, enabling an impressive spatial resolution of 16 m and a combined swath exceeding 800 km. These WFV images have shown their valuable applications across diverse fields. However, achieving accurate radiometric calibration is an essential prerequisite for establishing reliable connections between satellite signals and biophysical, as well as biochemical, parameters. However, observations with large viewing angles (>20°) pose new challenges due to the bidirectional reflectance distribution function (BRDF) effect having a pronounced impact on the accuracy of cross-radiation calibrations, especially for the off-nadir WFV1 and WFV4 cameras. To overcome this challenge, a novel approach was introduced utilizing the combined observations from the Gaofen-1 and Gaofen-6 satellites, with Landsat-8 OLI serving as a reference sensor. The key advantage of this synergistic observation strategy is the ability to obtain a greater number of image pairs that closely resemble Landsat-8 OLI reference images in terms of geometry and observation dates. This increased availability of matching images ensures a more representative dataset of the observation geometry, enabling the derived calibration coefficients to be applicable across various sun–target–sensor geometries. Then, the geometry angles and bidirectional reflectance information were put into a Particle Swarm Optimization (PSO) algorithm incorporating radiative transfer modeling. This PSO-based approach formulates cross-calibration as an optimization problem, eliminating the reliance on complex BRDF models and satellite-based BRDF products that can be affected by cloud contamination. Extensive validation experiments involving satellite data and in situ measurements demonstrated an average uncertainty of less than eight percent for the proposed cross-radiation calibration scheme. Comparisons of top-of-atmosphere (TOA) results calibrated using our proposed scheme, the previous traditional radiative transfer modeling using MODIS BRDF products for BRDF correction (RTM-BRDF) method, and official coefficients reveal the superior accuracy of our method. The proposed scheme achieves a 36.99% decrease in root mean square error (RMSE) and a 38.13% increase in mean absolute error (MAE) compared to official coefficients. Moreover, it achieves comparable accuracy to the RTM-BRDF method while eliminating the need for MODIS BRDF products, with a decrease in RMSE exceeding 14% for the off-nadir WFV1 and WFV4 cameras. The results substantiate the efficacy of the proposed scheme in enhancing cross-calibration accuracy by improving image match-up selection, efficiently removing BRDF effects, and expanding applicability to diverse observation geometries.

Graphical Abstract

1. Introduction

In recent years, Gaofen-1 satellite images have been widely used for a wide range of applications, including environmental conservation, disaster management, and urban development [1,2,3]. However, to ensure an accurate interpretation of these satellite signals and derive meaningful biophysical and biochemical parameters, precise radiometric calibration is of utmost importance. The radiometric calibration process should strive to achieve an absolute standard deviation of less than three percent, ensuring high accuracy and reliability in the derived measurements [4,5]. There are two approaches to radiometric correction, namely, absolute and relative calibrations [6,7]. Relative radiometric correction is an inter-image relative operation, which does not require the absolute correctness of the radiometric properties of the multi-temporal image, but only the relative consistency of the radiometric properties of the image to be corrected with the reference image, and therefore is mainly applied in change detection and time series analyses since it deals with images which have to be compared [8]. Absolute radiometric calibration enables the conversion of image digital numbers (DN) to at-sensor spectral radiance and top-of-atmosphere (TOA) reflectance, fundamental steps to compare products from different sensors [9]. There are generally three kinds of methods for conducting post-launch absolute radiometric calibrations: lunar and vicarious calibrations, and cross-calibrations [10]. First, the lunar calibration approach uses the Moon as a calibration source for sensors in orbit, and there are some shortcomings, such as the limited dynamic range, non-Lambertian reflectance, and variations in the distance of sensors to the Moon [11]. Vicarious calibration uses natural reference targets for instrument calibration coincident with a satellite overpass, and it is commonly employed to meet the accuracy requirements; however, it has limitations, such as being labor-intensive and constrained in terms of spatial coverage [12,13,14]. To address these challenges, cross-calibration approaches have been developed as a cost-effective and more frequent alternative. These methods capitalize on the utilization of a meticulously calibrated satellite sensor, such as Landsat 8 OLI or MODIS, which serves as a reliable calibration reference for the implementation of these techniques. These methods leverage the availability of a satellite sensor that is well calibrated, such as Landsat 8 OLI or MODIS, to serve as a reliable calibration reference [15,16,17,18], thereby providing unique advantages over vicarious calibration. Cross-calibration approaches have been successfully implemented in various remote-sensing instruments, including Sentinel-2 [19,20,21], HJ-1 [22,23], Gaofen-1 [24,25,26,27], Gaofen-4 [21,28,29,30], and Gaofen-6 [31,32,33].
The wide-field-of-view (WFV) imagers onboard Gaofen-1 possess a high spatial resolution of 16 m and a combined scanning swath of over 800 km [26,34]. The close-nadir cameras on Gaofen-1 (WFV2 and WFV3) have a viewing zenith angle range of 0° to 24°, while the off-nadir cameras (WFV1 and WFV4) have a range of 24° to 40° [35,36,37]. These viewing zenith angle ranges are considerably larger compared to the nadir-observing Landsat series sensors and other instruments, particularly for WFV1 and WFV4. The large viewing angles have a notable impact on atmospheric radiative transfer and the surface bidirectional reflectance distribution function (BRDF) [38,39]. The off-nadir WFV cameras exhibit a significant increase in atmospheric path reflectance, surpassing 20% when compared to the nadir view. This difference becomes even more pronounced for wider zenith viewing angles (>20°) due to the longer distance traveled through the atmosphere. As larger viewing angles are employed, the anisotropic reflection of surface targets becomes more prominent, resulting in higher errors in calibration coefficients due to the BRDF effect. Neglecting the BRDF in cross-calibration for sensors with large viewing angles can result in calibration coefficients with errors exceeding twofold [25,38], further affecting calibration-related applications and research. Therefore, it is meaningful and necessary to prioritize the development of a cross-calibration scheme that specifically takes into account the influence of large angles. This scheme will be instrumental in enhancing the availability and reliability of data acquired from sensors with large viewing angles.
The disparities in calibration coefficients obtained through cross-calibration methods can be explained by the influence of large viewing angles and the corresponding BRDF effects. Consequently, addressing accuracy issues related to large viewing angles necessitates the improvement of BRDF effect correction. Previous studies have primarily relied on MODIS BRDF products for correcting unequal BRDF effects [24,40]. However, the utilization of this method is limited by the unavailability of BRDF products for calibration areas due to cloud contamination. The establishment of BRDF lookup tables (LUTs) proved invaluable for radiometric cross-calibration of satellite sensors in situations where BRDF products were unavailable [39]. However, there are notable differences in terms of spatial resolution and spectral bands between MODIS and the Landsat-8 OLI and Gaofen-1 WFV instruments. As an alternative to using MODIS BRDF products, global searching (GS) algorithms [25,38] have been employed to derive calibration coefficients while considering BRDF effects. Nonetheless, these methods have only been applied to Gaofen-1 WFV1 and Gaofen-4 PMS, and a comprehensive analysis of the accuracy of the cross-radiation calibration scheme for all WFVs of Gaofen-1 is yet to be discussed. Apart from BRDF effect correction, the selection of satellite-based data for cross-calibration has also been a topic of discussion to address the challenges associated with large viewing angles. The core objective of cross-calibration is to ensure that the sensor and reference sensor image pairs exhibit similar time and observation geometries, as well as favorable atmospheric conditions, which greatly influence the accuracy of the cross-calibration process [27]. In this context, a novel radiometric cross-calibration method was proposed for Gaofen-1 PMS, focusing on improving the identification of images with good atmospheric conditions. The method involved constructing a BRDF model based on the top-of-atmosphere (TOA) radiance of MODIS extracted from long time-series sunny days, utilizing the TOA bright temperature and the variation coefficients of TOA radiance [27]. Additionally, the data quality of the selected regions of interest (ROIs) was also considered. To mitigate errors caused by the substantial differences in spatial resolution between Landsat-8 OLI and MODIS, Lu et al. adopted a strategy of selecting uniform pixels while performing a cross-radiation calibration of Gaofen-4. This approach involved calculating BRDF correction coefficients [41].
However, the adequacy of the number of image pairs and the representativeness of the sun–sensor geometry used for BRDF effect correction has not been addressed. Considering that the observation data from various satellite sensors exhibit complementary strengths in terms of spatiotemporal integrity and data availability, combining similar sensors has the potential to provide a larger number of image pairs that meet the requirements of cross-radiation. The launch of Gaofen-6 in June 2018, operating in conjunction with the Gaofen-1 satellite, has significantly reduced the revisit interval [42]. This synergistic observation capability allows for a revisiting period of approximately two days near the equator and around one day at mid to high latitudes. As a result, it becomes possible to obtain a wider range of sun–sensor geometries for randomly selected ROIs during cross-calibration. This enhancement is beneficial in acquiring more representative large-angle sun–sensor geometries, thereby enhancing the reliability and universality of cross-calibration coefficients across a wider range of angles. Nevertheless, the existence of spectral response discrepancies between different multispectral satellite sensors is a common issue stemming from inherent differences during sensor manufacturing. This issue cannot be ignored, particularly when dealing with the eight WFV sensors onboard the Gaofen-1/6 satellites, as ensuring consistency and reliability in radiative response accuracy is paramount. The variations in relative spectral responses (RSRs) among these sensors can lead to different observations of the same target. To compensate for the inherent offsets caused by RSR mismatches between two sensors, a spectral band adjustment factor (SBAF) can be utilized [43,44]. The SBAF incorporates the spectral profile of the target and the RSRs of the two sensors, thus facilitating accurate spectral calibration.
The primary objective of this study is to develop a radiometric cross-calibration scheme specifically designed to overcome the challenges posed by large viewing angles in Gaofen WFV instruments. The proposed scheme utilizes synergistic observations from the Gaofen-1/6 satellites and employs the particle swarm optimization (PSO) algorithm [45] with Landsat-8 OLI as the reference sensor. To be specific, the synergistic observations of the Gaofen-1 and Gaofen-6 satellites have made improvements in providing a more comprehensive and representative range of sun–target–sensor geometries for BRDF effect correction, enabling calibration coefficients to be applicable across a wider range of observation geometries, specifically targeting large viewing angles. Moreover, by integrating the PSO algorithm, the scheme effectively searches for calibration coefficients while considering the BRDF effect, eliminating the need for unobtainable MODIS BRDF products due to cloud contamination and addressing the issue of coarse spatial resolution for WFV sensors. Additionally, the PSO algorithm optimizes calibration coefficients on a per-ROI basis, ensuring improved accuracy and reliability by avoiding ROIs with significant biases. Furthermore, the study evaluates the uncertainties associated with the obtained cross-calibration coefficients by combing both in situ data and satellite images, facilitating a rigorous assessment of the effectiveness of the scheme. This approach is valuable in establishing the link between satellite signals and various biochemical characteristics, enhancing our understanding of complex environmental processes.

2. Study Area and Data Selection
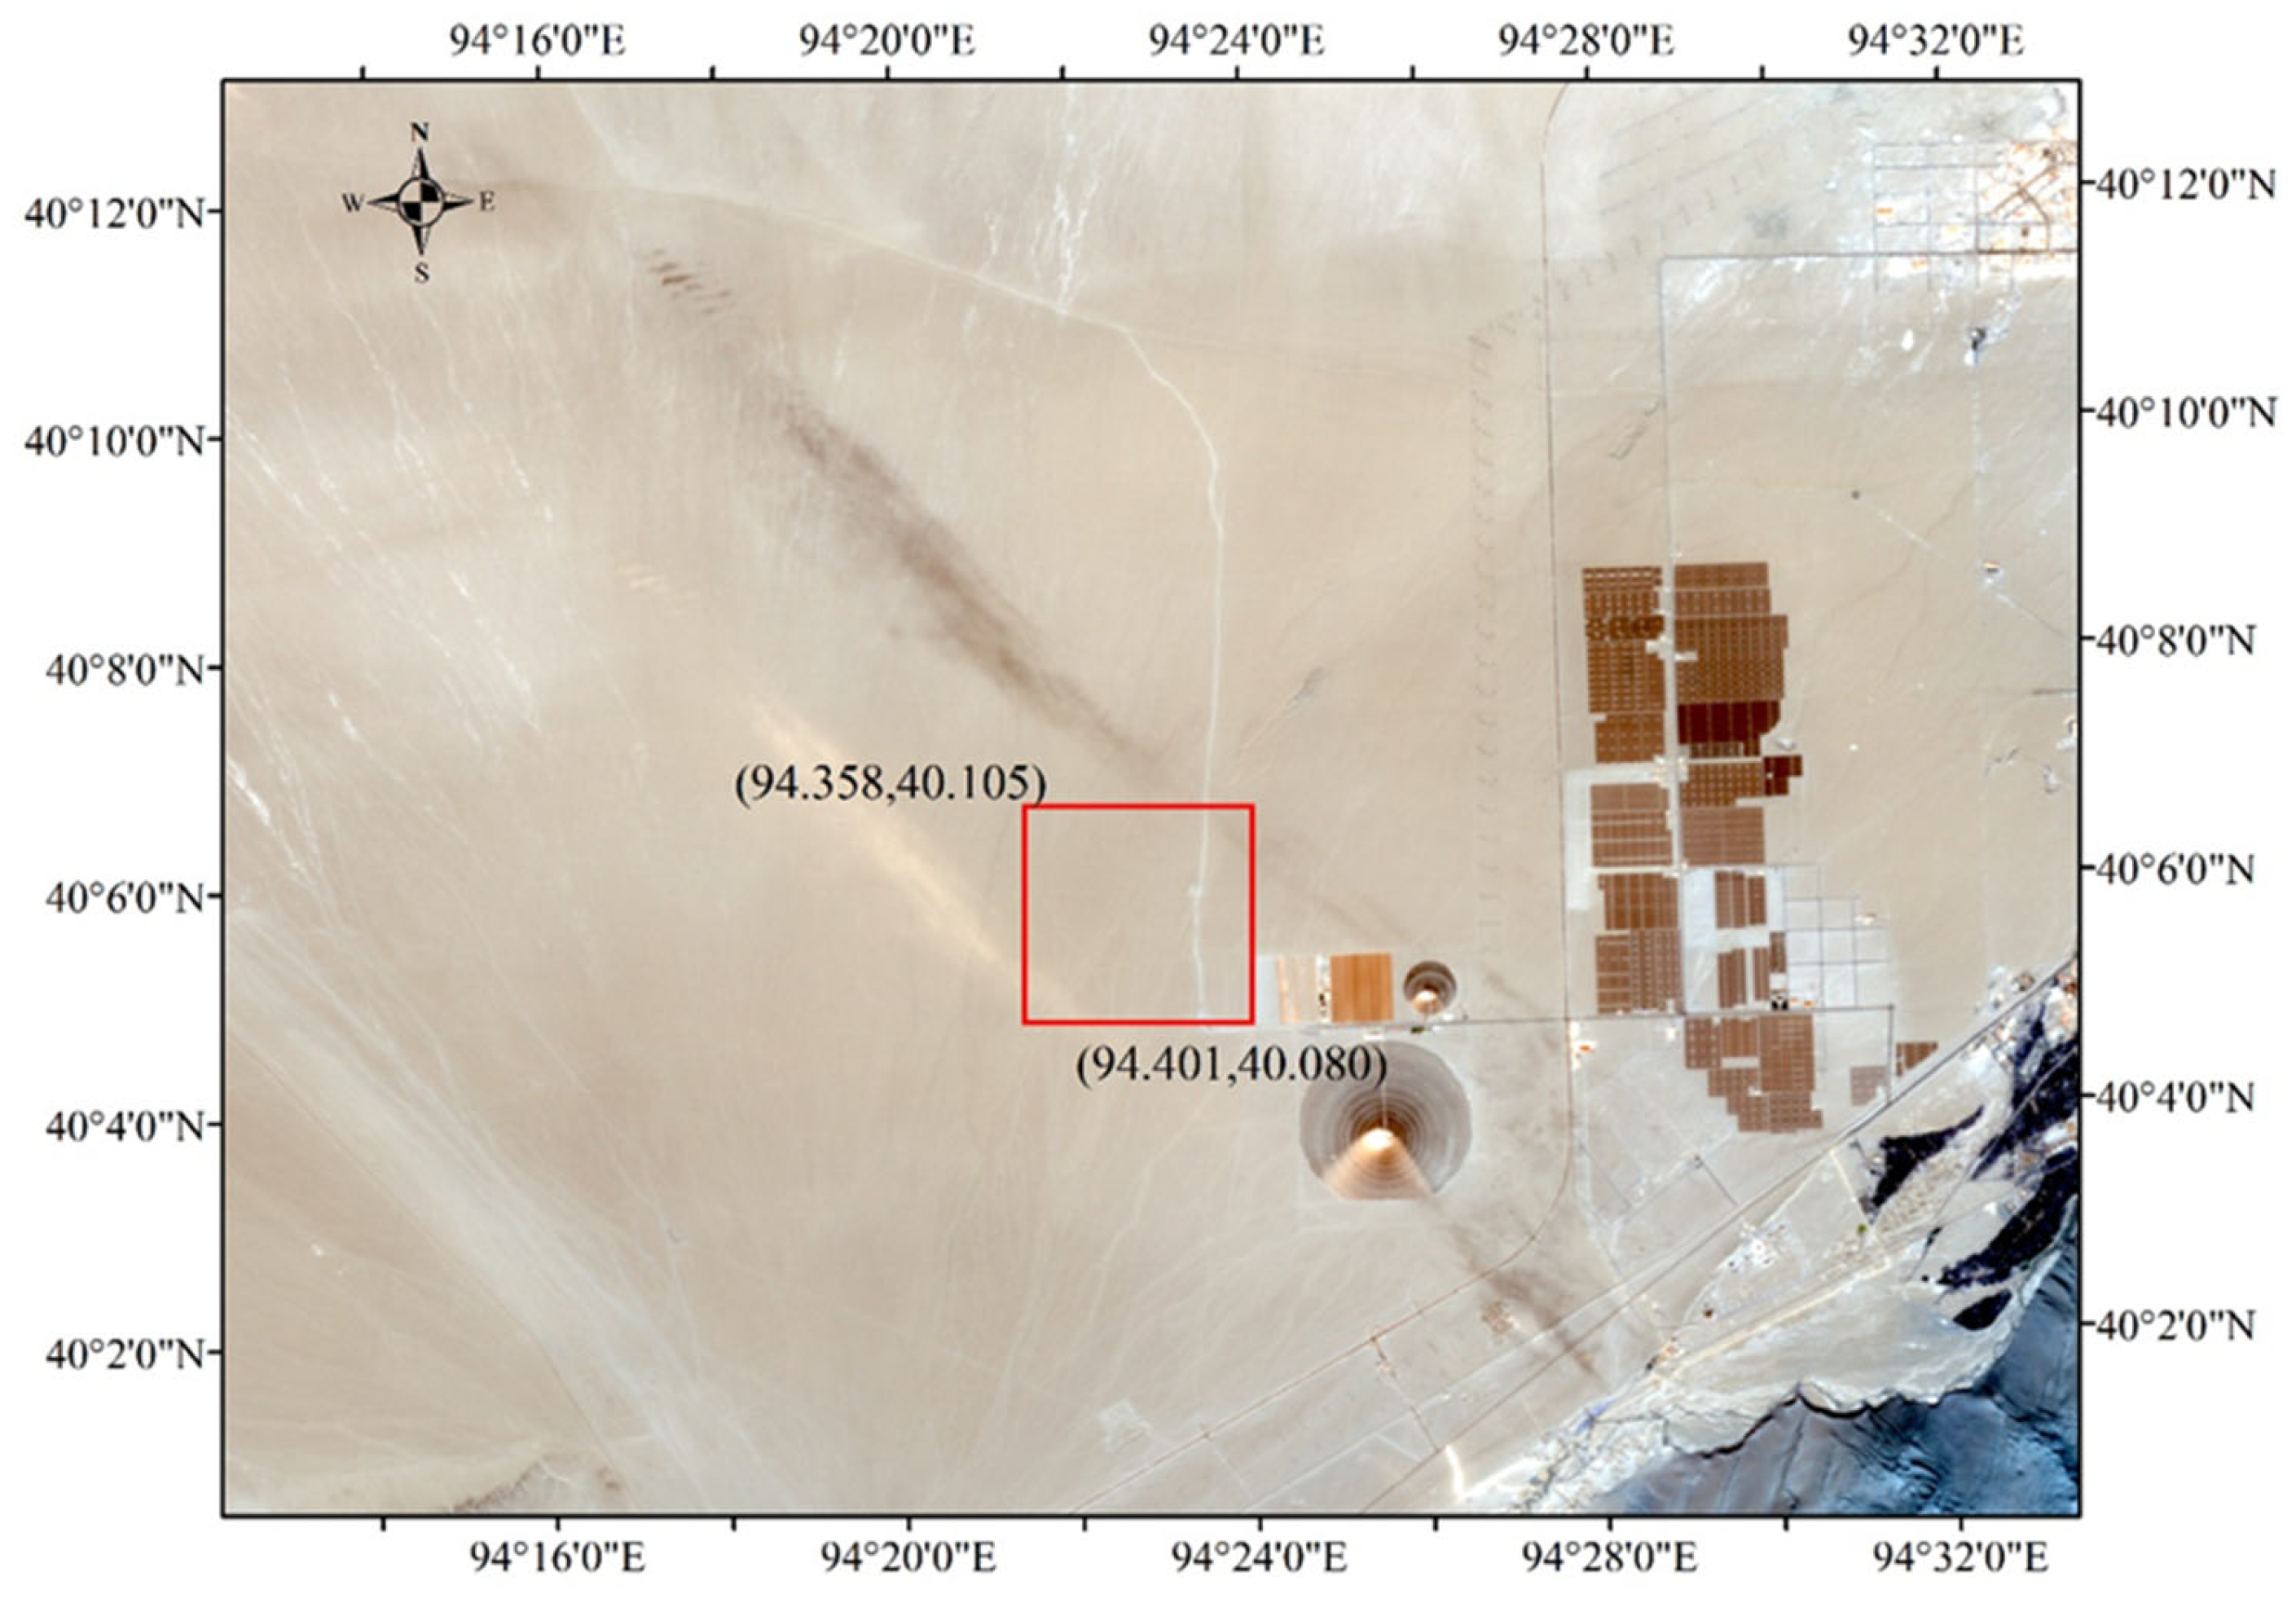
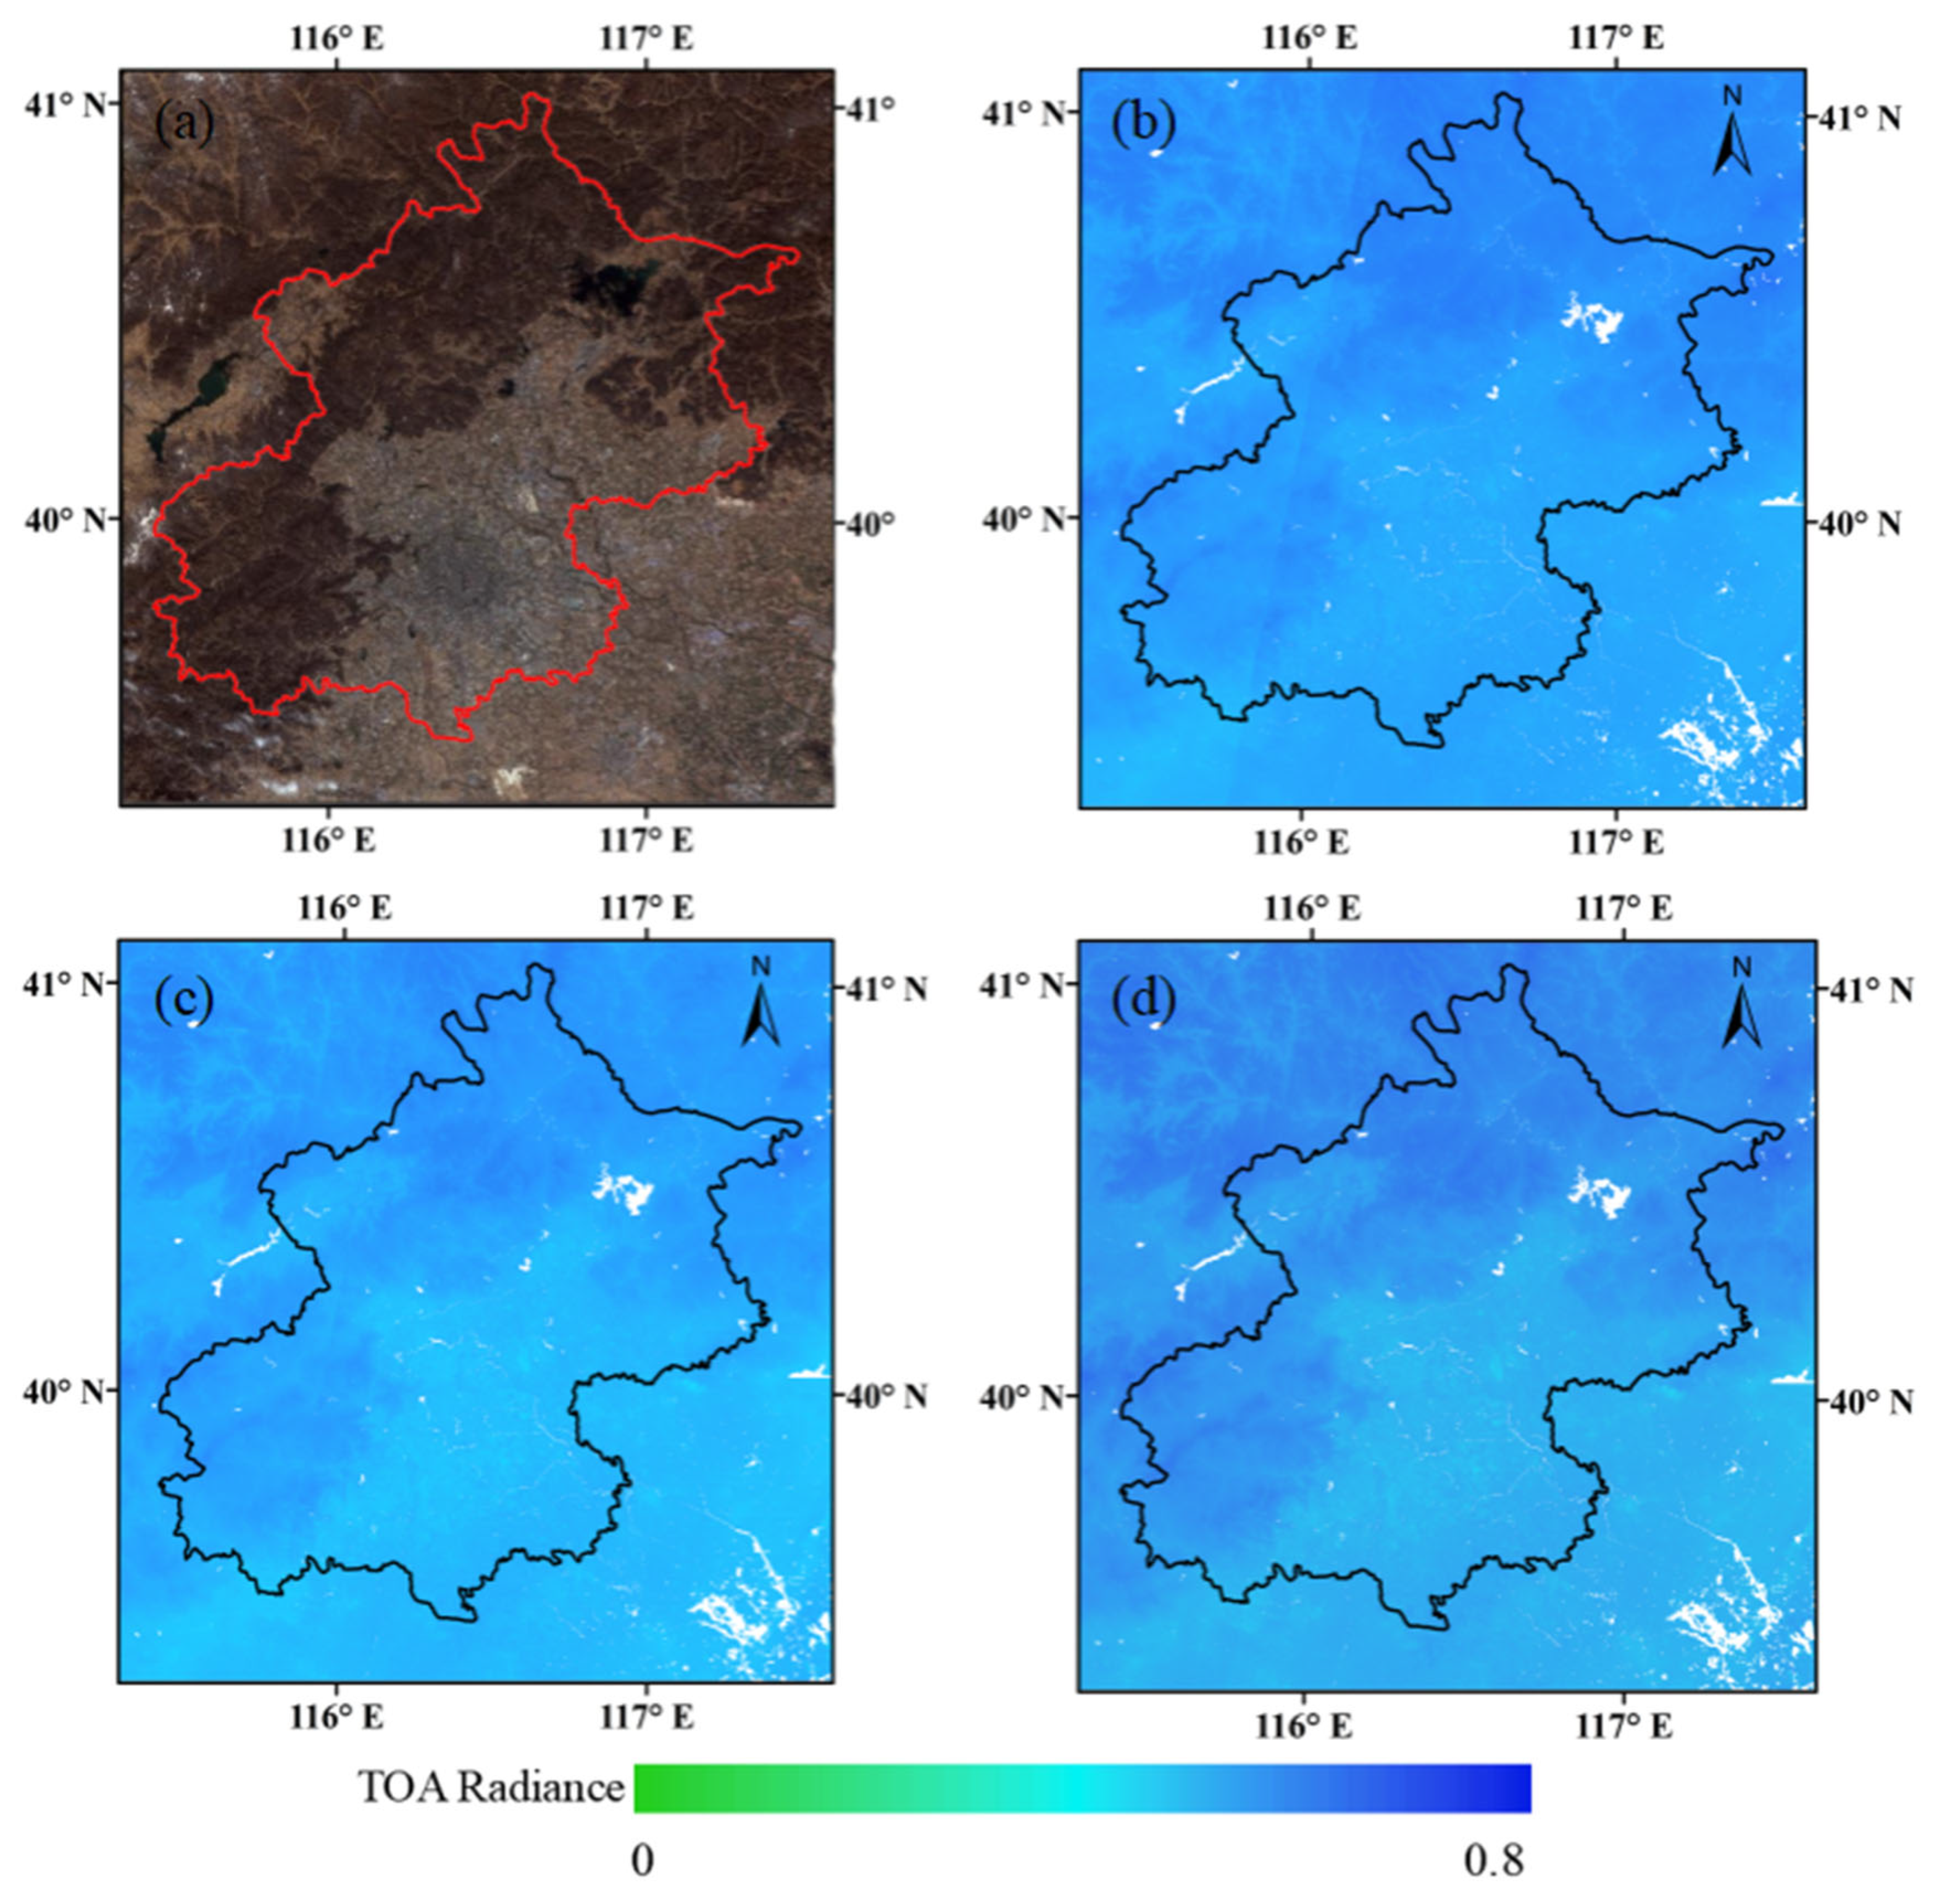
2.1. Study Area

The Dunhuang calibration site (94.358–94.401°N, 40.080–40.105°N) shown in Figure 1, located in the Gobi Desert of northwest China, was selected for radiometric calibration purposes in this study. Significantly, the surface reflectance measurements carried out at this site consistently demonstrate a low standard deviation of less than 3.0%, further confirming its reliability for accurate radiometric calibration [46]. Consequently, the data gathered at this site have been extensively employed in calibrating various Chinese optical satellite instruments [47]. Field measurements were conducted by the China Center for Resources Satellite Data and Application in August 2014. These measurements demonstrated that the Dunhuang region exhibits spatial, temporal, and radiometric stability [48,49,50]. These characteristics make Dunhuang an ideal location for cross-calibration experiments. Consequently, Dunhuang has been extensively employed for the calibration of Chinese satellite sensors, including CBERS-02/CCD [51], FY-3A/MERIS [47], HJ-1A, and 1B/CCD [52].

2.2. Satellite Datasets

In this study, Level 1A data from Gaofen-1 and Gaofen-6 WFV sensors were obtained from the China Center for Resources Satellite Data and Application (CRESDA, http://www.cresda.com, accessed on 5 May 2013). The WFV data acquired from different sites were utilized for cross-calibration and validation purposes, with Dunhuang selected as the cross-calibration site and Baotou chosen for validation. All available Gaofen-1/6 WFV data with no contamination of thick aerosols or clouds over Dunhuang and Baotou from 2018 to 2020 were collected for analysis. The solar–view geometry conditions were carefully taken into account during the cross-calibration process at the selected sites. The solar zenith angles, satellite zenith angles, and relative azimuth angles cover a substantial range, spanning from 19° to 58°, 6° to 36°, and 30° to 150°, respectively. As a result, the calibration coefficients derived from this approach are expected to remain valid and effective across a broader range of observation geometries, particularly focusing on large viewing angles, enhancing the applicability and robustness of the proposed cross-calibration scheme. The Gaofen-1 and Gaofen-6 satellites are polar orbiting sensors with a spatial resolution of 16 m and a swath width exceeding 800 km. Unlike the Gaofen-1/WFV sensor, which uses four WFV cameras to acquire images with an 800 km swath [24], the Gaofen-6/WFV sensor only uses one camera to meet this demand [33]. Both Gaofen-1 and Gaofen-6 satellites follow descending/daytime orbits that cross the equator at 10:30 a.m., and share a spectral band range of 0.45–0.89 μm [35]. Gaofen-6 operates in a network with the Gaofen-1 satellite (Figure 2), enabling an almost daily revisit period while maintaining high spatial resolution. The synergistic observations provide a spatial resolution of 16 m and a revisit period of approximately 1 to 2 days, ensuring the collection of ample data for all image pairs and calibration sites considered in this study.
The Landsat-8 and Gaofen-1/6 satellites demonstrate notable compatibility in terms of their overpass times and spectral ranges, positioning them as suitable candidates for conducting radiometric cross-calibration. These satellites operate on sun-synchronous orbits, which leads to consistent overpass timing occurring at approximately 10:30 am local time [53,54]. The Landsat-8 Operational Land Imager (OLI) band exhibits similar wavelengths to those of the Gaofen-1/6 WFV sensors, rendering it a reliable reference sensor for cross-calibration purposes (Table 1). To ensure data consistency, Landsat-8 OLI surface reflectance products were obtained from the United States Geological Survey (USGS, http://glovis.usgs.gov/, accessed on 2 July 2023) for the period between 2018 and 2020. The selected image pairs were restricted to those acquired within a time difference of less than one hour, minimizing variations in land surface and atmospheric conditions, as well as ensuring similar observing geometry (e.g., solar zenith angles, viewing zenith angles, and relative azimuth angles). Moreover, a visual inspection was conducted to choose only clear and clean data, thereby avoiding potential interferences from dense aerosols and cloud cover. A total of at least five hundred image pairs were collected for each WFV camera, facilitating the subsequent cross-calibration process. Detailed sensor information for both WFV1 and OLI is presented in Table 1.
The spatial resolutions of the two sensors demonstrate similarity. However, there are differences in terms of viewing angle. OLI predominantly captures imagery from a narrower range with a viewing zenith angle (VZA) typically within ±7°, owing to its predominantly nadir view. On the other hand, WFV1 covers a wider VZA range of 24–40°. While OLI and WFV1 images have similar sun elevations, their VZAs exhibit significant disparity. Hence, careful consideration of the BRDF becomes crucial during cross-calibration. Since WFV1 and OLI have similar relative spectral responses (RSRs) and spatial resolutions [24,39], the well-calibrated OLI sensor is a suitable choice for cross-calibrating WFV1, provided that due attention is paid to BRDF discrepancies. For cross-calibration and validation, datasets comprising cloud-free pairs of WFV1 and OLI, acquired on different dates, were utilized. The overpass time for the WFV1–OLI image pairs was restricted to one hour to mitigate variations in surface and atmospheric conditions. Despite the close alignment in sun elevations between WFV1 and OLI images, there are noticeable differences in their VZAs. This emphasizes the need for meticulous handling of BRDF discrepancies between the sensors.

Aerosol and Meteorology Data

The atmospheric parameters used as input for the Second Simulation of the Satellite Signal in the Solar Spectrum Vector (6SV) radiation transmission mode [55,56] for the atmospheric correction included ozone, water vapor, aerosol optical depth (AOD), and aerosol type, which were derived from MODIS aerosol and meteorology products. The MODIS-Terra satellite has a similar overpass time to the Gaofen WFV cameras, at approximately 10:30 am local time, providing consistent aerosol properties through its MOD04_L2 products, which can serve as representative aerosol properties for the Gaofen images.
The MODIS aerosol products offer daily global data with a spatial resolution of 1 km and can be accessed freely from LAADS (http://ladsweb.nascom.nasa.gov/, accessed on 2 July 2023). To ensure the usage of reliable products with high quality, products with quality assurance (QA) flags of two (good) or three (very good) were selected. For any missing aerosol data within the calibration field, spatial interpolation techniques were applied to estimate their values. Regarding the types of aerosols in MODIS products, the mixed or sulfate aerosol types corresponded to the continental or desert models in the 6SV model used in this study [24].
Additionally, MODIS ozone and water vapor data (MYD08_D3) were obtained from the Level-3 MODIS Atmosphere Daily Global Product. Various statistical summaries were computed depending on the specific parameter being considered. These statistics typically encompassed simple measures such as mean, minimum, maximum, and standard deviation. For this study, two specific sub-datasets, namely Atmospheric_Water_Vapor_Mean and Total_Ozone_Mean, were selected to extract the relevant information.

2.3. USGS Spectral Library

The library of USGS spectral data [57] was utilized to acquire the standard spectra of the targets located at the Dunhuang calibration sites. This library encompasses a diverse range of spectral samples from various materials, such as manufactured chemicals, liquids, coatings, plants, and minerals. With over 1300 spectra covering the visible, near-infrared, and mid-infrared wavelengths, the library provides an extensive collection of features that can be matched with corresponding spectra. To access the USGS spectral library, it was downloaded from the USGS Spectroscopy Lab website (http://speclab.cr.usgs.gov/, accessed on 2 July 2023). Subsequently, SBAF was calculated to account for differences among the different sensors employed in the study. This step ensured the necessary adjustments were made to achieve accurate and consistent spectral comparisons across the sensors utilized in the research.

2.4. RadCalNet TOA Data

RadCalNet is an initiative established by the Working Group on Calibration and Validation of the Committee on Earth Observation Satellites. It serves as a valuable resource for satellite operators by offering spectrally resolved reflectance values at the TOA level, which are traceable to the International System of Units. The primary objective of RadCalNet is to assist in the validation of cross-calibration coefficients, such as those derived by the proposed scheme. The RadCalNet service is accessible to users at no cost and provides an extensive and regularly updated archive of TOA radiance values derived from a network of sites. These sites offer nadir-view TOA radiance measurements at 30 min intervals throughout the local standard period from 9 am to 3 pm. The reflectance data is available at 10 nm intervals within the wavelength range of 400 nm to 2500 nm. For the purposes of this study, we selected the Baotao_Sand site located at coordinates (109.616, 40.866). The TOA data spanning from 2018 to 2022, specifically matching the WFV validation dates, were obtained from RadCalNet (https://www.radcalnet.org/, accessed on 2 July 2023). Specifically, we exclusively selected the data labeled as “All TOA simulations available for this day”. These datasets were then utilized to validate the accuracy of the radiometric cross-calibration results obtained in our study.

3. Methodology

This study presents a novel cross-calibration method specifically developed for large-angle observations using synergistic observations from the Gaofen-1 and Gaofen-6 satellites, with data from the well-calibrated Landsat-8 OLI as the reference dataset. To account for spectral differences between sensors, the SBAF was computed through spectral matching techniques using the USGS spectral library. The 6SV model was employed for the atmospheric correction in this study. To optimize the calibration process, the global-searching algorithm PSO was employed. By incorporating the SBAF and BRDF adjustment factors, the calibration ensured a more accurate alignment of the reflectance values between the two sensors, enhancing the reliability and consistency of the cross-calibration results. Finally, validation of the cross-calibration results was conducted using TOA data obtained from in situ data. Figure 3 illustrates the workflow of the cross-calibration methodology proposed in this study.

3.1. TOA Radiance Calculation

The TOA radiance for a specific pixel can be obtained by applying radiometric calibration to the DN (Digital Number) value using Equations (1) and (2).
L TOA ( WFV , i ) = Gain WFV , i · DN WFV , i +   Offset WFV , i
where Gain WFV , i and Offset WFV , i represent the calibration coefficients of the band i. L TOA is subsequently converted into TOA radiance ρ TOA through the following process.
ρ TOA ( WFV , i ) = π · L WFV , i · d 2 / ( E i · cos ϑ WFV )
where d represents the sun–earth distance and E i denotes the extra-atmospheric solar irradiance of the band i, which can be calculated using the following equation.
E i = a b f ( λ ) · S i ( λ ) d λ / a b f ( λ ) · S i ( λ ) d λ
where f ( λ ) represents the continuous extra-atmospheric solar irradiance and S i ( λ ) denotes the normalized spectral response function of the corresponding band.

3.2. Adjustments to the Spectral Bands and BRDF

The disparities in RSR between the corresponding spectral bands of target and reference sensors can be mitigated by f s , i [24,25].
f s , i = ρ WFV , i ρ OLI , i = aOLI , i bOLI , i ρ ( λ ) · S OLI , i ( λ ) · f ( λ ) d λ / aOLI , i bOLI , i S OLI , i ( λ ) · f ( λ ) d λ aWFV , i bWFV , i ρ ( λ ) · S WFV , i ( λ ) · f ( λ ) d λ / aWFV , i bWFV , i S OLI , i ( λ ) · f ( λ ) d λ
where i represents the ith band. S WFV and S OLI represent the normalized spectral response functions for WFV and OLI, respectively. ρ ( λ ) represents the continuous spectral reflectance for the target, which is ideally obtained through in situ measurements. However, in practical situations, collecting ample data across a vast area for all calibration sites poses a significant challenge. To address this limitation, this study utilizes the “best-matched” hyperspectral measurements from the USGS spectral library [24,25]. f represents the continuous extra-atmospheric solar irradiance. Therefore, the WFV spectral-adjusted reflectance can be estimated as follows.
ρ OLI ,   i ( θ s OLI ,   θ v OLI ,   φ s OLI   φ v OLI ) = f s ,   i × ρ WFV ,   i ( θ s OLI ,   θ v OLI ,   φ s OLI   φ v OLI )
where θ s OLI ,   θ v OLI ,   φ s OLI ,   φ v OLI represent the sun zenith angle, satellite zenith angle, sun azimuth angle and satellite azimuth angle of OLI, respectively. φ s OLI φ v OLI   represents the relative azimuth angle of OLI. ρ OLI , i represents the surface reflectance of OLI of the ith band, and ρ WFV , i represents the surface reflectance of WFV of the ith band.
Another inconsistency in cross-calibration arises from the surface contributions between the target and sensors, which can be attributed to the BRDF.
BRDF ( θ s ,   θ v ,   φ s ,   φ v ) = dL ( θ s ,   θ v ,   φ s ,   φ v ) dE ( θ s ,   θ v ,   φ s ,   φ v )
where θ s ,   θ v ,   φ s ,   φ v represent the sun zenith angle, satellite zenith angle, sun azimuth angle, and satellite azimuth angle, respectively, L represents the reflected radiance, and E denotes the incident irradiance. The BRDF employed to minimize the land surface bidirectional effects can be calculated by complex models; however, these models involve constant parameters obtained from BRDF products or in situ data. In this study, the BRDF correction factor [25,38] is defined to eliminate the BRDF differences between the target sensor BRDF WFV and the reference sensor BRDF OLI .
f b , i = BRDF WFV ( θ s WFV ,   θ v WFV ,   φ s WFV ,   φ v WFV ) BRDF OLI ( θ s OLI ,   θ v OLI ,   φ s OLI ,   φ v OLI )
In conventional cross-calibration methods that involve BRDF correction, MODIS BRDF products are commonly utilized to calculate f b , i using a BRDF model. However, the estimation of f b , i is carried out using the PSO method in this study, without the need for BRDF models or products.
After performing atmospheric correction through the 6SV model on Gaofen-1/6 images, the following formula is employed to calculate the surface reflectance of Landsat-8 OLI images.
ρ Simulated ( OLI ,   i ) = ρ ( WFV , i )   ×   f s , i   ×   f b , i
where ρ Simulated ( OLI , i ) is the simulated surface reflectance of Landsat-8 OLI by Gaofen WFV using the proposed scheme, f s , i is the spectral correction factor, and f b , i is the BRDF correction factor.

3.3. PSO for Cross-Calibration

The PSO algorithm [45] is a global optimization algorithm originally developed for hydrological models, which was applied for cross-calibration in this study. This algorithm incorporates the concept of complex shape segmentation and mixing, enhancing search efficiency, computational speed, and global search capabilities. An advantage of the PSO algorithm is its insensitivity to the initial parameter values, reducing the reliance on prior knowledge and mitigating issues arising from missing initial parameter values. In our study, the objective function utilized in the PSO algorithm is defined as follows.
y = | ρ Simulated ( OLI ,   i )   ρ ( OLI ,   i ) |
where ρ Simulated ( OLI , i ) is the simulated surface reflectance of a Landsat-8 OLI image by Gaofen WFV using the proposed scheme and ρ ( OLI , i ) is the surface reflectance of Landsat-8 OLI products. To guarantee the reliability of the obtained results, the PSO algorithm is independently executed 10,000 times for each ROI. This approach offers the advantage of identifying and eliminating ROIs with significant biases. The optimized parameters are initialized with random values within a predefined range. The optimization process terminates when one of the following two conditions is met: the coefficient of variation (CV) of the five continuous optimal values of the objective function falls below 0.001, or the objective function has been evaluated more than 10,000 times [25]. Note that the PSO-based method which utilizes the synergistic observations from the Gaofen-1/6 satellites is referred to as PSO_GF-1/6.

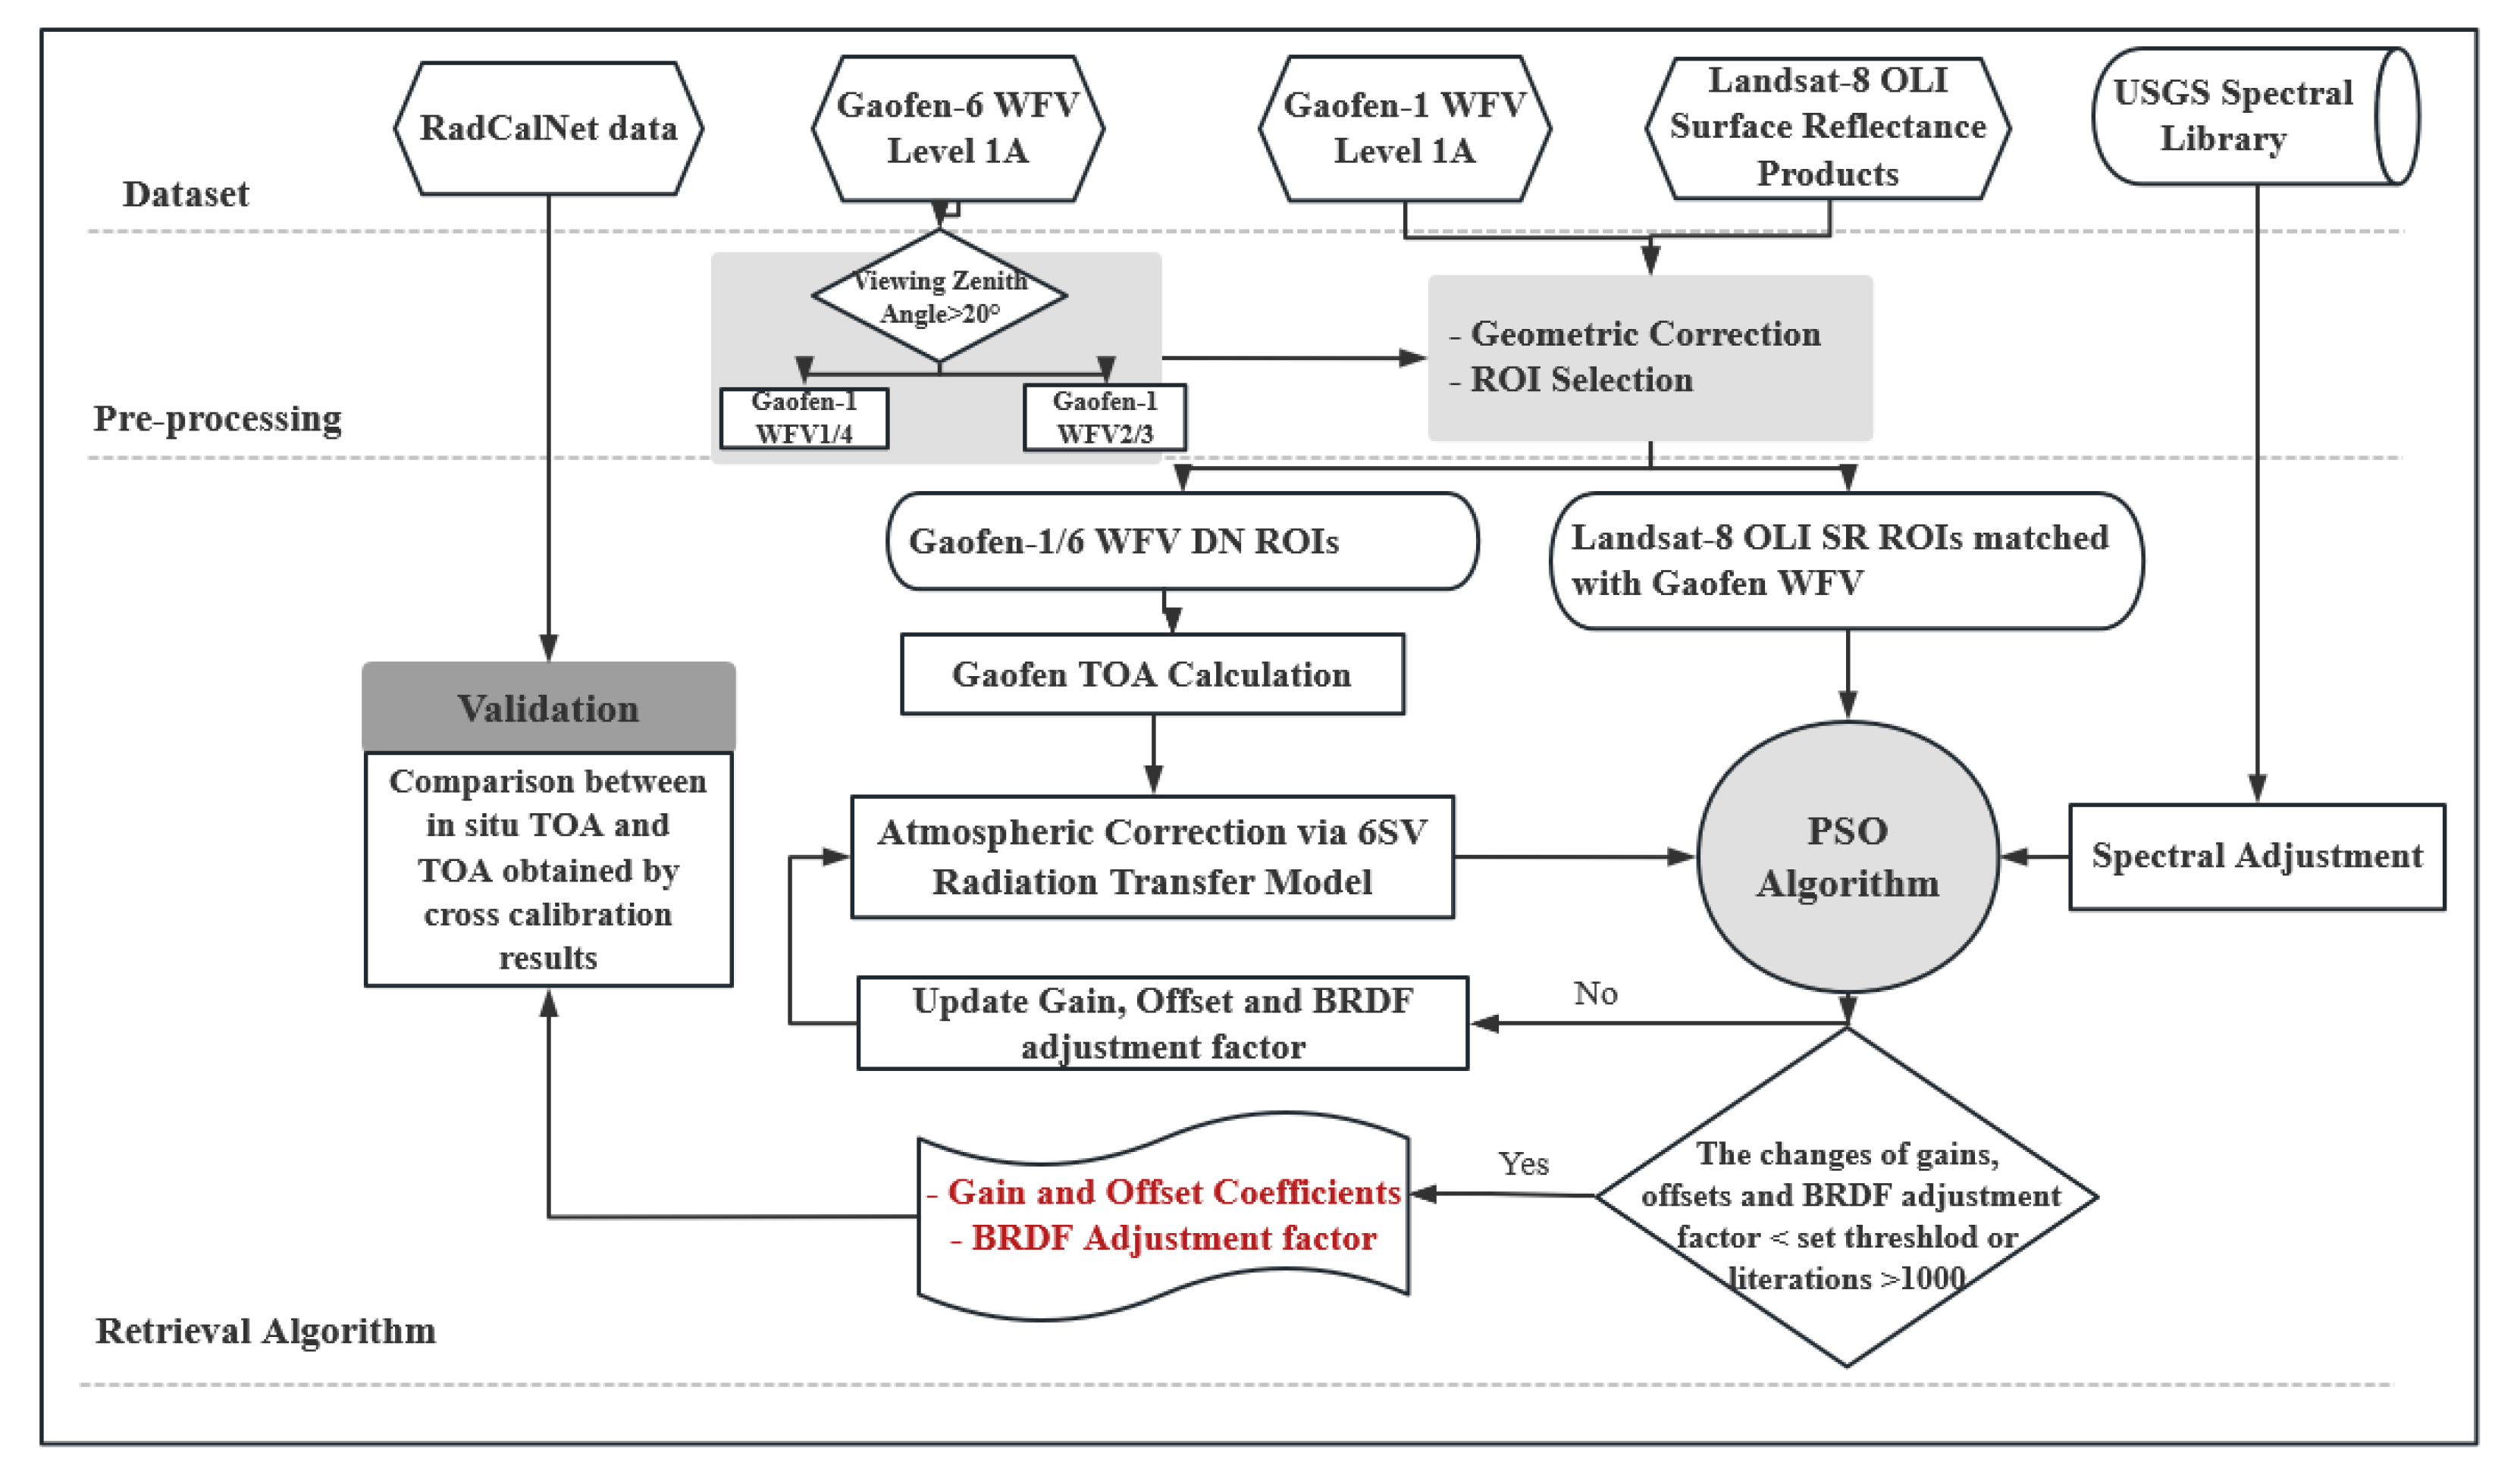
3.4. Practical Steps for Cross-Calibration

As depicted in Figure 3, the proposed cross-calibration procedure can be summed up as follows:
(1)
Correction of spectral response discrepancies between different multispectral satellite sensors of the eight WFV sensors onboard the Gaofen-1/6 satellites, as ensuring consistency and reliability in radiative response accuracy is paramount. To compensate for the inherent offsets caused by RSR mismatches between two sensors, the SBAF method is utilized.
(2)
Random selection of geo-matched regions of interest (ROIs) is conducted between Gaofen WFV and the Landsat-8 OLI sensors. The methodology for selecting these geo-matched ROIs aligns with the previous study [24]. The selection criteria involve checking the CV within a small window (ROI). Specifically, if the CV in the OLI window and the corresponding window in the WFV sensor, both located at the same geographical position, is less than 1%, the location is considered suitable for cross-calibration sampling. The subsequent calibration processes utilize the mean values of the corresponding windows, ensuring the homogeneity of the selected calibration sites by minimizing variation within the windows.
(3)
Estimation of the SBAF between the OLI and WFV instruments and spectral matching are conducted by identifying the best-matched spectra from the USGS spectral library. The selection of matching spectra is based on the minimum Mahalanobis distance [58] to determine the best-matched spectra in the USGS library and the atmospherically corrected OLI reflectance.
(4)
Obtaining Landsat-8 OLI surface reflectance and WFV nadir BRDF-adjusted reflectance. The specific calculation of the latter is as follows: the calibration, offset coefficients, and BDRF adjustment factor are first initialized. Then, use the initial values to calculate the TOA radiance values of the WFV data using Equations (1)–(3) and obtain the surface reflectance using the 6SV atmospheric correction model. The coefficients for atmospheric correction are determined by the atmospheric condition parameters on the day of the image pairs for cross-calibration.
(5)
Compare the Landsat-8 OLI surface reflectance and the nadir BRDF-adjusted reflectance of the WFV. If their difference is small enough to satisfy the convergence condition, then the optimal calibration coefficients and BDRF adjustment factor are obtained. However, if the difference exceeds the acceptable range, the PSO optimization algorithm is utilized to update the calibration coefficient values and offset the coefficients and BRDF adjustment factor, resulting in a new simulated surface reflectance. The process is iterated, continuing the loop until the termination condition is met.

3.5. Methods for Evaluation

In this study, two distinct datasets, namely Landsat 8-OLI images and simulated in situ measurements, were utilized to evaluate the uncertainties associated with the cross-calibration coefficients. It should be noted that the image pairs used for evaluation differed from those utilized for deriving the cross-calibration coefficients. The validation site located in Baotao_Sand provided the necessary in situ data. Specifically, during the cross-calibration process, Landsat 8-OLI surface reflectance products were utilized to obtain the nadir OLI surface reflectance. For Gaofen WFV images, spectral response differences were mitigated by applying a spectral adjustment factor estimated from the USGS spectral library. Subsequently, the BRDF correction was calculated within the PSO algorithm, followed by atmospheric correction using the 6SV model. This process resulted in the derivation of simulated nadir BRDF-adjusted Landsat-8 OLI surface reflectance.
In order to evaluate the uncertainties and illustrate the performance of the different calibration coefficients, two evaluation metrics, namely the mean absolute error (MAE) and root mean square error (RMSE), were employed. These metrics quantified the differences between the reflectance derived from the PSO_Gaofen1/6 method or official coefficients and the reflectance obtained from Landsat-8 OLI products, effectively representing the uncertainties associated with the calibration coefficients.
MAE = 1 n i = 1 n | SR ( WFV ) i SR ( OLI ) i |
RMSE = 1 n i = 1 n ( SR ( WFV ) i SR ( OLI ) i ) 2
where n is the number of SR ( WFV ) i SR ( OLI ) i pairs for validation, SR ( WFV )   is the surface reflectance calculated by the cross-coefficients derived from the proposed scheme, and SR ( OLI ) is the surface reflectance of the Landsat surface reflectance products.
Another type of validation conducted in this study is the in situ validation, which involves comparing the TOA radiance values calculated using the cross-calibration coefficients obtained from this study with the TOA radiance values simulated by the in situ RadCalNet data. The accuracy of the cross-calibration coefficients is assessed by estimating the mean difference percentage (MDP) between the TOA radiance values calculated using the cross-coefficients obtained by the proposed scheme and the TOA radiance values obtained from RadCalNet. This MDP serves as a measure of the accuracy of the cross-calibration coefficients in relation to the TOA radiance values.
MDP = 1 n i = 1 n ( TOA ( WFV ) i TOA ( RadCalNet ) i TOA ( RadCalNet ) × 100 % )  
where n is the number of TOA ( WFV ) i TOA ( RadCalNet ) i pairs for validation, TOA ( WFV )   is the TOA radiance calculated by the cross-coefficients derived from the proposed scheme, and TOA ( RadCalNet ) is the TOA radiance obtained from the TOA simulation using the in situ RadCalNet data at the Baotao_Sand site.

4. Results

4.1. Cross-Calibration Results

The calibration coefficients of WFV1 as a representative of off-nadir sensors were calculated using the proposed PSO_GF-1/6 method. This method allowed for the determination of gain and offset values for each matched ROI. Consequently, multiple sets of gains and offsets were obtained, corresponding to the number of matched ROIs. To fully exploit the acquired ROIs, a total of 500 gain and offset values were randomly selected. This selection process aimed to enhance the comprehensiveness of the results. Subsequently, statistical analyses were conducted on the cross-calibration coefficients for the four bands employing the PSO_GF-1/6 cross-calibration method. The resulting statistical measures, namely the minimum (Min), maximum (Max), mean (Mean), and CV values of the coefficients, are presented in Table 2.
As shown in Table 2, there is a significant difference between the maximum and minimum offset coefficients across the four bands compared to the gain coefficients. The CV values for the offset coefficients are consistently high, with a minimum value of 37.3%. Given the large CV values and the lack of sensitivity of radiance to offset coefficient changes, a detailed comparison of the offset coefficients was not performed. Instead, the focus of the analysis was examining the CV values of the gains.
Compared to the other three bands, the blue bands exhibit slightly higher gain CV values. This observation is likely attributed to larger variations in surface reflectance within the blue band range. Notably, the highest CV value of the observed gain is approximately 5.2%, suggesting that each PSO_GF-1/6 algorithm demonstrates internal stability. When considering the NIR bands of the four instruments, the differences in the CV values of the gains are generally minimal, with an average CV value of 0.9%. Additionally, there are no significant differences in the CV values of the gains between the off-nadir and close-nadir sensors. For instance, the gain CV values are 3% for the two close-nadir instruments (WFV2 and WFV3), while they are 2% for WFV1 and WFV4, which suggests that the proposed cross-calibration method effectively mitigates the impact of BRDF effects when deriving calibration coefficients for instruments with larger viewing zenith angles.
Figure 4 illustrates the evaluation results for the calibrated surface reflectance obtained through the proposed scheme compared to the surface reflectance of Landsat-8 OLI. The evaluation focuses on the four spectral bands of WFV1, which represents an off-nadir WFV camera with large viewing angles (as depicted in Figure 1). In order to provide a comprehensive analysis, the plots include the results derived from official coefficients, as well as the reflectance derived using the RTM-BRDF cross-calibration method.
The scatter plots in Figure 4 clearly demonstrate the excellent agreement between the simulated SR utilizing the calibration coefficients derived from the PSO-GF-1/6 method and Landsat-8 OLI surface reflectance products across various reflectance ranges in the four spectral bands. Both the RMSE and MAE values are consistently below 0.03 for all spectral bands. It is worth noting that slight differences exist between the RTM-BRDF and PSO_GF-1/6 methods, while significant deviations from the 1:1 line are observed when comparing the results obtained using the official coefficients and the other two methods. While the majority of validation data points align closely with the 1:1 line, there are relatively larger differences in a few points within the blue and red bands. Furthermore, the biases exhibit a more dispersed distribution from the mean, particularly in the NIR band. Comparing the different methods across all bands, relatively large RMSE values are evident for the NIR and green bands, in contrast to the blue and red bands of WFV1. Among the methods employed, both the PSO_GF-1/6 and RTM-BRDF methods demonstrate higher accuracy compared to official coefficients, with mean RMSE and MAE values that are lower by 0.007 and 0.005, respectively. Table 3 presents the comprehensive evaluation results of the proposed PSO-GF-1/6 scheme for all WFV sensors aboard the Gaofen-1 satellite.
Table 3 demonstrates the excellent performance of the proposed PSO-GF-1/6 scheme for all WFV sensors onboard Gaofen-1. The RMSEs and MAEs for all instruments and spectral bands are below 0.03 and 0.025, respectively. Statistical analysis reveals that compared to the results obtained using official coefficients and the RTM-BRDF method with MODIS BRDF products, the proposed method significantly improves calibration accuracy. It reduces the RMSE by 36.99% and increases the MAE by 38.13% compared to official coefficients. Furthermore, it achieves comparable accuracy to the RTM-BRDF method while eliminating the need for MODIS BRDF products. A slight decrease of 14.58% in RMSE is observed in the visible bands for WFV1 and WFV4, with negligible differences in the NIR bands, possibly attributed to smaller BRDF effects.
Moreover, the calibration uncertainty of PSO-GF-1/6 appears much smaller than RTM-BRDF, indicating promising improvements achieved using the proposed method. Specifically, while the RMSE and MAE of PSO-GF-1/6 are similar to those of RTM-BRDF, notable enhancements are observed for WFV4 across all bands, and the RTM-BRDF method performs better in the blue band for WFV2 and in the NIR band for WFV2 and WFV3.
When using the official calibration coefficients, relatively larger RMSE and MAE values are observed for WFV1 and WFV4, suggesting stronger BRDF effects on off-nadir viewing instruments. However, smaller discrepancies are observed in the NIR band, even for off-nadir sensors. Notably, the uncertainties of the official coefficients are reduced to 0.03 when only considering close-nadir cameras, indicating the usefulness of this method for such instruments. Additionally, to further demonstrate the performance of the three versions of calibration coefficients, mean difference percentages between calibrated TOA radiance values using different calibration coefficients and in situ TOA radiance values were estimated at various ranges, as shown in Section 4.3.1.

4.2. Radiometric Calibration Performance

To provide a comprehensive understanding of the effectiveness of the proposed radiometric cross-calibration scheme in practice, the image results before and after radiometric calibration in the blue band on the case day of 22 September 2019, in Beijing, China, are displayed in Figure 5.
As shown in Figure 5, the TOA radiance values obtained from the official coefficients (Figure 5b) exhibit a noticeable split-line phenomenon, attributed to the radiation differences between the different WFV sensors of the Gaofen satellite. However, TOA radiance values derived from both the RTM-BRDF method (Figure 5c) and the PSO_GF-1/6 method (Figure 5d) demonstrate continuous and consistent performance, indicating the necessity and effectiveness of cross-calibration. In particular, the PSO_GF-1/6 WFV TOA (Figure 5d) provides a more consistent description of the TOA spatial distribution with reduced radiation difference compared to the RTM-BRDF WFV TOA (Figure 5c).

4.3. Evaluation Results

4.3.1. Evaluation with In Situ Data

Figure 6 illustrates the comparison between the in situ simulated TOA radiance values and the calibrated TOA radiance values using different versions of calibration coefficients. The radiance biases derived by the proposed PSO_GF-1/6 method are compared with those gathered from RTM-BRDF and officially provided coefficients.
Figure 6 displays the error bars representing the TOA radiance values of Gaofen-1 WFV, obtained using different calibration coefficients and in situ data from RadCalNet. The calibrated TOA radiance values using coefficients obtained through the PSO-GF1/6 and RTM-BRDF methods demonstrate a strong agreement with the in situ simulated surface reflectance for the WFV cameras. The mean difference percentages are below 7.75% and 8.86%, respectively. In contrast, the TOA radiance values calibrated by official coefficients exhibit weaker performance, with a mean difference of approximately 10.28%.
Regarding specific bands, the PSO-GF1/6 method slightly outperforms the RTM-BRDF method in the blue and NIR bands, with mean difference percentages lower than 14.12%. However, it performs slightly worse than the RTM-BRDF method in the green and red bands, with mean differences exceeding 12.69%. In the case of official coefficients, its accuracy is notably poor in the full TOA range of the red band and in the low TOA range below 0.2 in the NIR band. Furthermore, its accuracy performance varies among different bands, with relatively lower performance and larger radiance biases observed in the NIR band. The insignificant improvement of the proposed calibration scheme in the NIR band was likely due to the smaller BRDF effects on the NIR band [24].

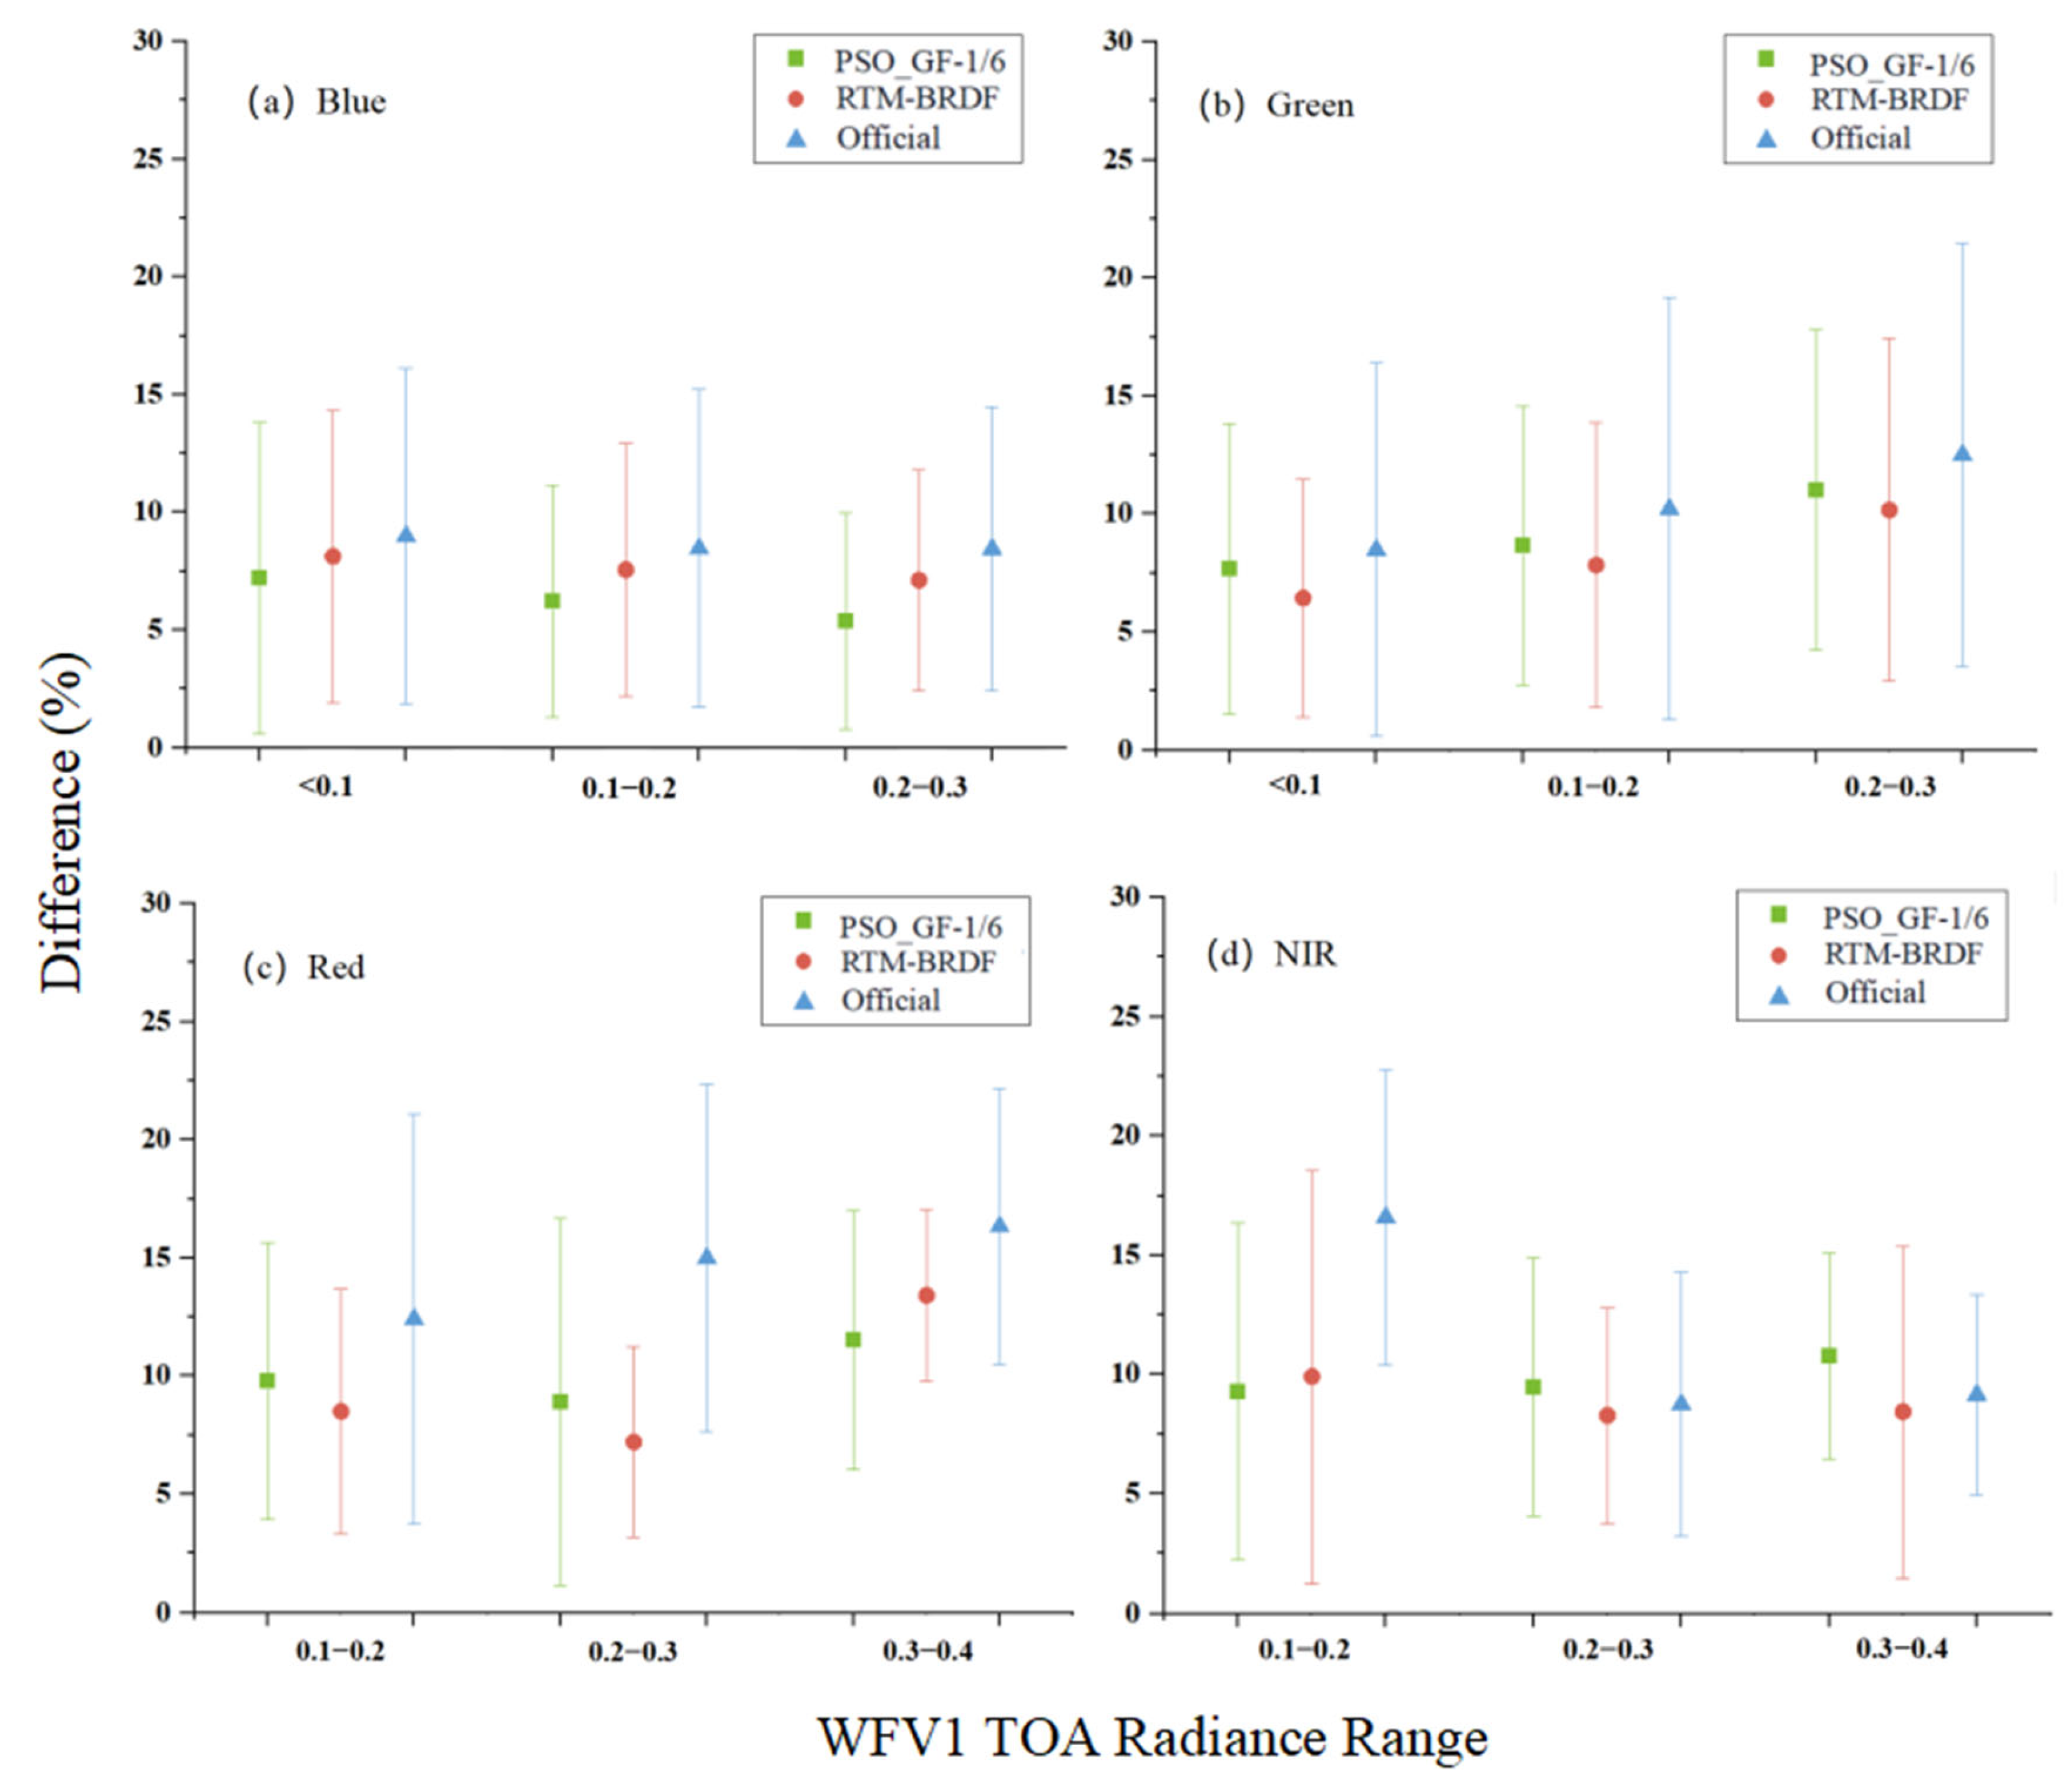
4.3.2. Uncertainty Percentage Calculation

Generally, the uncertainties of cross-calibration can be classified into three components. Firstly, there is uncertainty associated with the reference sensor (δ1), which is primarily influenced by the OLI sensor. Secondly, the uncertainty of calibration models (δ2) is quantified by the CV values obtained through simulation algorithms. Lastly, the uncertainty of variations (δ3) is determined by comparing the in situ TOA radiance measurements. Considering a calibration uncertainty for the referred OLI sensor, δ1 is within 3% [24,25]. The calibration coefficient variations obtained through the proposed model can be observed by the CV values in Table 2. δ2 values of PSO were about 1.75%, 1.63%, 3.47%, and 2.25% for WFV in the four bands, respectively. Validations with in situ RadCalNet data in Figure 6 indicated that the δ3 of PSO_GF-1/6 for WFV in each band was approximately 4.95%, 6.47%, 7.99%, and 7.56%, respectively. As a result, the generated calibration coefficients have an overall uncertainty, δ (δ = sqrt (δ122232)), of approximately 6.05%, 7.32%, 9.21%, and 8.44% for each band, respectively. Note that the uncertainty of the classic RTM-BRDF calibration method is approximately 8%, indicating that the proposed calibration scheme in this study can achieve comparable performance while eliminating the need for MODIS BRDF products. Nevertheless, the δ3 values for the red and NIR bands are over 8%, while those for the blue and green bands are below 7.5%. These findings indicate that more attention should be devoted to the calibration of the red and NIR bands in the cross-calibration process.

5. Discussion

In this study, a novel radiometric scheme has been proposed to address the challenges associated with large viewing angles in Gaofen WFV instruments by leveraging synergistic observations from the Gaofen-1/6 satellites using the PSO algorithm. Extensive validations utilizing satellite images and in situ data demonstrate uncertainties of approximately 8% for the generated coefficients, both for off-nadir and close-nadir WFV cameras.
Different from previous studies focused on improving image-pair quality [27,41] or correcting BRDF effects [24,25,38,39], this study is notable for the increase in image-pair numbers and sun–target–sensor geometry ranges. This synergistic observation offers the advantage of acquiring a greater number of matching images with similar geometries and observation dates as Landsat-8 OLI images. This results in more representative observation geometries, enabling calibration coefficients to be applicable across various sun–target–sensor geometries. By comparing with the results obtained by official coefficients and the RTM-BRDF method using MODIS BRDF products, it is proved that the proposed method can increase the calibration accuracy, with RMSE decreased by 36.99% and MAE increased by 38.13% compared with official coefficients. Furthermore, it achieves comparable accuracy to the RTM-BRDF method while freeing the process from the use of MODIS BRDF products. Notably, for WFV1 and WFV4 in the visible bands, there is a slight decrease in RMSE of 14.58%, while the insignificant differences in the NIR band can be attributed to smaller BRDF effects.
The PSO algorithm plays a crucial role In iteratively determining the optimal calibration coefficients and BRDF adjustment factors. This iterative process, with an average computation time of 14.27 s, enables the efficient correction of bidirectional effects without relying on complex BRDF models or MODIS BRDF products. Moreover, our experiments demonstrate that the proposed PSO_GF-1/6 method allows for the extraction of a unique set of gain and offset calibration coefficients for each ROI. In contrast, the RTM-BRDF method and vicarious calibration calculate a single set of coefficients by fitting all ROIs collectively. This advantage of the PSO_GF-1/6 method eliminates ROIs with significant biases, thereby reducing potential additive errors in the cross-calibration process. Additionally, the proposed approach shows comparable performance to the RTM-BRDF method using MODIS BRDF products. Note that the spatial resolution of MODIS BRDF products is relatively coarse (500 m) compared with the finer 16 m resolution WFV, and the availability of MODIS BRDF products can be influenced by cloud contamination. Therefore, the promising results obtained from our proposed approach suggest its potential to free cross-calibration from dependency on BRDF products and the complex calculation of BRDF models.
However, there are still some limitations of the proposed scheme that need to be addressed in future investigations. Firstly, the results indicate that the improvement achieved by the proposed calibration scheme in the NIR bands is relatively insignificant compared to the other three visible bands. This discrepancy is likely due to the smaller BRDF effects in the NIR band. As a result, spectral correction, which involves combining in situ observations or addressing other unknown uncertainties in the entire cross-calibration procedure, can be characterized as an optimization factor. Moreover, it is crucial to consider that seasonal and meteorological conditions may vary during image acquisition. These changes can lead to radiometric calibration differences in the images. To mitigate the impact of seasonality and meteorological conditions, developing time series calibration models may better reduce the biases introduced by these effects and minimize their impact on the calibration.

6. Conclusions

The current radiometric cross-calibration method for Gaofen-1 WFV cameras exhibits limitations in its relatively low accuracy for off-nadir cameras with large viewing angles (WFV1 and WFV4). Therefore, it is necessary to explore approaches that can enhance the cross-calibration accuracy of such sensors. This study introduced a novel radiometric cross-calibration method to tackle the challenges associated with large viewing angle sensors. The proposed radiometric cross-calibration framework is based on Gaofen-1 and Gaofen-6 synergistic observation using the PSO algorithm. This framework has improvements in the number of matched ROIs for cross-calibration and can provide a more comprehensive and representative range of sun–target–sensor geometries for BRDF effect correction, enabling calibration coefficients to be applicable across various observation geometries. Additionally, the PSO algorithm eliminates the need for MODIS BRDF products that are unavailable due to cloud contamination and addresses the issue of coarse spatial resolution for WFV sensors. Moreover, by individually optimizing the calibration coefficients for each ROI, the PSO algorithm enhances the accuracy and reliability of the cross-calibration procedure by avoiding ROIs with large biases. Extensive validations utilizing satellite images and in situ data have shown uncertainties of approximately 8% for the derived coefficients by the proposed scheme for both off-nadir and close-nadir cameras. Comparisons with official coefficients and the RTM-BRDF method utilizing MODIS BRDF products have demonstrated the superior calibration accuracy of our proposed method. Specifically, we achieved a 36.99% decrease in RMSE and a 38.13% increase in MAE compared to official coefficients. Notably, our method achieves comparable accuracy with the RTM-BRDF method while eliminating the need for MODIS BRDF products. A slight decrease of 14.58% in RMSE for WFV1 and WFV4 was observed in the three visible bands, with negligible differences observed in the NIR band attributed to smaller BRDF effects. The precise radiometric calibration provided by our approach enables the linkage of satellite signals to various biochemical characteristics, thereby facilitating potential applications for understanding biological processes. Moreover, the proposed scheme for radiometric cross-calibration holds promise for future applications, offering timely correction for radiometric degradations of the Gaofen-1/6 WFV cameras. It can also contribute to maintaining precise and consistent observations for future Gaofen missions in China and similar satellites in other countries.

Author Contributions

Methodology, J.D. and Y.C.; Software, J.D.; Validation, J.D. and Q.X.; Formal analysis, J.D. and Y.C.; Resources, Q.X.; Writing—original draft, J.D.; Writing—review & editing, Q.X.; Visualization, Q.X.; Supervision, Y.C.; Project administration, X.C.; Funding acquisition, X.C. All authors have read and agreed to the published version of the manuscript.

Funding

This research was funded by the National Natural Science Foundation of China grant number Nos. 42271354, 41971402. And The APC was funded by No. 42271354.

Data Availability Statement

Level 1A data from Gaofen-1 and Gaofen-6 WFV sensors can be obtained from the China Center for Resources Satellite Data and Application (CRESDA, http://www.cresda.com, accessed on 2 July 2023). Landsat-8 OLI surface reflectance products can be obtained from the United States Geological Survey (USGS, http://glovis.usgs.gov/, accessed on 2 July 2023). The spectral library data can be obtained from the USGS Spectroscopy Lab website (http://speclab.cr.usgs.gov/, accessed on 2 July 2023). The MODIS and meteorological datasets aerosol products can be accessed freely from LAADS (http://ladsweb.nascom.nasa.gov/, accessed on 2 July 2023). The in situ TOA radiance data can be obtained from RadCalNet (https://www.radcalnet.org/, accessed on 2 July 2023).

Acknowledgments

The authors would like to express our gratitude to CRESDA for providing the WFV data, the USGS for providing Landsat-8 OLI image data and the spectral library, the MODIS Land team for providing the aerosol and meteorological datasets products, and RadCalNet for providing in situ TOA radiance data. The reviewer’s comments are valuable which help a lot to improve this manuscript, and their efforts are greatly appreciated.

Conflicts of Interest

The authors declare no conflict of interest.

References

  1. Zhang, T.H.; Zhu, Z.M.; Gong, W.; Zhu, Z.R.; Sun, K.; Wang, L.C.; Huang, Y.S.; Mao, F.Y.; Shen, H.F.; Li, Z.W.; et al. Estimation of ultrahigh resolution PM2.5 concentrations in urban areas using 160 m Gaofen-1 AOD retrievals. Remote Sens. Environ. 2018, 216, 91–104. [Google Scholar] [CrossRef]
  2. Li, Z.; Shen, H.; Li, H.; Xia, G.; Gamba, P.; Zhang, L. Multi-feature combined cloud and cloud shadow detection in GaoFen-1 wide field of view imagery. Remote Sens. Environ. 2017, 191, 342–358. [Google Scholar] [CrossRef] [Green Version]
  3. Dong, Z.P.; Liu, Y.X.; Xu, W.X.; Feng, Y.K.; Chen, Y.L.; Tang, Q.H. A cloud detection method for GaoFen-6 wide field of view imagery based on the spectrum and variance of superpixels. Int. J. Remote Sens. 2021, 42, 6315–6332. [Google Scholar] [CrossRef]
  4. Roy, D.P.; Wulder, M.A.; Loveland, T.R.; Woodcock, C.E.; Allen, R.G.; Anderson, M.C.; Helder, D.; Irons, J.R.; Johnson, D.M.; Kennedy, R.; et al. Landsat-8: Science and product vision for terrestrial global change research. Remote Sens. Environ. 2018, 145, 154–172. [Google Scholar]
  5. Chander, G.; Markham, B.L.; Helder, D.L. Summary of current radiometric calibration coefficients for Landsat MSS, TM, ETM+, and EO-1 ALI sensors. Remote Sens. Environ. 2009, 113, 893–903. [Google Scholar] [CrossRef]
  6. Novelli, A.; Caradonna, G.; Tarantino, E. Evaluation of Relative Radiometric Correction techniques on Landsat 8 OLI sensor data. In Proceedings of the 4th International Conference on Remote Sensing and Geoinformation of the Environment (RSCy2016), Paphos, Cyprus, 4–8 April 2016; Volume 9688, pp. 62–70. [Google Scholar]
  7. Moghimi, A.; Celik, T.; Mohammadzadeh, A. Tensor-based keypoint detection and switching regression model for relative radiometric normalization of bitemporal multispectral images. Int. J. Remote Sens. 2022, 43, 3927–3956. [Google Scholar] [CrossRef]
  8. D’Elia, C.; Ruscino, S. An Automated Method for Relative Radiometric Correction Performed through Spectral Library Based Classification and Comparison. In Proceedings of the SPIE Conference on Image and Signal Processing for Remote Sensing XVIII, Edinburgh, UK, 24–27 September 2012. [Google Scholar]
  9. Helder, D.; Thome, K.J.; Mishra, N.; Chander, G.; Xiong, X.X.; Angal, A.; Choi, T. Absolute Radiometric Calibration of Landsat Using a Pseudo Invariant Calibration Site. IEEE Trans. Geosci. Remote Sens. 2013, 51, 1360–1369. [Google Scholar] [CrossRef]
  10. Lin, T.H.; Chang, J.C.; Hsu, K.H.; Lee, Y.S.; Zeng, S.K.; Liu, G.R.; Tsai, F.A.; Chan, H.P. Radiometric Variations of On-Orbit FORMOSAT-5 RSI from Vicarious and Cross-Calibration Measurements. Remote Sens. 2019, 11, 2634. [Google Scholar] [CrossRef] [Green Version]
  11. Barnes, R.A.; Eplee, R.E.; Patt, F.S.; McClain, C.R. Changes in the radiometric sensitivity of SeaWiFS determined from lunar and solar-based measurements. Appl. Opt. 1999, 38, 4649–4664. [Google Scholar] [CrossRef] [Green Version]
  12. Slater, P.N.; Biggar, S.F.; Thome, K.J.; Gellman, D.I.; Spyak, P.R. Vicarious radiometric calibrations of EOS sensors. J. Atmos. Ocean. Technol. 1996, 13, 349–359. [Google Scholar] [CrossRef]
  13. McCorkel, J.; Thome, K.; Ong, L. Vicarious Calibration of EO-1 Hyperion. IEEE J. Sel. Top. Appl. Earth Obs. Remote Sens. 2013, 6, 400–407. [Google Scholar] [CrossRef] [Green Version]
  14. Liu, C.C.; Kamei, A.; Hsu, K.H.; Tsuchida, S.; Huang, H.M.; Kato, S.; Nakamura, R.; Wu, A.M. Vicarious Calibration of the Formosat-2 Remote Sensing Instrument. IEEE Trans. Geosci. Remote Sens. 2010, 48, 2162–2169. [Google Scholar]
  15. Teillet, P.M.; Barker, J.L.; Markham, B.L.; Irish, R.R.; Fedosejevs, G.; Storey, J.C. Radiometric cross-calibration of the Landsat-7 ETM+ and Landsat-5 TM sensors based on tandem data sets. Remote Sens. Environ. 2001, 78, 39–54. [Google Scholar] [CrossRef] [Green Version]
  16. Lacherade, S.; Fougnie, B.; Henry, P.; Gamet, P. Cross Calibration Over Desert Sites: Description, Methodology, and Operational Implementation. IEEE Trans. Geosci. Remote Sens. 2013, 51, 1098–1113. [Google Scholar] [CrossRef]
  17. Chander, G.; Meyer, D.J.; Helder, D.L. Cross calibration of the Landsat-7 ETM+ and EO-1 ALI sensor. IEEE Trans. Geosci. Remote Sens. 2004, 42, 2821–2831. [Google Scholar] [CrossRef]
  18. Mishra, N.; Haque, M.O.; Leigh, L.; Aaron, D.; Helder, D.; Markham, B. Radiometric Cross Calibration of Landsat 8 Operational Land Imager (OLI) and Landsat 7 Enhanced Thematic Mapper Plus (ETM plus). Remote Sens. 2014, 6, 12619–12638. [Google Scholar] [CrossRef] [Green Version]
  19. Barsi, J.A.; Alhammoud, B.; Czapla-Myers, J.; Gascon, F.; Haque, M.O.; Kaewmanee, M.; Leigh, L.; Markham, B.L. Sentinel-2A MSI and Landsat-8 OLI radiometric cross comparison over desert sites. Eur. J. Remote Sens. 2018, 51, 822–837. [Google Scholar] [CrossRef]
  20. Pinto, C.T.; Shrestha, M.; Hasan, N.; Leigh, L.; Helder, D. SBAF for Cross-Calibration of Landsat-8 OLI and Sentinel-2 MSI over North African PICS. Earth Obs. Syst. XXIII 2018, 10764, 294–304. [Google Scholar]
  21. Gao, C.X.; Liu, Y.K.; Qiu, S.; Li, C.R.; Ma, L.L.; Han, Q.J.; Liu, J.R.; Zhao, E.Y.; Zhao, Y.G.; Qian, Y.G.; et al. Radiometric Cross-Calibration of GF-4/VNIR Sensor with Landsat8/OLI, Sentinel-2/MSI, and Terra/MODIS for Monitoring Its Degradation. IEEE J. Sel. Top. Appl. Earth Obs. Remote Sens. 2020, 13, 2337–2350. [Google Scholar] [CrossRef]
  22. Wang, Z.; Xiao, P.F.; Gu, X.F.; Feng, X.Z.; Li, X.Y.; Gao, H.L.; Li, H.; Lin, J.T.; Zhang, X.L. Uncertainty analysis of cross-calibration for HJ-1 CCD camera. Sci. China-Technol. Sci. 2013, 56, 713–723. [Google Scholar] [CrossRef]
  23. Zhong, B.; Zhang, Y.H.; Du, T.T.; Yang, A.X.; Lv, W.B.; Liu, Q.H. Cross-Calibration of HJ-1/CCD over a Desert Site Using Landsat ETM plus Imagery and ASTER GDEM Product. IEEE Trans. Geosci. Remote Sens. 2014, 52, 7247–7263. [Google Scholar] [CrossRef]
  24. Feng, L.; Li, J.; Gong, W.S.; Zhao, X.; Chen, X.L.; Pang, X.P. Radiometric cross-calibration of Gaofen-1 WFV cameras using Landsat-8 OLI images: A solution for large view angle associated problems. Remote Sens. Environ. 2016, 174, 56–68. [Google Scholar]
  25. Zhou, Q.; Tian, L.Q.; Li, J.; Wu, H.; Zeng, Q. Radiometric Cross-Calibration of Large-View-Angle Satellite Sensors Using Global Searching to Reduce BRDF Influence. IEEE Trans. Geosci. Remote Sens. 2021, 59, 5234–5245. [Google Scholar]
  26. Li, J.; Feng, L.; Pang, X.P.; Gong, W.S.; Zhao, X. Radiometric cross Calibration of Gaofen-1 WFV Cameras Using Landsat-8 OLI Images: A Simple Image-Based Method. Remote Sens. 2016, 8, 411. [Google Scholar]
  27. Liu, Q.Y.; Yu, T.; Gao, H.L. Radiometric Cross-Calibration of GF-1 PMS Sensor with a New BRDF Model. Remote Sens. 2019, 11, 707. [Google Scholar] [CrossRef] [Green Version]
  28. Yang, A.X.; Zhong, B.; Wu, S.L.; Liu, Q.H. Radiometric Cross-Calibration of GF-4 in Multispectral Bands. Remote Sens. 2017, 9, 232. [Google Scholar] [CrossRef] [Green Version]
  29. Han, J.; Tao, Z.; Xie, Y.; Liu, Q.Y.; Huang, Y.J. Radiometric Cross-Calibration of GF-4/PMS Based on Radiometric Block Adjustment. IEEE Trans. Geosci. Remote Sens. 2021, 59, 4522–4534. [Google Scholar] [CrossRef]
  30. Zhou, X.; Feng, D.; Xie, Y.; Tao, Z.; Lv, T.T.; Wang, J. Radiometric Cross-Calibration of GF-4/IRS Based on MODIS Measurements. IEEE J. Sel. Top. Appl. Earth Obs. Remote Sens. 2021, 14, 6807–6814. [Google Scholar] [CrossRef]
  31. Han, J.; Tao, Z.; Xie, Y.; Li, H.N.; Guan, X.G.; Yi, H.; Shi, T.T.; Wang, G.K. Radiometric Cross-Calibration of GF-6/WFV Sensor Using MODIS Images with Different BRDF Models. IEEE Trans. Geosci. Remote Sens. 2022, 60, 3169211. [Google Scholar] [CrossRef]
  32. Han, J.; Tao, Z.; Xie, Y.; Li, H.; Liu, Q.; Guan, X. A Novel Radiometric Cross-Calibration of GF-6/WFV with MODIS at the Dunhuang Radiometric Calibration Site. IEEE J. Sel. Top. Appl. Earth Obs. Remote Sens. 2021, 14, 1645–1653. [Google Scholar] [CrossRef]
  33. Yang, A.X.; Zhong, B.; Hu, L.F.; Wu, S.L.; Xu, Z.P.; Wu, H.B.; Wu, J.J.; Gong, X.S.; Wang, H.B.; Liu, Q.H. Radiometric Cross-Calibration of the Wide Field View Camera Onboard GaoFen-6 in Multispectral Bands. Remote Sens. 2020, 12, 1037. [Google Scholar] [CrossRef] [Green Version]
  34. Zhang, G.; Xu, K.; Huang, W.C. Auto-calibration of GF-1 WFV images using flat terrain. ISPRS J. Photogramm. Remote Sens. 2017, 134, 59–69. [Google Scholar] [CrossRef]
  35. Mou, H.W.; Li, H.; Zhou, Y.G.; Dong, R.J. Response of Different Band Combinations in Gaofen-6 WFV for Estimating of Regional Maize Straw Resources Based on Random Forest Classification. Sustainability 2021, 13, 4603. [Google Scholar] [CrossRef]
  36. Yang, F.K.; Fan, M.; Tao, J.H. An Improved Method for Retrieving Aerosol Optical Depth Using Gaofen-1 WFV Camera Data. Remote Sens. 2021, 13, 280. [Google Scholar] [CrossRef]
  37. Shang, P.; Shen, F. Atmospheric Correction of Satellite GF-1/WFV Imagery and Quantitative Estimation of Suspended Particulate Matter in the Yangtze Estuary. Sensors 2016, 16, 1997. [Google Scholar] [CrossRef] [PubMed] [Green Version]
  38. Chen, Y.P.; Sun, K.M.; Li, D.R.; Bai, T.; Huang, C.Q. Radiometric Cross-Calibration of GF-4 PMS Sensor Based on Assimilation of Landsat-8 OLI Images. Remote. Sens. 2017, 9, 811. [Google Scholar] [CrossRef] [Green Version]
  39. Zhou, Q.; Tian, L.Q.; Li, J.; Li, W.K. Assessment of bidirectional reflectance effects on desert and forest for radiometric cross-calibration of satellite sensors. ISPRS J. Photogramm. Remote Sens. 2020, 160, 180–194. [Google Scholar] [CrossRef]
  40. Zhong, B.; Yang, A.; Wu, S.; Li, J.; Liu, S.; Liu, Q. Cross-calibration of reflective bands of major moderate resolution remotely sensed data. Remote Sens. Environ. 2018, 204, 412–423. [Google Scholar] [CrossRef]
  41. Lu, J.; He, T.; Liang, S.L.; Zhang, Y.J. An Automatic Radiometric Cross-Calibration Method for Wide-Angle Medium-Resolution Multispectral Satellite Sensor Using Landsat Data. IEEE Trans. Geosci. Remote Sens. 2022, 60, 1–11. [Google Scholar]
  42. Sun, M.X.; Yu, L.J.; Zhang, P.; Sun, Q.Q.; Jiao, X.; Sun, D.F.; Lun, F. Coastal water bathymetry for critical zone management using regression tree models from Gaofen-6 imagery. Ocean. Coast. Manag. 2021, 204, 105522. [Google Scholar]
  43. Chander, G.; Mishra, N.; Helder, D.L.; Aaron, D.B.; Angal, A.; Choi, T.; Xiong, X.X.; Doelling, D.R. Applications of Spectral Band Adjustment Factors (SBAF) for Cross-Calibration. IEEE Trans. Geosci. Remote Sens. 2013, 51, 1267–1281. [Google Scholar] [CrossRef]
  44. Pinto, C.T.; Ponzoni, F.J.; Castro, R.M.; Leigh, L.; Kaewmanee, M.; Aaron, D.; Helder, D. Evaluation of the uncertainty in the spectral band adjustment factor (SBAF) for cross-calibration using Monte Carlo simulation. Remote Sens. Lett. 2016, 7, 837–846. [Google Scholar] [CrossRef]
  45. Clerc, M.; Kennedy, J. The particle swarm—Explosion, stability, and convergence in a multidimensional complex space. IEEE Trans. Evol. Comput. 2017, 6, 58–73. [Google Scholar] [CrossRef] [Green Version]
  46. Hu, X.Q.; Liu, J.J.; Sun, L.; Rong, Z.G.; Li, Y.; Zhang, Y.; Zheng, Z.J.; Wu, R.H.; Zhang, L.J.; Gu, X.F. Characterization of CRCS Dunhuang test site and vicarious calibration utilization for Fengyun (FY) series sensors. Can. J. Remote Sens. 2010, 36, 566–582. [Google Scholar] [CrossRef]
  47. Chen, L.; Hu, X.Q.; Xu, N.; Zhang, P. The Application of Deep Convective Clouds in the Calibration and Response Monitoring of the Reflective Solar Bands of FY-3A/MERSI (Medium Resolution Spectral Imager). Remote Sens. 2013, 5, 6958–6975. [Google Scholar] [CrossRef] [Green Version]
  48. Hu, X.Q.; Xu, N.; Liu, J.J.; Zhang, L.J.; Rong, Z.G. Postlaunch Calibration of FengYun-3B MERSI Reflective Solar Bands. IEEE Trans. Geosci. Remote Sens. 2013, 51, 1383–1392. [Google Scholar]
  49. Hu, X.Q.; Sun, L.; Liu, J.J.; Ding, L.; Wang, X.H.; Li, Y.; Zhang, Y.; Xu, N.; Chen, L. Calibration for the Solar Reflective Bands of Medium Resolution Spectral Imager Onboard FY-3A. IEEE Trans. Geosci. Remote Sens. 2012, 50, 4915–4928. [Google Scholar] [CrossRef]
  50. Sun, L.; Hu, X.Q.; Guo, M.H.; Xu, N. Multisite Calibration Tracking for FY-3A MERSI Solar Bands. IEEE Trans. Geosci. Remote Sens. 2012, 50, 4929–4942. [Google Scholar] [CrossRef]
  51. Gao, C.X.; Jiang, X.G.; Li, X.B.; Li, X.H. The cross-calibration of CBERS-02B/CCD visible-near infrared channels with Terra/MODIS channels. Int. J. Remote Sens. 2013, 34, 3688–3698. [Google Scholar] [CrossRef]
  52. Li, J.; Chen, X.L.; Tian, L.Q.; Yu, H.J.; Zhang, W. An evaluation of the temporal stability of HJ-1 CCD data using a desert calibration site and Landsat 7 ETM+. Int. J. Remote Sens. 2015, 36, 3733–3750. [Google Scholar] [CrossRef]
  53. Li, J.; Roy, D.P. A Global Analysis of Sentinel-2A, Sentinel-2B and Landsat-8 Data Revisit Intervals and Implications for Terrestrial Monitoring. Remote Sens. 2017, 9, 902. [Google Scholar] [CrossRef] [Green Version]
  54. Padro, J.C.; Pons, X.; Aragones, D.; Diaz-Delgado, R.; Garcia, D.; Bustamante, J.; Pesquer, L.; Domingo-Marimon, C.; Gonzalez-Guerrero, O.; Cristobal, J.; et al. Radiometric Correction of Simultaneously Acquired Landsat-7/Landsat-8 and Sentinel-2A Imagery Using Pseudoinvariant Areas (PIA): Contributing to the Landsat Time Series Legacy. Remote Sens. 2017, 9, 1319. [Google Scholar]
  55. Vermote, E.; Justice, C.; Claverie, M.; Franch, B. Preliminary analysis of the performance of the Landsat 8/OLI land surface reflectance product. Remote Sens. Environ. 2016, 185, 46–56. [Google Scholar] [CrossRef] [PubMed]
  56. Li, Y.J.; Ma, Q.M.; IEEE. Evaluating sentinel-2a atmospherically corrected reflectance using the 6sv model. In Proceedings of the IEEE International Geoscience and Remote Sensing Symposium (IGARSS), Fort Worth, TX, USA, 23–28 July 2017; pp. 2078–2081. [Google Scholar]
  57. Baldridge, A.M.; Hook, S.J.; Grove, C.I.; Rivera, G. The ASTER spectral library version 2.0. Remote Sens. Environ. 2009, 113, 711–715. [Google Scholar] [CrossRef]
  58. Du, B.; Zhang, L.P. A Discriminative Metric Learning Based Anomaly Detection Method. IEEE Trans. Geosci. Remote Sens. 2014, 52, 6844–6857. [Google Scholar]
Figure 1. The location of the calibration site and close view using a true color composite of Gaofen imagery. Please note that the red box is the selected calibration area in this study.
Remotesensing 15 03851 g001
Figure 2. Schematic of a wide-field-of-view (WFV) setup and Gaofen-1 and Gaofen-6 synergistic observations.
Remotesensing 15 03851 g002
Figure 3. Flowchart of the proposed cross-calibration scheme based on the PSO method.
Remotesensing 15 03851 g003
Figure 4. Evaluation of simulated surface reflectance of Gaofen-1 WFV1 using Landsat-8 OLI surface reflectance products. The results of the three versions of calibration coefficients are plotted in this figure. The dotted line is the 1:1 line.
Remotesensing 15 03851 g004
Figure 5. Inter-comparison of (d) PSO_GF-1/6 WFV TOA with (b) official WFV TOA and (c) RTM-BRDF WFV TOA in the blue band on 22 September 2019 (note that the no-value area is the water body area), combined with their corresponding MODIS-derived true-color image (a).
Remotesensing 15 03851 g005
Figure 6. The mean difference percentages between the calibrated TOA radiances of Gaofen-1/6 WFV using different methods and the in situ TOA radiance values from RadCalNet.
Remotesensing 15 03851 g006
Table 1. Comparison of the parameters between WFV and OLI.
WFVOLI
Band (nm)Blue450–520450–510
Green520–590530–590
Red630–690640–670
NIR770–890850–880
Spatial Resolution (m)1630
Swath (km)200 × 4180
Range of viewing zenith angle (VZA) (°)24–40±7
Table 2. Statistics of the cross-calibration coefficients of the four bands using the PSO-GF-1/6 cross-calibration method.
GainsOffsets
MaxMinMeanCVMaxMinMeanCV
Gaofen-1
WFV1
Blue0.1640.1530.1570.02310.000−0.3517.1990.481
Green0.1500.1420.1450.02310.000−0.3877.0320.484
Red0.1430.1360.1370.00810.000−0.4907.4380.451
NIR0.1150.1070.1080.00710.000−0.4657.4490.446
Gaofen-1
WFV2
Blue0.1900.1880.1890.05210.000−0.3717.5170.446
Green0.1770.1700.1710.01110.000−0.9577.1010.499
Red0.1450.1140.1330.02210.000−0.5257.1550.489
NIR0.1280.1100.1130.03510.000−0.4967.1800.486
Gaofen-1
WFV3
Blue0.1890.1680.1760.05810.000−0.6717.0500.479
Green0.1840.1730.1770.02410.000−0.2767.3340.445
Red0.1450.1200.1260.02310.000−0.1467.2580.458
NIR0.1340.1300.1310.0098.694−0.2656.8760.397
Gaofen-1
WFV4
Blue0.2080.1910.2020.04410.000−0.8097.3460.441
Green0.1750.1700.1710.0077.162−0.5115.5230.440
Red0.1390.1200.1230.0396.050−0.7464.9540.373
NIR0.1370.1200.1230.0236.047−0.4584.7680.416
Table 3. Evaluation of the simulated surface reflectance of Gaofen-1/6 WFV using surface reflectance by Landsat-8 OLI. All RMSEs and MAEs are listed.
MethodSensorBlue BandGreen BandRed BandNIR Band
RMSEMAERMSEMAERMSEMAERMSEMAE
PSO_GF-1/6WFV10.0090.0070.0160.0140.0050.0040.0280.022
WFV20.0050.0040.0050.0040.0070.0060.0270.023
WFV30.0080.0060.0060.0050.0060.0040.0290.021
WFV40.0050.0040.0060.0040.0130.0090.0260.022
RTM-BRDFWFV10.0080.0060.0140.0120.0080.0060.0270.022
WFV20.0070.0040.0060.0050.0090.0070.0180.013
WFV30.0070.0050.0070.0060.0080.0060.0250.019
WFV40.0090.0060.0090.0060.0150.0120.0230.018
OfficialWFV10.0140.0100.0250.0180.0190.0160.0290.022
WFV20.0110.0090.0150.0120.0120.010.0310.024
WFV30.0100.0080.0170.0150.0110.0090.0300.024
WFV40.0150.0130.0260.0210.0170.0150.0370.031
Disclaimer/Publisher’s Note: The statements, opinions and data contained in all publications are solely those of the individual author(s) and contributor(s) and not of MDPI and/or the editor(s). MDPI and/or the editor(s) disclaim responsibility for any injury to people or property resulting from any ideas, methods, instructions or products referred to in the content.

