
Spire RO Thermal Profiles for Climate Studies: Initial Comparisons of the Measurements from Spire, NOAA-20 ATMS, Radiosonde, and COSMIC-2

Abstract
:1. Introduction
2. Datasets
2.1. Radio Occultation Data
2.1.1. Spire
2.1.2. COSMIC-2
2.2. NOAA-20/ATMS
2.3. Radiosonde Data
2.4. ERA5
3. Methodology
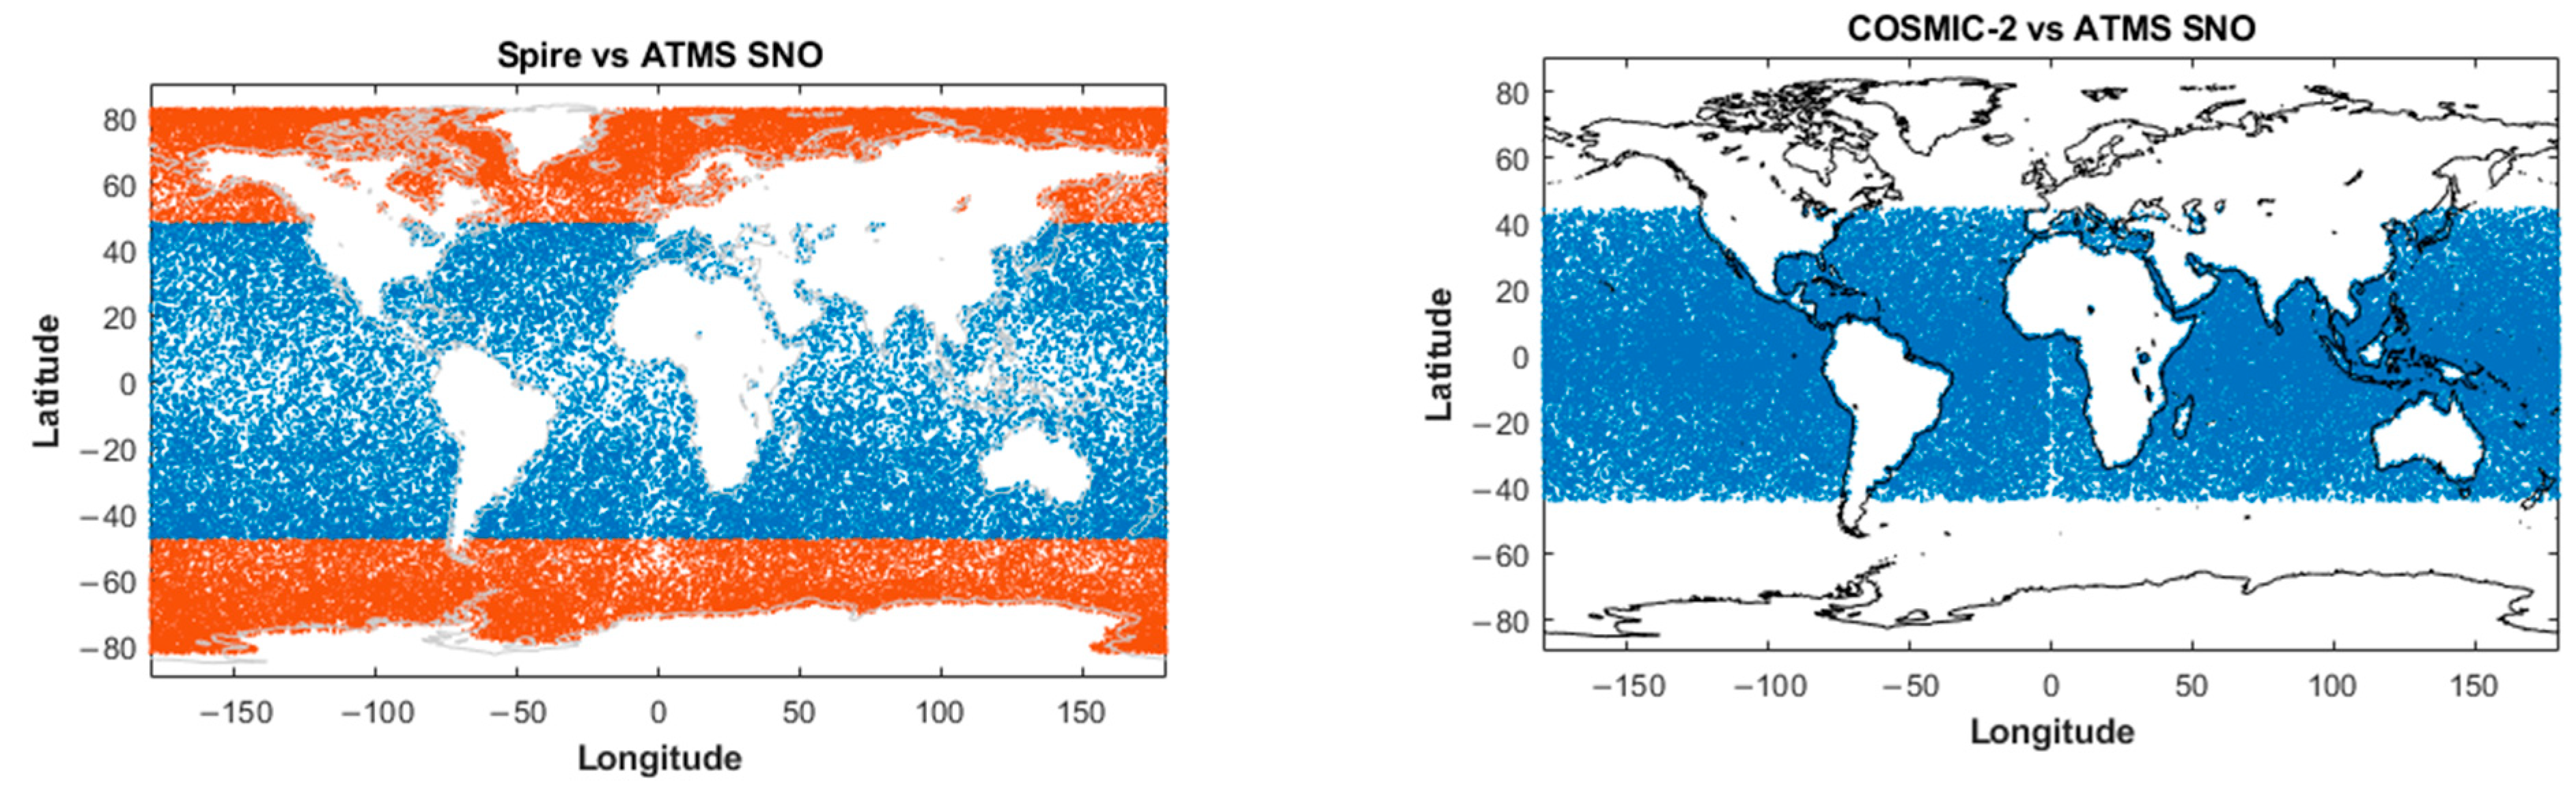
3.1. Latitude Limitations
3.2. Collocation, Quality Control, and Interpolation
3.3. CRTM
4. Results
4.1. Overall Evaluation of and Its Trends over Ocean (Land)
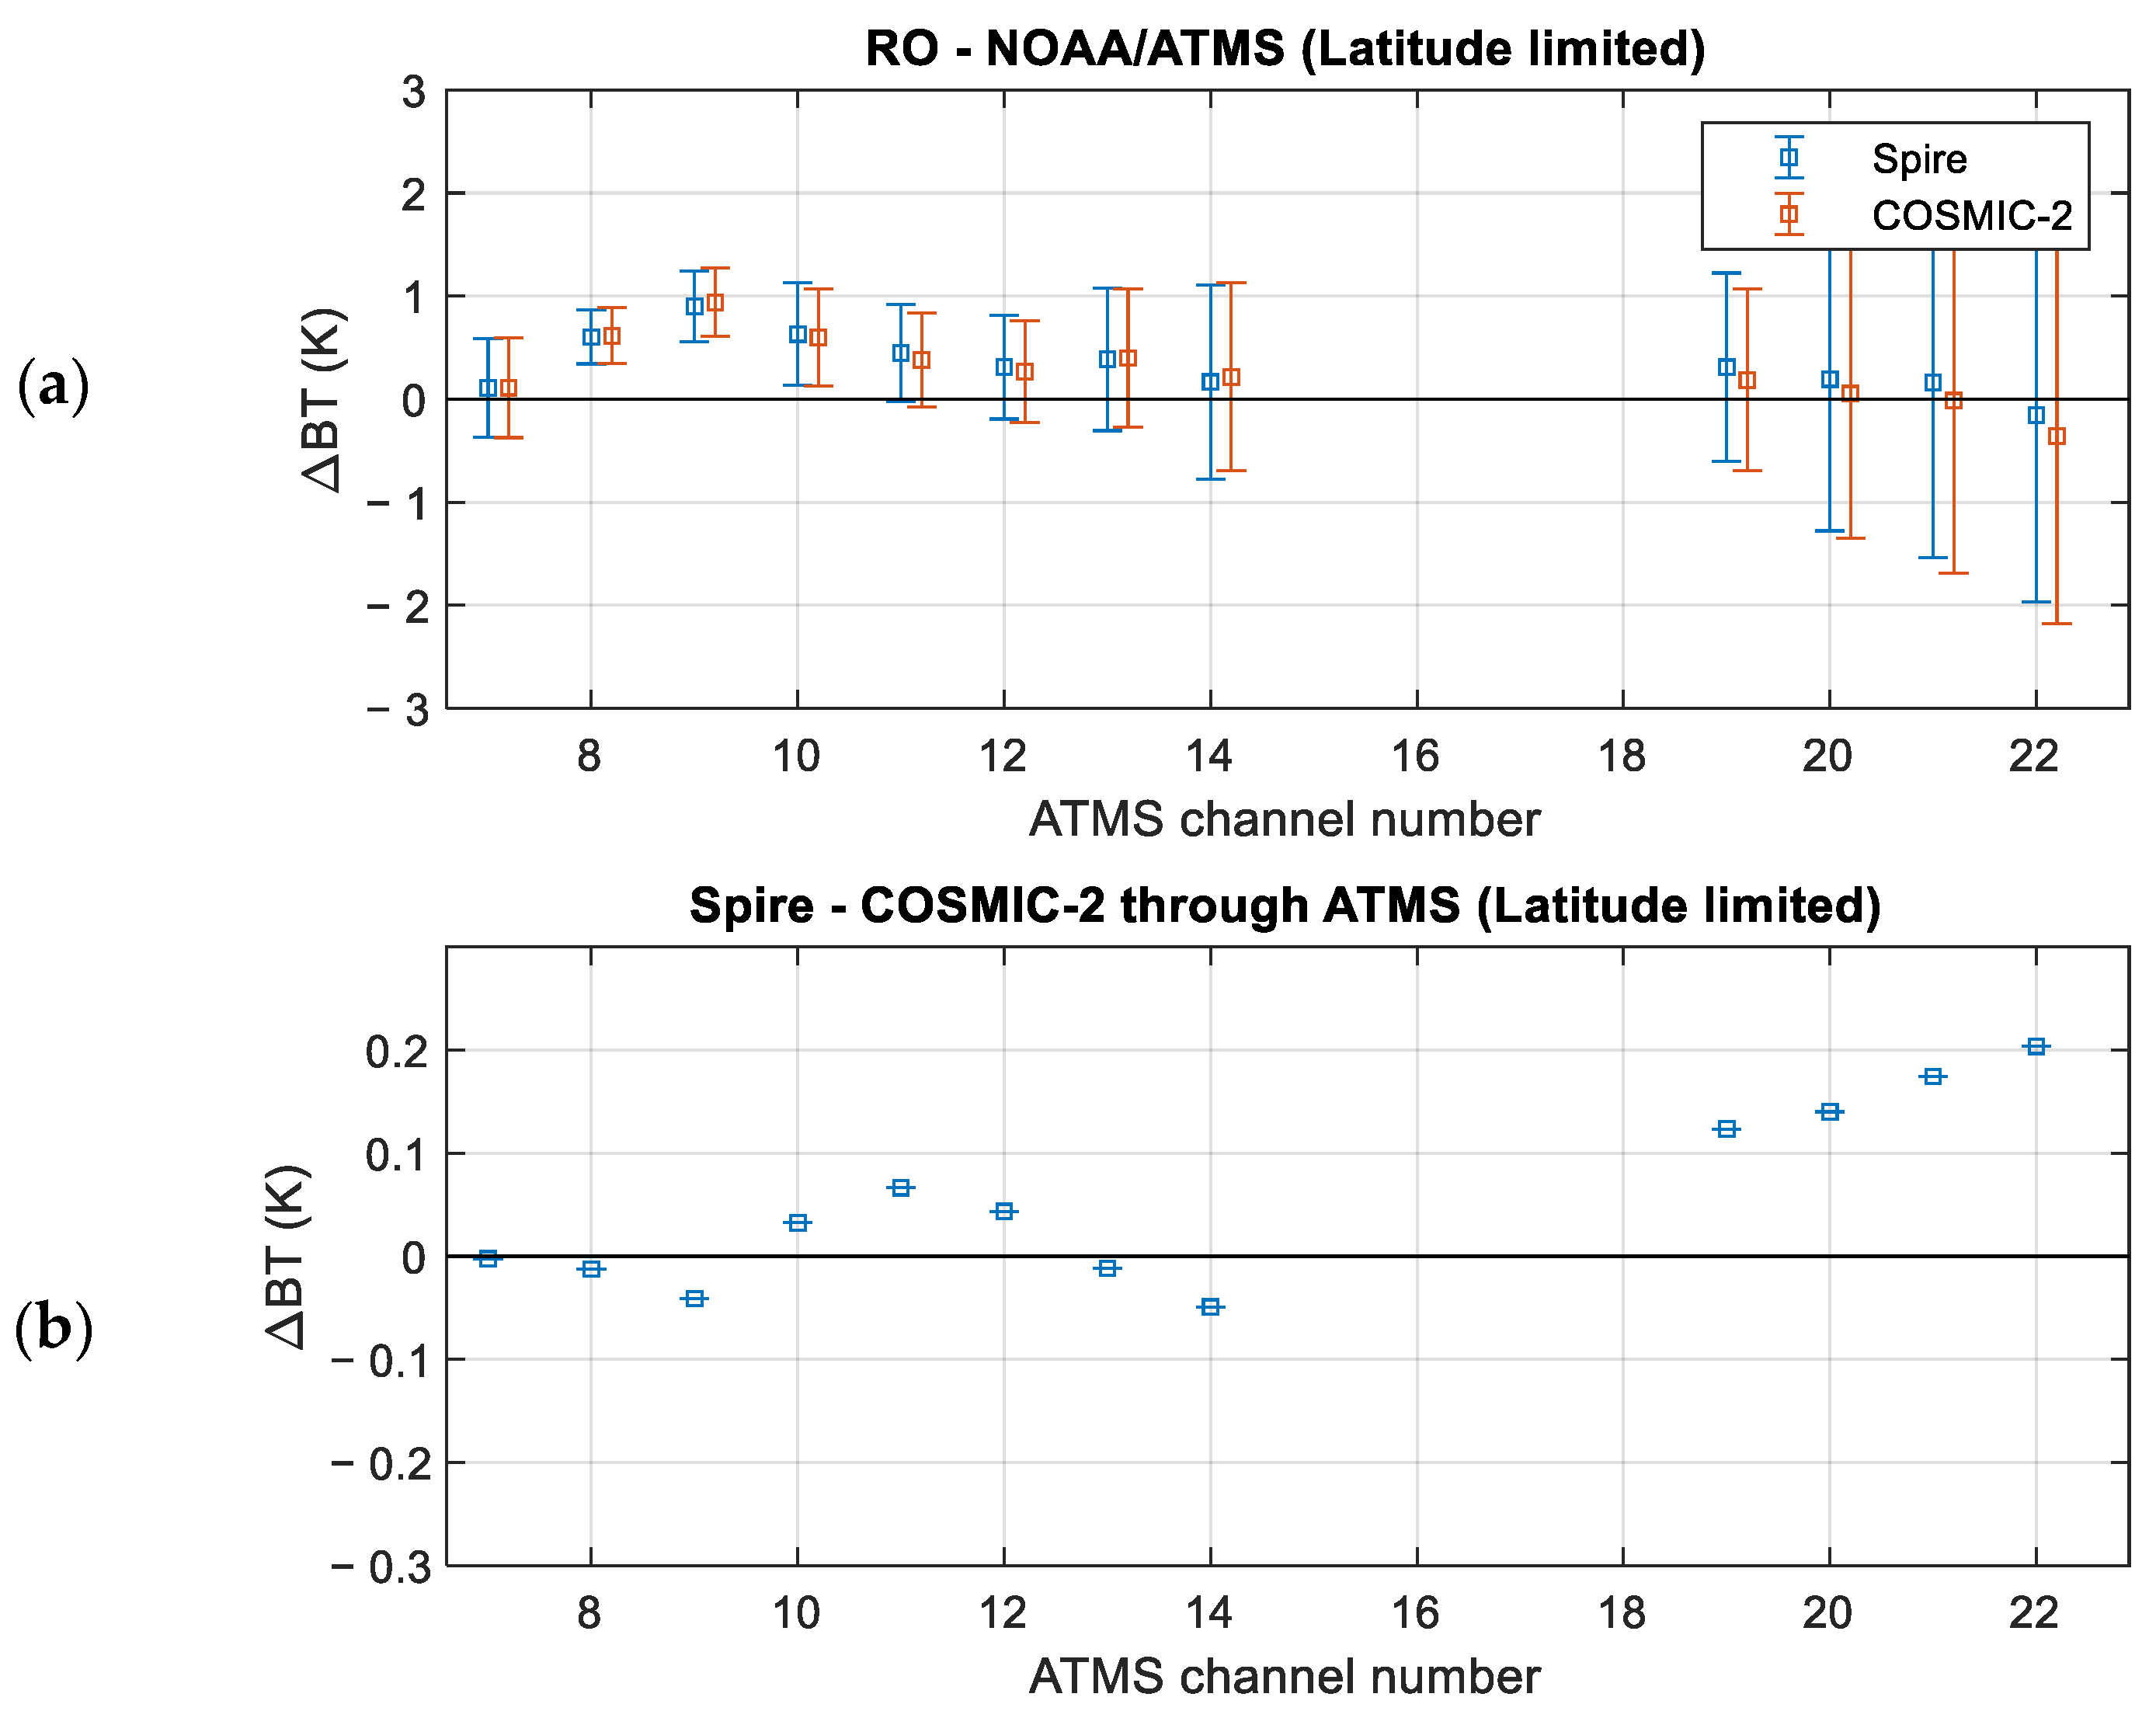
4.1.1. ∆BT and Evaluation
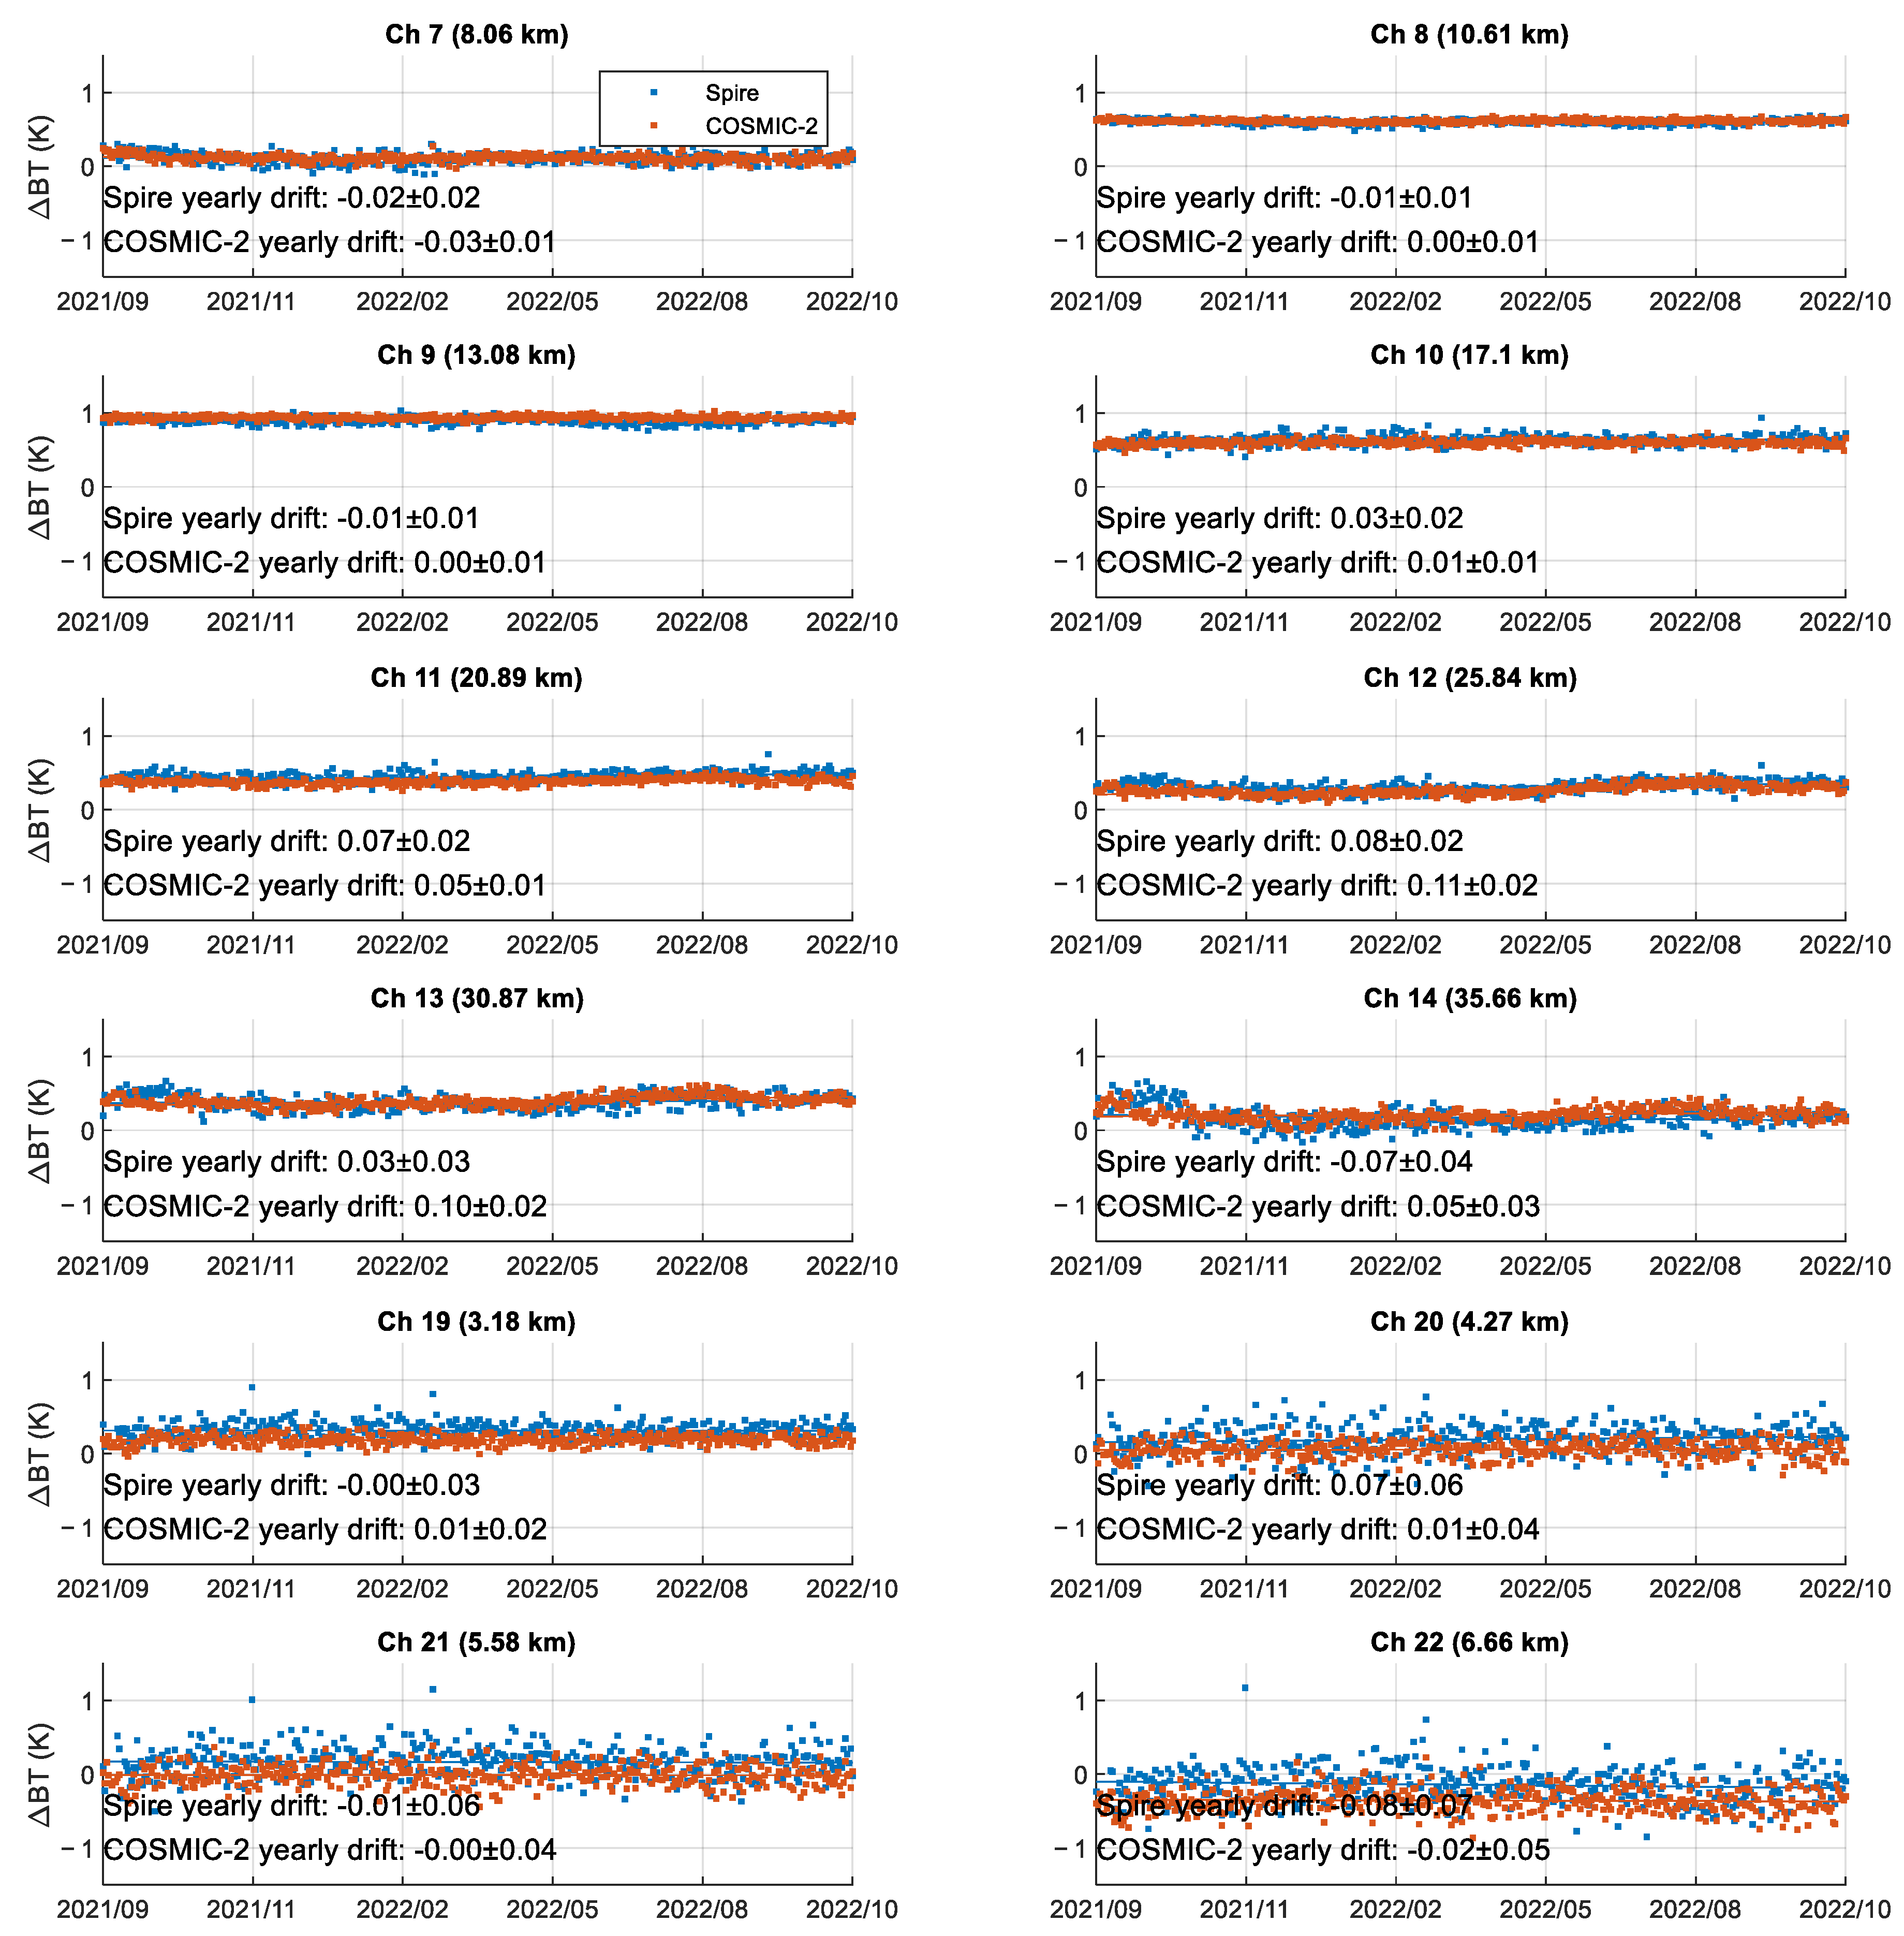
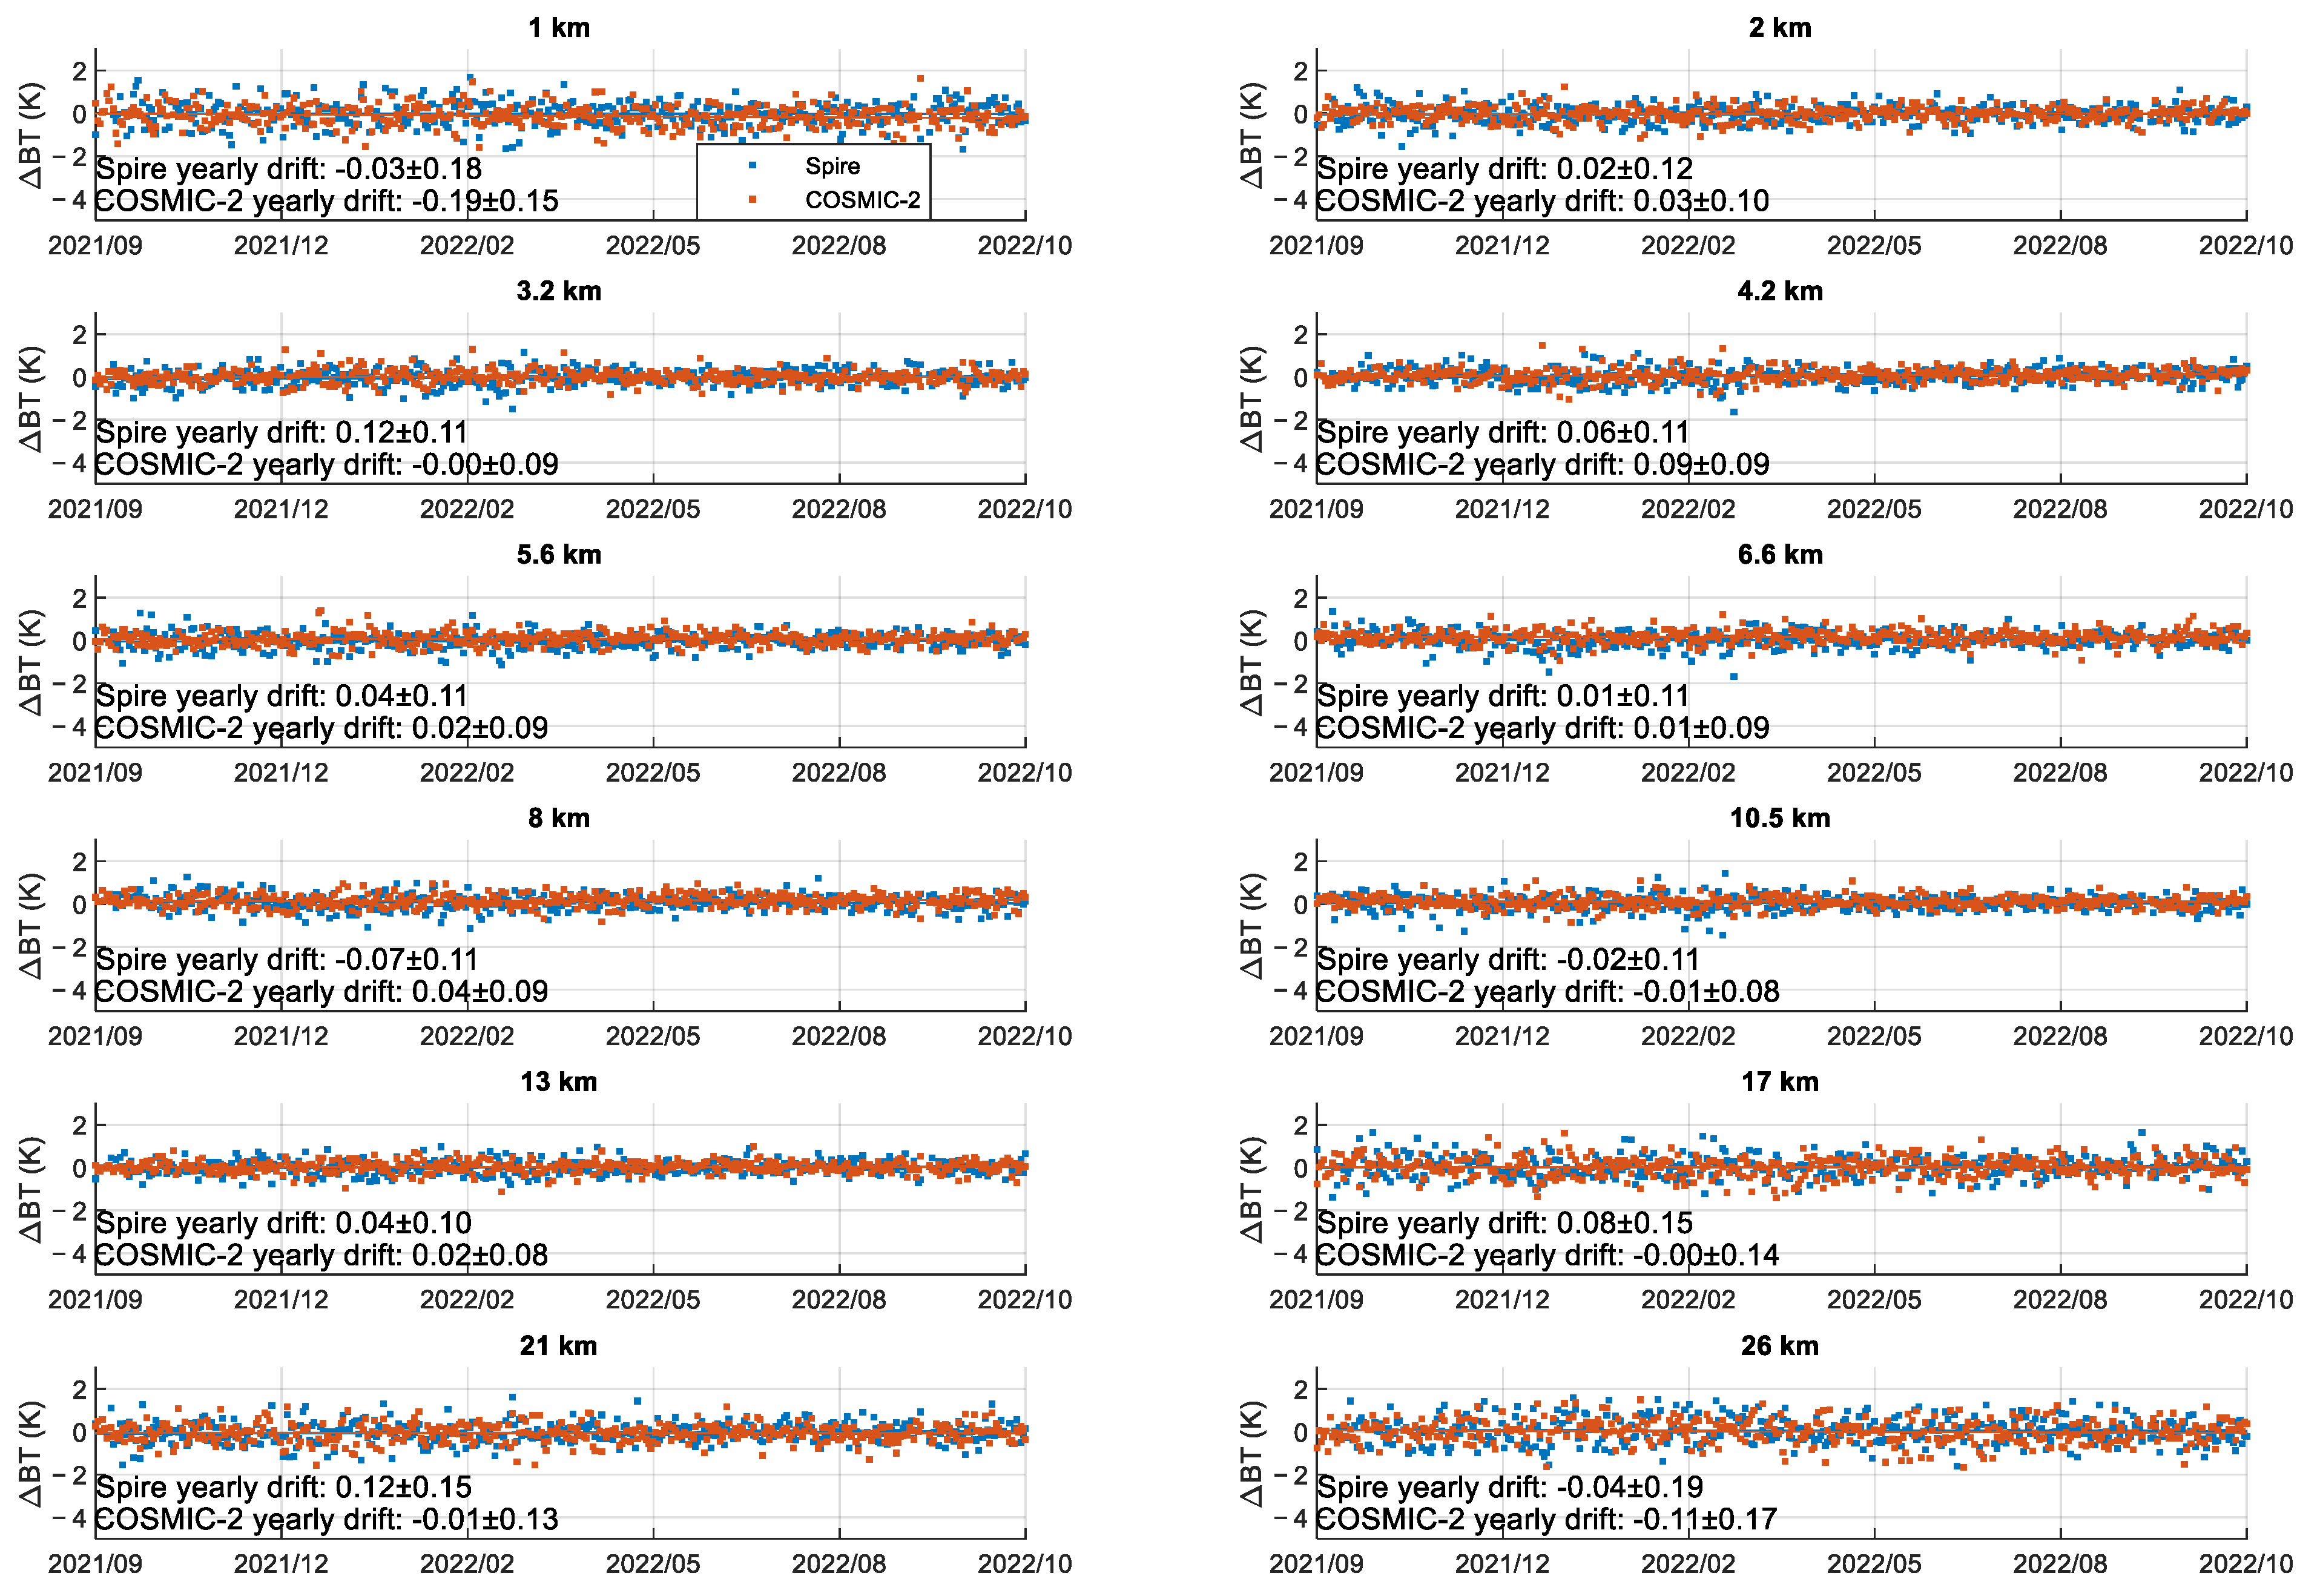
4.1.2. Trend Evaluation
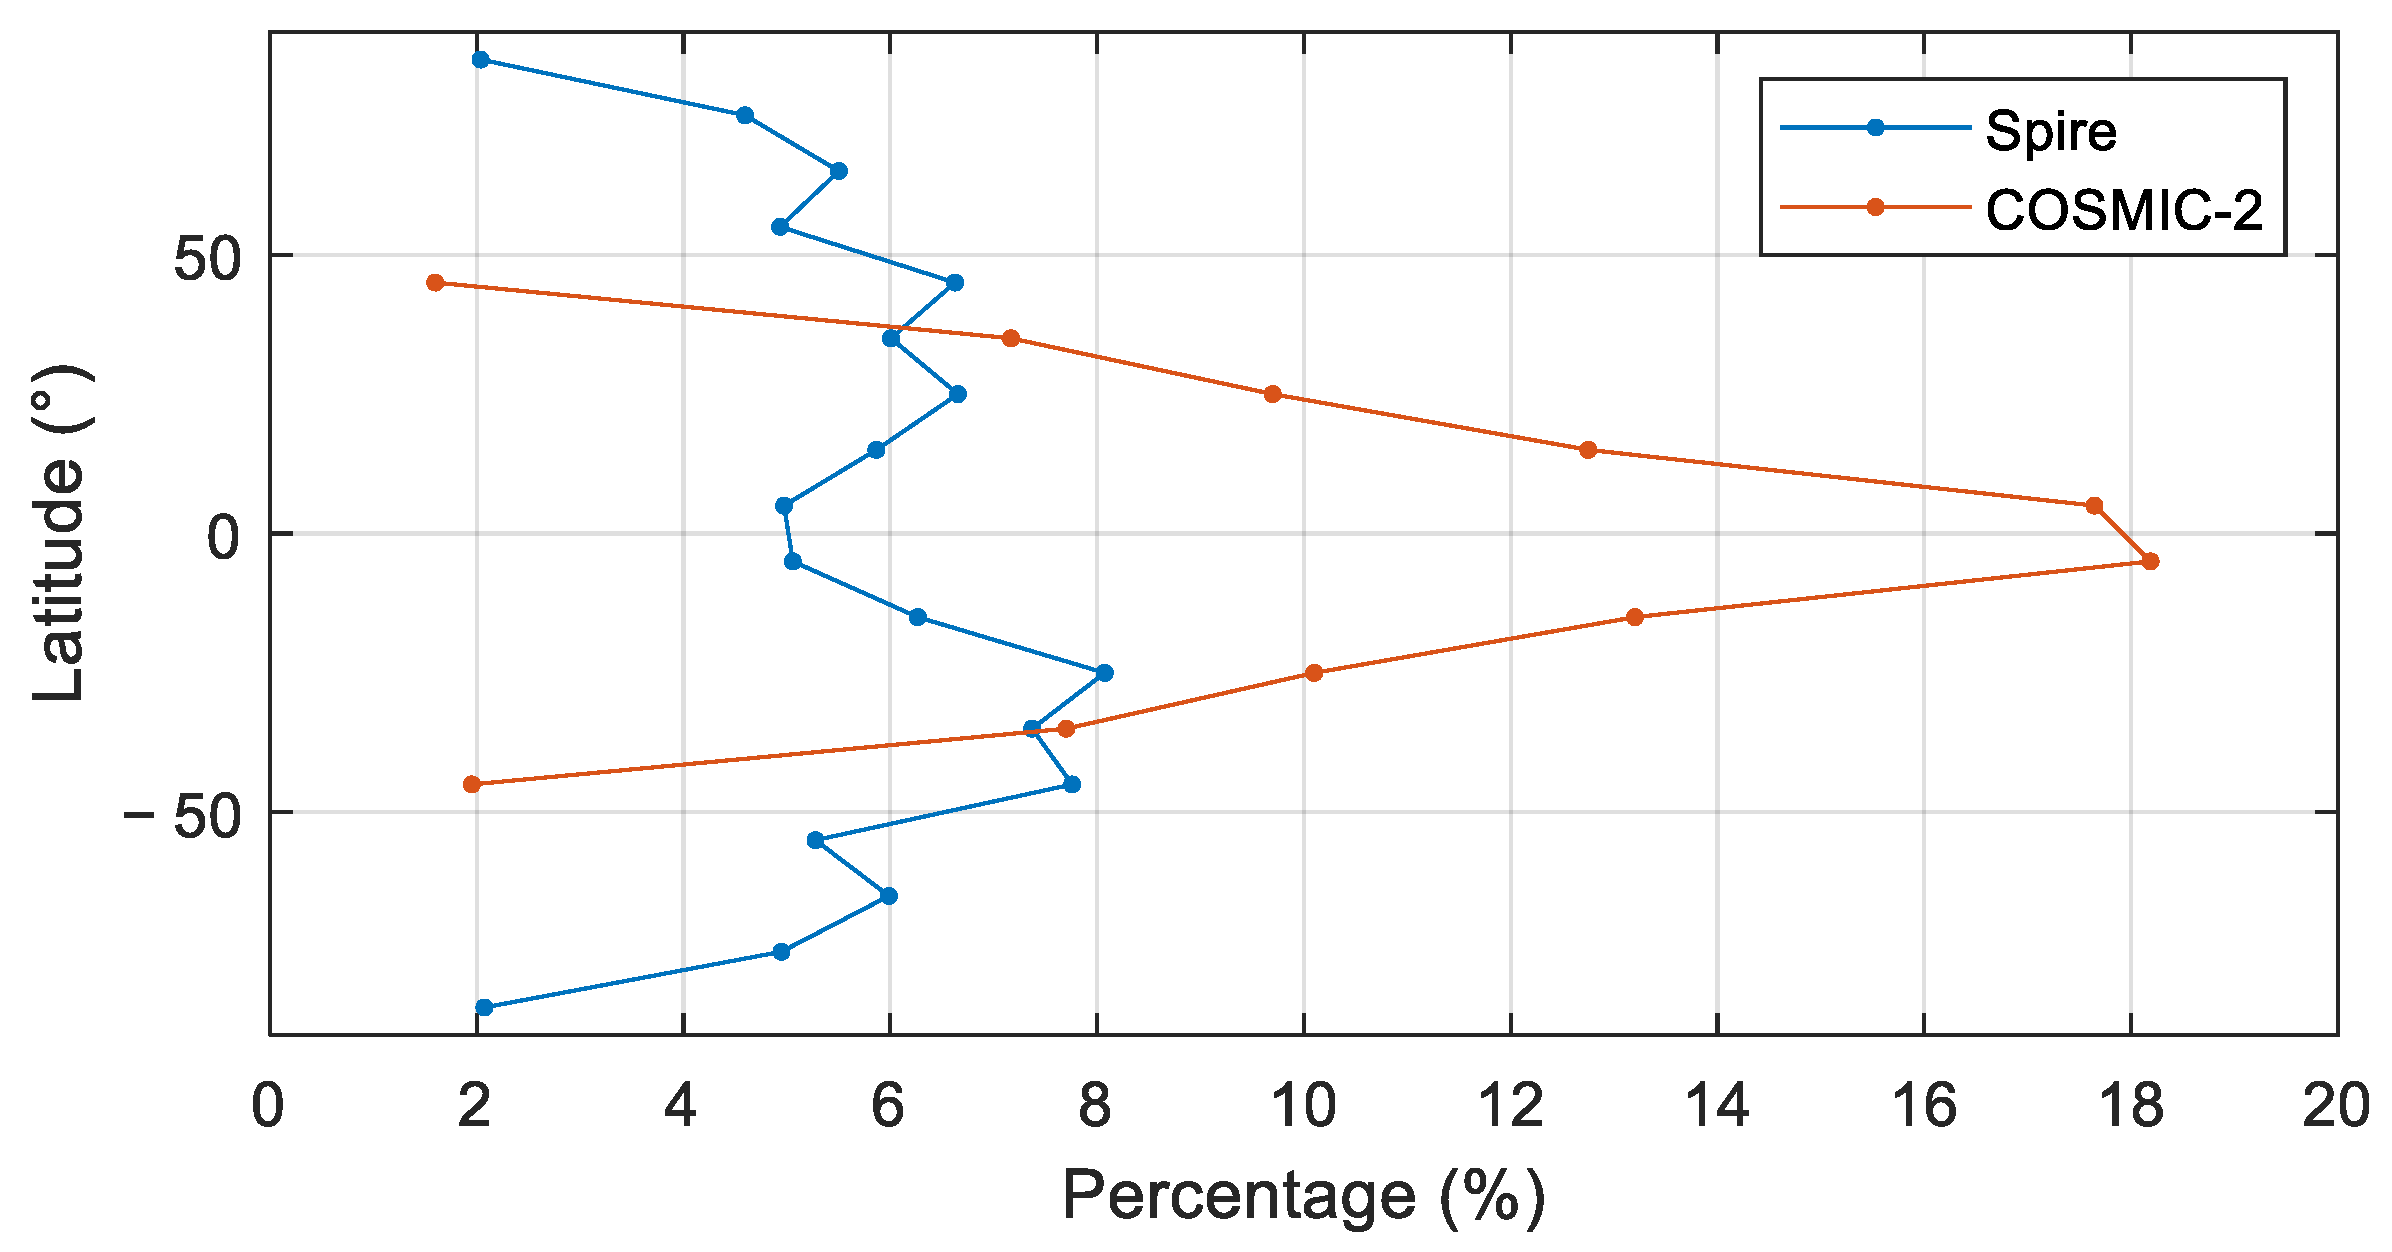
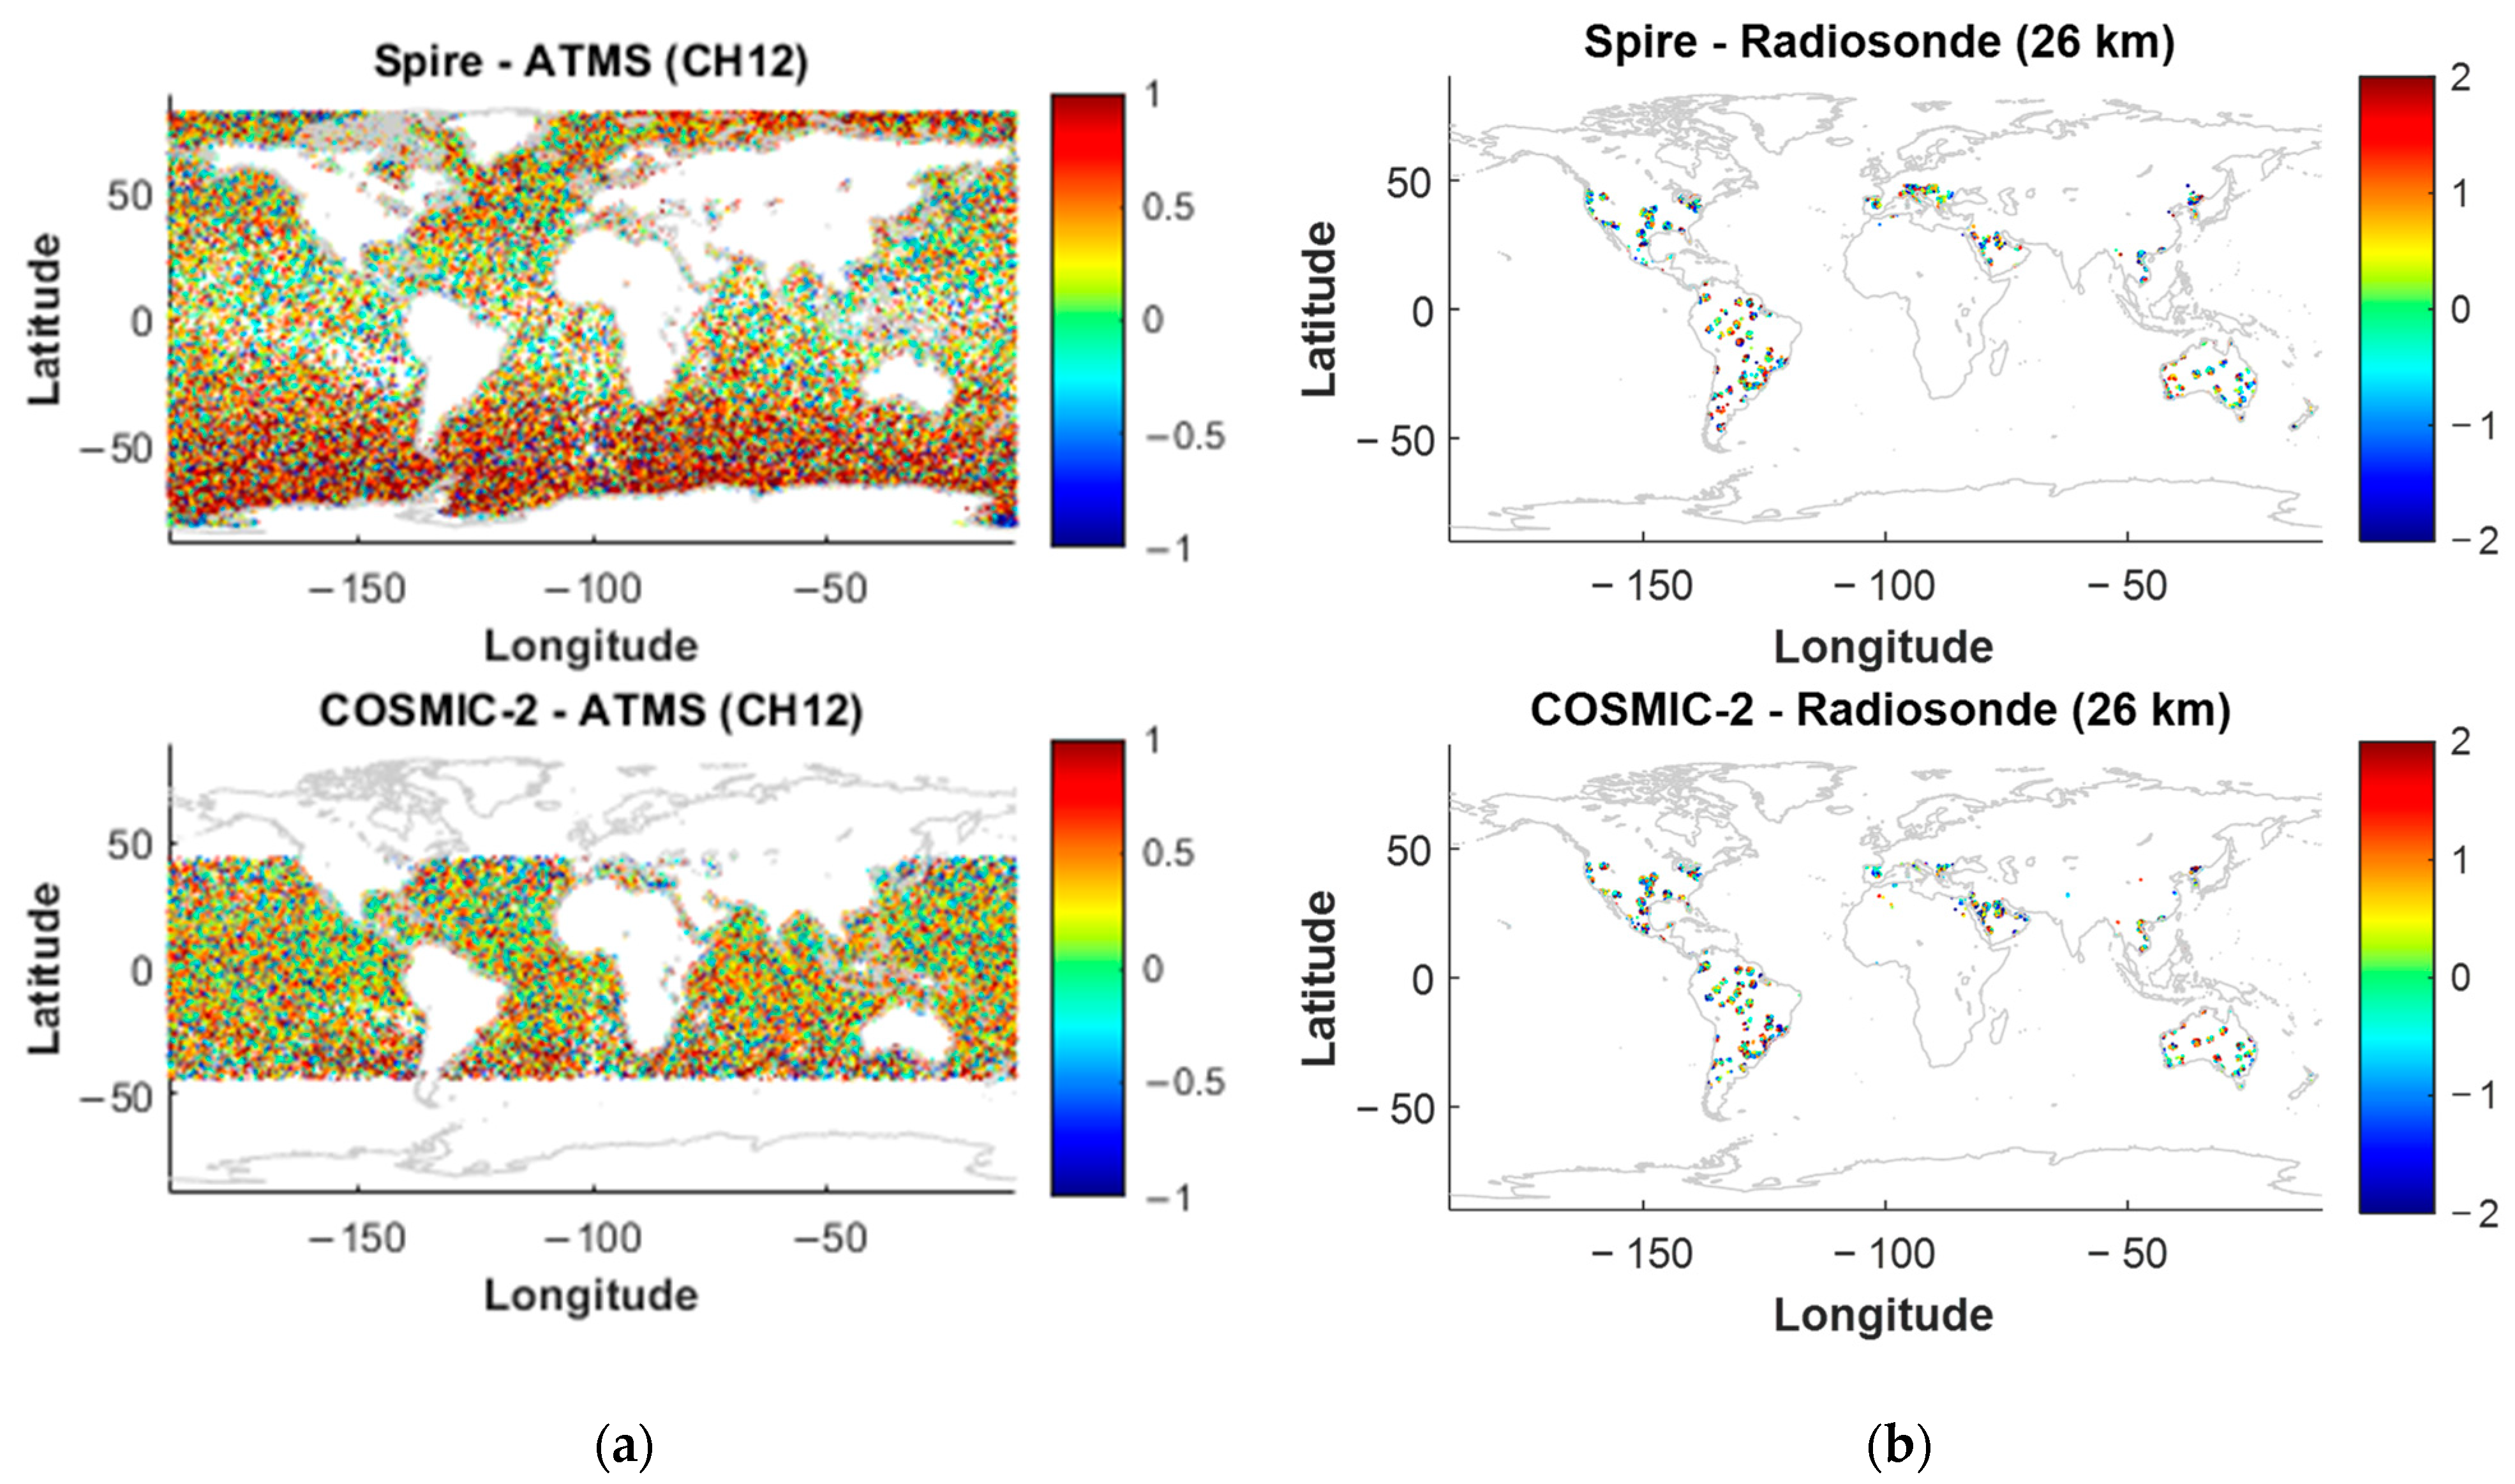
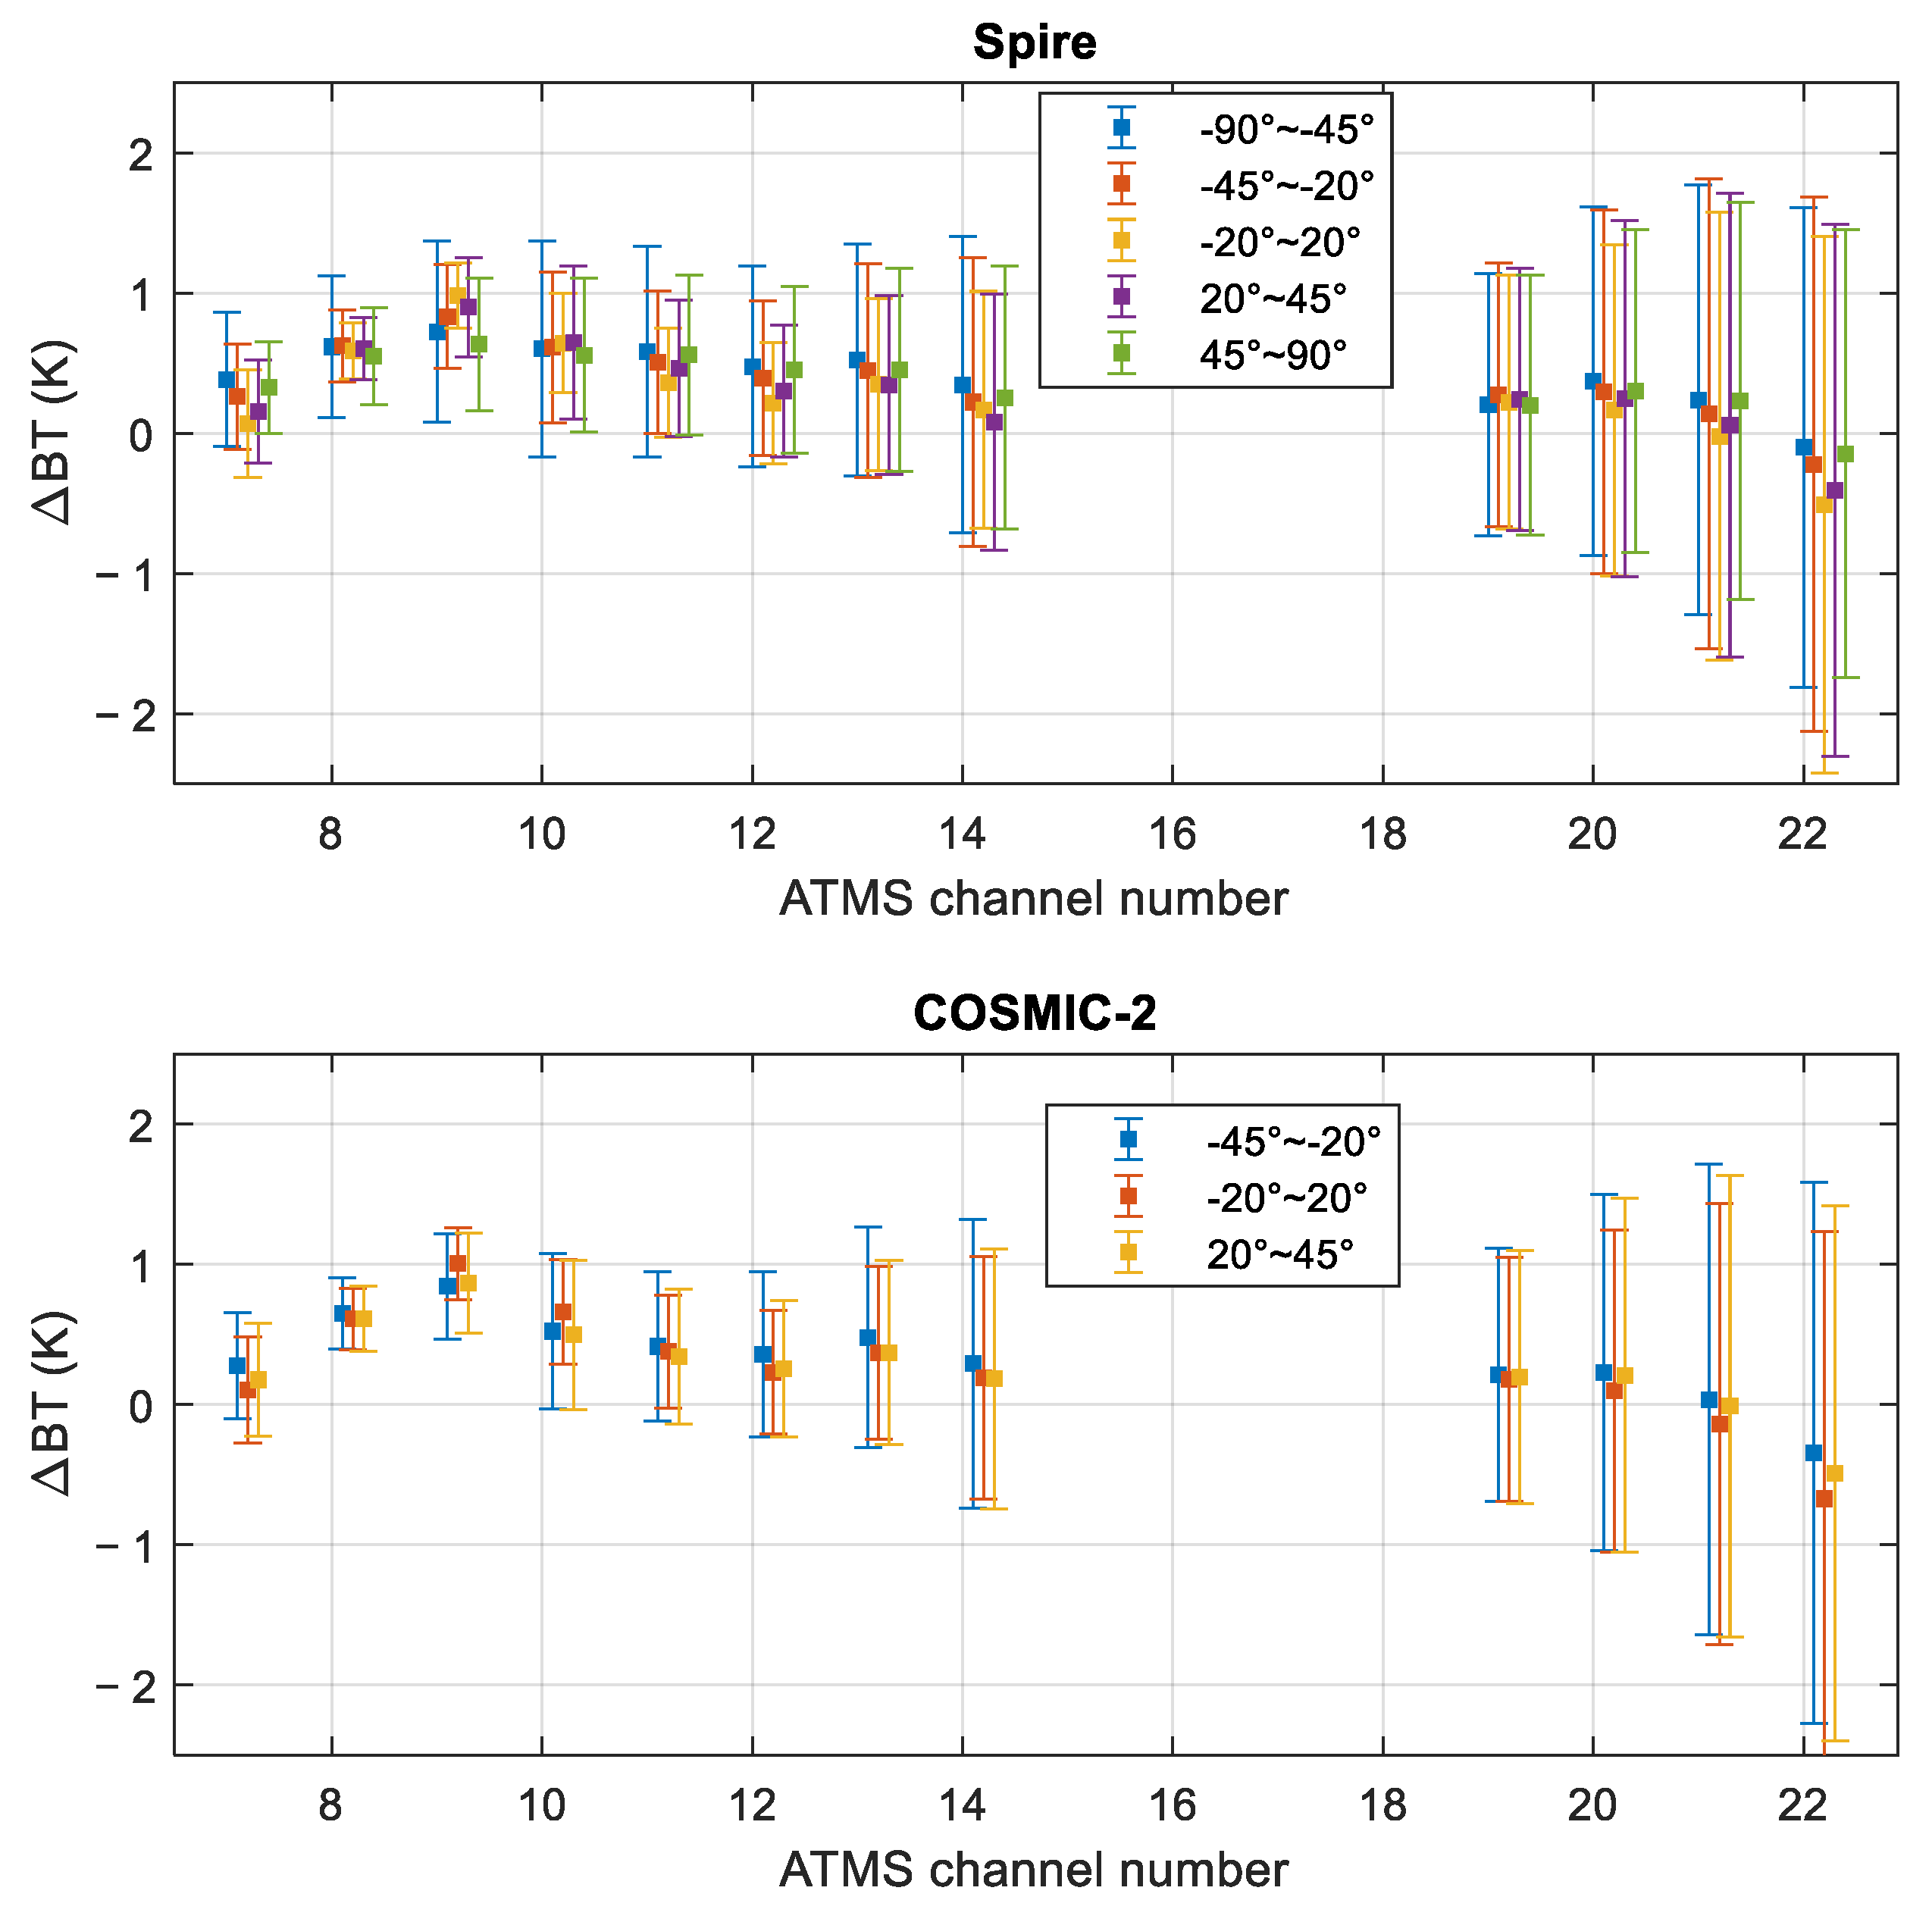
4.2. The Latitude Dependency Evaluation of BT Simulated with SPIRE and COSMIC-2 RO Soundings Using ATMS BT as a Reference
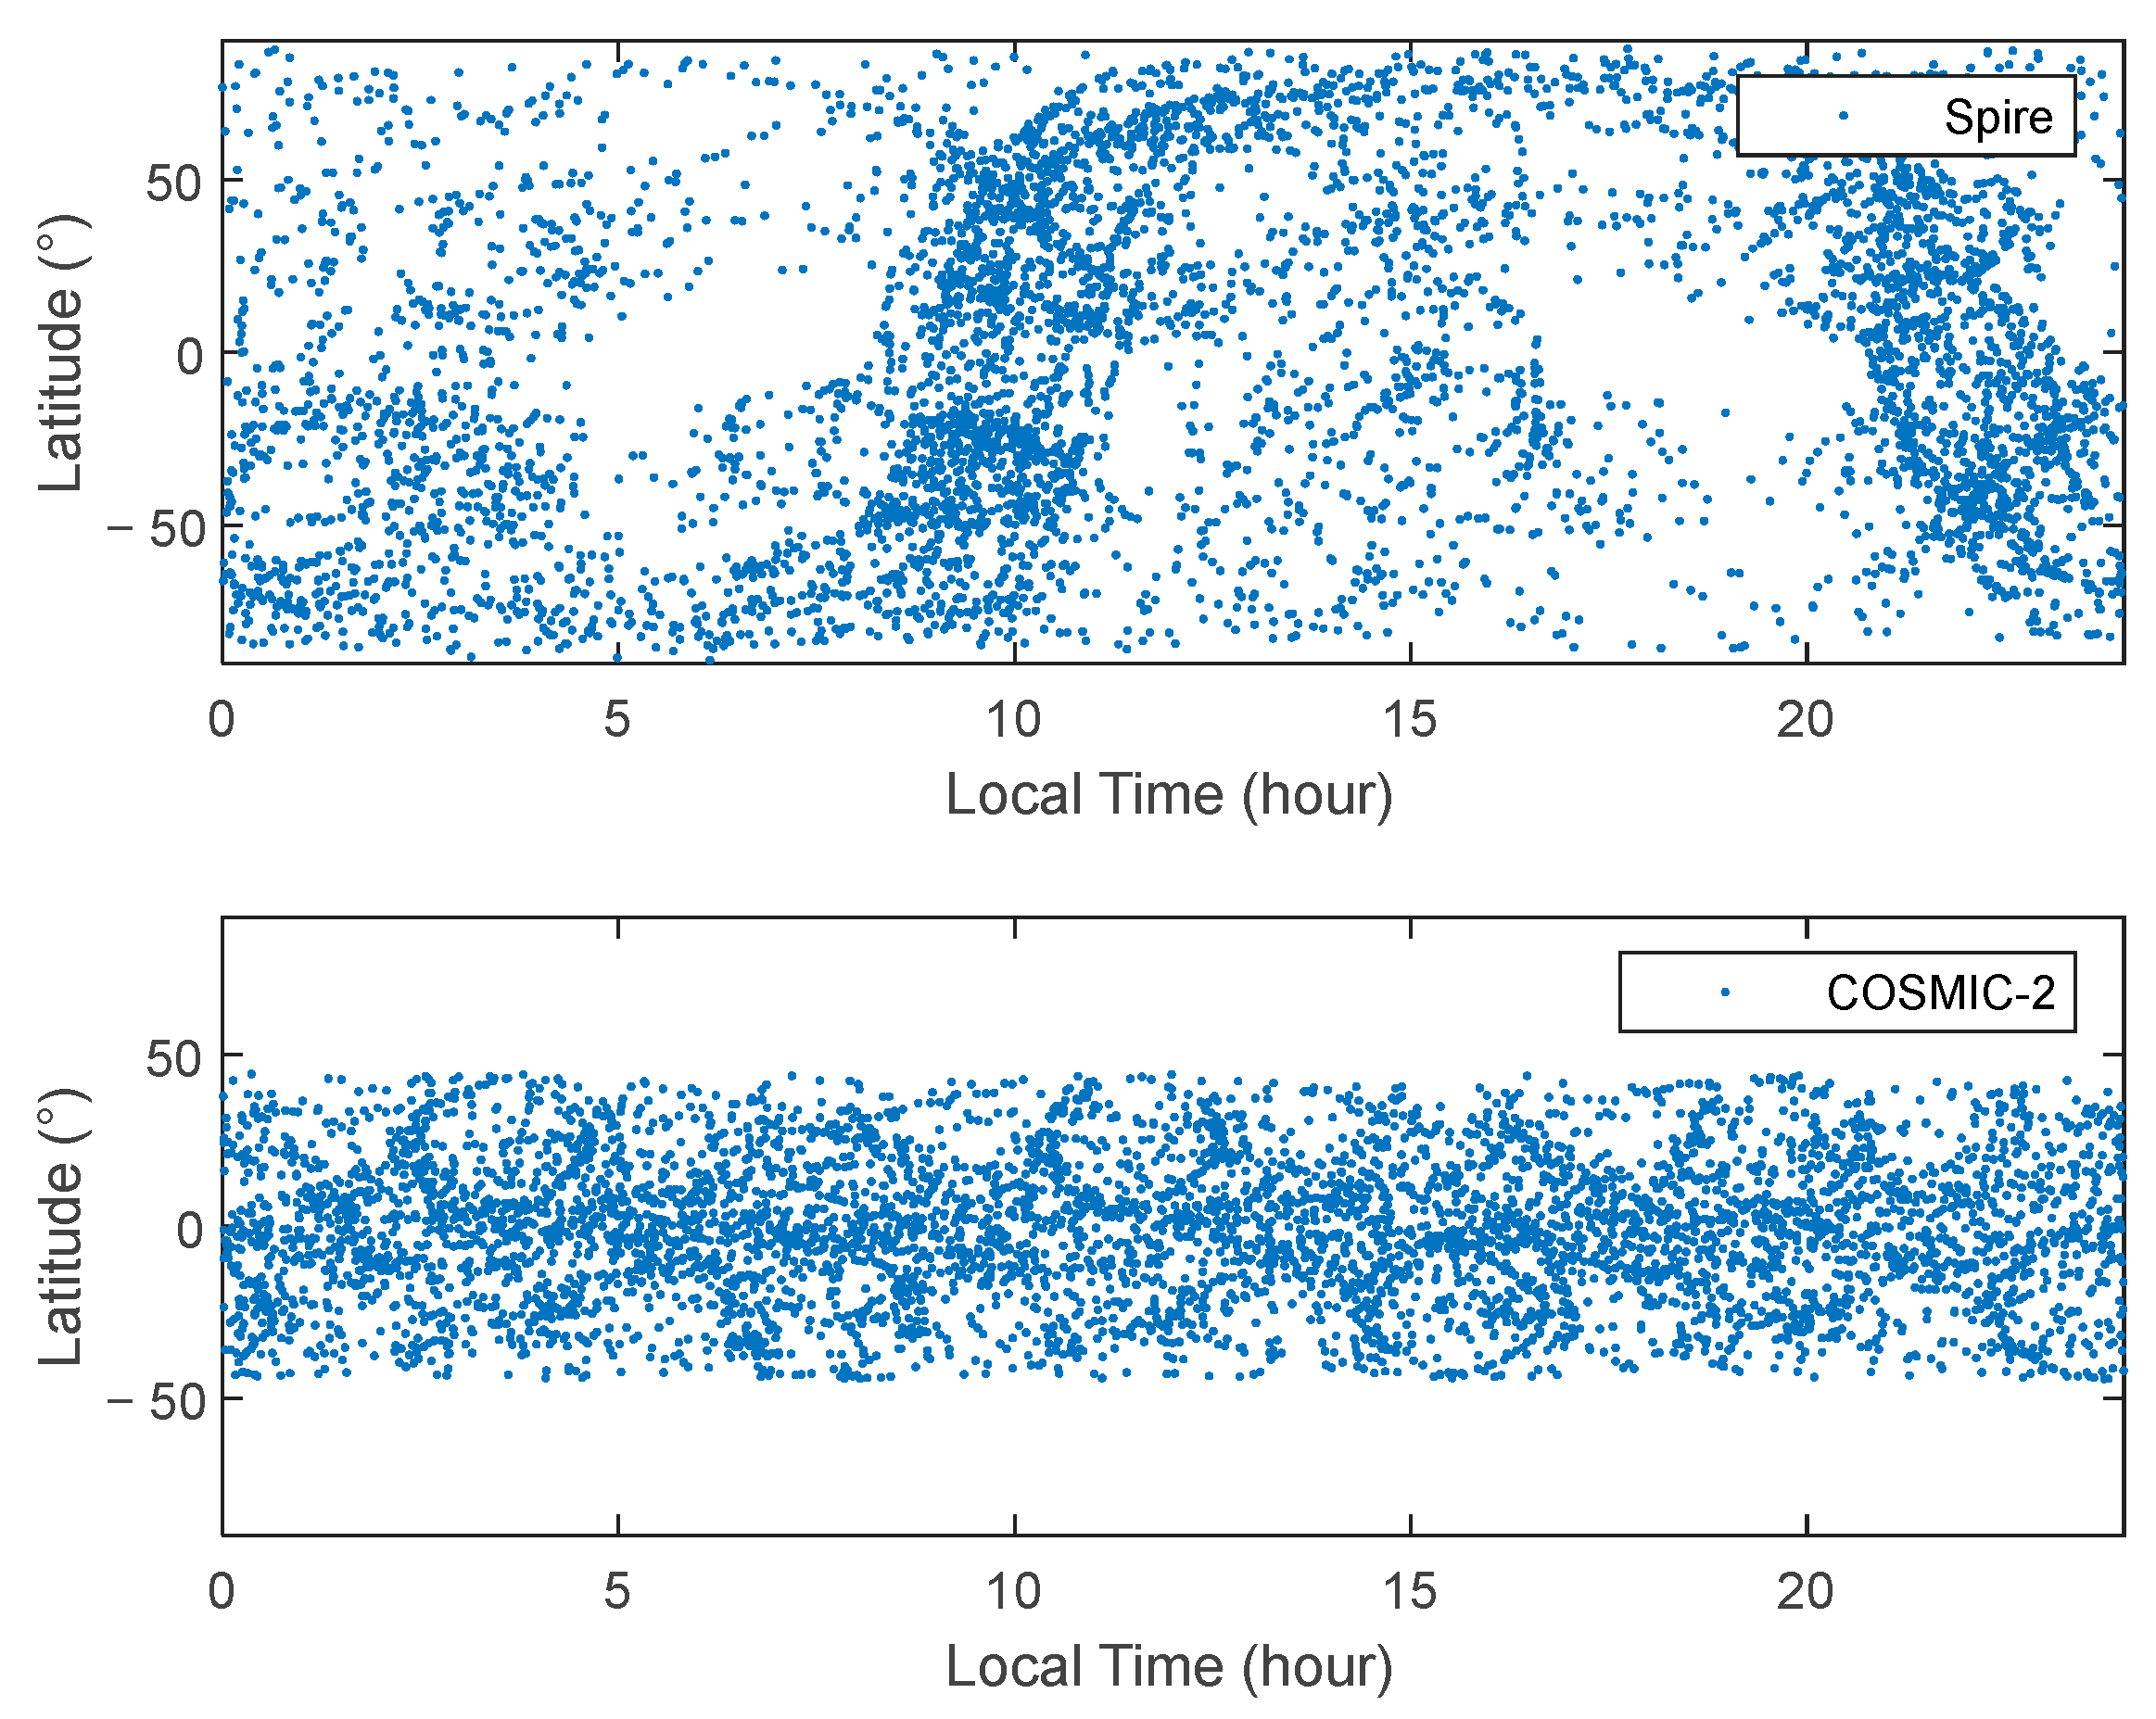
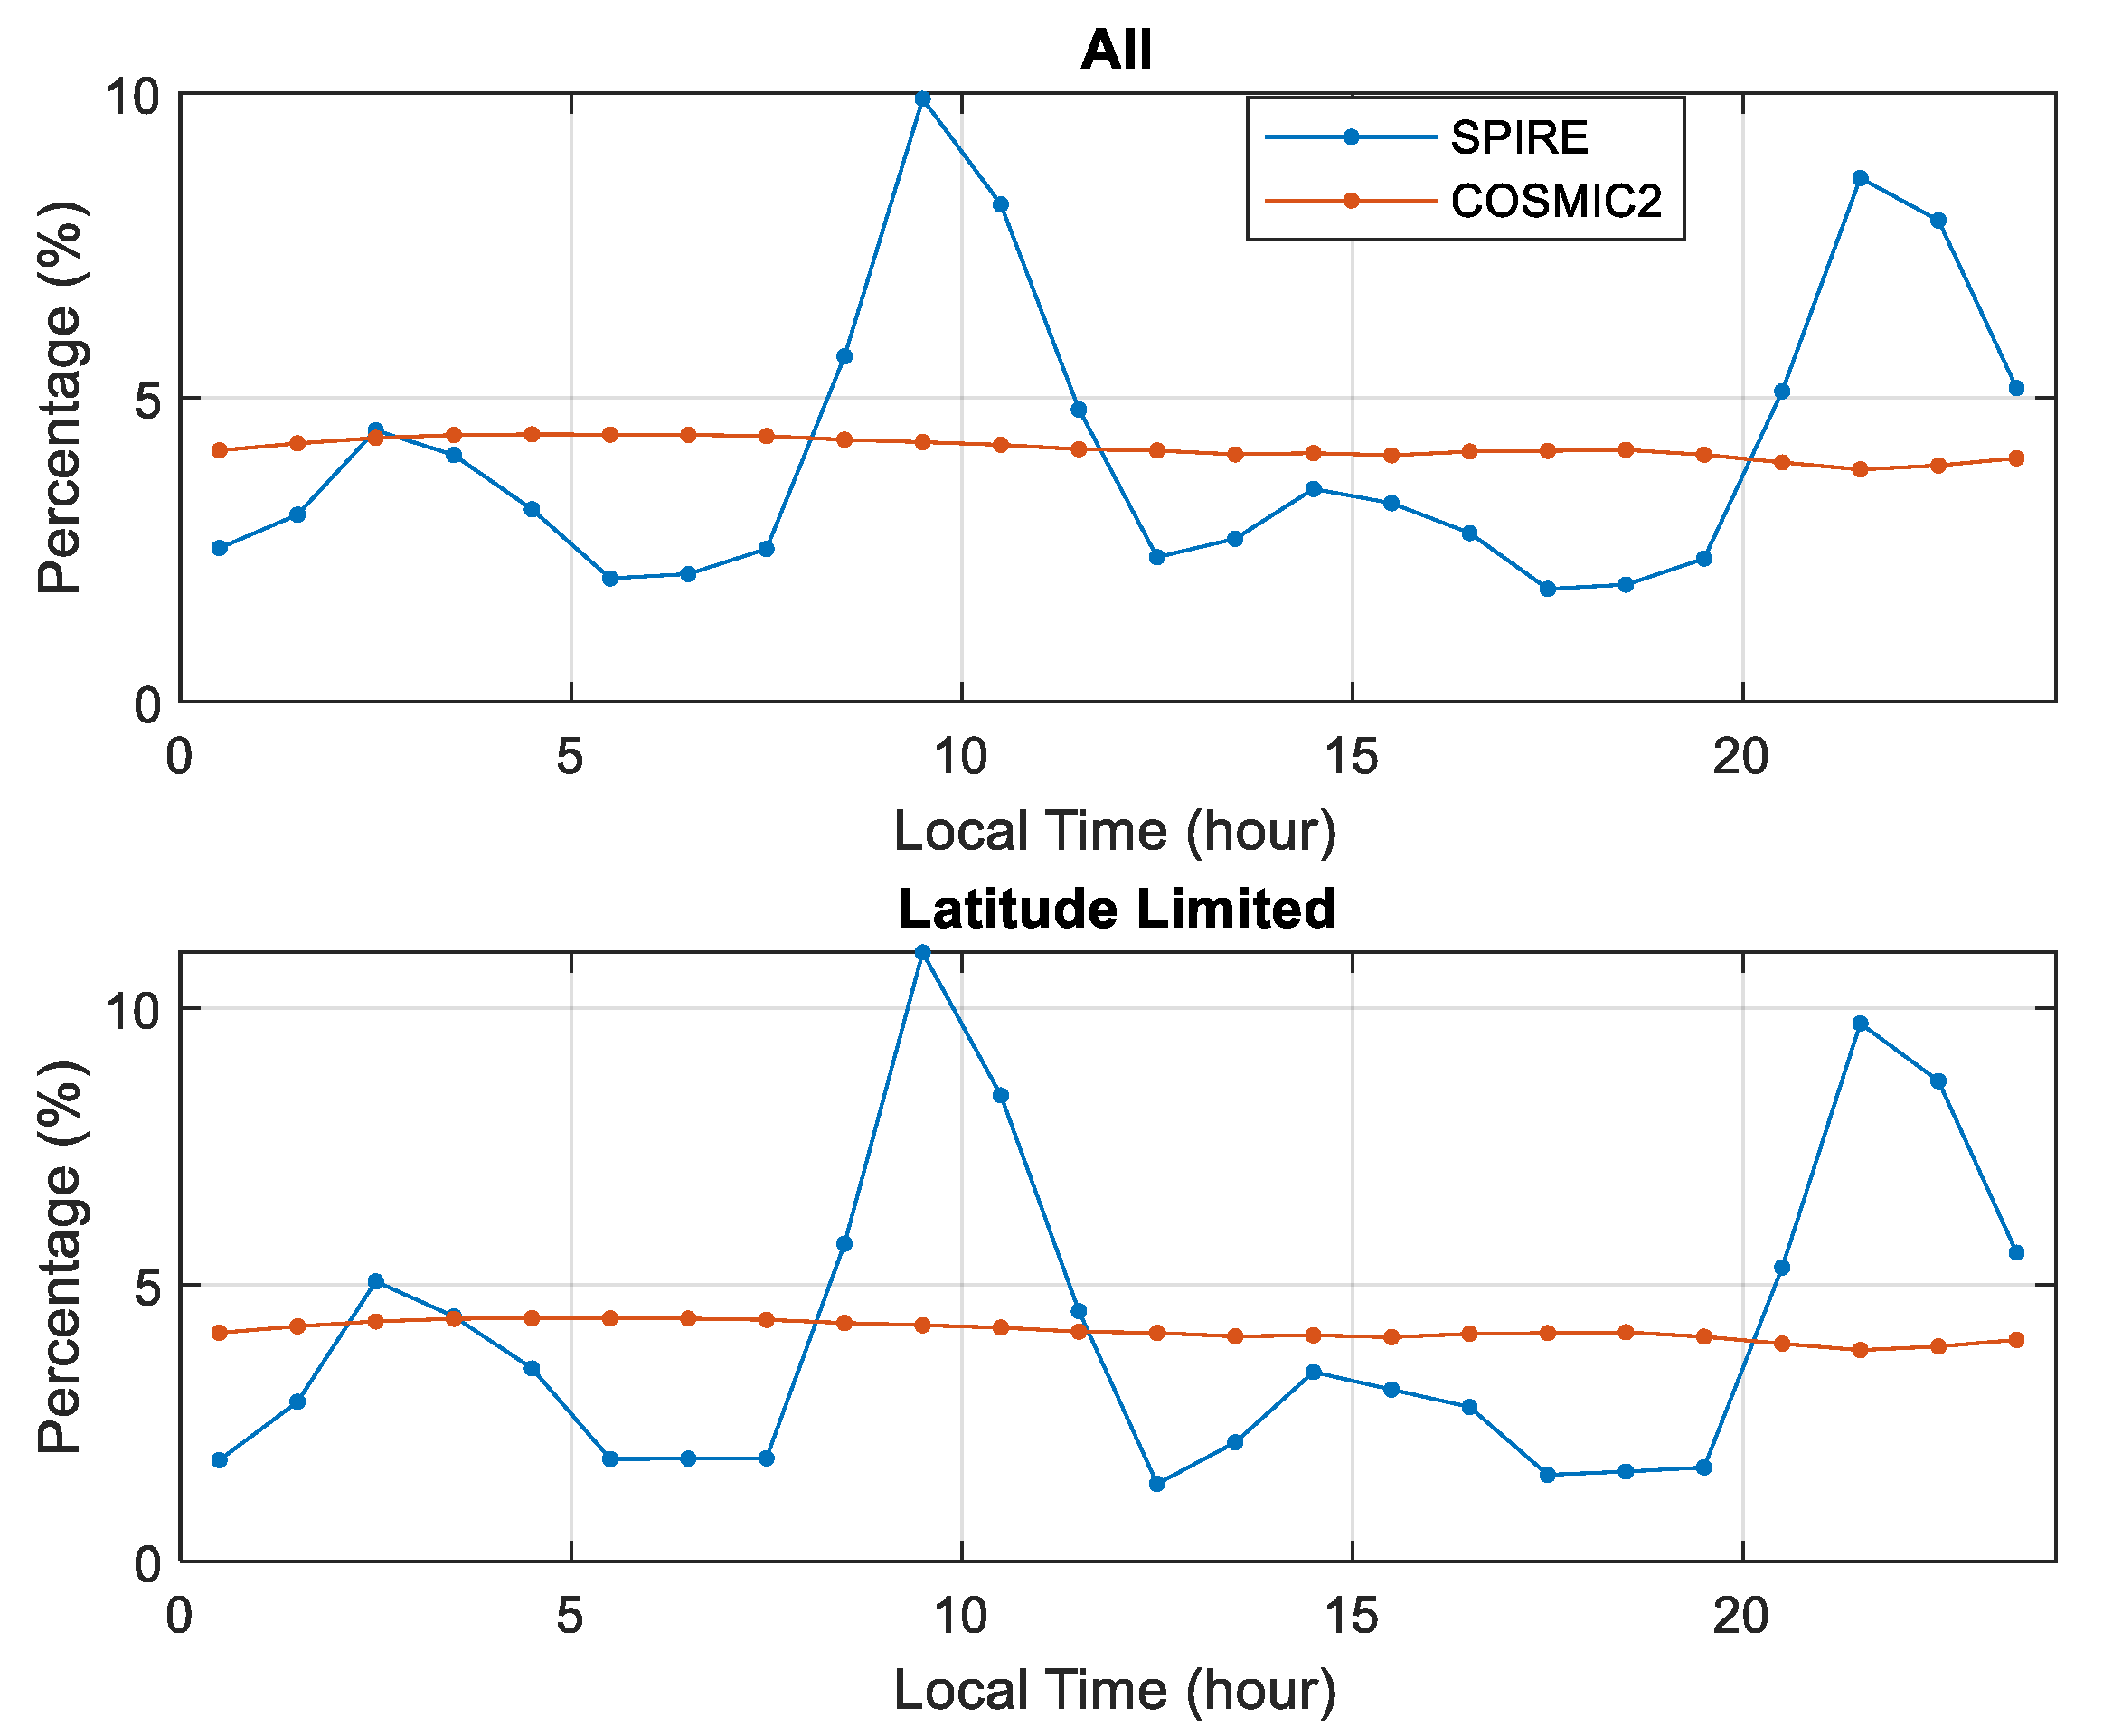
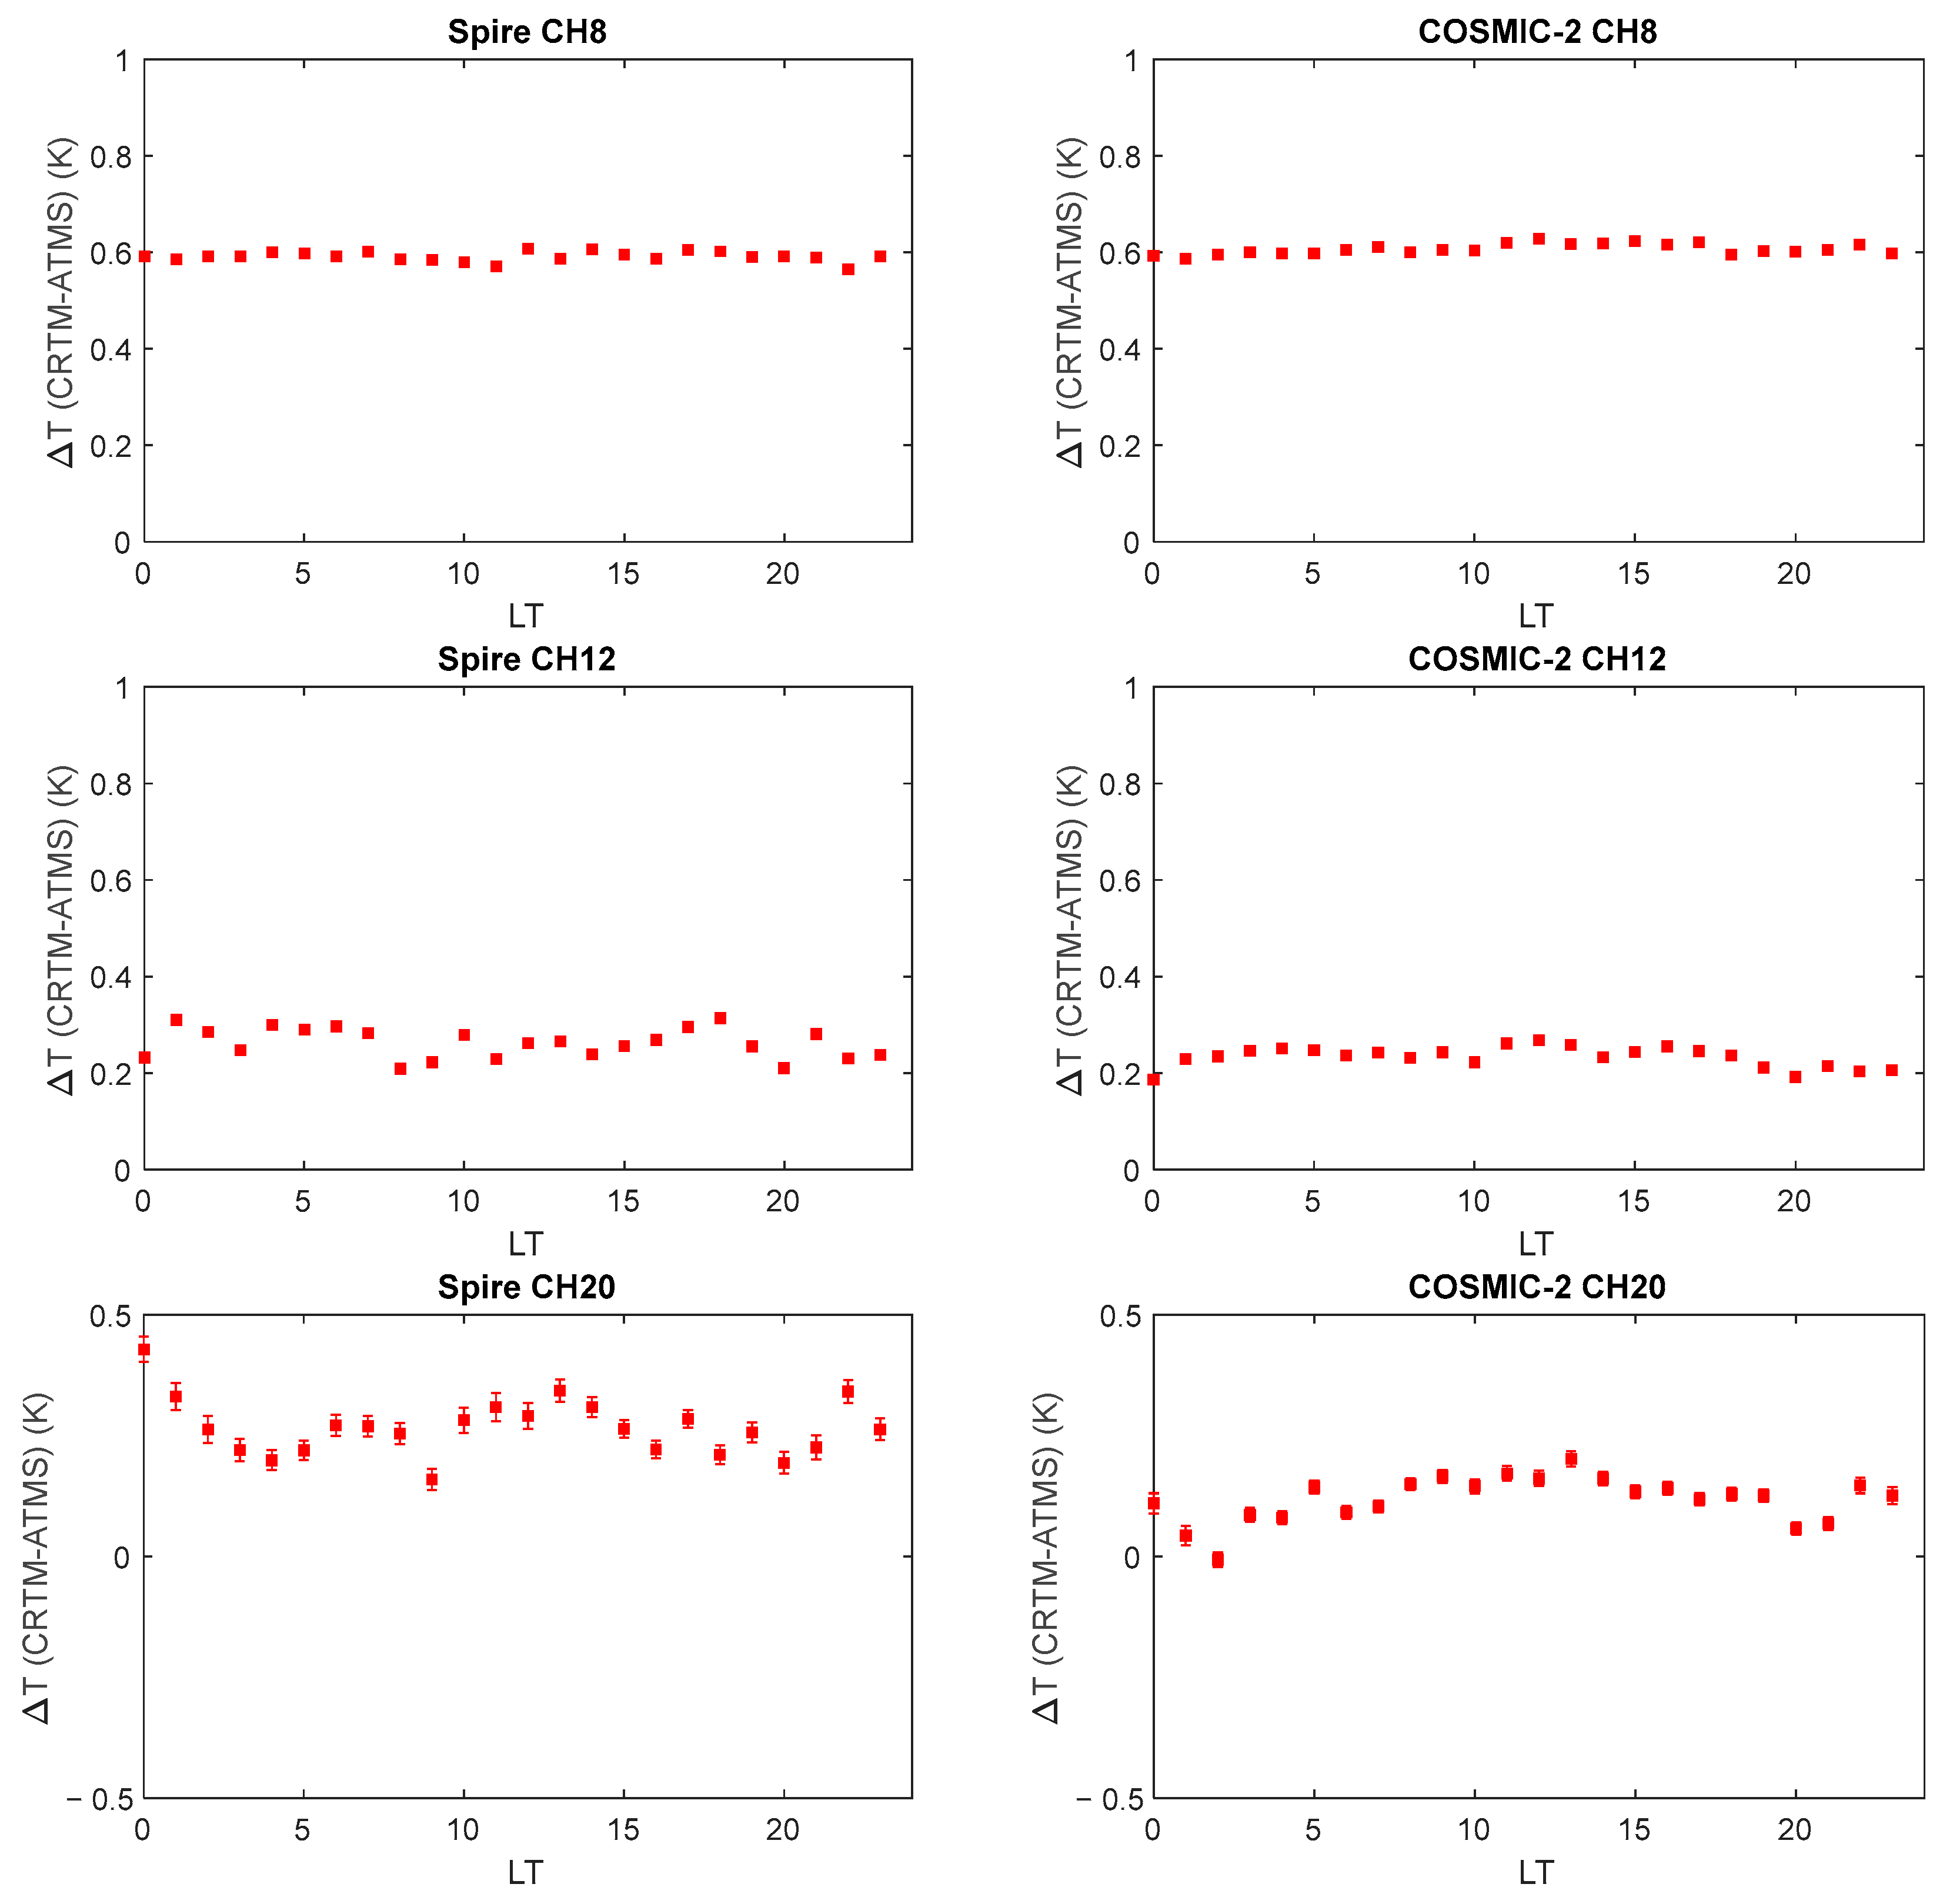
4.3. The Local Time Dependency Evaluation of BT Simulated with Spire and COSMIC-2 RO Soundings Using ATMS BT as a Reference
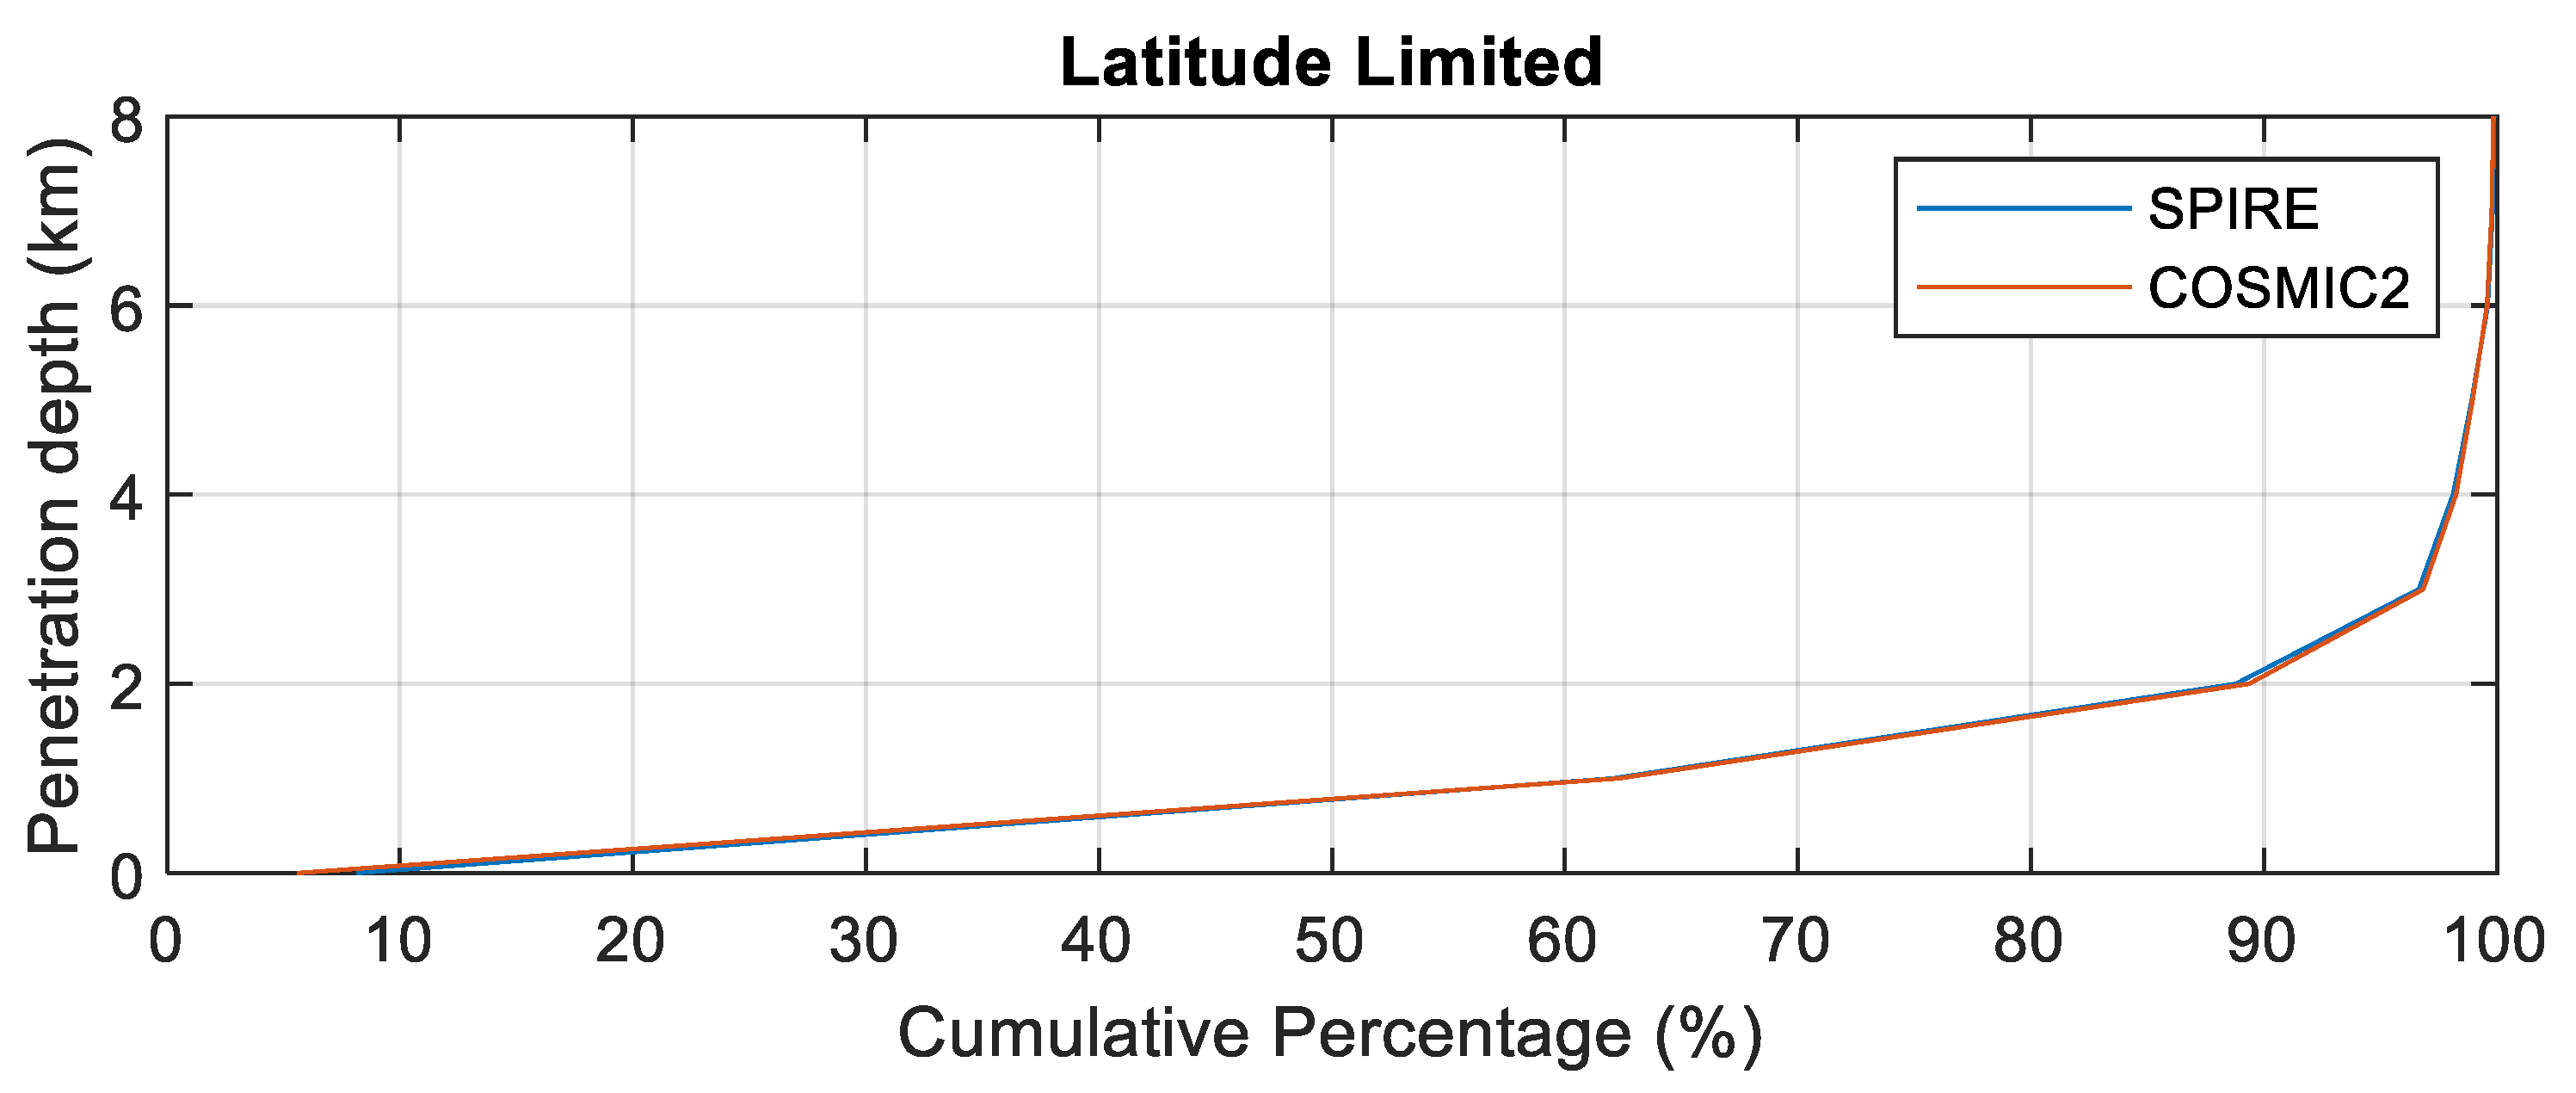
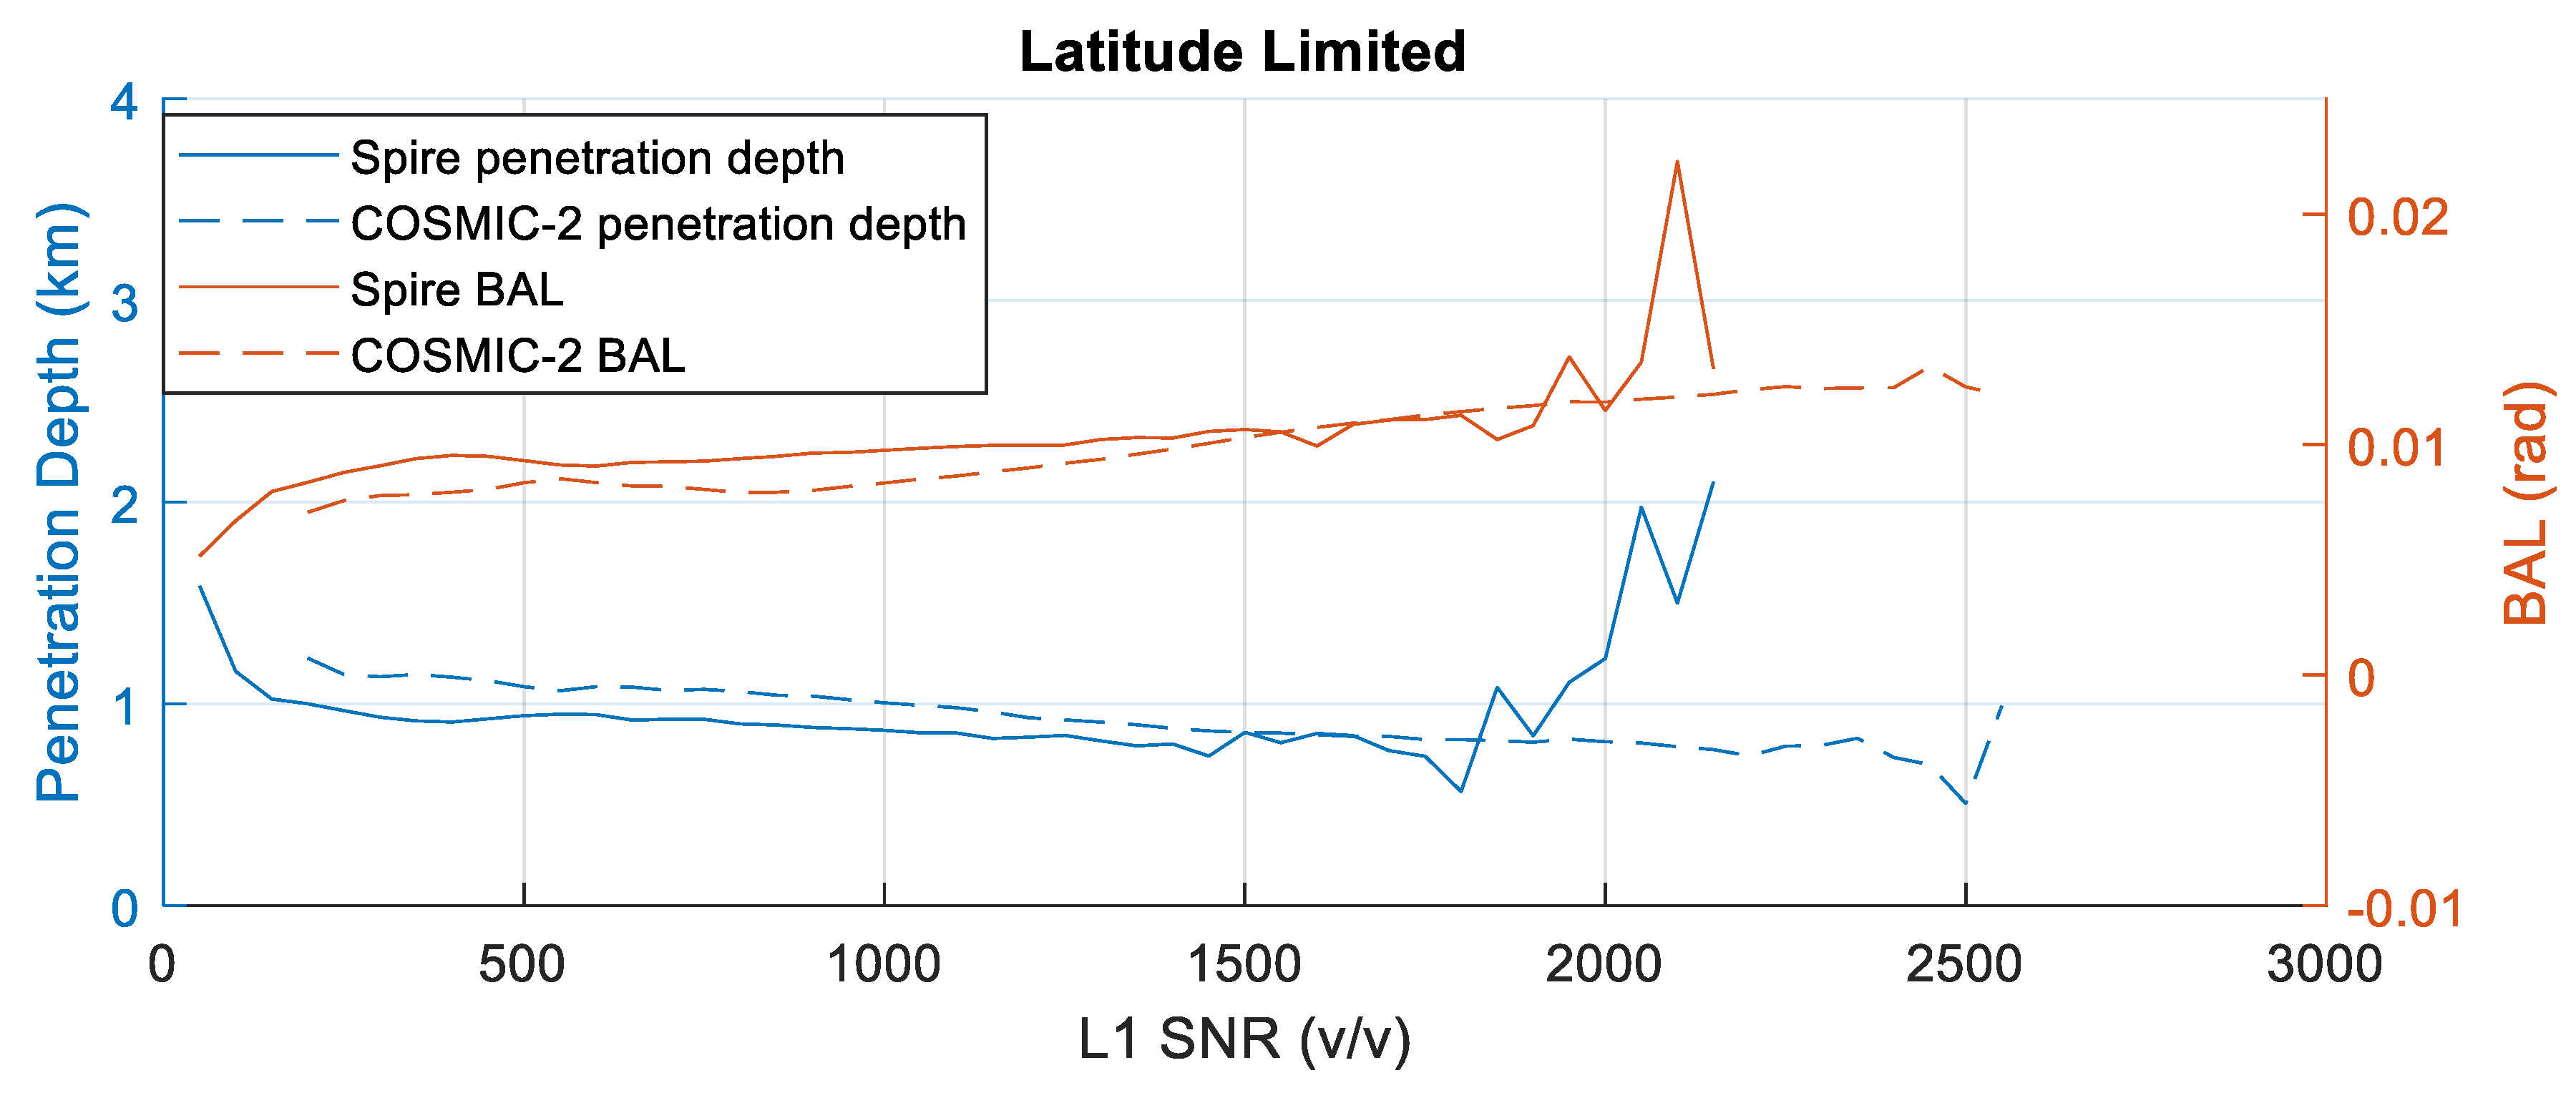
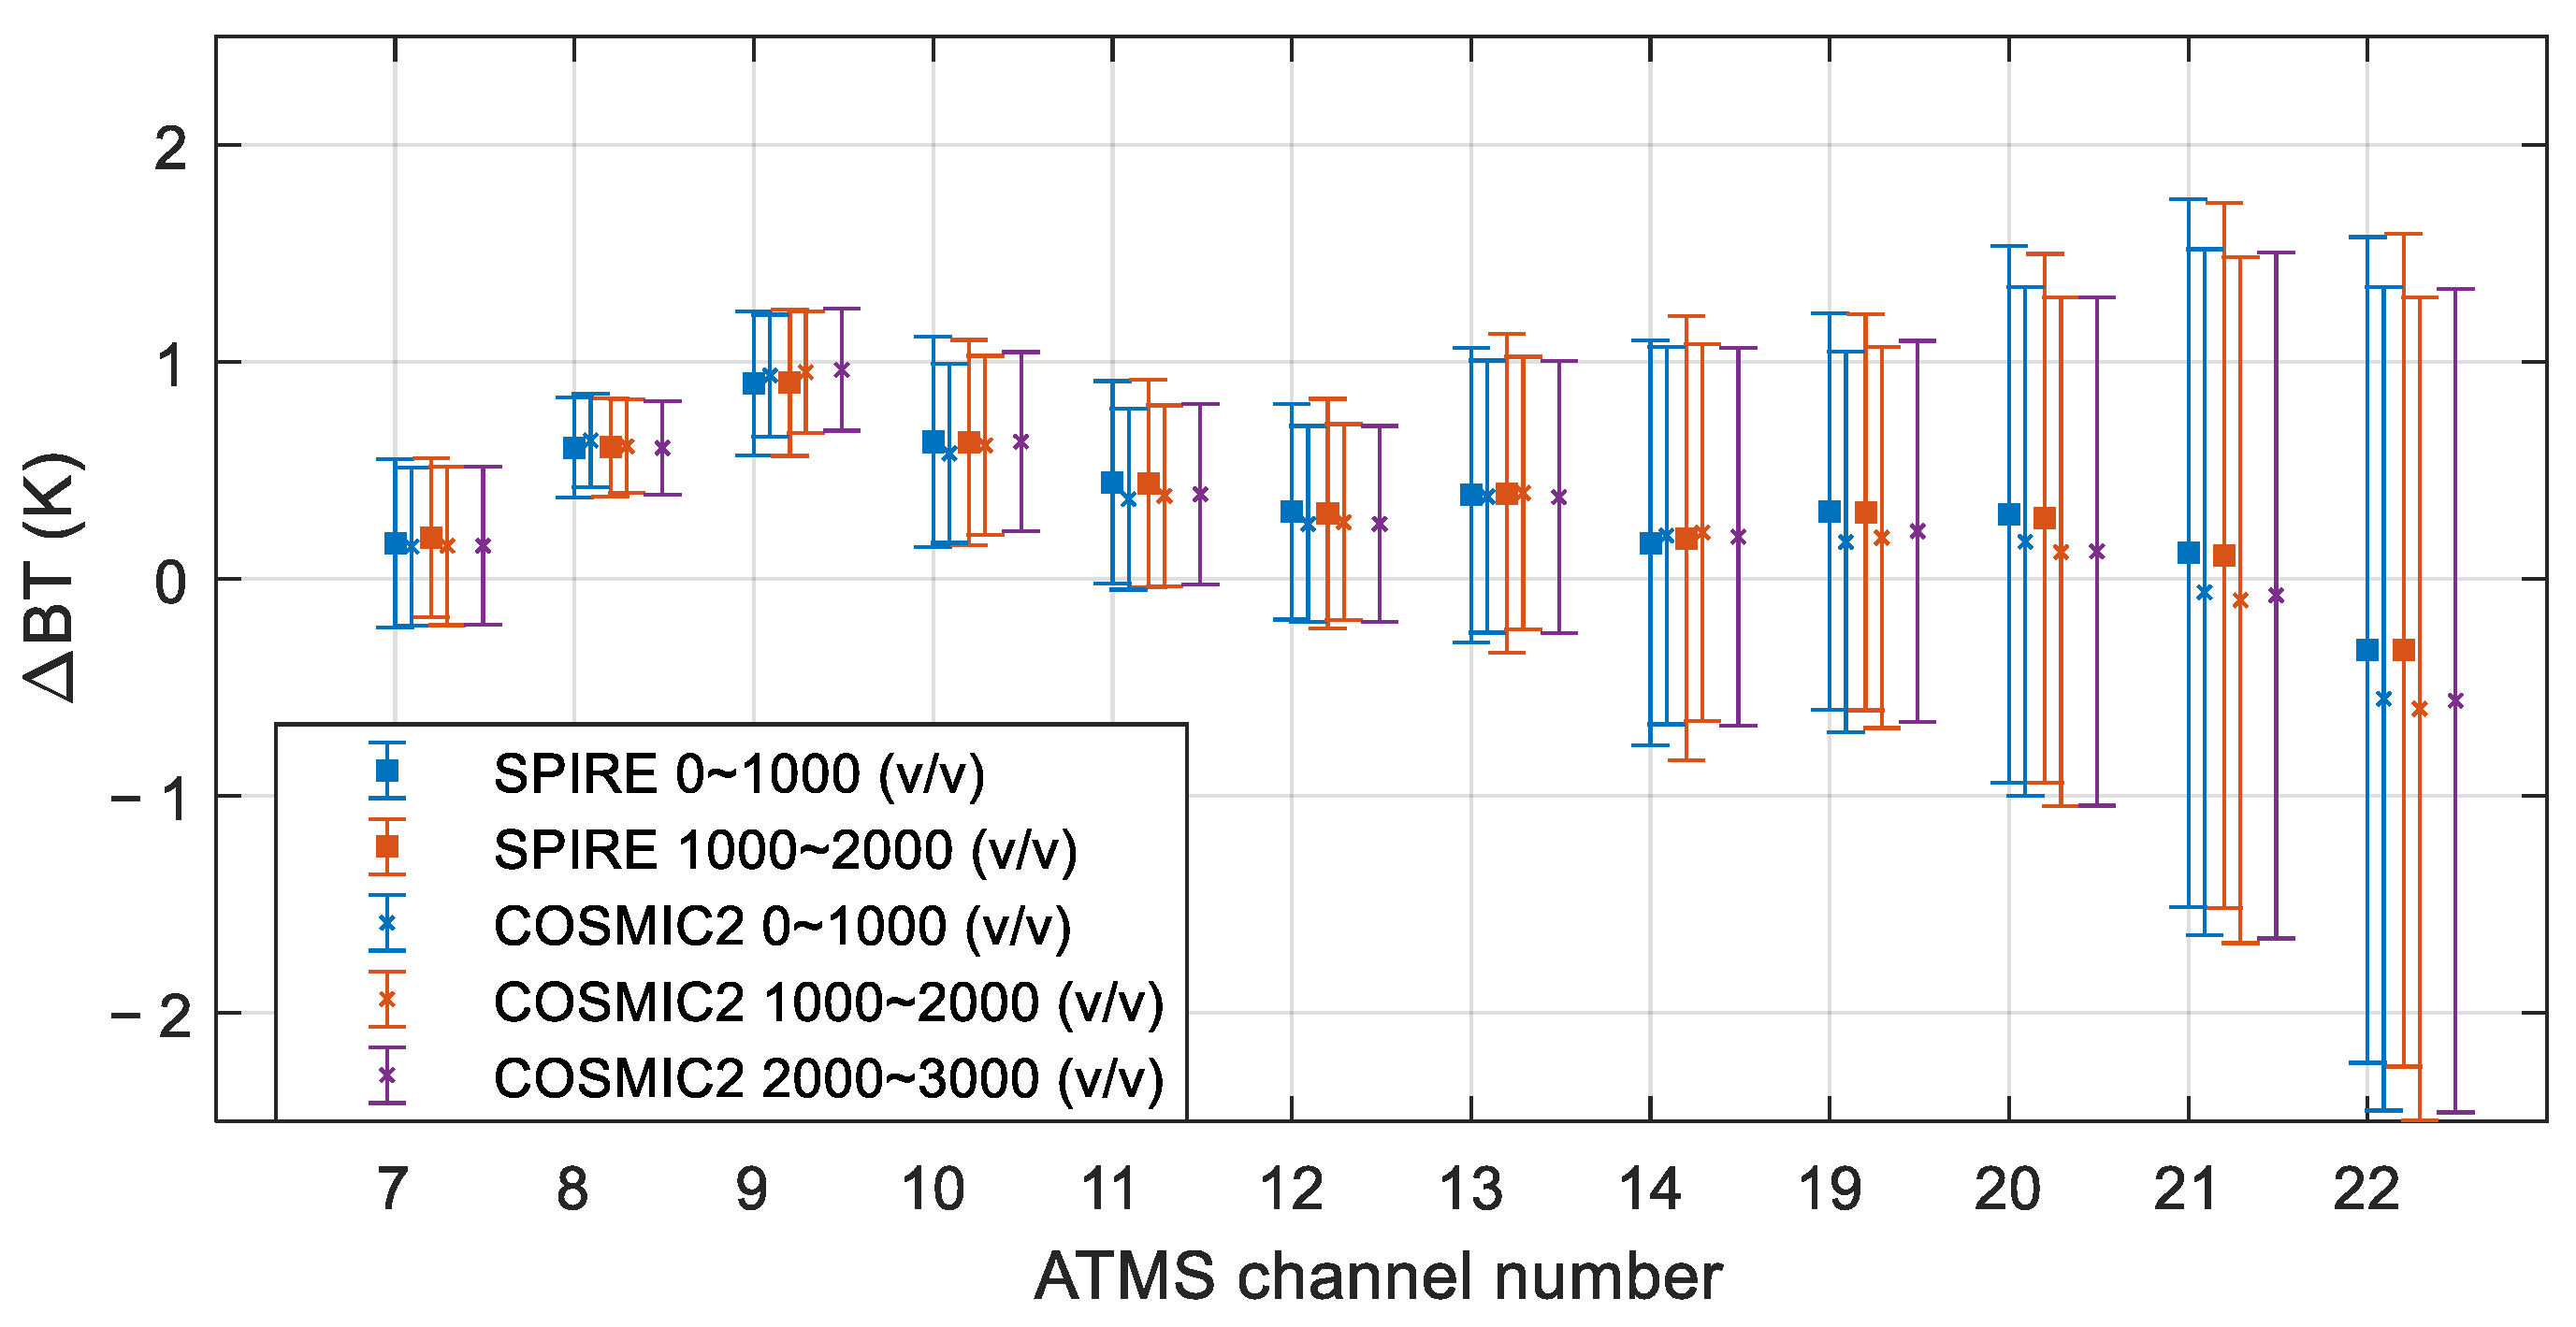
4.4. The SNR-Related Dependency Evaluation of BT Simulated with Spire and COSMIC-2 RO Soundings Using ATMS BT as a Reference
5. Conclusions
- i.
- The time series statistics and trends of the differences in Spire/COSMIC-2 CRTM-simulated BT (sounding profile T) and ATMS-observed BT (radiosonde profile T) over the ocean (land).
- ii.
- The trend comparison of the difference in Spire/COSMIC-2 CRTM-simulated BT (sounding profile T) and ATMS-observed BT (radiosonde profile T) over the ocean (land).
- iii.
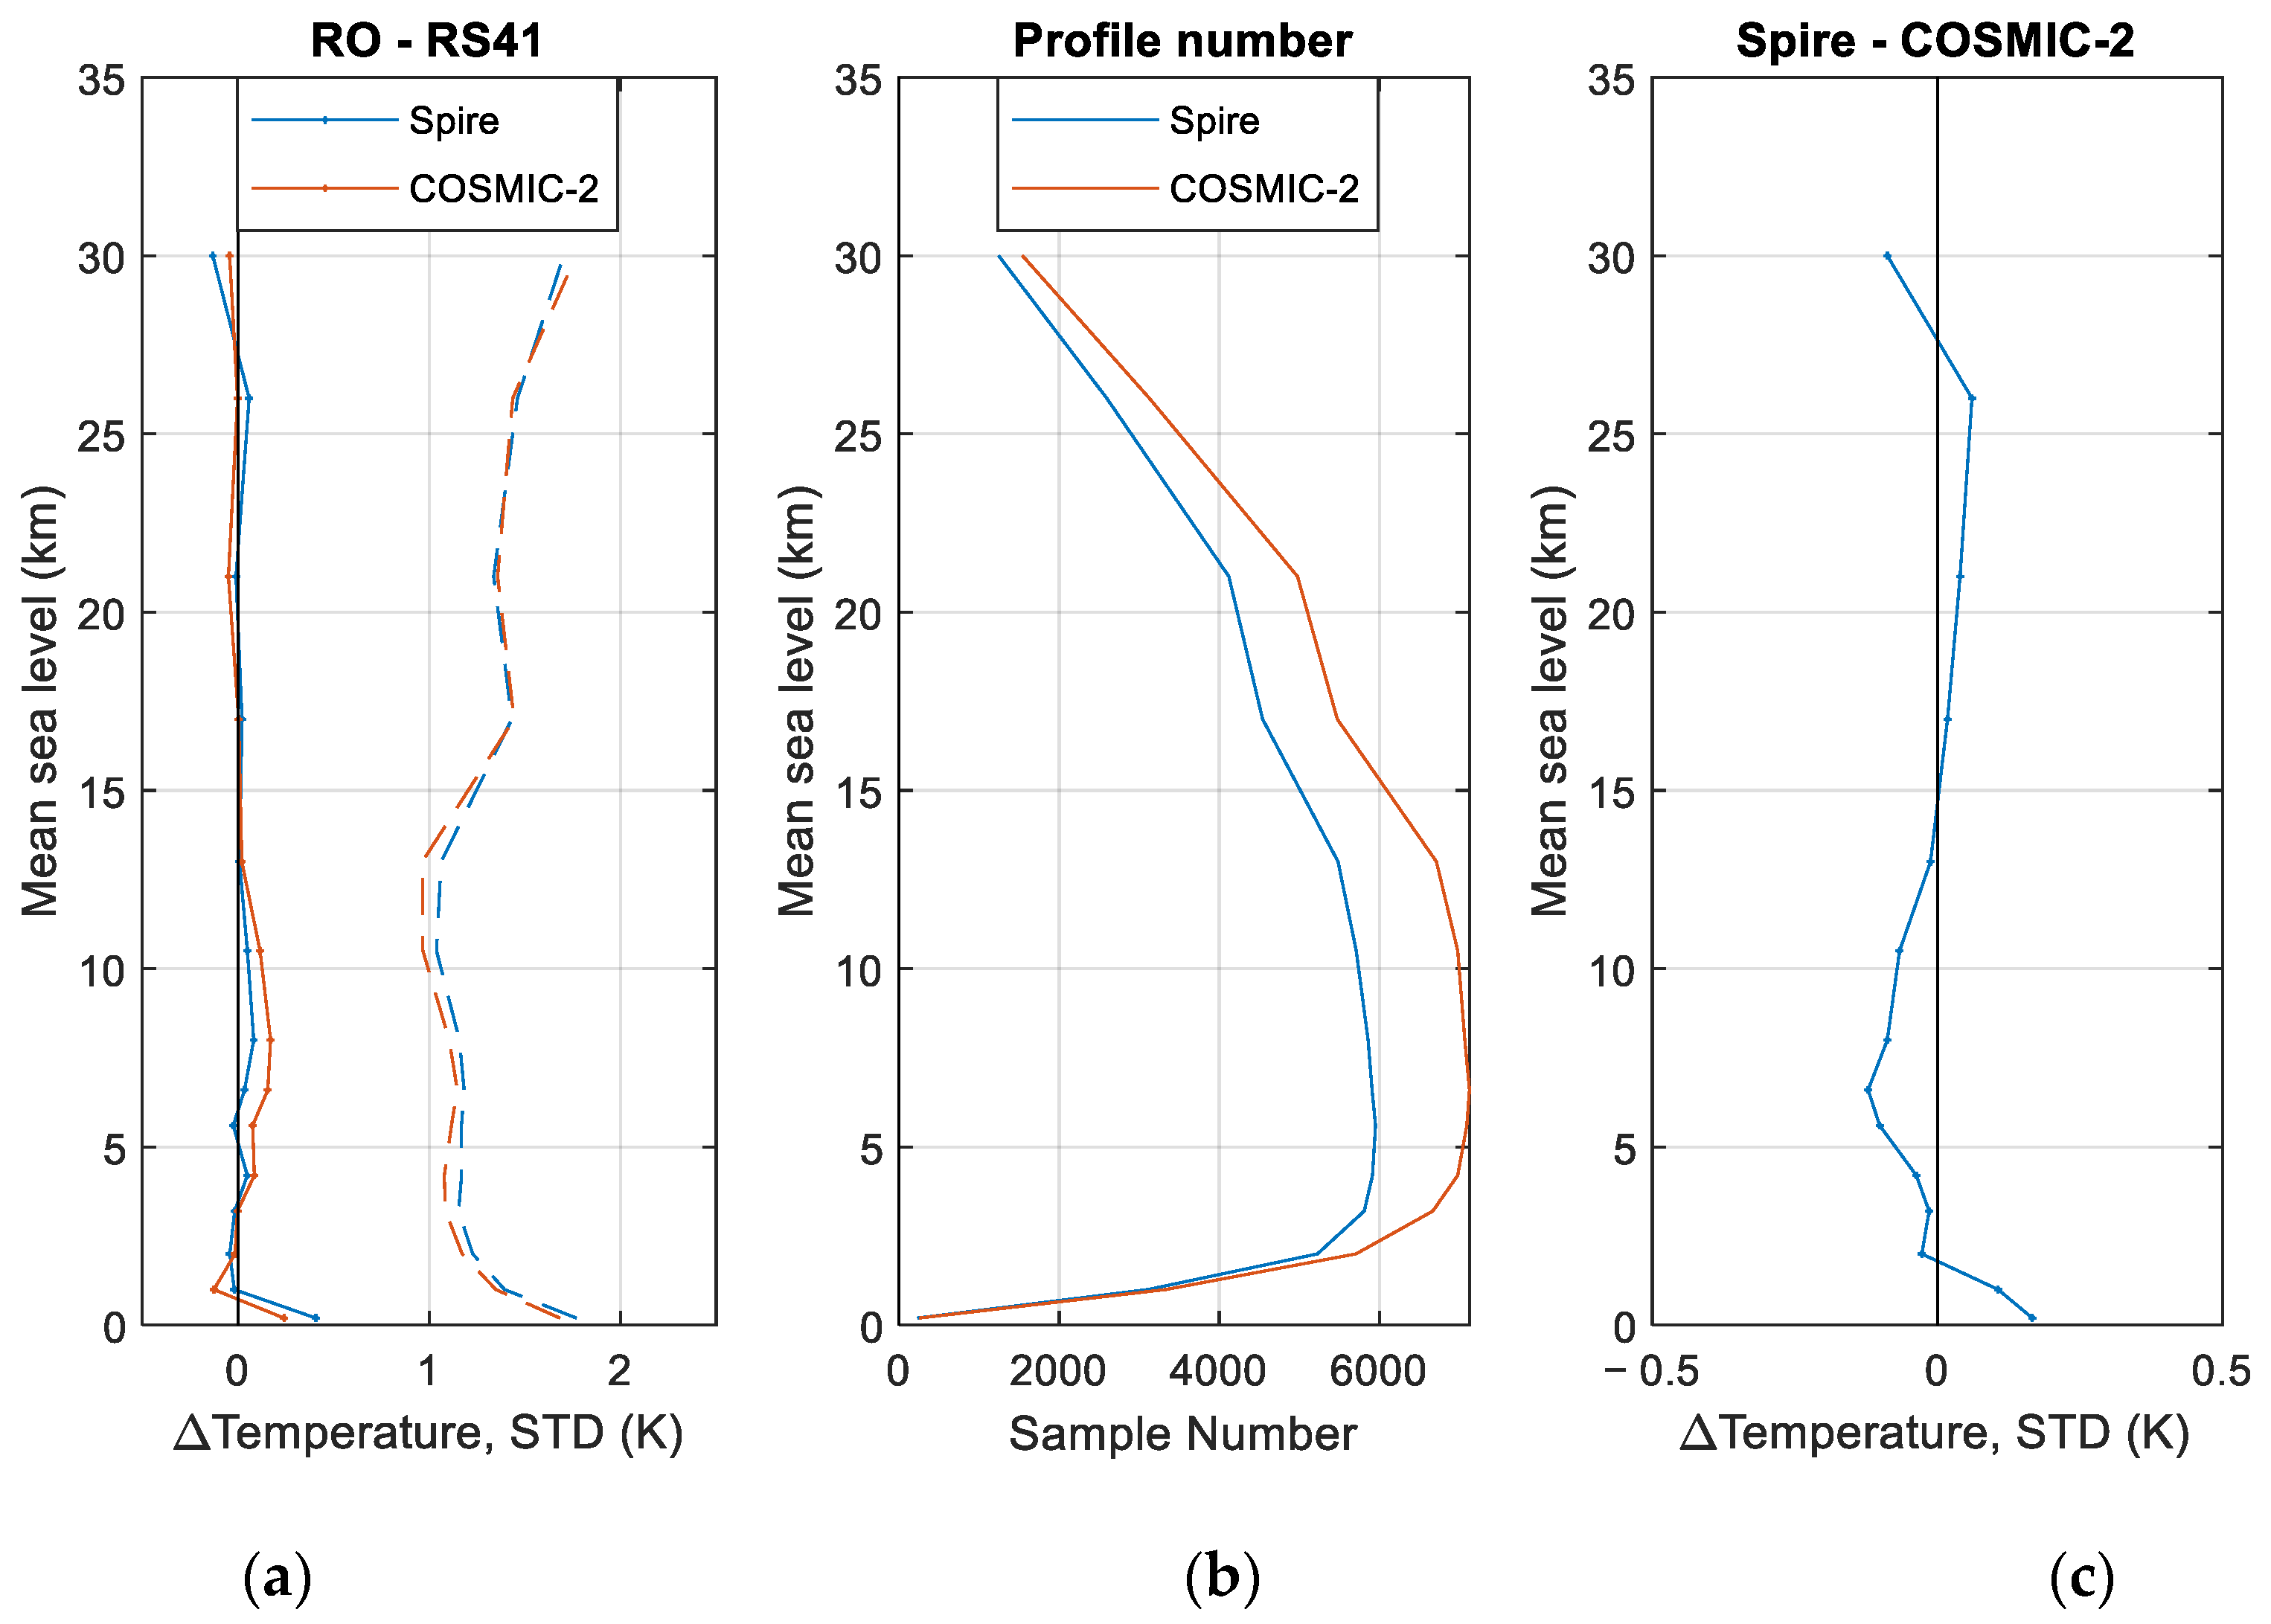
- The BT latitude dependency evaluation of Spire and COSMIC-2 through ATMS and radiosonde over ocean and land, respectively.
- iv.
- The BT local time dependency evaluation of Spire and COSMIC-2 through ATMS over the ocean.
- v.
- The BT SNR-related dependency evaluation of Spire and COSMIC-2 through ATMS over the ocean.
Author Contributions
Funding
Data Availability Statement
Acknowledgments
Conflicts of Interest
References
- Kuo, Y.-H.; Wee, T.-K.; Sokolovskiy, S.; Rocken, C.; Schreiner, W.; Hunt, D.; Anthes, R. Inversion and Error Estimation of GPS Radio Occultation Data. J. Meteorol. Soc. Jpn. Ser. II 2004, 82, 507–531. [Google Scholar] [CrossRef] [Green Version]
- Ho, S.-P.; Goldberg, M.; Kuo, Y.-H.; Zou, C.-Z.; Shiau, W. Calibration of Temperature in the Lower Stratosphere from Microwave Measurements Using COSMIC Radio Occultation Data: Preliminary Results. Terr. Atmos. Ocean. Sci. 2009, 20, 87. [Google Scholar] [CrossRef] [Green Version]
- Yunck, T.P.; Liu, C.-H.; Ware, R. A History of GPS Sounding. Terr. Atmos. Ocean. Sci. 2000, 11, 001. [Google Scholar] [CrossRef] [Green Version]
- Hajj, G.A.; Lee, L.C.; Pi, X.; Romans, L.J.; Schreiner, W.S.; Straus, P.R.; Wang, C. COSMIC GPS Ionospheric Sensing and Space Weather. Terr. Atmos. Ocean. Sci. 2000, 11, 235–272. [Google Scholar] [CrossRef] [Green Version]
- Kursinski, E.R.; Hajj, G.A.; Bertiger, W.I.; Leroy, S.S.; Meehan, T.K.; Romans, L.J.; Schofield, J.T.; McCleese, D.J.; Melbourne, W.G.; Thornton, C.L.; et al. Initial Results of Radio Occultation Observations of Earth’s Atmosphere Using the Global Positioning System. Science 1996, 271, 1107–1110. [Google Scholar] [CrossRef]
- Wang, B.-R.; Liu, X.-Y.; Wang, J.-K. Assessment of COSMIC radio occultation retrieval product using global radiosonde data. Atmos. Meas. Tech. 2013, 6, 1073–1083. [Google Scholar] [CrossRef] [Green Version]
- Anthes, R.A.; Bernhardt, P.A.; Chen, Y.; Cucurull, L.; Dymond, K.F.; Ector, D.; Healy, S.B.; Ho, S.-P.; Hunt, D.C.; Kuo, Y.; et al. The COSMIC/FORMOSAT-3 Mission: Early Results. Bull. Am. Meteorol. Soc. 2008, 89, 313–334. [Google Scholar] [CrossRef]
- Ho, S.-P.; Kirchengast, G.; Leroy, S.; Wickert, J.; Mannucci, A.J.; Steiner, A.; Hunt, D.; Schreiner, W.; Sokolovskiy, S.; Ao, C.; et al. Estimating the uncertainty of using GPS radio occultation data for climate monitoring: Intercomparison of CHAMP refractivity climate records from 2002 to 2006 from different data centers. J. Geophys. Res. Atmos. 2009, 114, D23107. [Google Scholar] [CrossRef] [Green Version]
- Ho, S.-P.; Hunt, D.; Steiner, A.K.; Mannucci, A.J.; Kirchengast, G.; Gleisner, H.; Heise, S.; von Engeln, A.; Marquardt, C.; Sokolovskiy, S.; et al. Reproducibility of GPS radio occultation data for climate monitoring: Profile-to-profile inter-comparison of CHAMP climate records 2002 to 2008 from six data centers. J. Geophys. Res. Atmos. 2012, 117, D18111. [Google Scholar] [CrossRef]
- Jing, X.; Shao, X.; Liu, T.-C.; Zhang, B. Comparison of GRUAN RS92 and RS41 Radiosonde Temperature Biases. Atmosphere 2021, 12, 857. [Google Scholar] [CrossRef]
- Zhang, B.; Ho, S.-P.; Cao, C.; Shao, X.; Dong, J.; Chen, Y. Verification and Validation of the COSMIC-2 Excess Phase and Bending Angle Algorithms for Data Quality Assurance at STAR. Remote Sens. 2022, 14, 3288. [Google Scholar] [CrossRef]
- Ho, S.-P.; Zhou, X.; Shao, X.; Chen, Y.; Jing, X.; Miller, W. Assessment of Spire Data in the Neutral Atmosphere. Remote Sens. 2023. submitted. [Google Scholar]
- Ho, S.-P.; Kireev, S.; Shao, X.; Zhou, X.; Jing, X. Processing and Validation of the STAR COSMIC-2 Temperature and Water Vapor Profiles in the Neutral Atmosphere. Remote Sens. 2022, 14, 5588. [Google Scholar] [CrossRef]
- Cao, C.; Wang, W.; Lynch, E.; Bai, Y.; Ho, S.-P.; Zhang, B. Simultaneous Radio Occultation for Intersatellite Comparison of Bending Angles toward More Accurate Atmospheric Sounding. J. Atmos. Ocean. Technol. 2020, 37, 2307–2320. [Google Scholar] [CrossRef]
- Li, Y.; Kirchengast, G.; Scherllin-Pirscher, B.; Schwaerz, M.; Nielsen, J.K.; Ho, S.-P.; Yuan, Y.-B. A New Algorithm for the Retrieval of Atmospheric Profiles from GNSS Radio Occultation Data in Moist Air and Comparison to 1DVar Retrievals. Remote Sens. 2019, 11, 2729. [Google Scholar] [CrossRef] [Green Version]
- Shao, X.; Ho, S.-P.; Zhang, B.; Cao, C.; Chen, Y. Consistency and Stability of SNPP ATMS Microwave Observations and COSMIC-2 Radio Occultation over Oceans. Remote Sens. 2021, 13, 3754. [Google Scholar] [CrossRef]
- Chen, Y.; Cao, C.; Shao, X.; Ho, S.-P. Assessment of the Consistency and Stability of CrIS Infrared Observations Using COSMIC-2 Radio Occultation Data over Ocean. Remote Sens. 2022, 14, 2721. [Google Scholar] [CrossRef]
- Ho, S.-P.; Pedatella, N.; Foelsche, U.; Healy, S.; Weiss, J.-P.; Ullman, R. Using Radio Occultation Data for Atmospheric Numerical Weather Prediction, Climate Sciences, and Ionospheric Studies and Initial Results from COSMIC-2, Commercial RO Data, and Recent RO Missions. Bull. Am. Meteorol. Soc. 2022, 103, E2506–E2512. [Google Scholar] [CrossRef]
- Shao, X.; Ho, S.P.; Jing, X.; Zhou, X.; Chen, Y.; Liu, T.C.; Zhang, B.; Dong, J. Characterizing the Tropospheric Water Vapor Variation using COSMIC Radio Occultation and ECMWF Reanalysis Data. Atmos. Chem. Phys. Discuss. 2023. preprint. [Google Scholar] [CrossRef]
- Irisov, V.; Masters, D.; Gorbunov, M.; Nguyen, V.; Sikarin, R.; Bloom, A.; Rocken, C. Comparison of Spire RO profiles processed by UCAR and Spire. In Proceedings of the 8th International Radio Occultation Working Group Meeting—IROWG-8, Virtual, 7–13 April 2021. [Google Scholar]
- McCarty, W.; Todling, R.; Privé, N.; Chattopadhyay, M.; Partyka, G.; Gelaro, R. Assessment of New Radio Occultation Measurements at the Global Modeling and Assimilation Office. In Proceedings of the 8th International Radio Occultation Working Group Meeting—IROWG-8, Virtual, 7–13 April 2021. [Google Scholar]
- Murphy, M.J.; Haase, J.S. Evaluation of GNSS Radio Occultation Profiles in the Vicinity of Atmospheric Rivers. Atmosphere 2022, 13, 1495. [Google Scholar] [CrossRef]
- Angling, M.J.; Nogués-Correig, O.; Nguyen, V.; Vetra-Carvalho, S.; Bocquet, F.-X.; Nordstrom, K.; Melville, S.E.; Savastano, G.; Mohanty, S.; Masters, D. Sensing the ionosphere with the Spire radio occultation constellation. J. Space Weather Space Clim. 2021, 11, 56. [Google Scholar] [CrossRef]
- Bosch, G. GNSS Radio Occultation in Advanced Numerical Weather Prediction Models. GEOmedia 2019, 23, 34–37. [Google Scholar] [CrossRef]
- Forsythe, V.V.; Duly, T.; Hampton, D.; Nguyen, V. Validation of Ionospheric Electron Density Measurements Derived from Spire CubeSat Constellation. Radio Sci. 2020, 55, e2019RS006953. [Google Scholar] [CrossRef]
- Zeng, Z.; Schreiner, W.S.; Weiss, J. Evaluation of Spire GNSS RO data for global tropopause and PBL detections. AGU Fall Meet. Abstr. 2020, 2020, IN029-02. [Google Scholar]
- Alessandro, P. SPIRE/STRATOS (GNSS-RO) Quality Assessment Summary; Telespazio: Rome, Italy, 2020. [Google Scholar]
- Ho, S.-P.; Zhou, X.; Kuo, Y.-H.; Hunt, D.; Wang, J.-H. Global Evaluation of Radiosonde Water Vapor Systematic Biases using GPS Radio Occultation from COSMIC and ECMWF Analysis. Remote Sens. 2010, 2, 1320–1330. [Google Scholar] [CrossRef] [Green Version]
- Sun, B.; Reale, A.; Seidel, D.J.; Hunt, D.C. Comparing radiosonde and COSMIC atmospheric profile data to quantify differences among radiosonde types and the effects of imperfect collocation on comparison statistics. J. Geophys. Res. Atmos. 2010, 115, D23104. [Google Scholar] [CrossRef] [Green Version]
- He, W.; Ho, S.-P.; Chen, H.; Zhou, X.; Hunt, D.; Kuo, Y.-H. Assessment of radiosonde temperature measurements in the upper troposphere and lower stratosphere using COSMIC radio occultation data. Geophys. Res. Lett. 2009, 36, L17807. [Google Scholar] [CrossRef] [Green Version]
- Shao, X.; Ho, S.-P.; Zhang, B.; Zhou, X.; Kireev, S.; Chen, Y.; Cao, C. Comparison of COSMIC-2 radio occultation retrievals with RS41 and RS92 radiosonde humidity and temperature measurements. Terr. Atmos. Ocean. Sci. 2021, 32, 1015–1032. [Google Scholar] [CrossRef]
- Ho, S.-P.; Anthes, R.A.; Ao, C.O.; Healy, S.; Horanyi, A.; Hunt, D.; Mannucci, A.J.; Pedatella, N.; Randel, W.J.; Simmons, A.; et al. The COSMIC/FORMOSAT-3 Radio Occultation Mission after 12 Years: Accomplishments, Remaining Challenges, and Potential Impacts of COSMIC-2. Bull. Am. Meteorol. Soc. 2020, 101, E1107–E1136. [Google Scholar] [CrossRef] [Green Version]
- Veenus, V.; Das, S.S.; Sama, B.; Uma, K.N. A comparison of temperature and relative humidity measurements derived from COSMIC-2 radio occultations with radiosonde observations made over the Asian summer monsoon region. Remote Sens. Lett. 2022, 13, 394–405. [Google Scholar] [CrossRef]
- Ho, S.-P.; Zhou, X.; Shao, X.; Zhang, B.; Adhikari, L.; Kireev, S.; He, Y.; Yoe, J.G.; Xia-Serafino, W.; Lynch, E. Initial Assessment of the COSMIC-2/FORMOSAT-7 Neutral Atmosphere Data Quality in NESDIS/STAR Using In Situ and Satellite Data. Remote Sens. 2020, 12, 4099. [Google Scholar] [CrossRef]
- Kim, E.; Abraham, S.; Amato, J.; Blackwell, W.J.; Cho, P.; Fuentes, J.; Hernquist, M.; Kam, J.; Leslie, R.V.; Liu, Q.; et al. An Evaluation of NOAA-20 ATMS Instrument Pre-Launch and On-Orbit Performance Characterization. IEEE Trans. Geosci. Remote Sens. 2022, 60, 5302813. [Google Scholar] [CrossRef]
- Iacovazzi, R.; Lin, L.; Sun, N.; Liu, Q. NOAA Operational Microwave Sounding Radiometer Data Quality Monitoring and Anomaly Assessment Using COSMIC GNSS Radio-Occultation Soundings. Remote Sens. 2020, 12, 828. [Google Scholar] [CrossRef] [Green Version]
- Kishore, P.; Ratnam, M.V.; Namboothiri, S.; Velicogna, I.; Basha, G.; Jiang, J.; Igarashi, K.; Rao, S.; Sivakumar, V. Global (50°S–50°N) distribution of water vapor observed by COSMIC GPS RO: Comparison with GPS radiosonde, NCEP, ERA-Interim, and JRA-25 reanalysis data sets. J. Atmos. Sol.-Terr. Phys. 2011, 73, 1849–1860. [Google Scholar] [CrossRef] [Green Version]
- Jauhiainen, H.; Lentonen, J.; Survo, P.; Lehtinen, R.; Pietari, T. The implications of Vaisala’s new radiosonde RS41 on improved in-situ observations for meteorological applications. In Proceedings of the AMS Annual Meeting 2014, Atlanta, GA, USA, 2–6 February 2014. [Google Scholar]
- Han, Y. JCSDA Community Radiative Transfer Model (CRTM): Version 1; NOAA: Washington, DC, USA, 2006. [Google Scholar]
- Liu, Q.; Yan, B.; Garrett, K.; Ma, Y.; Liang, X.; Huang, J.; Wang, W.; Cao, C. Deriving Surface Reflectance from Visible/Near Infrared and Ultraviolet Satellite Observations through the Community Radiative Transfer Model. IEEE J. Sel. Top. Appl. Earth Obs. Remote Sens. 2022, 15, 2004–2011. [Google Scholar] [CrossRef]
- Gelaro, R.; Johnson, B.T. The Community Radiative Transfer Model (CRTM): Recent Improvements and Applications. In Proceedings of the 103rd AMS Annual Meeting, Denver, CO, USA, 8–12 January 2023. [Google Scholar]
- Steiner, A.K.; Lackner, B.C.; Ladstädter, F.; Scherllin-Pirscher, B.; Foelsche, U.; Kirchengast, G. GPS radio occultation for climate monitoring and change detection. Radio Sci. 2011, 46, RS0D24. [Google Scholar] [CrossRef] [Green Version]
- Kursinski, E.R.; Hajj, G.A.; Schofield, J.T.; Linfield, R.P.; Hardy, K.R. Observing Earth’s atmosphere with radio occultation measurements using the Global Positioning System. J. Geophys. Res. Atmos. 1997, 102, 23.429–23.465. [Google Scholar] [CrossRef]
- Foelsche, U.; Borsche, M.; Steiner, A.K.; Gobiet, A.; Pirscher, B.; Kirchengast, G.; Wickert, J.; Schmidt, T. Observing upper troposphere–lower stratosphere climate with radio occultation data from the CHAMP satellite. Clim. Dyn. 2008, 31, 49–65. [Google Scholar] [CrossRef] [Green Version]
- Pirscher, B.; Foelsche, U.; Lackner, B.C.; Kirchengast, G. Local time influence in single-satellite radio occultation climatologies from Sun-synchronous and non-Sun-synchronous satellites. J. Geophys. Res. Atmos. 2007, 112, D1119. [Google Scholar] [CrossRef] [Green Version]
- Shen, Z.; Zhang, K.; He, Q.; Wan, M.; Li, L.; Wu, S. Quest over the Sampling Error of COSMIC Radio Occultation Temperature Climatologies. J. Atmos. Ocean. Technol. 2021, 38, 441–458. [Google Scholar] [CrossRef]
- Kirk-Davidoff, D.B.; Goody, R.M.; Anderson, J.G. Analysis of Sampling Errors for Climate Monitoring Satellites. J. Clim. 2005, 18, 810–822. [Google Scholar] [CrossRef] [Green Version]
- Chang, H.; Lee, J.; Yoon, H.; Morton, Y.J.; Saltman, A. Performance assessment of radio occultation data from GeoOptics by comparing with COSMIC data. Earth, Planets Space 2022, 74, 108. [Google Scholar] [CrossRef]
- Sokolovskiy, S.; Schreiner, W.; Zeng, Z.; Hunt, D.; Lin, Y.-C.; Kuo, Y.-H. Observation, analysis, and modeling of deep radio occultation signals: Effects of tropospheric ducts and interfering signals. Radio Sci. 2014, 49, 954–970. [Google Scholar] [CrossRef]
- Sokolovskiy, S.; Rocken, C.; Hunt, D.; Schreiner, W.; Johnson, J.; Masters, D.; Esterhuizen, S. GPS profiling of the lower troposphere from space: Inversion and demodulation of the open-loop radio occultation signals. Geophys. Res. Lett. 2006, 33, L14816. [Google Scholar] [CrossRef] [Green Version]
- Schreiner, W.S.; Weiss, J.P.; Anthes, R.A.; Braun, J.; Chu, V.; Fong, J.; Hunt, D.; Kuo, Y.-H.; Meehan, T.; Serafino, W.; et al. COSMIC-2 Radio Occultation Constellation: First Results. Geophys. Res. Lett. 2020, 47, e2019GL086841. [Google Scholar] [CrossRef]
- Sokolovskiy, S.; Schreiner, W.; Weiss, J.; Zeng, Z.; Hunt, D.; Braun, J. Initial assessment of COSMIC-2 data in the lower troposphere (LT). In Proceedings of the Joint 6th ROM SAF User Workshop and 7th IROWG Workshop 2019, Elsinore, Denmark, 19–25 September 2019. [Google Scholar]
- Gorbunov, M.; Irisov, V.; Rocken, C. Noise Floor and Signal-to-Noise Ratio of Radio Occultation Observations: A Cross-Mission Statistical Comparison. Remote Sens. 2022, 14, 691. [Google Scholar] [CrossRef]
- Sokolovskiy, S.V.; Rocken, C.; Lenschow, D.H.; Kuo, Y.-H.; Anthes, R.A.; Schreiner, W.S.; Hunt, D.C. Observing the moist troposphere with radio occultation signals from COSMIC. Geophys. Res. Lett. 2007, 34, L18802. [Google Scholar] [CrossRef] [Green Version]
- Irisov, V.; Duly, T.; Nguyen, V.; Masters, D.; Nogues-Correig, O.; Tan, L.; Yuasa, T.; Ector, D.R. Recent radio occultation profile results obtained from Spire’s CubeSat GNSS-RO constellation. AGU Fall Meet. Abstr. 2018, 2018, A44G-04. [Google Scholar]
- Irisov, V.; Ector, D.; Duly, T.; Nguyen, V.; Nogues-Correig, O.; Tan, L.; Yuasa, T. Atmospheric Radio Occultation Observation from Spire CubeSat Nanosatellites. In Proceedings of the 98th American Meteorological Society Annual Meeting, Austin, TX, USA, 7–11 January 2018. [Google Scholar]
- Irisov, V.; Nguyen, V.; Duly, T.; Nogués-Correig, O.; Tan, L.; Yuasa, T.; Ringer, J.; Masters, D.; Sikarin, R.; Gorbunov, M.; et al. Radio Occultation Observations and Processing from Spire’s CubeSat Constellation. In Proceedings of the Joint 6th ROM SAF User Workshop and 7th IROWG Workshop, EUMETSAT ROM SAF, Elsinore, Denmark, 19–25 September 2019. [Google Scholar]
- Bowler, N.E. An assessment of GNSS radio occultation data produced by Spire. Q. J. R. Meteorol. Soc. 2020, 146, 3772–3788. [Google Scholar] [CrossRef]


| Matching Pairs | ATMS (Ocean) | Radiosonde RS41 (Land) | ||
|---|---|---|---|---|
| Spire | COSMIC-2 | Spire | COSMIC-2 | |
| Original | 1,499,067 | 1,038,827 | 14,825 | 12,441 |
| Latitude | 445,373 | 1,038,827 | 10,190 | 12,441 |
| QC | 445,373 | 911,560 | 10,190 | 10,971 |
| Ocean/land | 346,987 | 691,032 | 6494 | 7237 |
| Outlier | 345,553~346,967 (CH7-14) 252,184~280,608 (CH19-22) | 686,989~691,021 (CH7-14) 521,247~565,018 (CH19-22) | See Figure 8b | See Figure 8b |
| RO vs. ATMS (K ± K) | RO vs. Radiosonde (K ± K) | ||||||
|---|---|---|---|---|---|---|---|
| Channel (Peak Sounding Height, km) | Spire | COSMIC-2 | Spire– COSMIC-2 | Height (km) | Spire | COSMIC-2 | Spire– COSMIC-2 |
| 7 (8.06) | 0.11 ± 0.48 | 0.11 ± 0.48 | 0.00 | 0.2 | 0.41 ± 1.77 | 0.24 ± 1.68 | 0.17 |
| 8 (10.61) | 0.60 ± 0.26 | 0.62 ± 0.27 | −0.01 | 1.0 | −0.02 ± 1.39 | −0.13 ± 1.35 | 0.11 |
| 9 (13.08) | 0.90 ± 0.34 | 0.94 ± 0.33 | −0.04 | 2.0 | −0.04 ± 1.23 | −0.01 ± 1.17 | −0.03 |
| 10 (17.10) | 0.63 ± 0.50 | 0.60 ± 0.47 | 0.03 | 3.2 | −0.02 ± 1.15 | −0.00 ± 1.08 | −0.01 |
| 11 (20.89) | 0.45 ± 0.47 | 0.38 ± 0.45 | 0.07 | 4.2 | 0.05 ± 1.17 | 0.09 ± 1.08 | −0.04 |
| 12 (25.84) | 0.31 ± 0.50 | 0.27 ± 0.49 | 0.04 | 5.6 | −0.02 ± 1.17 | 0.08 ± 1.12 | −0.10 |
| 13 (30.87) | 0.39 ± 0.69 | 0.40 ± 0.67 | −0.01 | 6.6 | 0.03 ± 1.18 | 0.16 ± 1.15 | −0.12 |
| 14 (35.66) | 0.17 ± 0.94 | 0.22 ± 0.91 | −0.05 | 8.0 | 0.08 ± 1.16 | 0.17 ± 1.10 | −0.09 |
| 19 (3.18) | 0.31 ± 0.91 | 0.19 ± 0.88 | 0.12 | 10.5 | 0.05 ± 1.04 | 0.12 ± 0.97 | −0.07 |
| 20 (4.27) | 0.19 ± 1.47 | 0.05 ± 1.40 | 0.14 | 13.0 | 0.01 ± 1.06 | 0.02 ± 0.96 | −0.01 |
| 21 (5.58) | 0.16 ± 1.70 | −0.01 ± 1.68 | 0.17 | 17.0 | 0.02 ± 1.43 | 0.00 ± 1.44 | 0.02 |
| 22 (6.66) | −0.16 ± 1.81 | −0.36 ± 1.82 | 0.20 | 21.0 | −0.01 ± 1.34 | −0.05 ± 1.36 | 0.04 |
| 26.0 | 0.06 ± 1.46 | −0.00 ± 1.44 | 0.06 | ||||
| 30.0 | −0.13 ± 1.70 | −0.04 ± 1.77 | −0.09 | ||||
| RO vs. ATMS (K/Year ± K/Year) | RO vs. Radiosonde (K/Year ± K/Year) | ||||||
|---|---|---|---|---|---|---|---|
| Channel (Peak Sounding Height, km) | Spire | COSMIC-2 | Spire– COSMIC-2 | Height (km) | Spire | COSMIC-2 | Spire– COSMIC-2 |
| 7 (8.06) | −0.02 ± 0.02 | −0.03 ± 0.01 | 0.01 | 0.2 | −0.03 ± 0.53 | −0.19 ± 0.43 | 0.16 |
| 8 (10.61) | −0.01 ± 0.01 | 0.00 ± 0.01 | −0.01 | 1.0 | −0.03 ± 0.18 | −0.19 ± 0.15 | 0.16 |
| 9 (13.08) | −0.01 ± 0.01 | 0.00 ± 0.01 | −0.01 | 2.0 | 0.02 ± 0.12 | 0.03 ± 0.10 | −0.01 |
| 10 (17.10) | 0.03 ± 0.02 | 0.01 ± 0.01 | 0.02 | 3.2 | 0.12 ± 0.11 | −0.00 ± 0.09 | 0.12 |
| 11 (20.89) | 0.07 ± 0.02 | 0.05 ± 0.01 | 0.02 | 4.2 | 0.06 ± 0.11 | 0.09 ± 0.09 | −0.02 |
| 12 (25.84) | 0.08 ± 0.02 | 0.11 ± 0.02 | −0.03 | 5.6 | 0.04 ± 0.11 | 0.02 ± 0.09 | 0.02 |
| 13 (30.87) | 0.03 ± 0.03 | 0.10 ± 0.02 | −0.07 | 6.6 | 0.01 ± 0.11 | 0.01 ± 0.09 | 0.00 |
| 14 (35.66) | −0.07 ± 0.04 | 0.05 ± 0.03 | −0.12 | 8.0 | −0.07 ± 0.11 | 0.04 ± 0.09 | −0.11 |
| 19 (3.18) | −0.00 ± 0.03 | 0.01 ± 0.02 | −0.01 | 10.5 | −0.02 ± 0.11 | −0.01 ± 0.08 | −0.01 |
| 20 (4.27) | 0.07 ± 0.06 | 0.01 ± 0.04 | 0.06 | 13.0 | 0.04 ± 0.10 | 0.02 ± 0.08 | 0.02 |
| 21 (5.58) | −0.01 ± 0.06 | −0.00 ± 0.04 | −0.01 | 17.0 | 0.08 ± 0.15 | −0.00 ± 0.14 | 0.08 |
| 22 (6.66) | −0.08 ± 0.07 | −0.02 ± 0.05 | −0.06 | 21.0 | 0.12 ± 0.15 | −0.01 ± 0.13 | 0.13 |
| 26.0 | −0.04 ± 0.19 | −0.11 ± 0.17 | 0.07 | ||||
| 30.0 | −0.26 ± 0.29 | −0.28 ± 0.24 | 0.02 | ||||
| RO vs. ATMS (Spire-COSMIC-2, K) | ||
|---|---|---|
| Channel (Peak Sounding Height, km) | Latitude Limited | Latitude Unlimited |
| 7 (8.06) | 0.00 | 0.14 |
| 8 (10.61) | −0.01 | −0.03 |
| 9 (13.08) | −0.04 | −0.19 |
| 10 (17.10) | 0.03 | −0.02 |
| 11 (20.89) | 0.07 | 0.15 |
| 12 (25.84) | 0.04 | 0.15 |
| 13 (30.87) | −0.01 | 0.06 |
| 14 (35.66) | −0.05 | 0.04 |
| 19 (3.18) | 0.12 | 0.03 |
| 20 (4.27) | 0.14 | 0.16 |
| 21 (5.58) | 0.17 | 0.26 |
| 22 (6.66) | 0.20 | 0.37 |
Disclaimer/Publisher’s Note: The statements, opinions and data contained in all publications are solely those of the individual author(s) and contributor(s) and not of MDPI and/or the editor(s). MDPI and/or the editor(s) disclaim responsibility for any injury to people or property resulting from any ideas, methods, instructions or products referred to in the content. |
© 2023 by the authors. Licensee MDPI, Basel, Switzerland. This article is an open access article distributed under the terms and conditions of the Creative Commons Attribution (CC BY) license (https://creativecommons.org/licenses/by/4.0/).
Share and Cite
Jing, X.; Ho, S.-P.; Shao, X.; Liu, T.-C.; Chen, Y.; Zhou, X. Spire RO Thermal Profiles for Climate Studies: Initial Comparisons of the Measurements from Spire, NOAA-20 ATMS, Radiosonde, and COSMIC-2. Remote Sens. 2023, 15, 3710. https://doi.org/10.3390/rs15153710
Jing X, Ho S-P, Shao X, Liu T-C, Chen Y, Zhou X. Spire RO Thermal Profiles for Climate Studies: Initial Comparisons of the Measurements from Spire, NOAA-20 ATMS, Radiosonde, and COSMIC-2. Remote Sensing. 2023; 15(15):3710. https://doi.org/10.3390/rs15153710
Chicago/Turabian StyleJing, Xin, Shu-Peng Ho, Xi Shao, Tung-Chang Liu, Yong Chen, and Xinjia Zhou. 2023. "Spire RO Thermal Profiles for Climate Studies: Initial Comparisons of the Measurements from Spire, NOAA-20 ATMS, Radiosonde, and COSMIC-2" Remote Sensing 15, no. 15: 3710. https://doi.org/10.3390/rs15153710