
Effects of Production–Living–Ecological Space Patterns Changes on Land Surface Temperature
by
 ,
,
Han Liu
1,
Ling Qin
1,2,3,*,
Menggang Xing
4,
Haiming Yan
1,2,
Guofei Shang
1,2,3 and
Yuanyuan Yuan
1 1
School of Land Science and Space Planning, Hebei GEO University, Shijiazhuang 050031, China
2
Natural Resource Asset Capital Research Center, Hebei GEO University, Shijiazhuang 050031, China
3
International Science and Technology Cooperation Base of Hebei Province, Hebei International Joint Research Center for Remote Sensing of Agricultural Drought Monitoring, Hebei GEO University, Shijiazhuang 050031, China
4
Department of Land Reclamation, Land Improvement Center of Hebei Province, Shijiazhuang 050000, China
*
Author to whom correspondence should be addressed.
Remote Sens. 2023, 15(14), 3683; https://doi.org/10.3390/rs15143683
Submission received: 9 May 2023
/
Revised: 17 July 2023
/
Accepted: 18 July 2023
/
Published: 24 July 2023
(This article belongs to the Special Issue Remote Sensing Applications for Interaction between Urbanization and Eco-Environment)
Abstract
:Rapid economic and social development has triggered competition for limited land space from different industries, accelerating the evolution of Beijing’s urban landscape types. The increase in impermeable surfaces and the decrease in ecological land have led to an increase in the impact on the urban thermal environment. Since previous studies have mainly focused on the impact of a single urban landscape on the urban thermal environment and lacked an exploration of the combined impact of multiple landscapes, this study applied standard deviation ellipses, Pearson correlation analysis, land surface temperature (LST) profile analysis, and hot spot analysis to comprehensively explore the influence of the evolving production–living–ecological space (PLES) pattern on LST. The results show that the average LST of various spaces continued to increase before 2009 and decreased slowly after 2009, with the highest average temperature being living space, followed by production space, and the lowest average temperature being ecological space for each year. The spatiotemporal shift path of the thermal environment is consistent with the shift trajectory of the living space center of gravity in Beijing; LST is positively correlated with living space (LS) and negatively correlated with production space (PS) and ecological space (ES). LST is positively correlated with LS and negatively correlated with PS and ES. Influenced by the change in bedding surface type, the longitudinal thermal profile curve of LST shows a general trend of “low at both ends and high in the middle”. With the change in land space type, LST fluctuates significantly, and the horizontal thermal profile curve shows a general trend of “first decreasing, followed by increasing and finally decreasing”. In addition, the hot spot analysis shows that the coverage area of very hot spots, hot spots, and warm spots increased by 0.72%, 1.13%, and 2.03%, respectively, in the past 30 years, and the main expansion direction is southeast, and very cold spots and cold spots are distributed in the northwest ecological space, and the area change first decreases and then increases.
1. Introduction
With the continuous acceleration of urbanization, the urban built-up area has expanded, and the construction of buildings, transportation, and water facilities has increased, changing the nature of surface radiation and near-surface water and heat exchange. In addition, the increase in urban population and the decrease in vegetation area have led to the increasingly serious urban heat island effect (UHI Effect). This effect is manifested by a significant increase in the temperatures in urban built-up areas, forming a heat-concentrated “island,” exacerbating environmental degradation and impacting urban ecological security and sustainable development [1]. The acquisition of land surface temperature (LST) based on remote sensing images provides solid data support for exploring the urban heat island effect [2,3,4,5], and spatial analysis techniques provide powerful tools for effectively revealing the thermal environmental effects of land use/land cover changes in the urbanization process [6,7].
To address the negative effects caused by urban heat environment changes, scholars both domestically and internationally have conducted extensive research on urban heat islands and land use/land cover (LULC). Karakuş et al. studied the relationship between LULC, the normalized difference vegetation index (NDVI), and land surface temperature (LST) in Sivas city center and its surrounding areas using Landsat satellite images from 1989 to 2015 and demonstrated the intensity of the UHI effect [8]. Kachari et al. considered the LULC changes in Shillong by using topographic map data from 1939 and Landsat satellite images from 2008 and 2013 [9]. Padmanaban et al. showcased the advantages of integrating imagery from multiple sensors in assessing LULC changes and evaluating surface permeability, temperature, and UHI occurrence in rapidly growing cities such as Tirunelveli in Tamil Nadu, India [10]. Roy et al. assessed the impact of LULC changes in the Chattogram Metropolitan Area (CMA) in southeastern Bangladesh on land surface temperature (LST) [11]. Khamchiangta et al. focused on analyzing the time series of LULC characteristics in the Bangkok metropolitan area and its relationship with UHI intensity. Rizvi aimed to evaluate the UHI in Karachi as a surface urban heat island (SUHI) by analyzing the impact of rapid urbanization and LULC changes on the increase in average temperature in Karachi, ensuring the existence of the UHI effect [12]. Zhao et al. aimed to study the influence of LULC landscape patterns more accurately on UHI effects through landscape index analysis [13]. To determine the response of land surface heat islands to LULC changes, Gao et al. used a numerical land model called u-HRLDAS (urban high-resolution land data assimilation system) as a modeling tool to study the impact of LULC changes in Wuhan from 1980 to 2013 on UHIs. This surge in research has benefited from the availability of freely accessible remote sensing data archives spanning fifty years, the use of state-of-the-art analysis methods, and advancements in computing power [14]. The purpose of Derdouri’s systematic review is to summarize, compare, and critically analyze multiple case studies conducted between 2001 and 2020, covering various aspects such as study area characteristics, data sources, LULC classification, and SUHI quantification methods, as well as the interaction mechanisms and connection techniques between SUHI intensity and spatial and temporal changes in LULC and proposed mitigation measures [15].
Most scholars have generally focused on applying the distribution status of landscape pattern indices to characterize the mechanisms of spatial pattern evolution on the thermal environment [16], but previous studies have shown that not all landscape pattern indices are applicable, and the land surface thermal environment is mainly related to the percentage of each type of land use (PLAND). In recent decades, scholars have applied various methods to investigate the thermal environment effects of land use change [17,18,19]. The correlation analysis between surface temperature and remote sensing indices has been widely used, and Getis–Ord Gi* autocorrelation has also been used to explore the relationship between LST and land use [20]. However, the above-mentioned studies generally provide limited information on the response mechanisms between PLAND indices and LST for various types of spaces, and it is of special significance to analyze the impact of PLES expansions on the urban surface thermal environment based on grids [21,22]. For example, Chen et al. proposed a 35% built-up PLAND index to split the thermal environment effect of the construction land expansion in Wu’an City by grid sampling statistics [22], and Qin et al. derived a 55–60% PLAND index of the built-up land within the grid to split the thermal environment effect in Shijiazhuang City by a 990 m × 990 m grid analysis [23].
However, currently, research is based on a traditional perspective of land use and land cover change (LULC) and the correlation between LULC and fluctuations in land surface temperature, which has limitations in exploring the impact of different land cover types on representative thermal environments. There is still a lack of research on the impact of grid-based quantitative analysis of production–living–ecological space pattern changes on the urban surface thermal environment. Based on the spatial planning and control direction of land, it is possible to divide the spatially functionally concentrated land into production, living, and ecological spaces (PLES) [24]. Production space corresponds to the production of industrial and agricultural products and services, living space is closely related to human activities and provides the necessary spatial conditions for human habitation and life, and ecological space is connected to nature and plays an important role in regulating, maintaining, and guaranteeing regional ecological security with the provision of ecological products and services as the leading function [25]. The Chinese government has made the optimization of the three spatial areas a core component of its ecological civilization and sustainable development strategy, aiming to “promote an intensive and efficient production space, a livable and moderate living space, and a mountainous and clear ecological space” [26]. Previous studies on the three spatial areas have mainly focused on the construction of theoretical frameworks and the identification and classification of functional spaces [27,28,29] but neglected the impact of the evolution of the landscape patterns of the three spatial areas on the ecological environment, especially the thermal environment on the surface. In contrast, exploring the influence of the evolution of the morphology and structure of the three functional spaces on the surface thermal environment will help to address the challenges associated with regional spatial imbalance and ecosystem degradation. Further research is needed on how to alleviate the UHI effect through adjustments in land use functions.
This study selected Beijing as a typical representative city of urbanization and started from the changes in land functional characteristics. By classifying surface variables according to production–living–ecological space, Landsat series remote sensing data were used. Landscape pattern analysis and geographic spatial analysis methods were comprehensively applied to explore the spatial patterns of Beijing’s different production–living–ecological space density levels over the past 30 years and their impact on the UHI effect. The goals were achieved through qualitative and quantitative analyses: investigating the spatial distribution characteristics and evolution patterns of Beijing’s production–living–ecological spaces over the past 30 years, quantitatively analyzing the relationship between the spatial evolution of production–living–ecological spaces and land surface temperature, providing data support for urban future development planning, optimizing the spatial patterns of land changes, balancing the distribution of production, living, and ecological spaces in different regions, and promoting sustainable development. The research results provide a research direction for the rational adjustment of urban three-dimensional spatial patterns to alleviate the UHI effect and serve as a reference for the selection of key areas for ecological restoration in territorial space.
2. Materials and Methods
2.1. Study Area
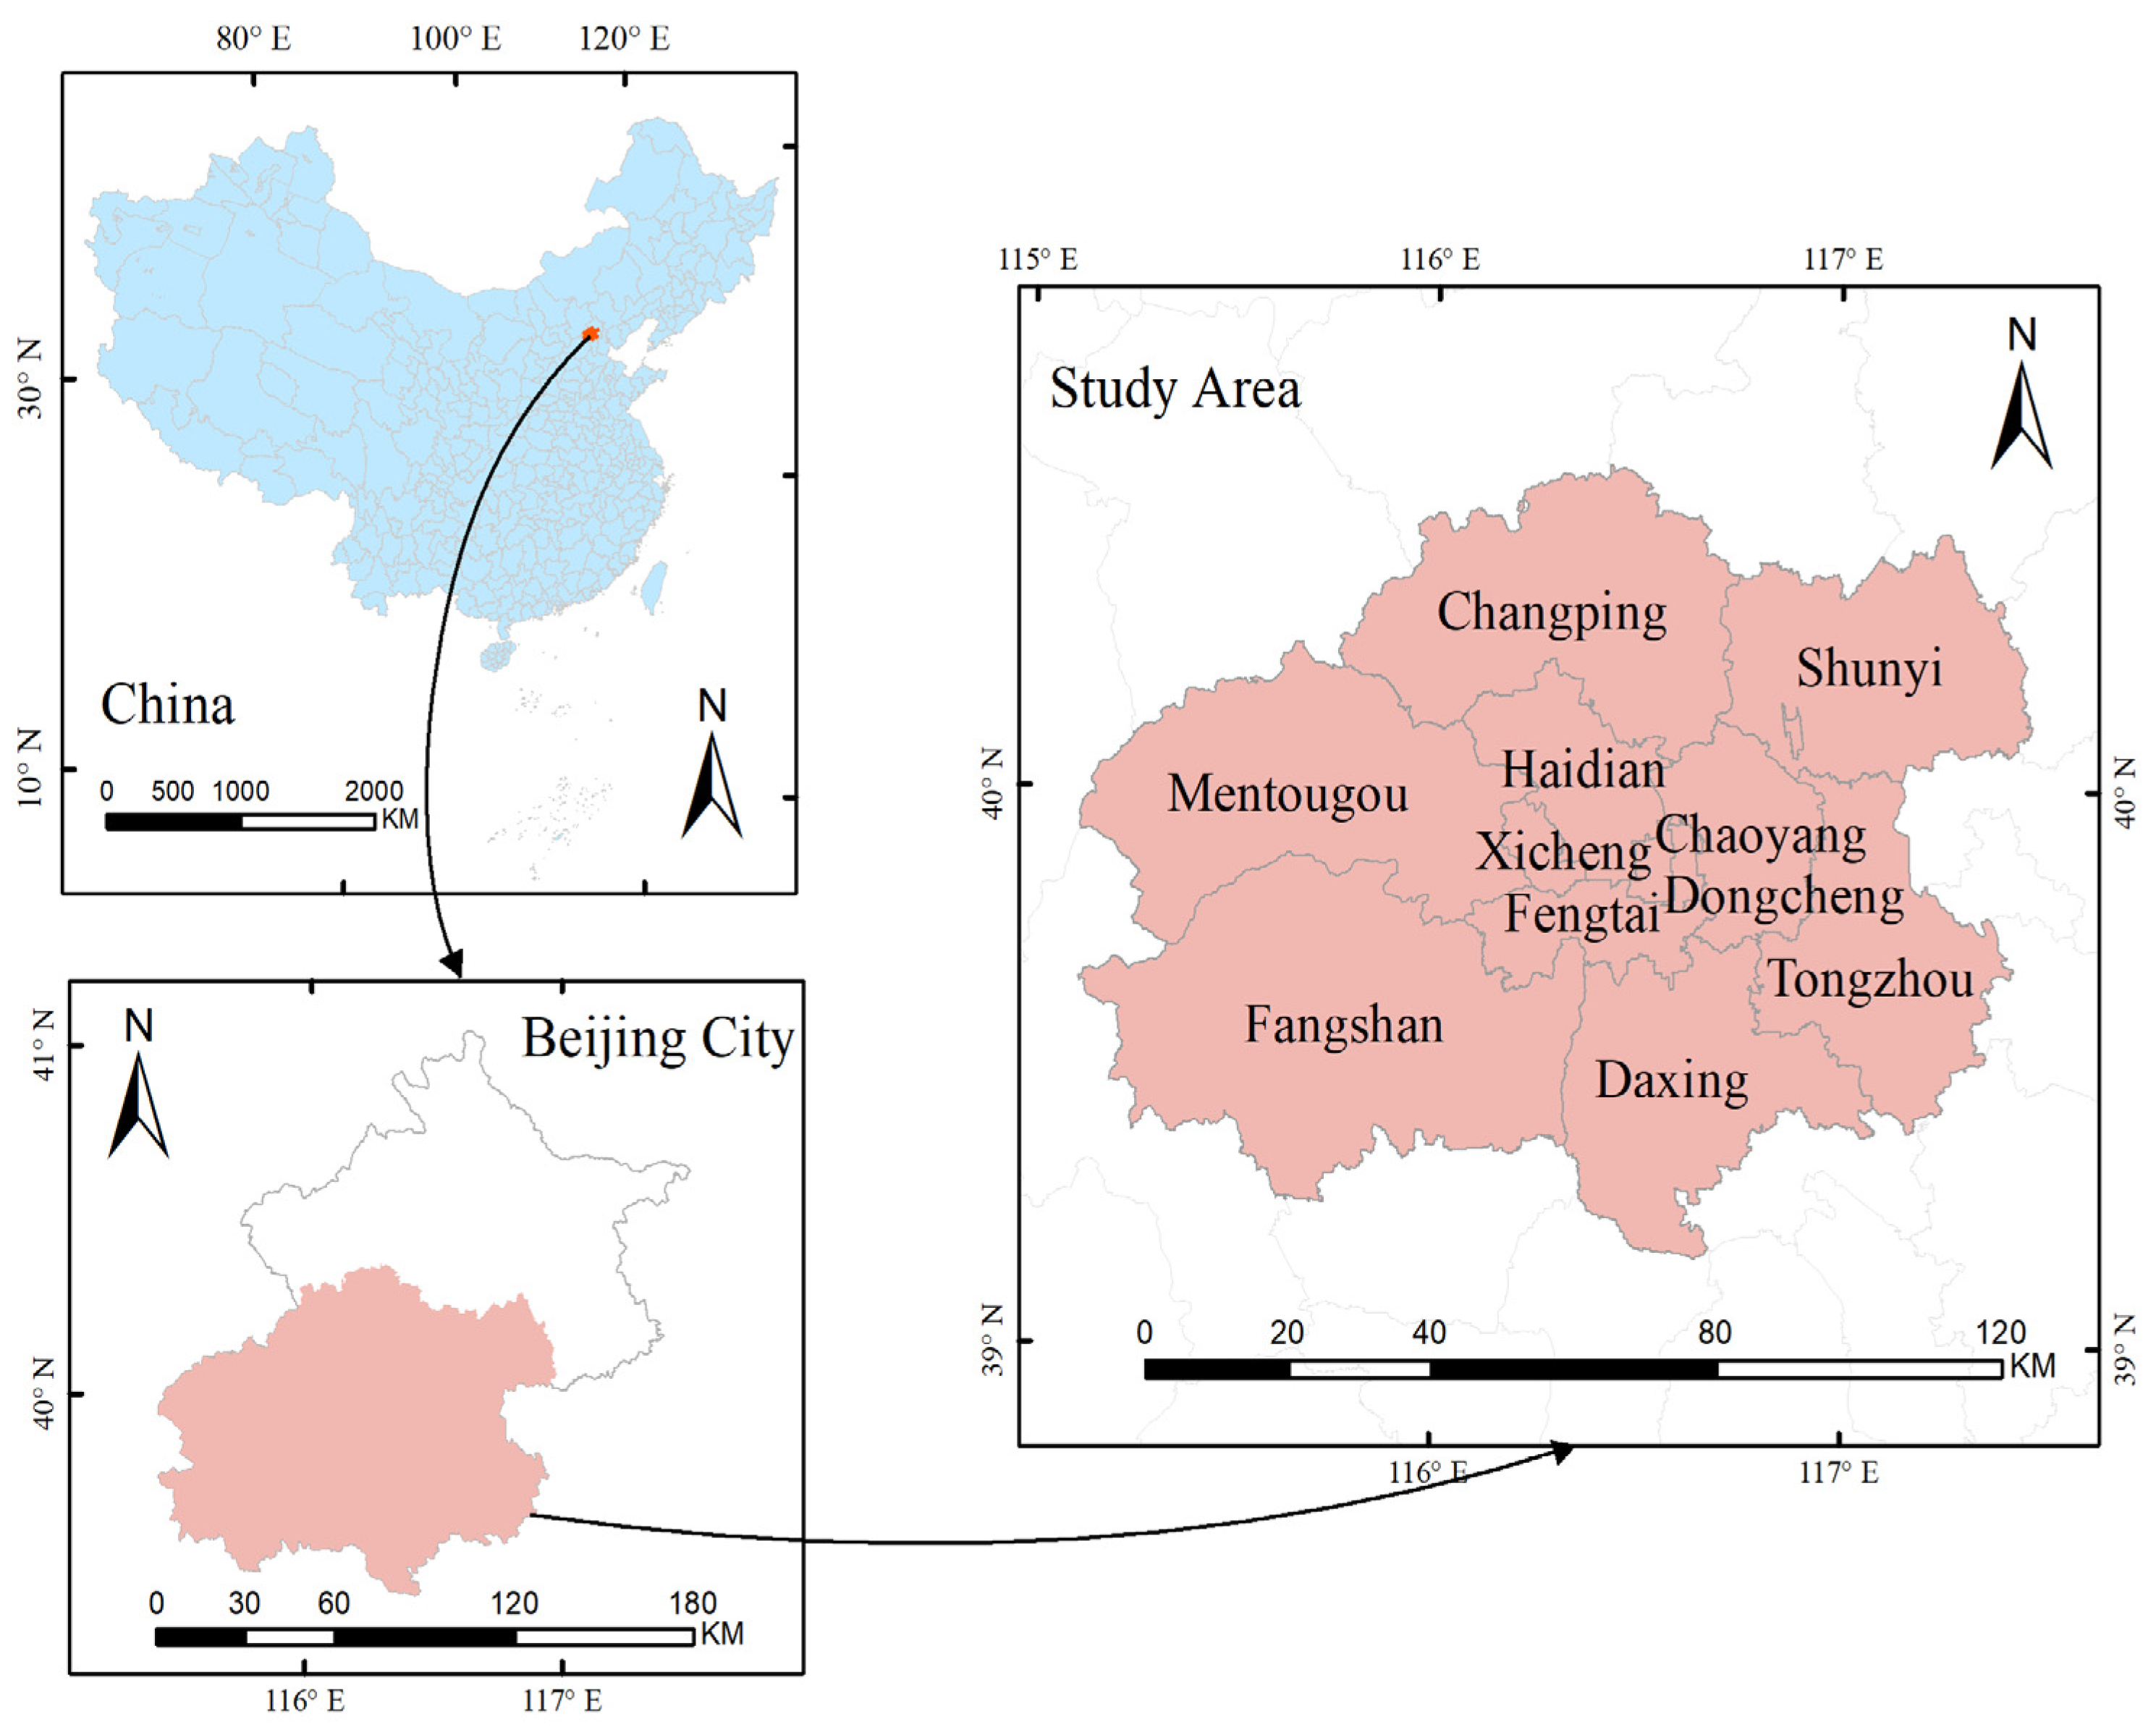
Beijing, the capital of China, is of great significance in terms of national politics, culture, international communication, and scientific and technological innovation. Over the past few decades, the economic development of Beijing has brought about significant changes in its spatial and landscape patterns. However, this development has also resulted in various environmental issues, particularly the degradation of the thermal environment. This degradation has had a notable impact on the city’s sustainable development. To examine the impact of rapid urbanization on the surface thermal environment, this study focuses on 12 representative districts in Beijing. These districts, namely Dongcheng, Xicheng, Haidian, Chaoyang, Fengtai, Mentougou, Shijingshan, Fangshan, Tongzhou, Shunyi, Changping, and Daxing, are characterized by the highest urbanization rate and population density in the city (Figure 1).
2.2. Data Sources
Data sources for this study included (1) Landsat image data (1990, 1999, 2004, 2009, 2014, and 2019) from the Google Earth Engine Platform (https://earthengine.google.com/, accessed on 1 June 2023.), with data parameters detailed in Table 1, and (2) land use data from PIE Engine platform’s China Land Use/Cover Datasets (CLUDs) [30] (https://engine.piesat.cn/, accessed on 2 June 2023.).
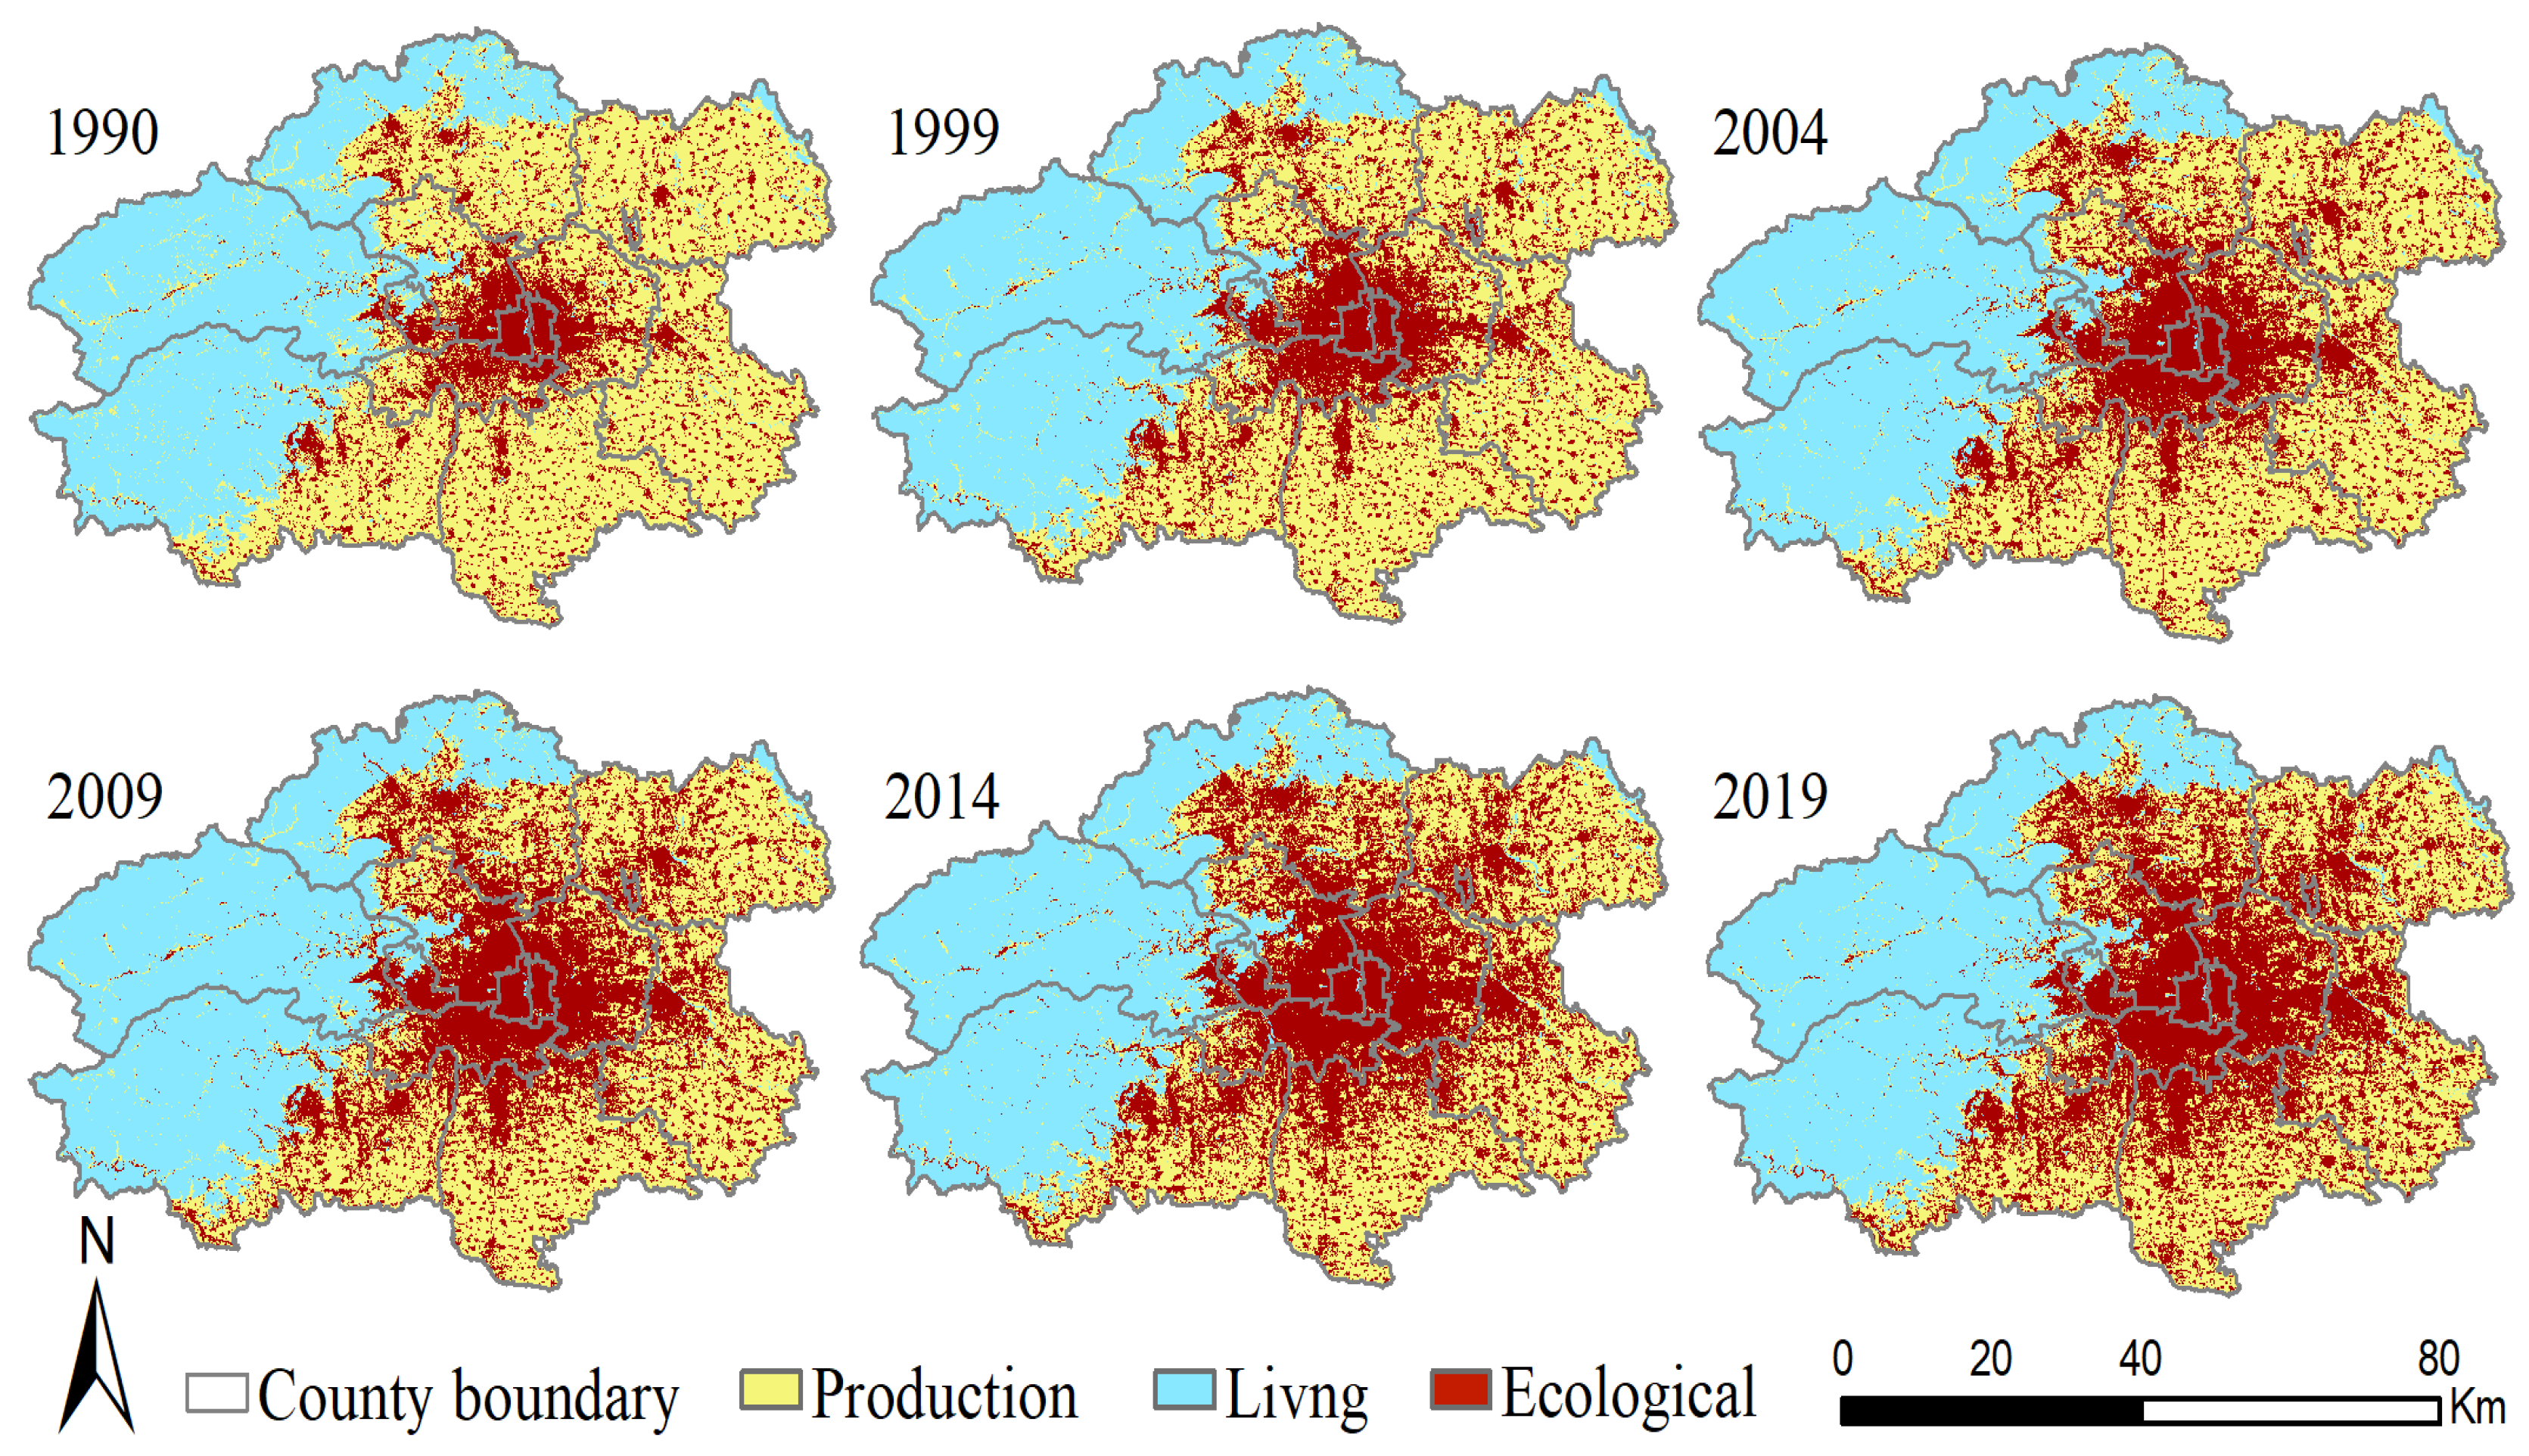
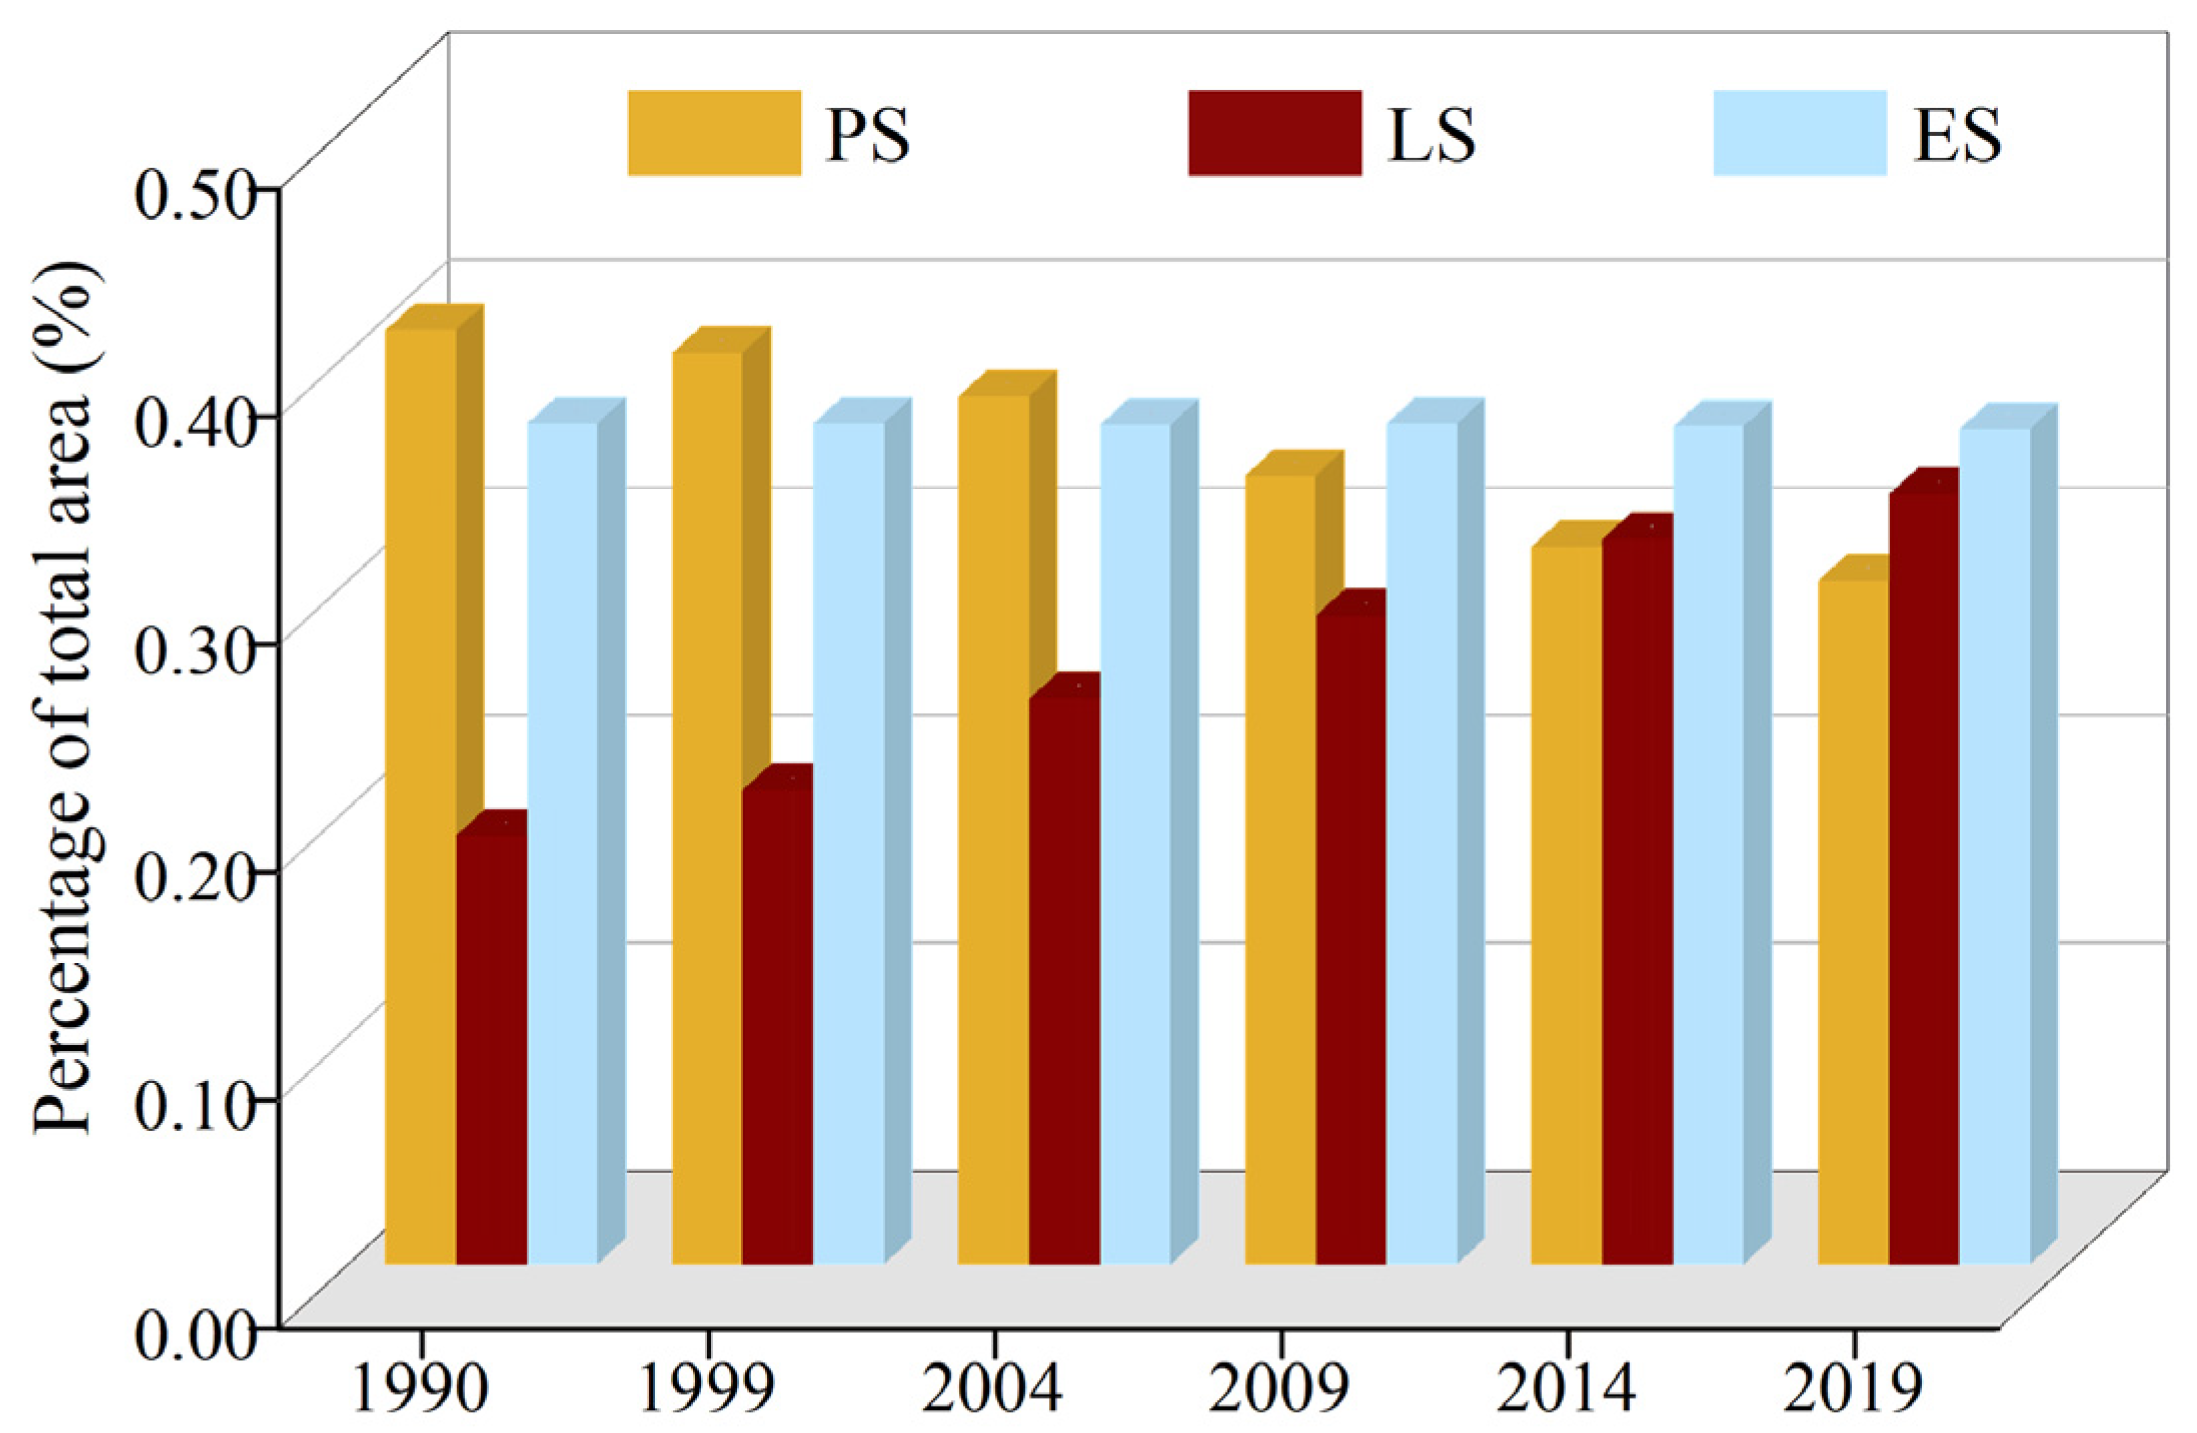
In this study, the acquired land use/cover data of the study area were geographically grouped based on the dominant function principle and divided into production, living, and ecological spaces (PLES, Table 2), and the distribution and proportional relationship of the three spaces in 1990, 1999, 2004, 2009, 2014, and 2019 were statistically summarized using ArcGIS software (Figure 2 and Figure 3).
Based on the characteristics of the study area, the production space in this study is mainly the agricultural production space, the living space consists of the space to meet the residents’ needs for residence, travel, and various activities and space for urban construction, while the ecological space refers to the space with ecological protection functions and can provide ecological products and services.
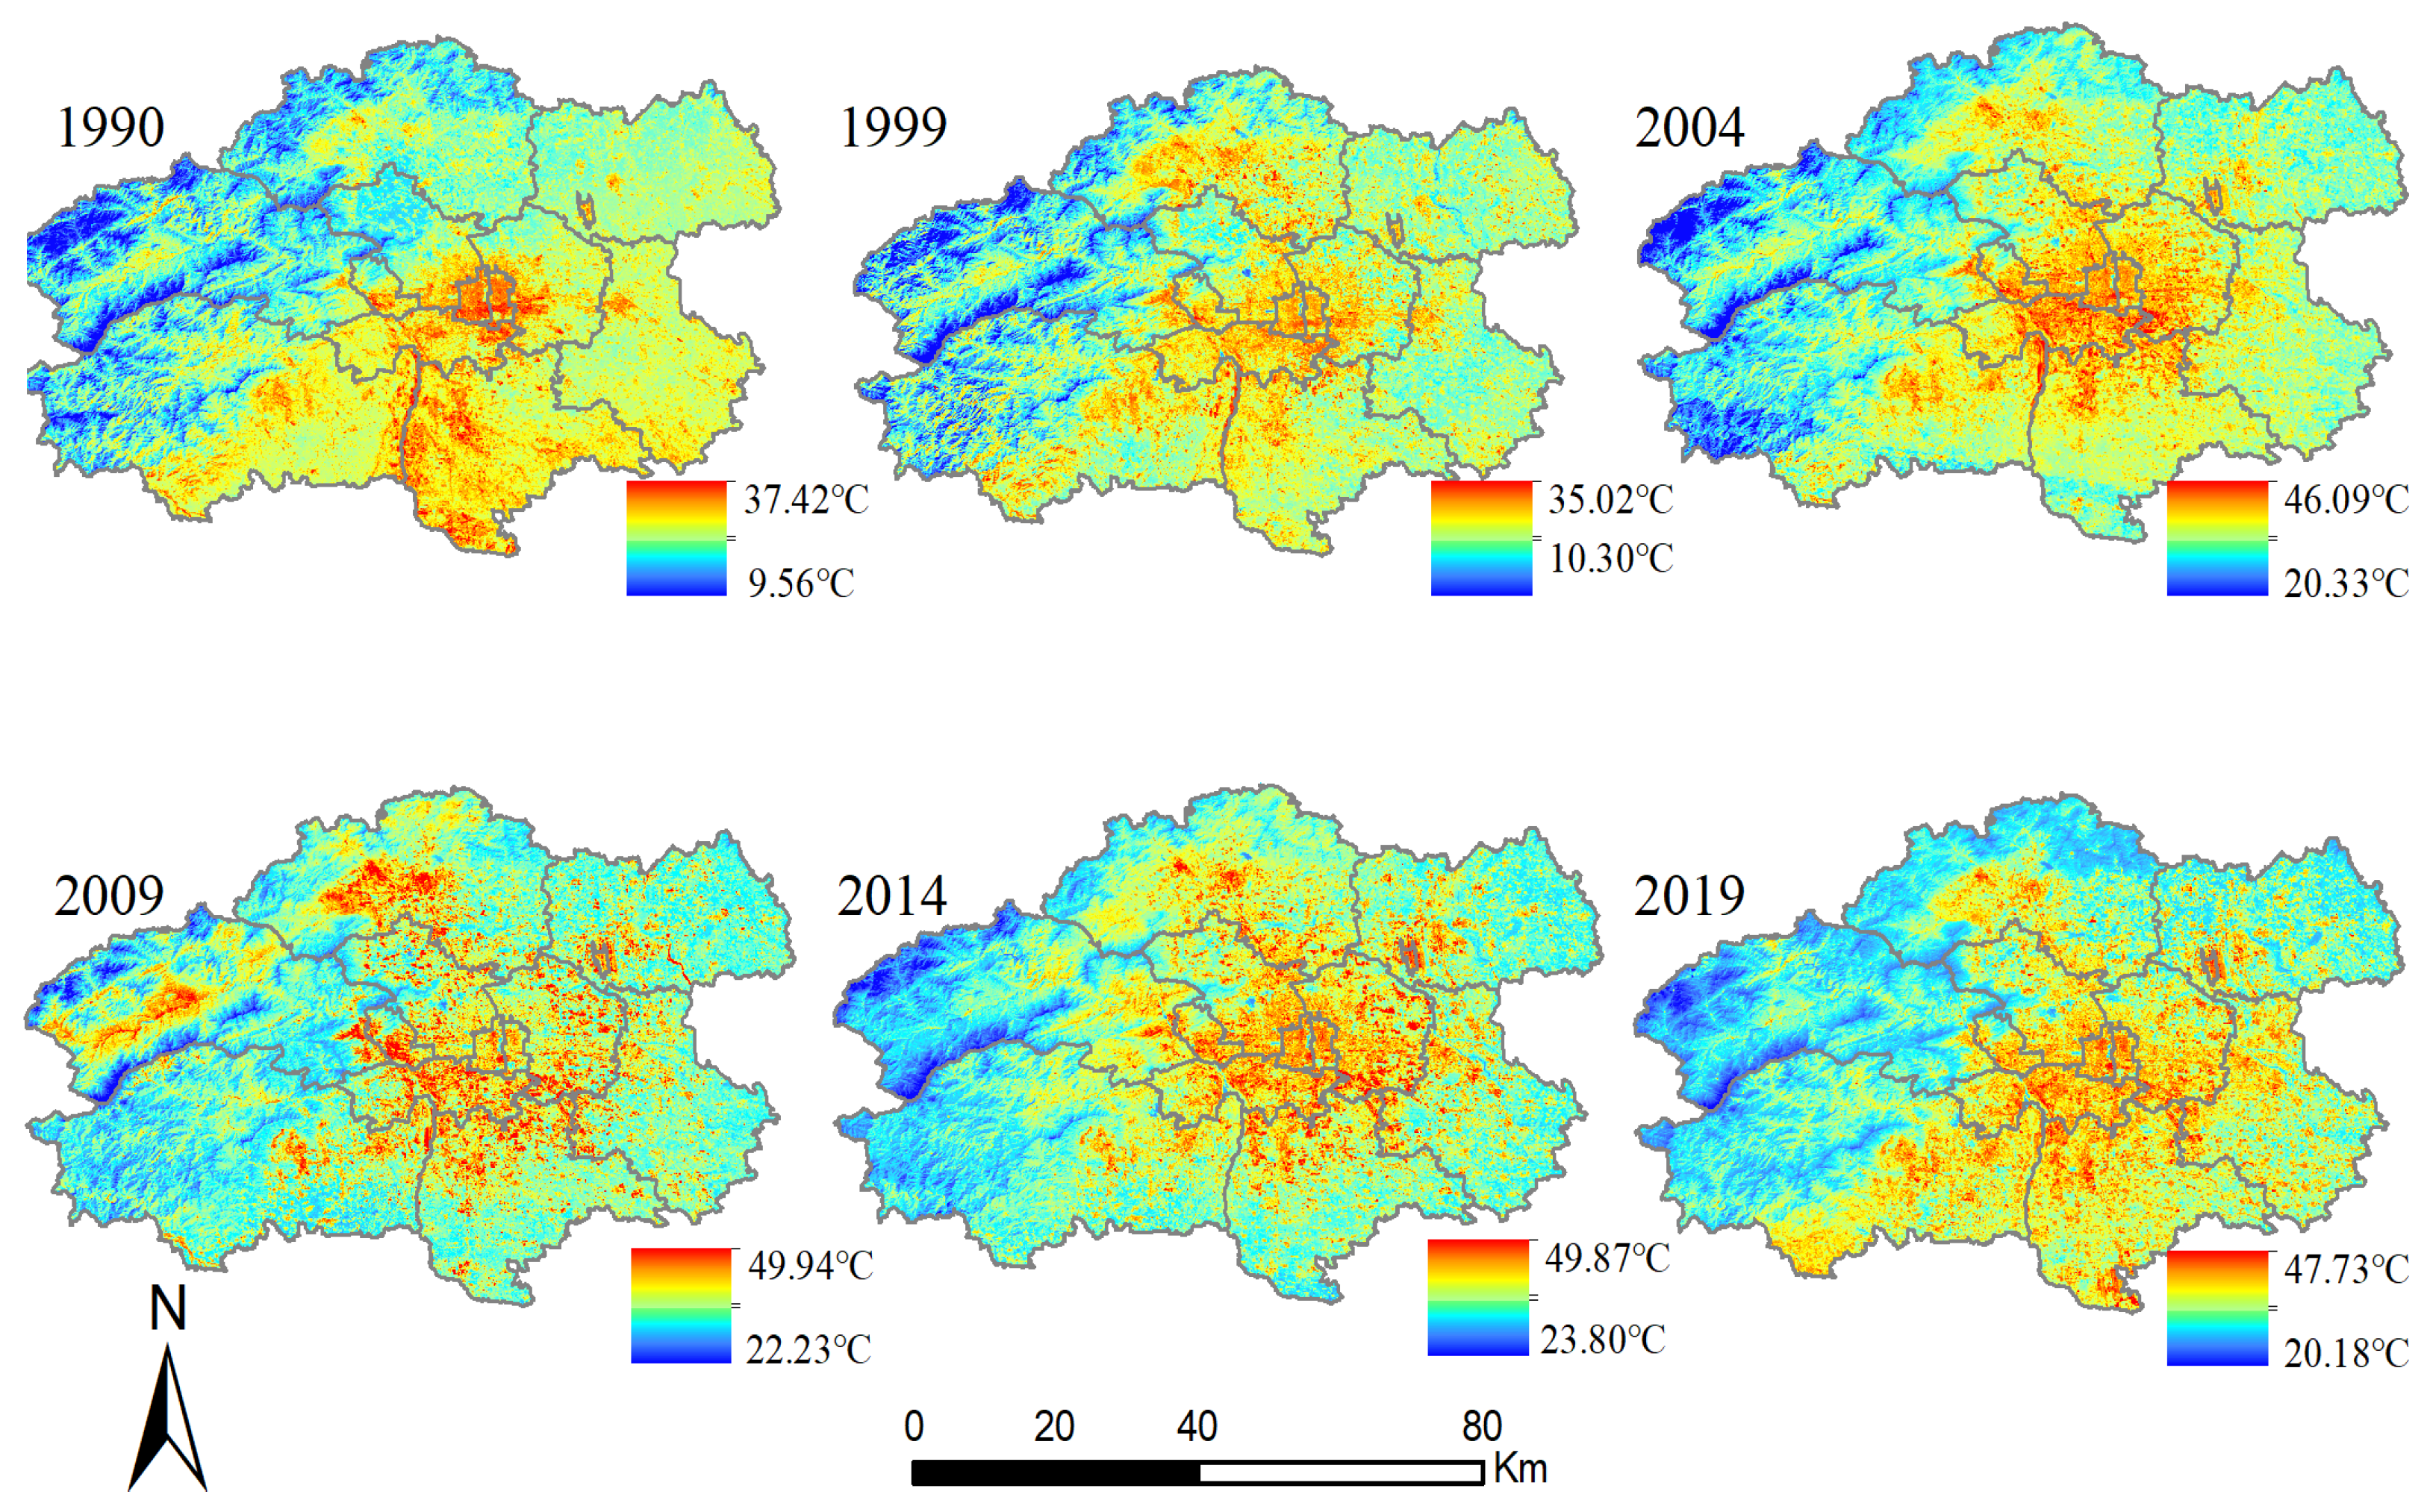
In this study, six Landsat images were selected from 1990, 1999, 2004, 2009, 2014, and 2019 during the low cloud period, and 12 LST single-band image scenes were acquired. This study then mosaicked these remote sensing images of each period together (Figure 4). LST data were obtained using a practical single channel (PSC) method with the GEE cloud platform and the Landsat series satellite surface temperature data inversion framework. The overall bias of the obtained temperature products was 0.17 K according to the cross-validation with MODIS LST products, indicating high accuracy.
2.3. Methods
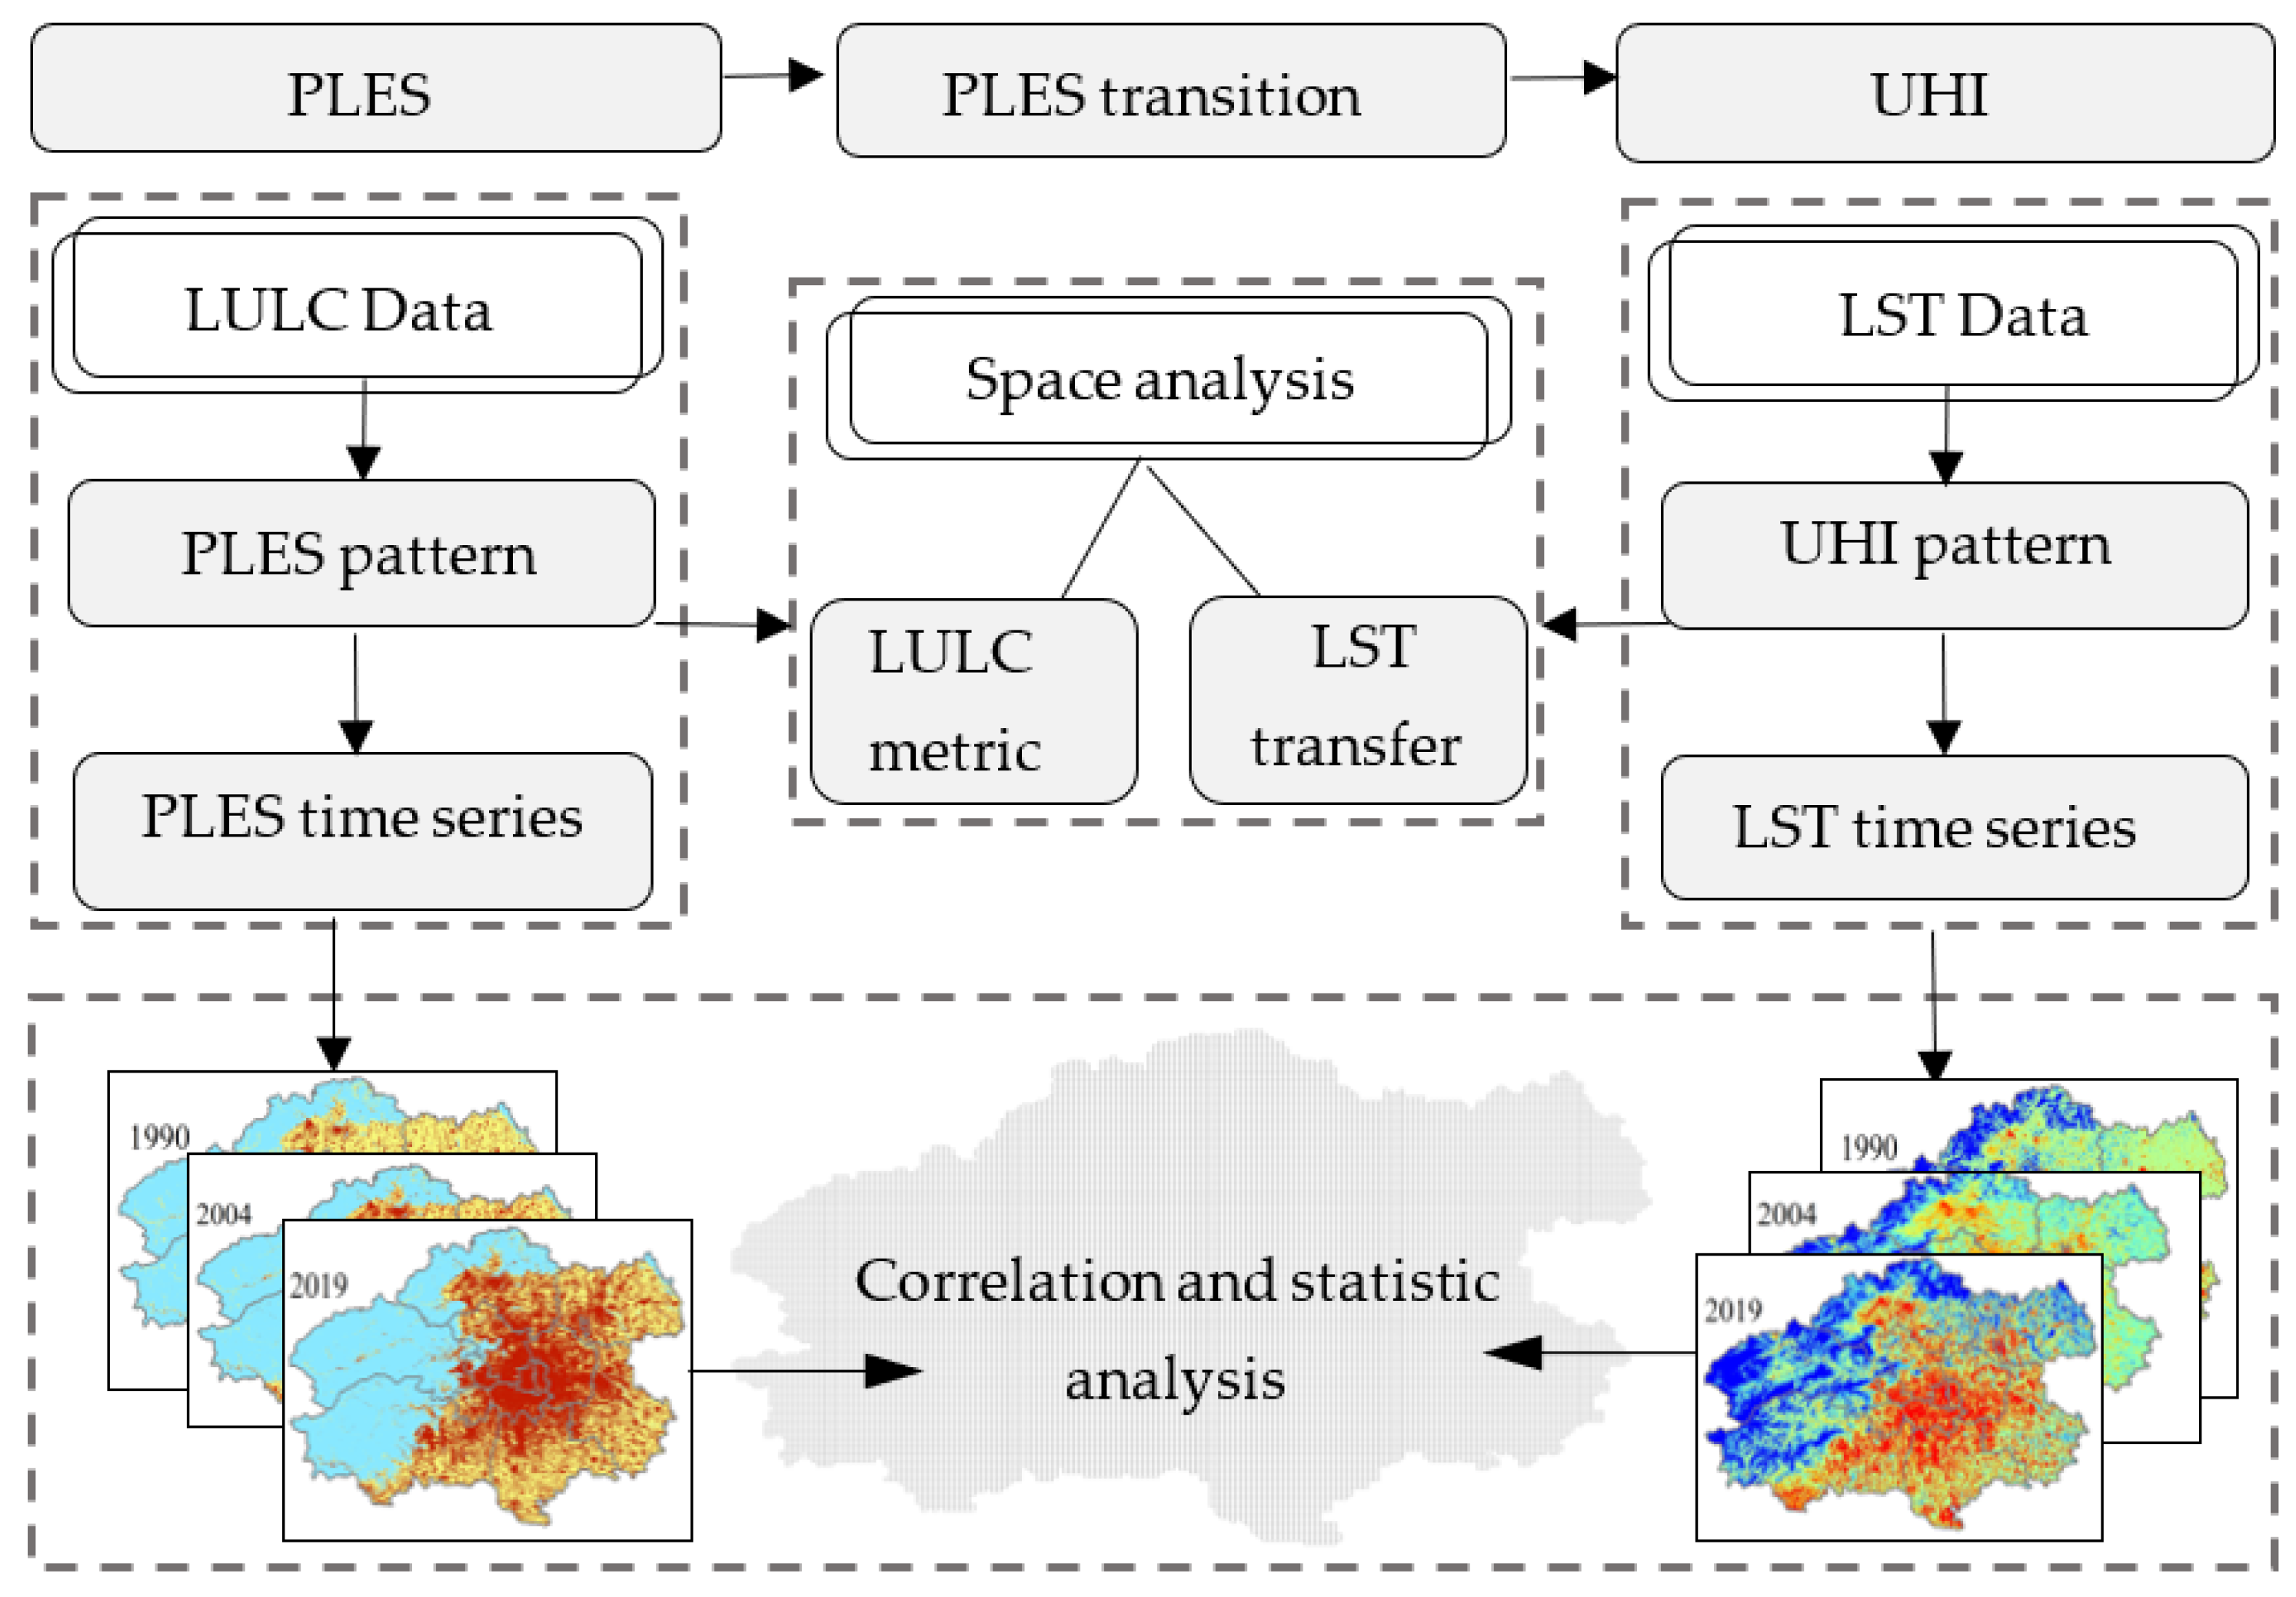
The research framework of this paper is divided into three steps (Figure 5). In the first step, PLES classification maps of the study area were generated based on LULC data with the production–living–ecology spatial classification system. The surface temperature maps for 1990, 1999, 2004, 2009, 2014, and 2019 were generated using the GEE platform. Secondly, we extracted the center of gravity of production space, living space, ecological space, and heat islands using ArcGIS and plotted the center of gravity migration trajectory and then generated the transfer matrix of the PLES using Origin. Thirdly, we applied the Pearson correlation analysis model to combine the PLES and LST data, and we also applied hot spot analysis to identify the hot and cold spots with statistical significance.
2.3.1. The Classification of the PLES
The classification of the PLES is crucial for studying the spatial patterns of these areas. However, there is currently no consensus on the classification system for PLES. In this study, we have used the dominant functions of the land to classify PLES and establish a connection between land use data and PLES. The production space comprises arable land, industrial land, and storage land. The living space includes residential areas and transportation facilities. The ecological space primarily consists of forests and water bodies.
2.3.2. Land Use Structure Shift
The area tabulation and aggregation of the tristimulus data for each year was carried out using the tristimulus transfer matrix formula to obtain cross-transformed data.
In Equation (1), S denotes the area of land type, denote the land use type at the beginning and the end of the study period, respectively, and denotes the area transferred from land use type at the beginning to land use type at the end. Each row in the matrix represents the information on the transfer of land type at the beginning of the period to all land types at the end, and each column represents the information on the transfer of land type at the end from all land types at the beginning.
2.3.3. Thermal Environment Grading Classification
Since the climatic differences between years affect the true land surface temperature, it needs to be standardized at first. The formula is as follows.
where denotes the standardized temperature of the grid, denotes the temperature of the grid, denotes the maximum temperature, and denotes the minimum temperature.
The mean–standard deviation method was used to classify the thermal environment in the study area, and the LST was divided into five thermal classes: low, sub-low, medium, sub-high temperature, and high temperature (Table 2). By grading the LST, a map of the thermal class distribution can be generated for each period, making the thermal environment comparable across time.
2.3.4. Spatial Autocorrelation Analysis and Correlation Analysis
In this study, we used the spatial autocorrelation tool in ArcGIS software to calculate the Moran’s I and LST of the production–living–ecological space and analyze the aggregation characteristics of PLES distribution and LST to detect the spatial autocorrelation of geographic entities. The calculation formula is as follows.
where n denotes the number of samples, denotes the spatial weight matrix, denotes the temperature value, denotes the PLAND value of each period, and denotes the arithmetic mean of the temperature value.
2.3.5. Hot Spot Analysis (Getis–Ord Gi*)
The spatial LST distribution over the city landscape was examined using hot spot analysis (Getis–Ord Gi*) to characterize both hot and cold spots over Beijing city using LST based on its neighboring features. The Getis–Ord Gi* statistic is derived from Equations (6)–(8).
where is defined by the feature attribute value of , is defined by the spatial weight between features and , and is defined by the total number of features.
3. Results
3.1. Temporal and Spatial Transfer Characteristics of PLES
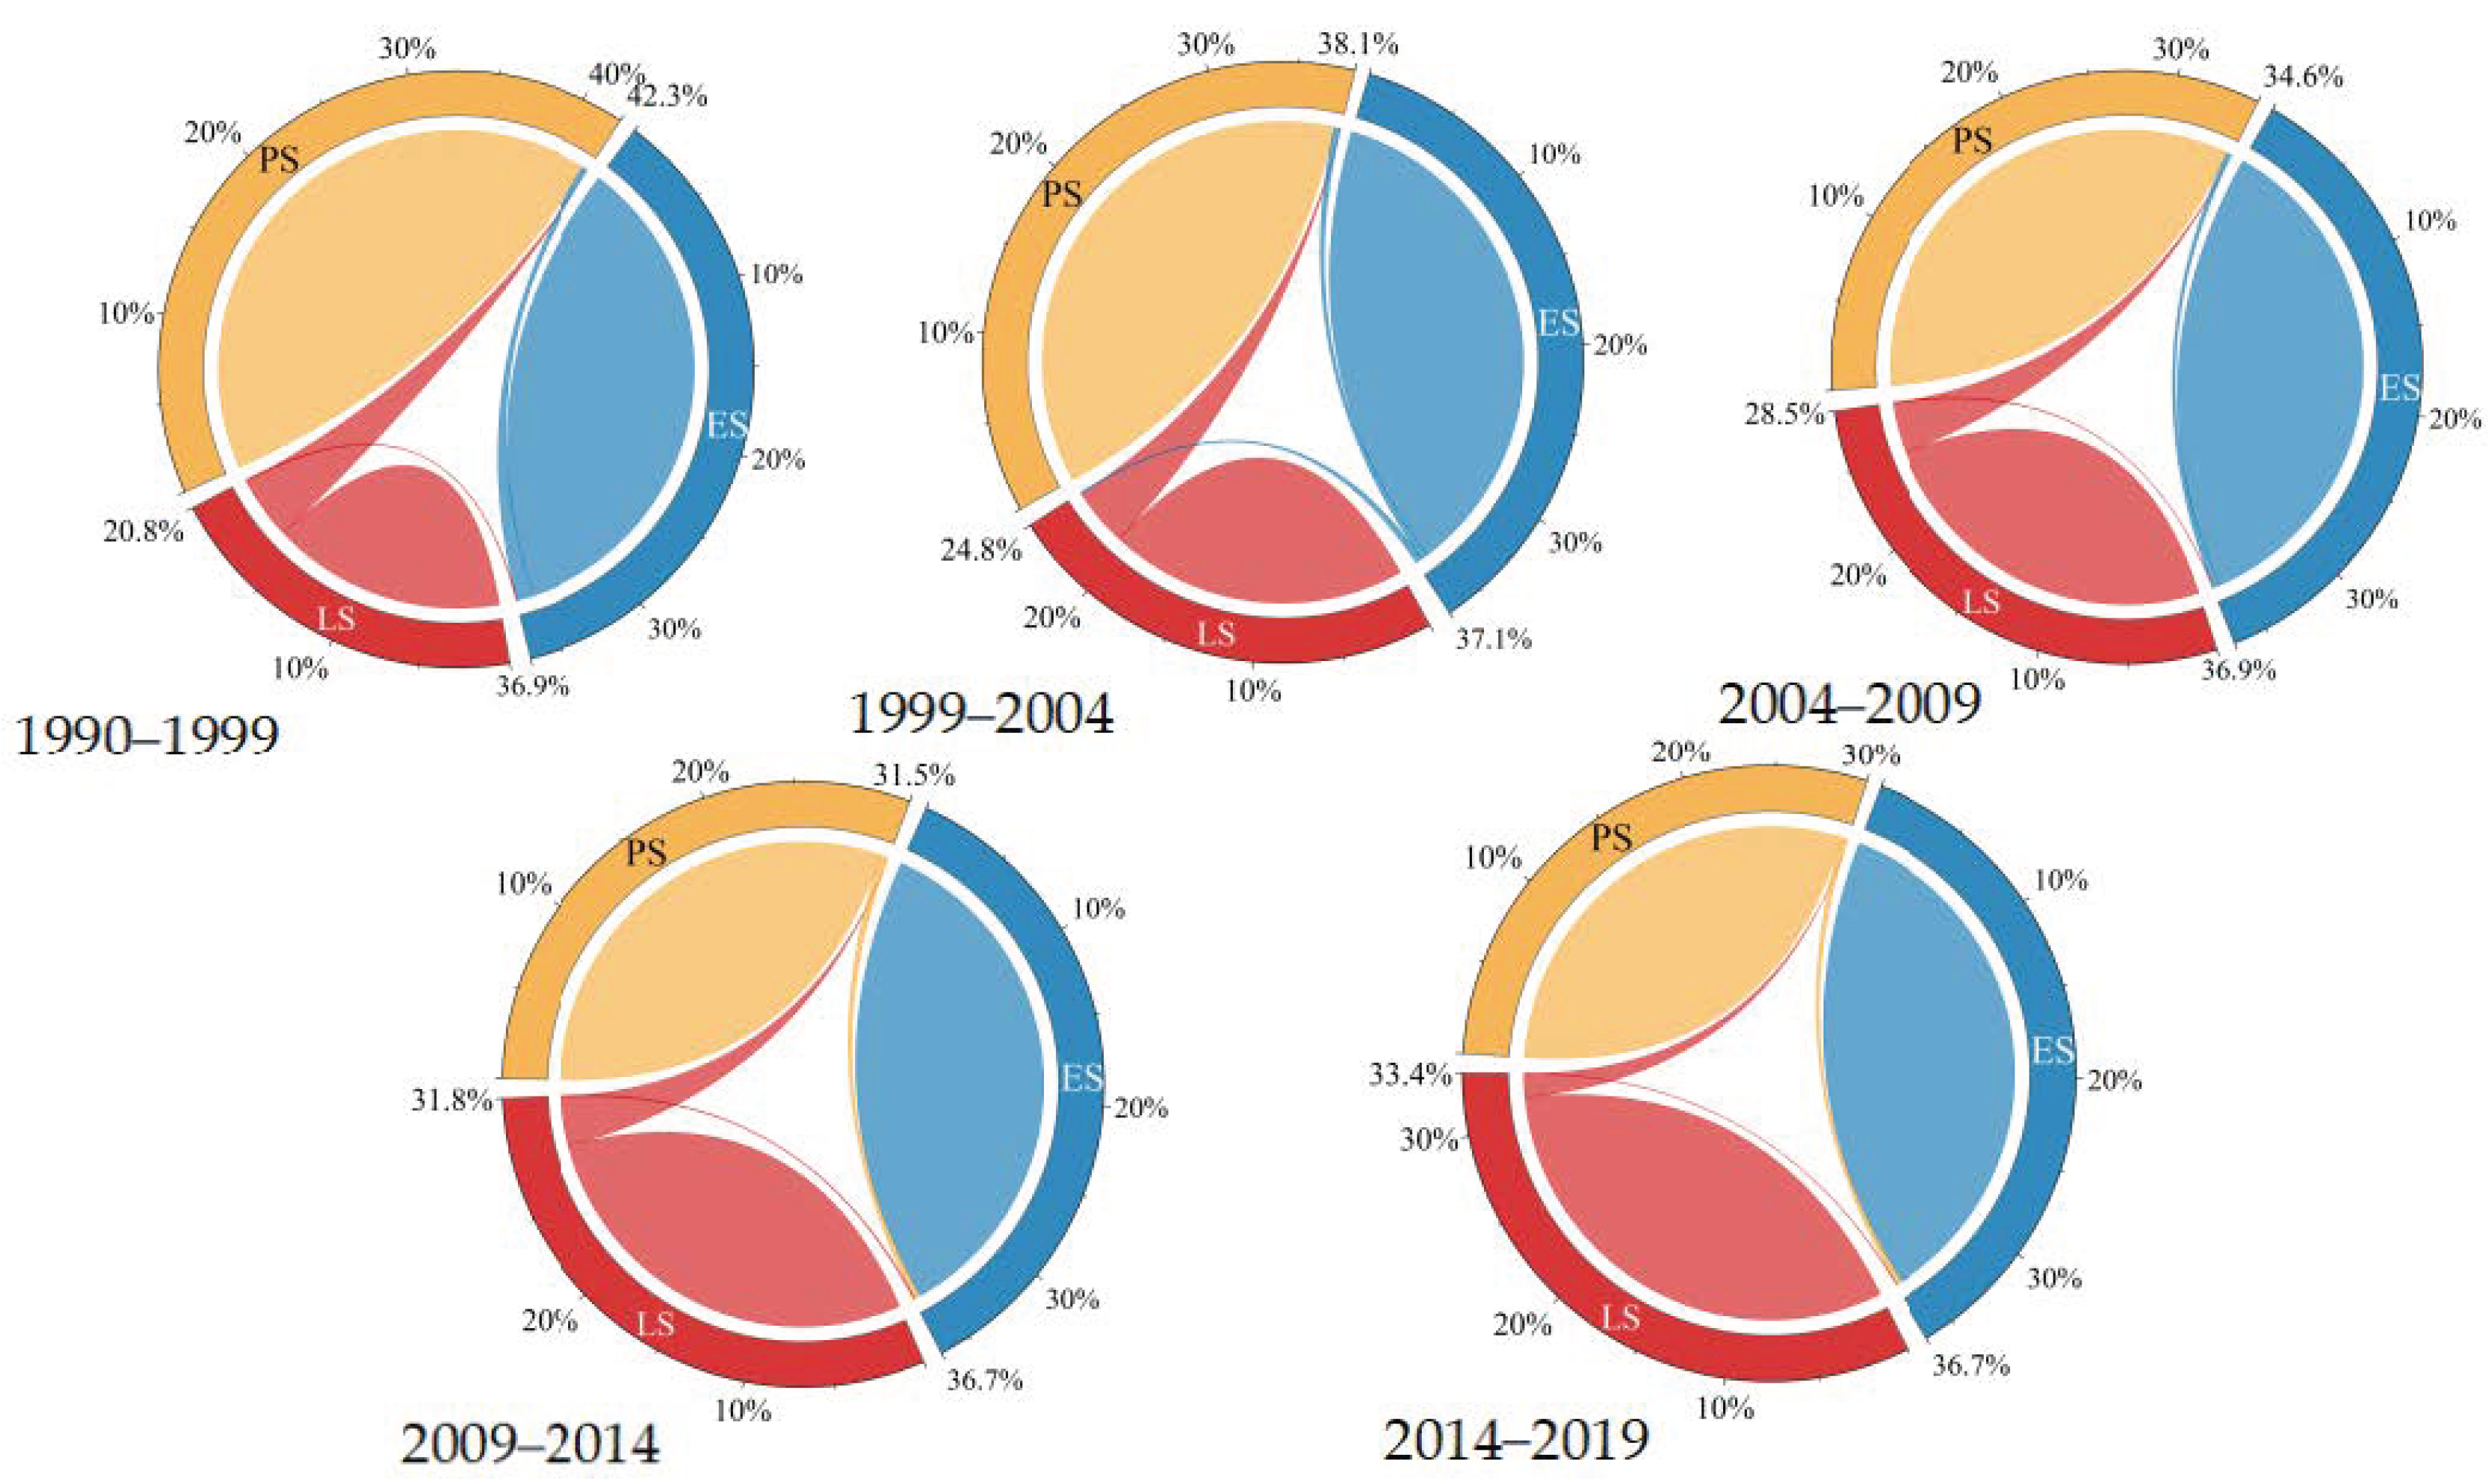
In this study, we conducted a statistical analysis of the changes in the area of PLES from 1990 to 2019. We also conducted a structure transfer analysis of the PLES area for five different study periods: 1990–1999, 1999–2004, 2004–2009, 2009–2014, and 2014–2019 (Figure 6). The results indicate that the area of living space land in the study area significantly increased over the 30-year period, from 20.8% to 33.4% of the total area. On the other hand, the area of production space land decreased each year, from 42.3% to 30%. The area of ecological space land did not show noticeable changes, with a slight decrease from 36.9% to 36.7%.
The main change in the PLES was observed in the transfer between living and production space land, specifically the transformation from production space land to living space land. From 1990 to 2014, the living space area expanded at a faster rate, with a spatial share increase of 11%. However, from 2014 to 2019, the growth rate gradually slowed down, with a spatial share increase of 1.6%.
This development trend aligns with the urbanization process in Beijing. The urbanization rate exceeded 70% in 1990, and since 2000, urbanization has shifted from a high rate to rapid development. The demand for living space has significantly increased due to population growth and the expansion of the construction scale. In April 2015, the Beijing–Tianjin–Hebei Synergistic Development Plan Outline was adopted, which aimed to orderly deconstruct Beijing’s non-capital functions. This involved shutting down and withdrawing general manufacturing and polluting enterprises, promoting industrial transfer, dismantling commodity trading markets in the central city, and regulating the population scale. As a result, there has been a gradual reduction in the scale of land for production space. Additionally, the establishment of Xiong’an New Area in April 2017 has effectively carried out the task of de-congesting Beijing’s non-capital functions.
3.2. Characteristics of the Distribution of Thermal Environment
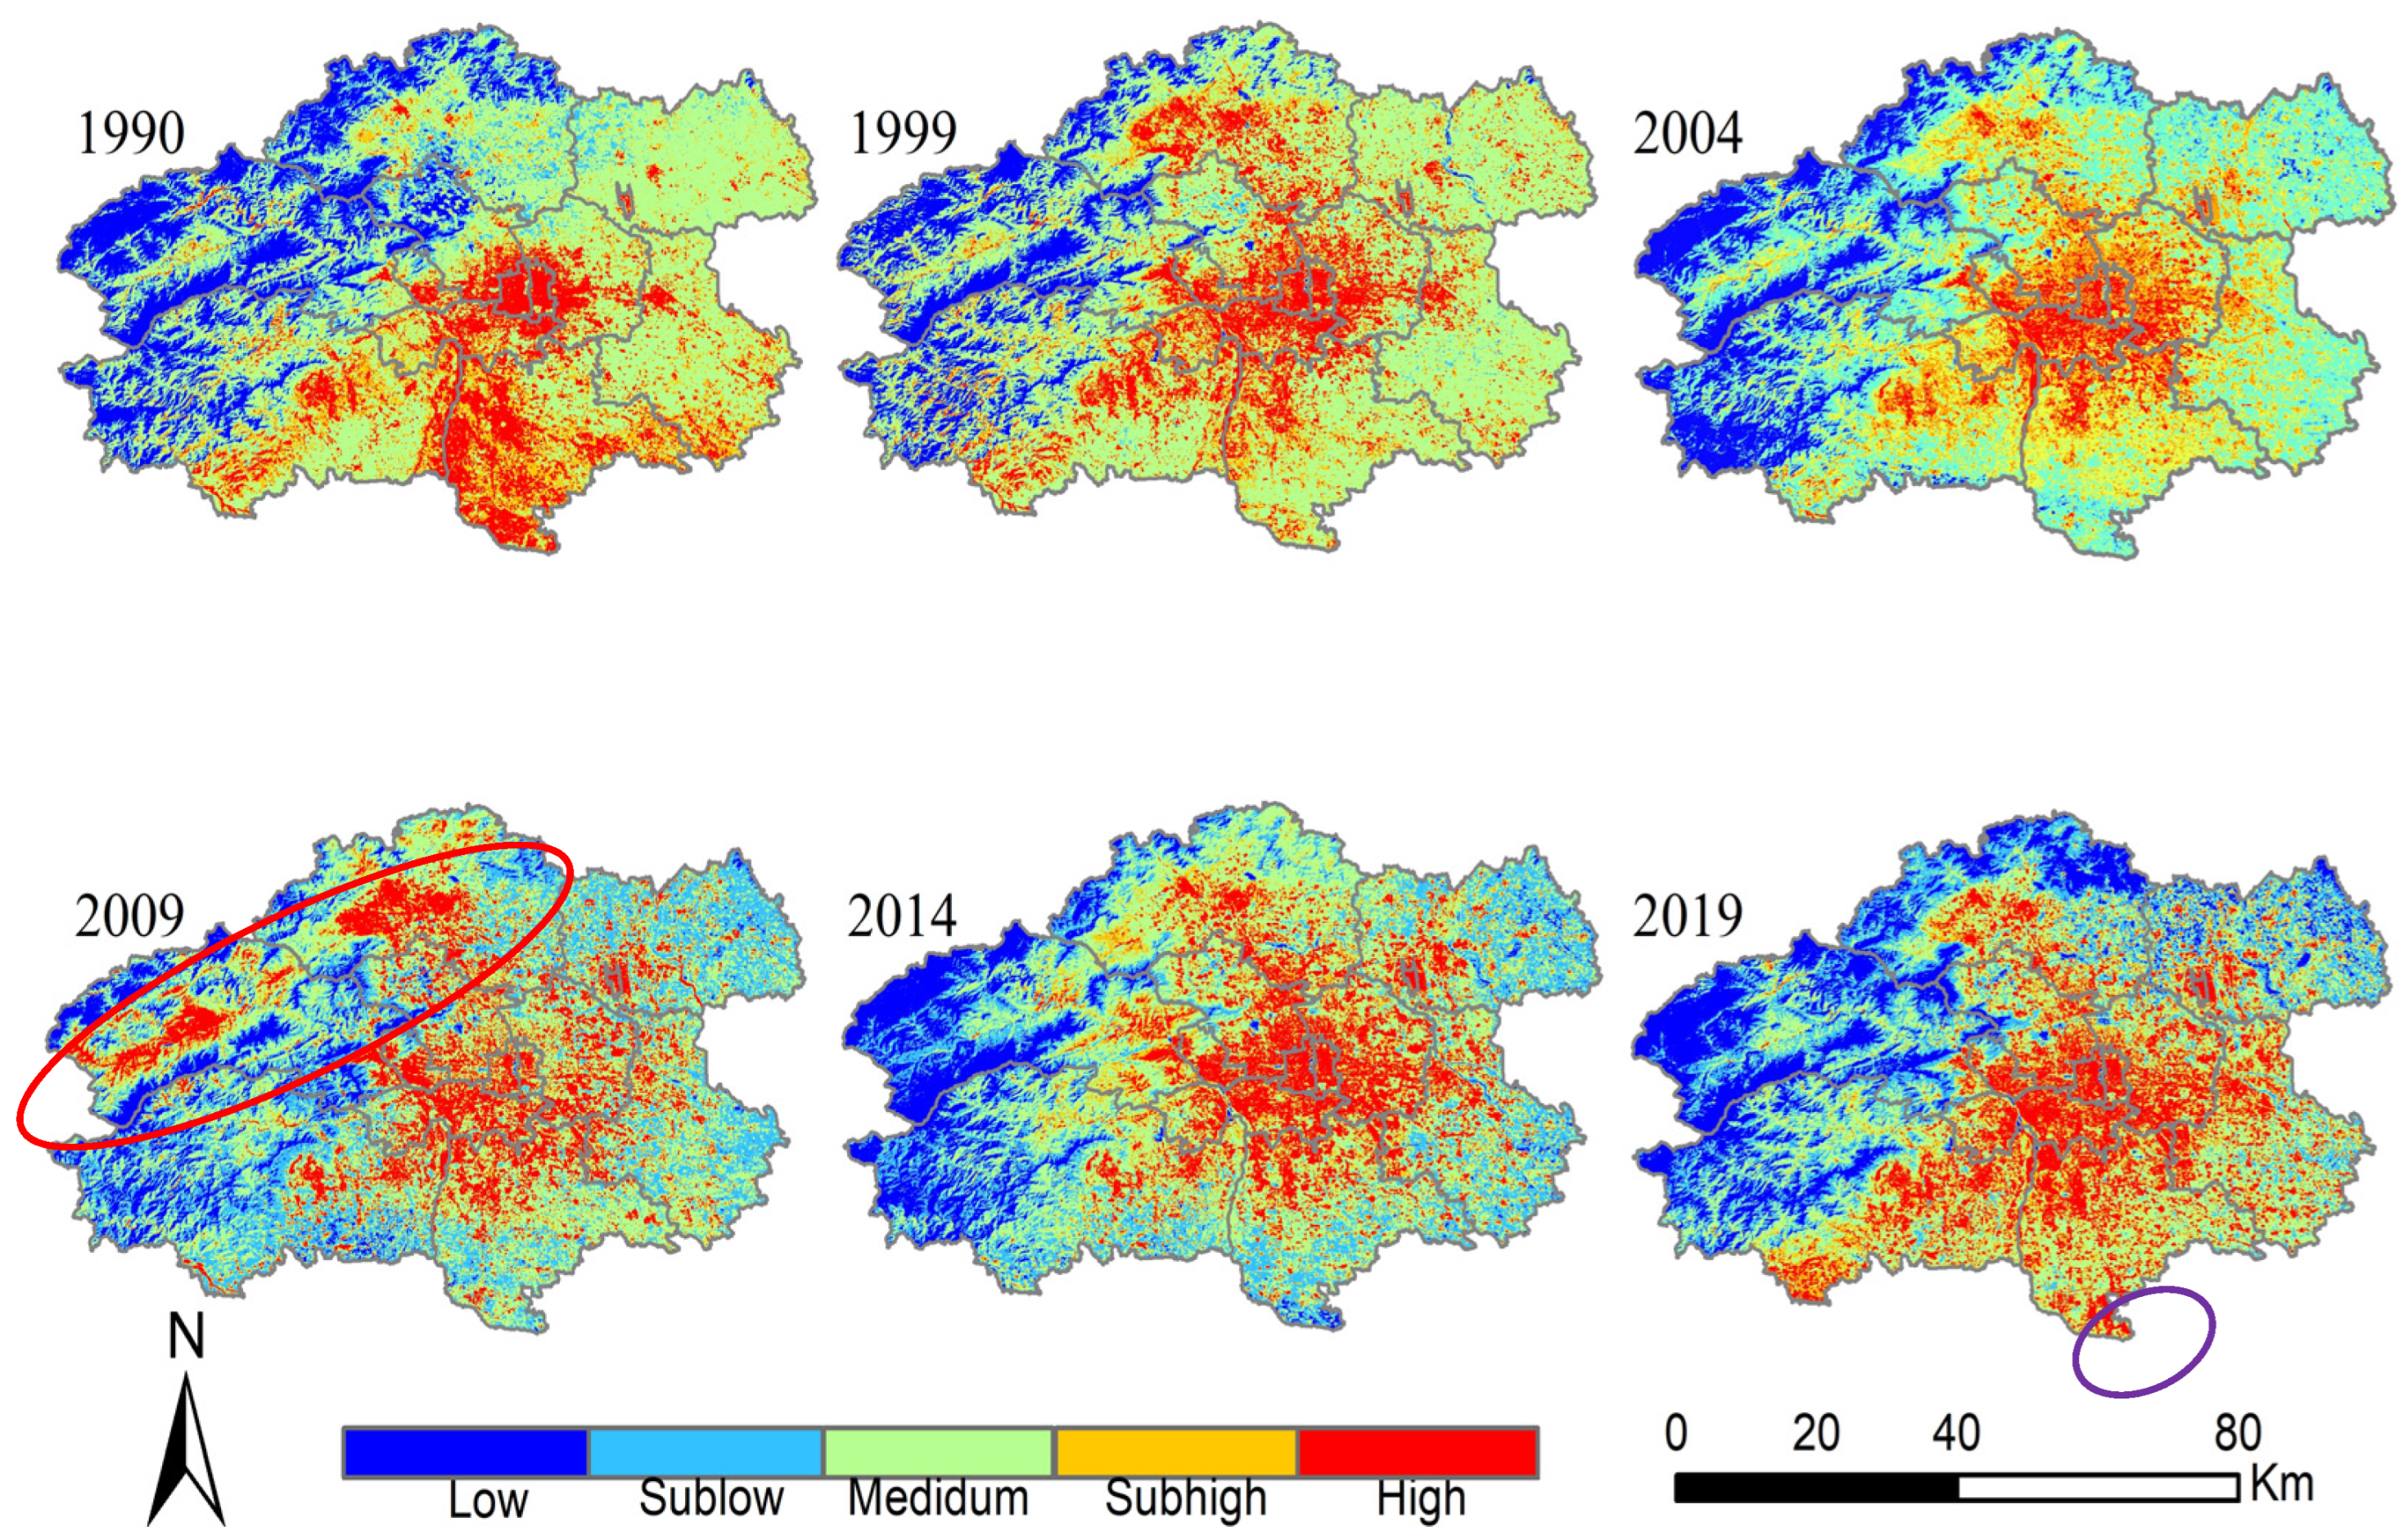
In this study, the high-temperature and sub-high-temperature zones were set as the heat island zones, the medium-temperature zones as the normal zones, and the low-temperature and sub-low-temperature zones as the cold island zones, generating heat level distribution maps for six time periods in 1990, 1999, 2004, 2009, 2014 and 2019 (Figure 7). The results show that the thermal environment pattern in the study area has changed dramatically over the 30-year period, with the heat island area centered on the east and west urban areas and gradually expanding to the exterior, keeping pace with the urbanization development process, among which the changes in the southern Daxing District and the western Mentougou District are more representative. Among them, the heat island effect in Daxing District shows a trend from strong to weak and gradually growing stronger. In 1990, the heat island effect in the region was significant, which originated from the large proportion of bare land and strong reflectivity in the region, and with the continuous expansion of agricultural production area, the heat island range gradually shrank, until 2019, when Daxing Airport was officially put into service, which led to the thermal island effect in the southeast corner of the region (purple circle range) suddenly intensifying. Mentougou District is rich in coal resources, due to the ecological environment deterioration caused by mining, resulting in its highest heat island effect in 2009 (red circle range), the intensity is even higher than in the central urban area, and then, with the formation of the “ecological connotation zone” function, mines and sand and gravel plants and mines were closed, and the ecological environment of the area was significantly improved through reforestation, sand source treatment, the ecological restoration of abandoned mines, and comprehensive treatment of Yongding River. The thermal environment in Fangshan District has undergone significant changes in recent years. From 1999 to 2005, comprehensive environmental restoration was carried out in the mining areas of Fangshan District, particularly in the areas of limestone and dolomite extraction, resulting in a significant increase in vegetation cover. However, with the development of the economy and urban expansion, the underlying surface properties in Fangshan District have changed, leading to changes in the surface thermal environment. Especially in the southernmost part of Fangshan District, the thermal environmental effects have become more pronounced due to changes in underlying surface types, urban expansion, and increased human activities.
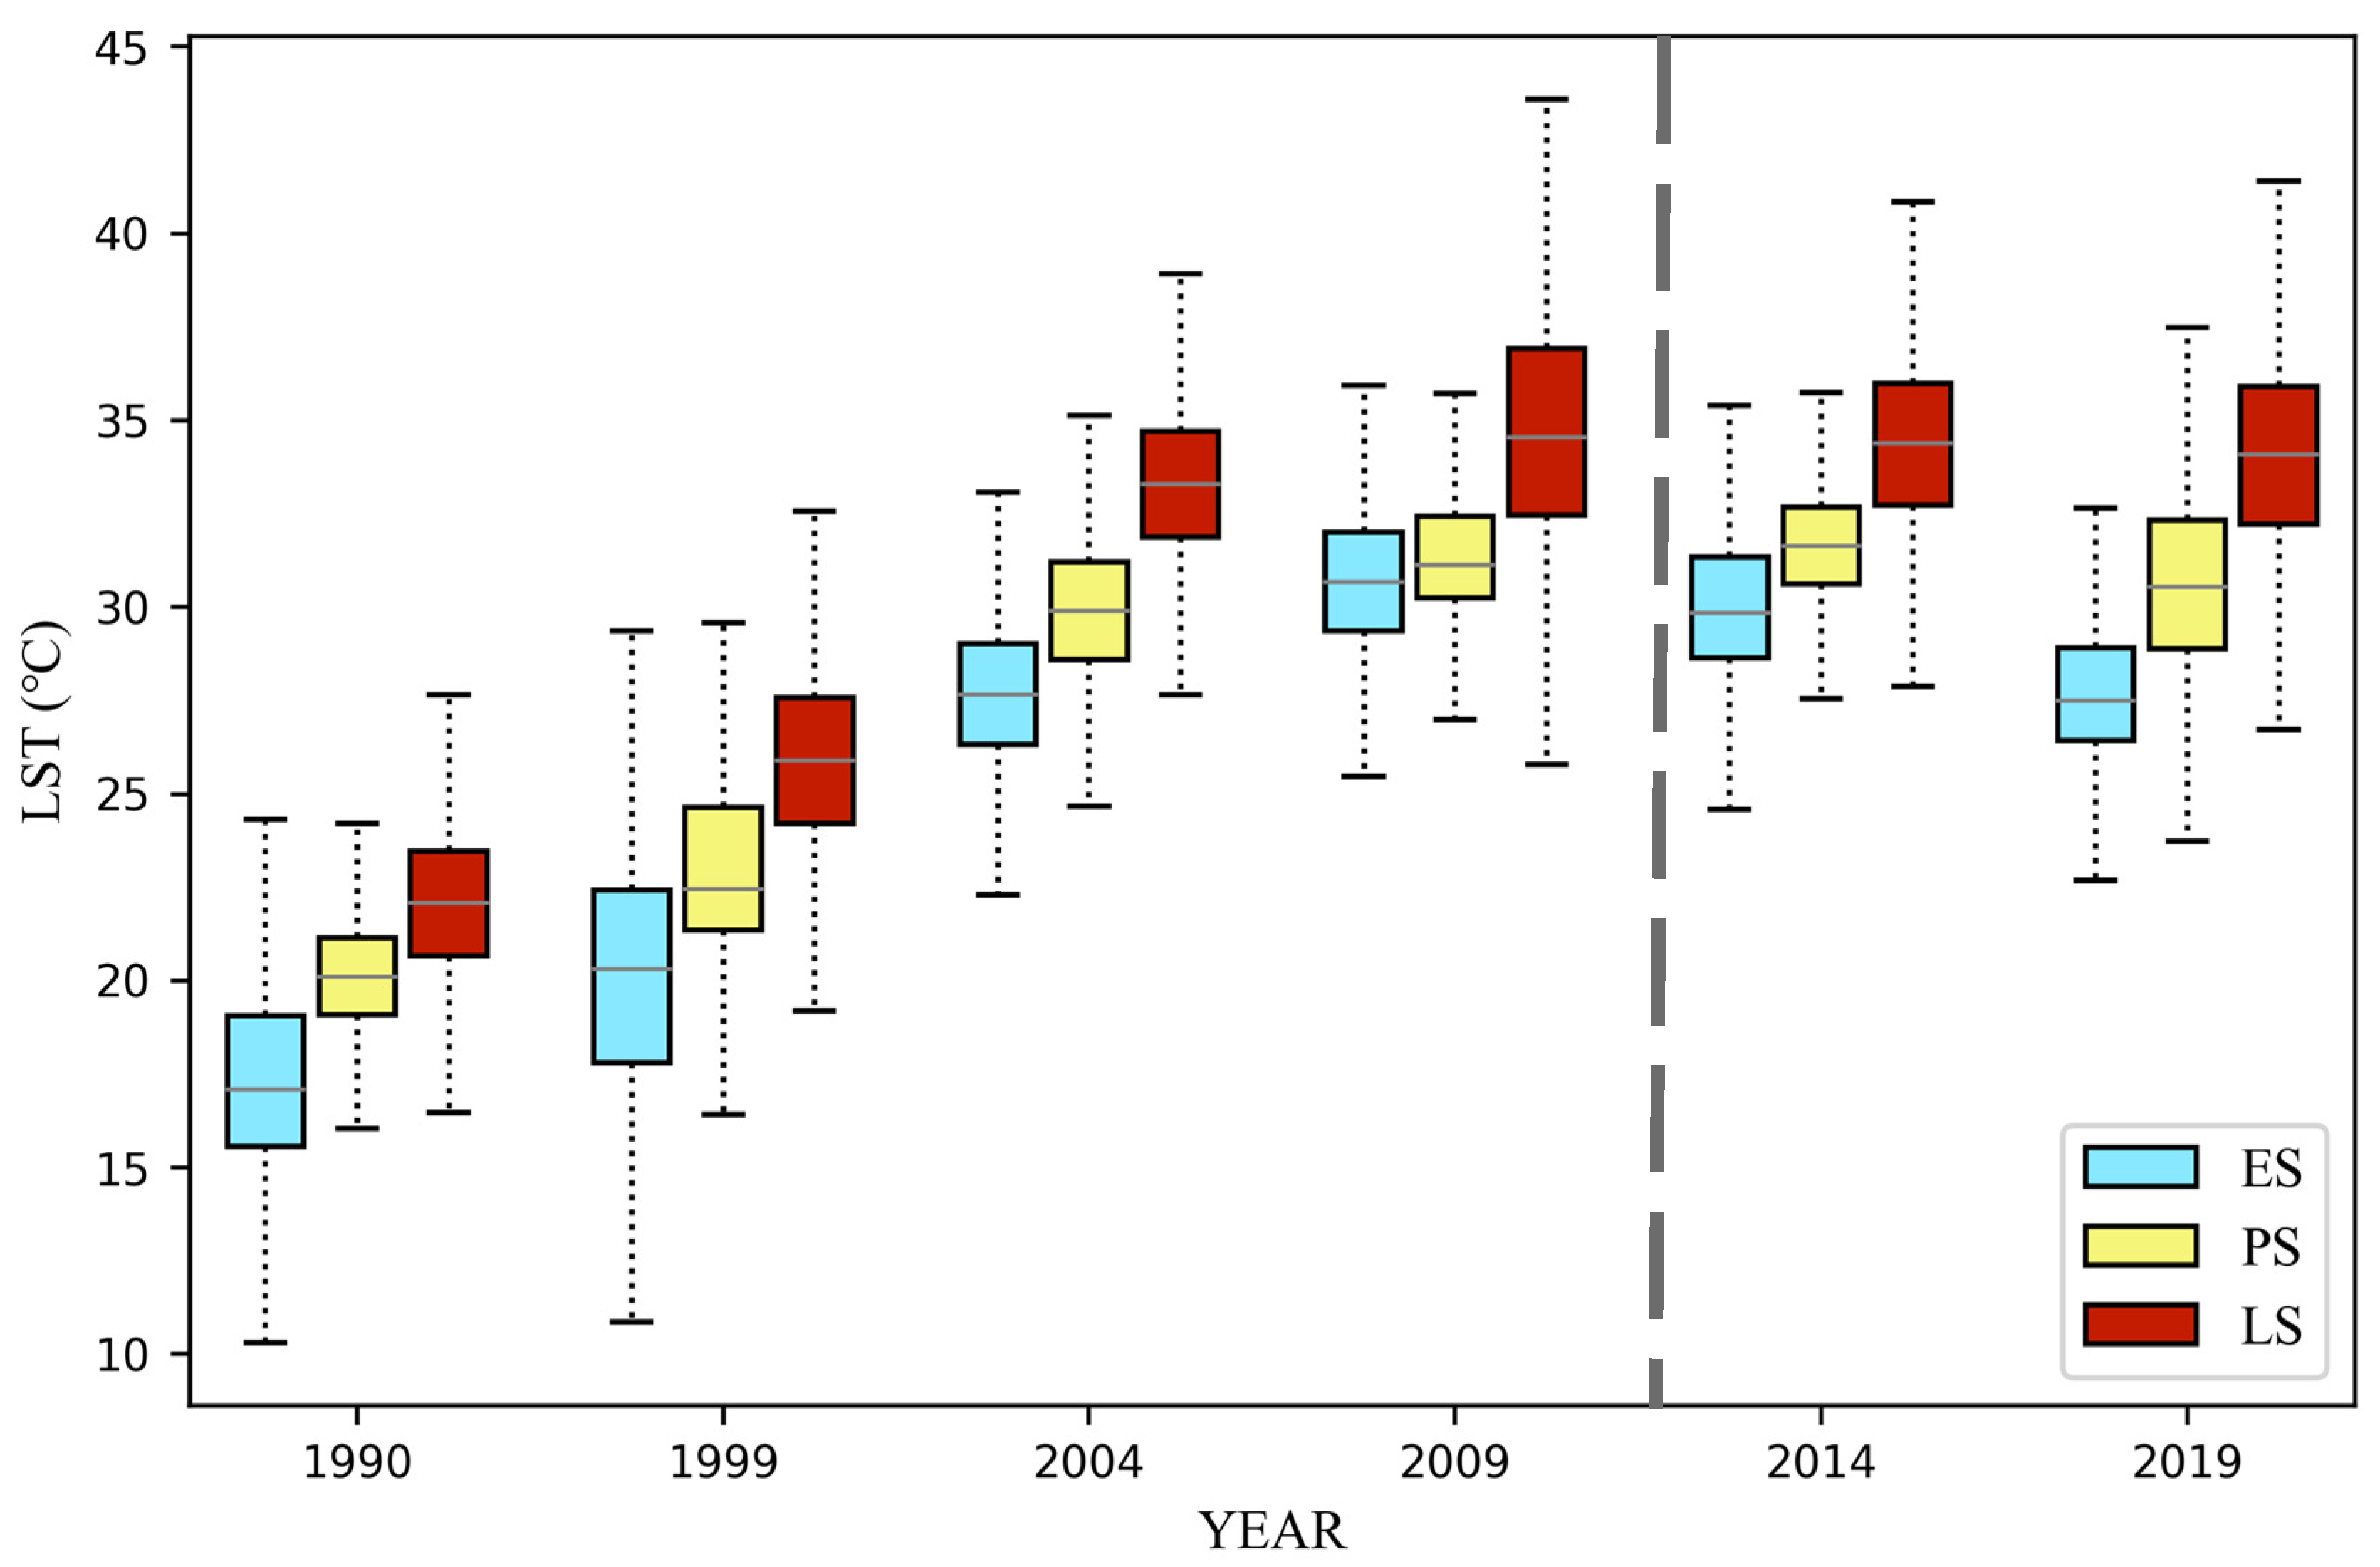
In order to show the LST change more intuitively, the temperature of the PLES in this study was counted (Figure 8), and the results show that the lowest value in the study area in the past 30 years appeared in the ecological space in 1990, and the highest temperature appeared in the living space in 2009. The average surface temperature of the PLES in the region was divided into two stages with the year 2009 as the boundary. Before 2009, the average surface temperature of all types of spaces showed an increasing trend; after 2009, the ecological space cooled significantly and the ecological cold island effect appeared, while the average surface temperature of production and living spaces basically maintained a stable state.
3.3. Spatial Dynamics of Urban Heat Island and PLES Land
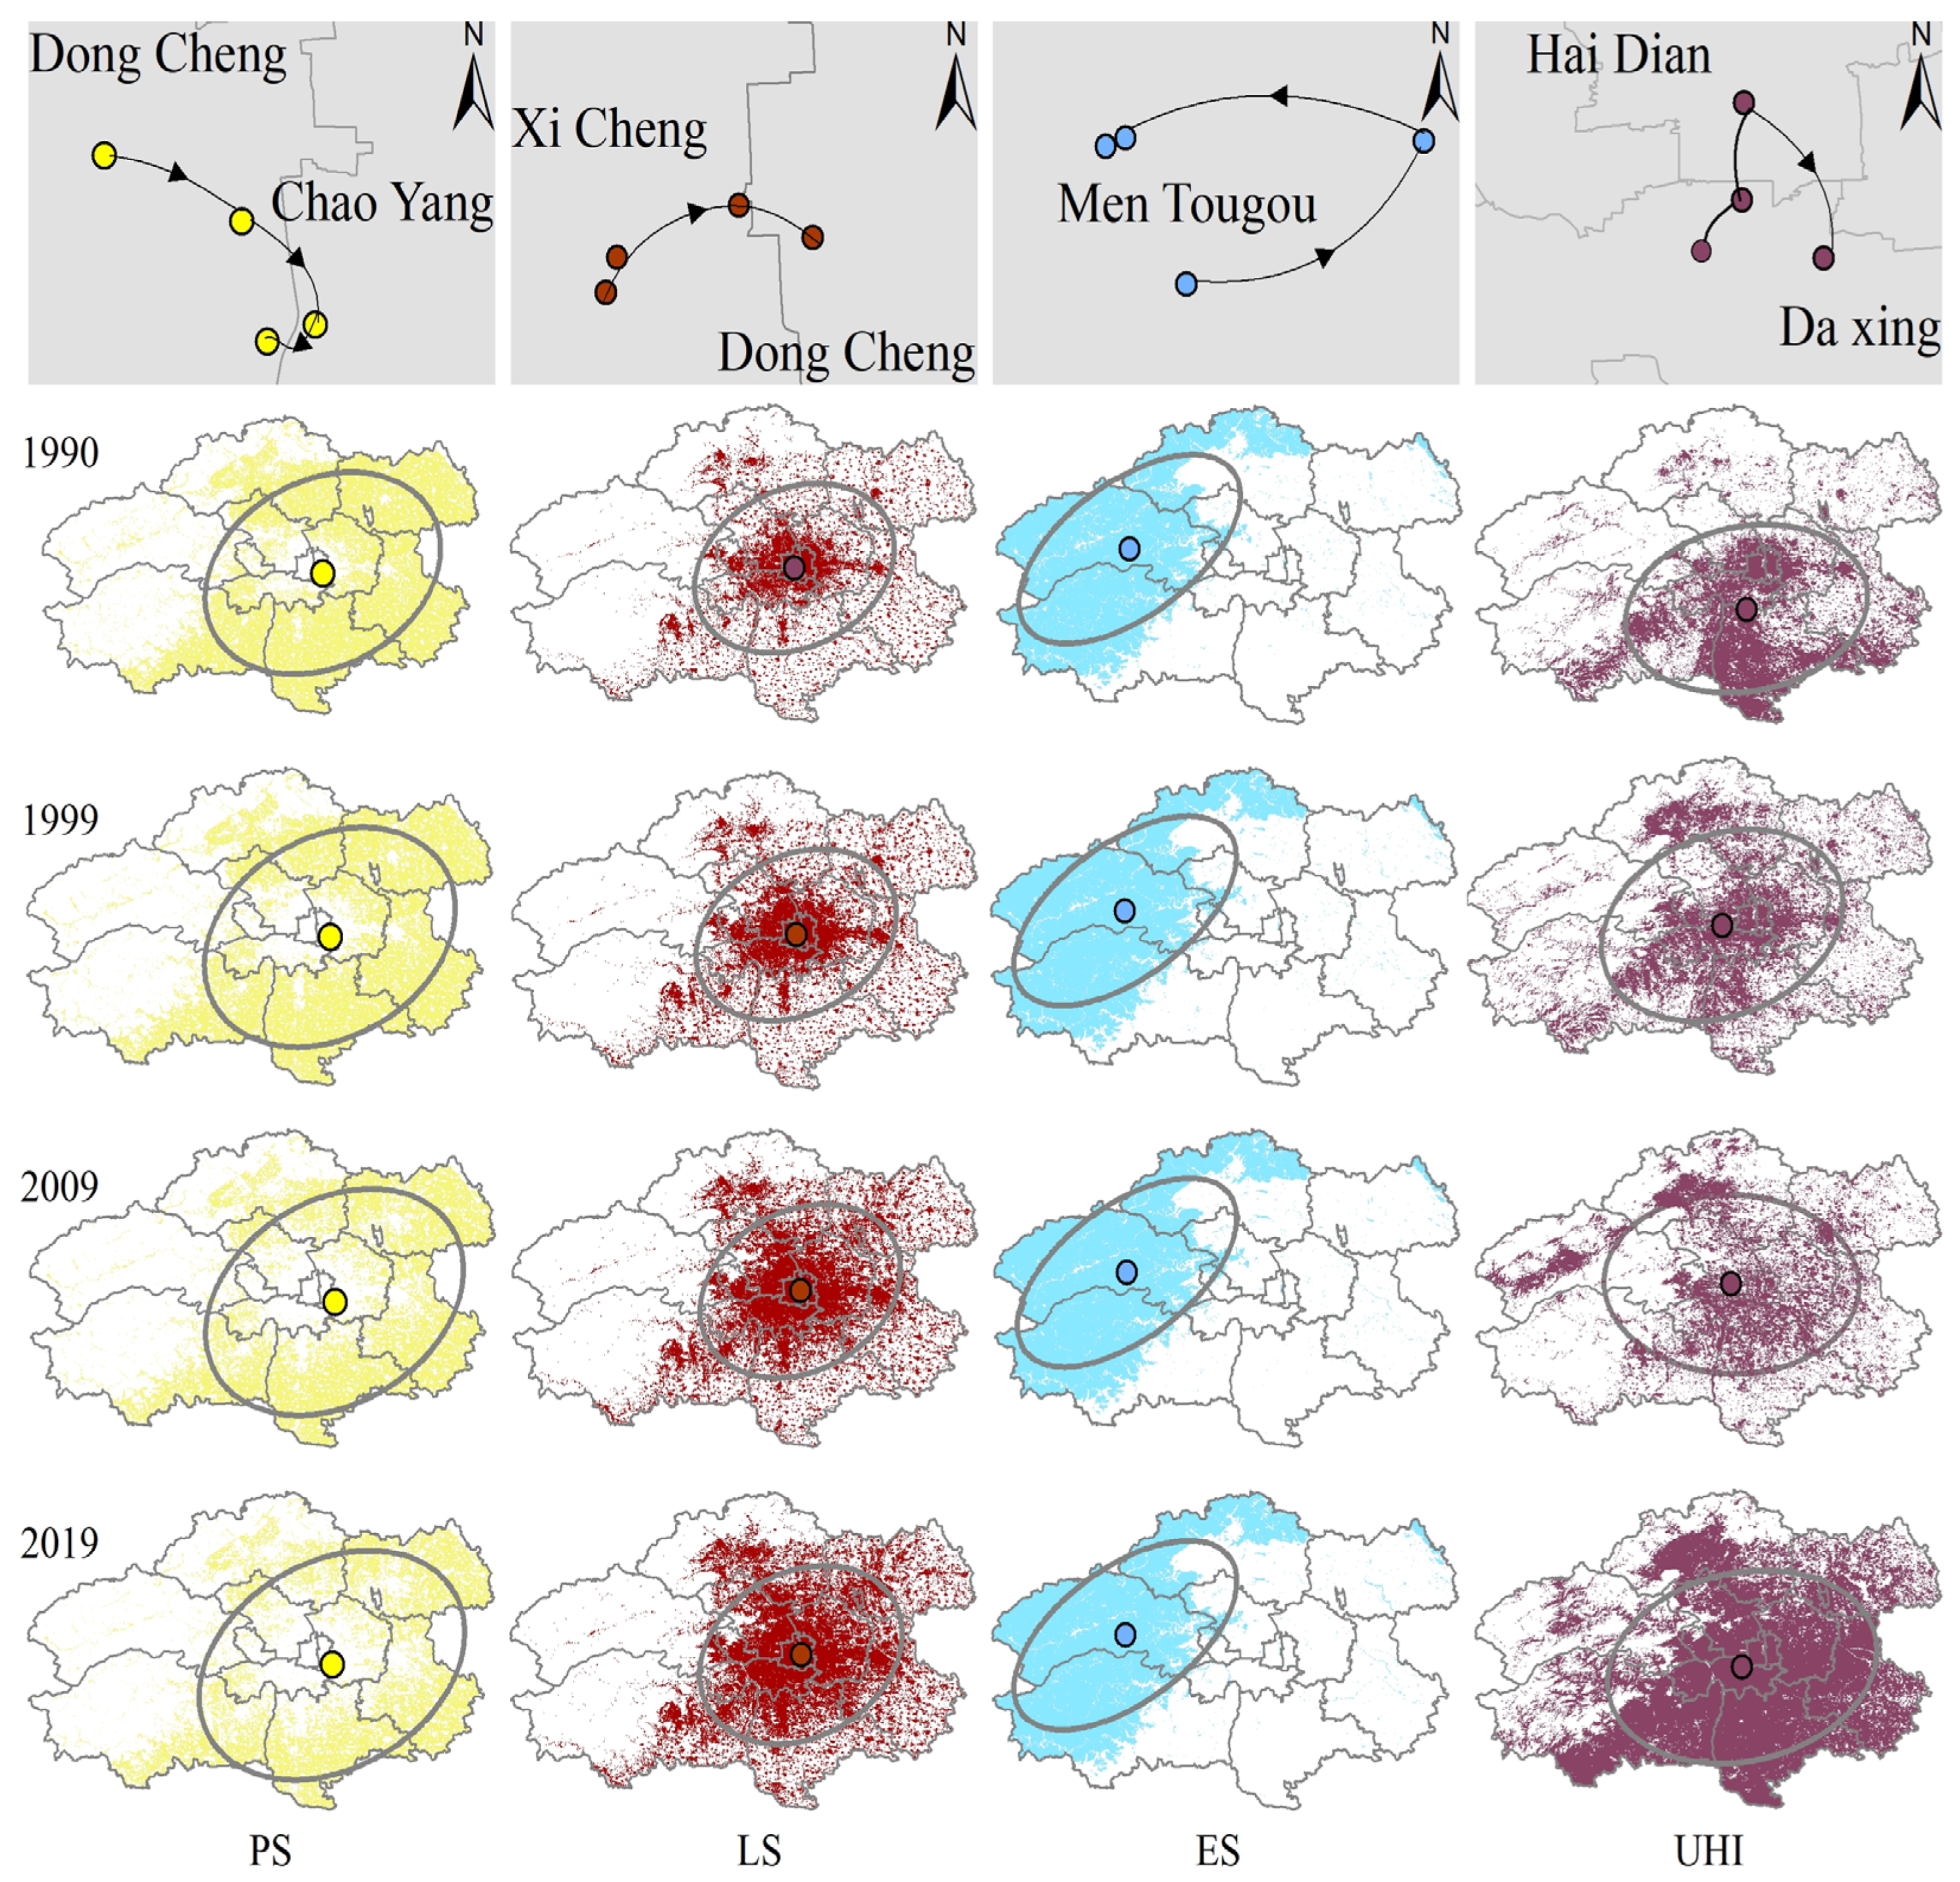
As indicated by Figure 9, the migration paths of the center of gravity of ecological space, production space, and living space differ. The migration direction of the heat island’s center of gravity and the migration direction of the center of gravity of living and production space have a similar tendency, but they are located in different areas. The center of gravity of production space mainly migrates within Dongcheng District, while the center of gravity of living space is mainly distributed between Dongcheng District and Xicheng District in the city center. The center of gravity of ecological space is located in the western Mentougou District, and the center of gravity of the heat island is concentrated in Daxing District and Haidian District.
The spatial distribution envelopes (SDEs) of the PLES vary significantly. The SDE of ecological space is the widest, with a long axis direction in the southwest–northeast direction throughout the year and a clear distribution trend. The SDE of living space has the smallest distribution range, concentrated slightly east of the center. The SDE of production space has the largest distribution range, covering the central, eastern, and southern areas. The SDE of the heat island changes significantly in each study period. From 1990 to 1999, the heat island SDE gradually shifted northwestward due to ecological deterioration in the northwest of Beijing. In 2009, the heat island SDE was in the northwest–southeast direction, and in 2019, it reached its maximum extent.
3.4. Results of Spatial Autocorrelation Analysis and Correlation Analysis
The PLES autocorrelation in the study area was analyzed using ArcGIS. According to Table 3, The results indicated that both the PLAND and LST of PLES had p-values of zero during the study period, which passed the 95% confidence test. The Z-values of PLAND in each space were high, indicating strong spatial autocorrelation. Additionally, the Moran’s I values for each year were greater than 0, and the LST Moran’s I values were higher than PLAND, indicating a noticeable spatial positive correlation of surface temperature.
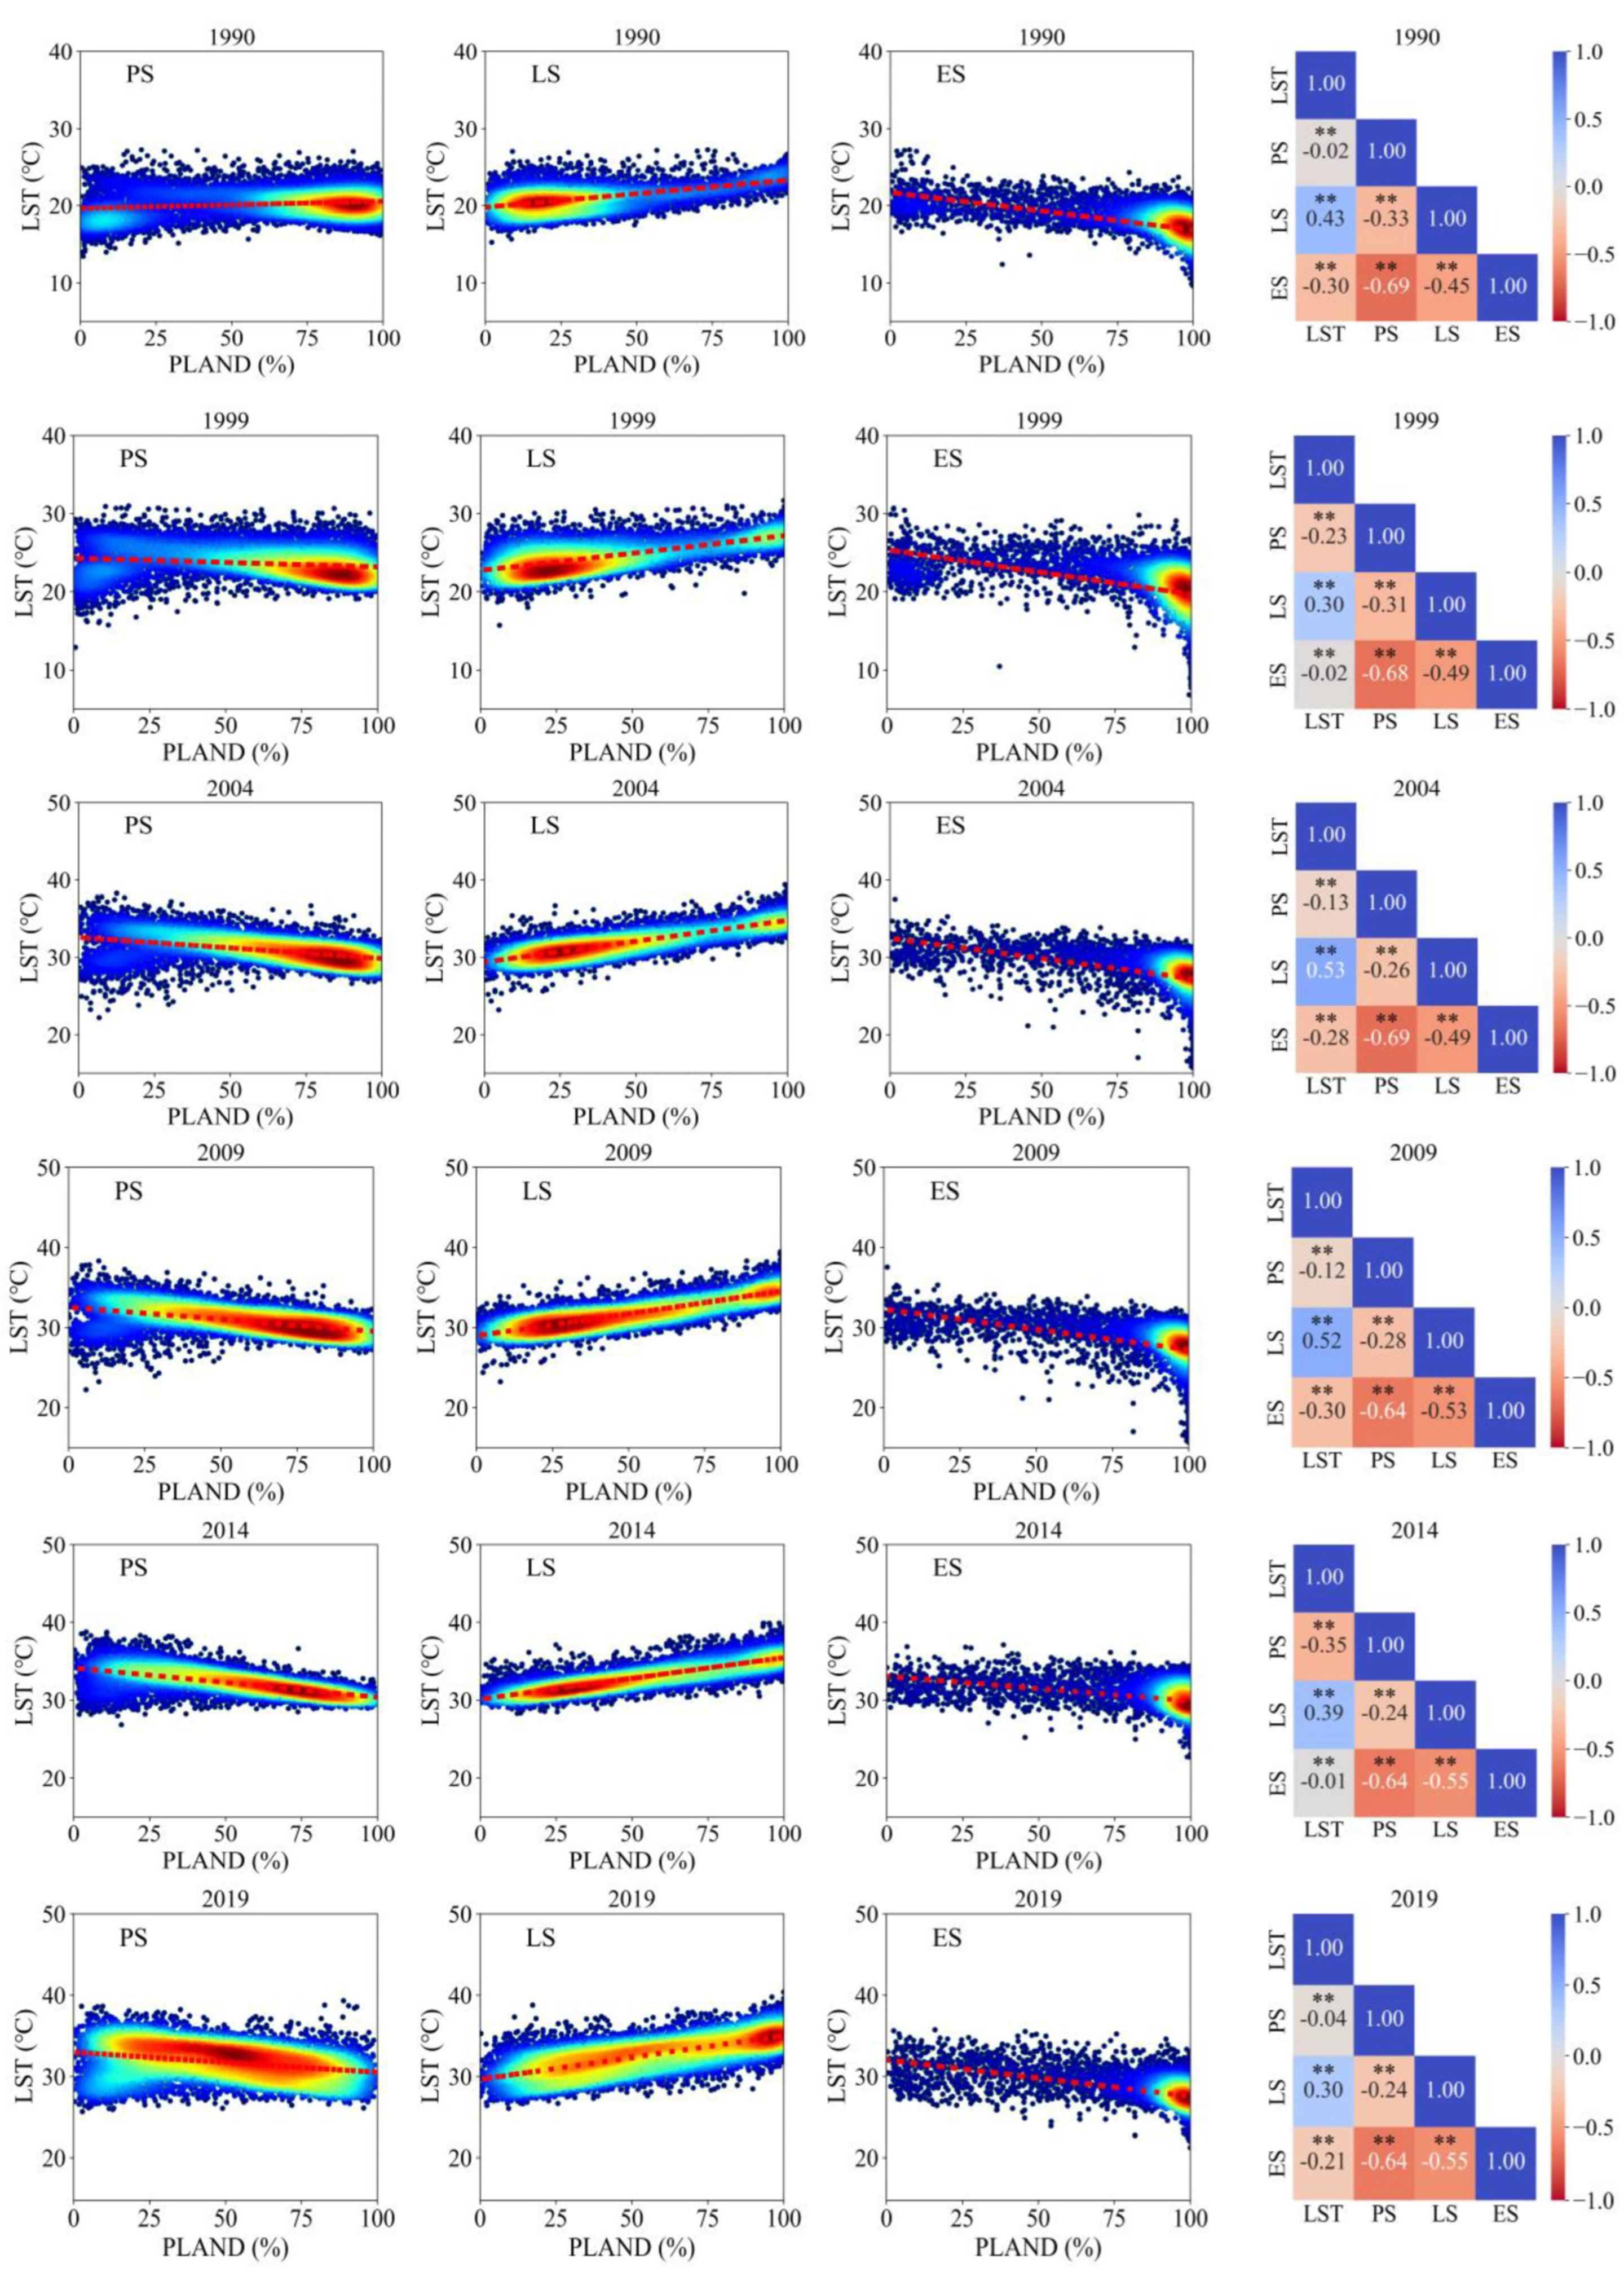
The trend analysis of PLES and LST in the study area, conducted through scatter plots of nuclear density and Spearman’s rank correlation coefficient (Figure 10), showed that there was an obvious increasing trend of LST with the increase in PLAND value in production space. There was a significant positive correlation between the two, with the most significant increasing trend observed in 2004, where Spearman’s rank correlation coefficient reached a maximum value of 0.53. On the other hand, LST had a negative correlation with PLAND in both ecological space and living space. To understand the influence mechanism of LST without interference from correlations among the three factors (production space, ecological space, and living space), partial correlation coefficients between LST and the three factors were calculated using Spearman’s rho. The results showed that, given the other variables, there was still a strong negative correlation between the PLAND of living space and LST (PRS ≥ 0.49), indicating that production space had the most prominent influence on surface temperature in PLES. When considering the other two variables, the absolute value of the bias correlation coefficient between the PLAND of ecological space and LST was significantly lower, indicating its limited influence on surface temperature. The value of the partial correlation coefficient between the PLAND of production space and LST was unstable, with a coefficient of 0.12 in 1990, which was negative, and positive in the remaining years.
3.5. LST Profile Analysis
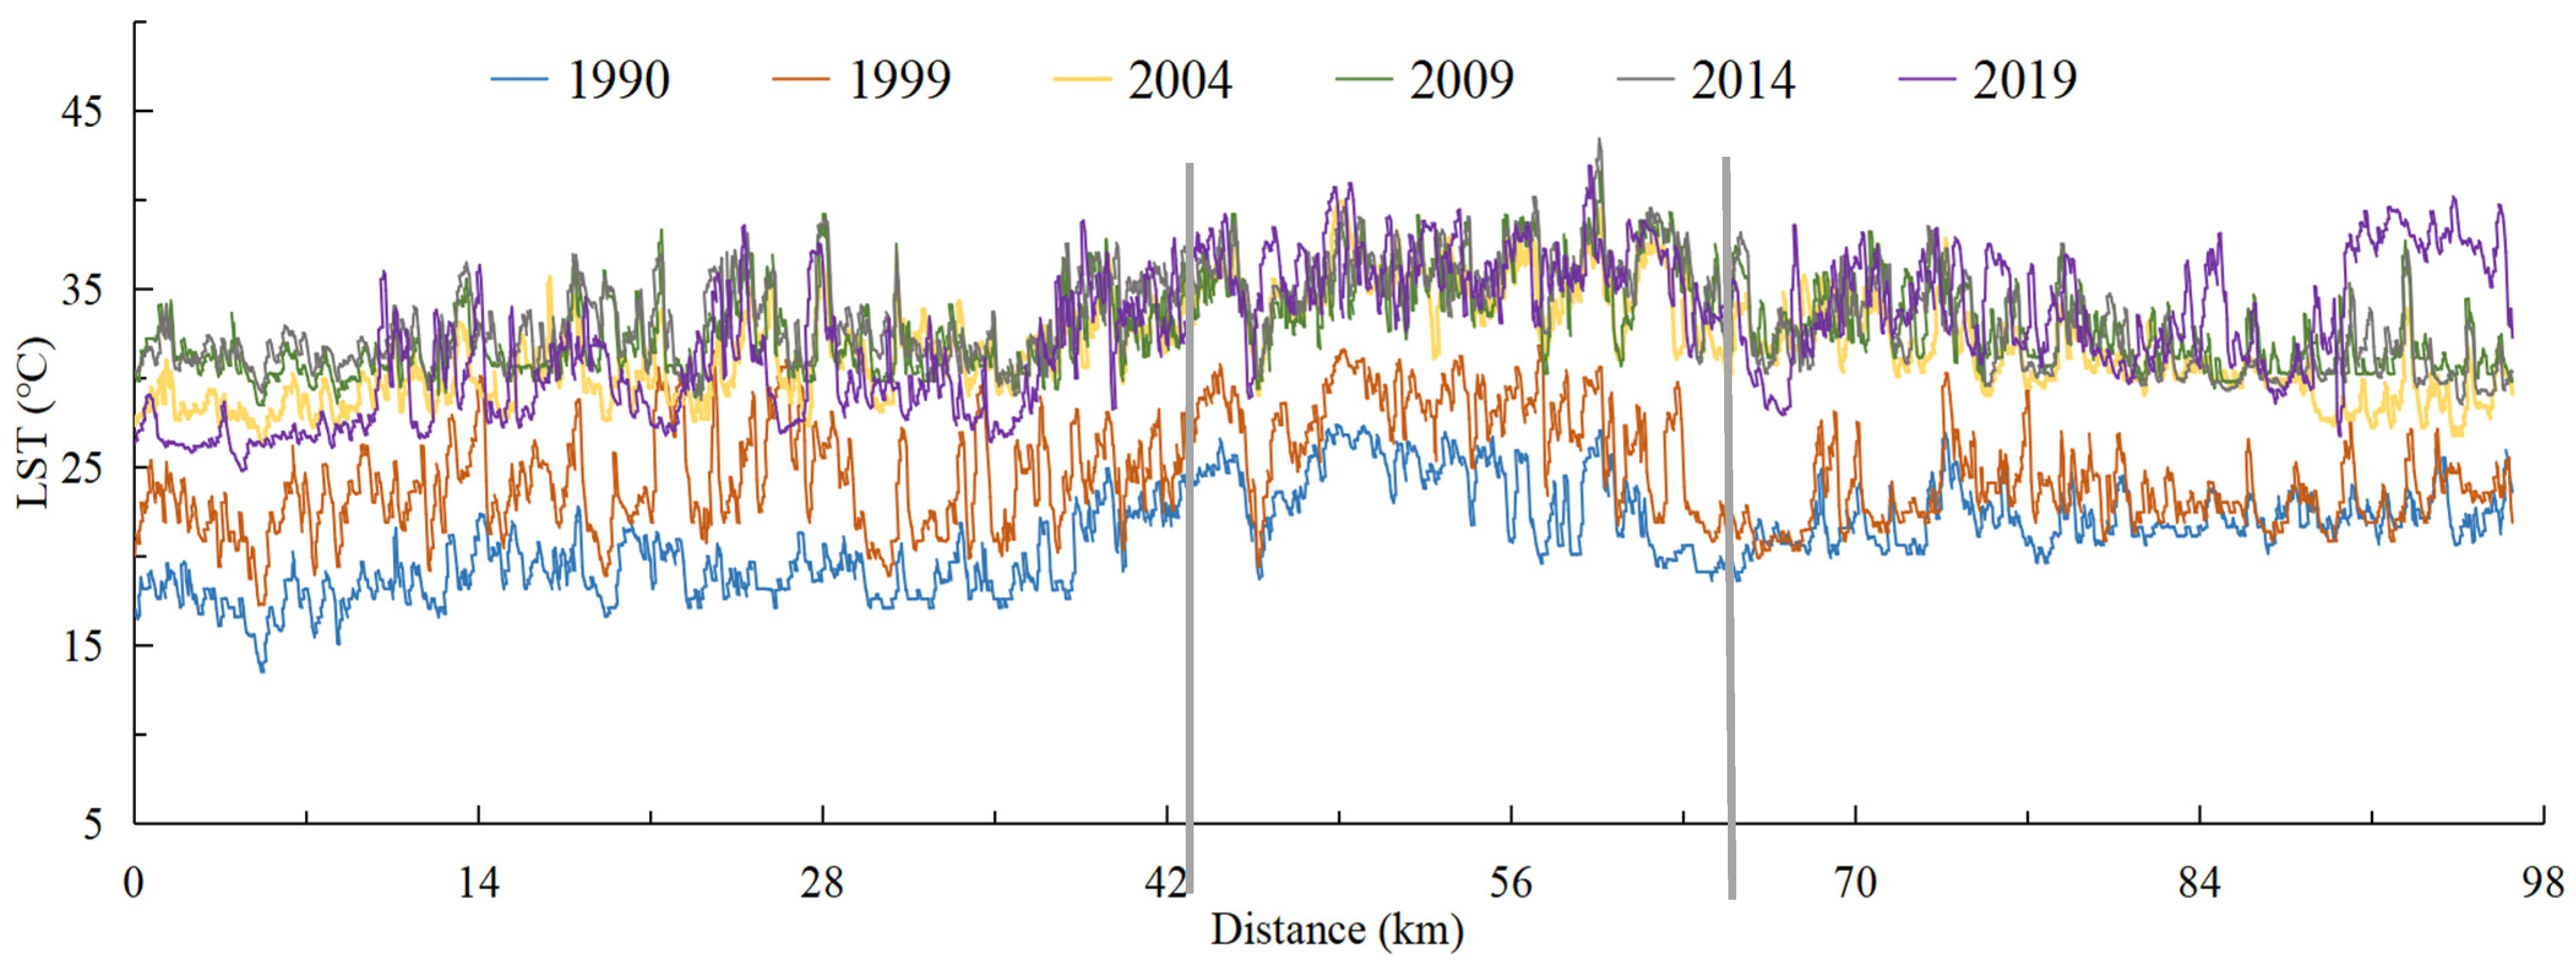
The analysis of the north–south thermal profile lines reveals the overall trend and spatial characteristics of the heat island in the study area (Figure 11). Firstly, the six profile lines representing different years show a general trend of “the middle is high, the two ends are low.” This is influenced by the different types of subsurface in the study area, resulting in staggered fluctuations in land surface temperature (LST) peaks and valleys, reflecting changes in land use types. Secondly, there is a significant warming trend from 1990 to 2004, followed by a slowdown in temperature fluctuation from 2004 to 2019. Lastly, the north–south profile is divided into three sections: 0–40 km, 40–64 km, and 64–98 km. In the 0–40 km section, the underlying surface transitions from suburban areas to urban areas, with alternating hot and cold islands. The cold island areas consist of ecological spaces such as forest parks and the Wenyu River, as well as production spaces like arable land. The hot island areas mainly include urban construction land. The differences in the underlying surface lead to noticeable fluctuations in the temperature curve. In the 40–64 km section, located within the fourth ring of Beijing, there is a high population density and well-developed infrastructure, resulting in high LST. However, there is a sharp decrease in LST at 46 km, influenced by the superior ecological environment of Jingshan Park. The 64–98 km section, mainly located in Daxing District, consists of urban construction land interspersed with arable land. Since 2009, there has been a gradual increase in temperature fluctuations, reflecting the influence of different land space subsurfaces. In 2019, there was a sharp increase in LST between 90 and 98 km, primarily due to the completion and operation of Daxing Airport and the conversion of the underlying surface to built-up land.
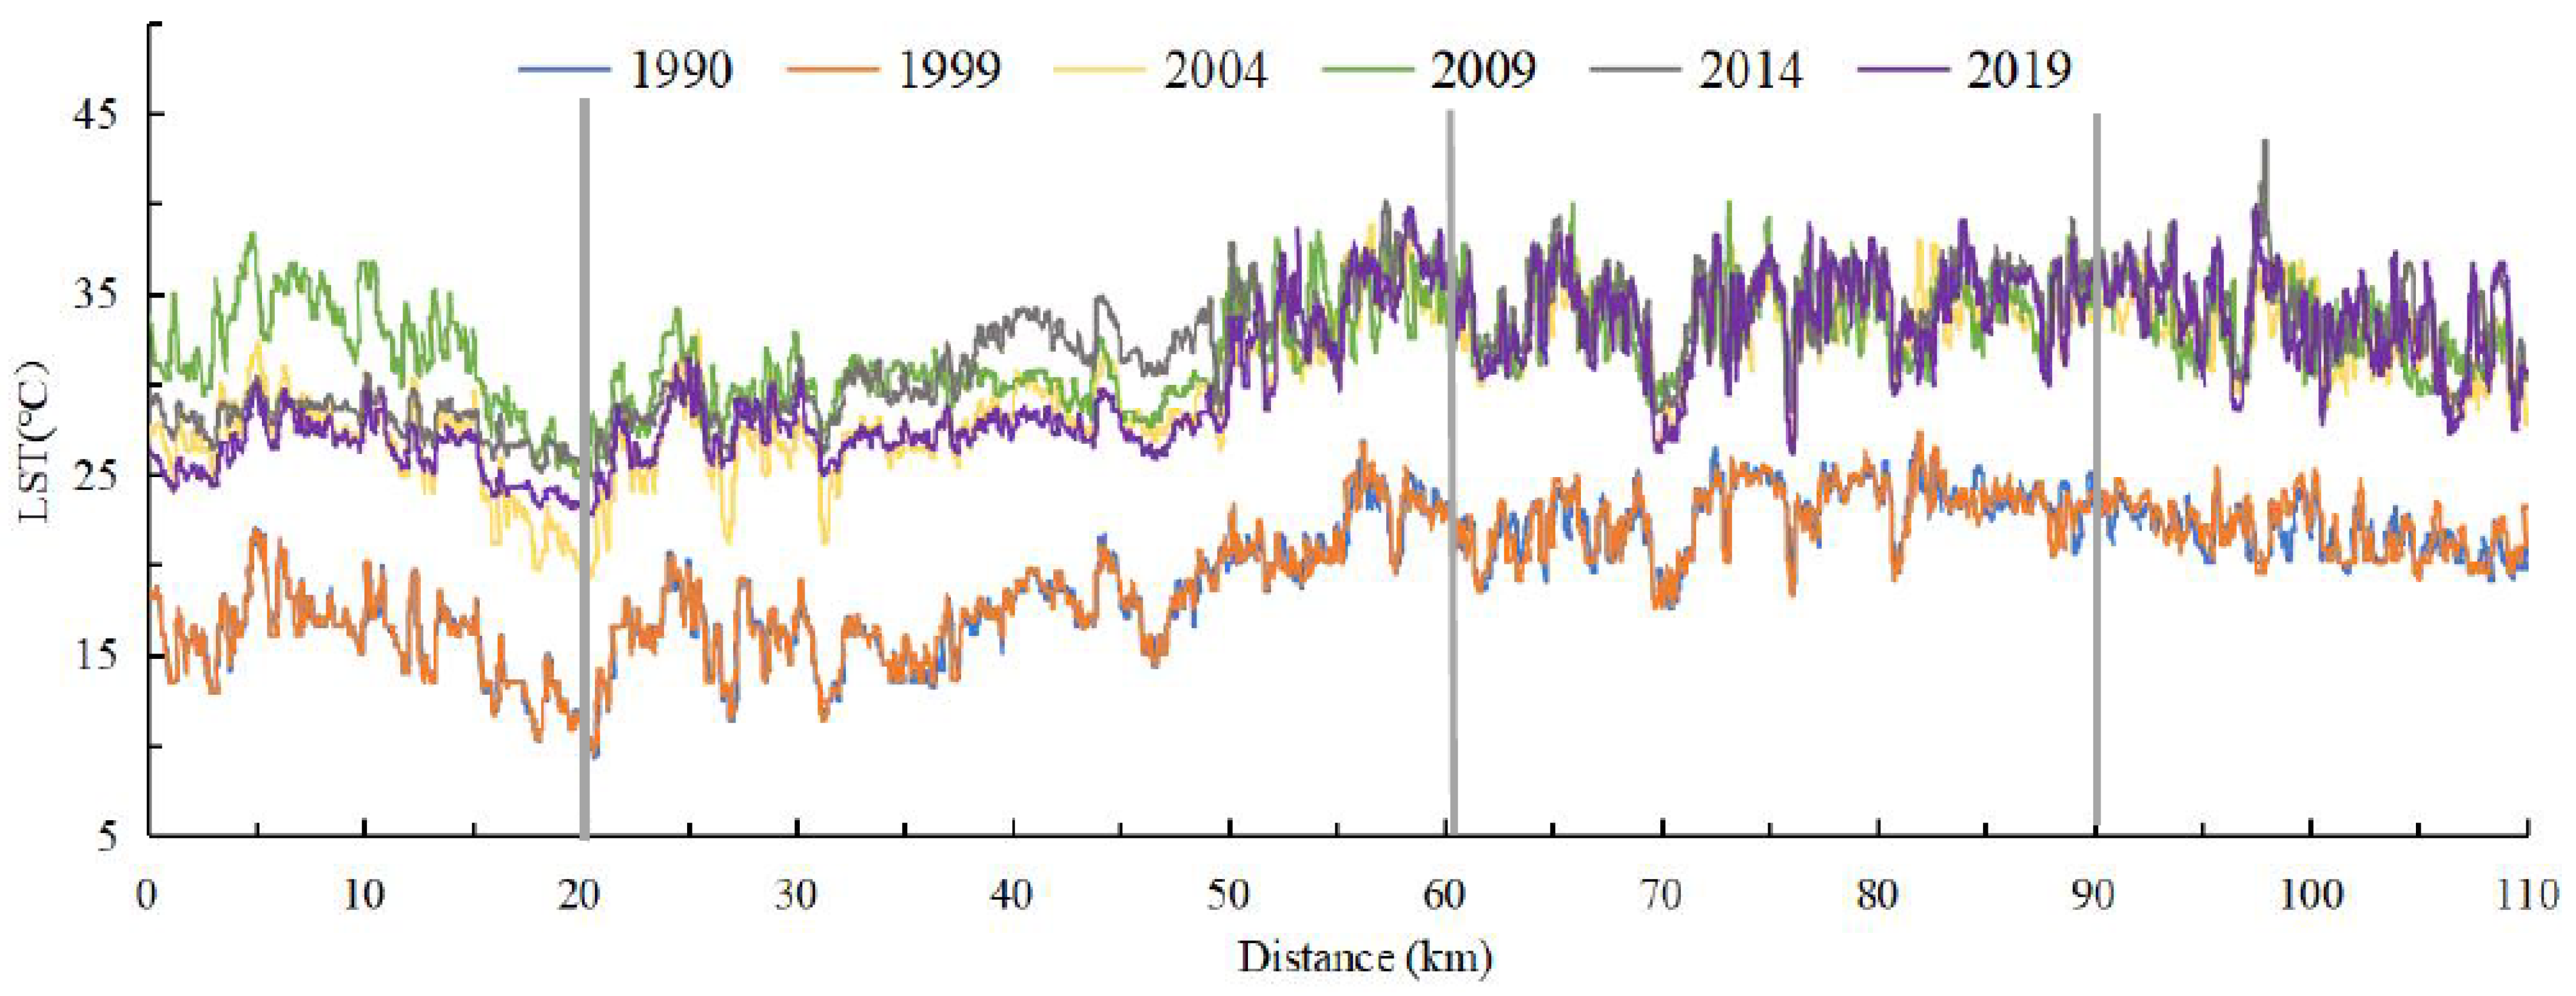
The profile line in the 0–20 km section is positioned in the Mentougou area of Beijing. During the period from 1999 to 2009, the profile line experienced significant warming attributed to human activities such as mining. However, after 2009, the temperature of the thermal profile line showed a year-by-year decreasing trend due to ecological restoration efforts. At the 20 km mark, the thermal profile crosses the Xishan Mountain Range in the southwest–northeast direction. This crossing reveals a notable temperature difference between the mountain range and its surrounding areas. The 20–60 km section represents an urban–rural transition area, where the land surface temperature (LST) exhibits a clear upward trend. The 60–90 km section falls within the fifth ring of Beijing and displays a distinct trough in temperature due to the influence of the substratum type in this area. At 62 km, the LST forms a valley, and at 62 km, the Laoshan Urban Recreation Park is located. Yuyuantan, Beihai Park, and Ritan Park are positioned at 70 km, 76 km, and 82 km, respectively. These locations feature large bodies of water, particularly Yuyuantan Park and Beihai Park, which contribute to the prominence of the cold island effect. This effect is particularly noticeable in 2019. The 90–110 km section corresponds to Tongzhou District. Since Tongzhou became part of Beijing in 1997, urban development has significantly accelerated, leading to a more pronounced heat island effect in this area.
3.6. Hot Spot Identification and Analysis
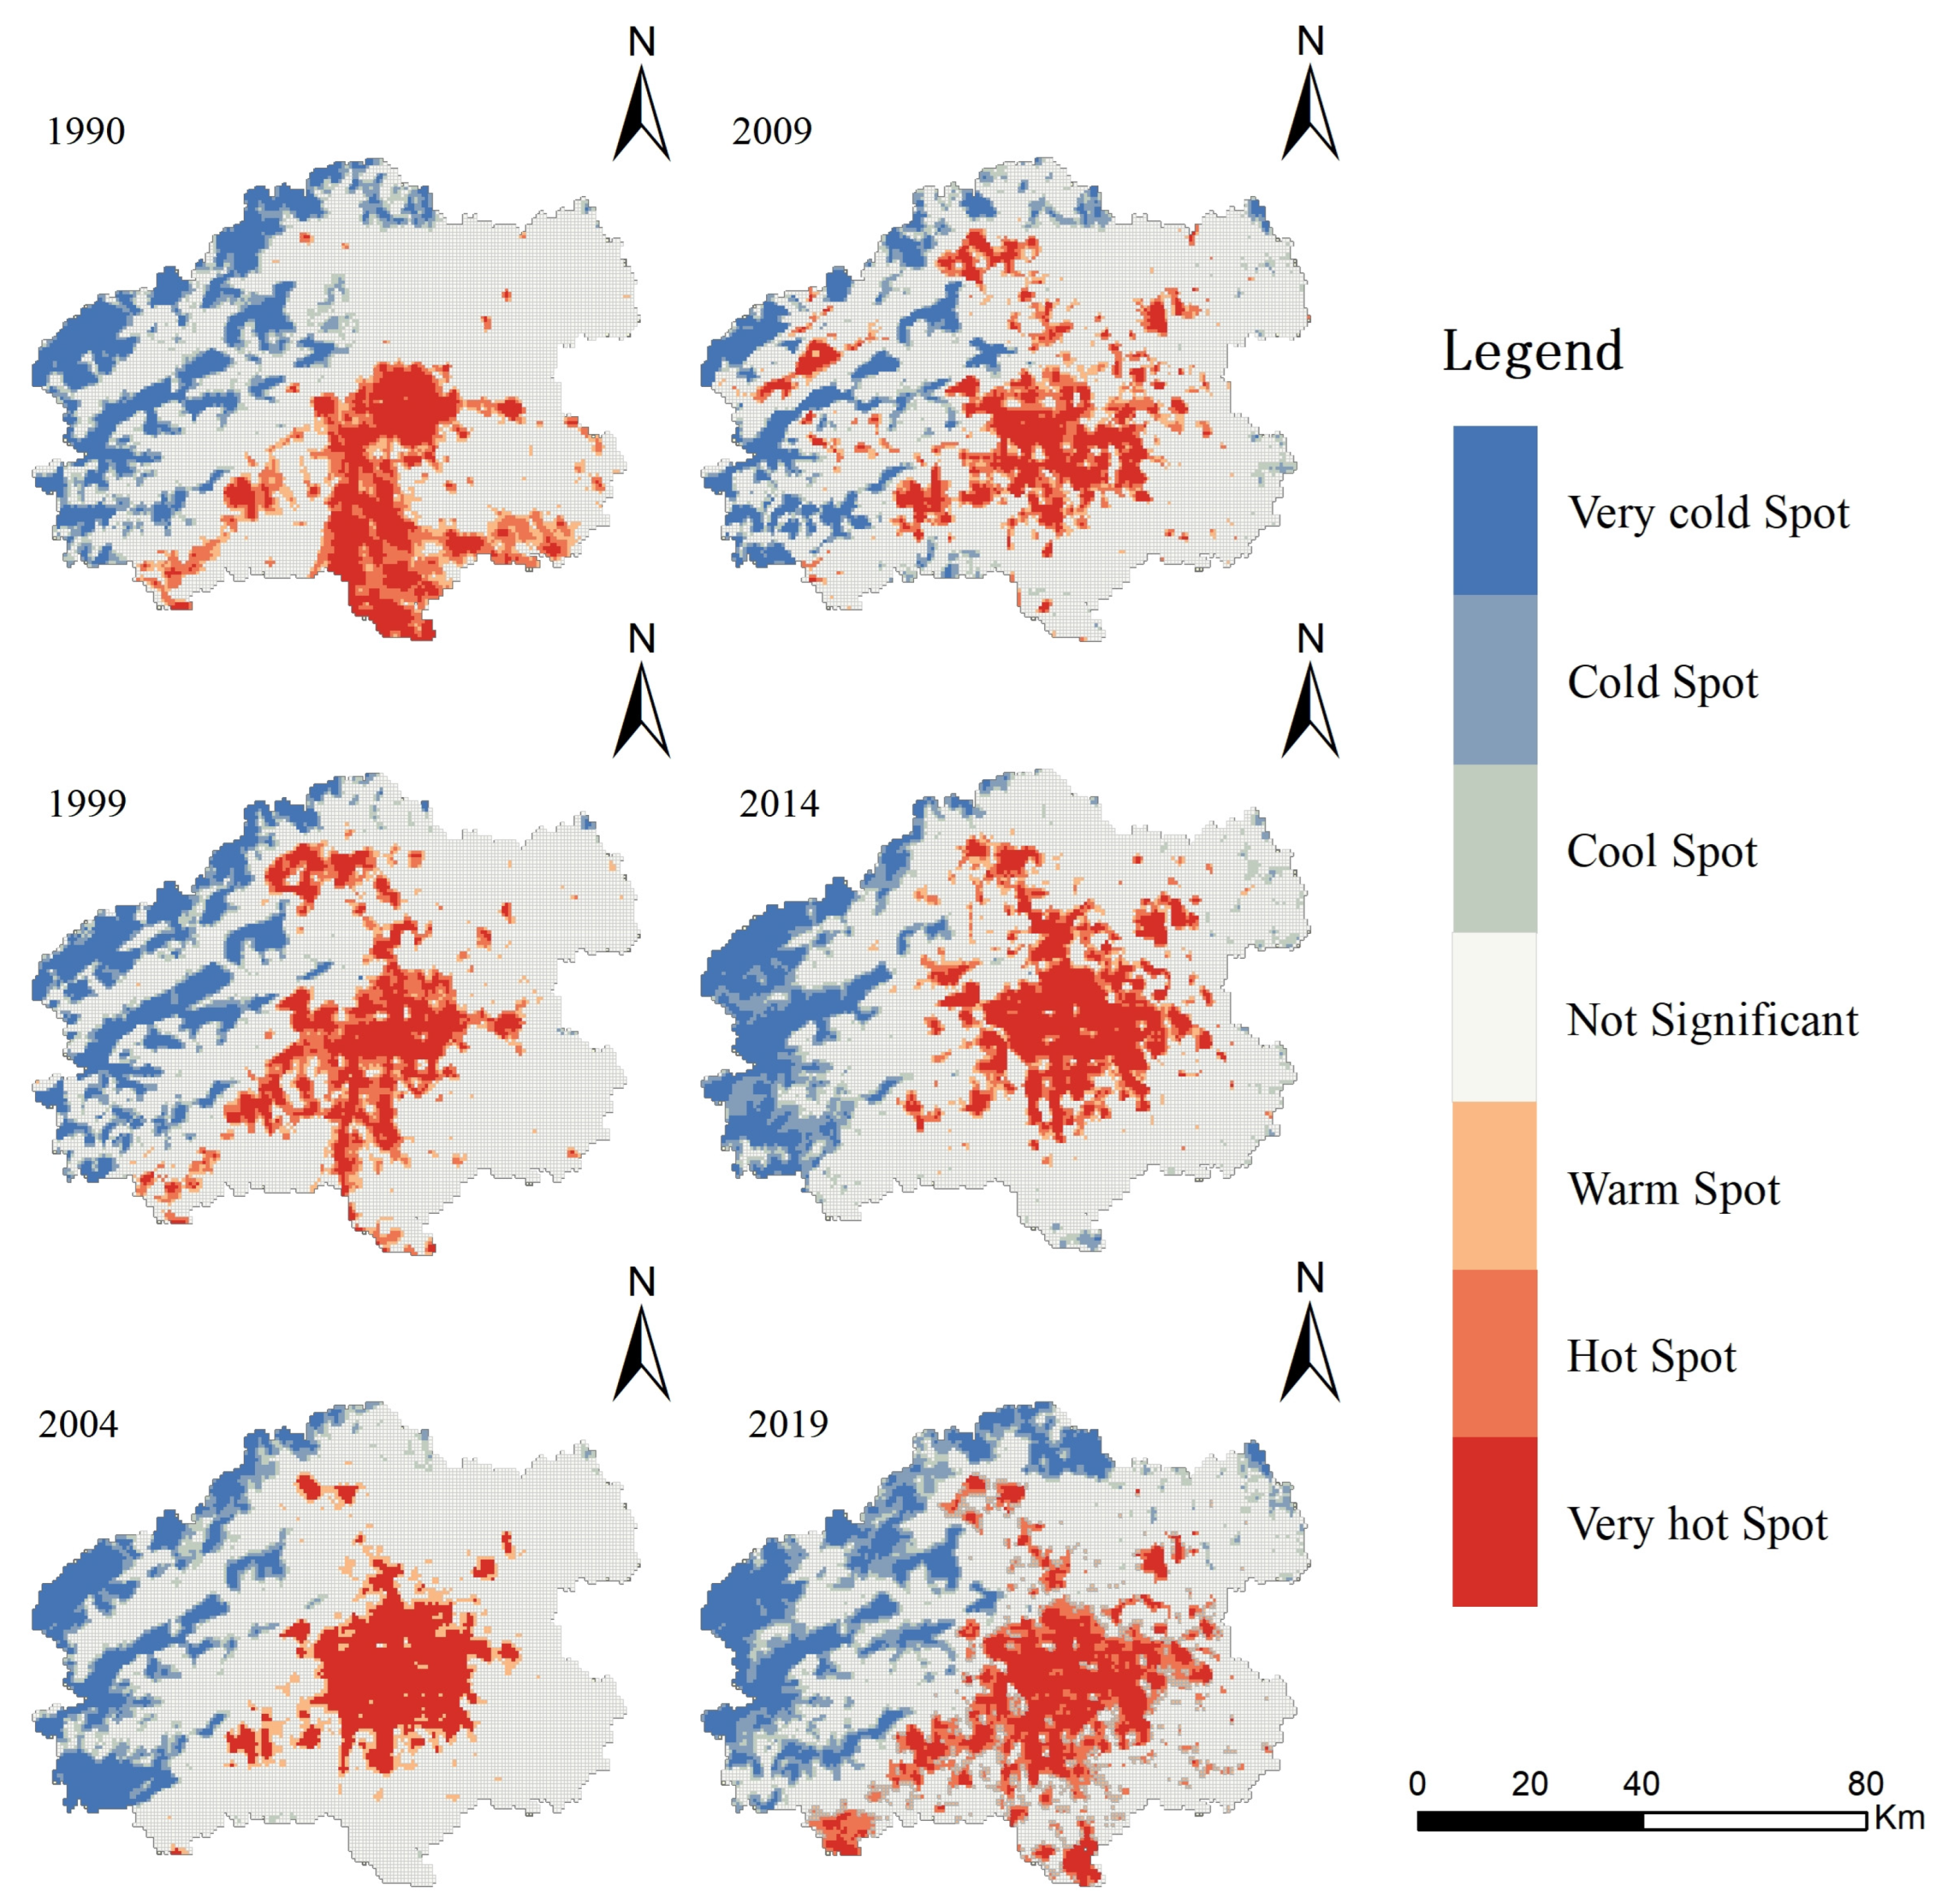
The study employed the Getis–Ord Gi* method for hot spot analysis, which is based on the surface temperature values of neighboring features. The study area was divided into seven regions, including very cold spots, cold spots, cool spots, not significant areas, warm spots, hot spots, and very hot spots. Very cold spots represent extremely clustered areas with significantly low values compared to the surrounding regions. Cold spots indicate clustered areas with significantly low values compared to the surrounding regions. Cool spots represent clustered areas with relatively low values, but the level of significance is not as strong. Not significant areas indicate no significant clustering pattern or hot spot regions. These regions have similar feature values to the surrounding areas and lack obvious clustering characteristics. Warm spots represent clustered areas with relatively high values, but the level of significance is not as strong. Hot spots represent clustered areas with significantly high values compared to the surrounding regions. Very hot spots represent extremely clustered areas with significantly high values compared to the surrounding regions (Figure 12).
From Figure 13, the following observations can be made: very cold spots, cold spots, and cool spots are mainly distributed in the ecologically dense vegetation spaces in the northwest region, while very hot spots, hot spots, and warm spots are mainly concentrated in the residential spaces in the city center and surrounding bare land areas, and the not significant areas are mainly located in the production spaces. Over the past 30 years, the areas of very cold spots, cold spots, and cool spots have experienced a trend of decrease followed by increase. This trend is closely related to ecological development measures such as mine reclamation and vegetation restoration. Specifically, from 1990 to 2019, the area of very cold spots increased by 0.12% due to changes in underlying surface types and the expansion of living spaces; the area of cold spots increased by 3.09%, and the area of cool spots increased by 0.76% (Table 4).
Urban expansion and human activities have led to an increase in bare land, especially in the city center and surrounding areas. Bare land lacks vegetation cover and is prone to absorb and store more heat, resulting in hot spot and warm spot areas. In addition, the heat island effect of bare land may also contribute to the increase in very hot spot areas. During the study period, the area of warm spots increased by 0.72%, the area of hot spots increased by 1.13%, and the area of very hot spots increased the most, totaling 2.03%. These areas are mainly distributed in the residential areas in the city center and its surroundings, and the increase in urban population and the urbanization process has led to the expansion of residential spaces. These areas often exhibit higher surface temperatures due to high-density buildings, limited green spaces, and relatively less vegetation cover. Furthermore, the area of not significant regions in the production spaces decreased the most, reaching 7.83%. Due to the relatively stable land use types in the production spaces, they are less affected by changes in underlying surface types and the expansion of living spaces. Production spaces may include industrial areas, agricultural areas, or other production activity areas, and these areas have relatively stable surface temperatures without obvious hot spots or cold spots.
4. Discussions
The land space is the place and environment where humans live. The interaction between humans and the natural environment in the land space changes the function of the regional land space through changes in land use types and shaping the PLES is an effective means of ecological civilization construction and spatial planning [31,32]. It classifies land space based on different land use functions to optimize development patterns, control development intensity, and adjust the spatial structure of the land space [33]. Compared with traditional land use classification, this article combines land use spatial data based on the principle of functional dominance, which addresses the insufficient consideration of functional space in land use classification and achieves coupling between land function and land use classification. Therefore, this method can be widely applied in determining the ecological environment effects and other related areas [34]. In the process of rapid urbanization and industrialization, the transformation of land use in Beijing has caused frequent changes in the layout of PLES and the quantity of land use, which has affected the significant changes in land use quantity and spatial structure, and further affected the ecological environment of the region, especially the thermal ecological environment, resulting in a serious UHI phenomenon. The results of this study indicate that the expansion of construction land during the accelerated economic development in a certain region inevitably leads to the urban heat island effect. Ecological spaces such as green areas and water bodies have a cooling effect in cities, known as the cool island effect. The study found that the intensity of the cool island effect increases with the increase in the proportion of ecological space area, like previous research findings [15,23,35,36]. However, this study goes beyond the previous research focus on a single land cover type in relation to the heat island problem and instead explores the long-term spatial pattern evolution of the three ecological spaces in Beijing and its impact on the dynamic distribution of surface heat environment from the perspective of land function. This provides a basis for us to deepen our understanding of the relationship between land function changes and the surface heat environment and helps to explore sustainable urban planning and ecological conservation strategies. By considering the changes in different land function types comprehensively, we can better achieve the coordinated development of ecology, economy, and society, which is of great reference significance for the sustainable development of other rapidly developing cities.
In current urban heat island studies, commonly used spatial units include pixels, statistical areas, or geographical areas. However, using pixels as spatial units may lead to the loss of UHI details and sensitivity to noise and local variations, while larger statistical areas may result in the smoothing of UHI and the loss of spatial non-uniformity. This study chose the grid method to explore the relationship between PLES and UHI, which can to some extent balance the loss of details and spatial non-uniformity [37]. In addition, this study used Moran’s I index and hot spot analysis to comprehensively consider the spatial clustering and spatial correlation of the surface heat environment. The use of these two methods can more comprehensively reveal the spatial autocorrelation and spatial characteristics of the surface heat environment. Based on the research findings, we have proposed the following recommendations. Firstly, based on the significant ecological cold island effect of ecological space, the ecological space layout can be planned to use the “point-line-surface” greening mode, especially in the heat island areas. This can be achieved by implementing green space patches, vertical greening, and water bodies to improve land use intensity. Then, the transformation of urban land use types will lead to noticeable changes in LST. For example, when industrial land is converted into residential land, the regional thermal environment will change from a low LST area to a high LST area. Therefore, measures such as limiting the blind expansion of residential space, the rational layout of production space, and increasing the area of ecological space can help mitigate the adverse impacts of the thermal environment and coordinate the relationships among the three living spaces. Lastly, to minimize the thermal environmental impacts brought about by the transformation of the three spatial regions and promote ecological environment protection and sustainable urban development in Beijing, urban planners and decision-makers can prioritize the cold and hot spot areas outlined in this study and propose targeted measures while strictly supervising their implementation. This research aims to promote ecological protection and sustainable urban development in Beijing.
This study provides valuable information on the impacts of land use change based on the PLES on UHIs. However, there are limitations in understanding and describing the temperature changes at small scales within the city due to the multiple functions of some land uses in the PLES and the low spatiotemporal resolution of Landsat satellite data used for surface temperature retrieval [6,38]. Further research is needed to address these limitations. Firstly, this study only considers three types of spaces: production, living, and ecological spaces. It is necessary to incorporate the functional characteristics of different land use types and explore the contribution rates of composite spaces. For example, farmland serves as a production space but also has ecological functions during crop growth. In future research, it is important to further classify and explore how to convert the contributions of different functional spaces. Secondly, this study does not account for the additional effects of rapid population growth in certain areas of Beijing on the UHI effect. It is necessary to conduct more complex scenario simulations to better understand these combined effects in future research. Thirdly, the selected Landsat satellite series revisits every 16 days, allowing for a maximum of two remote sensing images per month. The selected months are mainly August and September, which are during the peak summer season in Beijing when cloudy weather is common. The presence of cloud cover negatively affects the accuracy and reliability of land surface temperature (LST) retrieval results. This limitation restricts the number of available images for LST inversion, preventing the continuous acquisition of temperature change information. Additionally, the spatial resolution of the thermal infrared band (TIR) used for LST retrieval is 120 m for Landsat 5 and 100 m for Landsat 8, which is relatively low in terms of spatial and temporal resolution and cannot provide detailed information on land surface temperature distribution [39]. To overcome these limitations, future research will utilize high spatiotemporal resolution sensor data from platforms such as Sentinel-2 to obtain comprehensive and detailed land surface temperature distribution [40,41,42]. Cloud detection and restoration algorithms will be employed to reduce the impact of cloud cover on images and improve the quality and usability of remote sensing data. By combining ground observation data and model simulation methods, the accuracy and spatiotemporal resolution of land surface temperature inversion will be further improved to accurately capture temperature changes at small scales within the city and comprehensively understand the impact of land use on the distribution of urban thermal environment patterns.
5. Conclusions
This study examines the spatial distribution characteristics and evolution patterns of land use and urban heat islands in Beijing over the past 30 years, using six summer remote sensing images from 1990, 1999, 2004, 2009, 2014, and 2019. Various software such as ArcGIS 10.8, FRAGSTATS 4.2, and Python were used for analysis. The study also quantitatively analyzed the spatial evolution of production, living, and ecological spaces in relation to surface temperature. The main findings are as follows:
(1). Regarding the composition and distribution of production, living, and ecological spaces (PLES), living space has the largest proportion, while ecological space has the smallest. Ecological space is concentrated in the northwest mountainous area while living and production spaces are concentrated in the southeast plain area. Over the past 30 years, living space has gradually expanded due to urbanization and economic development, leading to the conversion of production and ecological spaces into living space, especially in the southeast region. There is also evidence of spatial transformation between living and ecological spaces in the northwest region.
(2). The distribution of urban heat islands in the study area has shown significant changes that are generally consistent with the direction and characteristics of regional development. The surface temperature of PLES in Beijing reached a turning point in 2009. Before 2009, the surface temperature continued to rise, which can be attributed to the urbanization process and urban planning during that period. The large-scale construction and human activities during urbanization resulted in increased heat release, leading to an increase in surface temperature. However, after 2009, the implementation of control measures or planning policies gradually led to a decrease in surface temperature. Furthermore, correlation analysis shows that surface temperature is positively correlated with living space and negatively correlated with ecological space. This implies that as living space expands and human activities increase, surface temperature also increases. On the other hand, the increase in ecological space is associated with factors such as vegetation coverage and green areas, which can provide a certain cooling effect and negatively affect surface temperature.
(3). The impact mechanism of PLES structural changes on the surface thermal environment was analyzed using the Pearson correlation analysis with the landscape index PLAND. The results show that living space has the most significant correlation with surface temperature, with the best fit when R2 is 0.53. The degree of influence of PLES on surface temperature is in the order of living space, production space, and ecological space. In the longitudinal profile, surface temperature exhibits an overall trend of “low at both ends, high in the middle.” Due to the transformation of underlying space types, there is significant interannual fluctuation in surface temperature, indicating that the urban heat island effect exhibits spatial differentiation and temporal dynamics, requiring more refined and targeted management measures. The results of Getis–Ord Gi* statistics show that the coverage of extremely cold and cold spots has decreased during the study period. Hot spot analysis shows that the northwest region of Beijing is characterized by extremely cold, cold, and cool spots, indicating lower surface temperatures compared to other areas. This is attributed to its topographical features, higher vegetation coverage, and less human activity. The northwest region of Beijing has better thermal regulation capacity and provides cooler climatic conditions.
In conclusion, this study provides valuable insights and references for future urban planning and land resource management by analyzing the land use and urban heat island evolution in Beijing from the perspective of PLES. It also highlights the importance of ecological protection and environmental management in mitigating the heat island effect. These research findings are significant for promoting sustainable urban development and improving the urban thermal environment.
Author Contributions
H.L. and L.Q.: Investigation, data curation, writing—original draft preparation, writing—review and editing, funding acquisition; M.X. and G.S.: conceptualization, methodology, supervision, project administration; H.Y. and Y.Y.: software, validation, visualization. All authors have read and agreed to the published version of the manuscript.
Funding
This study was funded by the Social Science Development Research Project of Hebei Province (20200302057).
Data Availability Statement
The data presented in this paper are available on request from the corresponding author.
Acknowledgments
The authors are thankful to the editor and the anonymous reviewers for their valuable comments and suggestions for upgrading the quality of this paper.
Conflicts of Interest
The authors declare no conflict of interest.
References
- Howard, L. The Climate of London: Deduced from Meteorological Observations, Made at Different Places in the Neighbourhood of the Metropolis; William Phillips: London, UK, 1818; Volume 1. [Google Scholar]
- Ye, H.; Li, Z.; Zhang, N.; Leng, X.; Meng, D.; Zheng, J.; Li, Y. Variations in the Effects of Landscape Patterns on the Urban Thermal Environment during Rapid Urbanization (1990–2020) in Megacities. Remote Sens. 2021, 13, 3415. [Google Scholar] [CrossRef]
- Shu, Y.; Zou, K.; Li, G.; Yan, Q.; Zhang, S.; Zhang, W.; Liang, Y.; Xu, W. Evaluation of Urban Thermal Comfort and Its Relationship with Land Use/Land Cover Change: A Case Study of Three Urban Agglomerations, China. Land 2022, 11, 2140. [Google Scholar] [CrossRef]
- Amir Siddique, M.; Boqing, F.; Dongyun, L. Modeling the Impact and Risk Assessment of Urbanization on Urban Heat Island and Thermal Comfort Level of Beijing City, China (2005–2020). Sustainability 2023, 15, 6043. [Google Scholar] [CrossRef]
- Wang, H.; Li, B.; Yi, T.; Wu, J. Heterogeneous Urban Thermal Contribution of Functional Construction Land Zones: A Case Study in Shenzhen, China. Remote Sens. 2022, 14, 1851. [Google Scholar] [CrossRef]
- Yu, X.; Guo, X.; Wu, Z. Land surface temperature retrieval from Landsat 8 TIRS—Comparison between radiative transfer equation-based method, split window algorithm and single channel method. Remote Sens. 2014, 6, 9829–9852. [Google Scholar] [CrossRef] [Green Version]
- Mohan, M.; Kandya, A. Impact of urbanization and land-use/land-cover change on diurnal temperature range: A case study of tropical urban airshed of India using remote sensing data. Sci. Total Environ. 2015, 506, 453–465. [Google Scholar] [CrossRef]
- Karakuş, C.B. The impact of land use/land cover (LULC) changes on land surface temperature in Sivas City Center and its surroundings and assessment of Urban Heat Island. Asia-Pac. J. Atmos. Sci. 2019, 55, 669–684. [Google Scholar] [CrossRef]
- Kachari, R. Swelter in the city: Population distribution, land use change and the urban heat island effect in Shillong, India. In Environmental Change in the Himalayan Region: Twelve Case Studies; Springer: Berlin/Heidelberg, Germany, 2019; pp. 173–187. [Google Scholar]
- Padmanaban, R.; Bhowmik, A.K.; Cabral, P. Satellite image fusion to detect changing surface permeability and emerging urban heat islands in a fast-growing city. PLoS ONE 2019, 14, e0208949. [Google Scholar] [CrossRef]
- Roy, S.; Pandit, S.; Eva, E.A.; Bagmar, M.S.H.; Papia, M.; Banik, L.; Dube, T.; Rahman, F.; Razi, M.A. Examining the nexus between land surface temperature and urban growth in Chattogram Metropolitan Area of Bangladesh using long term Landsat series data. Urban Clim. 2020, 32, 100593. [Google Scholar] [CrossRef]
- Khamchiangta, D.; Dhakal, S. Time series analysis of land use and land cover changes related to urban heat island intensity: Case of Bangkok Metropolitan Area in Thailand. J. Urban Manag. 2020, 9, 383–395. [Google Scholar] [CrossRef]
- Zhao, H.; Tan, J.; Ren, Z.; Wang, Z. Spatiotemporal characteristics of urban surface temperature and its relationship with landscape metrics and vegetation cover in rapid urbanization region. Complexity 2020, 2020, 7892362. [Google Scholar] [CrossRef]
- Gao, M.; Li, Z.; Tan, Z.; Liu, Q.; Shen, H. Simulating the Response of the Surface Urban Heat Environment to Land Use and Land Cover Changes: A Case Study of Wuhan, China. Remote Sens. 2021, 13, 4495. [Google Scholar] [CrossRef]
- Derdouri, A.; Wang, R.; Murayama, Y.; Osaragi, T. Understanding the links between lulc changes and suhi in cities: Insights from two-decadal studies (2001–2020). Remote Sens. 2021, 13, 3654. [Google Scholar] [CrossRef]
- Li, H.; Peng, J.; Yanxu, L.; Yi’na, H. Urbanization impact on landscape patterns in Beijing City, China: A spatial heterogeneity perspective. Ecol. Indic. 2017, 82, 50–60. [Google Scholar] [CrossRef]
- How Jin Aik, D.; Ismail, M.H.; Muharam, F.M. Land use/land cover changes and the relationship with land surface temperature using Landsat and MODIS imageries in Cameron Highlands, Malaysia. Land 2020, 9, 372. [Google Scholar] [CrossRef]
- Faqe Ibrahim, G.R. Urban land use land cover changes and their effect on land surface temperature: Case study using Dohuk City in the Kurdistan Region of Iraq. Climate 2017, 5, 13. [Google Scholar] [CrossRef] [Green Version]
- Tariq, A.; Shu, H. CA-Markov chain analysis of seasonal land surface temperature and land use land cover change using optical multi-temporal satellite data of Faisalabad, Pakistan. Remote Sens. 2020, 12, 3402. [Google Scholar] [CrossRef]
- Mullerova, D.; Williams, M. Satellite monitoring of thermal performance in smart urban designs. Remote Sens. 2019, 11, 2244. [Google Scholar] [CrossRef] [Green Version]
- Song, Z.; Li, R.; Qiu, R.; Liu, S.; Tan, C.; Li, Q.; Ge, W.; Han, X.; Tang, X.; Shi, W. Global land surface temperature influenced by vegetation cover and PM2.5 from 2001 to 2016. Remote Sens. 2018, 10, 2034. [Google Scholar]
- Chen, W.; Hu, C.; Liu, L.; Zhang, J.; Wang, K.; Liu, S. Characteristics of built-up land change in resource-based cities and their impact on land surface temperature—Taking Wu’an as an example. Ecol. Inform. 2022, 68, 101582. [Google Scholar] [CrossRef]
- Qin, L.; Liu, H.; Shang, G.; Yang, H.; Yan, H. Thermal Environment Effects of Built-Up Land Expansion in Shijiazhuang. Land 2022, 11, 968. [Google Scholar] [CrossRef]
- Yang, Y.; Bao, W.; Liu, Y. Coupling coordination analysis of rural production-living-ecological space in the Beijing-Tianjin-Hebei region. Ecol. Indic. 2020, 117, 106512. [Google Scholar] [CrossRef]
- Wu, J.; Zhang, D.; Wang, H.; Li, X. What is the future for production-living-ecological spaces in the Greater Bay Area? A multi-scenario perspective based on DEE. Ecol. Indic. 2021, 131, 108171. [Google Scholar]
- Fu, C.; Tu, X.; Huang, A. Identification and characterization of Production–living–ecological space in a central urban area based on POI data: A case study for Wuhan, China. Sustainability 2021, 13, 7691. [Google Scholar] [CrossRef]
- Yang, Y.; Bao, W.; Li, Y.; Wang, Y.; Chen, Z. Land use transition and its eco-environmental effects in the Beijing–Tianjin–Hebei urban agglomeration: A production–living–ecological perspective. Land 2020, 9, 285. [Google Scholar] [CrossRef]
- Fu, J.; Bu, Z.; Jiang, D.; Lin, G. Identification and Classification of Urban PLES Spatial Functions Based on Multisource Data and Machine Learning. Land 2022, 11, 1824. [Google Scholar] [CrossRef]
- Zou, L.; Liu, Y.; Wang, J.; Yang, Y. An analysis of land use conflict potentials based on ecological-production-living function in the southeast coastal area of China. Ecol. Indic. 2021, 122, 107297. [Google Scholar] [CrossRef]
- Wang, M.; Zhang, Z.; Hu, T.; Wang, G.; He, G.; Zhang, Z.; Li, H.; Wu, Z.; Liu, X. An efficient framework for producing landsat-based land surface temperature data using Google Earth Engine. IEEE J. Sel. Top. Appl. Earth Obs. Remote Sens. 2020, 13, 4689–4701. [Google Scholar] [CrossRef]
- Lin, G.; Jiang, D.; Fu, J.; Zhao, Y. A review on the overall optimization of production–living–ecological space: Theoretical basis and conceptual framework. Land 2022, 11, 345. [Google Scholar] [CrossRef]
- Wu, X.; Ding, J.; Lu, B.; Wan, Y.; Shi, L.; Wen, Q. Eco-Environmental Effects of Changes in Territorial Spatial Pattern and Their Driving Forces in Qinghai, China (1980–2020). Land 2022, 11, 1772. [Google Scholar] [CrossRef]
- Xu, N.; Chen, W.; Pan, S.; Liang, J.; Bian, J. Evolution Characteristics and Formation Mechanism of Production-Living-Ecological Space in China: Perspective of Main Function Zones. Int. J. Environ. Res. Public Health 2022, 19, 9910. [Google Scholar] [CrossRef]
- Tian, F.; Li, M.; Han, X.; Liu, H.; Mo, B. A production–living–ecological space model for land-use optimisation: A case study of the core Tumen River region in China. Ecol. Model. 2020, 437, 109310. [Google Scholar] [CrossRef]
- Lin, J.; Qiu, S.; Tan, X.; Zhuang, Y. Measuring the relationship between morphological spatial pattern of green space and urban heat island using machine learning methods. Build. Environ. 2023, 228, 109910. [Google Scholar] [CrossRef]
- Liou, Y.-A.; Nguyen, K.-A.; Ho, L.-T. Altering urban greenspace patterns and heat stress risk in Hanoi city during Master Plan 2030 implementation. Land Use Policy 2021, 105, 105405. [Google Scholar] [CrossRef]
- Liu, Y.; Wang, Z. Research Progress and Hotspot Analysis of Urban Heat Island Effects Based on Cite Space Analysis. Land 2023, 12, 1154. [Google Scholar] [CrossRef]
- Jiménez-Muñoz, J.-C.; Sobrino, J.A. Split-window coefficients for land surface temperature retrieval from low-resolution thermal infrared sensors. IEEE Geosci. Remote Sens. Lett. 2008, 5, 806–809. [Google Scholar] [CrossRef]
- Mushore, T.; Odindi, J.; Mutanga, O. “Cool” Roofs as a Heat-Mitigation Measure in Urban Heat Islands: A Comparative Analysis Using Sentinel 2 and Landsat Data. Remote Sens. 2022, 14, 4247. [Google Scholar] [CrossRef]
- Abunnasr, Y.; Mhawej, M. Towards a combined Landsat-8 and Sentinel-2 for 10-m land surface temperature products: The Google Earth Engine monthly Ten-ST-GEE system. Environ. Model. Softw. 2022, 155, 105456. [Google Scholar] [CrossRef]
- Onačillová, K.; Gallay, M.; Paluba, D.; Péliová, A.; Tokarčík, O.; Laubertová, D. Combining Landsat 8 and Sentinel-2 Data in Google Earth Engine to Derive Higher Resolution Land Surface Temperature Maps in Urban Environment. Remote Sens. 2022, 14, 4076. [Google Scholar] [CrossRef]
- Nasseri, S.; Farhadi Bansouleh, B.; Azari, A. Estimation of land surface temperature in agricultural lands using Sentinel 2 images: A case study for sunflower fields. Irrig. Drain. 2023, 72, 796–806. [Google Scholar] [CrossRef]
Figure 1.
Location of the study area.

Figure 2.
Land cover classification for 1990, 1999, 2004, 2009, 2014, and 2019 in Beijing.

Figure 3.
Time series production–living–ecological space area statistic diagram.

Figure 4.
Land surface temperature for 1990, 1999, 2004, 2009, 2014, and 2019 in Beijing.

Figure 5.
Framework of PLES change and its effects on LST.

Figure 6.
LULC transfer flow charts from 1990 to 2019 in Beijing.

Figure 7.
Distribution of heat levels for 1990, 1999, 2004, 2009, 2014, and 2019 in Beijing.

Figure 8.
Box plots of land surface temperature for production–living–ecological space in Beijing.

Figure 9.
Spatial dynamic changes in heat islands from 1996 to 2019 in Beijing.

Figure 10.
Regression analysis results of PLAND and LST from 1990 to 2019 in Beijing. ** indicates that the correlation was significant at the level of 0.01 (detection < 0.01).
Figure 10.
Regression analysis results of PLAND and LST from 1990 to 2019 in Beijing. ** indicates that the correlation was significant at the level of 0.01 (detection < 0.01).

Figure 11.
The profile of LST from north to south in Beijing.

Figure 12.
The profile of LST from west to east in Beijing.

Figure 13.
Hot spots based on Getis–Ord Gi* in Beijing.


Table 1.
Remote sense statistic parameters.
| Data | Type | Date of Acquisition | Row/Path |
|---|---|---|---|
| Landsat5 | TM | 18 September 1990–8 October 1990 | 124/32 123/32 |
| Landsat5 | TM | 20 August 1999–21 September 1999 | 124/32 123/32 |
| Landsat5 | TM | 30 August 2004–8 September 2004 | 124/32 123/32 |
| Landsat5 | TM | 22 August 2009–22 September 2009 | 124/32 123/32 |
| Landsat8 | OLI | 26 August 2014–14 September 2014 | 124/32 123/32 |
| Landsat8 | OLI | 10 August 2019–2 September 2019 | 124/32 123/32 |
Table 2.
Land surface temperature grading criteria.
| Classification | LST Level | Grading Standard |
|---|---|---|
| Cold island | Low | |
| Sub-low | ||
| Normal area | Medium | |
| Heat island | Sub-high | |
| High |
Note: denotes the normalized temperature of the grid, indicates the average temperature in the study area for each year, and represents the standard deviation of the LST.
Table 3.
Moran’s I distribution chart between PLAND and LSTs from 1990 to 2019.
| 1990 | 1999 | |||||||
|---|---|---|---|---|---|---|---|---|
| LST | PLAND of PS | PLAND of LS | PLAND of ES | LST | PLAND of PS | PLAND of LS | PLAND of ES | |
| Moran’s I | 0.8869 | 0.8651 | 0.8060 | 0.9641 | 0.8786 | 0.8817 | 0.9112 | 0.9709 |
| Expected | −0.0003 | −0.0003 | −0.0003 | −0.0003 | −0.0003 | −0.0003 | −0.0004 | −0.0003 |
| Z | 189.0519 | 193.2245 | 250.6284 | 165.1131 | 220.1757 | 220.1795 | 271.2499 | 243.7586 |
| P | 0.0000 | 0.0000 | 0.0000 | 0.0000 | 0.0000 | 0.0000 | 0.0000 | 0.0000 |
| 2004 | 2009 | |||||||
| LST | PLAND of PS | PLAND of LS | PLAND of ES | LST | PLAND of PS | PLAND of LS | PLAND of ES | |
| Moran’s I | 0.8625 | 0.8405 | 0.8155 | 0.9849 | 0.813564 | 0.8868 | 0.9067 | 1.0453 |
| Expected | −0.0003 | −0.0003 | −0.0003 | −0.0003 | −0.0003 | −0.00002 | −0.0003 | −0.00003 |
| Z | 196.3262 | 232.3142 | 250.6254 | 284.3956 | 187.1511 | 257.2895 | 282.1602 | 276.3519 |
| P | 0.0000 | 0.0000 | 0.0000 | 0.0000 | 0.0000 | 0.0000 | 0.0000 | 0.0000 |
| 2014 | 2019 | |||||||
| LST | PLAND of PS | PLAND of LS | PLAND of ES | LST | PLAND of PS | PLAND of LS | PLAND of ES | |
| Moran’s I | 0.8347 | 0.8615 | 0.8163 | 0.9651 | 0.8648 | 0.8905 | 0.9235 | 0.9563 |
| Expected | −0.0003 | −0.0003 | −0.0003 | −0.0003 | −0.0003 | −0.00002 | 0.000013 | −0.00003 |
| Z | 192.7885 | 215.9164 | 252.3541 | 268.9672 | 199.8752 | 271.5682 | 253.8644 | 261.4285 |
| P | 0.0000 | 0.0000 | 0.0000 | 0.0000 | 0.0000 | 0.0000 | 0.0000 | 0.0000 |
Table 4.
Hot spot classes based on the Getis–Ord Gi* statistic.
| Hot Spot Classes | Percentage of Area (%) | ||||||
|---|---|---|---|---|---|---|---|
| 1990 | 1999 | 2004 | 2009 | 2014 | 2019 | 1990–2019 | |
| Very cold spot | 11.99% | 10.85% | 10.23% | 8.43% | 9.96% | 12.11% | 0.12% |
| Cold spot | 5.86% | 4.59% | 4.95% | 4.59% | 6.19% | 8.95% | 3.09% |
| Cool spot | 3.93% | 2.71% | 3.32% | 3.69% | 3.56% | 4.69% | 0.76% |
| Not significant | 56.63% | 61.10% | 61.74% | 62.86% | 58.97% | 48.80% | −7.83% |
| Warm spot | 4.43% | 3.99% | 3.38% | 4.53% | 3.67% | 5.15% | 0.72% |
| Hot spot | 7.45% | 7.22% | 5.07% | 7.06% | 5.47% | 8.58% | 1.13% |
| Very hot spot | 9.69% | 9.54% | 11.31% | 8.84% | 12.18% | 11.72% | 2.03% |
Disclaimer/Publisher’s Note: The statements, opinions and data contained in all publications are solely those of the individual author(s) and contributor(s) and not of MDPI and/or the editor(s). MDPI and/or the editor(s) disclaim responsibility for any injury to people or property resulting from any ideas, methods, instructions or products referred to in the content. |
© 2023 by the authors. Licensee MDPI, Basel, Switzerland. This article is an open access article distributed under the terms and conditions of the Creative Commons Attribution (CC BY) license (https://creativecommons.org/licenses/by/4.0/).
Share and Cite
MDPI and ACS Style
Liu, H.; Qin, L.; Xing, M.; Yan, H.; Shang, G.; Yuan, Y. Effects of Production–Living–Ecological Space Patterns Changes on Land Surface Temperature. Remote Sens. 2023, 15, 3683. https://doi.org/10.3390/rs15143683
AMA Style
Liu H, Qin L, Xing M, Yan H, Shang G, Yuan Y. Effects of Production–Living–Ecological Space Patterns Changes on Land Surface Temperature. Remote Sensing. 2023; 15(14):3683. https://doi.org/10.3390/rs15143683
Chicago/Turabian StyleLiu, Han, Ling Qin, Menggang Xing, Haiming Yan, Guofei Shang, and Yuanyuan Yuan. 2023. "Effects of Production–Living–Ecological Space Patterns Changes on Land Surface Temperature" Remote Sensing 15, no. 14: 3683. https://doi.org/10.3390/rs15143683
Note that from the first issue of 2016, this journal uses article numbers instead of page numbers. See further details here.