
Research on Stellar Occultation Detection with Bandpass Filtering for Oxygen Density Retrieval
by
 , ,
, ,
Zheng Li
1,2, 
Xiaocheng Wu
1,2,3,*,
Cui Tu
1,2,3,
Xiong Hu
1,2,
Zhaoai Yan
1,2,3,
Junfeng Yang
1,2 and
Yanan Zhang
1,2 1
State Key Laboratory of Space Weather, National Space Science Center, Chinese Academy of Sciences, Beijing 100190, China
2
Key Laboratory of Science and Technology on Environmental Space Situation Awareness, Chinese Academy of Sciences, Beijing 100190, China
3
University of Chinese Academy of Sciences, Beijing 100190, China
*
Author to whom correspondence should be addressed.
Remote Sens. 2023, 15(14), 3681; https://doi.org/10.3390/rs15143681
Submission received: 21 June 2023
/
Revised: 19 July 2023
/
Accepted: 19 July 2023
/
Published: 24 July 2023
(This article belongs to the Section Atmospheric Remote Sensing)
Abstract
:Stellar occultation instruments detect the transmission of stellar spectra through the planetary atmosphere to retrieve densities of various atmospheric components. This paper introduces an idea of using instruments with bandpass filters for stellar occultation detection. According to the characteristics of the occultation technique for oxygen density measurement, a full-link forward model is established, and the average transmission under a typical nocturnal atmosphere is calculated with the help of the HITRAN database, occultation simulation and a 3D ray-tracing program. The central wavelength and bandwidth suitable for 760 nm oxygen A-band absorption measurement are discussed. This paper also compares the results of the forward model with GOMOS spectrometer data under this band, calculates the observation signal-to-noise ratio corresponding to different instrument parameters, and target star magnitudes. The results of this paper provide a theoretical basis for the development of a stellar occultation technique with a bandpass filter and guidance on the instrument design.
1. Introduction
Atmospheric density detection in the mesosphere is the focus of the earth and space scientific community. Stellar occultation technology is an effective approach to detect the middle and upper atmosphere by measuring the spectral absorption and refraction characteristics of planetary atmospheres on starlight. It can detect atmospheric parameters such as density, temperature, and composition, and plays an important role in solving problems in the near-space environment [1]. This technology has the advantages of global coverage and multiple occultation events, and has irreplaceable potential advantages in studying climate change, ozone layer holes, etc.
The idea of stellar occultation technology was first proposed by Smith and Hunten in 1968 [2]. In 1973, the Stellar Ultraviolet Photometers carried on the OAO-2 satellite achieved the detection of intermediate ozone concentration for the first time and obtained the distribution of lower thermosphere molecular oxygen at night [3]. GOMOS, developed by ESA in 2002, was the first instrument dedicated to detecting Earth’s atmospheric component density using stellar occultation technology [4], mainly detecting the vertical profile of the ozone while also monitoring other atmospheric components. Some researchers have also used GOMOS data to study oxygen density inversion, but due to limitations of the instrument itself and the effect of temperature on oxygen absorption cross-sections, the inversion results are not ideal.
Oxygen density can be used to calculate the total atmospheric density because the proportion of oxygen in the air is very stable, accounting for 20.947% below 80 km, and has a uniform distribution from the stratosphere to the mesosphere [5]. Currently, there is no stellar occultation instrument specifically designed for oxygen density detection in the mesosphere, but some solar occultation instruments have been the focus of such research. Researchers used the absorption characteristics of the 760 nm oxygen absorption A-band to retrieve oxygen density. In 1993 and 1998, NASA respectively launched the POAM II and POAM III solar occultation instruments. POAM was designed with nine photometers to detect atmospheric absorption lines in different bands, one of which has a central wavelength of 761.3 nm and a bandwidth of 2.3 nm, specifically for detecting the oxygen absorption A-band [6,7]. The ILAS solar occultation instrument launched by Japan’s Ministry of the Environment in 1996 obtained atmospheric temperature and pressure by retrieving oxygen density, with an estimated error of about 4 K and 4% [8]. The ACE-MAESTRO solar occultation instrument developed by the Canadian Space Agency began operation in 2003 and calculated total atmospheric density through the stable proportion of oxygen [9].
Considering the stable proportion of oxygen below 80 km, the low absorption efficiency above 80 km, and the presence of aerosols, water vapor, turbulence and other complex influences below 40 km, this paper’s conceived occultation instrument with a bandpass filter focuses on oxygen density detection at altitudes of 40–80 km, uses a single band, and is designed with a wider bandwidth for a higher signal-to-noise ratio. Based on these characteristics, this paper establishes a stellar occultation full-link forward model, explores the central wavelength and bandwidth suitable for oxygen density measurement, and compares the forward model transmission results with GOMOS actual data. Finally, we analyze the signal-to-noise ratio corresponding to different instrument parameters and target star magnitudes. The research results of this paper provide guidance for the development of a stellar occultation instrument with a bandpass filter.
2. The Principle of Stellar Occultation Technology
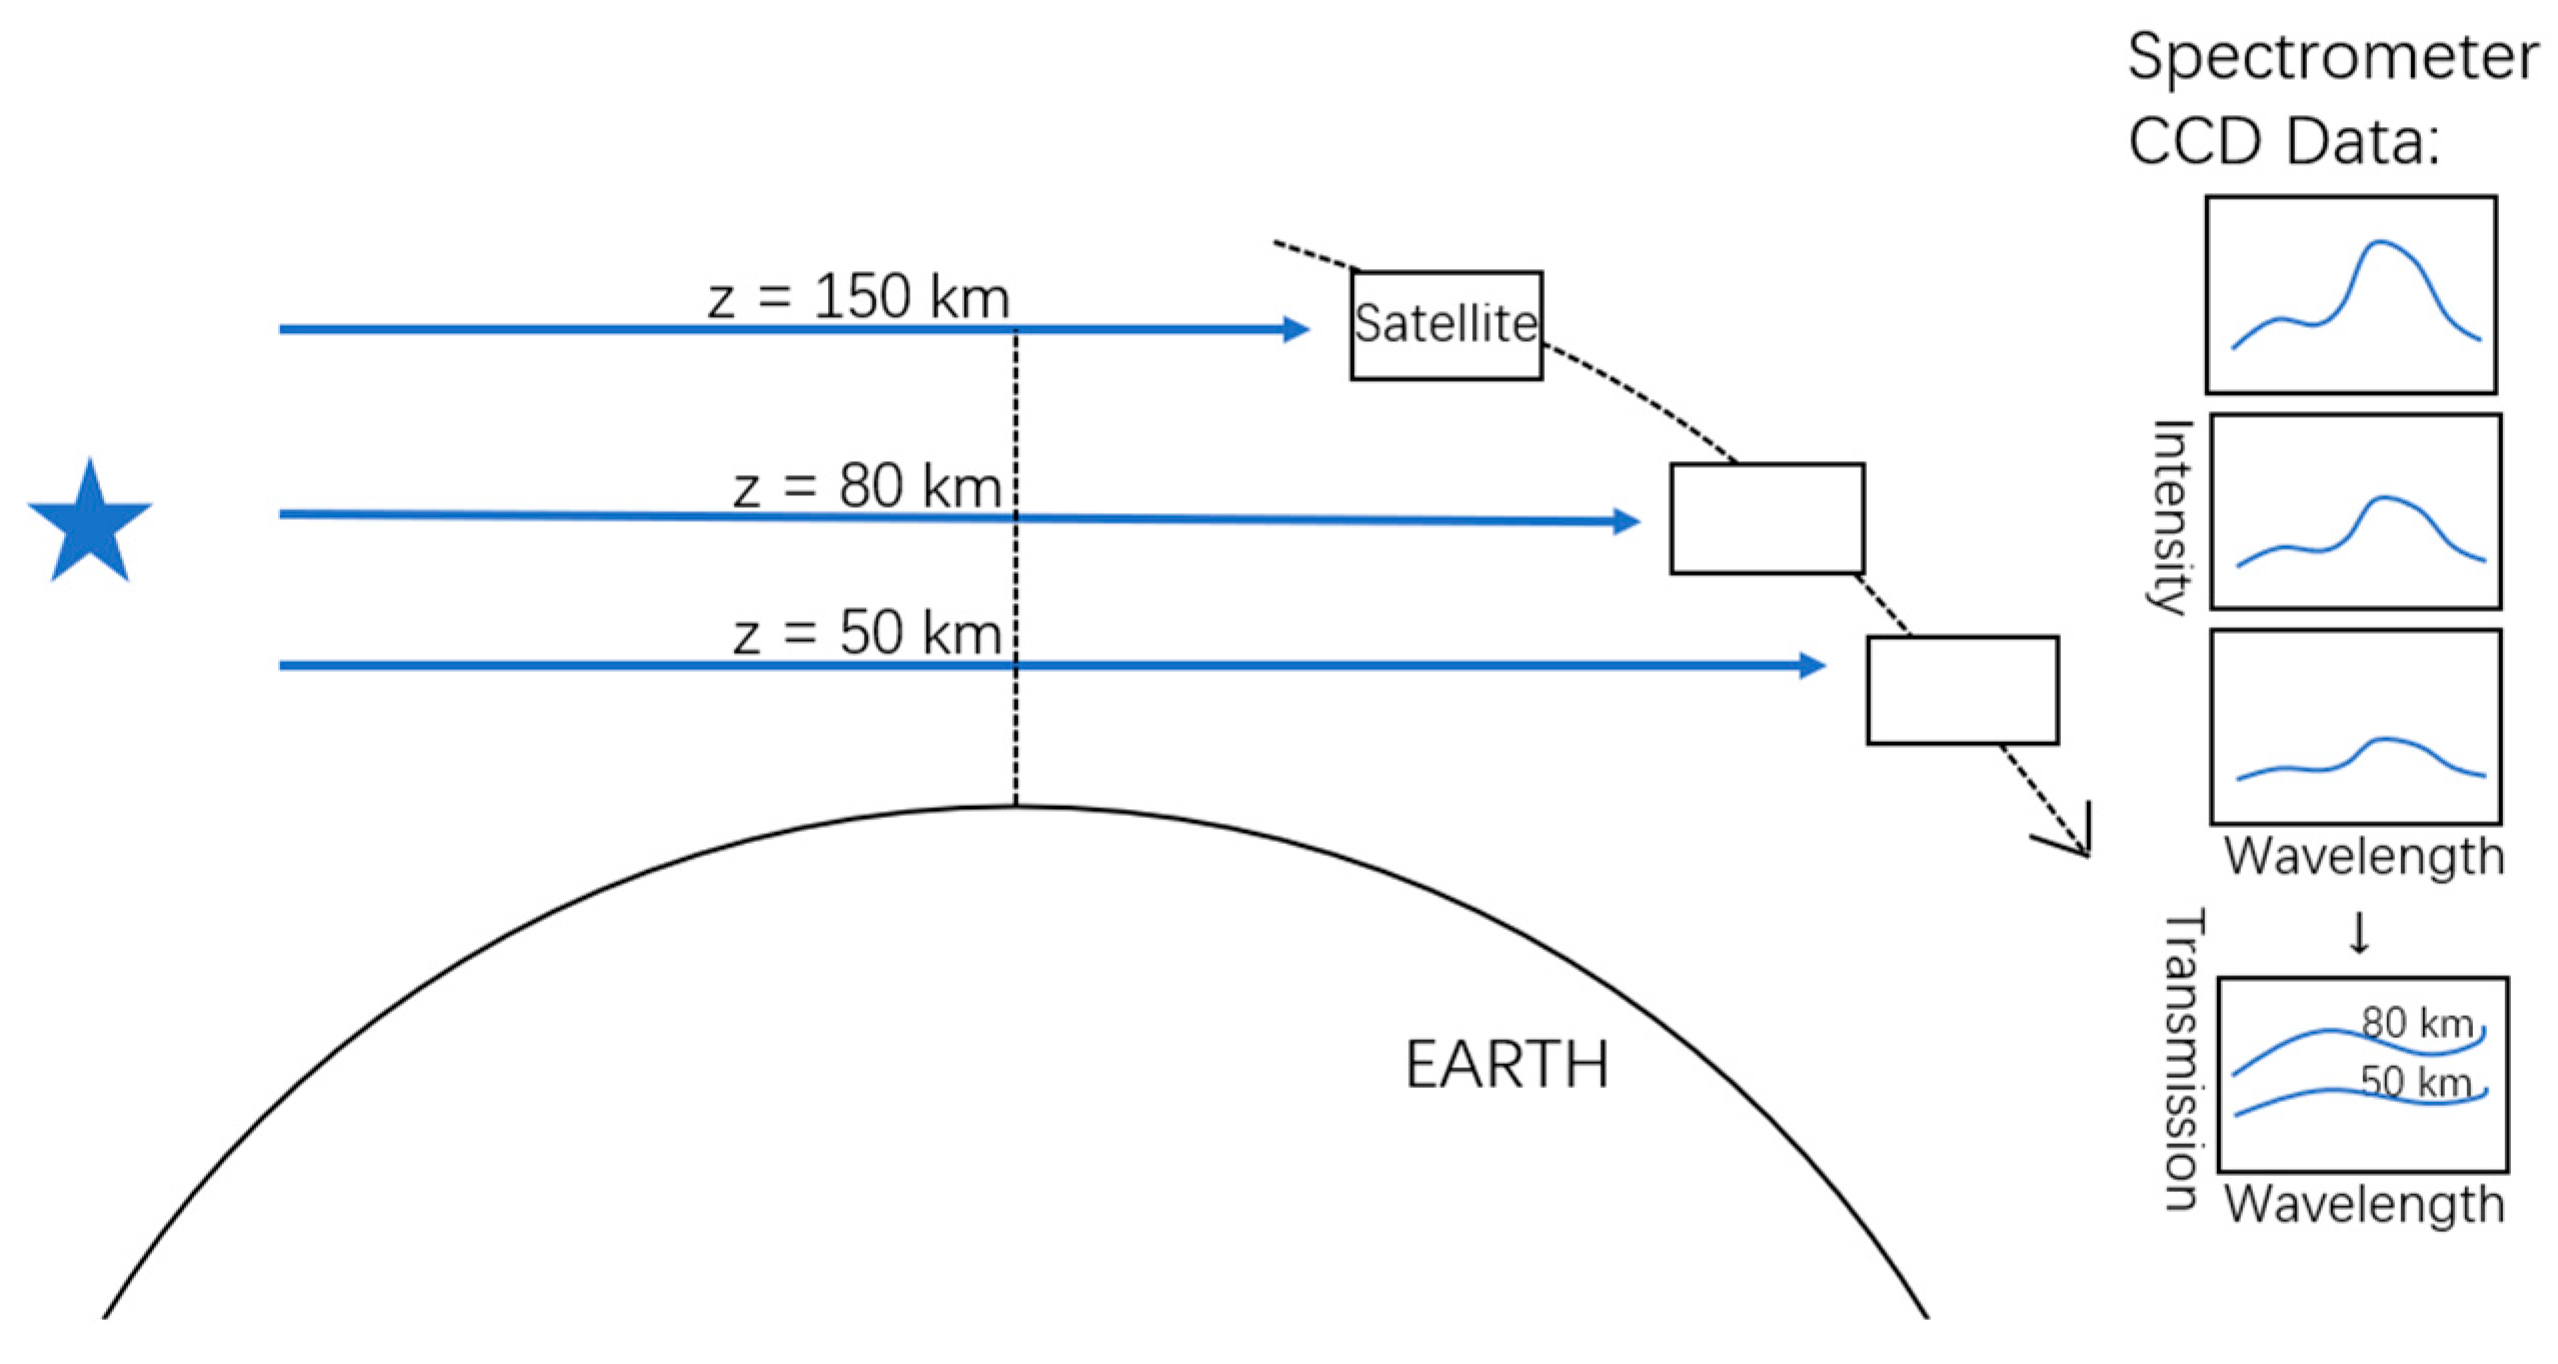
In a stellar occultation event, a star is viewed as a point source passing through the atmosphere and is received at different heights by a spectrometer or photometer mounted on an LEO orbit satellite, to obtain the atmospheric spectral transmission. Figure 1 shows the scheme of a stellar occultation event, the star symbol represents a real bright star. Different components in the atmosphere have different effects on starlight, such as refraction, absorption, scattering, etc., and various atmospheric component density parameters can be retrieved by utilizing these characteristics. The minimum distance from the line connecting the star and satellite to the Earth’s surface is defined as the occultation tangent height. As the occultation tangent height decreases continuously, the length of the starlight passing through the atmosphere increases, and the starlight received by the detector gradually decays. The ratio of the attenuated spectrum to the unabsorbed reference spectrum is called atmospheric spectral transmission:
Here, λ is the wavelength of detection, z is the tangent height. F is the detected flux of star in different tangent height, F0 is the unabsorbed reference flux, Tobs is the observed transmission.
According to the Beer–Lambert Law,
Here, τ is optical depth, j represents different atmospheric components, σ is absorption or scattering cross-section, ρ is the density of atmospheric components, is the location along the light path. Optical depth is the product of cross-sections and densities integrated along the light path. The Beer–Lambert law is key to the inversion of star occultation data. The onion peeling method can be used to retrieve the density of atmospheric components [10].
The current occultation-detection instruments mainly carry spectrometers to achieve multi-band detection, their structures are large and costly. Due to the high resolution of spectrometers and the dim light of stars, the signal within each band is relatively low and the signal-to-noise ratio is unsatisfactory for oxygen measurement. Therefore, we have conceived a stellar occultation instrument with a bandpass filter to realize a higher signal-to-noise ratio and simpler structures, by sacrificing the spectral-detection ability. For the detection of a single atmospheric component, this method helps to achieve low-cost and networked occultation detection.
By changing the central wavelength of the filter, the instrument can be used not only for oxygen measurement but also for detecting other components such as ozone and water vapor.
3. Forward Model and Results
The establishment of the forward model is the basis for subsequent retrieval work. The model first uses the oxygen spectral-line intensity from the HITRAN database to calculate the oxygen absorption cross-section at different temperatures. The coordinates of the light path are obtained by the occultation simulation program. Then, the product of oxygen density output by the NRLMSISE00 model and the cross-section is integrated along the light path to calculate optical depth, and then transmission is obtained. The relationship between transmission and signal-to-noise ratio can be analyzed to perform band and instrument parameter selection.
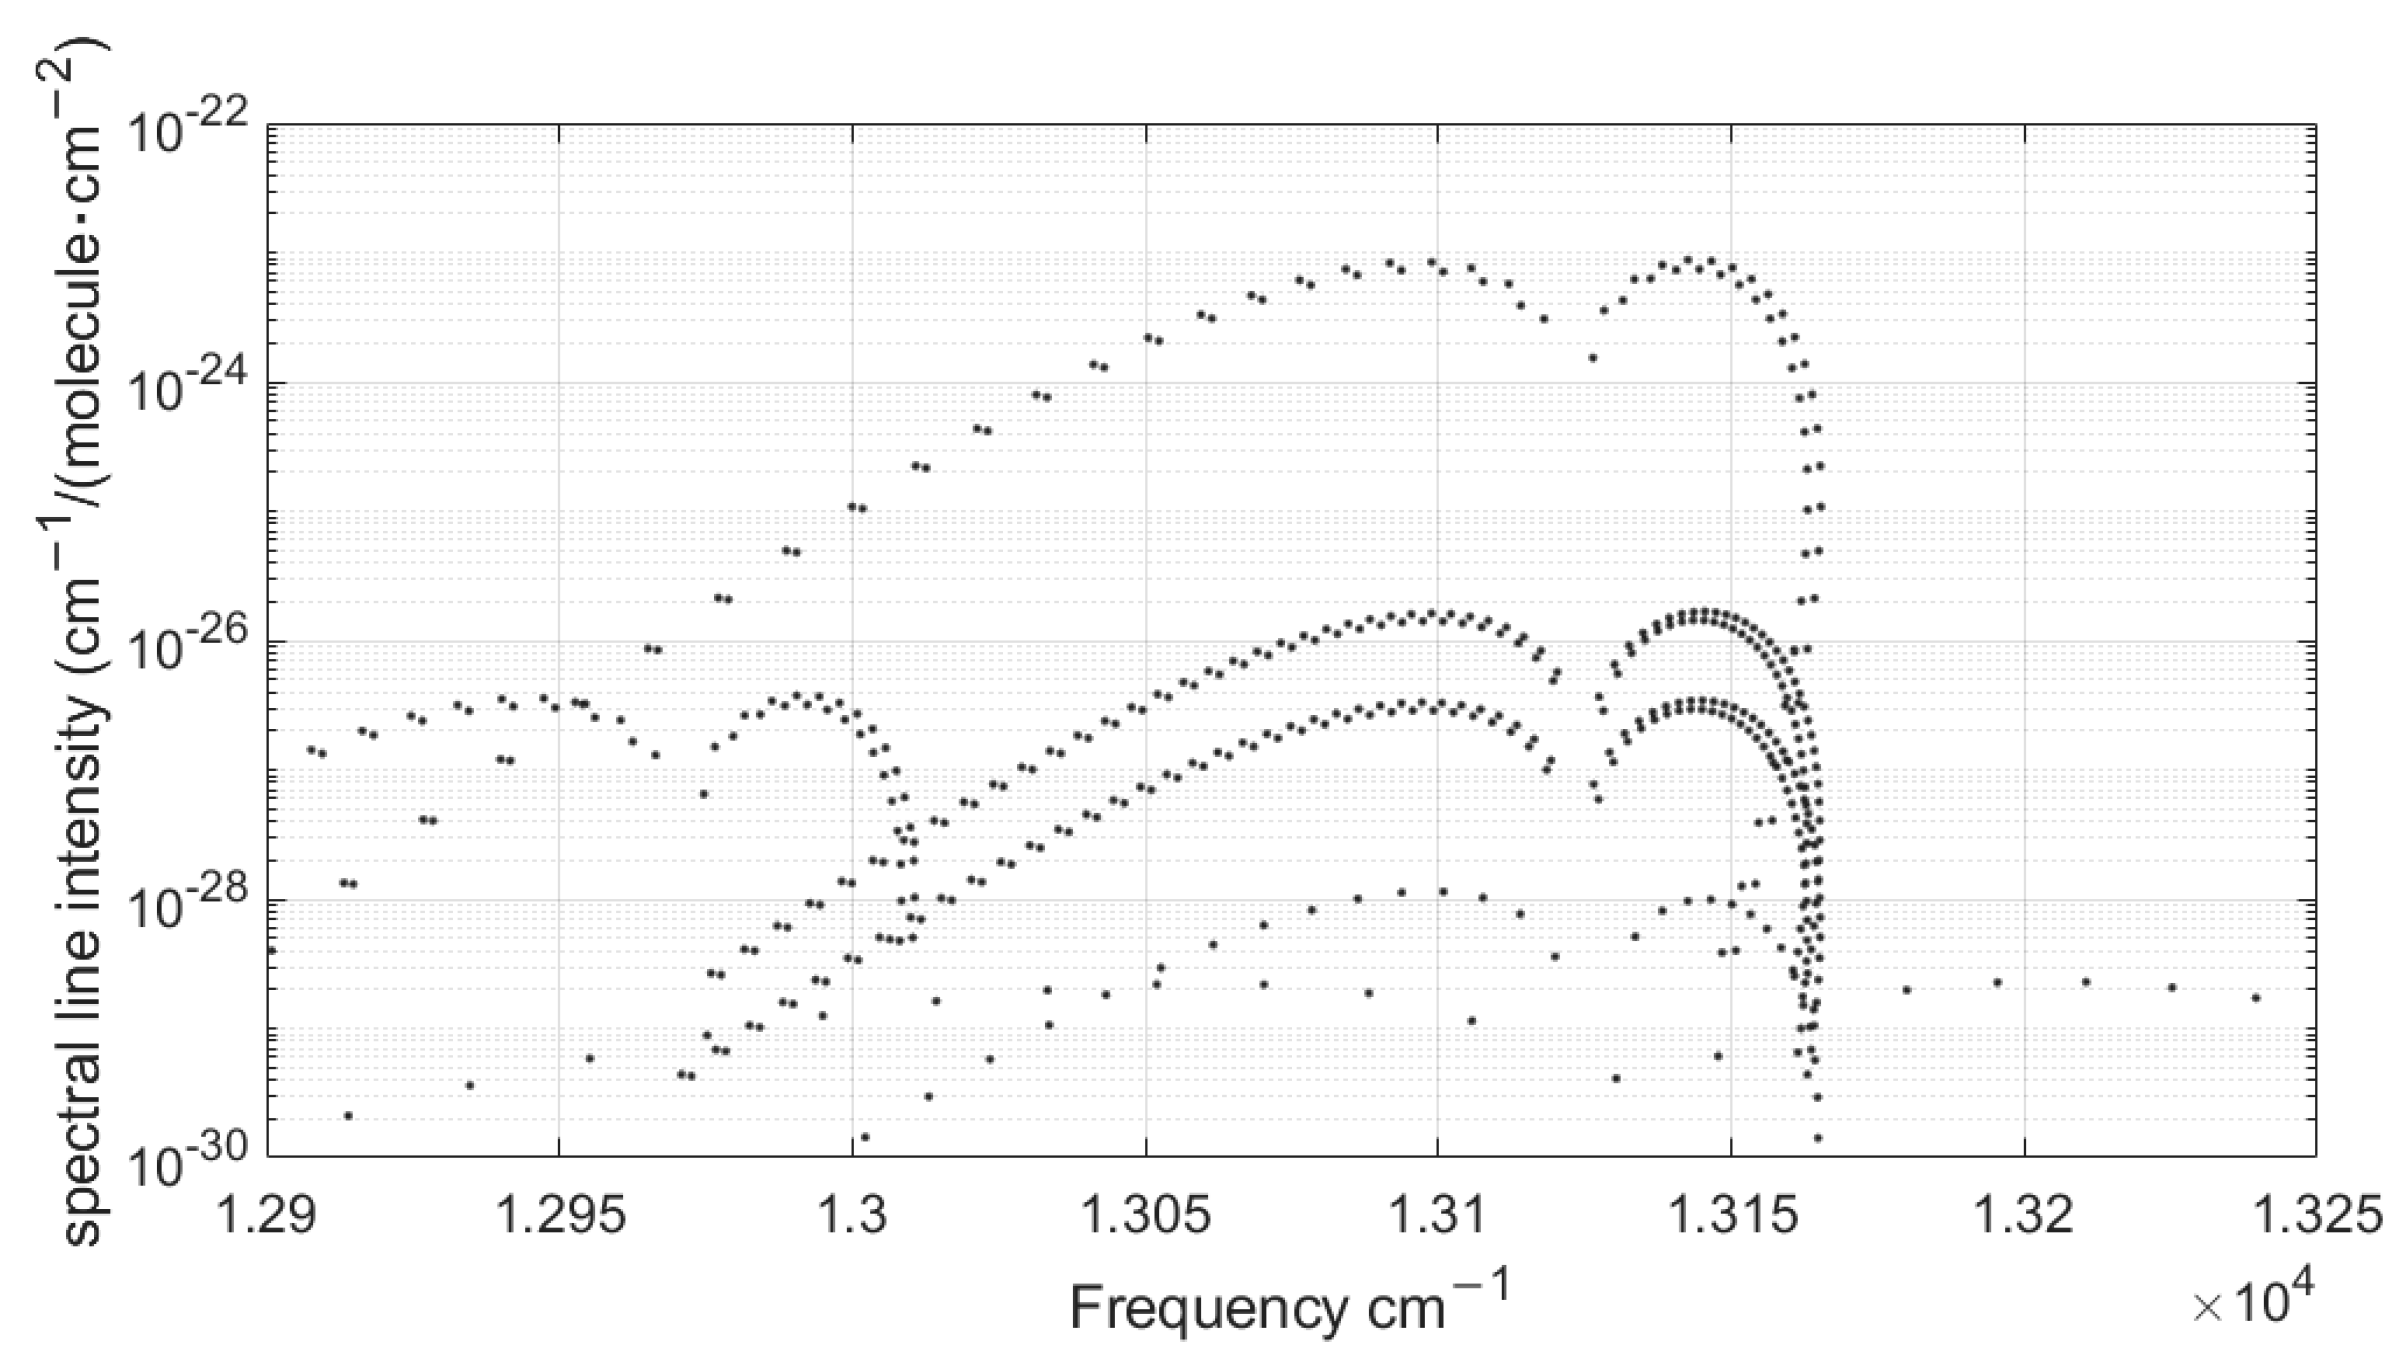
The spectral-line intensity data are from HITRAN 2004 [11]. They include the low-energy-state energy E″ (cm−1) and the spectral-line intensity S (cm−1/(molecule⋅cm−2)) corresponding to the frequency v (cm−1), as shown in Figure 2:
The actual spectral lines present in the atmosphere have a certain width and shape. The absorption of spectral lines varies with frequency, with maximum absorption at the center frequency and rapid decreases on both sides. In order to represent this frequency-dependent absorption distribution, a line shape function is generally defined for a spectral line, so that the absorption coefficient can be written as [12]:
Here, is the absorption coefficient at frequency , S is line intensity, a function of temperature, which can be derived from quantum mechanics theory:
Here, TS is the reference temperature of HITRAN data, S(TS) is the spectral-line intensity at reference temperature, E″ is the lower-state energy of the transition. and are the vibrational and rotational partition functions. For oxygen, and can be expressed by the following formula at temperatures between 175 and 325 K, where T is in Kelvin.
In the above formula, j varies with the molecule. Generally, for linear molecules (such as O2, CO2, N2O, etc.), j = 1; while for non-linear molecules (such as H2O, O3, CH4, etc.), j = 1.5.
In the actual atmospheric absorption calculation, there are three main physical mechanisms causing spectral-line broadening. It is necessary to consider the effects of pressure broadening (mainly occurring in the stratosphere and troposphere below 30 km), Doppler broadening (mainly occurring above 30 km), and their mixed effect—Voigt broadening. Under the Doppler broadening mechanisms, the Doppler half-width aD and the absorption coefficient are as follows:
Here, M is molecular weight.
Since the stellar occultation instrument discussed in this paper mainly focuses on atmospheric detection above 40 km, where the atmosphere is thin and Doppler broadening dominates, a Doppler line shape is used for the forward model.
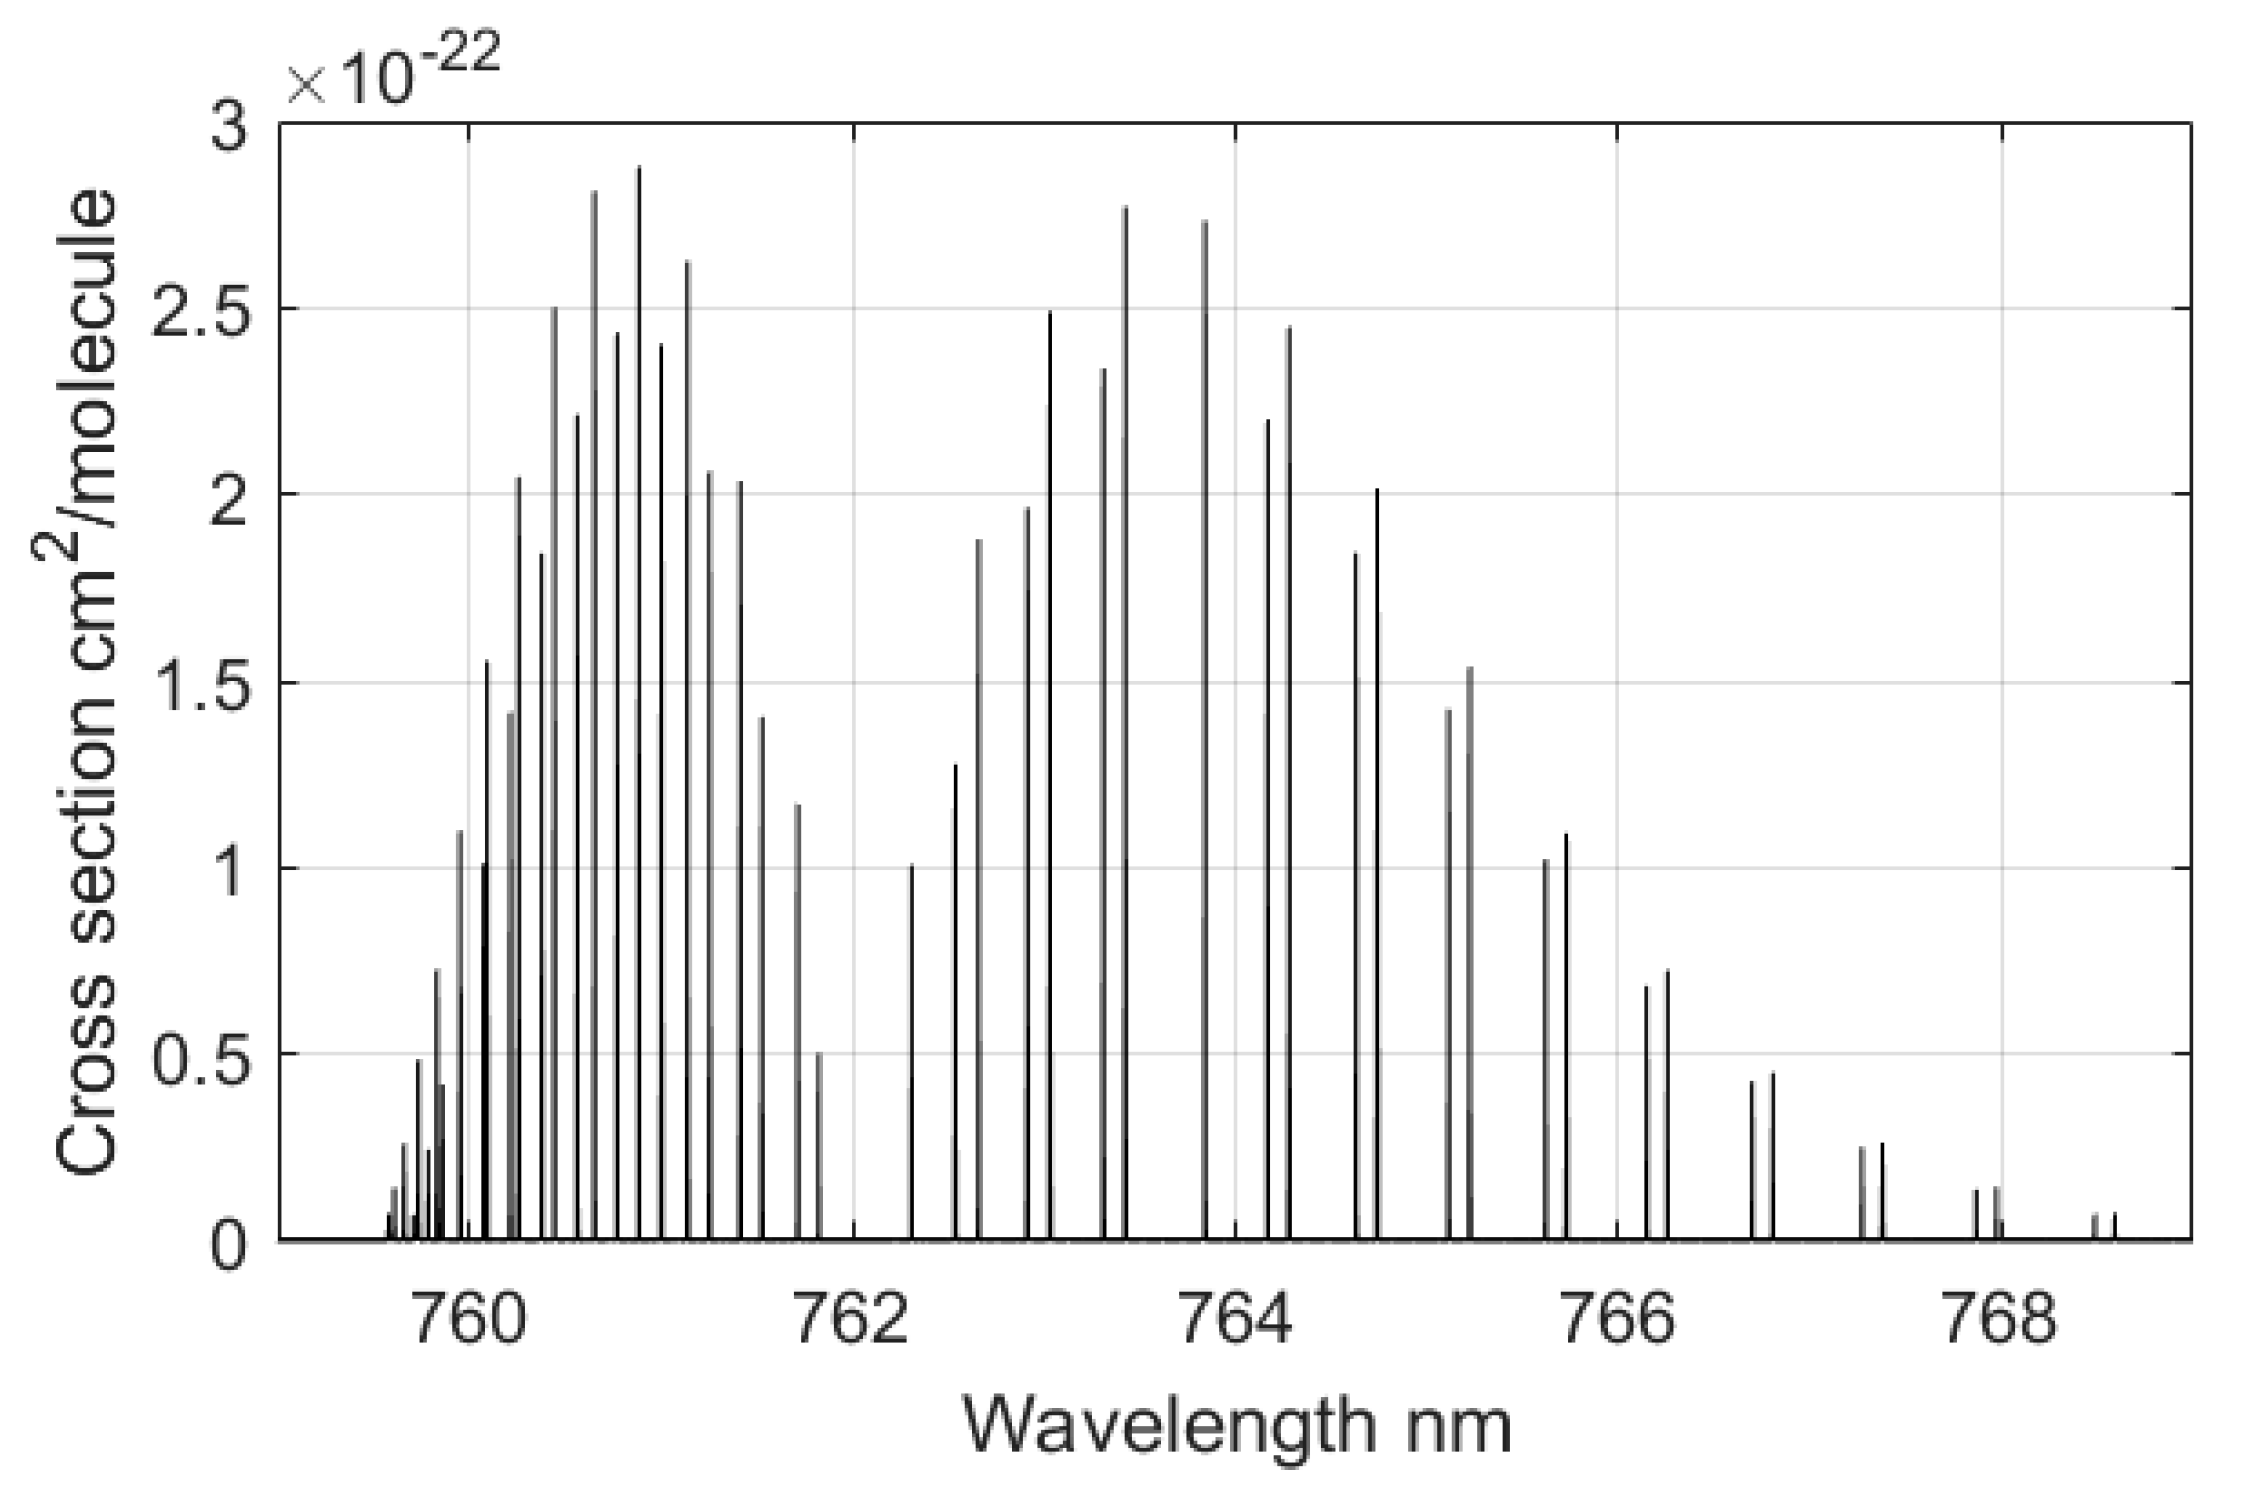
kv,i is the absorption coefficient for the ith spectral line at frequency ν. Then, the cross-section can be obtained by the absorption coefficient:
The cross-section result is shown in Figure 3; the x-axis is converted from frequency to wavelength.
Although scattering and absorption effects involve different physical processes, the net effect of scattering can be regarded as an equivalent process to absorption and can be calculated simultaneously [13]. Consider the Rayleigh scattering coefficient:
In the formula, 1.06 is the air depolarization factor, n(λ) is the air refractive index, and Nstp is the air number density at sea level. Thus, we can obtain the total extinction coefficient:
Using the occultation simulation program [14], the coordinates of the star (ra1, ra2, …, ran), satellite coordinates (rb1, rb2, …, rbn), and corresponding time (t1, t2, …, tn) are obtained within an occultation event. Considering the light bending caused by atmospheric refraction, the star and satellite coordinate sets are input into the radio occultation 3D ray-tracing program [15] to obtain the corresponding ray-tracing coordinates (, , …, ).
The temperature and oxygen density at each position is obtained by inputting the time tn and the ray-tracing coordinate into the NRLMSISE00 atmospheric model. The total atmospheric optical depth τ passed by the starlight:
is the absorption cross-section of component j at location . Ρj is the density of component j at location . After obtaining the total optical depth, the atmospheric transmission can be obtained by Beer–Lambert’s law:
The atmosphere also has the effect of refractive dilution, which can be calculated by the following formula:
Here, pA is the position of the intersection of incoming and outgoing rays, pS is the position of a satellite. D is the distance between the atmospheric screen and the observation plane, both perpendicular to the star direction. ω is the refractive angle [16].
At this point, the observed transmission of starlight through the atmosphere to the instrument is:
And the average transmission observed by the instrument between λ1~λ2 is:
Here, F(λ) is the flux density of star, Q(λ) is the quantum efficiency of photoelectric device.
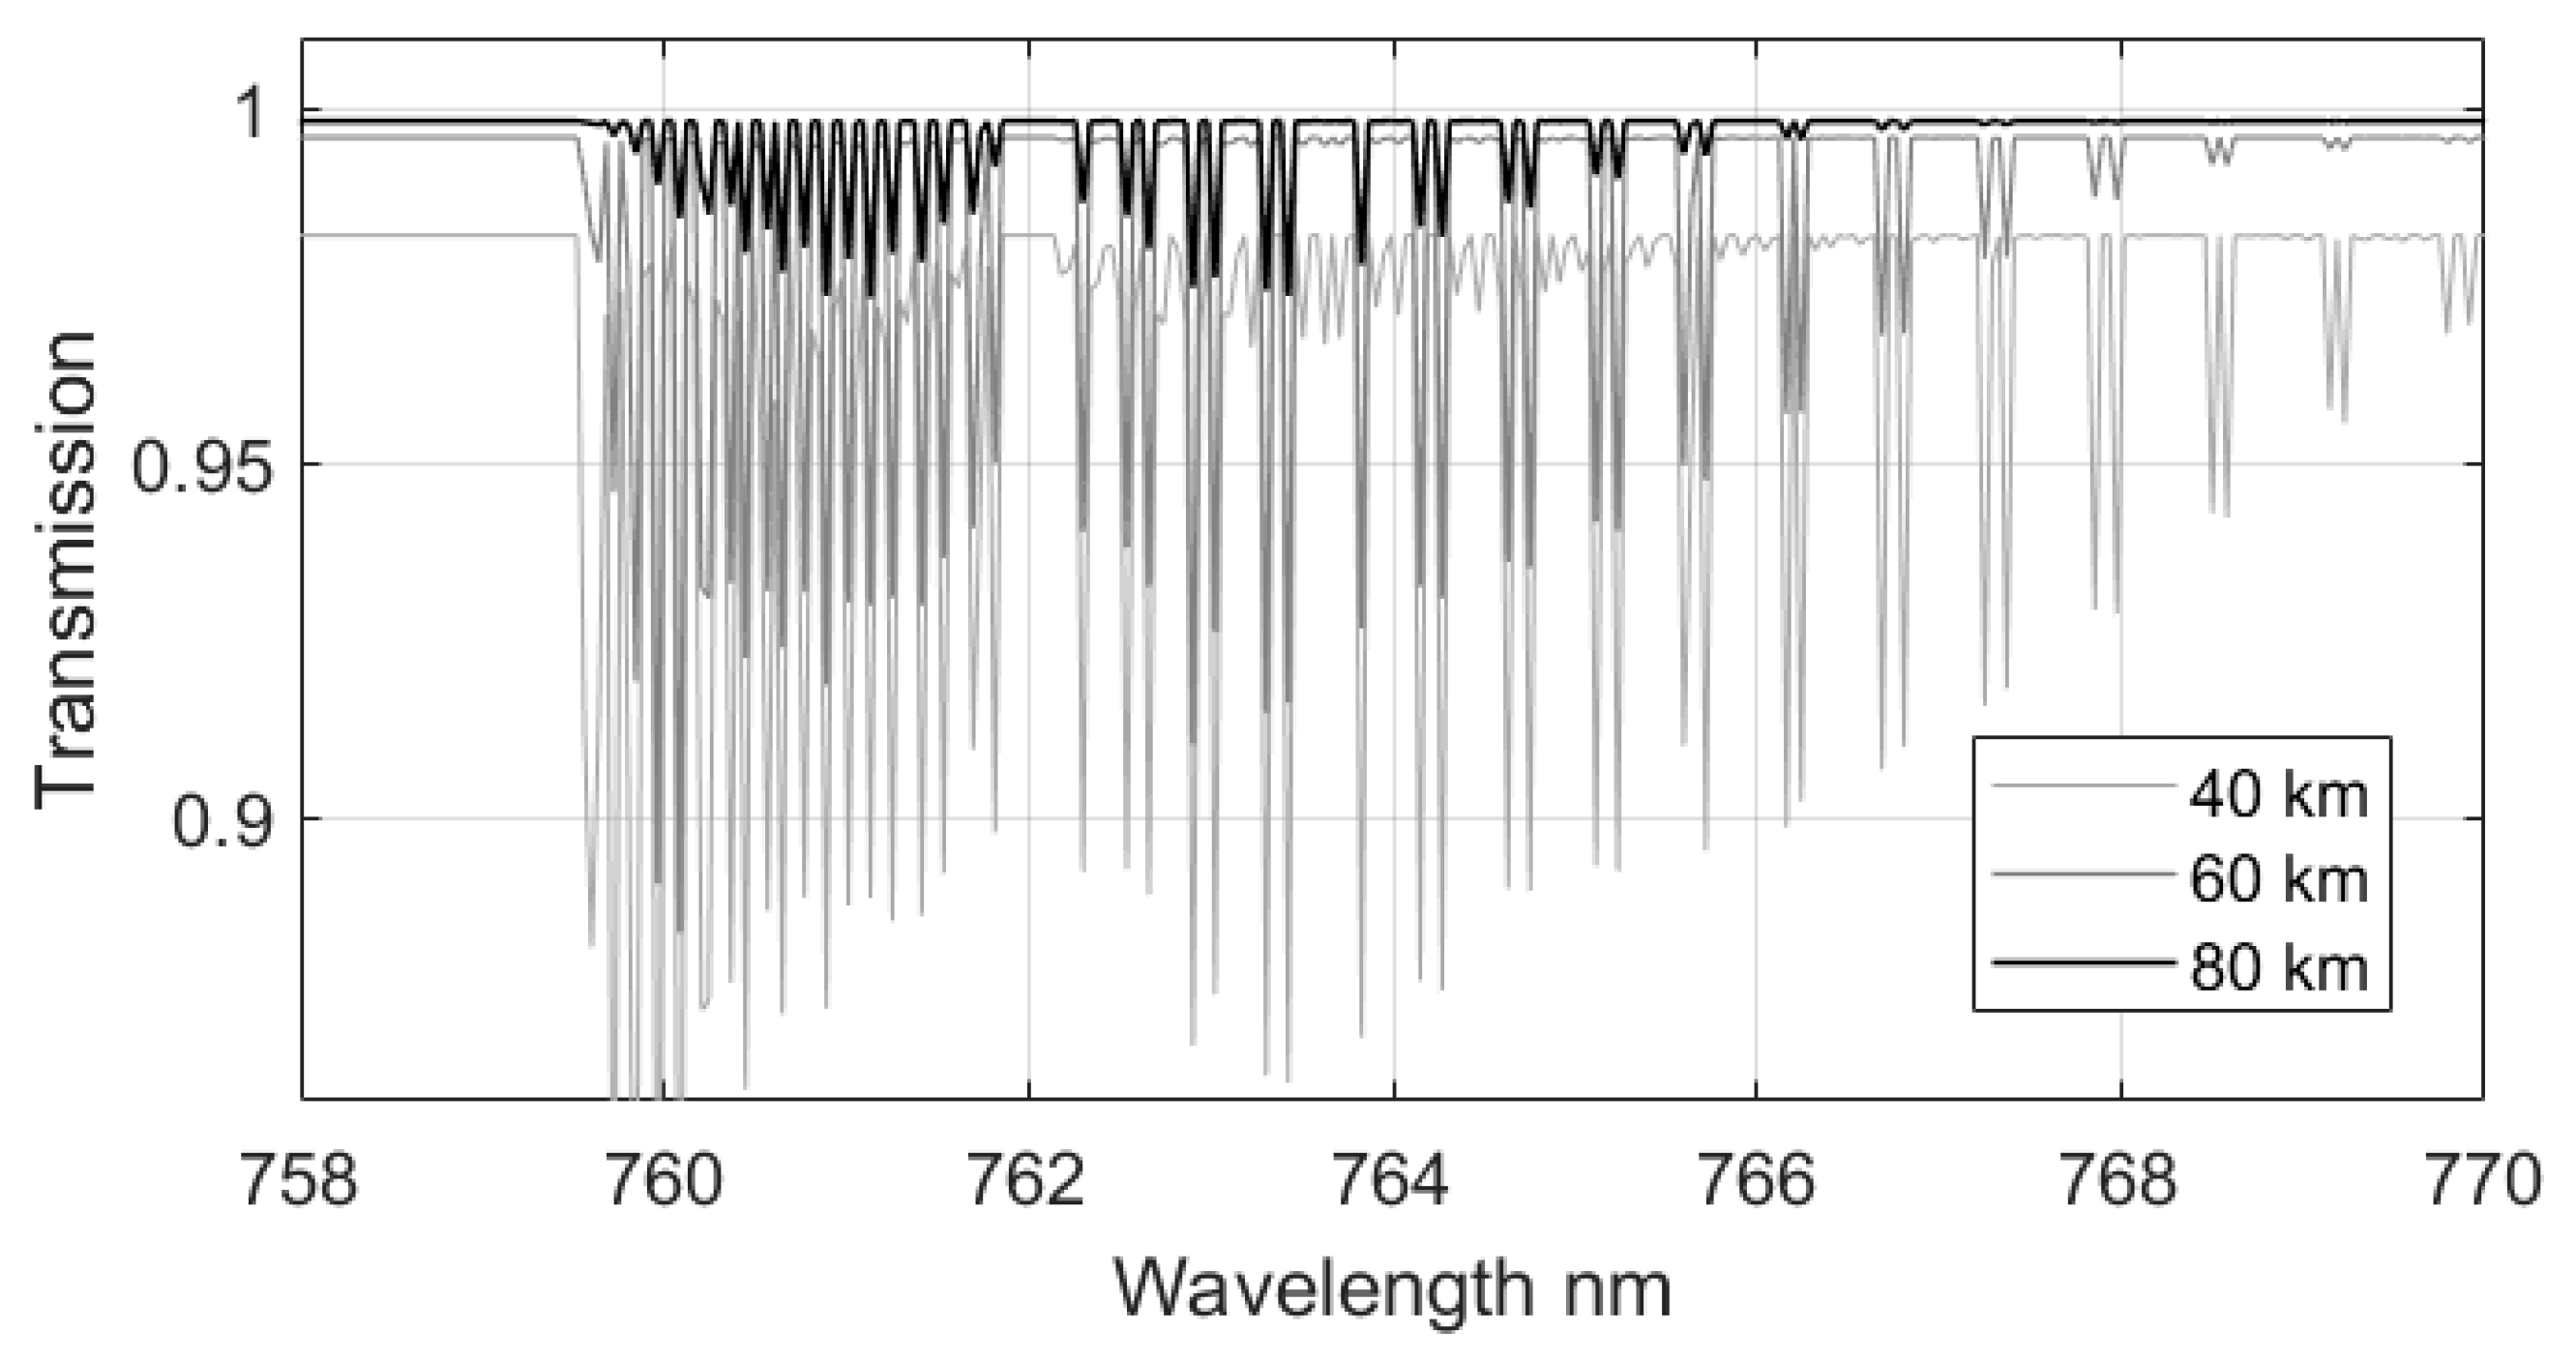
A typical nocturnal atmospheric spatiotemporal parameter (LAT: −45.0, LON: −39.8, YEAR: 2018, DAY: 180, UT: 06:00) is set, the spatial resolution of the 3D ray-tracing program is set to 10 m, and the satellite orbit height is set to 830 km. The oxygen density within the altitude of 0–150 km is considered. Then, is obtained by performing the forward model, as shown in Figure 4:
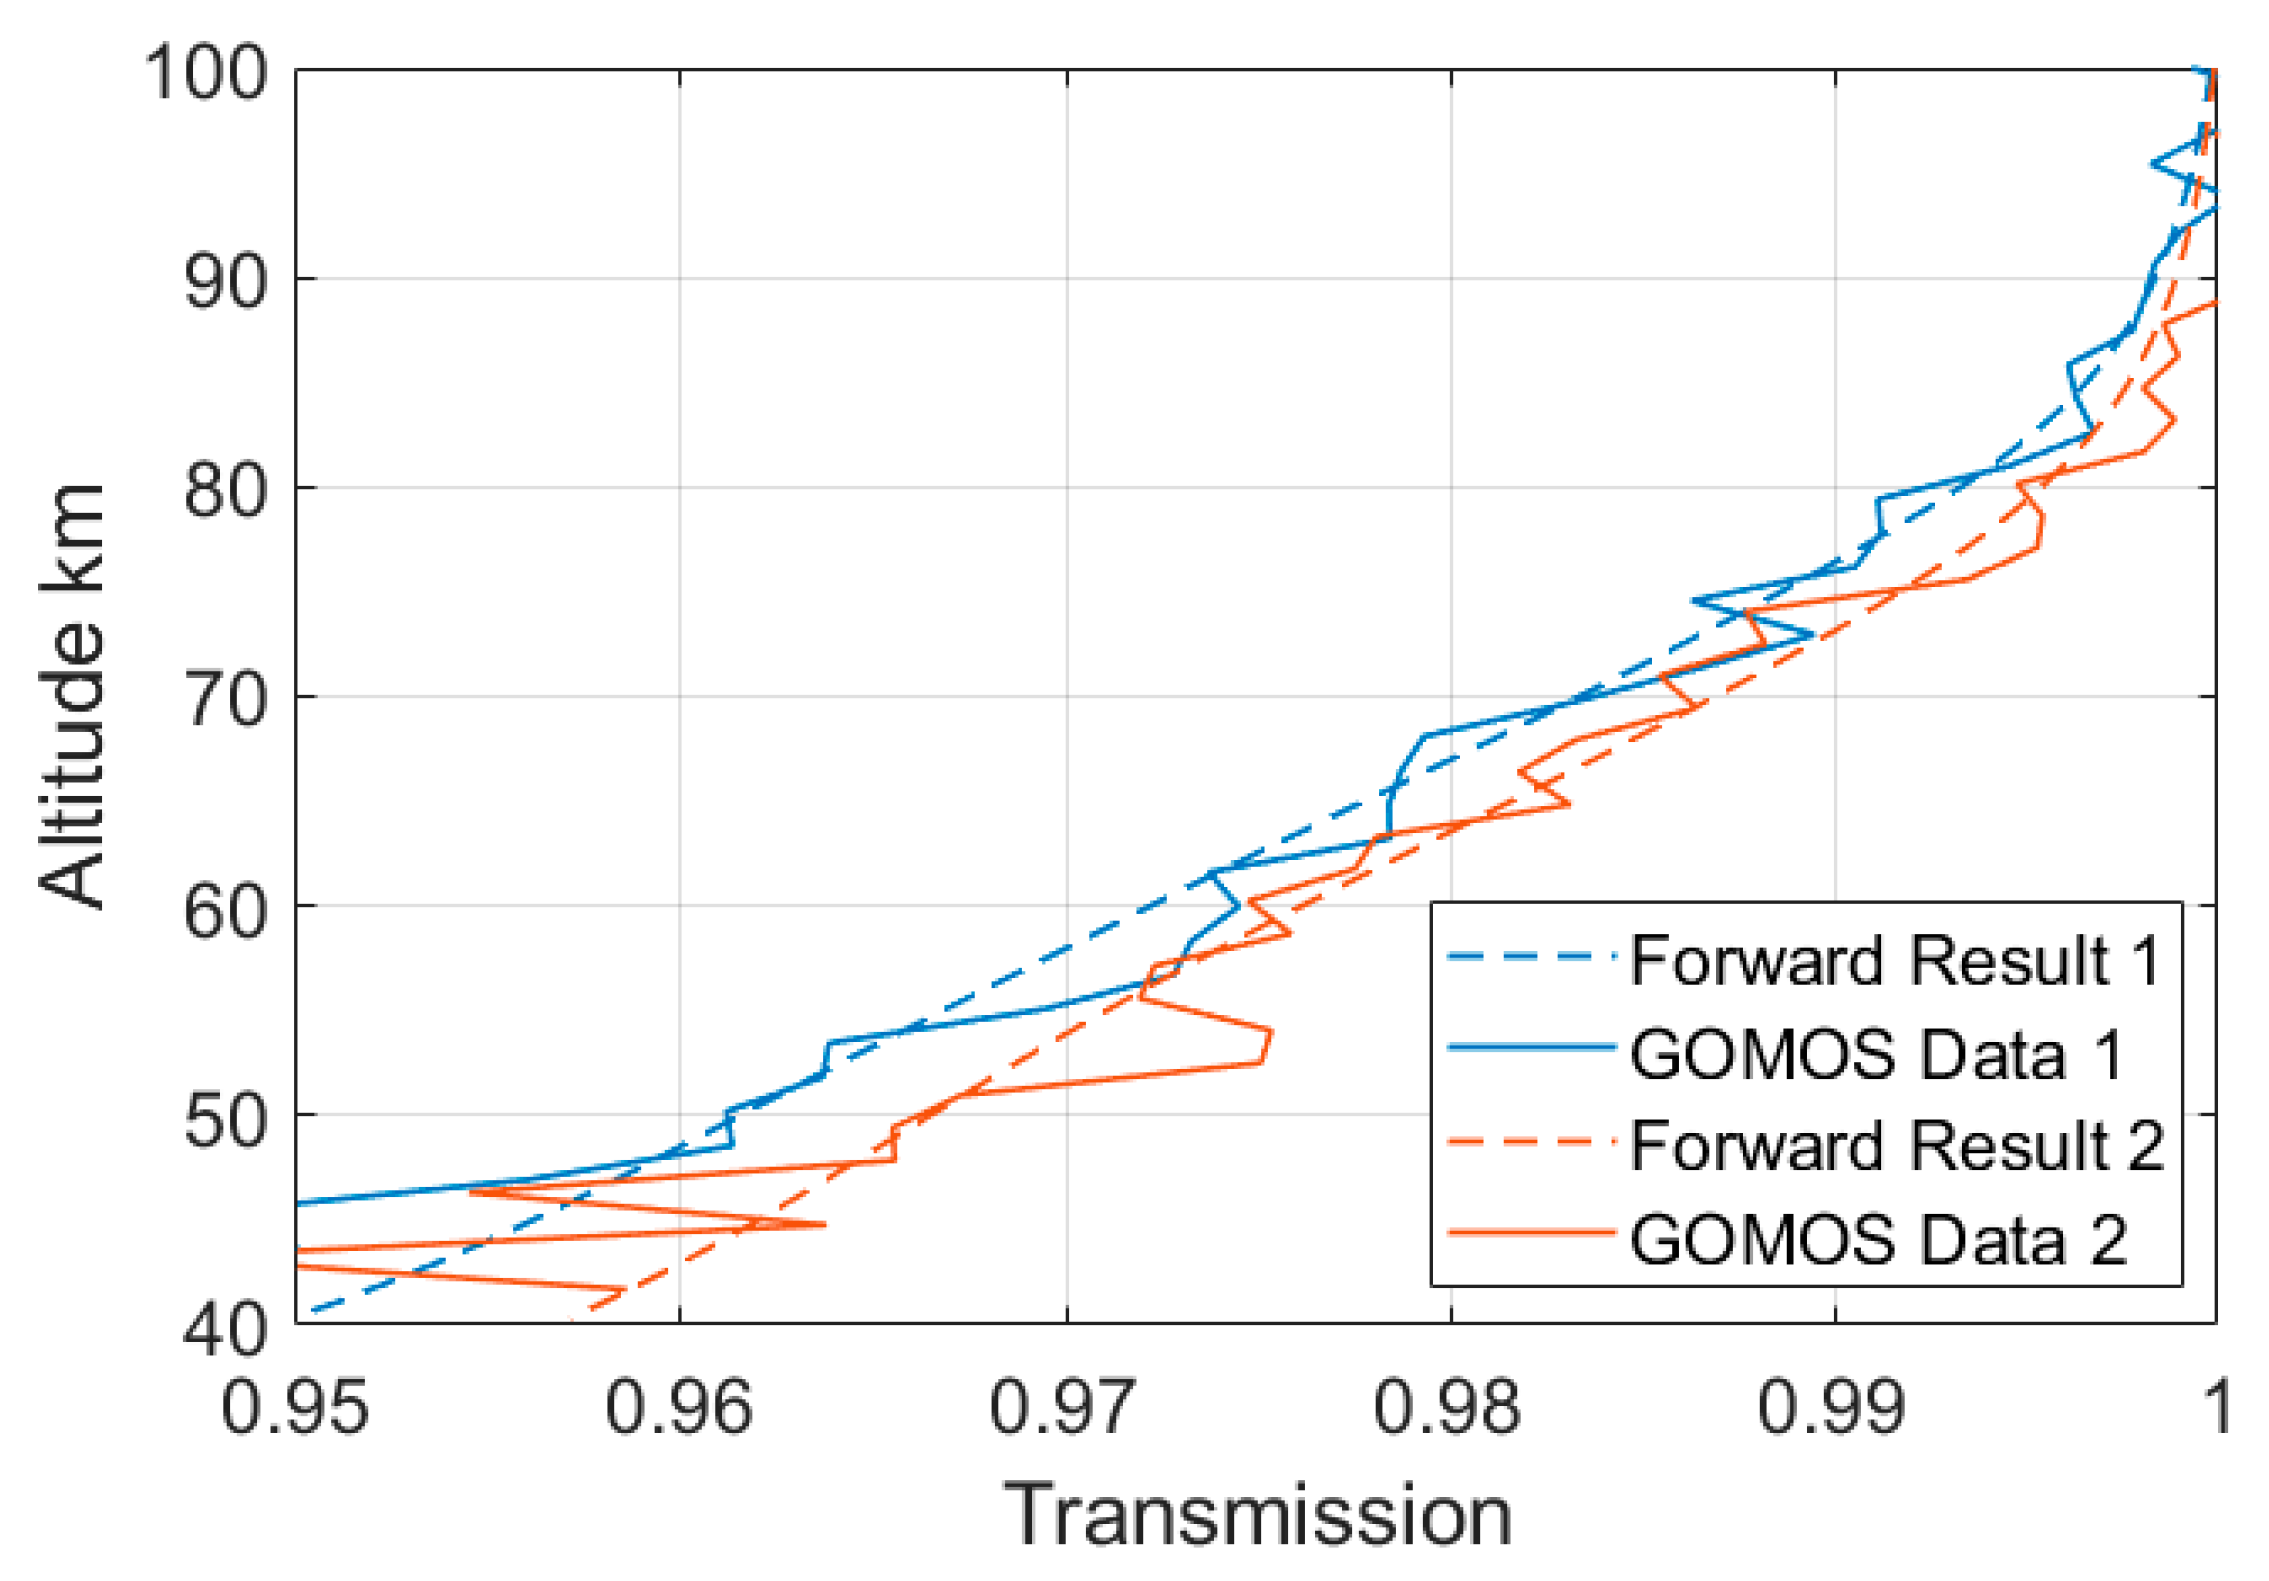
To verify the reliability of the forward model, actual detection data from the GOMOS spectrometer (Data 1: LAT: 82.08, LON: −41.56, YEAR: 2005, DAY: 1, UT: 12:32 and Data 2: LAT: −23.60, LON: −101.78, YEAR: 2005, DAY: 1, UT: 05:16) were used to calculate the average transmission in the 759.8–761.8 nm band and were compared with the results of the forward model used in the previous section (spatiotemporally corresponding). The results are as shown in Figure 5:
It can be seen that the curves match well, and the numerical values and trends are consistent, indicating that the forward model is reliable. The fluctuation of GOMOS data curve is due to its low signal-to-noise ratio.
4. Filter Band Selection
We define the signal as the light intensity absorbed by the atmosphere rather than the light intensity detected by the instrument. F0 is the stellar flux that is not absorbed by the atmosphere and can be regarded as a constant in a narrow bandwidth. Assuming only photon noise is considered, the signal-to-noise ratio formula is:
In general, the larger the bandwidth, the more spectral segments with low absorption rates will be included, resulting in an increase in the average transmission. We need to find an optimal bandwidth value to maximize the signal-to-noise ratio.
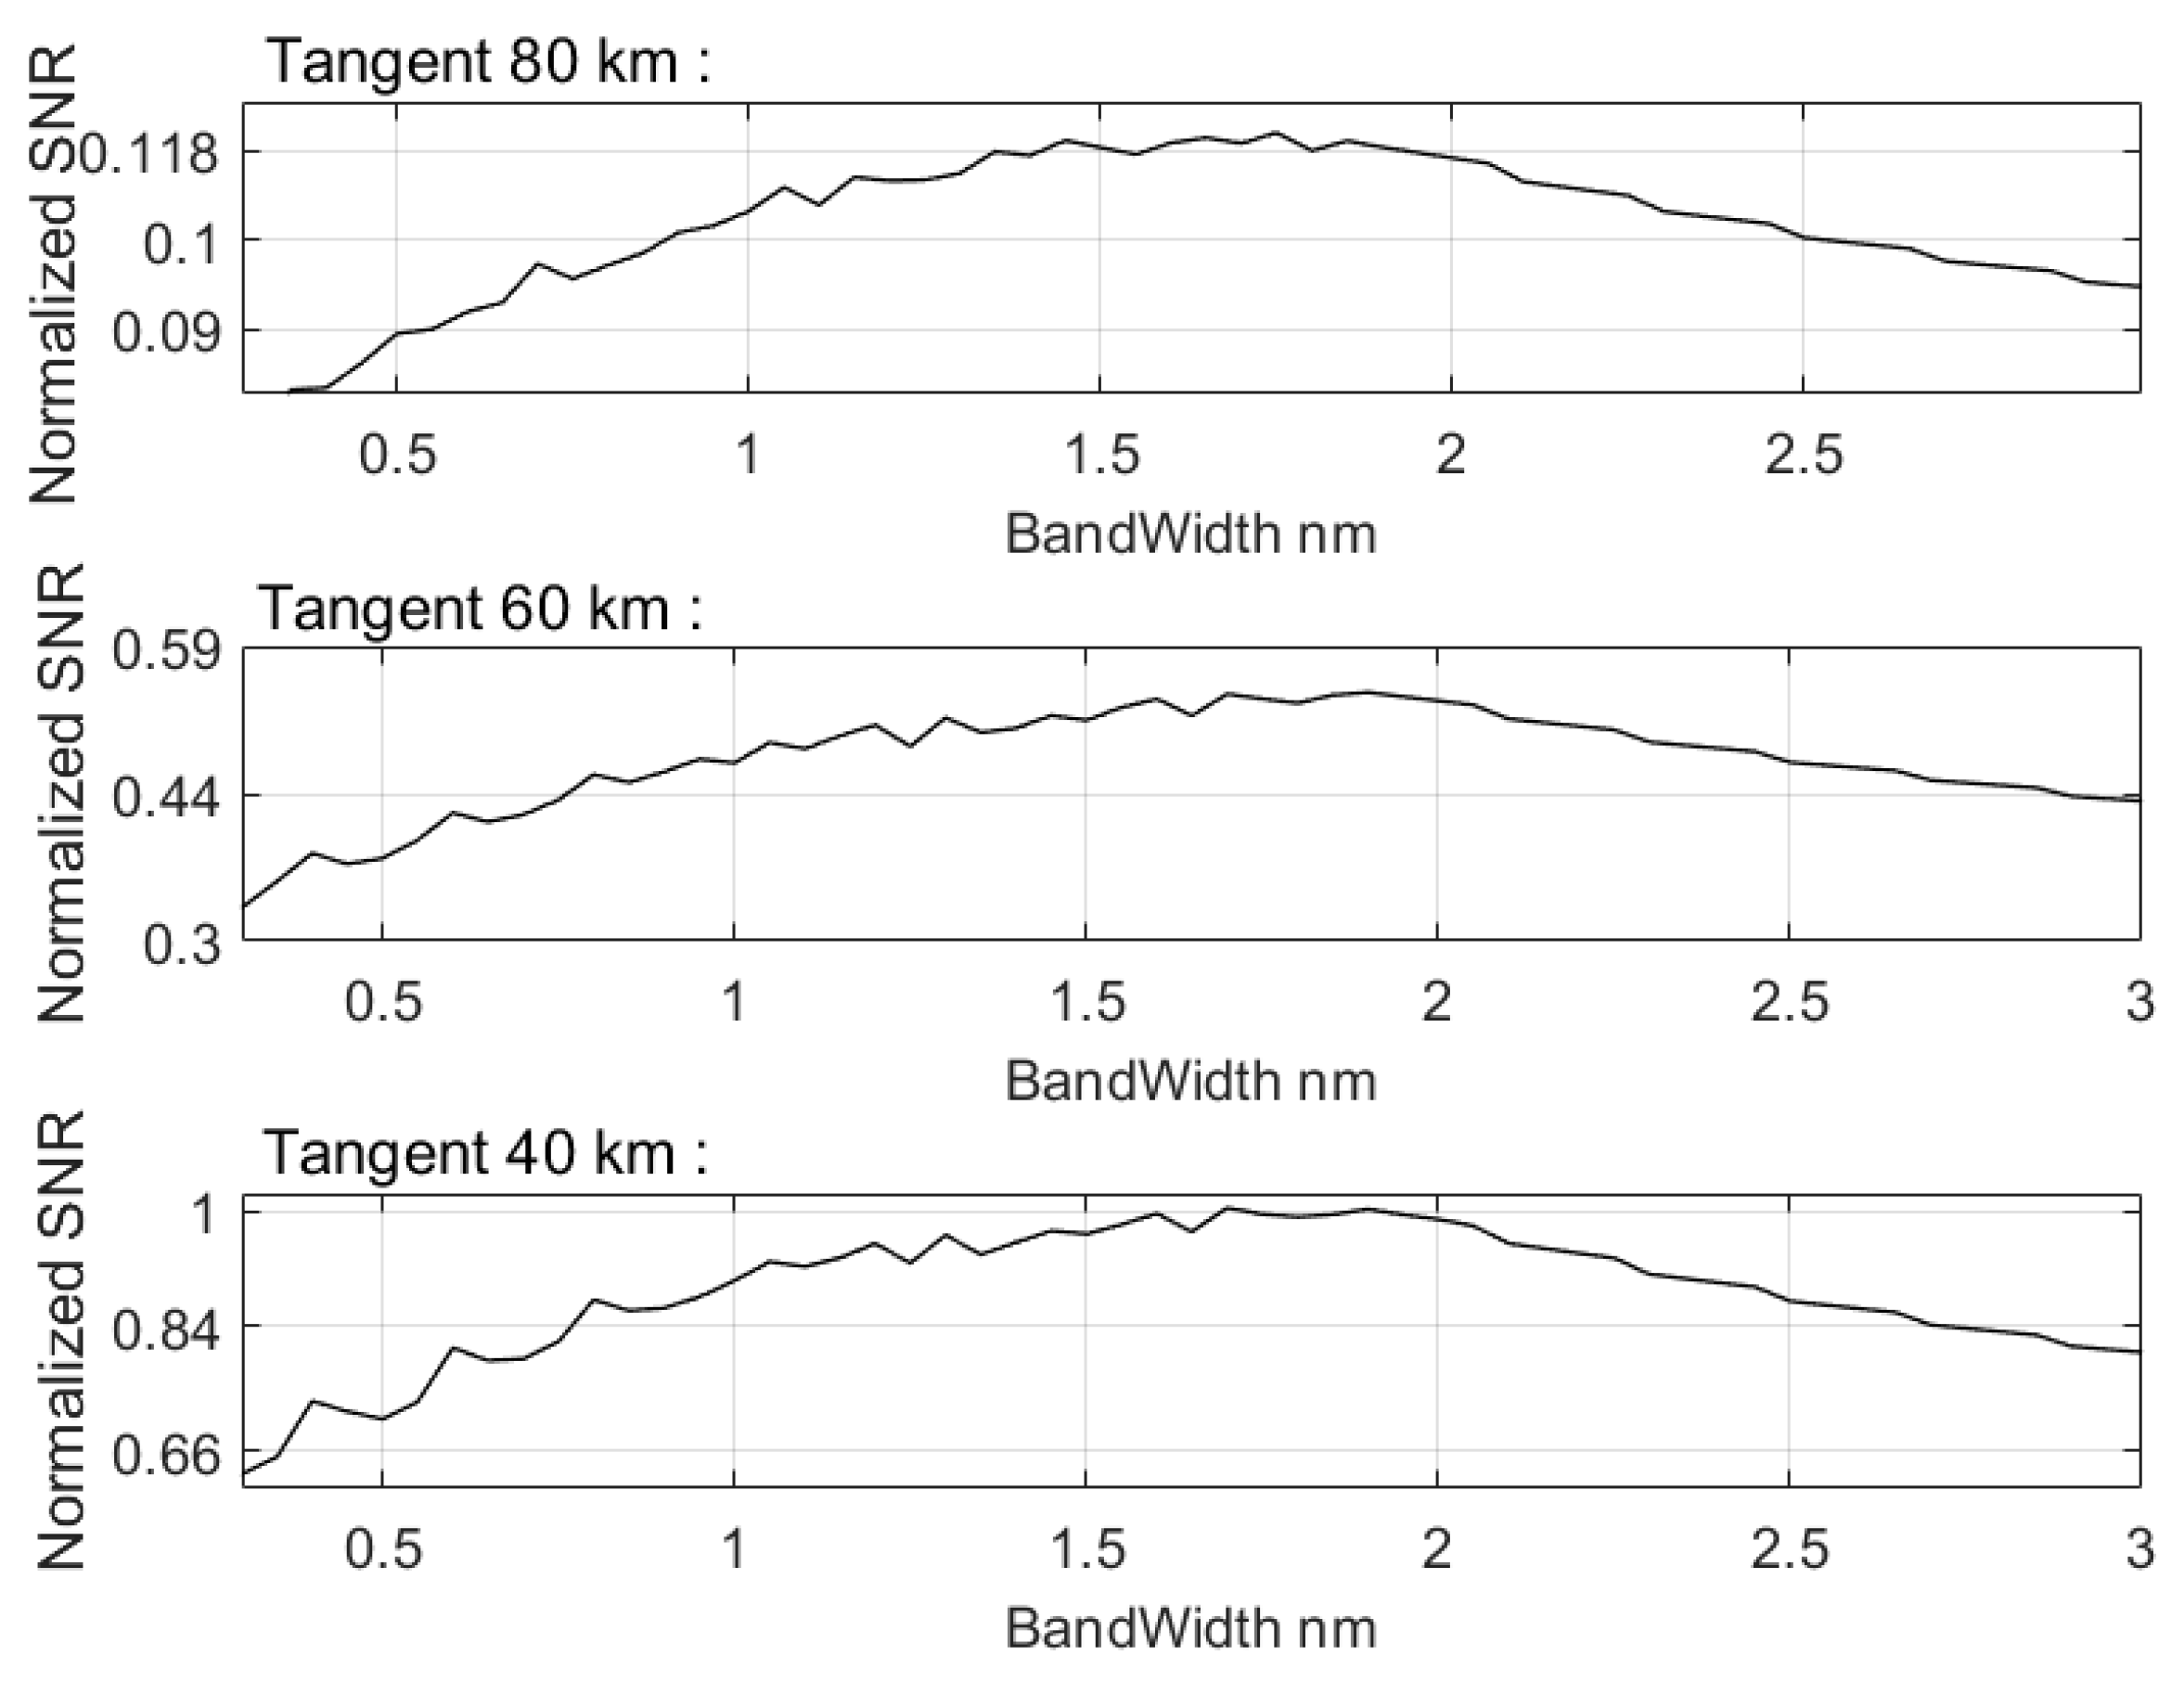
The forward results Tobs(λ) and Tabs(λ) of the typical spatiotemporal parameters are substituted into Formula (18). We traversed the bandwidth and central wavelength to calculate and record the highest signal-to-noise ratio achieved by different bandwidths. As can be seen from Figure 6, for detection at tangent heights between 40 and 80 km, the highest signal-to-noise ratio can be achieved when the bandwidth is between 1.5 and 2 nm.
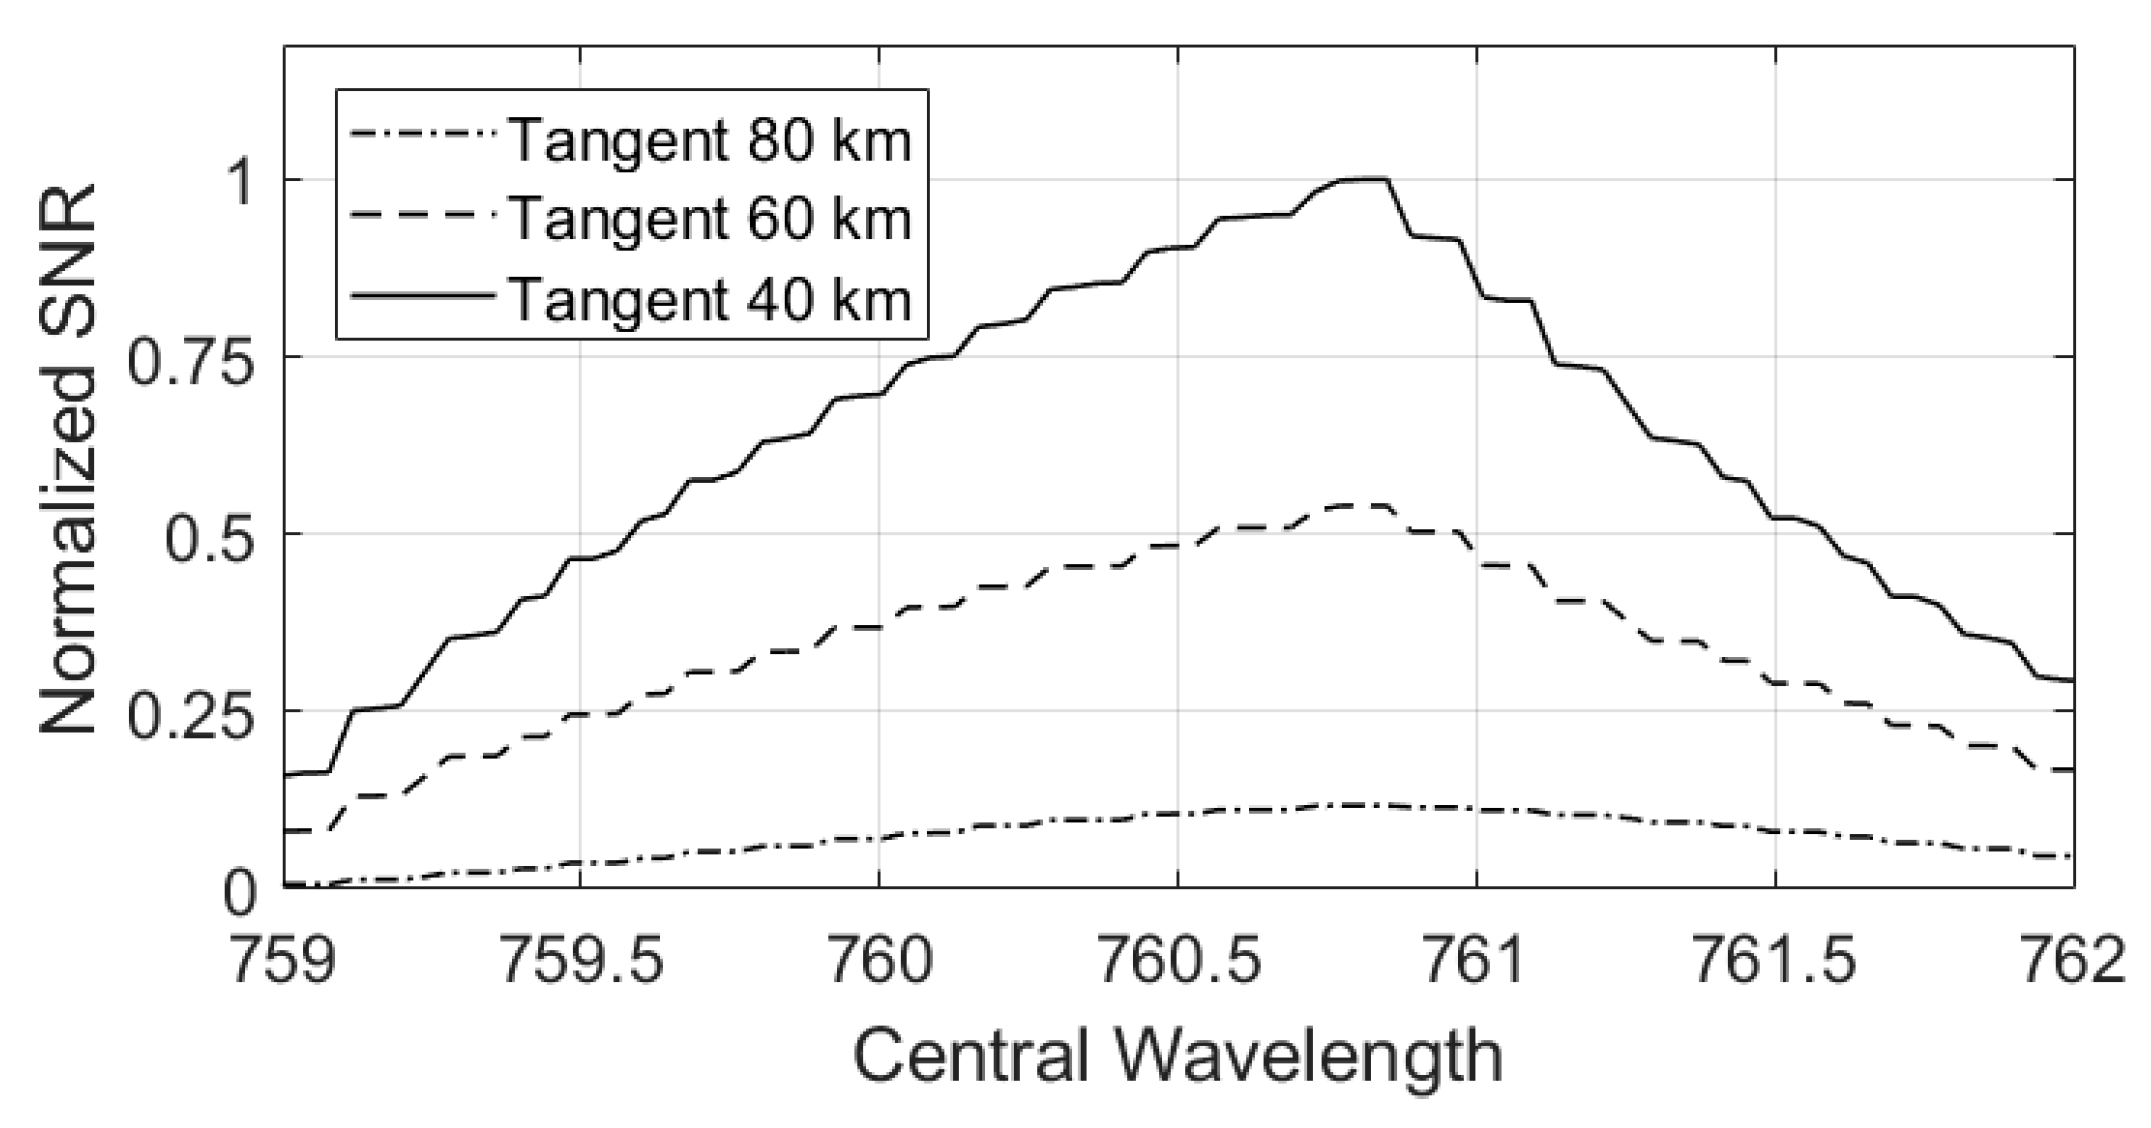
Considering the processing of filters and engineering practice, the bandwidth of the filter can be set to 2 nm. When the bandwidth is fixed at 2 nm, the highest signal-to-noise ratio can be achieved when the central wavelength is set to 760.8 nm, as shown in Figure 7:
In summary, the filter band for the measurement of oxygen absorption A-band should be set to 759.8~761.8 nm.
5. Signal-to-Noise Analysis
The brightness of the star and the size of the telescope are the key factors determining the signal-to-noise ratio of the detection. The brightness of the star detected on Earth is measured by apparent magnitude. The smaller the magnitude value, the brighter the star. The ratio of brightness between two stars with a difference of 1 magnitude is 2.512 times, and the conversion formula is as follows:
where M1 and M2 represent the apparent magnitude of star 1 and star 2, S1 and S2 represent the brightness of the two stars.
The brightest star in the sky is Sirius, which has an apparent magnitude of −1.46. The light flux density of Sirius at 760 nm is approximately 5.3 × 10⁻⁹ erg/cm2/s/A [17], which is equivalent to about 2 × 10⁴ photon/cm2/s/nm. According to the statistical results of the Hipparcos star catalog [18], there are a total of 48 stars with a magnitude of −1.46~2 in the sky, and their number and distribution are suitable as target light sources for the telescope. Since it is difficult to obtain the flux density data of all these stars, we use the flux density of Sirius as a reference and use the magnitude conversion Formula (19) to approximately convert the light flux density of the stars with magnitudes between −1.46 and 2 near 760 nm to analyze instrument performance.
The light from a star is partially absorbed by the atmosphere and enters the telescope of the instrument. After passing through the 2 nm filter, it hits the photoelectric device. For a star with an apparent magnitude of M, the electrical signal generated by photons in the λ1~λ2 band when observed at a tangent height of H can be calculated using the following formula:
Tobs(λ, z) is the forward results under typical atmospheric spatiotemporal parameters. E(λ) is the product of the instrument’s optical efficiency and the photoelectric device quantum efficiency, which is set as a constant 55%. A is the telescope lens area, T is the photoelectric device integral time set to 0.5 s, and FSi(λ) is the flux density of Sirius used as a reference. h is Planck’s constant 6.626 × 10⁻³⁴ J·s, and c is the speed of light 3 × 10⁸ m/s. After obtaining the electrical signal Ne, the signal-to-noise ratio can be calculated using the following formula:
z0 is the tangent height at which starlight is not absorbed by the atmosphere. Nread is the readout noise of the photoelectric device, with a typical value of 5 e− rms. Ndark is the dark current noise of the photoelectric device. Nowadays, devices can control dark current well under cooling conditions, so this term is ignored.
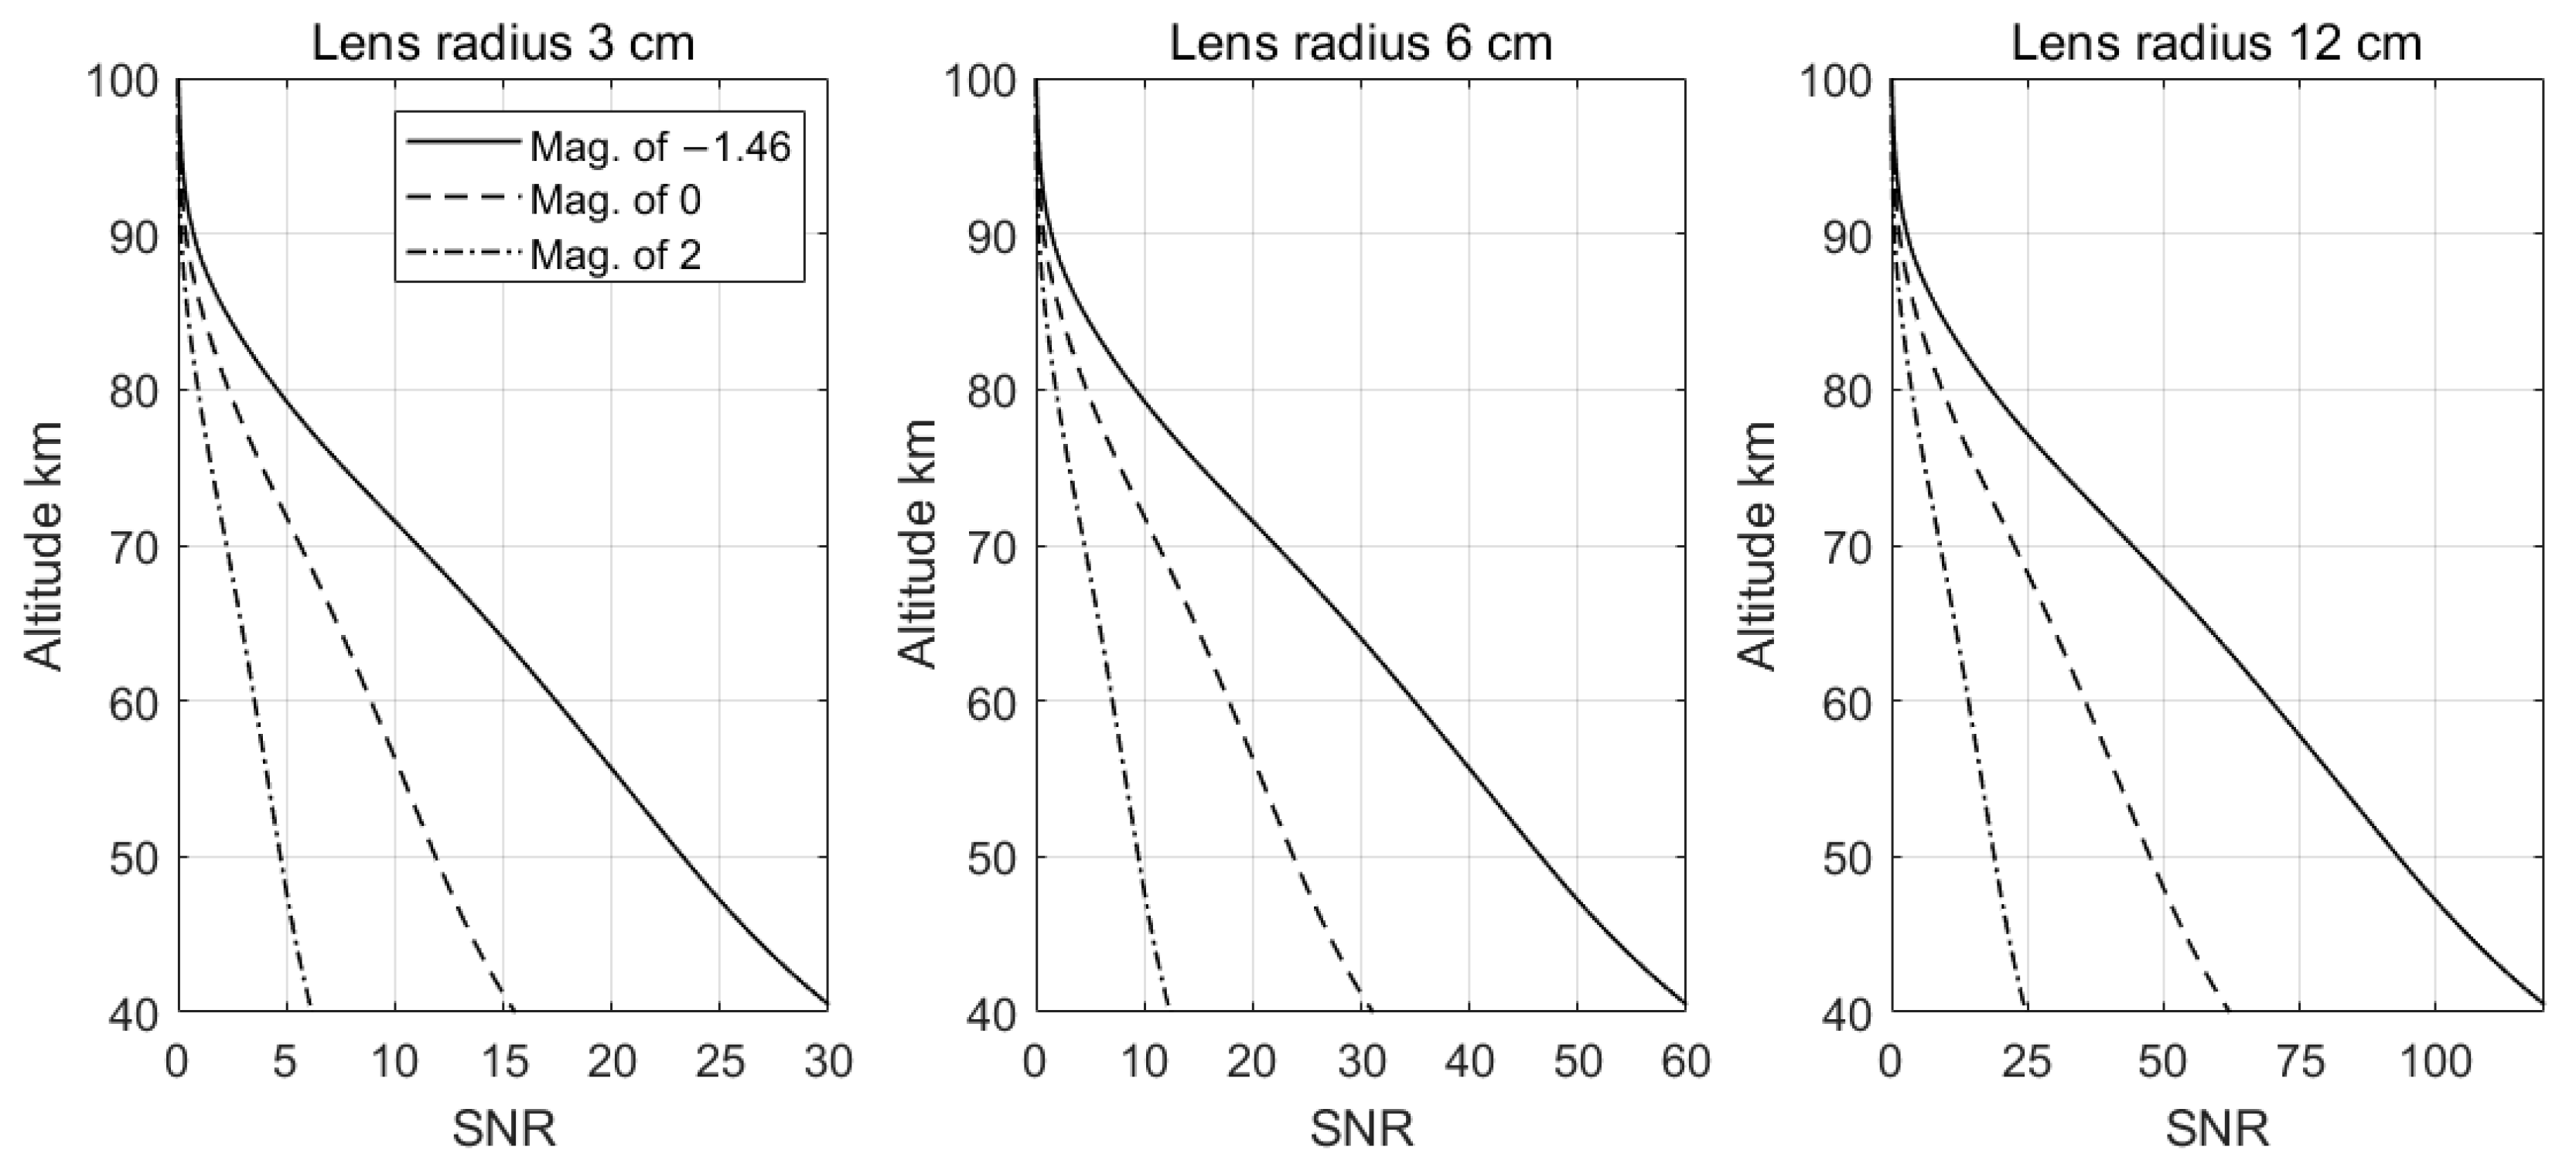
The telescope lens radius is set to 3 cm, 6 cm, and 12 cm, respectively, and the magnitude is set to −1.46, 0, and 2. The results are shown in Figure 8:
For observations at the same tangent height, the signal-to-noise ratio increases with the increase in lens radius and star magnitude. If the instrument is focused to detect oxygen density at high altitudes, such as at around 80 km, and the higher the number of target stars, the lens radius needs to be as large as possible to achieve a higher signal-to-noise ratio. For a tangent height of 80 km, a 6 cm radius lens can achieve a signal-to-noise ratio of 9 for observing Sirius and a signal-to-noise ratio greater than 1.8 for observing stars brighter than a magnitude of 2. A 12 cm radius lens can achieve a signal-to-noise ratio of 18 for observing Sirius and a signal-to-noise ratio greater than 3.7 for observing stars brighter than a magnitude of 2. For higher altitudes, a 12 cm radius lens only achieves a signal-to-noise ratio of 3.0 when observing Sirius at 90 km, and signal-to-noise ratios less than 0.1 when observing at 100 km.
By analyzing the relationship between magnitude and signal-to-noise ratio, we can select suitable target stars to achieve our detection performance requirements. As for the radius of the lens, it should be optimized based on the number of bright stars and optical design, according to the actual situation.
6. Conclusions
This paper establishes a stellar occultation full-link forward model according to the characteristics of occultation instruments with a bandpass filter. It is dedicated to the detection of oxygen density at altitudes of 40–80 km. The observation band of 759.8–761.8 nm is designed to achieve the highest signal-to-noise ratio. The transmission calculated by the forward model is compared with the actual data detected by GOMOS. The numerical values and trends of the two are quite consistent, indicating that the forward model is reasonable and reliable. Finally, the signal-to-noise ratio corresponding to different instrument parameters and target star magnitudes is analyzed. If high-altitude and multi-occultation detection is desired, the lens radius should be greater than 6 cm. The research results of this paper provide a theoretical basis and design guidance for the development of stellar occultation technology.
In future work, we will focus on establishing an oxygen-density retrieval model for the occultation technology, as well as perform signal simulation and error analysis.
Author Contributions
Conceptualization, Z.L. and C.T.; methodology, Z.L. and X.W.; software, Z.L., Y.Z. and J.Y.; validation, X.H. and Z.Y.; investigation, C.T.; funding acquisition, J.Y. All authors have read and agreed to the published version of the manuscript.
Funding
This research was funded by National Natural Science Foundation of China (Grant No. 41204137, 42174192, 11872128), the Pandeng Program of National Space Science Center, Chinese Academy of Sciences, and the Ministry’s and National Commission’s Scientific Research Project JK20211A020086.
Data Availability Statement
Not applicable.
Conflicts of Interest
The authors declare no conflict of interest.
References
- Wehr, T.; Paulsen, T.; Popescu, A.; Snoeij, P.; Fanton d’Andon, O.; Barrot, G. Calibration and first results of stellar occultation measurements with GOMOS on Envisat. C. Geoscience and Remote Sensing Symposium. In Proceedings of the IGARSS ’02. 2002 IEEE International, Toronto, ON, Canada, 24–28 June 2002. [Google Scholar]
- Hays, P.B.; Roble, R.G. Stellar spectra and atmospheric composition. J. Atmos. Sci. 1968, 25, 1141–1153. [Google Scholar] [CrossRef]
- Hays, P.B.; Roble, R.G. Stellar occultation measurements of molecular oxygen in the lower thermosphere. J. Planet. Space Sci. 1973, 21, 339–348. [Google Scholar] [CrossRef] [Green Version]
- Kyrölä, E.; Tamminen, J.; Leppelmeier, G.W.; Sofieva, V.; Hassinen, S.; Bertaux, J.L.; Hauchecorne, A.; Dalaudier, F.; Cot, C.; Korablev, O.; et al. GOMOS on Envisat: An overview. Adv. Space Res. 2004, 33, 1020–1028. [Google Scholar] [CrossRef]
- Anderson, G.P.; Clough, S.A.; Kneizys, F.X.; Chetwynd, J.H.; Shettle, E.P. AFGL Atmospheric Constituent Profiles (0–120 km). Environmental Research Papers. 1986. Available online: https://www.researchgate.net/profile/Eric-Shettle/publication/235054307_AFGL_Atmospheric_Constituent_Profiles_0120km/links/00b7d5261849c835c1000000/AFGL-Atmospheric-Constituent-Profiles-0120km.pdf (accessed on 20 May 2023).
- Lumpe, J.D.; Bevilacqua, R.M.; Hoppel, K.W.; Krigman, S.S.; Kriebel, D.L.; Debrestian, D.J.; Randall, C.E.; Rusch, D.W.; Brogniez, C.; Ramananahérisoa, R.; et al. POAM II retrieval algorithm and error analysis. J. Geophys. Res. Atmos. 1997, 102, 23593–23614. [Google Scholar] [CrossRef]
- Lucke, R.L.; Korwan, D.R.; Bevilacqua, R.M.; Hornstein, J.S.; Shettle, E.P.; Chen, D.T.; Daehler, M.; Lumpe, J.D.; Fromm, M.D.; Debrestian, D.; et al. The Polar Ozone and Aerosol Measurement (POAM) III instrument and early validation results. J. Geophys. Res. Atmos. 1999, 104, 18785–18799. [Google Scholar] [CrossRef]
- Sugita, T.; Yokota, T.; Nakajima, T.; Nakajima, H.; Waragai, K.; Suzuki, M.; Matsuzaki, A.; Itou, Y.; Saeki, H.; Sasano, Y. Temperature and pressure retrievals from O2 A-band absorption measurements made by ILAS: Retrieval algorithm and error analyses. In Proceedings of the SPIE—The International Society for Optical Engineering, Sendai, Japan, 9–12 October 2000; Volume 4150. [Google Scholar] [CrossRef]
- Nowlan, C.R.; McElroy, C.T.; Drummond, J.R. Measurements of the O2 A- and B- bands for determining temperature and pressure profiles from ACE–MAESTRO: Forward model and retrieval algorithm. J. Quant. Spectrosc. Radiat. Transfer. 2007, 108, 371–388. [Google Scholar] [CrossRef]
- Zhang, S.M.; Wu, X.-C.; Sun, M.-C.; Hu, X.; Gong, X.-Y. Using Onion-Peeling Method to Inverse Ozone Density Based on the Stellar Occultation Technology in the Near Space Region. J. Spectrosc. Spectr. Anal. 2022, 42, 203–209. [Google Scholar]
- Rothman, L.S.; Jacquemart, D.; Barbe, A. The HITRAN 2004 molecular spectroscopic database. J. Quant. Spectrosc. Radiat. Transfer. 2005, 96, 139–204. [Google Scholar] [CrossRef] [Green Version]
- Zhang, H.; Shi, G.Y. A fast and efficient line-by-line calculation method for atmospheric absorption. J. Sci. Atmos. Sin. 2000, 24, 111–121. [Google Scholar]
- Sneep, M.; Ubachs, W. Direct measurement of the Rayleigh scattering cross section in various gases. J. Quant. Spectrosc. Radiat. Transf. 2005, 92, 293–310. [Google Scholar] [CrossRef]
- Zhu, Q.; Sun, M.; Dong, X.; Zhu, P. Design and Simulation of Stellar Occultation Infrared Band Constellation. Remote Sens. 2022, 14, 3327. [Google Scholar] [CrossRef]
- Beyerle, G.; Gorbunov, M.E.; Ao, C.O. Simulation studies of GPS radio occultation measurements. Radio Sci. 2016, 38, 5-1–5-16. [Google Scholar] [CrossRef] [Green Version]
- Dalaudier, F.; Kan, V.; Gurvich, A.S. Chromatic refraction with global ozone monitoring by occultation of stars. I. Description and scintillation correction. Appl. Opt. 2001, 40, 866–877. [Google Scholar] [CrossRef] [PubMed]
- Krisciunas, K.; Suntzeff, N.B.; Kelarek, B.; Bonar, K.; Stenzel, J. Spectrophotometry of Very Bright Stars in the Southern Sky. Publ. Astron. Soc. Pac. 2017, 129, 054504. [Google Scholar] [CrossRef] [Green Version]
- Protte, P.; Hoffmann, S.M. Accuracy of magnitudes in pre-telescopic star catalogs. Astron. Nachrichten 2020, 341, 827–840. [Google Scholar] [CrossRef]
Figure 1.
Scheme of a stellar occultation event.

Figure 2.
O2 spectral-line intensity data by HITRAN 2004 (T = 296 K).

Figure 3.
O2 absorption cross-section (T = 296 K).

Figure 4.
The transmission varies with wavelength.

Figure 5.
Average transmission results of GOMOS and forward model in 759.8–761.8 nm.

Figure 6.
The relationship between bandwidth and max SNR.

Figure 7.
The relationship between central wavelength and SNR when bandwidth is set to 2 nm.

Figure 8.
The relationship between SNR and lens radius, apparent magnitude, tangent height.

Disclaimer/Publisher’s Note: The statements, opinions and data contained in all publications are solely those of the individual author(s) and contributor(s) and not of MDPI and/or the editor(s). MDPI and/or the editor(s) disclaim responsibility for any injury to people or property resulting from any ideas, methods, instructions or products referred to in the content. |
© 2023 by the authors. Licensee MDPI, Basel, Switzerland. This article is an open access article distributed under the terms and conditions of the Creative Commons Attribution (CC BY) license (https://creativecommons.org/licenses/by/4.0/).
Share and Cite
MDPI and ACS Style
Li, Z.; Wu, X.; Tu, C.; Hu, X.; Yan, Z.; Yang, J.; Zhang, Y. Research on Stellar Occultation Detection with Bandpass Filtering for Oxygen Density Retrieval. Remote Sens. 2023, 15, 3681. https://doi.org/10.3390/rs15143681
AMA Style
Li Z, Wu X, Tu C, Hu X, Yan Z, Yang J, Zhang Y. Research on Stellar Occultation Detection with Bandpass Filtering for Oxygen Density Retrieval. Remote Sensing. 2023; 15(14):3681. https://doi.org/10.3390/rs15143681
Chicago/Turabian StyleLi, Zheng, Xiaocheng Wu, Cui Tu, Xiong Hu, Zhaoai Yan, Junfeng Yang, and Yanan Zhang. 2023. "Research on Stellar Occultation Detection with Bandpass Filtering for Oxygen Density Retrieval" Remote Sensing 15, no. 14: 3681. https://doi.org/10.3390/rs15143681
Note that from the first issue of 2016, this journal uses article numbers instead of page numbers. See further details here.