Article

Evolution Patterns of Cooling Island Effect in Blue–Green Space under Different Shared Socioeconomic Pathways Scenarios

1
College of Geography and Environment and Science, Henan University, Kaifeng 475000, China
2
Key Laboratory of Geospatial Technology for the Middle and Lower Yellow River Regions, Henan University, Kaifeng 475000, China
3
State Key Laboratory of Grassland and Agro-Ecosystems, International Centre for Tibetan Plateau Ecosystem Management, College of Ecology, Lanzhou University, Lanzhou 730000, China
4
College of Forestry, Guizhou University, Guiyang 550025, China
*
Author to whom correspondence should be addressed.
These authors contributed equally to this work.
Remote Sens. 2023, 15(14), 3642; https://doi.org/10.3390/rs15143642
Submission received: 28 May 2023 / Revised: 4 July 2023 / Accepted: 18 July 2023 / Published: 21 July 2023
(This article belongs to the Special Issue Advances in Thermal Infrared Remote Sensing)

Abstract

:
Blue–green space refers to blue space (rivers and lakes) and green space (lawns and trees), which have the cooling island effect and are increasingly acknowledged as a potential and effective way to help alleviate the urban heat island effect. Scientific and flexible blue–green space planning is required, especially for medium- and large-scale urban agglomerations in the face of climate change. However, the temporal evolution and spatial patterns of the cooling island effect in the blue–green space under different future scenarios of climate change have not been fully investigated. This would impede long-term urban strategies for climate change adaptation and resilience. Here we studied the relationship between future climate change and blue–green spatial layout with Weather Research and Forecasting (WRF), based on the numerical simulation data of 15 global climate models under different extreme Shared Socioeconomic Pathway (SSP) scenarios. As a result, future changes in urban cooling island (UCI) magnitudes were estimated between historical (2015–2020) and future timelines: 2030s (2021–2040), 2050s (2041–2060), 2070s (2061–2080), and 2090s (2081–2100). Our results showed different land use types in blue and green space across the study area were predicted to present various changes in the next 80 years, with forest, grassland, and arable land experiencing the most significant land use transfer. The future UCI intensity of cities under SPP5-8.5 (12) was found to be lower than that under SPP2-4.5 (15), indicating that cities may be expected to experience decreases in UCI magnitudes in the future under SSP5-8.5. When there is no expansion of urban development land, we found that the conversion of different land use types into blue and green space leads to little change in future UCI intensity. While the area growth of forests and water bodies is proportional to the increase in UCI, the increase of farmland was observed to have the most significant impact on reducing the amplitude of urban UCI. Given that Huai’an City, Yancheng City, and Yangzhou City have abundant blue–green space, the urban cooling island effect was projected to be more significant than that of other cities in the study area under different SSP scenarios. The simulation results of the WRF model indicate that optimizing the layout of urban blue–green space plays an important role in modulating the urban thermal environment.

1. Introduction

The heat island effect in urban areas can significantly intensify and amplify the impacts of climate change, causing high temperatures, heat waves, etc. [1,2,3,4,5,6,7,8,9]. With the acceleration of the global urbanization process, the scope and degree of the Urban Heat Island (UHI) effect will be further aggravated in the future. Alleviating the UHI effect has thus become an urgent environmental task for human survival and development in the 21st century [10,11]. To tackle the issues posed by the UHI phenomenon, the incorporation of vegetation and water elements in urban areas has been recommended. Blue–green spaces refer to urban environments that integrate natural features like rivers and lakes (blue elements) with green elements such as lawns and trees. This approach is increasingly acknowledged as a practical and effective strategy for alleviating excessive heat accumulation and ameliorating the UHI effect [5,8,10,12,13]. Therefore, the Urban Cooling Island (UCI), commonly referred to as the difference between urban blue–green space and development land temperatures, has attracted more attention in recent years [5,8,13].
Research showed that the UCI effect is jointly controlled by meteorological conditions, urban spatial morphology, underlying surface characteristics, and anthropogenic heat emission [14,15,16]. Urban spatial configuration pertains to the structural attributes of urban elements and their spatial and vertical relationships. While previous research has focused extensively on meteorological conditions and characteristics of urban surfaces, there has been a significant oversight regarding urban spatial morphology, which, in fact, plays a crucial role in the formation and evolution of the UCI effect [10,13,17]. So far, pronounced UCI effect phenomena can be found in many metropolitan cities around the world [5,18,19,20,21,22], accurate evaluation and future prediction of which become essential for long-term city development.
The IPCC has predicted a series of scenarios describing possible future climate conditions, which have been widely used in different fields of climate science, energy, agriculture, water management, and public health, among others [23]. The setting of the Shared Socioeconomic Pathway (SSP) scenarios is grounded in the current situation and development plans of countries and regions, with the aim of producing socio-economic development scenarios that are context-specific in the future [24,25,26,27,28,29]. Before estimating future urban temperatures, the Global Climate Model (GCM) simulation under Shared Socioeconomic Pathways (SSPs) needed to be scaled down to a finer resolution to provide accurate and localized projections. The dynamic downscaling methods have been commonly used to explore future urban-rural temperature differences [30,31,32,33,34]. However, previous studies using such a method only focused on representative Global Climate Model (GCM) projections and selected cities for projecting UHI effects instead of UCI [35,36,37]. For example, the frequency distributions of daily minimum (Tmin) and maximum (Tmax) temperatures for urban and rural stations were detected by statistical analysis, which found a more pronounced effect observed during summer than in other seasons [30]. Further, a physical scaling and downscaling model was used to estimate future changes in SUHI magnitudes at 20 Canadian cities, which showed the urban environment of the future may be more uncomfortable than surrounding areas due to its higher heat storage and lower evaporative cooling [31].
Although strategies such as increasing green cover or water bodies have been proposed to mitigate the UHI effect, there is a need to investigate their current efficiency and performance, especially their future projection of changes under different climate contexts. Specifically, it is necessary to establish a strong linkage and seamless integration between the projected future temperature and the characteristics of blue–green spaces (such as their size, structure, layout, etc.) to accurately assess the quantitative changes in the future UCI effect. The sixth phase of the new round of international coupled model comparison program provides rich and authoritative global climate model data for the field of climate change prediction. The SSPs’ scientific scenarios combine various processes (e.g., radiation forcing, socio-economic development, energy and land use change, greenhouse gas emissions, etc.) to analyze the relationship between socio-economic development and climate change response capacity. Thus, these SSP scenarios provide important data and a theoretical basis for assessing the impact and risk of climate change. In this study, we selected 15 kinds of CMIP6 global model data, including two combined scenarios (SSP2-4.5 and SSP5-8.5), to analyze the spatial-temporal evolution of the maximum temperature, average temperature, and minimum temperature in summer in the Northern subtropical zone from 2021 to 2100. Under different future SSP scenarios (Figure 1), we had the following aims: (i) The objective is to examine the spatiotemporal patterns of future temperature in the study area through simulations using Global Climate Models (GCM). This involves analyzing how temperature changes across different locations and time periods in the future based on the outputs of the GCM models. The focus is on understanding the distribution and variations of temperature over the study area under various future climate scenarios; (ii) The aim is to quantify the disparities in the UCI effect between two extreme future scenarios outlined in the Shared Socioeconomic Pathways (SSPs). Specifically, the goal is to assess and compare the impact of blue–green spaces (such as parks, green roofs, and water bodies) on mitigating the UCI effect in these scenarios. This entails measuring and analyzing the contrasting effects of blue–green spaces in reducing heat buildup and regulating local temperatures in the face of different future socio-economic and climate conditions; (iii) The objective is to evaluate the existing UCI conditions in the designed blue–green spaces within cities. This evaluation involves assessing the current effectiveness of these spaces in mitigating UHI effects, which refer to the phenomenon of higher temperatures in urban areas compared to surrounding rural areas. Additionally, the aim is to suggest the future potential of these blue–green spaces in further mitigating UHI effects amidst climate change. This assessment may include examining factors such as the design, location, and scale of the blue–green spaces, as well as their ability to provide cooling benefits and improve microclimate conditions within urban environments.

2. Data and Methodology

2.1. Study Area

The northern boundary of the northern subtropical zone, which corresponds to the 0 °C isotherm of the average temperature in the coldest month of January, is a well-known north–south boundary in China’s physical geography. The temperature zone boundary exhibits a significant trend of shifting toward higher latitudes due to global change. The spatial distribution of the northern subtropical zone is particularly sensitive to global warming. To understand the potential impact of climate change on natural landscapes, it is essential to have a thorough understanding of the characteristics of spatial variation in urban ecology.
Since October 2018, the Huaihe River Ecological Economic Belt has been elevated as a part of a national strategy. The Eastern Sea-River-Stream-Lake Linkage Zone (ESLZ), which is part of the northern subtropical zone and includes Huai’an, Yancheng, Yangzhou, Taizhou, and Chuzhou, boasts natural location advantages (Figure 2). Except for Huai’an, the other four cities belong to the ESLZ’s world-class urban agglomeration, the Yangtze River Delta. The Yangtze River Delta is China’s fastest-growing economic region and has developed into one of the six greatest urban agglomerations globally, with particularly pronounced summer heat island effects. The ESLZ, driven by the development of world-class urban agglomerations, is unavoidably impacted by the growing UHI effect, becoming a typical area affected by the urbanization process and rapid urbanization in China. Being near the sea, the ESLZ has abundant water and green spaces that provide favorable conditions for studying the cooling island effect of blue–green space.

2.2. Datasets

2.2.1. Urban Land Use Data

The global urban land use data is the first global dataset based on Shared Socioeconomic Pathways and Representative Concentration Pathways. The SSP-RCP scenario’s 1 km resolution future global urban land use prediction product (2015–2100) (available at www.geosimulation.cn, accessed on 20 May 2020) has a good spatial resolution, preserves spatial details, and avoids distortion of the global urban land use pattern. Relevant achievements have been published in Nature Communications [38]. The future urban land expansion simulation adopts the flus model, which uses machine learning methods to capture the complex relationship between urban land expansion and its driving factors. The model also adopts the Cellular Automata mechanism, reflecting the complexity of path dependence and positive feedback in the real process of urban land expansion.

2.2.2. Climate Model Dataset

The SSPs are an essential component of the new generation of climate change scenarios. The introduction of SSPs has increasingly played a prominent role in facilitating climate change predictions and impact research and supporting climate policy decisions. Unlike most previous studies, this study selects 15 simulation results from Global Climate Models (GCMs) to avoid the uncertainty of single-mode climate data. Assuming that all models are independent of each other and given equal weight, the multi-model ensemble average method is used to process the 15 GCM climate data (as shown in Table 1), thereby enhancing the reliability of the predictive outcomes. In addition to the information provided, the downscaled monthly future climate data obtained from the CMIP6 is available in GeoTiff format. These files contain data at a spatial resolution of 30 s, which corresponds to approximately 1 km resolution at the equator. The downscaled climate data covers a range of time periods, including 2021–2040, 2041–2060, 2061–2080, and 2081–2100. This temporal coverage allows for the examination of climate projections over several decades, and the downscaled climate data includes information from 15 different GCMs, representing various modeling approaches and assumptions.

2.3. Data Processing

2.3.1. Climate Model Data Assessment

SSP2-4.5 belongs to a moderate radiative forcing scenario, and its radiative forcing stabilized at 4.5 w/m2 in 2100. This scenario is often used as a reference for CMIP6, such as regional downscaling and interdecadal climate prediction in the collaborative regional climate downscaling program. In addition, since the land use and aerosol path of SSP2 are not extreme, it only represents a scenario combining moderate social vulnerability and moderate radiative forcing. The reason for choosing the SSP2-4.5 stable scenario is that it is consistent with the purpose of energy conservation and emission reduction in China’s future development model and China’s sustainable development goals. SSP5-8.5 is a high forcing scenario. The reason for choosing SSP5-8.5 is that SSP5 is the only path that can achieve emissions as high as 8.5 w/m2 in 2100.
In order to reduce the uncertainty of single-mode climate data, this study selected 15 sets of GCM simulation results. Assuming that the models are independent of each other and given equal weights, the multi-model ensemble average method was adopted to process 15 sets of GCM climate data in order to increase the reliability of the prediction results. Previous studies have shown that the simulation accuracy of the multi-model average method for global and regional-scale future climate is generally better than that of a single mode [39,40].
For this study, temperature variables such as maximum temperature, average temperature, and minimum temperature were selected under two extreme representative scenarios, SSP2-4.5 and SSP5-8.5. GCM data were divided into five periods: historical periods, 2020s (2015–2020), 2030s (2021–2040), 2050s (2041–2060), 2070s (2061–2080), and 2090s (2081–2100). Based on the ground observation data from 2015 to 2020, the climate model data quality under the SSP2-4.5 scenario for the same period was verified (Table 2). The results show that the maximum air temperature, average air temperature, and minimum air temperature in the future summer were in good agreement with the ground observation data for the same period. This indicates that the ensemble mean method has high precision in calculating the climate model data under future SSP scenarios and can be used for future urban climate change research.

2.3.2. WRF Driving Field Reanalysis Data

Coupling the urban canopy model (UCM) with the Weather Research and Forecasting (WRF) model is a common approach used to simulate the intricate physical processes associated with heat, momentum, and atmospheric water exchange in complex mesoscale urban environments. The integration of coupled models enhances the parameterization of lower boundary conditions, ensuring the provision of dependable and precise simulations of the urban climate for the specific study area. The fundamental principle behind the coupled model is to enhance the parameterization of lower boundary conditions, aiming to deliver dependable and precise simulations of UCI specific to the study area. The WRF/UCM model, as a single-layer mesoscale model, incorporates a comprehensive representation of a generalized urban geometric environment. This includes considerations such as building shadows, reflections of short- and long-wave radiation, canopy wind profiles, as well as multi-layer heat transfer equations for roofs, walls, and pavements [41,42]. The WRF/UCM model, being a single-layer model, has the capability to replicate the urban blue–green space, encompassing a wide range of urban structures and geometries. This leads to enhanced horizontal weather prediction accuracy and improved boundary conditions for simulations [43,44,45,46,47,48,49,50]. Over the last twenty years, the ESLZ has undergone rapid and uncontrolled urbanization, resulting in the conversion of numerous vacant land parcels into developed, built-up areas. Accurate evaluation and future prediction of UCI effects have become imperative for the sustainable long-term development of cities. The Final Operational Global Analysis (FNL) is a dataset provided by NCEP (http://rda.ucar.edu/datasets, accessed on 3 July 2023) that comes from the Global Data Assimilation System (GDAS), integrating ground observation data and satellite remote sensing inversion data. The dataset has a horizontal resolution of 1° × 1° and is available 4 times a day (0000UTC, 0600UTC, 1200UTC, and 1800UTC) from July 1999 to the present. It contains a total of 51 layers from 1000 hPa to 10 hPa in the vertical direction. The simulation area is centered at 33°N and 120°E and consists of 3 layers of bidirectional nesting with 537 × 402, 693 × 495 and 936 × 792 grid points that are located in the east-west and north-south orientations, correspondingly (Figure 2). The horizontal resolutions of the first (outermost), second, and third (innermost) multi-grids are 9 km, 3 km, and 1 km, respectively. There are 51 layers in the vertical direction, and the model top layer pressure is 50 hPa. The integration time of all experiments is from 02:00 on 4 August 2018 to 02:00 on 6 August 2018, and the simulation results are outputted every hour. In addition, 02:00–24:00 on 4 August 2018 is the adjustment stage of the model, without analysis [51,52,53]. 5 August 2018 is model analysis time (Table 3).

3. Results

3.1. Spatial Changes in Blue and Green Space under Different SSP Scenarios

Under the SSP2-4.5 stable development scenario and the SSP5-8.5 high forcing scenario, significant changes are expected in different land use types in the blue–green space of the ESLZ over the next 80 years, as shown in Figure 3 and Figure 4 and Table 4 and Table 5. Specifically, under the SSP2-4.5 scenario, the forest and grassland areas are expected to decrease at a faster rate, with the total area decreasing by 0.17 × 10³ km2 and 3.81 × 10³ km2 by the 2070s. The arable land area increased at a steady rate and reached its maximum in the 2070s, with an increase of 3.66%. Since 2020, the water area has increased at a relatively constant rate, reaching 2.89 × 10³ km2 in the 2050s, but it will not increase further in the subsequent period. Moreover, under the high forcing scenario of SSP5-8.5, the changes in blue–green space area are similar to those under the stable development scenario of SSP2-4.5. However, the forest area decreased faster, by 0.23 × 10³ km2 in the 2070s, while the grassland area decreased at a slower rate, only by 3.35 × 10³ km2 in the same period. The growth rate of arable land area was even slower, increasing by 3.14 × 10³ km2 in the 2070s. The water area increased to 3.03 × 10³ km2 in the 2050s and will not increase in the period after that. Overall, during the period of 2020 to 2080, the arable land area and grassland area can decrease greatly, while the arable land area can increase greatly. The overall area remained basically unchanged after the 2070s. The urban development land area has not changed since 2020, and the total area remains at 4.07 × 10³ km2. Therefore, forest, grassland, and arable land are the most significant land use transfer patterns in the blue–green space of the ESLZ.

3.2. Rates of Change in Temperature

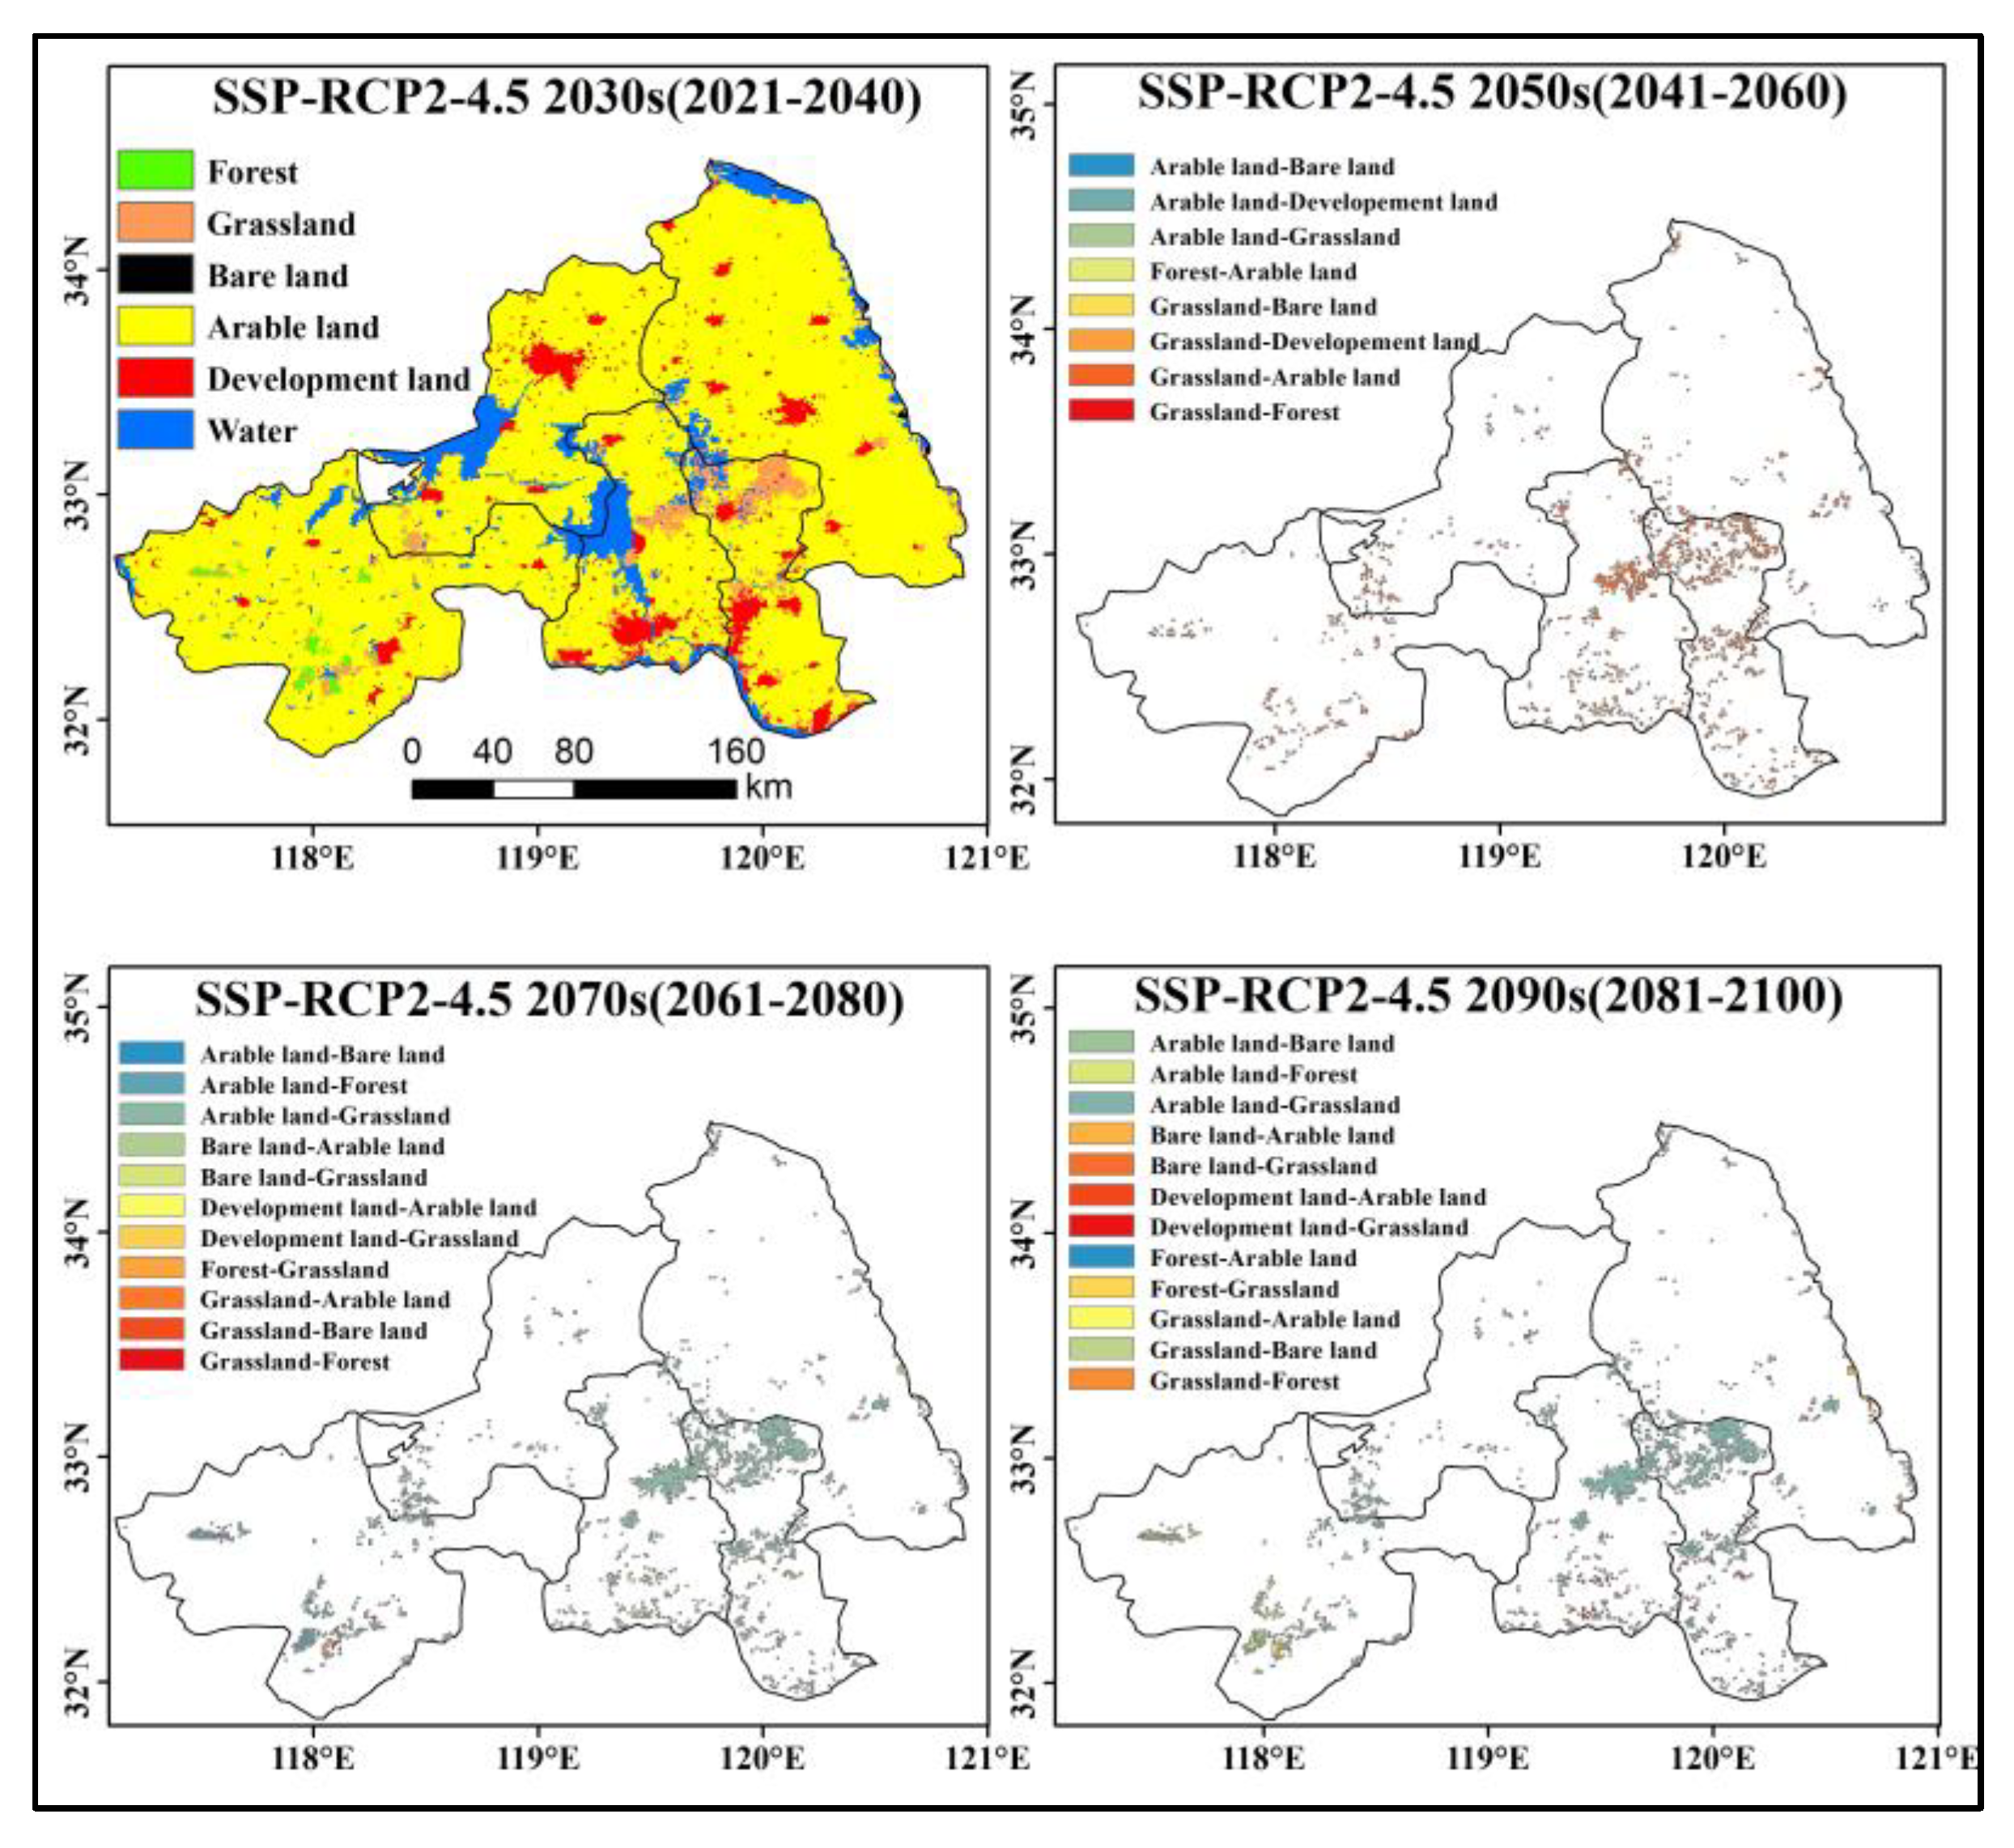
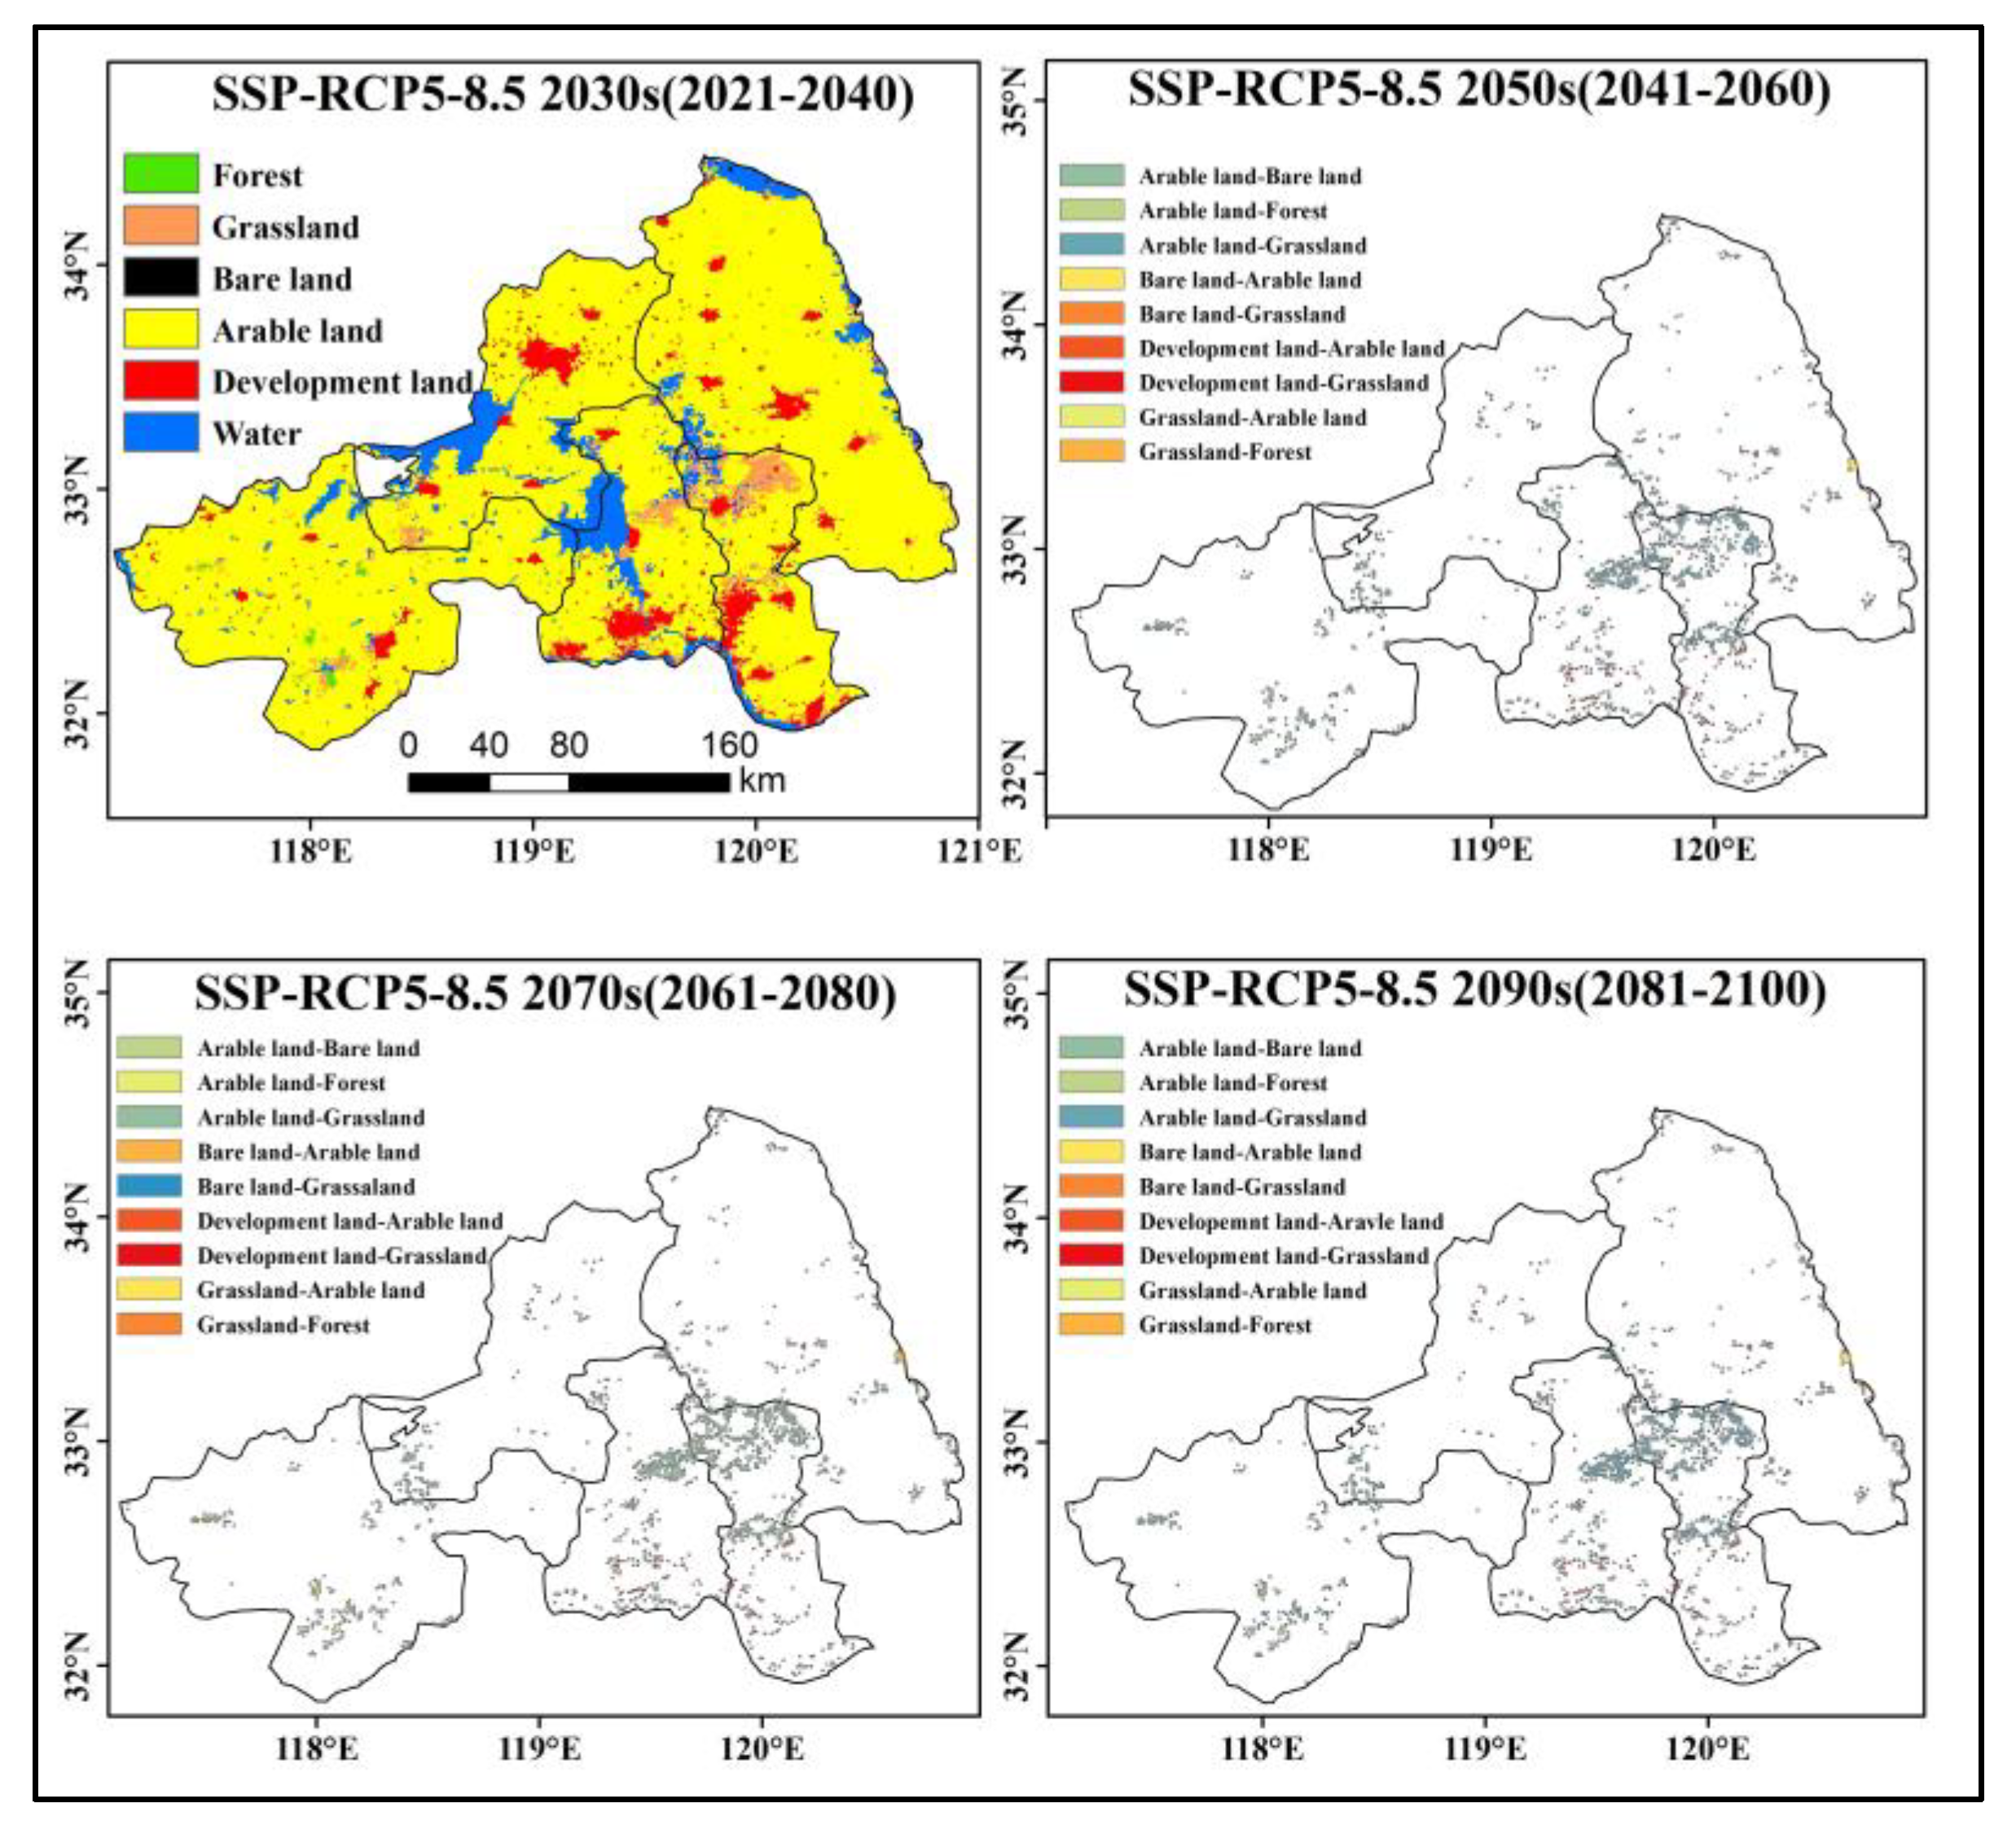
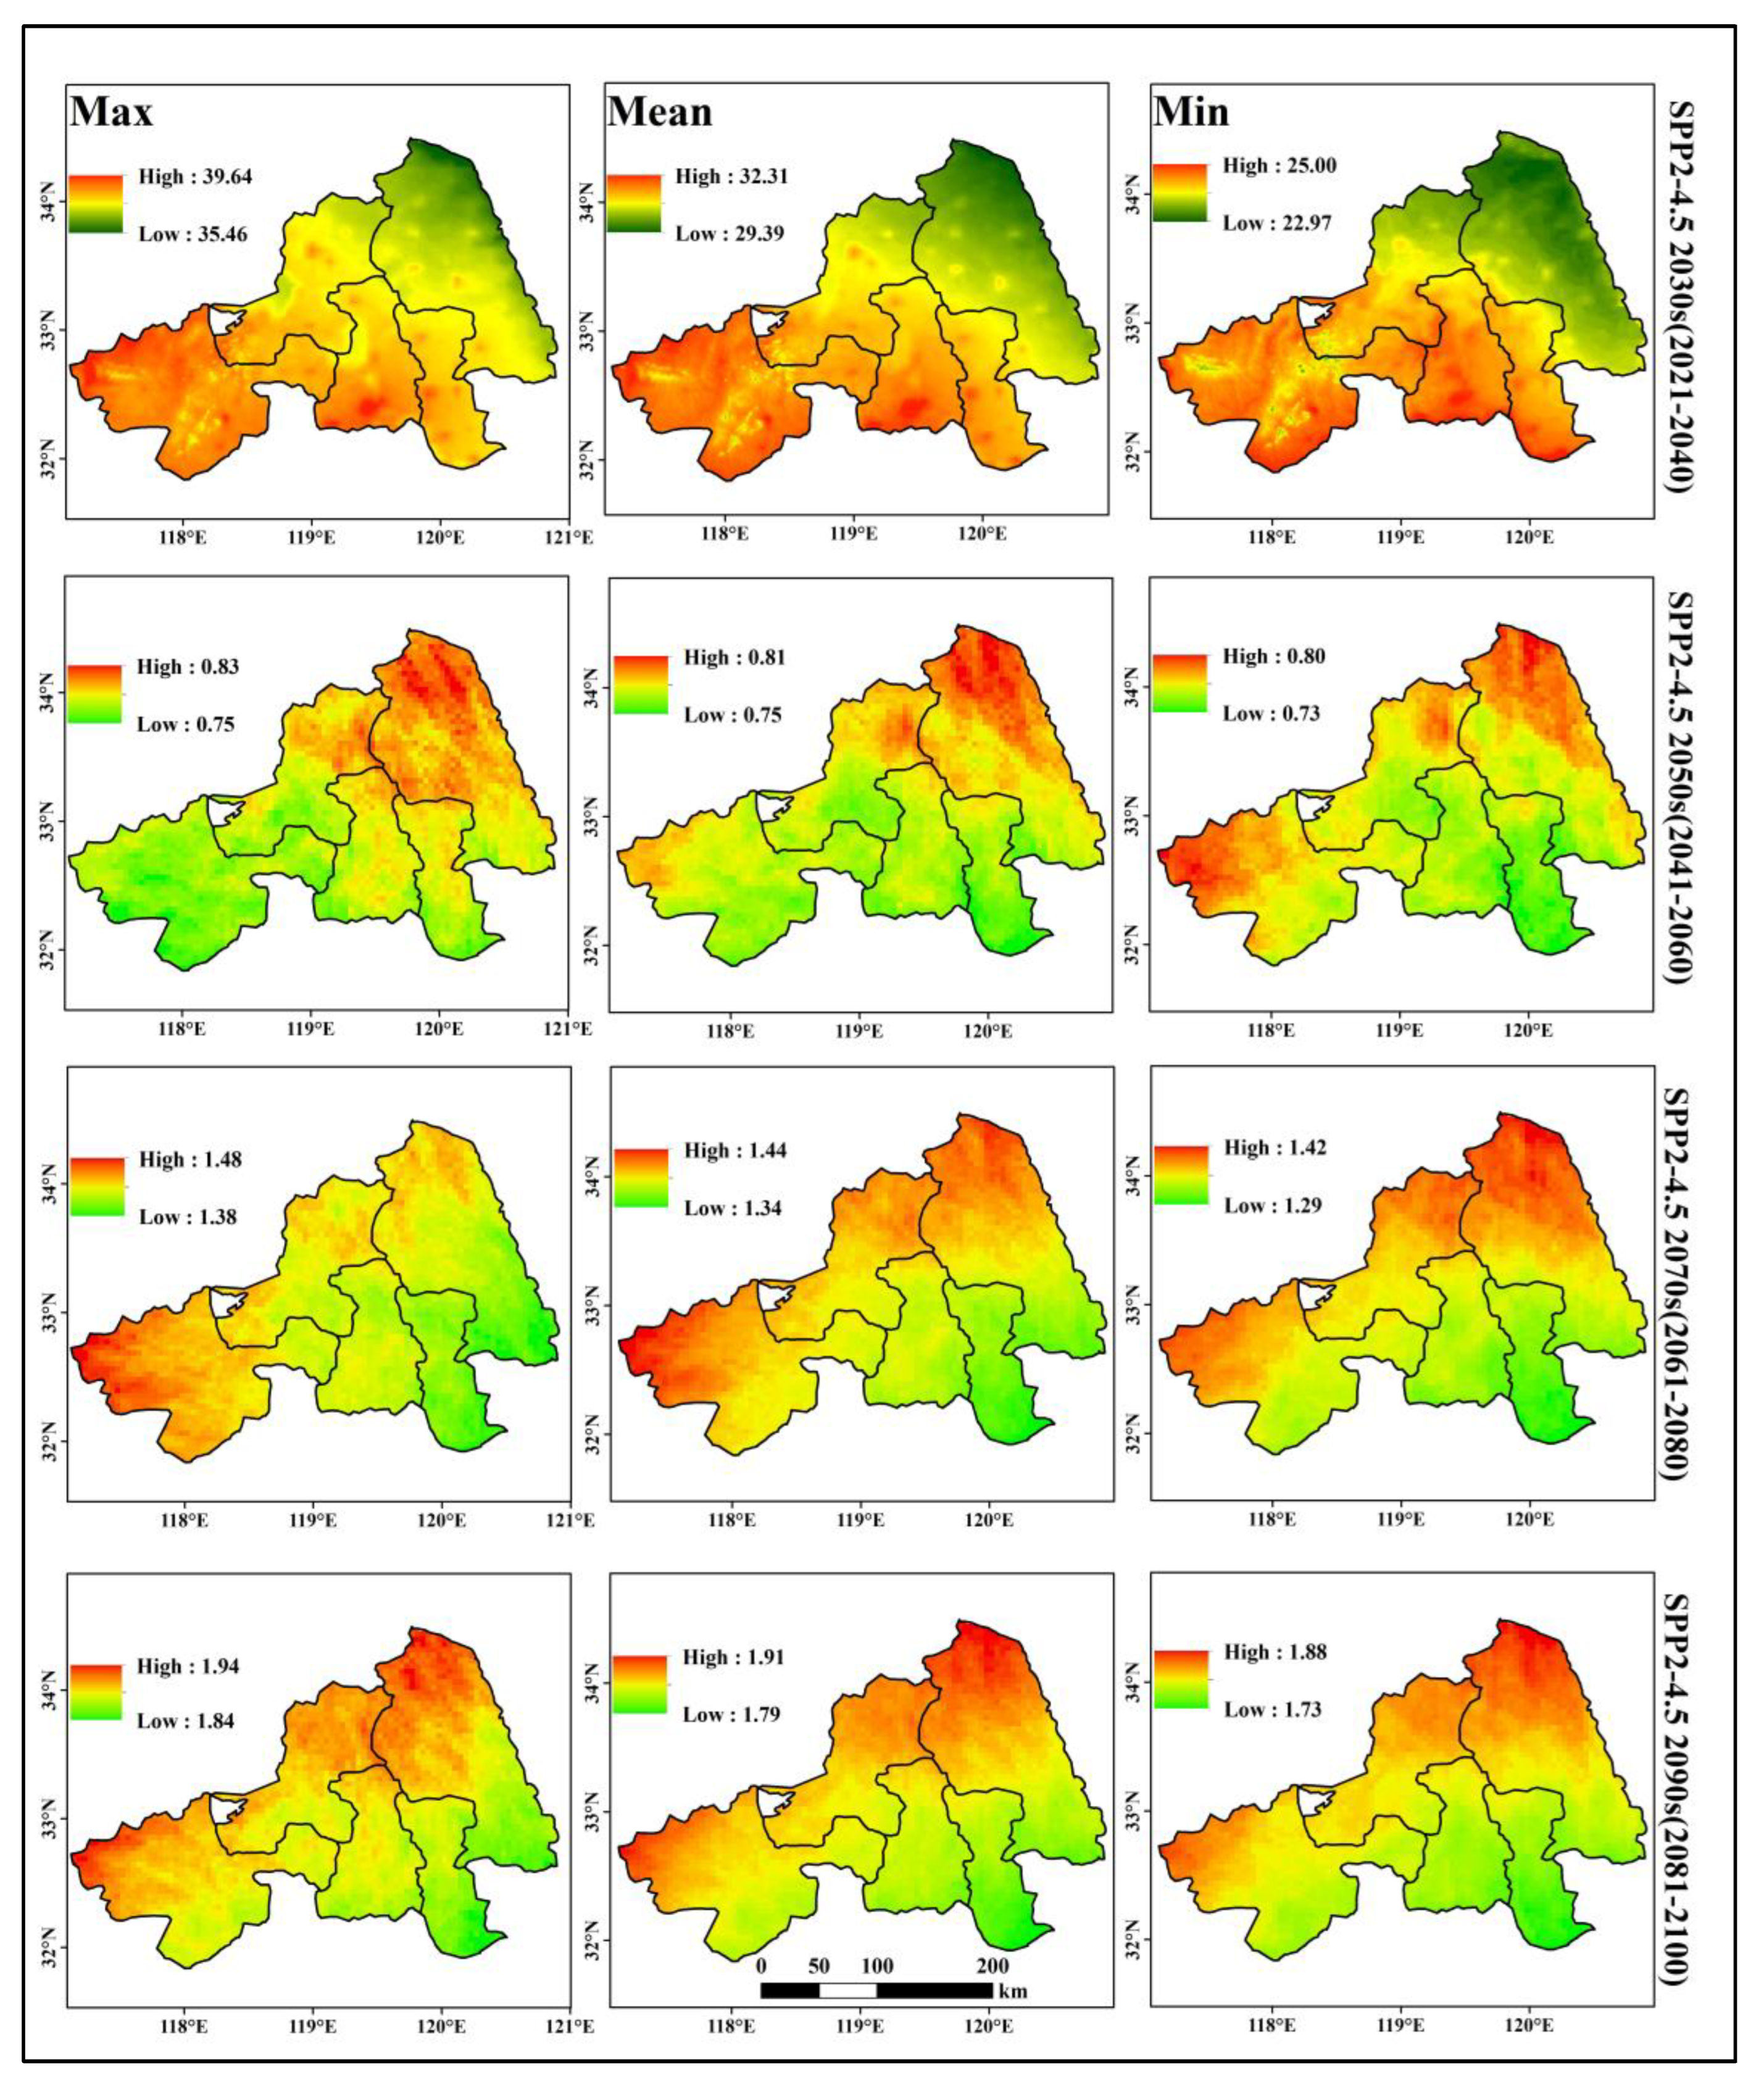
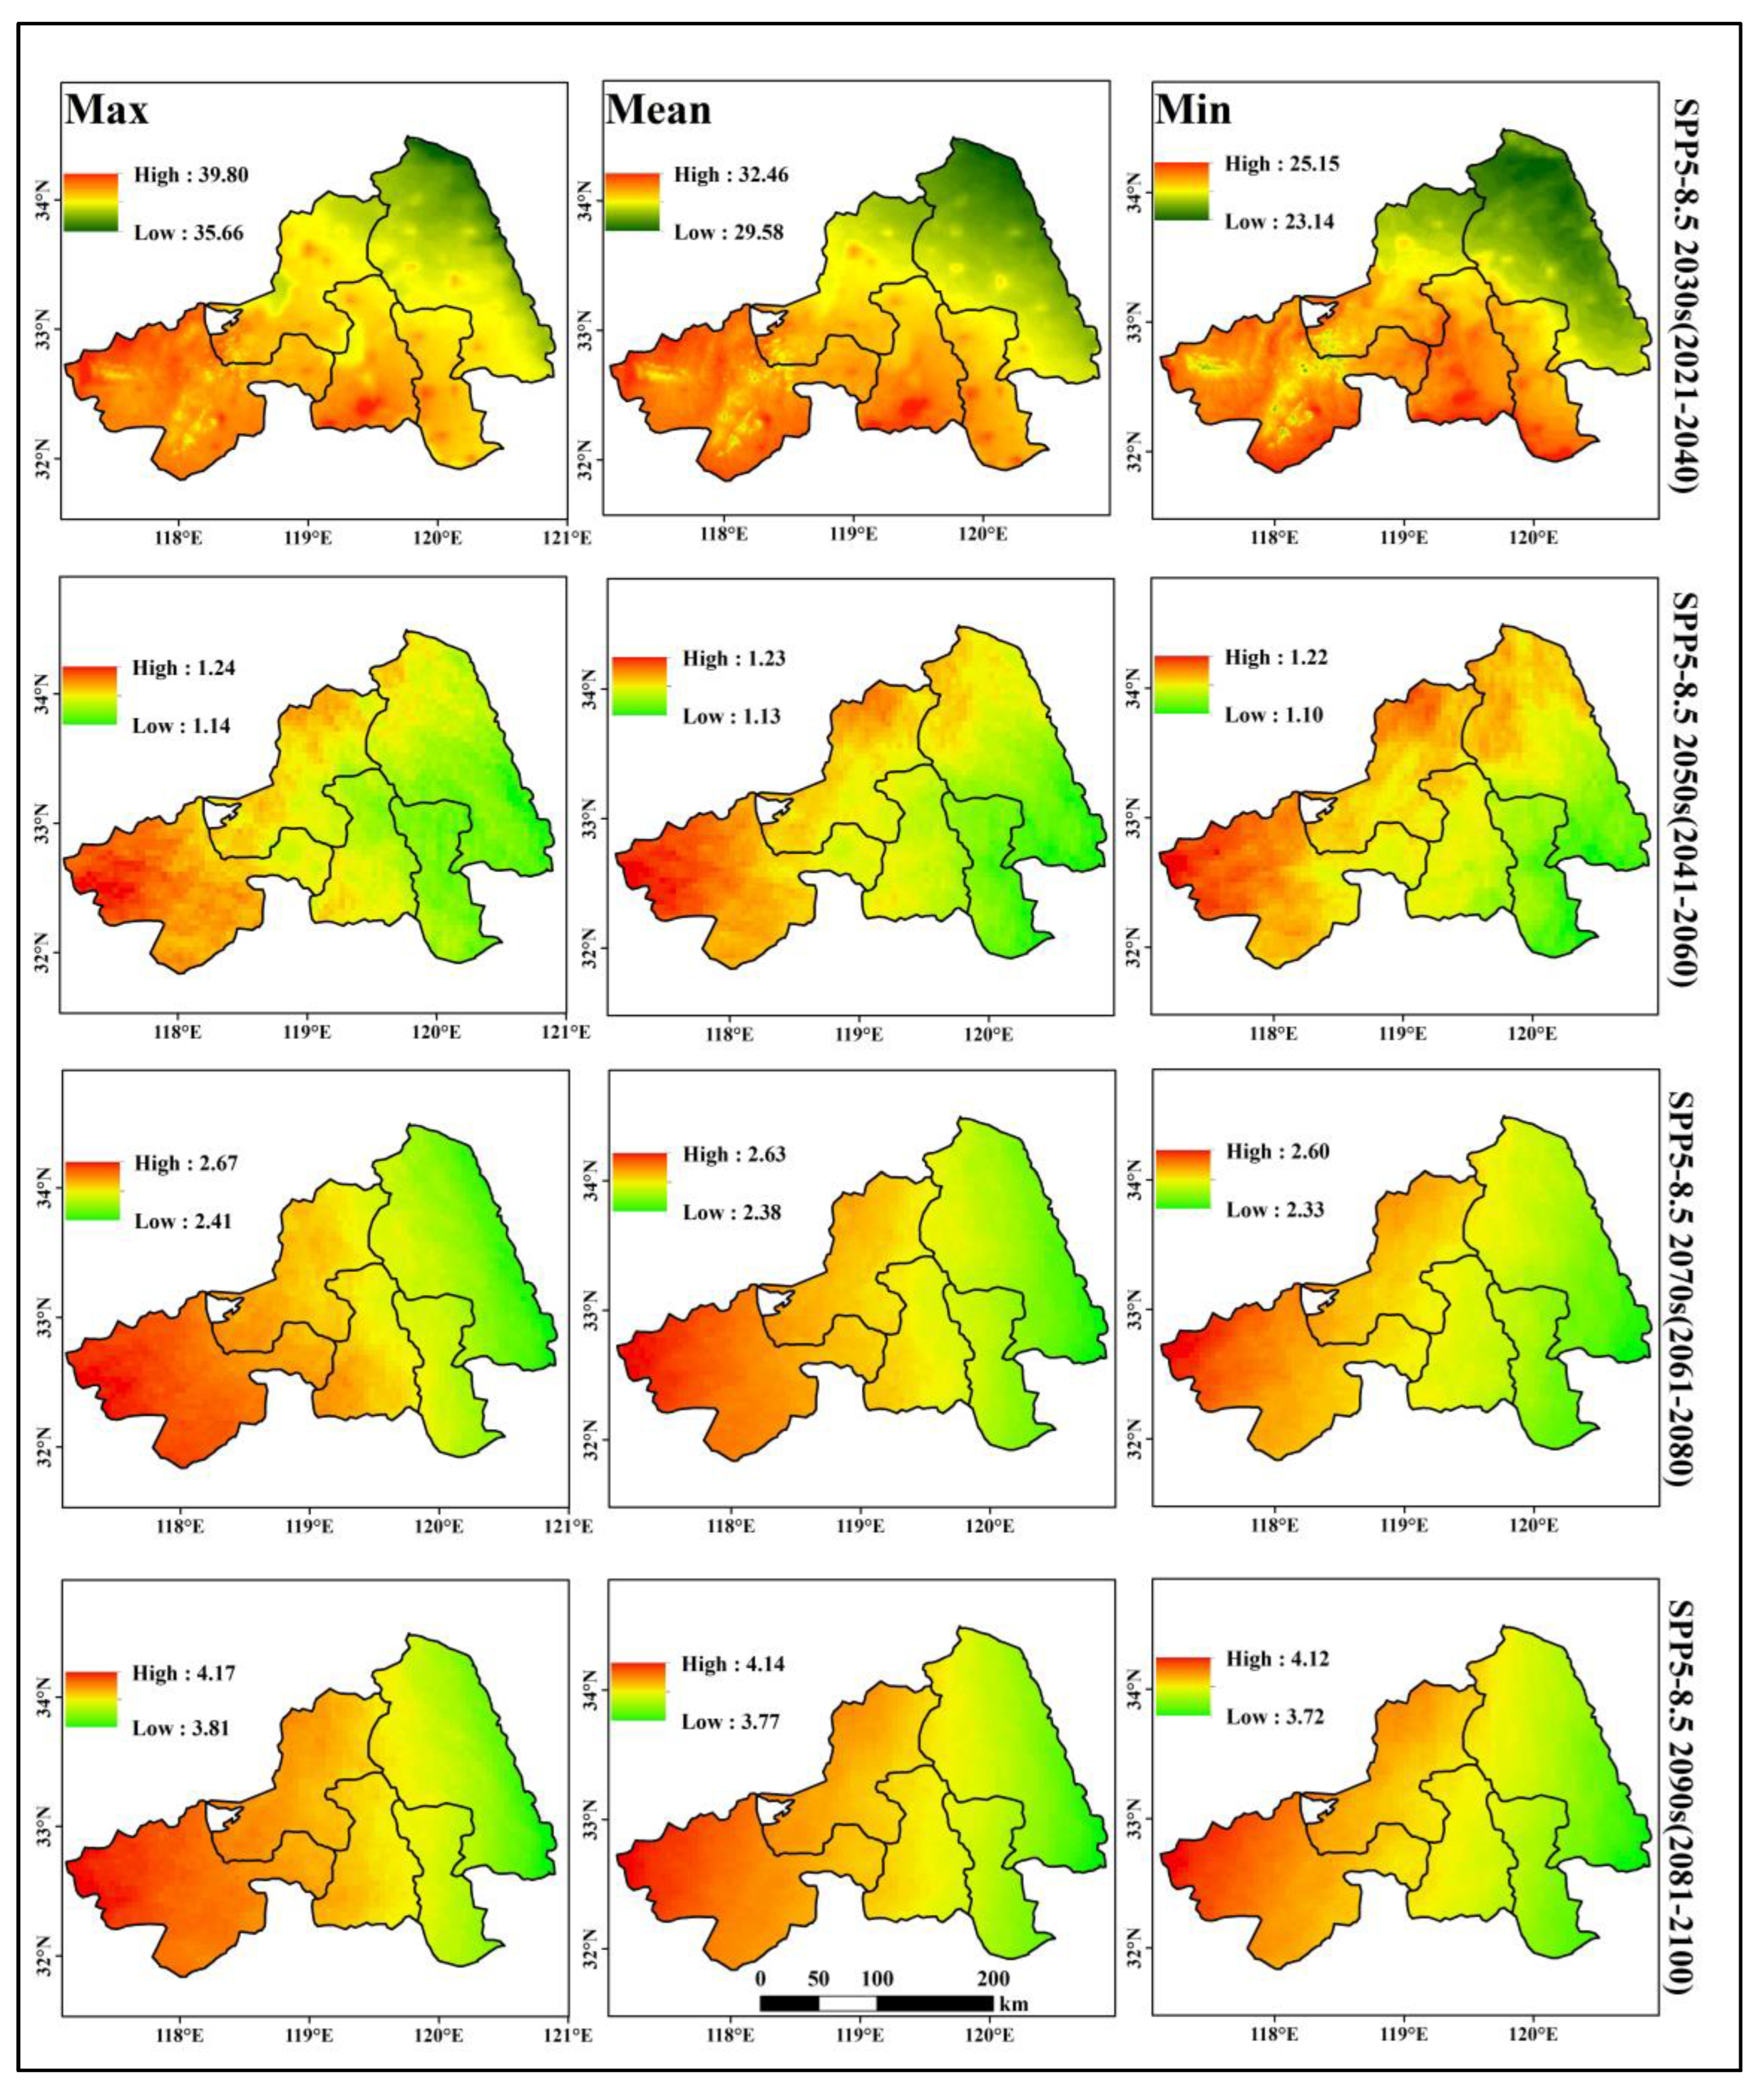
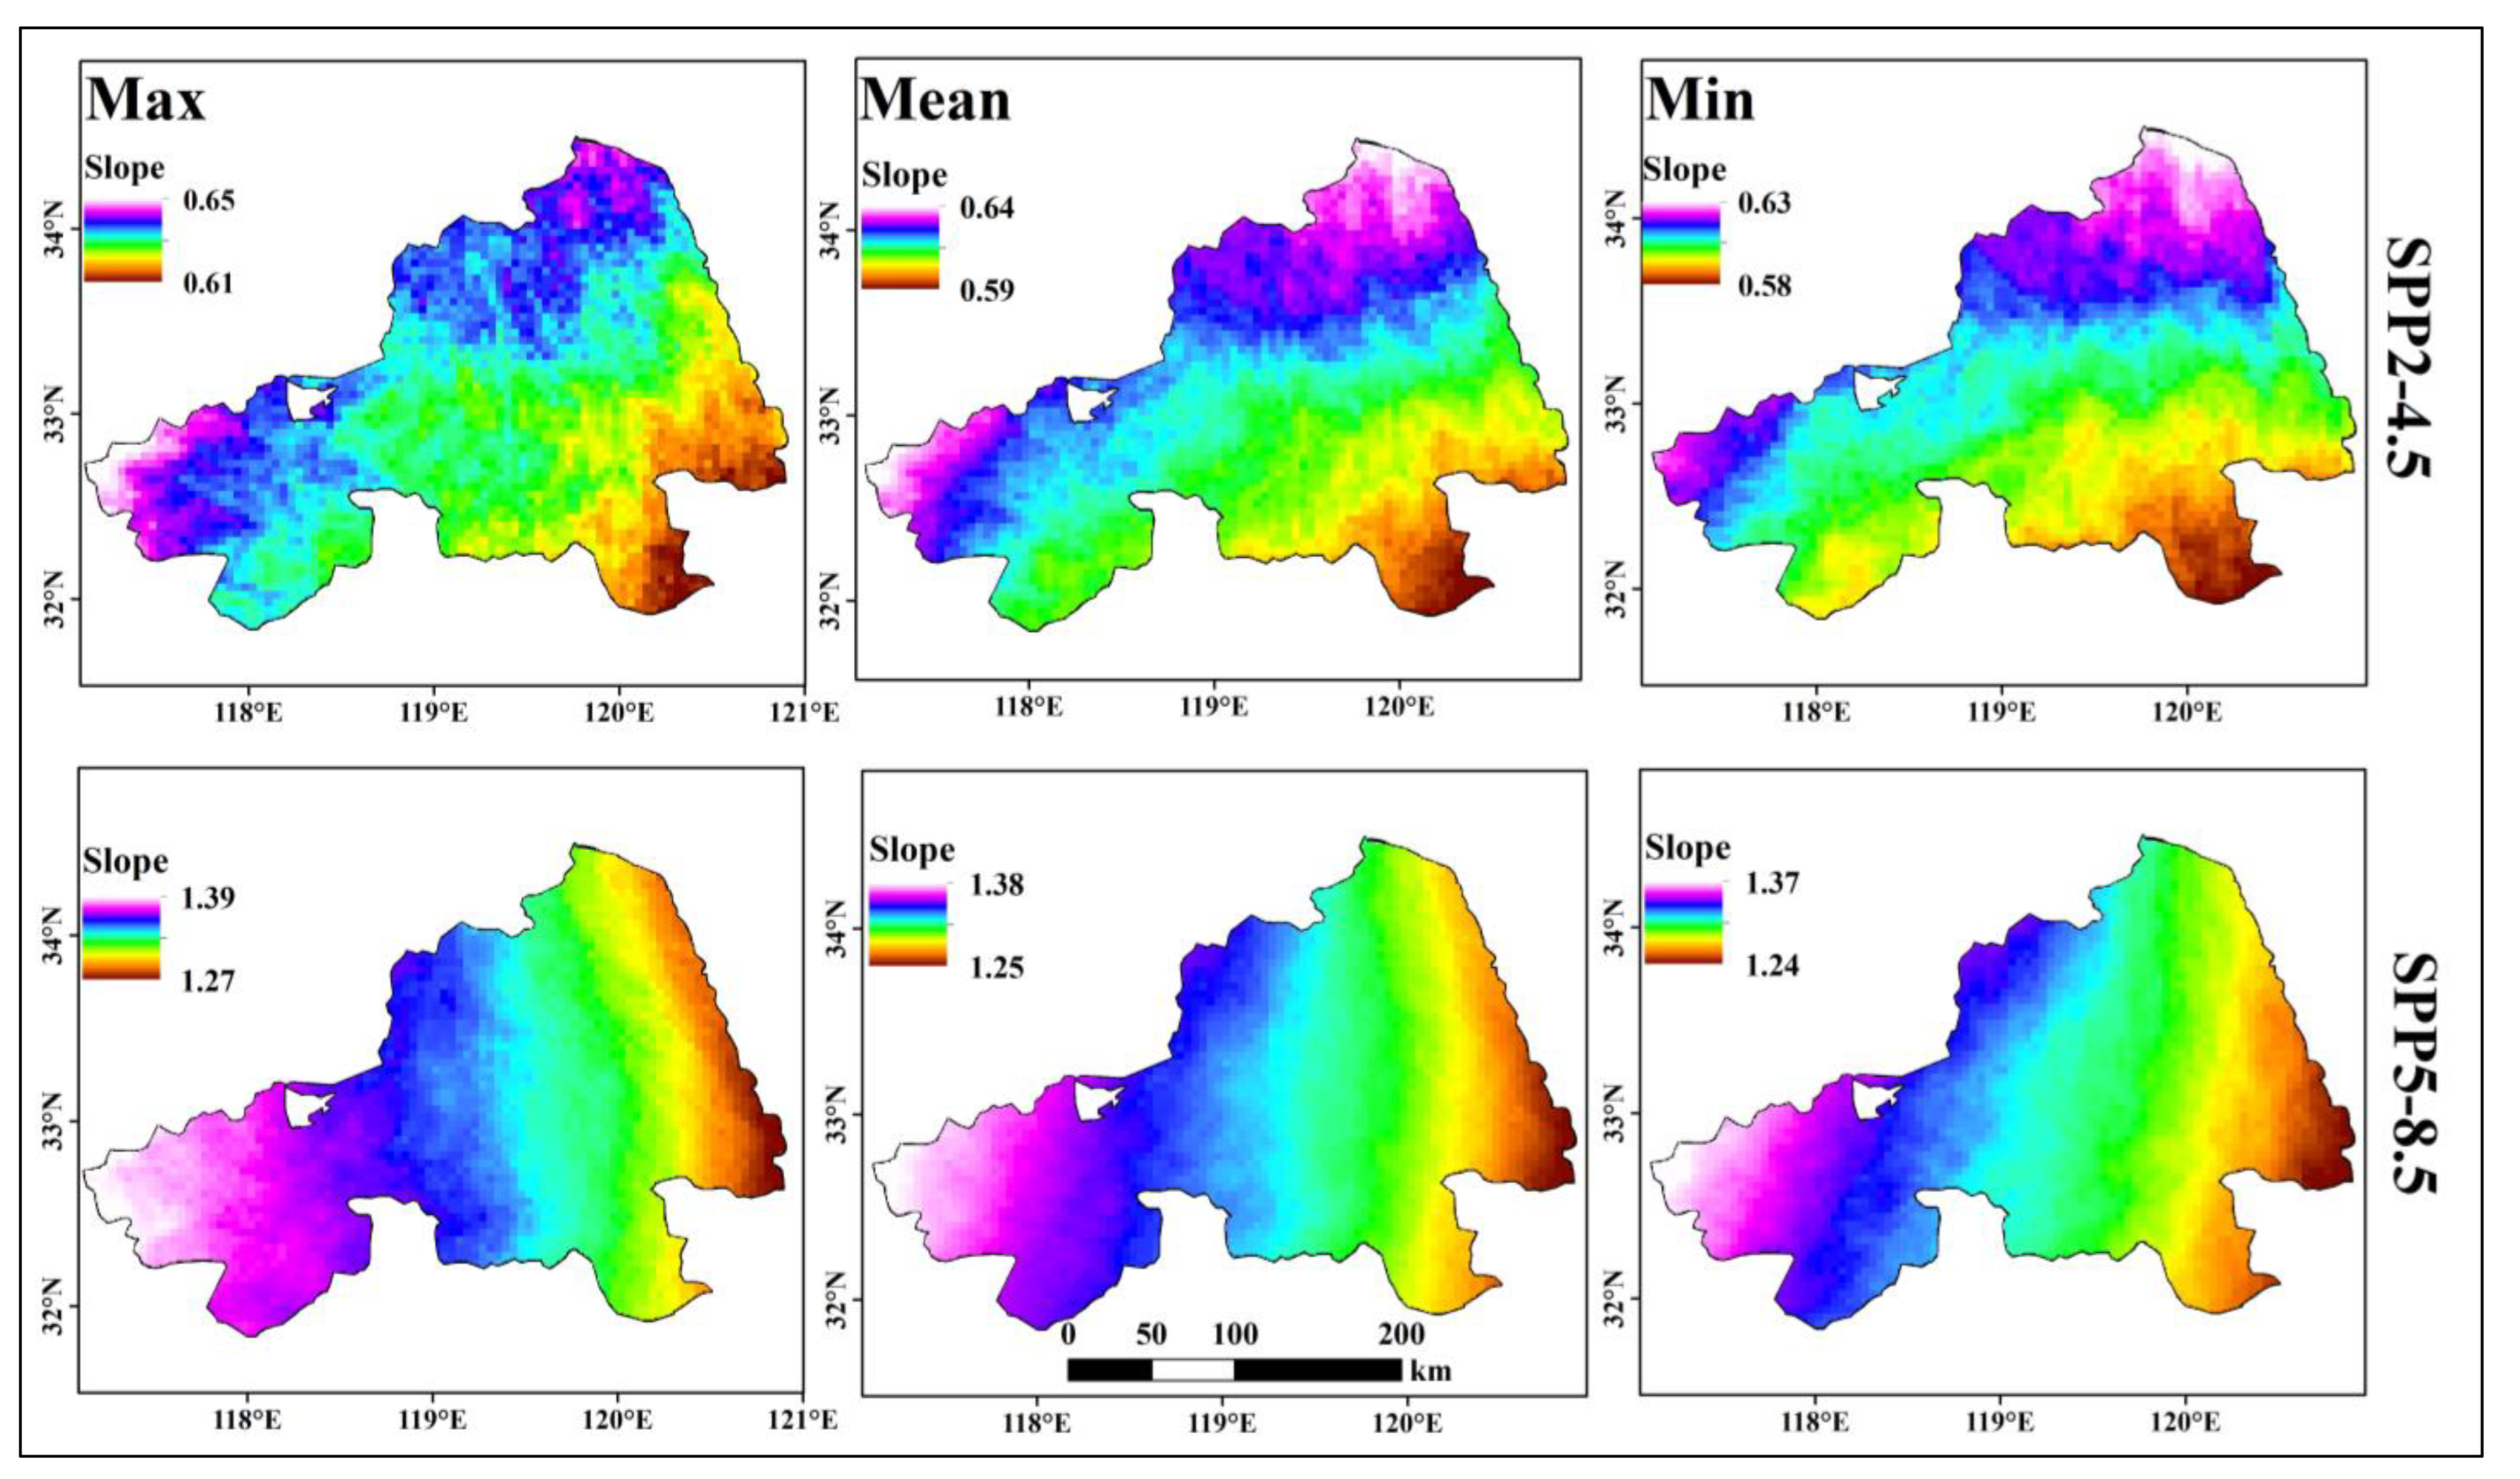
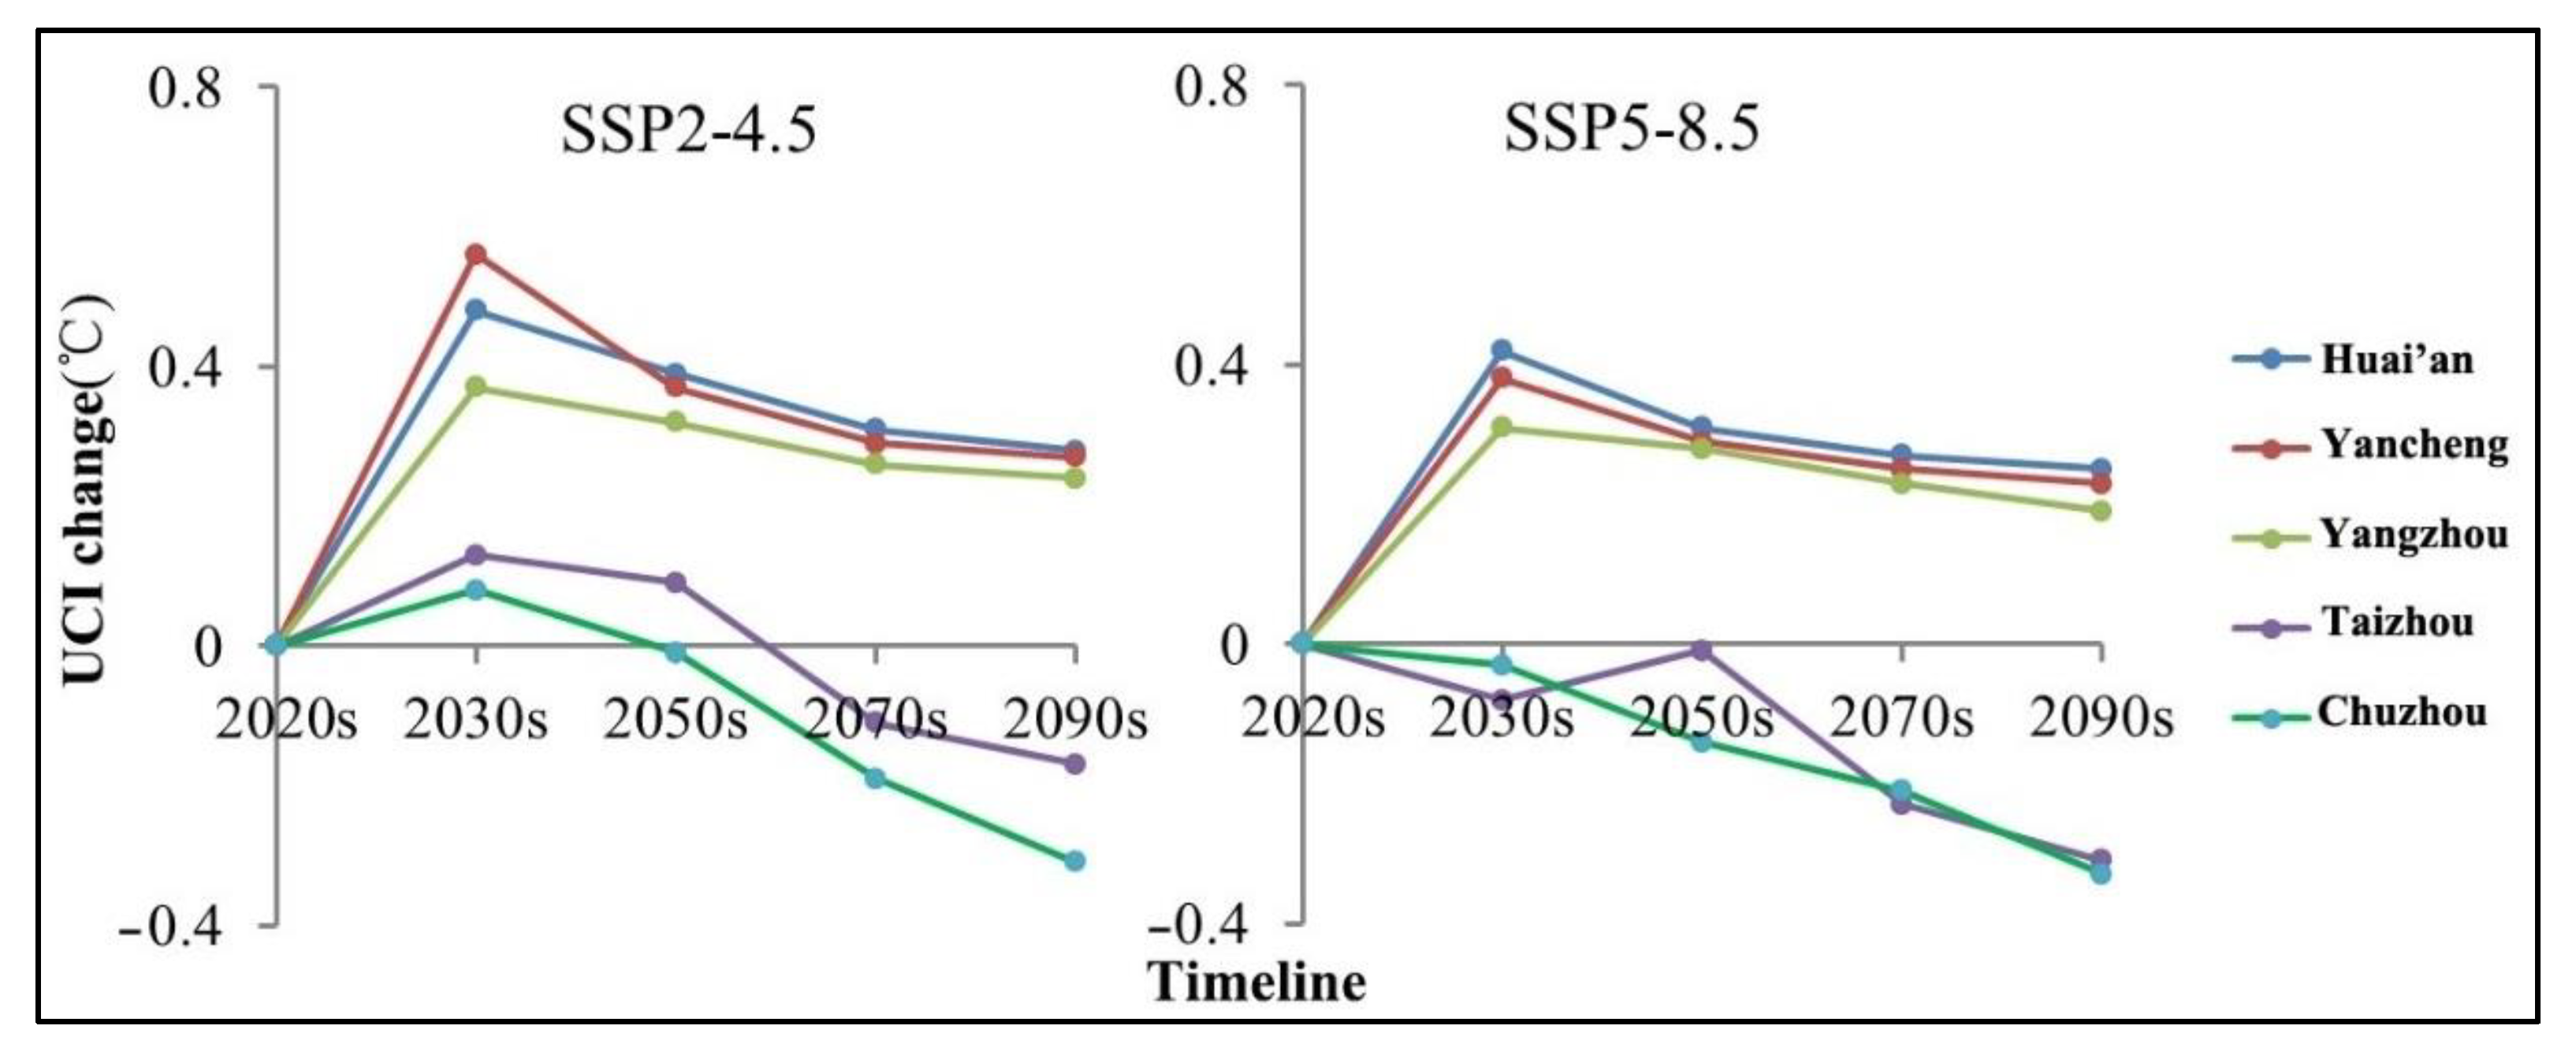
By analyzing the spatial distribution map of annual summer temperature change, it becomes evident that there will be significant spatial differentiation in terms of land use change and trends in climate warming over the next 80 years (Figure 5, Figure 6 and Figure 7). During 2021–2100, the average annual temperature showed an increasing trend under both SSP2-4.5 and SSP5-8.5 scenarios, and the increasing range increased with the increase of radiative forcing. It can be found that in the next 80 years, the regional average value of the cumulative temperature increase in the ESLZ area in summer will be 0.69 °C, with an average of 0.16 °C every 20 years. This trend of temperature change in the future summer is the same as that in the historical period. According to the statistics from the monitoring data of the China Meteorological Administration, the annual average temperature in the ESLZ has shown an upward trend in the past 20 years, with an average increase of 0.33 °C every decade. Under different SSP scenarios, the regional temperature in Chuzhou increases the fastest, with 0.44 °C, and the temperature in Hongze Lake in Huai’an increases by 0.11 °C on average every 20 years. Taizhou and Yangzhou are also the main warming areas in the future due to climate change. Although land use change is not the only cause of temperature change in historical periods, the consistency of this regional warming trend deserves attention. The areas where forests are reduced and arable land is increased are mainly located in Chuzhou, Taizhou, and Yangzhou. Compared with the entire ESLZ, the regional warming values in these areas are slightly higher, and there is little transfer of other land types in these areas, which is obviously affected by the expansion of urban agglomeration in the Yangtze River Delta. Simultaneously, the decrease in forest and grassland coverage, coupled with the expansion of arable land, particularly in Chuzhou, Taizhou, and Yangzhou, has resulted in substantial ecological land loss and a regional warming effect. Consequently, the expansion of arable land in these three cities has had a pronounced warming effect during the summer season.
There are spatial variations in land use change and its associated warming effect, characterized by higher warming effects in areas experiencing land use change and lower warming effects in areas without land use change. Statistical results indicate that the average temperature increase in the land use conversion area of the ESLZ is 0.51 °C, while the average temperature increase in the area without land use change is about 0.35 °C.
Table 4. Regional temperature changes of different land use types in the 2030s and 2050s under the future SSPs scenario model. (Forest: FO; Grassland: GR; Arable land: AR; Water: WA; Wetland: WE; Development land: DE; Bare land: BA).
SSP2-4.5SSP5-8.5
≤30 °C30~32 °C32~34 °C≥34 °C≤30 °C30~32 °C32~34 °C≥34 °C
km2%km2%km2%km2%km2%km2%km2%km2%
2021~2040FO1.960.84231.5599.16----0.640.7189.0099.29----
GR60.292.802094.8597.20----19.850.971945.9294.9184.514.12--
BA1947.4121.0852.59----20.2461.5911.6235.361.003.05--
AR24.150.0641,397.5999.94----21.000.0541,551.7599.945.610.01--
WA501.7112.593479.1587.333.000.08--386.059.693584.7289.9514.570.37--
DE17.440.672595.7899.33----10.050.252371.6887.46330.0612.17--
2041~2060FO--208.5599.032.050.97----5.0114.8728.6885.13--
GR--660.7375.83210.6324.17----133.4314.10812.5885.90--
BA--44.8997.821.002.18----52.7198.141.001.86--
AR--42,426.2199.53201.110.47----47.970.1142,535.2899.89--
WA--2963.4974.601008.7325.39----673.4216.963296.9583.04--
DE--746.6227.381980.6172.62----398.3113.902467.9486.10--
Table 5. Regional temperature changes of different land use types in the 2070s and 2090s under the future SSPs scenario model (Forest: FO; Grassland: GR; Arable land: AR; Water: WA; Wetland: WE; Development land: DE; Bare land: BA).
SSP2-4.5SSP5-8.5
≤30 °C30~32 °C32~34 °C≥34 °C≤30 °C30~32 °C32~34 °C≥34 °C
km2%km2%km2%km2%km2%km2%km2%km2%
2061~2080FO--3.834.1389.1195.87------28.15100--
GR--98.2725.96285.0274.04------712.6986.96155.5414.04
BA--56.9198.331.001.67------54.03100--
AR--59.610.1443,153.7199.86------42,363.0299.12361.110.88
WA--582.2115.083367.0084.92------2995.3876.38953.3423.62
DE--278.0410.222457.5389.78------1484.5151.131442.2448.87
2081~2100FO----101.69100--------28.15100
GR--49.0612.71353.5287.24------47.565.71749.6794.29
BA--44.7476.1714.0023.83------18.0032.7137.0367.29
AR--49.340.3143,154.5399.69------39.170.1142,689.9699.89
WA--568.7214.593399.5085.41------491.0212.853477.7087.15
DE--56.942.282658.7697.72------42.191.432814.5698.57
In this study, the spatial distribution statistics of air temperature in the 2030s, 2050s, 2070s, and 2090s show (Table 4 and Table 5) that the air temperature in most areas (36.35%, 37.22%, 39.77%, and 40.39%) will exceed 32.24 °C. The average temperature of the development land is 33.41 °C. In accordance with the future scenario model, the prevalence of development land and arable land plays a crucial role in contributing to higher temperatures among various land use types. Even if cities undergo limited urbanization, the greenhouse effect, global warming, and alterations in surface characteristics will remain significant factors leading to urban warming in the future.
Considering the overall trend and spatial pattern of the land use temperature effect in the ESLZ, we observed a distinct divergence in the monthly mean temperature change attributable to land use during the summer season over the next 80 years (Table 4 and Table 5). In general, the most significant increase in air temperature caused by land use change was the maximum and could reach 1.51 °C. Land use change in the ESLZ is mainly represented by the transformation from forest land to arable land. In summer, forests use evapotranspiration to take away heat, leading to a smaller sensible heat flux and a significant cooling effect. However, when a certain scale of forest is transformed into arable land, more bare land is exposed, resulting in a lower latent heat flux and a higher sensible heat flux, leading to an obvious warming trend in the region. Therefore, the expansion of arable land areas will cause a regional warming effect. Due to the existence of large-scale forests and the conversion of grassland to arable land in this region, the increase in summer temperatures will be more significant.

3.3. Spatiotemporal Patterns of the Blue–Green Cooling Island Effect in Future Scenarios

The paper utilizes future temperature data from 15 GCM under SSP2-4.5 and SSP5-8.5 scenarios to calculate the temperature changes between the future time periods (2030s, 2050s, 2070s, and 2090s) and the historical period (2020s). The difference in air temperature between urban development land and urban blue and green space is used to characterize the UCI intensity in the future. Figure 8 illustrates the changes in UCI intensity between the historical and future time periods (mean of 15 GCM predictions) for the two SSP scenario models, while Table 6 summarizes the intensity of UCI changes under the two scenarios. The UCI changes fastest between 2020 and 2030 in the historical period, and the change rate then becomes relatively stable. To emphasize the influence of other factors on UCI changes, this chapter focuses primarily on the UCI intensity changes between the historical period and the 2090s period. Among all cities analyzed in this study, Yancheng had the largest increase in UCI intensity (SSP2-4.5: 0.58 °C), while Chuzhou had the largest decrease (SSP5-8.5: −0.33 °C). The future UCI intensity of cities under SSP5-8.5 (12) is lower than that under SSP2-4.5 (15). It is expected that the UCI intensity of Huai’an, Yancheng, and Yangzhou will increase under both SSP scenarios, while the UCI intensity of Taizhou and Chuzhou will decrease under SSP5-8.5 scenarios. The indication of UCI intensity change depends on the SSP scenario in the analysis. Given that Huai’an City, Yancheng City, and Yangzhou City have abundant blue–green space, the UCI effect is more apparent under different SSP scenarios.
In order to study the relationship between future UCI intensity and land use change, this section derives the linear regression relationship between them and analyzes their amplitude change and statistical significance (p = 0.05). We generated scatter plots illustrating the relationship between changes in UCI intensity and the total number of pixels associated with each blue-green land use type in the historical time periods of the 2020s and 2090s. These scatter plots were obtained for various SSP scenarios (Figure 9). According to the figure, without expansion of urban development land, the mutual conversion of areas of different land use types in the blue–green space leads to a small change in the amplitude of UCI intensity in the future, while an increase in forest and water bodies shows a positive correlation with UCI intensity. However, an increase in arable land has the most significant impact on reducing the range of urban UCI. In the future, if UHI is caused by land use and climate change, it can be offset to a certain extent by increasing forest coverage, indicating that afforestation can effectively deal with the risk of increasing UHI intensity in the ESLZ.
The scatter diagram in Figure 10 shows the relationship between UCI intensity and the size of urban blue–green space under different SSP scenarios. Our analysis reveals a notable positive correlation between the change in UCI intensity and the size of urban blue–green space. This suggests that cities characterized by larger blue–green spaces are likely to encounter a lesser decline in UCI in the future. Through evaluation and analysis of UCI changes in the ESLZ, it was found that five cities have experienced detectable UCI phenomena in the past. Cities with larger (or smaller) blue–green spaces will have larger (or smaller) increments of UCI amplitude in the future. The intensity of the UCI effect caused by changes in regional blue–green space area decreases from north to south, particularly in Huai’an City and Yancheng City.

3.4. Planning Reference of the Regional and UCI Effects

  • Urban green space optimization reference
The strategic placement of green space along the main wind direction of the city can enhance the ventilation effect while also bringing cooler air from the outskirts into the urban center. However, in old urban centers with limited land resources, it may be more feasible to interplant green space and increase the flexibility of the green space without taking up excessive land. The ideal arrangement of green space has a significant impact on mitigating the urban thermal environment. Where possible, large wedge-shaped green spaces should be created, and the complexity of the green space boundary should be increased. Green spaces not only improve the thermal conditions for residents in densely populated residential areas but also serve to mitigate the UHI effect by breaking up the contiguous, expansive heat island and increasing fragmentation. This fragmentation helps reduce the intensity of the UHI effect to a certain degree.
2.
Urban water body optimization reference
To improve the efficiency of water bodies, lakes and rivers within and outside the city should be connected, and small wetlands should be integrated. Artificial wetlands can also be added to increase connectivity. The river serves as a natural ventilation corridor for the city, but high temperatures in the surrounding environment can reduce the cooling island effect of the river. Therefore, it is imperative to implement stringent regulations regarding development intensity, building volume, height, and other related factors in the vicinity of rivers to prevent adverse impacts on the ventilation of the city. A wide green buffer zone should be reserved on both sides of the river to ensure that the cooling corridor formed by the river can have maximum impact.
3.
Urban blue–green space planning optimization reference
The cooling island effect of water is stronger than that of green space, and the combination of water and green space has the strongest cooling island effect. Therefore, artificial lakes, ponds, and other water landscapes can be added to urban parks or green spaces. In areas with a serious heat island effect, small artificial water bodies, pocket parks, pocket green spaces, or vertical greening should be properly planned to improve the greening rate of the city. As the Huaihe River Ecological Economic Zone has just been incorporated into the national green ecological development plan, it is appropriate to increase green spaces and lakes while protecting the existing large lakes, green spaces, and rivers in the city. Incorporating blue–green ecological corridors along urban main arteries and ring roads that align with the prevailing wind direction can enhance the ventilation of the city, disperse accumulated heat, effectively mitigate the UHI effect, and enhance urban air quality.
Huai’an blue–green space optimization reference
Combined with the positioning of urban spatial characteristics, the strategy of “taking lakes into the city” should be followed to strengthen the advantages of Hongze Lake, which is the fourth largest freshwater lake in China, in terms of landscape and ecology. The integration of the existing urban areas of the Huai’an and Hongze districts should be promoted through the ancient hydraulic Exhibition Gallery of Gaojiayan, the modern hydraulic Exhibition Gallery of the general irrigation canal in Northern Jiangsu’s Huaihe River Seaway, and the regional greenway. By integrating landscape resources and green ecological resources along the three corridors of “Gaojiayan Hydraulic Exhibition Corridor”, “Ancient Huaihe River-Yanhe Ecological Leisure Corridor” and “Grand Canal-Li Canal Cultural Tourism Corridor”, a characteristic urban blue and green space can be created, highlighting the water-dependent urban ecological pattern of Huai’an City. Additionally, the four main development axes and landscape roads of Huaihai North and South Road, Xiangyu Road, Meigao Road, and Huaihai East and West Road should be connected and integrated, forming a spatial pattern of “Water green vertical and horizontal clusters alternate”.
Yancheng blue–green space optimization reference
Fully considering the wind direction and urban layout of Yancheng City, the focus is on creating the Tongyu Canal and two green corridors of Xinyang Port, forming the outer ring expressway Greenway. At the same time, the Mangshe River, Xiaoxin River, and other rivers will have a green belt of no less than 20 m controlled, and each river will have a green belt of no less than 10 m controlled. By utilizing the existing trunk roads and rivers, a comprehensive network of interconnected greenways is established throughout the entire city. This greenway system creates urban ventilation corridors, effectively reducing the UHI effect when combined with strategically placed parks.
The ecological green ring, based on the expressway ring, connects many country parks outside the central city. The green space frame of the central city, constructed by the ecological green space along the Tongyu River and Xinyang Port, is the support of Yancheng’s “water-green city”. Along the Anaconda River, Chuanchang River, and New River on both sides, a green belt of more than 20 m will be constructed, along with more than 15 m of green belt construction along the Xiaoyang River on both sides, and a green belt of more than 10 m along other rivers on both sides.
Yangzhou blue–green space optimization reference
Based on the North–South Jianghuai ecological corridor and the East–West Yiyang River Jiajiang ecological corridor, as well as the regional ecological green space patterns of Shaobohu Lake, Beizhou ecological, and Lixia River wet areas, an urban green space system is constructed by fully integrating the urban water network pattern. This system highlights the characteristics of riverside zonal green space and connects the regional ecological green space and urban green space networks with wedge-shaped green space. The result is an urban green space system with both internal and external connections, and a reasonable layout.
The ancient canal, Chenghe River system, Grand Canal, and Mangdao River form a riverside belt green space network that connects various public green spaces. The historic city is surrounded by a green land network composed of the ancient canal, Beicheng River, Erdao River, Hao Cao River, Xinggou River, and Caohe riverside green land. The network links the main municipal and district parks of the city through the ancient canal and Mangdao River. The Shugang–Slender West Lake scenic area is connected to the Beishan ecological area across the railway and to the Yizheng hills and mountains in the west through Shugang Xifeng, a sports park, and the western district of New Town along the mountains and rivers. To the east, the Ancient Canal is linked to Phoenix Island Country Park via Zhuyu Wan Park and to the Yangtze shelterbelt to the south. It is also connected to the country park via Liao Jia Gou and Mang Dao He to the north and south, respectively, forming wedge-shaped green spaces that penetrate the central city in multiple directions. Ecological green belts that are no less than 50 m wide are arranged on both sides of the Tongyu River and Xinyang Port, and the width can be appropriately reduced within the urban built-up area according to the actual situation.
Taizhou blue–green space optimization reference
Protect the water source protection areas of Taizhou No. 3 Water Plant and Jingjiang Yaqiao Water Plant, as well as important wetlands along the river and Jiangxinzhou. Gradually relocate existing urban construction or industrial land in the area for ecological restoration. Protect the water quality and biodiversity of the wetland ecosystem and prohibit urban construction or industrial development from encroaching on wetlands. The Lixia River Ecological Function Protection and Forbidden Development Subzone includes the Yinjiang River, Xintongyang Canal, Taidong River Clear Water Channel Maintenance Area, and Lacquer Lake Important Wetland. Strengthen the protection of major rivers such as the Yangtze River, Diversion River, Taidong River, Xintongyang Canal, and Tai Canal, and improve the greening of construction on both sides of the river.
Build the Fengcheng green ring and the Yangtze River-Lead River-New Tong Yang Canal-Pioneer River green ring, which includes a lead river channel and a compound green corridor composed of the coastal protective belt. Construct the compound green corridor composed of Ningqi Railway, Kaiyang Expressway, and New Tong Yang Canal green belt, and the compound green corridor composed of Tai Town Expressway, intercity railway, River North Road, and Medicine Production and Group Green Space composed of a composite green gallery. Strengthen the greening of six main rivers, including the Nanguan River, Phoenix River, old Tong Yang Canal, Zhoushan River, water delivery river Cai Wei groove, and Xuanbao Port. Along the Yangtze River, Diversion River, New Tongyang Canal, and Tai Town Expressway, construct the peripheral ecological green space of the central city and the wetland ecological park in the north, the Taizhou Botanical Garden in the west, a lake park in the southeast, and a riverside wetland ecological park in the south.
Chuzhou blue–green space optimization reference
Build the Qingliu River ecological landscape belt, the Langya Mountain scenic spot ecological core, and the Minghu ecological wetland landscape core. Strengthen the separation of Western Chuxi, Eastern Chuxi, and Southern Chuxi by railway, river, and ecological green space, and connect them by ring roads and urban expressways. Increase park green spaces such as the Longxing Road green corridor and Shengtianhe green corridor, and expand urban green spaces and water areas. We will strengthen the construction and upgrading of various types of green spaces, such as Fengleting, Longchi Street, Jingyuan, Chengnan Wetland Park, Huizhou Road, and Century Avenue. We will promote the greening of the road network by removing walls to reveal green spaces and inserting green spaces in the seams. We will transform and upgrade street parks and pocket green spaces.
4.
Regional thermal environment simulation based on the reference scheme
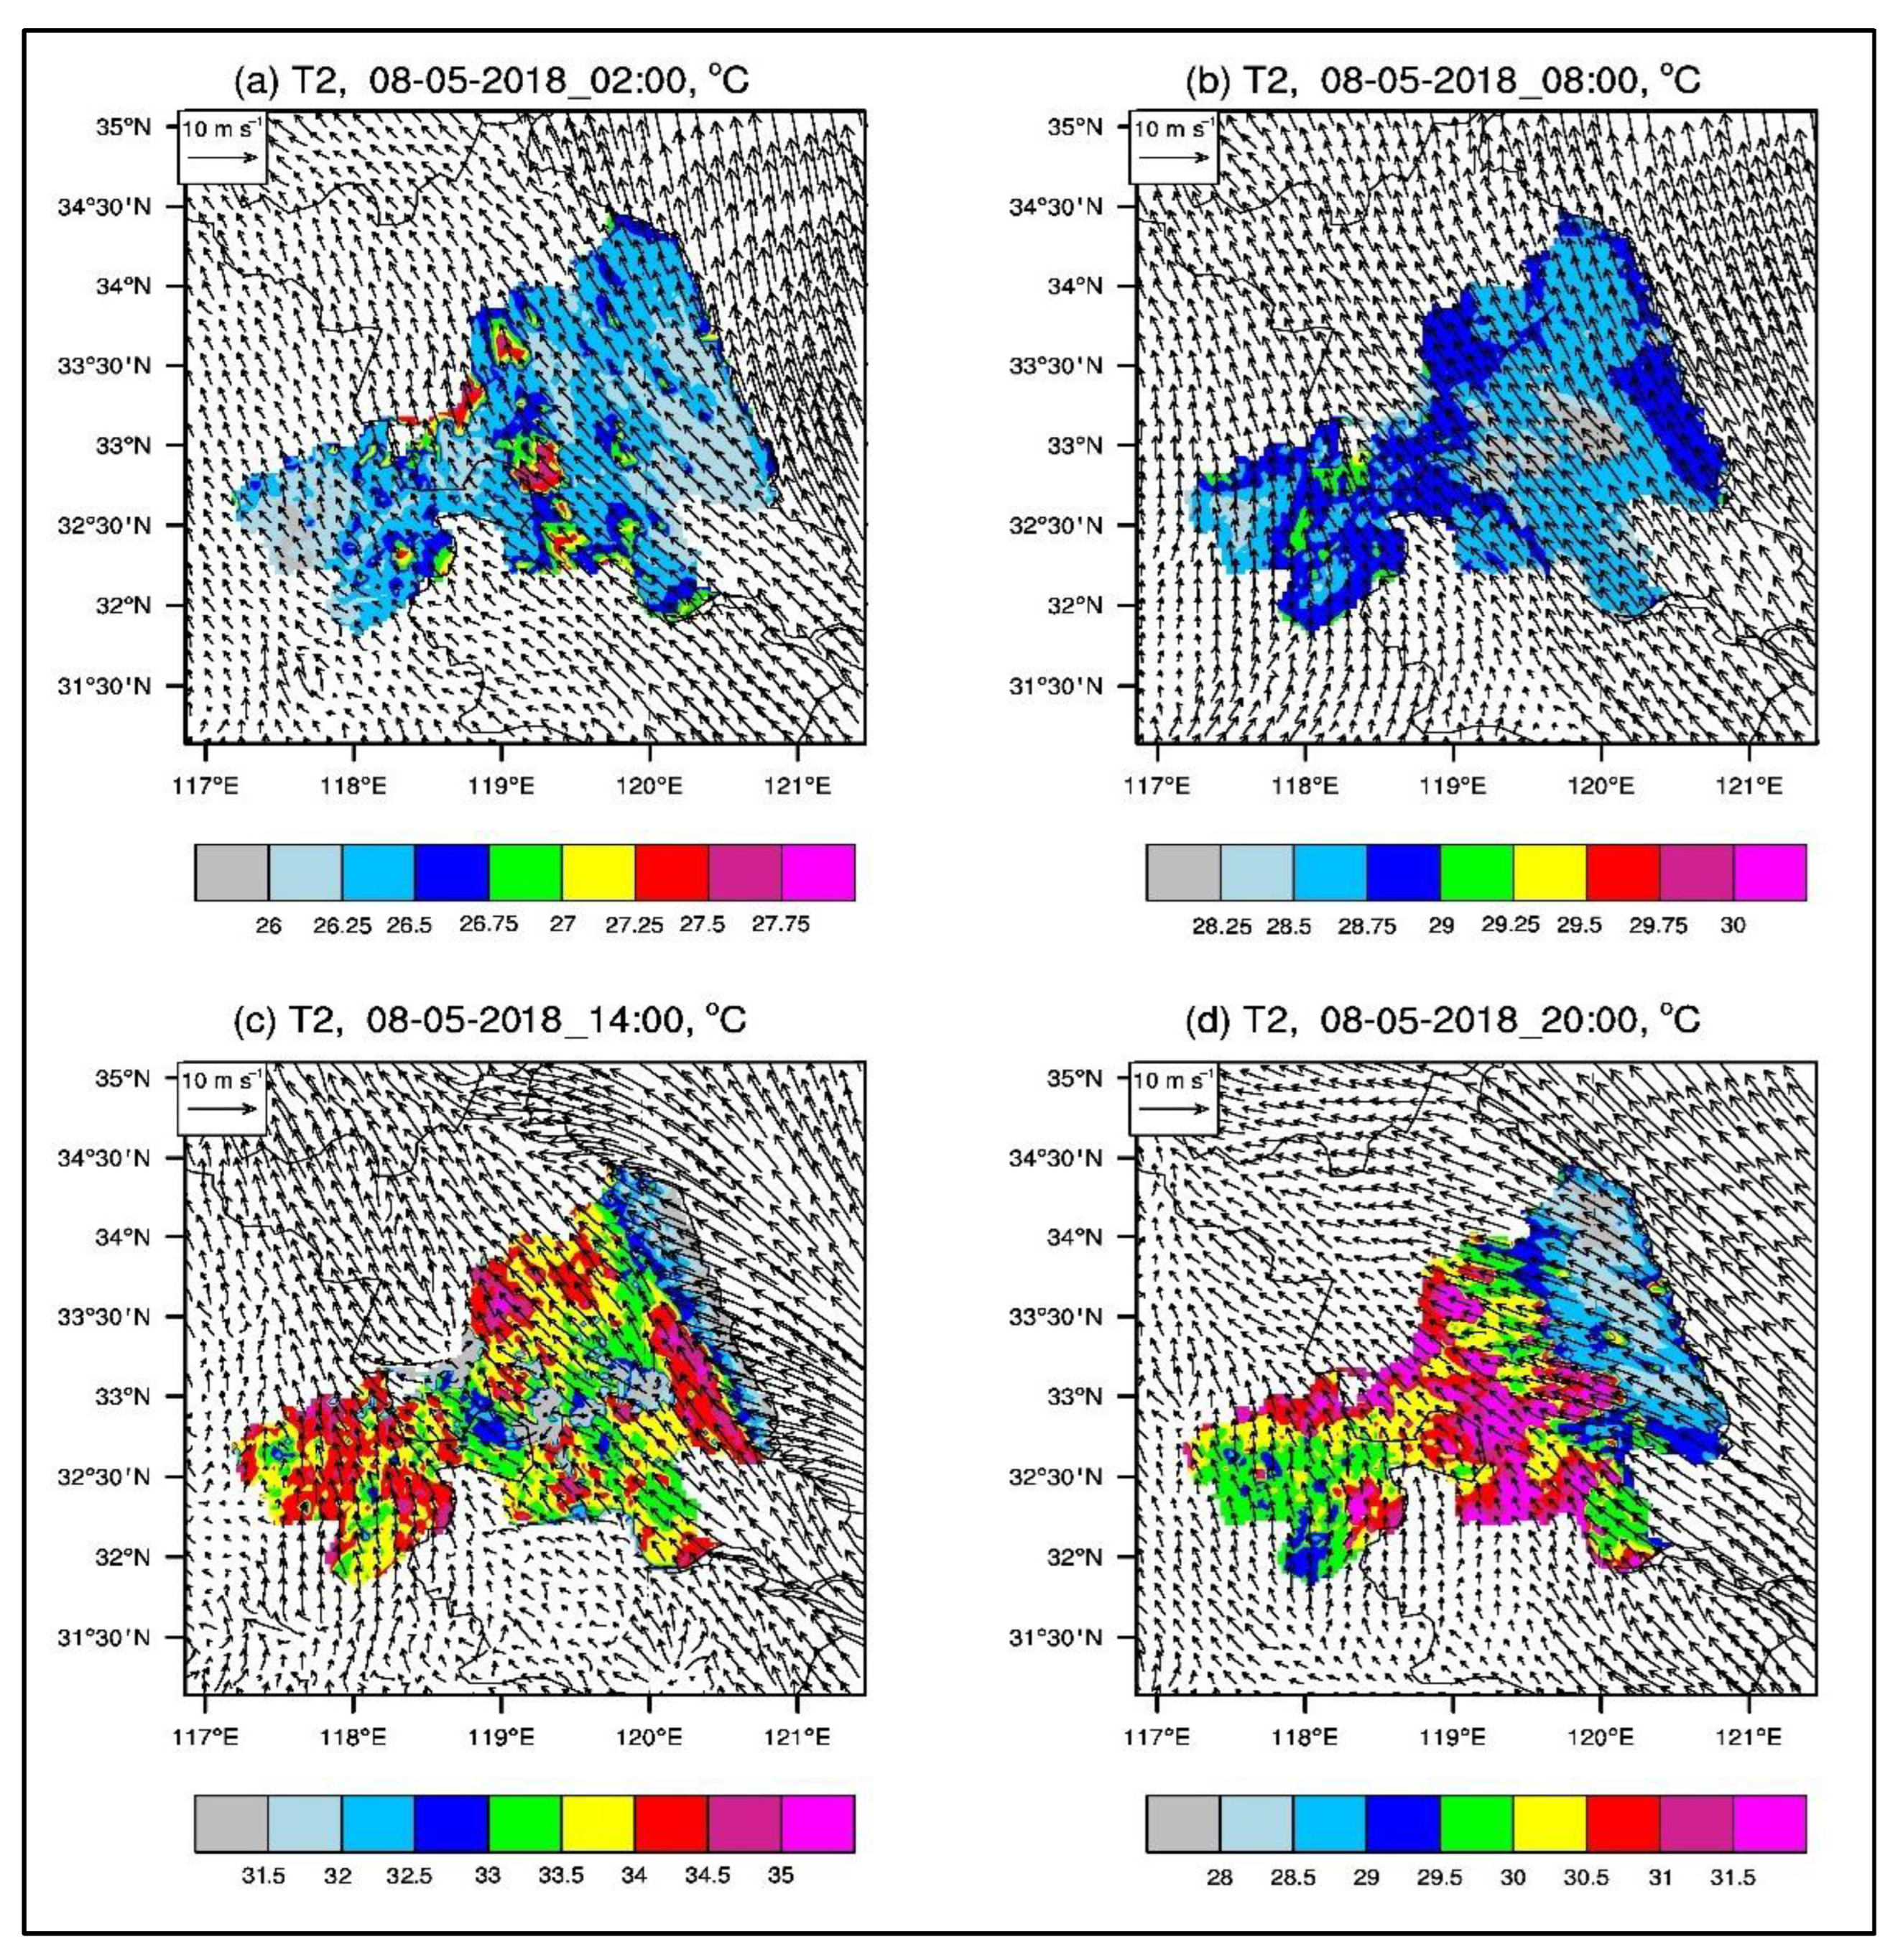
To facilitate visual comparison, this section selects the hottest day from 2000 to 2020 in summer for a comparative simulation based on the WRF scheme. According to Figure 11, the heat island effect in the central urban area of the ESLZ, based on the reference scheme, was effectively alleviated, and the maximum temperature was reduced to 36.52 °C. In Huai’an City, Yancheng City, and the northern part of Yangzhou City, the heat island effect was significantly weakened through the construction of transparent blue–green space measures, and the average maximum temperature was reduced to 35.17 °C. When green ecological corridors are added around rivers, lakes, and waterways, such as the Yangtze River, Hongze Lake, Gaoyou Lake, Shaobo Lake, Baima Lake, Dazong Lake, and Zhaojiagou Irrigation Canal in Northern Jiangsu, the area of the cooling island around them increases significantly, and the cooling island effect in the downwind direction is particularly significant. By increasing the blue–green space along the outer ring ecological corridors of Yancheng, Taizhou, and Yangzhou and introducing the cooling air generated by the cooling island effect outside the central urban area, the UHI effect at the edge of the central urban area can be effectively alleviated. Therefore, optimizing the layout of urban blue–green space plays an important role in improving the urban thermal environment.

4. Discussion

4.1. UCI Effect under the Future Scenario Model

In the future scenario model, the UCI changes of the five major cities in the eastern Haihe River Lake Linkage Zone show that due to the region’s rich blue–green space, there are noticeable UCI phenomena in each city, but the UCI intensity in all regions will decrease. The study also found a positive correlation between UCI magnitude and urban blue–green space scale (area) during the observation period. The results indicate a significant correlation between UCI magnitude and the blue–green space scale (p < 0.05), which is a crucial finding of this study. This is because, in the past, there has been limited research on the impact of urban blue–green spatial scale on UCI distribution characteristics in future scenarios. The future UCI growth rate is greater in cities with larger blue–green spaces and smaller in cities with smaller blue–green spaces. Cities with smaller blue–green spaces are more likely to experience the UHI phenomenon under future climate change and land cover change, particularly in Chuzhou and Yangzhou (Figure 5 and Figure 6). So far, the discussion has primarily focused on trends in ESLZ (presumably a specific region or location) temperature averages. In this section, we present the spatial patterns of trends by comparing summer seasonal and annual trends across four 20-year periods characterized by significant warming in the ESLZ (Figure 7). This study also examines the relationship between future urban blue–green space area and the UCI value’s change. The greater the proportion of urban blue–green space area, the higher the future UCI value. Therefore, as climate and land cover change, increasing the area of blue–green space near cities can help adjust UCI in the future, indicating that afforestation is an adaptive measure for cities at higher risk of future UHI intensity increases in the study area.
Currently, our understanding and comprehension of the coupling relationship between urban spatial form, the UCI effect, and its mechanism at the urban macroscale are very limited. The research outcomes pertaining to this subject often present conflicting results, signifying the ongoing debates among researchers regarding the association between urban spatial form and the UHI effect. As a result, there is a necessity for continued exploration and discourse on the influence of urban spatial configuration on the UCI effect on a larger scale. Given that urban form factors are significantly impacted by spatial correlation and that the urban thermal environment is scale-dependent [31,54], it is essential to investigate and elucidate the influence of urban form indicators on the urban thermal environment across multiple spatial scales.
To predict the spatial pattern of urban land use, it is necessary to establish scenarios that can reflect future social, economic, and environmental conditions. For example, some scholars have projected the global urban land distribution map for 2030 based on the United Nations’ global population and economic projections. Some scholars have also utilized global climate scenarios developed by the IPCC to model future global and regional land cover changes, including urban land types [55]. Land use change is considered one of the most significant human factors affecting the Earth’s system. It has far-reaching physical and biogeochemical impacts on regions and even the whole world. Therefore, current Earth system models usually utilize land use records as a key input to simulate Earth system dynamics more realistically and analyze the impact of land use on climate and biogeochemical cycles. For instance, the Land Use Model Inter-comparison Project (LUMIP) was initiated in CMIP6 to gain a better understanding of the impact of land use on climate. Urban climate prediction is complicated due to non-stationary sources such as climate and land cover changes, leading to significant changes in global climate conditions [56,57]. The findings of this chapter are consistent with many previous studies, indicating that even if cities do not experience rapid urbanization, the greenhouse effect, global warming, and changes in surface characteristics will remain significant causes of future urban warming [58,59].
We acknowledge the limitations of our study and recognize that including a higher number of layers, particularly concentrated in the lowest few kilometers, would yield a more precise depiction of the urban environment and its associated effects. By making this adjustment, we can conduct a more comprehensive evaluation of the UCI phenomenon and its interaction with blue–green spaces. Additionally, we plan to enhance the accuracy of our study by downscaling climate model data using the WRF model rather than relying solely on the FNL data. This modification addresses the limitations of our original approach, such as the lack of incorporation of future changes [60,61]. In our next steps, we will conduct downscaling using the WRF model to obtain higher-resolution climate data for future scenarios outlined in the SSP scenarios. This adjustment will ensure a more accurate representation of future climate conditions and enhance the reliability of our predictions. To further improve our methodology, we will incorporate relevant insights and best practices for WRF simulations. By doing so, we aim to refine our approach and gain deeper insights into the most effective methods for conducting downscaling using the WRF model.
In this study, the performance of 15 climate models from CMIP6 was evaluated in terms of their ability to simulate the annual average temperature, annual maximum temperature, and annual minimum temperature in the ESLZ. The results indicate that the model set was able to simulate the temporal and spatial distribution characteristics and evolution of temperature in the northern subtropical region of China well. However, this study only used the method of the set average weight arithmetic average to realize the pattern set. If the results can be further screened according to the statistical values of each pattern and different weight systems are allocated to realize the pattern set, the simulation effect will be further improved. In the future, the application of different datasets can only serve as a reference, and using different evaluation indicators to evaluate the simulation ability of climate models may lead to different conclusions. Therefore, it is necessary to further evaluate the simulation results of climate models at multiple spatial and temporal scales.

4.2. The Blue–Green Model in Land Spatial Planning

The simulation results presented in this paper, using the WRF mesoscale model and the blue–green space reference scheme, demonstrate the significant impact of land surface changes on the temperature patterns of the entire region. Based on a reasonable reference scheme, the cooling island effect of blue–green spaces is even more pronounced (see Figure 10). Considering the context of global warming and the increasing occurrence of extreme heat events, it is imperative to establish scientifically robust and efficient approaches to enhance urban climates and promote the sustainable development of future urban ecosystems. Therefore, clarifying the temporal and spatial variations of the mitigation of UHI effects, enhancing UCI effects, revealing their underlying mechanisms, and proposing adaptive measures are critical topics for research on climate change and urbanization [62,63,64,65]. The UCI effect is influenced by meteorological conditions, urban blue–green space form, underlying surface characteristics, and anthropogenic heat emissions. Previous studies have focused more on meteorological conditions and urban underlying surface characteristics; however, in fact, urban blue–green space plays a key role in the formation and development of the cooling island effect [14,15].
The urban blue–green spatial form refers to the relationship and organizational characteristics of urban blue–green elements in the spatial plane and vertical height. Given the context of global warming and accelerated urbanization, clarifying the influence of urban blue–green spatial form on the UCI effect holds great theoretical and practical value. Such exploration would not only deepen our scientific understanding of the UCI effect and global climate change, but it would also provide a basis for spatial planning and related parameter regulation on different scales to alleviate the UHI effect by optimizing urban blue–green spatial form. Hence, it is essential to explore the interplay and mechanisms between urban spatial configuration and the heat island effect across various spatial scales. Additionally, identifying the scale at which key indicators of urban blue–green spatial form have the most significant impact on the cooling island effect is crucial for a comprehensive understanding of the phenomenon.
The urban area only occupies a small portion of the global land area, yet it supports more than half of the world’s population. However, urban blue–green space, which covers a smaller portion of urban land, is often unstable. The expansion of urban areas has surpassed the growth of urban populations, resulting in profound impacts on biodiversity conservation, water, carbon, aerosol, and nitrogen cycles in local and global climate systems. Anthropogenic greenhouse gas emissions in urban areas account for 70% of the world’s emissions. Moreover, urban expansion has led to the loss of over 80% of the local natural habitats. Therefore, it is of utmost importance to gain a proper understanding of how future urban land use changes will impact other land covers. This understanding is vital for addressing environmental challenges, ensuring social stability and environmental security, and fostering the sustainable development of human society. To predict the spatial pattern of urban land use, it is necessary to establish a scenario that reflects future socio-economic and environmental conditions.
The study of the relationship between urban morphology and urban thermal environment and the cooling island effect has made some progress from the perspective of urban macro-scale. The indicators closely related to the cooling island effect on the macro scale include two-dimensional layout such as land use, urban function layout, vegetation coverage, and urban three-dimensional spatial morphology. Land use change, impervious area, vegetation, and water are the most important factors affecting the UHI effect. The rapid development of remote sensing technology provides technical support for revealing the coupling relationship between urban macro-scale cooling island intensity and urban surface parameters such as land use. However, few studies have considered the driving mechanism of land use change and urban blue–green space form on the UCI effect from an urban macro-scale perspective [66]. To sum up, the current understanding of the coupling relationship between urban spatial form and the UCI effect and its mechanism at the macroscale of the city is very limited, and the research conclusions are usually contradictory, which shows that researchers are still controversial about the relationship between urban blue–green space form and UHI. Therefore, the impact of urban blue–green space on the UCI effect on the macroscale remains to be further studied and discussed. At the same time, the correlation between blue–green spatial form, layout, and the cooling island effect is not necessarily linear. It is necessary to investigate whether commonly used parameter regression and other methods can accurately capture the correlation between the two variables. Exploring machine learning algorithms, which do not rely on predetermined relationship models, can provide valuable insights for optimizing correlation studies [67,68,69,70,71].

5. Conclusions

In order to assess the future changes in the UHI effect in a quantitative manner, it is crucial to establish effective integration and connection between the projected future temperature and the scale, structure, and layout of blue–green spaces. This coupling is essential for examining the current effectiveness and performance of strategies such as enhancing green cover or incorporating water bodies, as well as projecting their efficacy under varying climate conditions. Our findings suggest that the variability of the UCI intensity change indication depends on the scenario of SSPs considered in the analysis. Considering the abundance of blue–green space in Huai’an City, Yancheng City, and Yangzhou City, the UCI effect becomes more pronounced under various SSP scenarios. Cities characterized by a larger extent of bright blue–green space are expected to encounter a lesser decline in the UCI effect in the future. Our research adds to the existing knowledge regarding the long-term effects of blue–green spaces in the context of future climate conditions, an area that has received relatively limited attention thus far. Through offering significant scientific guidance for future urban planning, our discoveries can shape the creation of sustainable and resilient urban environments, thereby aiding in the mitigation of the detrimental impacts of climate change.

Author Contributions

All authors conceived, designed, and implemented the study. Conceptualization: Z.P. and Z.X.; methodology: F.Q.; software: J.L.; validation: Y.P. and Q.L.; formal analysis: J.L. and N.D.; investigation and resources: Y.P.; data curation: J.L., Q.L. and N.D.; original draft preparation: Z.P. and Z.X.; and review and editing: Z.X. and F.Q. All authors have read and agreed to the published version of the manuscript.

Funding

This research was funded jointly by the National Science & Technology Infrastructure of China: (No.2005DKA32300), the National Science and Technology Platform Construction Project of China (2005DKA32300), and Major Projects of the Ministry of Education Base (16JJD770019) in China.

Data Availability Statement

The data and codes that support the findings of this study are available on request from the corresponding author.

Acknowledgments

The research work was financially supported by the National Science & Technology Infrastructure of China: (No.2005DKA32300). Many thanks are extended to the National Science & Technology Infrastructure of China (No. 2005DKA32300), the Major Projects of the Ministry of Education (No. 16JJD770019), and the Data Sharing Infrastructure of Earth System Science Data Centre of the Lower Yellow River Region (http://henu.geodata.cn, accessed on 3 July 2023).

Conflicts of Interest

The authors declare no conflict of interest.

References

  1. Zhou, L.; Edickinson, R.; Tian, Y.; Myneni, R.B. Evidence for a significant urbanization effect on climate in China. Proc. Natl. Acad. Sci. USA 2004, 101, 9540–9544. [Google Scholar] [CrossRef] [PubMed]
  2. Patz, J.A.; Campbelllendrum, D.; Holloway, T.; Foley, J.A. Impact of regional climate change on human health. Nature 2005, 438, 310–317. [Google Scholar] [CrossRef] [PubMed]
  3. Stewart, I.D. A systematic review and scientific critique of methodology in modern urban heat island literature. Int. J. Climatol. 2011, 31, 200–217. [Google Scholar] [CrossRef]
  4. Cao, C.; Lee, X.; Liu, S.; Oleson, K.W.; Schultz, N.M.; Xiao, W.; Zhang, M.; Zhao, L. Urban heat islands in China enhanced by haze pollution. Nat. Commun. 2016, 7, 12509. [Google Scholar] [CrossRef] [PubMed]
  5. Estoque, R.C.; Murayama, Y.; Myint, S.W. Effects of landscape composition and pattern on land surface temperature: An urban heat island study in the megacities of Southeast Asia. Sci. Total Environ. 2017, 577, 349–359. [Google Scholar] [CrossRef]
  6. Oleson, K.; Anderson, G.; Jones, B.; McGinnis, S.A.; Sanderson, B. Avoided climate impacts of urban and rural heat and cold waves over the US using large climate model ensembles for RCP8.5 and RCP4.5. Clim. Chang. 2018, 146, 377–392. [Google Scholar] [CrossRef] [Green Version]
  7. Peng, J.; Ma, J.; Liu, Q.; Liu, Y.; Hu, Y.; Li, Y.; Yue, Y. Spatial-temporal change of land surface temperature across 285 cities in China: An urban-rural contract perspective. Sci. Total Environ. 2018, 635, 487–497. [Google Scholar] [CrossRef]
  8. Besir, A.B.; Cuce, E. Green roofs and facades: A comprehensive review. Renew. Sustain. Energy Rev. 2018, 82, 915–939. [Google Scholar] [CrossRef]
  9. Santamouris, M. Recent progress on urban overheating and heat island research. Integrated assessment of the energy, environmental, vulnerability and health impact synergies with the global climate change. Energy Build. 2020, 207, 109482. [Google Scholar] [CrossRef]
  10. Zhao, L.; Lee, X.; Smith, R.B.; Oleson, K. Strong contributions of local back-ground climate to urban heat islands. Nature 2014, 511, 216–219. [Google Scholar] [CrossRef]
  11. O’Neill, B.C.; Kriegler, E.; Riahi, K.; Ebi, K.L.; Hallegatte, S.; Carter, T.R.; Mathur, R.; van Vuuren, D.P. A new scenario framework for climate change research: The concept of Shared Socioeconomic Pathways. Clim. Chang. 2014, 122, 387–400. [Google Scholar] [CrossRef] [Green Version]
  12. Zhou, D.; Zhao, S.; Liu, S.; Zhang, L.; Zhu, C. Surface urban heat island in China’s 32 major cities: Spatial patterns and drivers. Remote Sens. Environ. 2014, 152, 51–61. [Google Scholar] [CrossRef]
  13. Zhao, W.; Wang, W.J.; Hou, G.L.; Gong, C.; Jiang, M.; Lyu, X. Cooling effects of different wetlands in semi-arid rural region of northeast China. Theor. Appl. Climatol. 2020, 141, 31–41. [Google Scholar]
  14. Guo, G.; Zhou, X.; Wu, Z.; Gong, C.; Lyu, X. Characterizing the impact of urban morphology heterogeneity on land surface temperature in Guangzhou, China. Environ. Model. Softw. 2016, 84, 427–439. [Google Scholar] [CrossRef]
  15. Allegrini, J.; Carmeliet, J. Coupled CFD and building energy simulations for studying the impacts of building height topology and buoyancy on local urban microclimates. Urban Clim. 2017, 21, 278–305. [Google Scholar] [CrossRef]
  16. Peng Hu, Y.; Dong, J.; Liu, Q.; Liu, Y. Quantifying spatial morphology and connectivity of urban heat islands in a megacity: A radius approach. Sci. Total Environ. 2020, 714, 136792. [Google Scholar] [CrossRef]
  17. Yang, G.; Yu, Z.; Jørgensen, G.; Vejre, H. How can urban blue-green space be planned for climate adaption in high-latitude cities? A seasonal perspective. Sustain. Cities Soc. 2020, 53, 101932. [Google Scholar] [CrossRef]
  18. O’Malley, C.; Piroozfar, P.; Farr, E.R.P.; Pomponi, F. Urban heat island (UHI) mitigating strategies: A case-based comparative analysis. Sustain. Cities Soc. 2015, 19, 222–235. [Google Scholar] [CrossRef] [Green Version]
  19. Peng, J.; Xie, P.; Liu, Y.; Jing, M. Urban thermal environment dynamics and associated landscape pattern factors: A case study in the Beijing metropolitan region. Remote Sens. Environ. 2016, 173, 145–155. [Google Scholar] [CrossRef]
  20. Ren, Z.; He, X.; Pu, R.; Zheng, H. The impact of urban forest structure and its spatial location on urban cool island intensity. Urban Ecosyst. 2018, 21, 863–874. [Google Scholar] [CrossRef]
  21. Yu, Z.; Guo, X.; Jørgensen, G.; Vejre, H. How can urban green spaces be planned for climate adaptation in subtropical cities? Ecol. Indic. 2017, 82, 152–162. [Google Scholar] [CrossRef]
  22. Fan, H.; Yu, Z.; Yang, G.; Liu, T.Y.; Hung, C.H.; Vejre, H. How to cool hot humid (Asian) cities with urban trees? An optimal landscape size perspective. Agric. For. Meteorol. 2019, 265, 338–348. [Google Scholar] [CrossRef]
  23. IPCC. Climate change 2021, The physical science basis. In Working Group I Contribution to the Fourth Assessment Report of the Intergovernmental Panel on Climate Change; Cambridge University Press: Cambridge, UK, 2021. [Google Scholar]
  24. Fricko, O.; Havlik, P.; Rogelj, J.; Klimont, Z.; Gusti, M.; Johnson, N.; Kolp, P.; Strubegger, M.; Valin, H.; Amann, M.; et al. The marker quantification of the Shared Socioeconomic Pathway 2, A middle-of-the-road scenario for the 21st century. Glob. Environ. Chang. 2017, 42, 251–267. [Google Scholar] [CrossRef] [Green Version]
  25. Fujimori, S.; Hasegawa, T.; Masui, T.; Takahashi, K.; Herran, D.S.; Dai, H.; Hijioka, Y.; Kainuma, M. SSP3, AIM implementation of Shared Socioeconomic Pathways. Glob. Environ. Chang. 2017, 42, 268–283. [Google Scholar] [CrossRef]
  26. Kriegler, E.; Bauer, N.; Popp, A.; Humpenöder, F.; Leimbach, M.; Strefler, J.; Baumstark, L.; Bodirsky, B.L.; Hilaire, J.; Klein, D.; et al. Fossil-fueled development (SSP5): An energy and resource intensive scenario for the 21st century. Glob. Environ. Chang. 2017, 42, 297–315. [Google Scholar] [CrossRef] [Green Version]
  27. Kusaka, H.; Hara, M.; Takane, Y. Urban climate projection by the WRF model at 3-km horizontal grid increment: Dynamical downscaling and predicting heat stress in the 2070′s august for Tokyo, Osaka, and Nagoya metropolises. J. Meteorol. Soc. Jpn 2012, 90B, 47–63. [Google Scholar] [CrossRef] [Green Version]
  28. Adachi, S.A.; Kimura, F.; Kusaka, H.; Inoue, T.; Ueda, H. Comparison of the impact of global limate changes and urbanization on summertime future climate in the Tokyo Metropolitan Area. J. Appl. Meteorol. Climatol. 2012, 51, 1441–1454. [Google Scholar] [CrossRef]
  29. Argüeso, D.; Evans, J.; Fita, L.; Bormann, K.J. Temperature response to future urbanization and climate change. Clim. Dyn. 2014, 42, 2183–2199. [Google Scholar] [CrossRef]
  30. Sachindra, D.A.; Ullah, S.; Zaborski, P.; Nowosad, M.; Dobek, M. Temperature and urban heat island effect in lublin city in poland under changing climate. Theor. Appl. Climatol. 2022, 151, 667–690. [Google Scholar] [CrossRef]
  31. Das, M.; Das, A.; Momin, S. Quantifying the cooling effect of urban green space: A case from urban parks in a tropical mega metropolitan area (India). Sustain. Cities Soc. 2022, 87, 104062. [Google Scholar] [CrossRef]
  32. Gaur, A.; Simonovic, S.P. Application of physical scaling towards downscaling climate model precipitation data. Theor. Appl. Climatol. 2017, 132, 287–300. [Google Scholar] [CrossRef]
  33. Gaur, A.; Simonovic, S.P. Accessing vulnerability of land-cover types to climate change using physical scaling downscaling model. Int. J. Climatol. 2017, 37, 2901–2912. [Google Scholar] [CrossRef]
  34. Gaur, A.; Simonovic, S.P. Extension of physical scaling method and its application towards downscaling climate model based near surface air temperature. Int. J. Climatol. 2017, 37, 3353–3366. [Google Scholar] [CrossRef]
  35. Gaur, A.; Eichenbaum, M.K.; Simonovic, S.P. Analysis and modelling of surface urban heat island in 20 canadian cities under climate and land-cover change. J. Environ. Manag. 2018, 206, 145–157. [Google Scholar] [CrossRef] [PubMed]
  36. Sharma, R.; Hooyberghs, H.; Lauwaet, D.; De Ridder, K. Urban heat island and future climate change-implications for delhi’s heat. J. Urban Health 2019, 96, 235–251. [Google Scholar] [CrossRef] [PubMed]
  37. Keat, W.J.; Kendon, E.J.; Bohnenstengel, S.I. Climate change over uk cities: The urban influence on extreme temperatures in the uk climate projections. Clim. Dyn. 2021, 57, 3583–3597. [Google Scholar] [CrossRef]
  38. Chen, G.; Li, X.; Liu, X.; Chen, Y.; Liang, X.; Leng, J.; Xu, X.; Liao, W.; Qiu, Y.; Wu, Q.; et al. Global projections of future urban land expansion under shared socioeconomic pathways. Nat. Commun. 2020, 11, 537. [Google Scholar] [CrossRef] [Green Version]
  39. Pierce, D.W.; Barnett, T.P.; Santer, B.D.; Gleckler, P.J. Gleckler. Selecting global climate models for regional climate change studies. Proc. Natl. Acad. Sci. USA 2009, 106, 8441–8446. [Google Scholar] [CrossRef]
  40. Huang, P.; Ying, J. A multimodel ensemble pattern regression method to correct the tropical Pacific SST change patterns under global warming. J. Clim. 2015, 28, 4706–4723. [Google Scholar] [CrossRef]
  41. Kusaka, H.; Kimura, F. Thermal effects of urban canyon structure on the nocturnal heat is- land: Numerical experiment using a mesoscale model coupled with an urban canopy model. J. Appl. Meteorol. 2004, 43, 1899–1910. [Google Scholar] [CrossRef]
  42. Kusaka, H.; Kimura, F. Coupling a single-layer urban canopy model with a simple atmo- spheric model: Impact on urban heat island simulation for an idealized case. J. Meteorol. Soc. Japan. Ser. II 2004, 82, 67–80. [Google Scholar] [CrossRef] [Green Version]
  43. Carvalho, D.; Rocha, A.; Gómez-Gesteira, M.; Santos, C.S. WRF wind simulation and wind energy production estimates forced by different reanalyses: Comparison with observed data for Portugal. Appl. Energy 2014, 117, 116–126. [Google Scholar] [CrossRef]
  44. Kim, E.; Choi, K.; Park, S.; Kim, M.-H.; Kim, S.-W.; Park, M.-S.; Ahn, M.-H.; Park, Y.-S.; Song, C.-K. Turbulent characteristics in complex coastal areas assessed using BSWO observations and WRF-LES simulation results. Atmos. Res. 2023, 289, 106756. [Google Scholar] [CrossRef]
  45. Papangelis, G.; Tombrou, M.; Dandou, A.; Kontos, T. An urban “green planning” approach utilizing the Weather Research and Forecasting (WRF) modeling system: A case study of Athens, Greece. Landsc. Urban Plan. 2012, 105, 174–183. [Google Scholar] [CrossRef]
  46. Gholami, S.; Ghader, S.; Khaleghi-Zavareh, H.; Ghafarian, P. Sensitivity of WRF-simulated 10 m wind over the Persian Gulf to different boundary conditions and PBL parameterization schemes. Atmos. Res. 2020, 247, 105147. [Google Scholar] [CrossRef]
  47. Huang, D.; Gao, S. Impact of different reanalysis data on WRF dynamical downscaling over China. Atmos. Res. 2017, 200, 25–35. [Google Scholar] [CrossRef]
  48. Chen, C.; Sasa, K.; Ohsawa, T.; Prpić-Oršić, J. Comparative study on WRF model simulations from the viewpoint of optimum ship routing. Ocean. Eng. 2020, 207, 107379. [Google Scholar] [CrossRef]
  49. Chu, Y.; Li, J.; Li, C.; Tan, W.; Su, T.; Li, J. Seasonal and diurnal variability of planetary boundary layer height in Beijing: Intercomparison between MPL and WRF results. Atmos. Res. 2019, 227, 1–13. [Google Scholar] [CrossRef]
  50. Pan, Z.; Xie, Z.; Wu, L.; Pan, Y.; Ding, N.; Liang, Q.; Qin, F. Simulation of Cooling Island Effect in Blue-Green Space Based on Multi-Scale Coupling Model. Remote Sens. 2023, 15, 2093. [Google Scholar] [CrossRef]
  51. Umberto, B.; Zahra, J.; Jonathan, G. Effects of greenery enhancements for the resilience to heat waves: A comparison of analysis performed through mesoscale (WRF) and microscale (Envi-met) modeling. Sci. Total Environ. 2020, 747, 141300. [Google Scholar]
  52. Khan, A.; Chatterjee, S.; Weng, Y. Urban Heat Island Modeling for Tropical Climates; Elsevier: Amsterdam, The Netherlands, 2020. [Google Scholar]
  53. Wang, J.; Yan, Z.; Quan, X.-W.; Feng, J. Urban warming in the 2013 summer heat wave in eastern China. Clim. Dyn. 2016, 48, 3015–3033. [Google Scholar] [CrossRef]
  54. Wu, J.; Yang, S.; Zhang, X. Interaction analysis of urban blue-green space and built-up area based on coupling model—A case study of wuhan central city. Water 2020, 12, 2185. [Google Scholar] [CrossRef]
  55. Popp, A.; Calvin, K.; Fujimori, S.; Havlik, P.; Humpenöder, F.; Stehfest, E.; Bodirsky, B.L.; Dietrich, J.P.; Doelmann, J.C.; Gusti, M.; et al. Land-use futures in the shared socio-economic pathways. Glob. Environ. Chang. 2017, 42, 331–345. [Google Scholar] [CrossRef] [Green Version]
  56. Intergovernmental Panel on Climate Change. Climate Change: The Physical Science Basis. In Contribution of Working Group I to the Fifth Assessment Report of the Intergovernmental Panel on Climate Change; Cambridge University Press: Cambridge, UK; New York, NY, USA, 2013; pp. 33–115. [Google Scholar]
  57. Pielke, R.A.; Pitman, A.; Niyogi, D.; Mahmood, R.; McAlpine, C.; Hossain, F.; Goldewijk, K.K.; Nair, U.; Betts, R.; Fall, S.; et al. Land use/land cover changes and climate: Modeling analysis and observational evidence. Wiley Interdiscip. Rev. Clim. Chang. 2011, 2, 828–850. [Google Scholar] [CrossRef]
  58. Ogashawara, I.; Bastos, V. A quantitative approach for analyzing the relationship between urban heat islands and land cover. Remote Sens. 2012, 4, 3596–3618. [Google Scholar] [CrossRef] [Green Version]
  59. Dereczynski, C.; Silva, W.L.; Marengo, J. Detection and projections of climate change in Rio de Janeiro, Brazil. Am. J. Clim. Chang. 2013, 2, 25–33. [Google Scholar] [CrossRef] [Green Version]
  60. Bowden, J.H.; Otte, T.L.; Nolte, C.G.; Otte, M.J. Examining Interior Grid Nudging Techniques Using Two-Way Nesting in the WRF Model for Regional Climate Modeling. J. Clim. 2012, 25, 2805–2823. [Google Scholar] [CrossRef]
  61. Raghavan, S.V.; Vu, M.T.; Liong, S.Y. Regional climate simulations over Vietnam using the WRF model. Theor. Appl. Climatol. 2015, 126, 161–182. [Google Scholar] [CrossRef]
  62. Zhou, T.J.; Yu, R.C. Twentieth-Century Surface Air Temperature over China and the Globe Simulated by Coupled Climate Models. J. Clim. 2006, 19, 5843–5858. [Google Scholar] [CrossRef]
  63. Cao, X.; Onishi, A.; Chen, J.; Imura, H. Quantifying the cool island intensity of urban parks using ASTER and IKONOS data. Landsc. Urban Plan. 2010, 96, 225–231. [Google Scholar] [CrossRef]
  64. Estrada, F.; Botzen, W.W.; Tol, R.S. A global economic assessment of city policies to reduce climate change impacts. Nat. Clim. Chang. 2017, 7, 403–406. [Google Scholar] [CrossRef]
  65. Yu, Z.; Yang, G.; Zuo, S.; Jørgensen, G.; Koga, M.; Vejre, H. Critical review on the cooling effect of urban blue-green space: A threshold-size perspective. Urban For. Urban Green. 2020, 49, 126630. [Google Scholar] [CrossRef]
  66. Zhou, X.; Chen, H. Impact of urbanization-related land use land cover changes and urban morphology changes on the urban heat island phenomenon. Sci. Total Environ. 2018, 635, 1467–1476. [Google Scholar] [CrossRef] [PubMed]
  67. Yu, Z.; Chen, S.; Wong, N.H.; Ignatius, M.; Deng, J.; He, Y.; Hii, D.J.C. Dependence between urban morphology and outdoor air temperature: A tropical campus study using random forests algorithm. Sustain. Cities Soc. 2020, 61, 102200. [Google Scholar] [CrossRef]
  68. Xie, Z.; Stuart, R.; Edward, T.; Pannell, D.; Hobbs, R.; Briggs, P.; McDonald-Madden, E. Using Landsat observations (1988–2017) and Google Earth Engine to detect vegetation cover changes in rangelands–A first step towards identifying degraded lands for conservation. Remote Sens. Environ. 2019, 232, 111317. [Google Scholar] [CrossRef]
  69. Fu, B.; Lan, F.; Yao, H.; Qin, J.; He, H.; Liu, L.; Huang, L.; Fan, D.; Gao, E. Spatio-temporal monitoring of marsh vegetation phenology and its response to hydro-meteorological factors using CCDC algorithm with optical and SAR images: In case of Honghe National Nature Reserve, China. Sci. Total Environ. 2022, 843, 156990. [Google Scholar] [CrossRef]
  70. Xie, Z.; Game, E.T.; Hobbs, R.J.; Pannell, D.J.; Phinn, S.R.; McDonald-Madden, E. Conservation opportunities on uncontested lands. Nat. Sustain. 2020, 3, 9–15. [Google Scholar] [CrossRef]
  71. Zhao, C.; Jia, M.; Wang, Z.; Mao, D.; Wang, Y. Toward a better understanding of coastal salt marsh mapping: A case from China using dual-temporal images. Remote Sens. Environ. 2023, 295, 113664. [Google Scholar] [CrossRef]
Figure 1. Flow chart.
Remotesensing 15 03642 g001
Figure 2. Study area.
Remotesensing 15 03642 g002
Figure 3. Spatial distribution of land use in the 2030s and change based on it under the SSP2-4.5 scenario.
Remotesensing 15 03642 g003
Figure 4. Spatial distribution of land use in the 2030s and change based on it under the SSP5-8.5 scenario.
Remotesensing 15 03642 g004
Figure 5. Spatial distribution of temperature in the 2030s and the corresponding changes based on it under the SSP2-4.5 scenario.
Remotesensing 15 03642 g005
Figure 6. Spatial distribution of temperature in the 2030s and the corresponding changes based on it under the SSP5-8.5 scenario.
Remotesensing 15 03642 g006
Figure 7. Spatial distribution temperature trends from 2021 to 2100 under the SSP2-4.5 and SSP5-8.5 scenarios. (Forest: FO; Grassland: GR; Arable land: AR; Water: WA; Wetland: WE; Development land: DE; Bare land: BA).
Remotesensing 15 03642 g007
Figure 8. Intensity change of the UCI effect in the future.
Remotesensing 15 03642 g008
Figure 9. Scatter plot of UCI intensity and land use conversion under SSP2-4.5 and SSP5-8.5 scenarios (p = 0.05).
Remotesensing 15 03642 g009
Figure 10. Scatter plot of UCI intensity and blue–green spatial area under the SSP2-4.5 and SSP5-8.5 scenarios (p = 0.05).
Remotesensing 15 03642 g010
Figure 11. Simulation diagram of 2 m temperature on the hottest day in summer in the ESLZ based on the reference scheme.
Remotesensing 15 03642 g011
Table 1. Basic information on 15 global climate models in CMIP6.
NumberMode NameResearch InstitutionsResolution
1ACCESS-ESM1-5Commonwealth Scientific and Industrial Research Organization of Australia1.875° × 1.24°
2BCC-CSM2-MRChina National Climate Center1.125° × 1.125°
3CanESM5-CanOECanadian Centre for Climate Modeling and Analysis2.8125° × 2.8125°
4CMCC-ESM2European Mediterranean Climate Change Center, Italy1.875° × 1.875°
5CNRM-ESM2-1French National Centre for Meteorological Research1.4° × 1.4°
6EC-Earth3-Veg-LREuropean Union Earth System Model Alliance1.125° × 1.125°
7FIO-ESM-2-0First Institute of Oceanography, State Oceanic Administration, China2.875° × 1.1°
8GISS-E2-1-HNASA’s Gold Institute for Space Studies2.5° × 2.0°
9HadGEM3-GC31-LLMet Office Hadley Center1.875° × 1.25°
10INM-CM5-0Institute of Numerical Mathematics, Russian Academy of Sciences2.0° × 1.6°
11IPSL-CM6A-LRInstitute Pierre Simon Laplace, France2.5° × 1.25°
12MIROC6Japan Environmental Research Institute and Japan Earth Environment Research Center1.40625° × 1.40625°
13MPI-ESM1-2-LRMax Planck Institute of Meteorology, Germany; Japan Meteorological Research Institute1.875° × 1.875°
14MRI-ESM2-0Japanese Meteorological graduate student1.125° × 1.126°
15UKESM1-0-LLEarth System Centre, UK/New Zealand1.875° × 1.25°
Table 2. Root mean square error and determination coefficient values of observed data and air temperature data under the SSP2-4.5 scenario in the same period.
CityMaxMeanMin
R2RMSE (°C)R2RMSE (°C)R2RMSE (°C)
Huai’an0.980.760.951.30.951.26
Yancheng0.960.940.921.490.961.02
Yangzhou0.960.970.921.660.961.13
Taizhou0.970.980.961.420.971.04
Chuzhou0.971.020.951.320.961.08
Table 3. Physical parameters in WRF-UCM V4.0.3.
Configurationd01d02d03
VersionARW-WRF V4.0.3
Initial and Boundary conditionsNCEP FNL
Run time4 August 2018 02 h~6 August 2018 02 h
Time period of analysis5 August 2018
Grid distance (km)931
Grid number537 × 402693 × 495936 × 792
Number of vertical layers51 layers
MicrophysicsWSM 6-class grauple
Short-wave radiationRrtm scheme
Long-wave radiationDudhia scheme
Surface layer modelNoah-LSM + Single-Layer UCM
Planetary boundary layerMellor-Yamada-Janjic (ETA) TKE scheme
CumulusKain-Fritsch schemeNoneNone
LUCC DataOnly Study Area
Table 6. Intensity change of the UCI effect in four time periods under the future scenario.
CitySSP2-4.5 (°C)SSP5-8.5 (°C)
2021~20402041~20602061~20802081~21002021~20402041~20602061~20802081~2100
Huai’an0.480.390.310.280.420.310.270.25
Yancheng0.560.370.290.270.380.290.250.23
Yangzhou0.370.320.260.240.310.280.230.19
Taihzou0.130.09−0.11−0.17−0.08−0.01−0.23−0.31
Chuzhou0.08−0.01−0.19−0.31−0.03−0.14−0.21−0.33
Disclaimer/Publisher’s Note: The statements, opinions and data contained in all publications are solely those of the individual author(s) and contributor(s) and not of MDPI and/or the editor(s). MDPI and/or the editor(s) disclaim responsibility for any injury to people or property resulting from any ideas, methods, instructions or products referred to in the content.

