

The SOLAR-HRS New High-Resolution Solar Spectra for Disk-Integrated, Disk-Center, and Intermediate Cases


Laboratoire Atmosphères Observations Spatiales (LATMOS), Centre National de la Recherche Scientifique (CNRS), Université de Versailles Saint-Quentin-en-Yvelines (UVSQ), Université Paris-Saclay, Sorbonne Université (SU), 11 Boulevard d’Alembert, 78280 Guyancourt, France
*
Author to whom correspondence should be addressed.
Remote Sens. 2023, 15(14), 3560; https://doi.org/10.3390/rs15143560
Submission received: 20 May 2023
/
Revised: 8 July 2023
/
Accepted: 10 July 2023
/
Published: 15 July 2023
(This article belongs to the Special Issue New Challenges in Solar Radiation, Modeling and Remote Sensing II)
Abstract
:The solar spectrum at the top of the atmosphere contains crucial data for solar physics, astronomy, and geophysics. Accurately determining high-resolution solar reference spectra, whether they are disk-integrated, disk-center, or intermediate cases, represents a new challenge and is of primary importance for all applications where spectral solar radiation needs to be evaluated. These spectra are also essential for interpreting remote sensing measurements that rely on sunlight, such as those obtained by Earth observation satellites or spacecraft exploring other planets. This paper lays a foundation for the implementation of multiple new solar irradiance reference spectra that have high resolution and are representative of solar minimum conditions. We developed the SOLAR high-resolution extraterrestrial reference spectra (SOLAR-HRS disk-integrated spectra) by normalizing high-spectral-resolution solar line data to the absolute irradiance scale of the SOLAR-ISS reference spectrum. The resulting one-of-a-kind SOLAR-HRS disk-integrated spectrum has a spectral resolution varying between 0.001 and 1 nm in the 0.5–4400 nm wavelength range. We also implemented a new high-resolution solar spectrum at the disk-center, covering a range of 650–4400 nm with a spectral resolution of 0.001 to 0.02 nm. We further expanded our analysis by producing several solar spectra for ten different solar view angles ranging from = 0.9 to = 0.05 (SOLAR-HRS intermediate cases). Finally, we developed new Merged Parallelised Simplified ATLAS spectra (MPS-ATLAS) based on solar modeling with Kurucz and Vald3 solar linelists for both the disk-integrated and disk-center spectra. One of the objectives of implementing all these new solar spectra is to fulfill the requirements of the MicroCarb space mission, which focuses on measuring greenhouse gas emissions. The solar data of this study are openly available.
1. Introduction
The solar spectrum is the distribution of electromagnetic radiation emitted by the Sun as a function of wavelength [1], ranging from gamma rays to radio waves. It can be categorized into several bands, namely, gamma-ray (10 fm to 1 pm), X-ray (1 pm to 10 nm), ultraviolet (10–380 nm), visible (380–780 nm), infrared (780 nm to 1 mm), microwave (1–15 mm), and radio wavelengths (0.1 mm to 100 m). An accurate knowledge of the solar spectrum [2,3,4,5,6,7,8,9,10] represents an important input for various disciplines and areas, including astronomy and astrophysics, solar physics, atmospheric science, remote sensing and its application, solar energy [11], materials science, and medical science.
The solar spectrum provides essential data for studying the physical processes that occur in the Sun, such as nuclear fusion, energy transfer, and magnetic field generation. By analyzing the solar spectrum in detail, we can obtain valuable information about the chemical composition, temperature, and density of various layers in the solar atmosphere, as well as the presence of magnetic fields and other phenomena. This knowledge is crucial for advancing our understanding of the Sun. Three main kinds of solar spectra are of interest:
- The disk-integrated solar spectrum (Figure 1) and its variations over time, which are important for understanding the solar variability and its underlying mechanisms.
- The disk-center solar spectrum (with the deepest and warmest layers at the center) and limb darkening, which are important for the construction and verification of solar model atmospheres and therefore for a better understanding of the solar atmosphere.
- Solar spectra for different solar view angles, which are crucial for our understanding of both spatially resolved solar spectral radiance and full-disk spectral irradiance.
The three kinds of solar spectra also have broad utility in atmospheric science and climate applications. They are often used for sensor radiometric calibration and for converting satellite radiance measurements to reflectance values, which represent a key step in many remote sensing applications. As a result, the Sun frequently serves as a reference for instrument calibration to ensure the reliability of quantitative studies in remote sensing [12]. It is also used as a stable and well-characterized source of light for precision space-based instruments that measure the absorption of greenhouse gases in the Earth’s atmosphere (carbon dioxide, methane, dioxygen, water vapor, etc.). Therefore, the absolute accuracy of the solar spectra (disk-integrated, disk-center, and different solar view angles) plays a vital role in the Global Space-based Inter-Calibration System (GSICS) as part of international efforts dedicated to climate monitoring, weather forecasting, and environmental applications. There are various solar reference spectra available for these important applications. Some are derived from direct solar irradiance observations made by one or more satellite instruments. These spectra are known for their relatively high reported accuracy but have lower spectral resolution (a few tenths of a nm) compared to ground-based observations. Other solar reference spectra are created by normalizing high-spectral-resolution solar lines to a spectrum with higher accuracy but lower resolution. Models are also developed to provide very high spectral resolution solar spectra.
Discrepancies have been observed between the available solar reference spectra and independent measurements, exceeding the quoted accuracies [10,13,14]. Therefore, it is important to implement new accurate solar reference spectra at one astronomical unit with very high spectral resolution and over a wide range of wavelengths.
This innovative work provides a new high-resolution extraterrestrial solar reference spectrum (SOLAR-HRS disk-integrated spectrum), which represents an important new constraint for scientific analyses in a broad array of fields. SOLAR-HRS has a spectral resolution varying between ∼0.001 and 1 nm in the 0.5–4400.0 nm wavelength range. This study also provides a new solar SOLAR-HRS disk-center spectrum in the 650.0–4400.0 nm wavelength range and several solar spectra (SOLAR-HRS intermediate cases) for ten different solar view angles from = 0.9 to = 0.05, where is the cosine of the emission angle (direction from a point on the surface of the limb-darkened body of the Sun toward the observer with respect to the local vertical direction (0 at center of disk, 90 at edge of disk)). These different spectra are obtained by normalizing high-spectral-resolution solar line data to the absolute irradiance scale of the SOLAR-ISS reference spectrum [9]. We have additionally developed new solar spectra based on models (MPS-ATLAS) to enable comparisons. To address other needs (solar cell testing and photovoltaic devices), we developed two high-resolution spectra at air mass 1.5 (AM1.5 in vacuum and air) in the 650.0–4400.0 nm wavelength range. The AM1.5 solar spectrum refers to the standard spectral distribution of solar radiation that has been filtered by the Earth’s atmosphere at sea level (1.5 atmosphere thickness corresponds to a solar zenith angle of 48.2).
Section 2 presents MicroCarb’s scientific requirements regarding the expected accuracy of solar spectra. Section 3 discusses the various methods used to determine the solar spectra. Section 4 describes the methodology used to develop the SOLAR-HRS and MPS-ATLAS spectra, while Section 5 provides a description of the new solar spectra and a comparison to independent datasets. Finally, Section 6 contains a discussion and concluding statements.
2. MicroCarb’s Scientific Needs Regarding the Disk-Integrated Solar Spectrum
An increasing number of space missions need to use accurate solar reference spectra for the calibration requirements of their instruments. This is the case for the MicroCarb mission [15], which requires a high-resolution and high-precision solar spectrum to infer the concentration of carbon dioxide (CO). It aims to measure integrated CO concentrations in the column using a high-spectral-resolution infrared grating spectrometer (resolving power of ∼25,000, spatial resolution of ∼250 × 400 km) aboard a microsatellite. The MicroCarb data consist of measurements in four narrow spectral bands (Table 1) of the solar spectral irradiance (SSI) reflected by the Earth’s surface and partially scattered by aerosols and absorbed by atmospheric gases.
The MicroCarb mission focuses on two wavelength bands (central lines at ∼1.6 and ∼2.0 m), where the radiation emitted by the Sun and reflected by the Earth toward the instrument satellite thus carries the signature of the CO molecule [16]. It is the depth of the absorption lines that contains information about the CO concentration. In addition to the two CO absorption bands, MicroCarb also acquires spectra in narrow bands characteristic of O at 0.76 and 1.27 m [17]. These wavelength bands enable the normalization of CO concentration measurements accounting for atmospheric pressure, as well as the consideration of the effects of scattering elements, such as clouds and aerosols. The high precision required for the estimated CO product (uncertainty <1 ppm and regional bias <0.2 ppm) [18] underscores the need for precise calibration and spectral inversion tools, for which MicroCarb requires a high-resolution (less than 0.004 nm) and high-precision absolute solar spectrum (1%). A high-resolution solar spectrum allows a better discrimination of the spectral features and a more accurate identification of the absorption lines. Meanwhile, the high-precision level of the solar spectrum (Table 2) ensures that any variations or uncertainties in the solar spectrum do not affect the accuracy of the MicroCarb measurements. To have a negligible impact on the MicroCarb CO estimate, the position of the dark absorption lines in the solar spectrum (Fraunhofer lines) must be known with excellent precision (central line position less than 10 nm—offset). In addition, the knowledge of these expected solar Fraunhofer line shapes (equivalent widths and central line depths) must be determined with an accuracy close to 0.1%. The scientific requirements of the MicroCarb space-based mission show the importance of having an excellent knowledge of the solar spectrum. This solar input represents an important component of atmospheric missions, as it provides crucial information about the interaction of solar radiation with the Earth’s atmosphere.
3. Importance of Solar Spectra and Their Determination Methods
The disk-integrated solar spectrum has very important implications for atmospheric science. Its distribution of energy is crucial for the atmospheric photochemistry and photochemical processes that act in the Earth’s atmosphere, such as photo-absorption, photo-dissociation, and photo-ionization. For example, the balance between the radiation in the Herzberg continuum (200–242 nm) and the Hartley band (260–320 nm) defines the concentration of ozone in the atmosphere. Also of particular importance are high-resolution measurements of the solar spectrum that aim at resolving individual Fraunhofer lines. Indeed, these lines lead to a very sophisticated spectral profile of the solar irradiance variability [19], and accurately accounting for this profile is crucial for calculating photolysis rates in the solar atmosphere [20,21]. Furthermore, the Sun is a prototype for solar-like stars, so accurate measurements of its spectrum are important for solar–stellar connection studies [22].
The accurate measurement of the solar-disk-integrated spectrum at the top of the atmosphere and its variability over time (e.g., a few solar cycles) obviously represents an important parameter for solar physics. This solar spectrum characterizes the activity of the outer layers of the Sun (photosphere, chromosphere, and corona). By comparison with theoretical reconstructions, an accurately measured solar spectrum allows the temperature, composition, and density of the solar atmosphere to be assessed. In addition, the precise knowledge of the long-term evolution of spectral solar illumination makes it possible to access processes (magnetic field), leading to a better understanding of the variability in the outer regions of our star. These measurements also make it possible to trace the temperature and composition of these regions. More generally, they make it possible to validate models of the solar atmosphere. Two types of variability must be observed with precision: (1) undecadal variability (11-year solar cycle) and (2) variability due to the emergence of sunspots, the effect of which is modulated by the 27-day solar rotation. In addition to the solar-disk-integrated spectrum, measurements at several disk positions allow for probing various layers of the solar atmosphere and, thus, better constraining its structure. Interestingly, the modeling of center-to-limb variations obtained a new lease of life after the advent of transit photometry missions, e.g., Kepler [23] and the Transiting Exoplanet Survey Satellite (TESS) [24]. The knowledge of the center-to-limb variations in stellar brightness is needed for the determination of planetary radii from transit light curves. As a result, significant effort is currently being invested in the modeling of stellar center-to-limb variations [25,26,27,28]. Accurate measurements of solar center-to-limb variations are needed to test and validate stellar models for the exemplary case of the Sun. So, observations of the solar limb-darkening function (LDF) are important, since they describe the brightness of the solar disk from its center to its limb.
The determination of a highly resolved, top-of-atmosphere disk-integrated solar spectrum is extremely important, as well as the disk-center solar spectrum and the solar spectra for different solar view angles. Four approaches exist to obtain all these spectra.
3.1. The Theoretical Approach
The theoretical determination of the solar spectrum involves the application of complex methods that rely on the knowledge of the atomic/molecular energy levels and several parameters of the Sun, such as the pressure, temperature, and composition.
Radiative transfer codes are used to calculate the solar spectrum at a given period. The resulting spectrum contains millions of spectral lines that correspond to various chemical elements present in the solar atmosphere.
Improving these methods is of great interest, as they can be applied to study the atmospheres of other stars as well.
The disk-integrated solar spectrum, the disk-center solar spectrum, and the solar spectra for different solar view angles can be determined from radiative codes, such as:
- The radiative transfer code developed by R.-L. Kurucz (http://kurucz.harvard.edu/sun/irradiance2008/, accessed on 13 April 2011), which calculated radiative transfer under the assumption of local thermodynamic equilibrium (LTE).
- The Solar Radiation Physical Modeling (SRPM) radiative transfer code developed by J.-M. Fontenla [29,30], which is a computing system for the quantitative evaluation of physical process modeling in the context of high-spectral-resolution solar observations. As with all other radiative codes, SRPM takes into account various physical processes, such as the absorption, scattering, and emission of radiation. SRPM (200 nm to 100 m) is extensively used in the study of the solar atmosphere and its effects on the Earth’s climate.
- The COSI spherical radiative transfer code [31], which stands for COde for Solar Irradiance. It solves both the radiative transfer equation and the equations of statistical equilibrium simultaneously. This is essential for accurately determining the solar spectral irradiance in the ultraviolet region (partially formed in the chromosphere), where the LTE assumption is not valid.
- The NESSY radiative transfer code [32], which stands for Non-Local Thermodynamic Equilibrium (NLTE) Spectrum SYnthesis. It represents an improvement of the COSI code, where the entire solar spectrum (ultraviolet, visible, infrared) can be obtained. The computation time of NESSY is significantly faster than that of COSI, making it a more efficient tool for analyzing star spectra.
- The MPS-ATLAS code [33], which was developed by the Max Planck Institute for Solar System Research (Germany). It is based on the ATLAS 9 code [34] and combines the efficient generation of opacity distribution functions (ODFs), atmosphere modeling, and spectral synthesis in local thermodynamic equilibrium into a single efficient package. MPS-ATLAS has been validated against previous ATLAS 9 calculations, the PHOENIX code calculations [35], and high-quality observations. It provides more numerical functionality and is substantially faster compared to other available codes.
The Sun is the only star that can be observed with very high resolution. Thus, direct measurements of the solar spectrum are of high interest for improving radiative transfer codes and stellar spectra.
3.2. Ground-Based Measurements and the Bouguer–Langley Method Extrapolation
Ground-based instruments [13,36] are used to measure the disk-integrated solar spectrum with good accuracy and high resolution. Measurements made by these instruments can be affected by the Earth’s atmosphere. To remove the effects of the atmosphere (ozone, Rayleigh scattering, aerosols, etc.), the Bouguer–Langley method is used. It is based on repeated measurements with an instrument [37] operated at a given location for a cloudless day as the Sun moves across the sky. The Langley plot technique allows the measurement of the evolution of the solar spectral irradiance at the ground for several values of the air mass coefficient. Then, through linear extrapolation at AM = 0, the value of the solar spectral irradiance at the top of the atmosphere is obtained. With an extremely resolved instrument, this method is excellent and provides a direct measurement of the extraterrestrial disk-integrated solar spectrum. A solar spectrum in specific wavelength bands (within atmospheric windows) with very high resolution can be obtained using this technique. However, as previously mentioned, this method requires stable atmospheric conditions during measurements (pressure, temperature, aerosols, etc.). Moreover, under-resolved atmospheric absorptions are not completely removed if they are not linear. Therefore, other methods are necessary to improve these measurements.
3.3. Ground-Based and Airplane Measurements and the Telluric Subtraction Method
The objective of this approach is to measure the solar spectrum for low air mass coefficients and under different conditions (integrated solar disk, at the center of the solar disk, etc.). As these measurements are made from the ground or by airplane, the presence of telluric lines (spectral lines originating in the Earth’s atmosphere) can disturb the measurements. The main telluric lines come from water, dioxygen, ozone, and other atmospheric constituents. Therefore, it is necessary to subtract these lines from the measurements to obtain a high-resolution solar spectrum. A good model of spectroscopic and atmospheric lines, such as the high-resolution transmission molecular absorption (HITRAN) database, and excellent fitting software are necessary to perform this telluric subtraction. The exact and precise quantities of atmospheric constituents (CO, CH, NO, HF, CO, HO, HDO, O, etc.) are extracted from the column. As the precision requirements for atmospheric composition measurements become stricter, better representations of the solar spectrum are necessary. Based on the telluric subtraction approach and using data from the Atmospheric Trace Molecule Spectroscopy (ATMOS) Fourier Transform Spectrometer, the Mark IV Balloon Interferometer (MkIV), the Kitt Peak solar telescopes, University of Denver atlases (https://mysite.du.edu/~agoldman/atlas.html, accessed on 15 June 2010), and the Total Carbon Column Observing Network (TCCON), empirical lists of solar lines were established by Geoffrey Toon (Jet Propulsion Laboratory, California Institute of Technology). In combination with basic line-shape functions, these linelists allow the computation of solar pseudo-transmittance spectra [38]. Pseudo-transmittance spectra of solar absorption lines were obtained for an integrated solar disk and at the center of the solar disk (https://mark4sun.jpl.nasa.gov/toon/solar/solar_spectrum.html, accessed on 2020 (TCCON release). These solar pseudo-transmittance spectra (SPTS) contain more than 40,000 narrow and discrete lines (Fraunhofer lines) and cover a region between ∼380 and 16,660 nm (26,316–600 cm). They can be used to develop solar spectra at high resolution.
In summary, obtaining high-resolution solar spectra from this method involves several steps, including:
- Measuring solar spectra: The first step is to measure the solar spectrum on the ground or with an airplane. The presence of atmospheric absorption lines (e.g., from water vapor, oxygen, and ozone) distorts the solar spectrum. Thus, these atmospheric lines need to be removed before the solar spectrum can be analyzed.
- Removing atmospheric absorption lines: This can be carried out by comparing the measured solar spectrum to a reference spectrum that has been corrected for atmospheric absorption. The reference spectrum can be obtained from a solar atlas or a model of the Earth’s atmosphere.
- Modeling solar spectral lines: After removing atmospheric absorption lines, the remaining lines can be attributed to the Sun. However, some of these lines may also be due to atmospheric pollution or instrumental effects. To ensure that only solar spectral lines are analyzed, a detailed model of solar spectral lines must be used. These models (Kurucz, SRPM, COSI, NESSY, MPS-ATLAS, etc.) take into account the physical properties of the Sun, such as temperature, pressure, and composition.
- Analyzing solar spectral lines: Once the solar spectral lines have been isolated, they can be analyzed to extract information about the Sun’s physical properties. The intensity and width of the spectral lines can be used to determine the temperature and pressure of the Sun’s atmosphere. The positions of the spectral lines allow the composition of the Sun’s atmosphere to be determined, including the abundance of elements, such as hydrogen, helium, oxygen, carbon, iron, neon, nitrogen, silicon, magnesium, sulfur, calcium, and chromium.
3.4. Space-Based Measurements
Space-based instruments are used to measure the disk-integrated solar spectrum with high accuracy and low resolution. These instruments have several advantages over ground-based measurements, including the absence of atmospheric absorption and scattering and the ability to measure the full disk of the Sun. However, the obtained solar spectra will have limited spectral coverage and/or resolution. In addition, although the pre-launch calibration and characterization procedures of space instruments achieve very low levels of uncertainty, once in space, the verification and/or re-calibration of such instruments quickly become very difficult, if not impossible. As previous studies have shown [39], solar spectra measured from space-based instruments may differ considerably from each other, partly due to instrument degradation in orbit and difficulties in accounting for possible changes in the instruments between pre-flight calibration and operation in space. Nevertheless, this is the only way to obtain a complete spectrum outside the atmosphere. Therefore, it is necessary to develop new space-based instruments that are fully traceable to the international system of units.
There are several methods to measure solar spectra in space:
- Solar irradiance measurement using a photometer, radiometer, or telescope: This method involves the measurement of the total amount of solar radiation received by a sensor in space (e.g., the PREcision Monitoring Sensor (PREMOS) photometer or the SOlar Diameter Imager and Surface Mapper (SODISM) telescope [40,41] onboard the French PICARD microsatellite). By analyzing the spectral content of the radiation, the solar spectrum can be derived. This method has the advantage of being relatively simple and robust, but it does not provide detailed spectral information.
- Spectroscopy using diffraction grating: This method involves the use of optical parts to disperse the incoming solar radiation into its component wavelengths and then measuring the intensity of each wavelength using a detector such as a photomultiplier detector (SOLar SPECtrum (SOLSPEC) onboard the International Space Station). This method can provide detailed spectral information, but it requires precise calibration and is sensitive to instrument drift.
- Spectroscopy using a Fabry–Perot interferometer: This method involves the use of an interferometer to selectively pass only certain wavelengths of the incoming solar radiation while blocking out all others. By scanning the interferometer over a range of wavelengths, the solar spectrum can be reconstructed. This method can provide very high spectral resolution, but it requires very precise alignment and calibration.
- Spectroscopy using a Fourier transform interferometer: This method involves the use of a special interferometer to measure the interference pattern of the incoming solar radiation as a function of wavelength. By applying a Fourier transform to the interference pattern, the solar spectrum can be reconstructed. This method can provide very high spectral resolution and is relatively simple to implement, but it is sensitive to instrument vibrations and requires careful calibration.
4. Methodology for Determining the SOLAR-HRS and MPS-ATLAS Spectra
4.1. Methodology for Obtaining the SOLAR-HRS Spectra Based on Ground and Space Observations
The SOLAR-HRS disk-integrated spectrum is developed by applying a spectral ratio method to normalize very high spectral resolution solar line data to the absolute irradiance scale of the SOLAR-ISS [9] lower-resolution reference spectrum. The very high spectral resolution solar line data are based on Quality Assurance of Spectral Ultraviolet Measurements in Europe Fourier Transform Spectrometer (QASUMEFTS) solar irradiance observations from 300 to 380 nm [36] and SPTS solar pseudo-transmittance from 380 to ∼4400 nm [38]. The SOLAR-ISS reference spectrum [9] serves as a reference for the lower-resolution but higher-accuracy spectrum from 0.5 to 3000 nm.
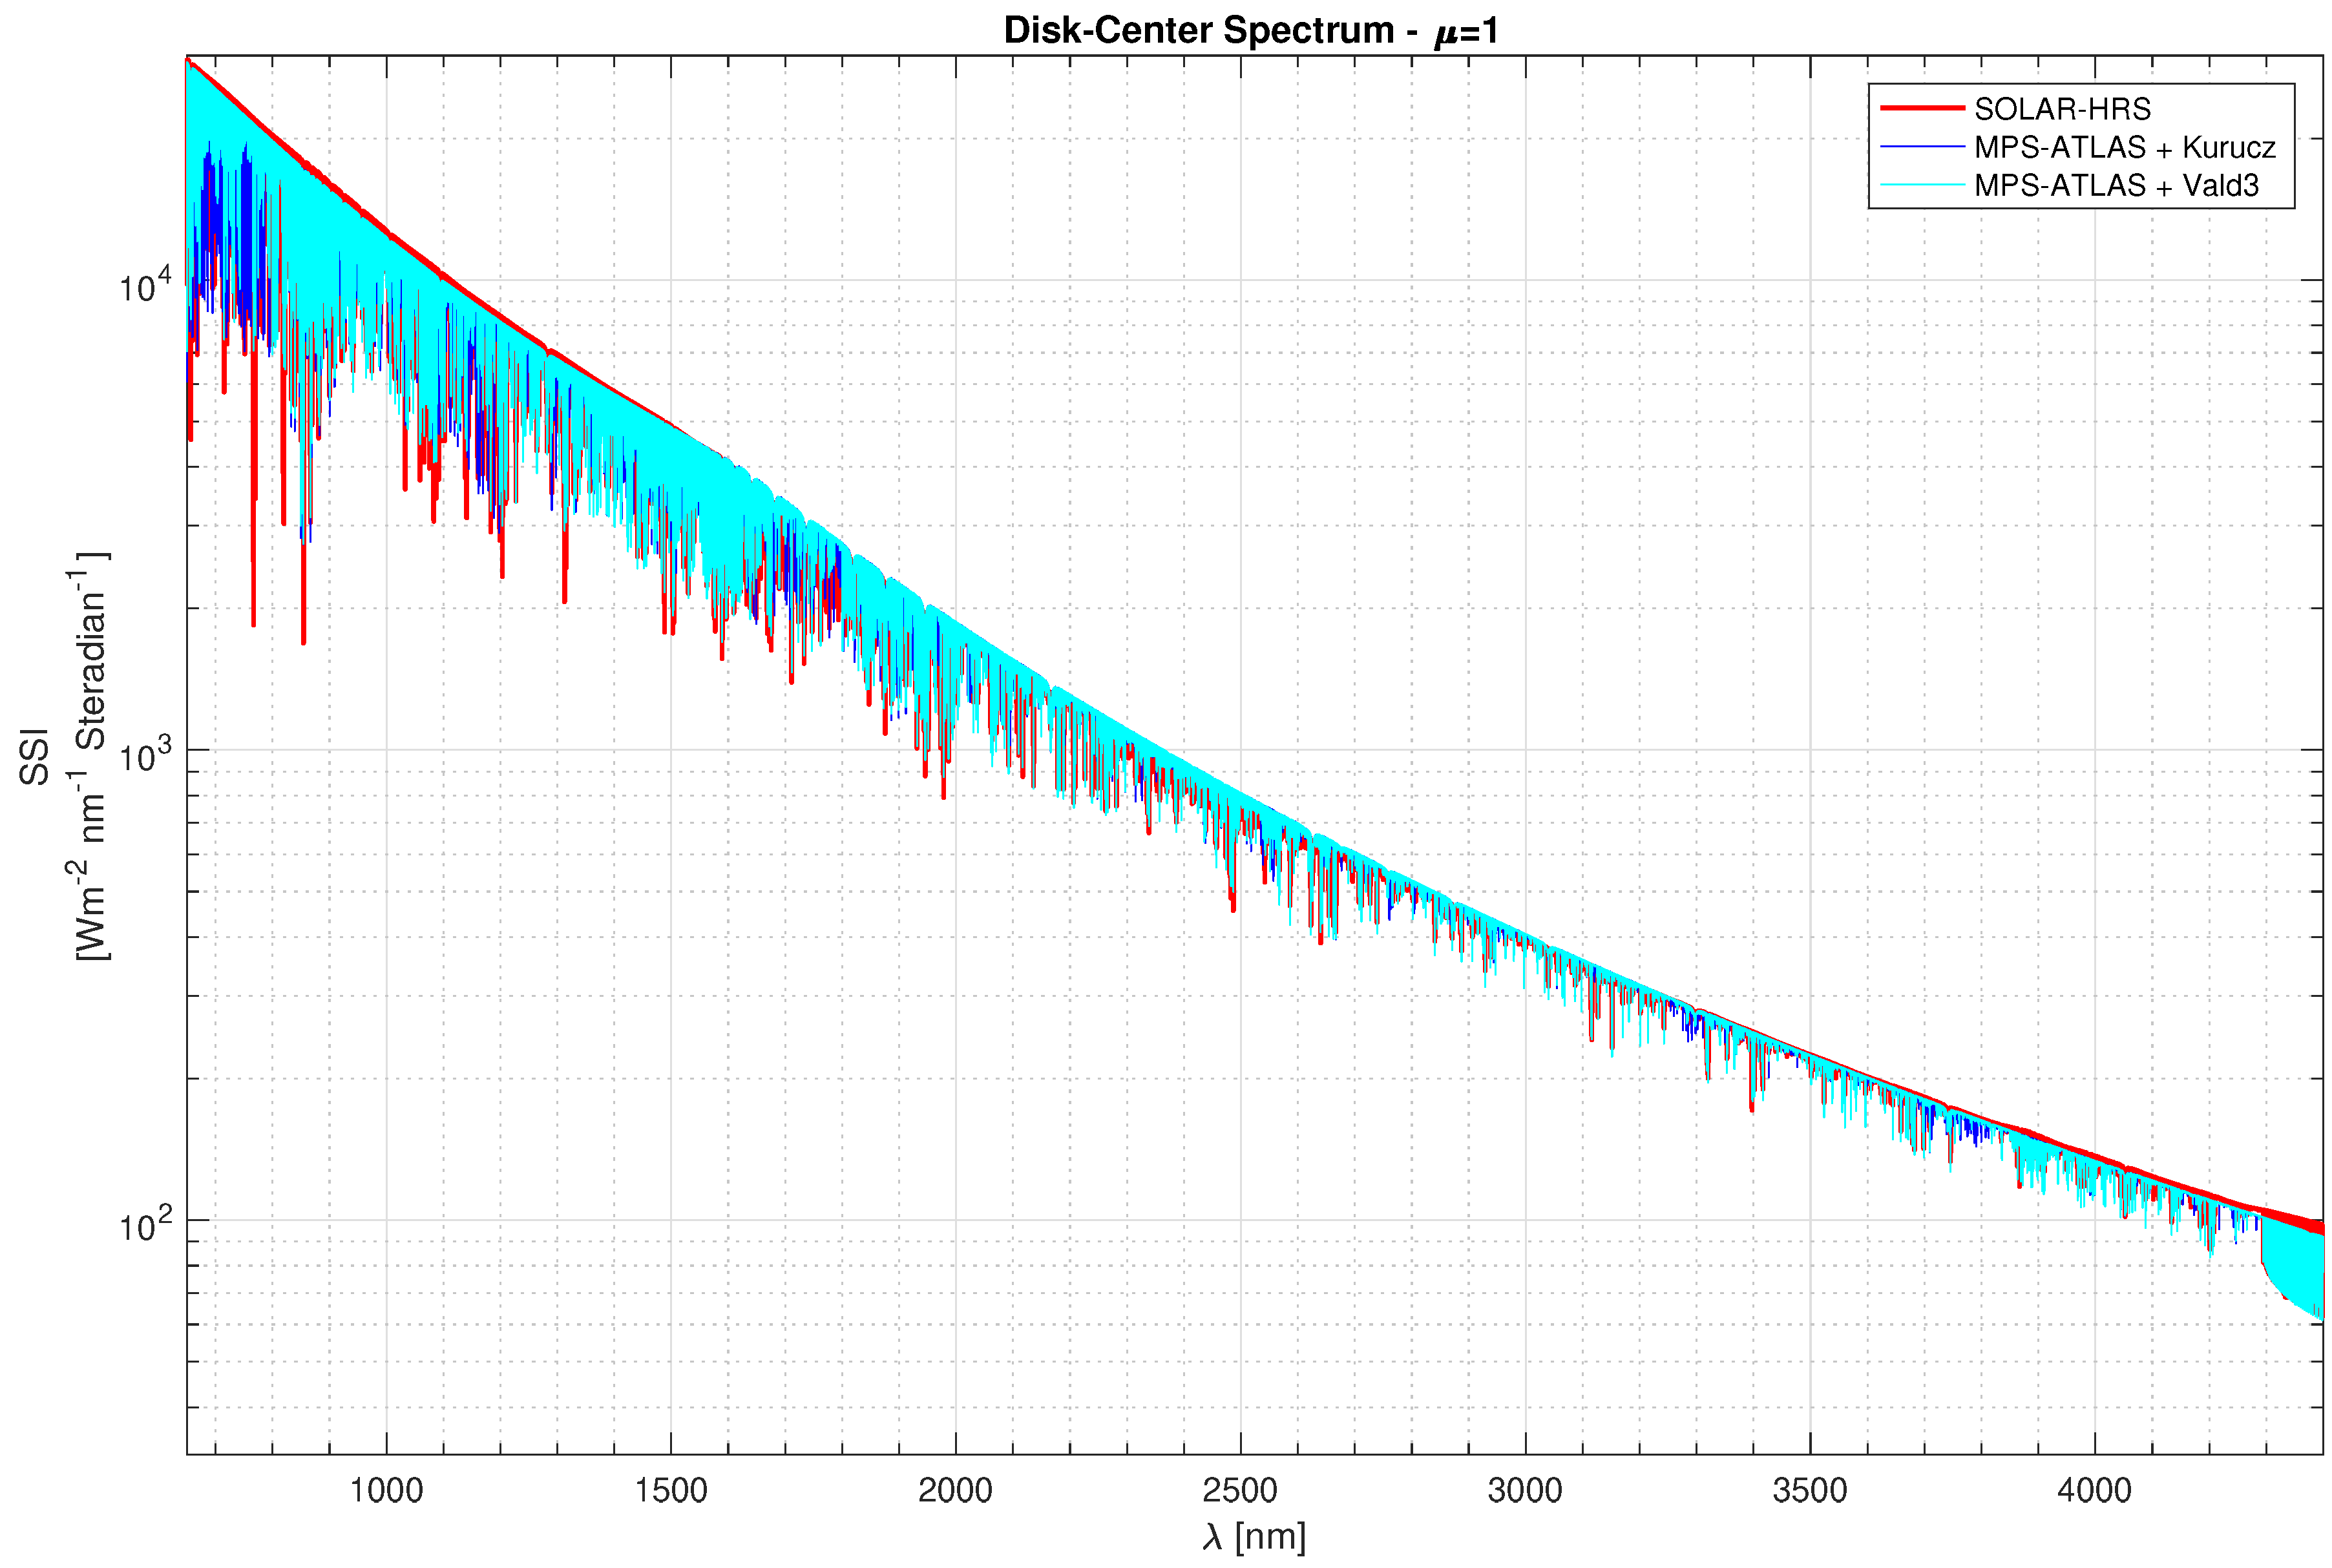
The same method is used to obtain the SOLAR-HRS disk-center spectrum (Figure 2), which is based on the SPTS solar pseudo-transmittance spectrum for disk- center [38], solar limb-darkening function (models and observations), and SOLAR-ISS lower-resolution reference spectra.
To obtain the SOLAR-HRS spectra for each wavelength (), the spectral ratio method is therefore used. It consists of a wavelength-dependent scaling factor, which adjusts high-spectral-resolution datasets to match a lower-resolution but higher-accuracy spectrum (SOLAR-ISS). Five steps are necessary to obtain the SOLAR-HRS high-resolution extraterrestrial reference spectra. They are described below.
- Convolve a high-resolution spectrum with lower radiometric calibration accuracy and the best slit function that is available for the lower-resolution solar measure or reference spectrum :The high-resolution solar spectrum () based on very high spectral resolution solar line data is degraded to SOLAR-SOLSPEC instrument resolution using the chosen slit function settings (). The convolution of the spectrum by the instrument slit function is given by the integral described in Equation (1). The integration interval () is defined by the width of the slit function.
- Interpolate the obtained high-sampling low-resolution spectrum on the wavelength grid of the low-resolution reference spectrum:The solar spectrum obtained in step 1 has low spectral resolution, but it has preserved the sampling of the initial spectrum at very high spectral resolution (). Therefore, it is necessary to resample the spectrum to make it compatible with the absolute reference solar spectrum for obtaining the scaling factor.
- Divide that spectrum by the low-resolution spectrum to obtain the fraction by which to multiply the original high-resolution spectrum, used in the first step to obtain the scaling factor (Q):
- Interpolate the low-sampling scaling factor to the high-resolution wavelength grid:
- The new high-resolution solar reference spectrum is defined by:
The spectral ratio method is a powerful technique used to adjust solar irradiance datasets. When using the spectral ratio method to derive the new radiometrically and spectrally calibrated high-resolution solar reference spectrum, several points need to be considered carefully. They include:
- The choice of the best ground-based solar high-resolution spectra (e.g., QASUMEFTS) and/or pseudo-transmittance spectra (e.g., SPTS) that have a radiometric calibration with lower accuracy.
- The choice of a lower-resolution reference spectrum that is considered the most realistic for radiometric calibration accuracy and based on space measurements (e.g., SOLAR-ISS).
- An accurate knowledge of the spectral response function of the instrument (e.g., slit function of SOLAR-SOLSPEC) providing the low-resolution reference spectrum, as well as careful attention to the details of the interpolation process.
- An accurate knowledge of the sources of uncertainty (reference spectrum’s radiometric calibration, original high-resolution spectrum’s radiometric calibration, etc.).
4.2. Methodology for Obtaining the MPS-ATLAS Solar Spectra Based on Kurucz and Vald3 Solar Linelists
The 1D MPS-ATLAS solar spectra (with Kurucz or Vald3 linelists) are based on the Merged Parallelised Simplified ATLAS code [42]. MPS-ATLAS implements the new setup of opacity distribution functions (ODFs) [43] into an updated version of the well-established, widely used ATLAS 9 and DFSYNTHE codes for ODFs (http://kurucz.harvard.edu/programs/NEWDF/, accessed on 13 April 2011) [44]. The code has been recently used to produce an extensive grid of 1D stellar atmospheres and spectra [28], as well as to calculate emergent 3D atmospheric irradiance models [45,46]. Here, we present only calculations based on 1D modeling when the atmospheric structure and emergent spectrum are calculated with the MPS-ATLAS code. A detailed description of the 1D modeling is given in [33]. We also studied an approach with 3D modeling when the 3D atmosphere is calculated with the MURaM code [47] (study of the structure and dynamics of the solar atmosphere based on equations of magnetohydrodynamics (MHD) to simulate the behavior of a plasma in a three-dimensional domain), and subsequent spectral synthesis was conducted with MPS-ATLAS. The setup of the MURaM approach for obtaining 3D solar spectra is described in detail in [42] and will be the subject of further analysis. One of the biggest problems in solar spectra modeling is uncertainties in the atomic and molecular linelists. The current linelists used in solar modeling contain more than 100 million lines, but most of the lines are blended and cannot be resolved in laboratories, so the line parameters for these must be taken from models rather than from measurements. As a result, many weak lines can be still missing from the linelists [48].
In this study, we focused only on two frequently used solar linelists: Kurucz’s original linelist (DFSYNTHE) and the Vald3 linelist [49].
The Kurucz solar linelists comprise a comprehensive set of atomic and molecular data utilized to model and study the solar spectrum. These linelists provide extensive information about the energy levels and transitions of atoms and molecules in the Sun, including their spectroscopic properties, wavelengths, and line strengths.
The Vald3 solar linelists use atomic and molecular data to predict the solar spectrum and take into account various physical processes occurring in the solar atmosphere, such as radiation, convection, and turbulence. These comprehensive linelists are based on the most accurate and updated data on atomic and molecular transitions, as well as the effects of pressure and Doppler broadening.
From solar parameters (Teff, log g, Fe/H+ abundances, etc.), MPS-ATLAS (with Kurucz or Vald3 linelists) calculates solar spectra together with their LDFs. Then, we can obtain MPS-ATLAS disk-center (Figure 2) and MPS-ATLAS disk-integrated spectra (for Kurucz and Vald3 linelists). From these solar models, we also obtained several solar spectra for eleven different solar view angles from = 1.0 to = 0.05.
5. Results
The accurate determination of unprecedented high-resolution solar spectra is challenging. Table 3 displays the new SOLAR-HRS and MPS-ATLAS spectra obtained [50] based on the methods described in Section 4. The data type, wavelength coverage, spectral resolution, and sampling are given for each new solar spectrum implemented (SOLAR-HRS and MPS-ATLAS). The different new high-resolution solar reference spectra derived in this work and listed in Table 3 can be downloaded from the Sun-Climate Observation Virtual Earth-Atmosphere portal (http://bdap.ipsl.fr/voscat_en/solarspectra.html, accessed on 13 March 2023).
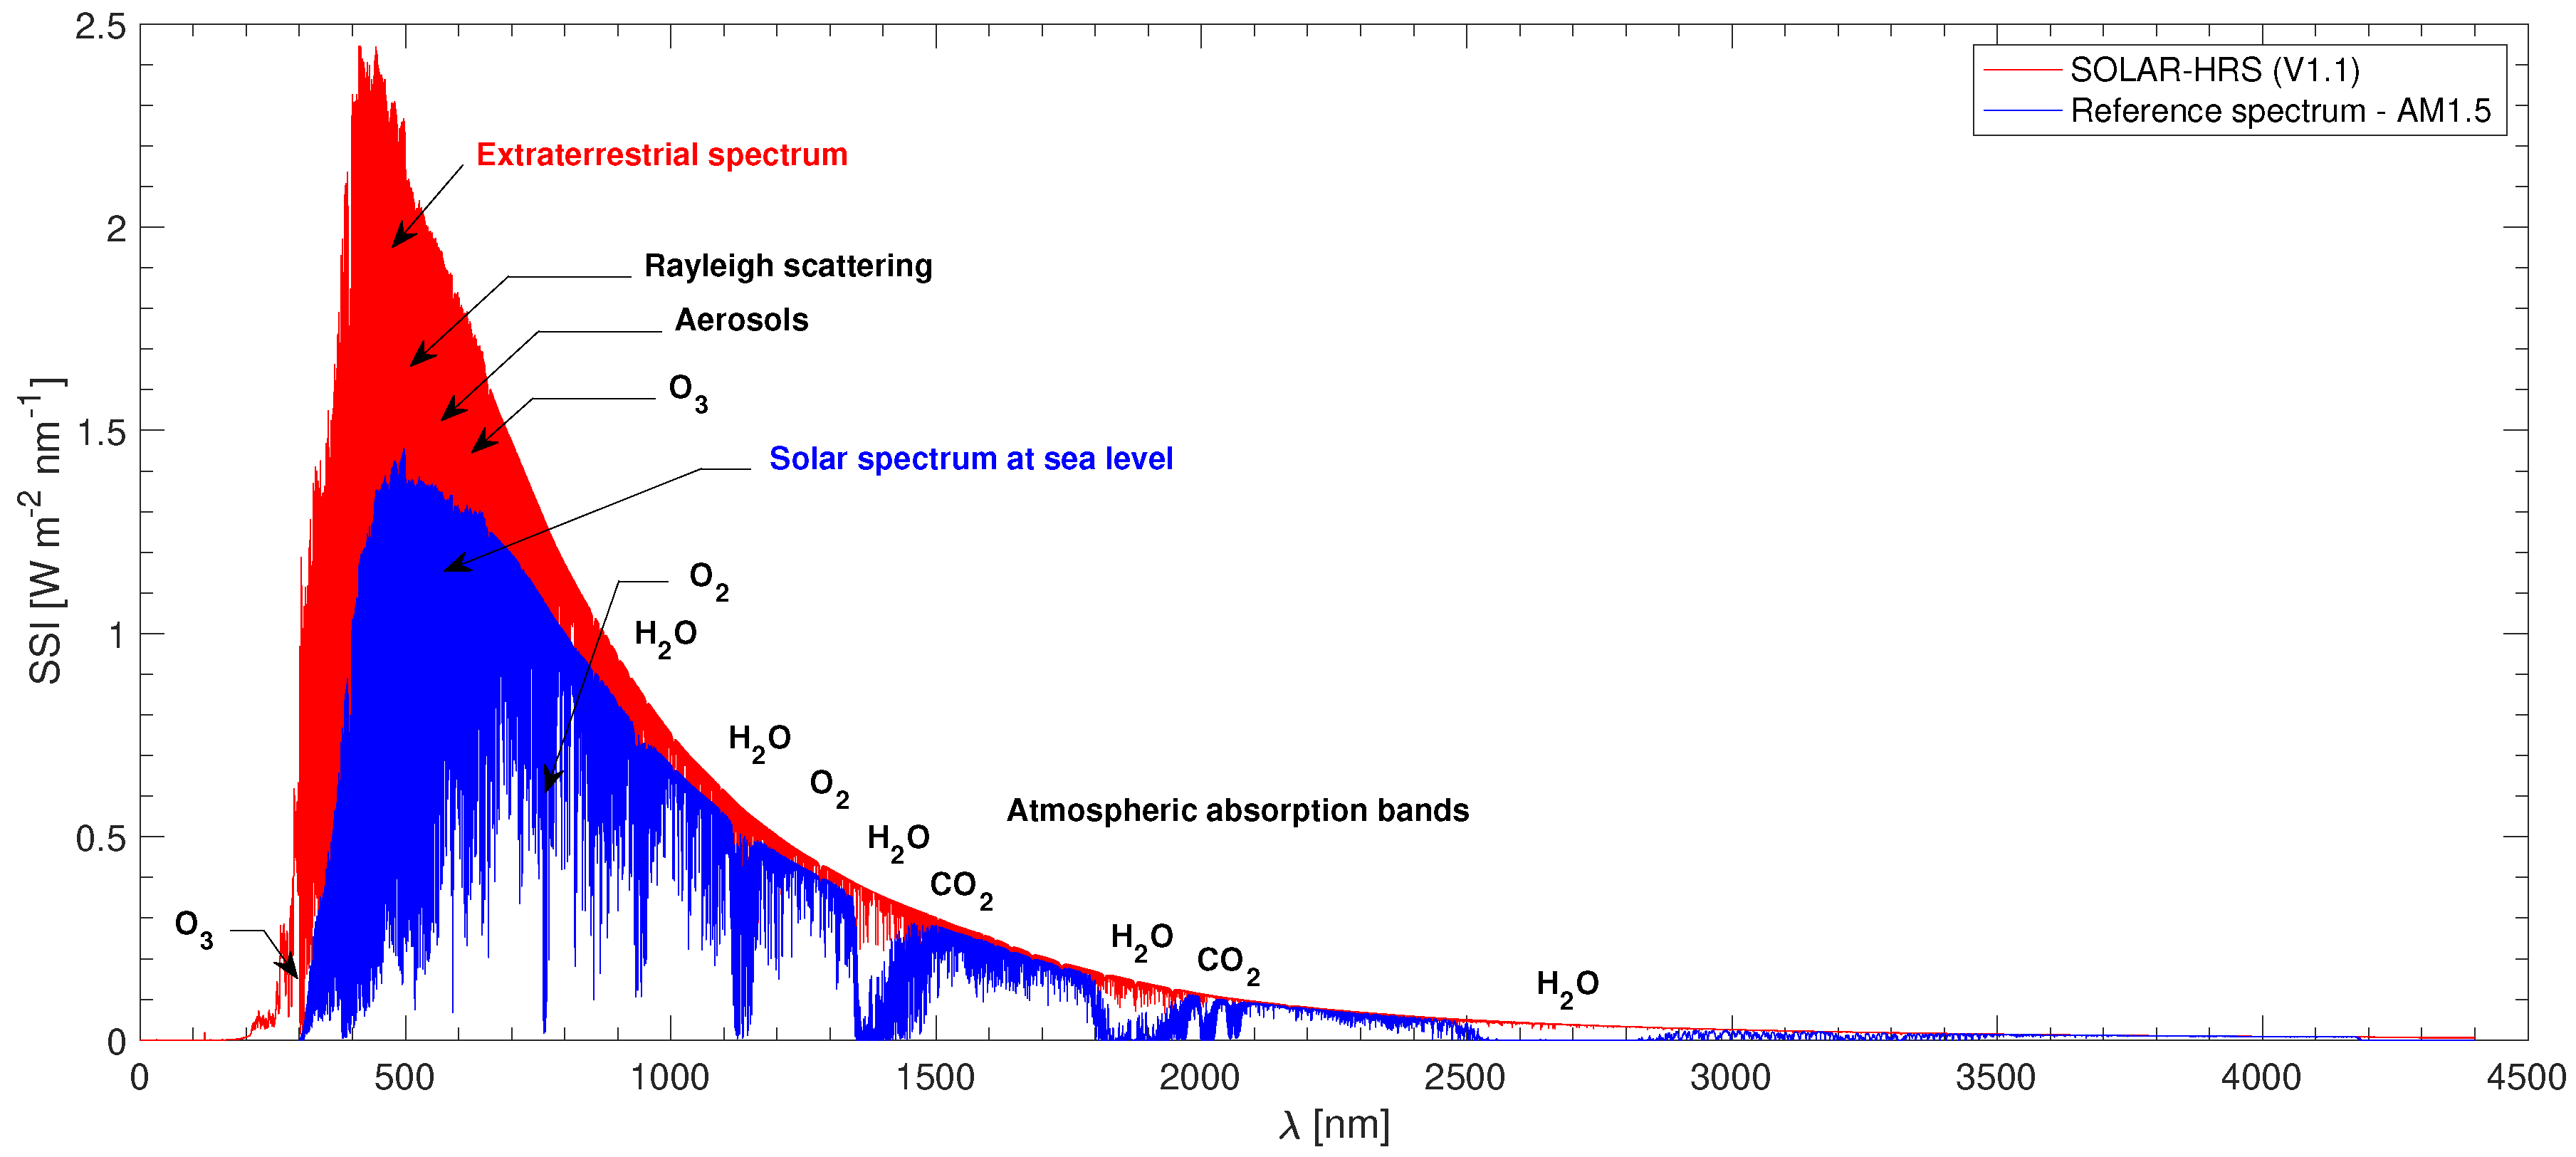
The SOLAR-HRS disk-integrated spectrum is shown in Figure 1. This spectrum is representative of a solar minimum. It was obtained from SOLAR-ISS, QASUMEFTS (datasets were converted from air to vacuum scale), and SPTS data. The SOLAR-HRS radiometric uncertainty (k = 1) mainly depends on the uncertainty of the SOLAR-ISS spectrum [9]. In the 165–500 nm wavelength range, the absolute radiometric uncertainty varies from 5 to 1%, with higher values around few wavelengths (168.9, 200.2, 209.2, 217.3, 263.7, 275.6, 279.2, 280.8, 284.7, 286.0, and between 338.5 and 356.3 nm). Between 500 and 2000 nm, the radiometric uncertainty is less than 1%, with upper peaks for a few wavelengths (660.6, 720.2, 972.7, 1348.2, 1599.0, and 1619.0 nm). Between 2000 and 2922 nm, the radiometric uncertainty ranges from 1 to 10%, with an upper peak at 2010.0 nm. Beyond 2922 nm, the uncertainty becomes too great since the solar spectral irradiance becomes too low to measure with high accuracy.
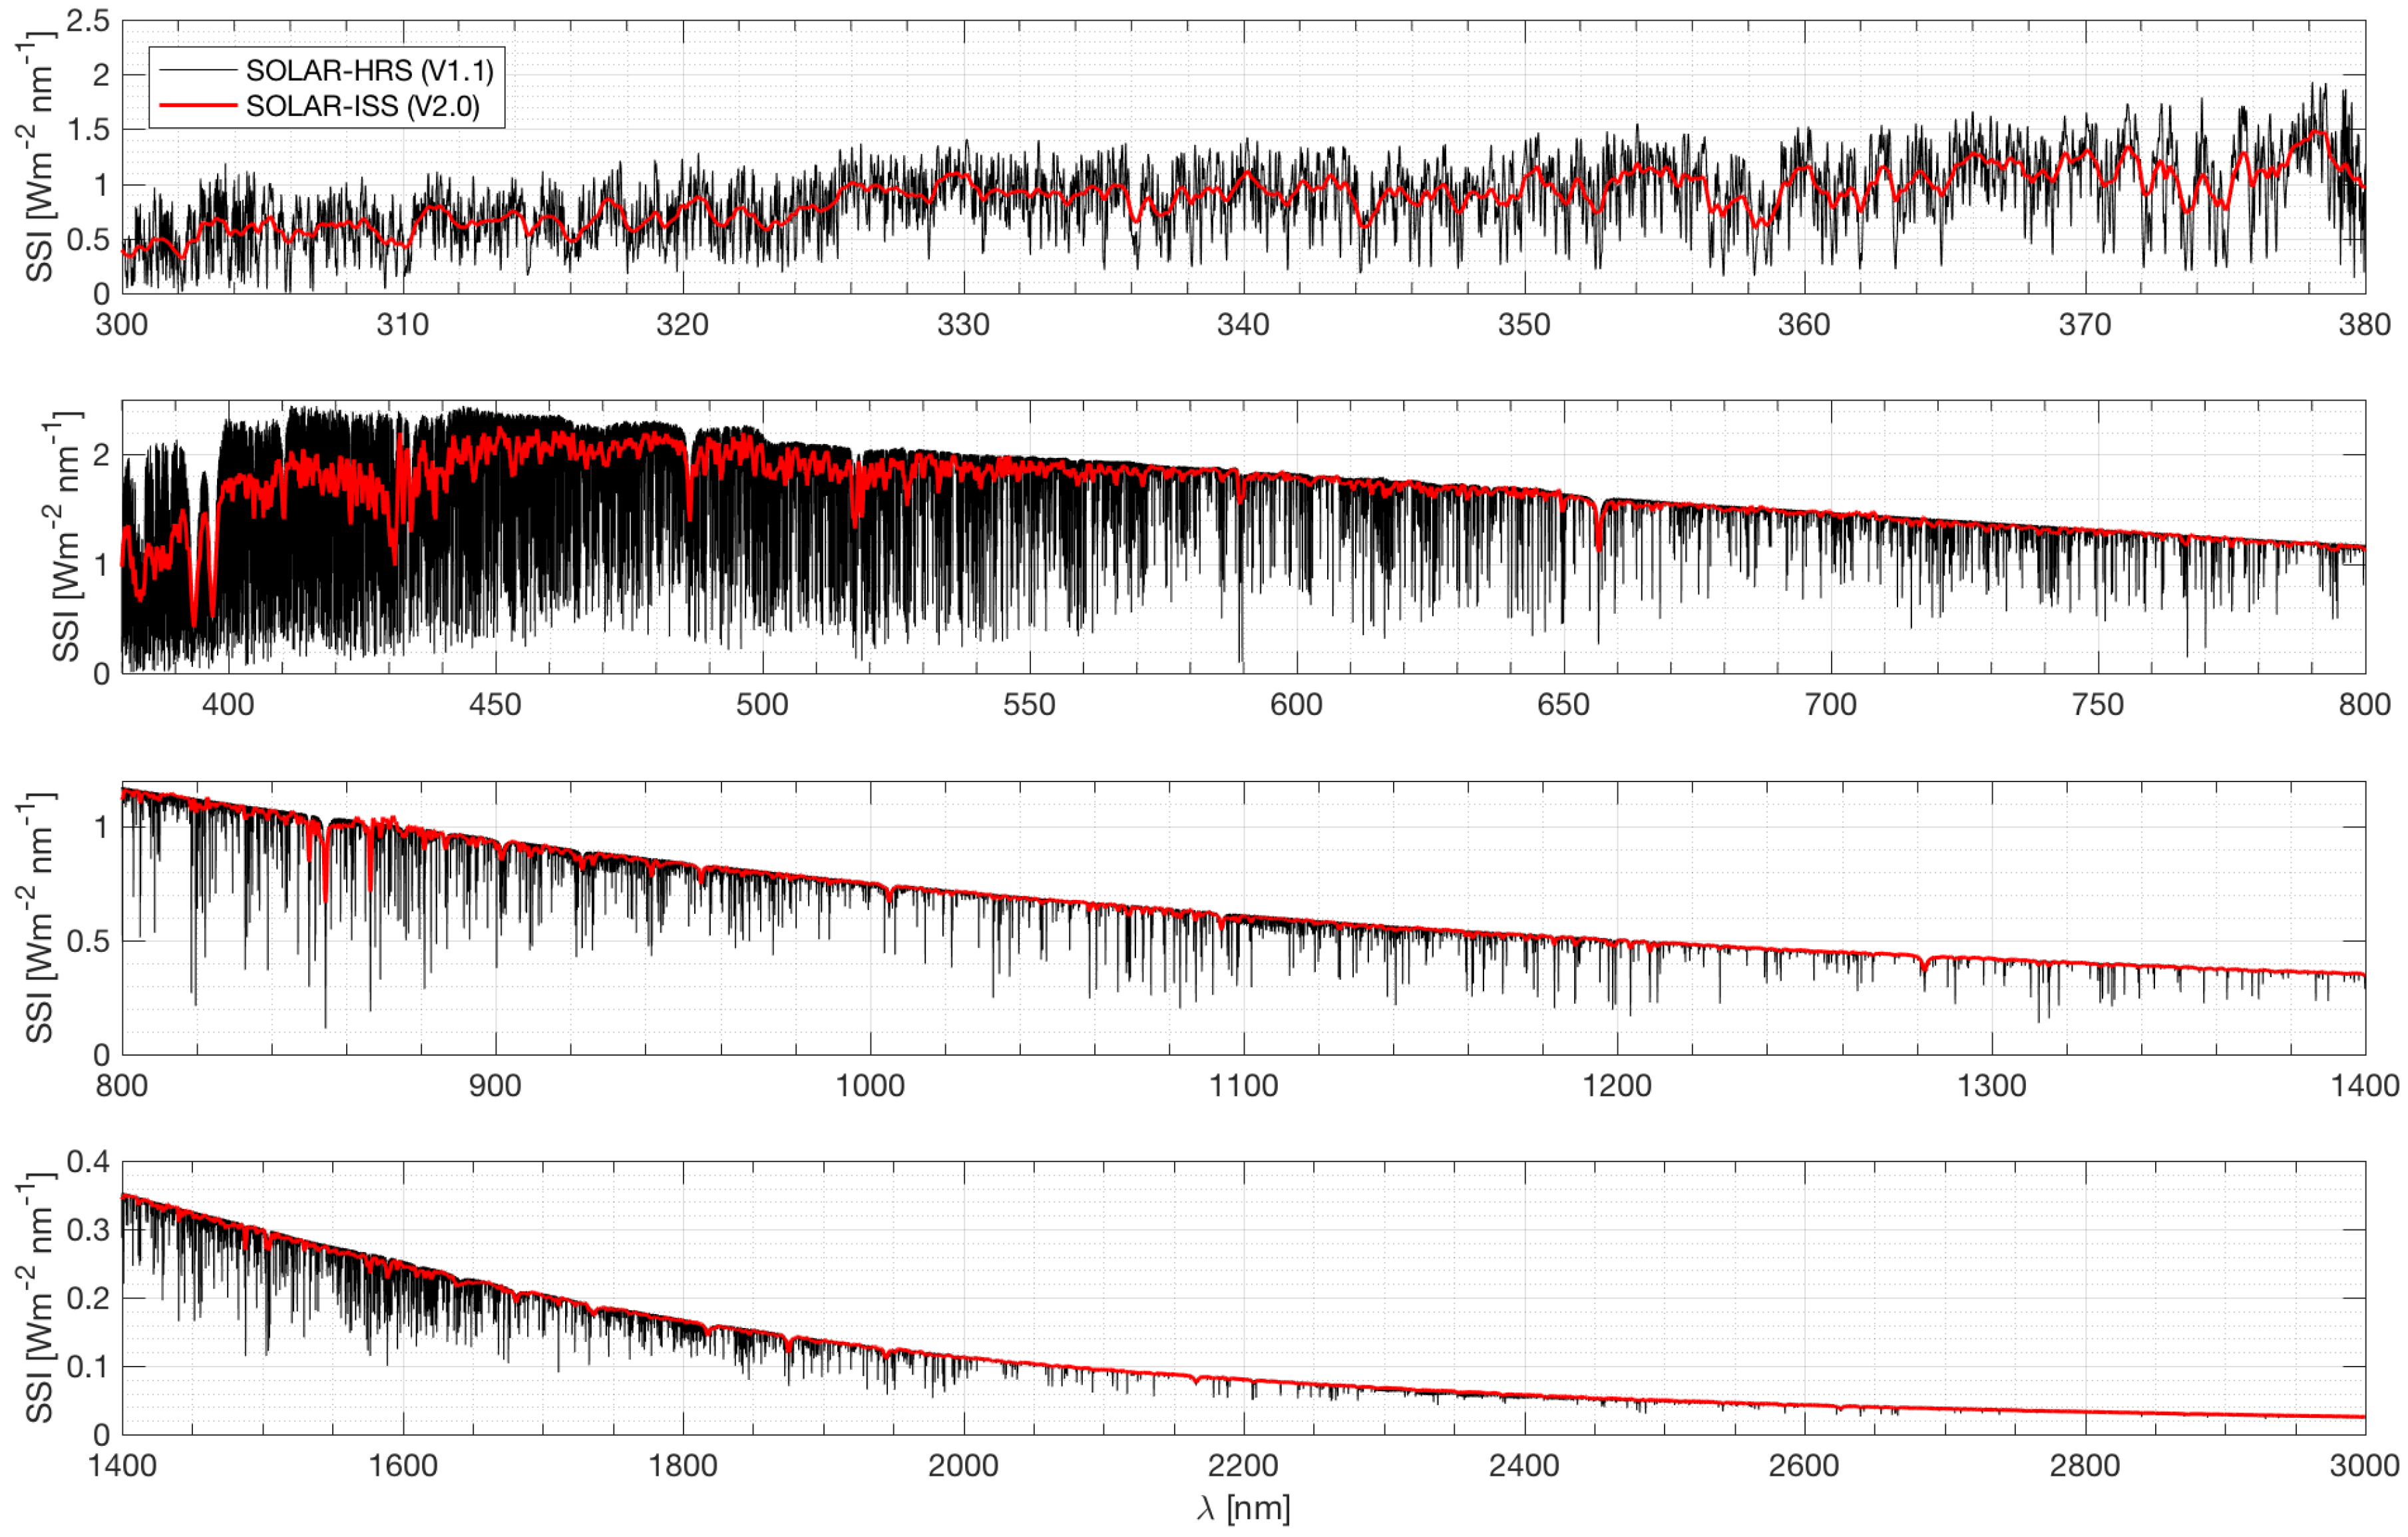
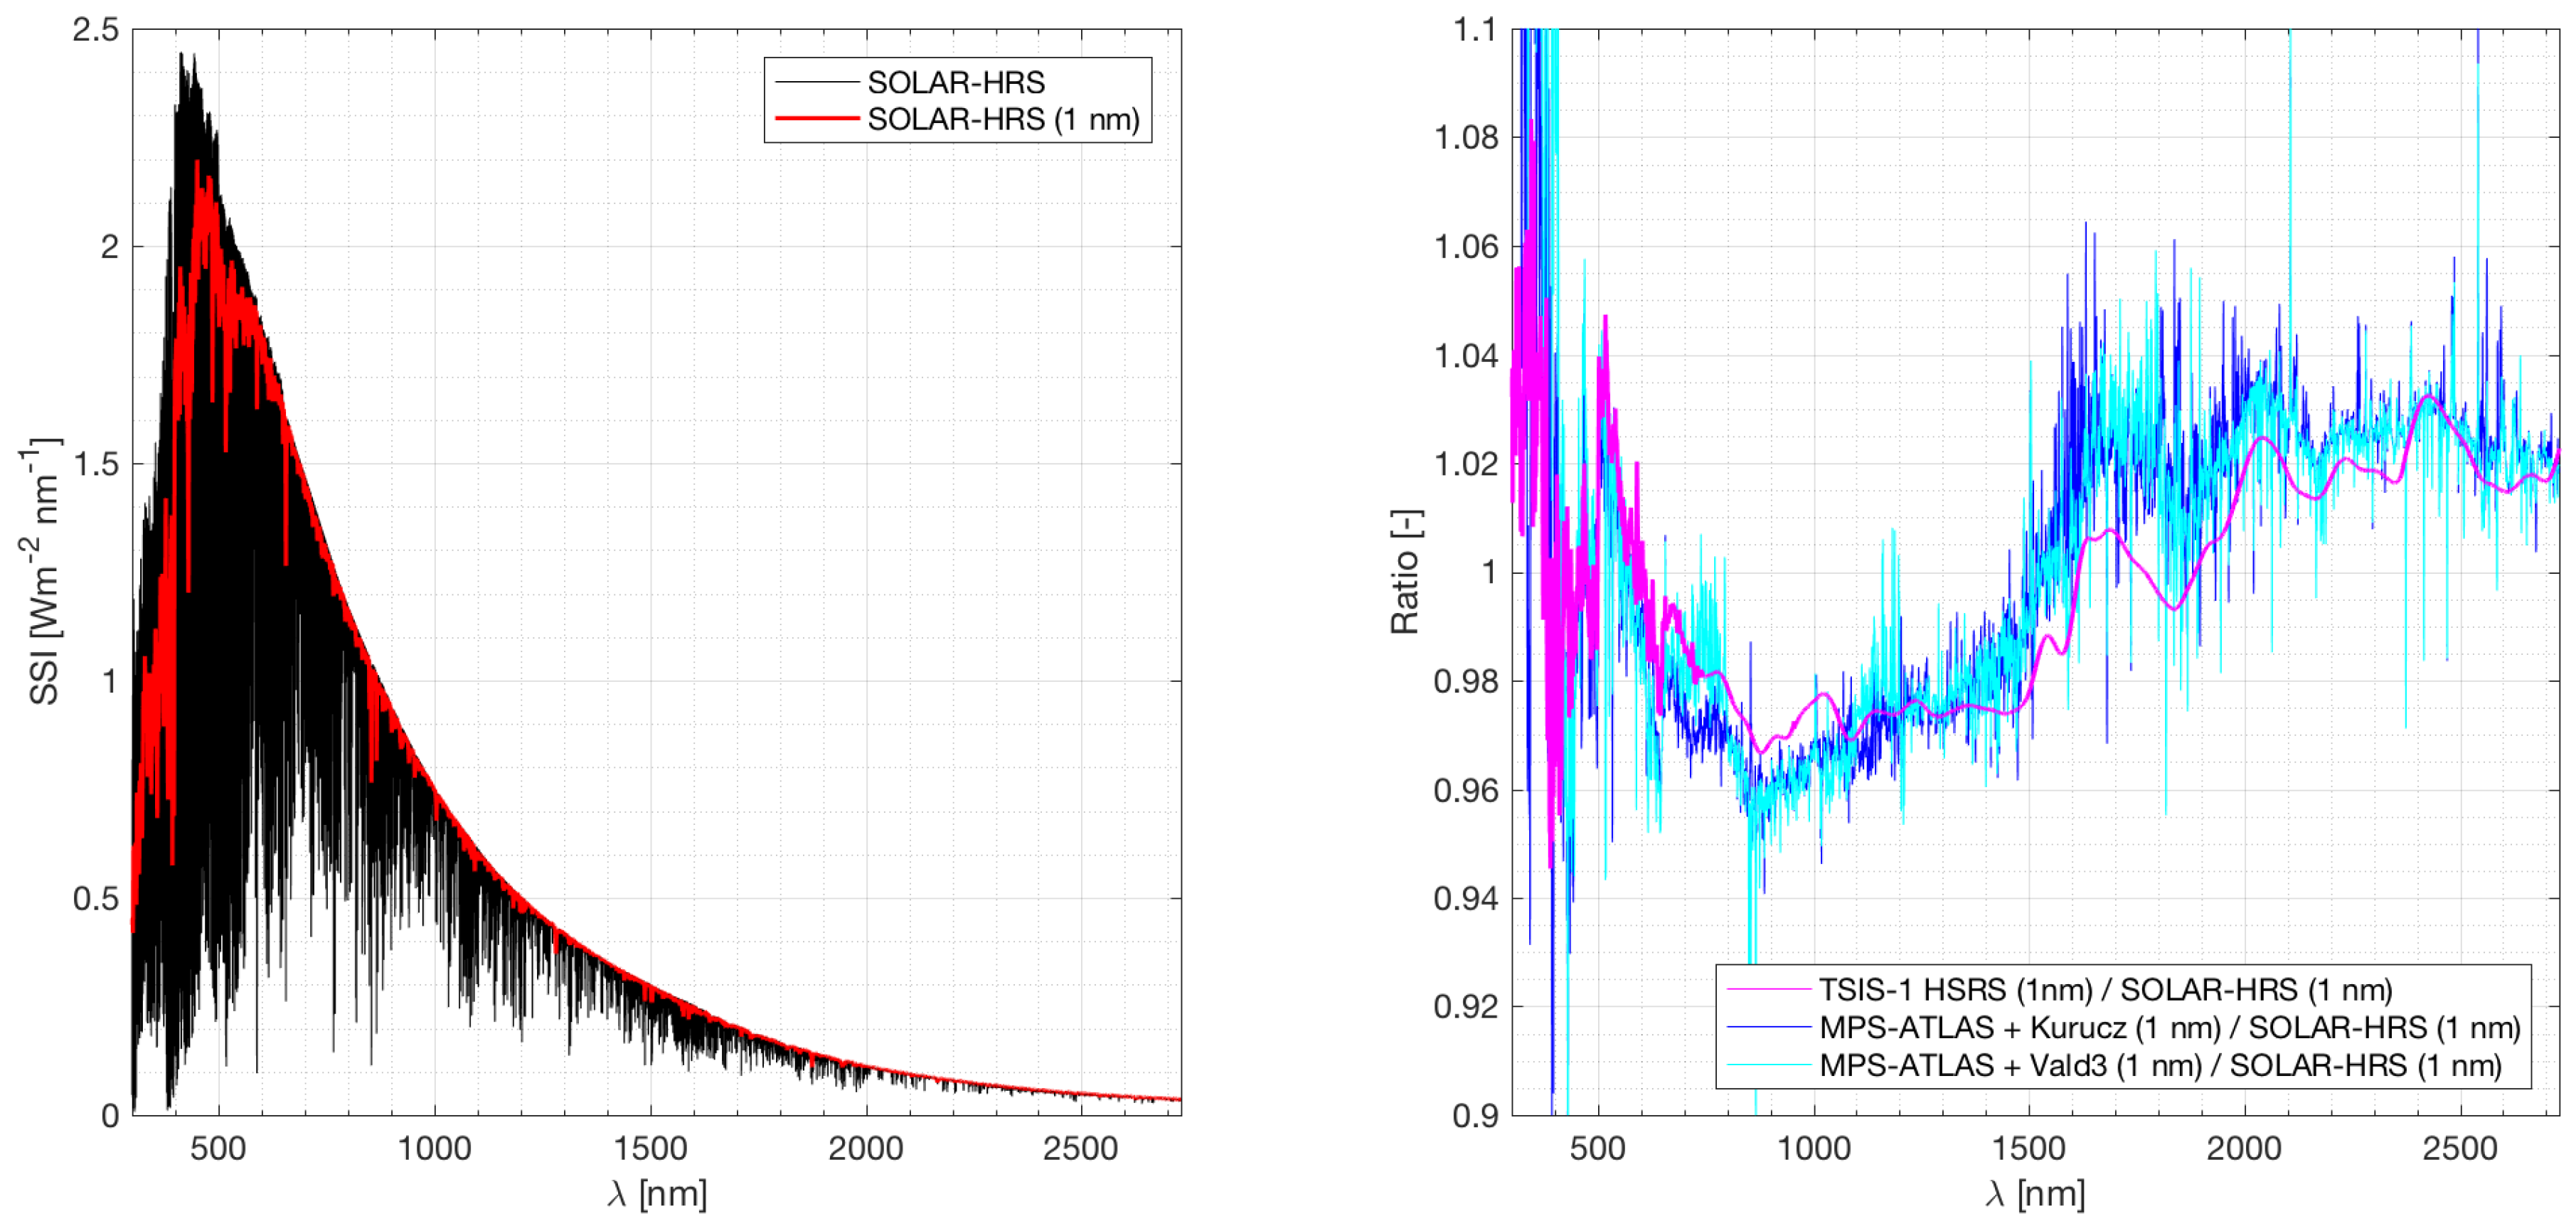
Figure 3 shows the evolution of SOLAR-HRS and SOLAR-ISS disk-integrated spectral irradiance as a function of wavelength between 300 and 3000 nm. In the 300–380 nm range, the SOLAR-HRS spectral resolution is better than 0.025 nm. Between 380 and 3000 nm, the SOLAR-HRS spectral resolution is between ∼0.0005 and 0.01 nm. The multitude of Fraunhofer lines, as a set of solar spectral absorption lines, are clearly visible on the plot. In Figure 4 (right), a comparison between the SOLAR-HRS disk-integrated spectrum and the Total and Spectral Solar Irradiance Sensor-1 Hybrid Solar Reference Spectrum (TSIS-1 HSRS) [10] is made. In the 500–1500 nm range, the difference between SOLAR-HRS and TSIS-1 HSRS is close to 3%. Above 1500 nm, the agreement is excellent and within 2%, which confirms the quality of the SOLAR-HRS spectrum regarding its absolute uncertainty.
The difference between the SOLAR-HRS and MPS-ATLAS models (Figure 4, right) is not significant, because the models have no clearance with respect to the absolute level of the true solar spectrum. Generally, models use a reference to calibrate their absolute values of solar spectral irradiance.
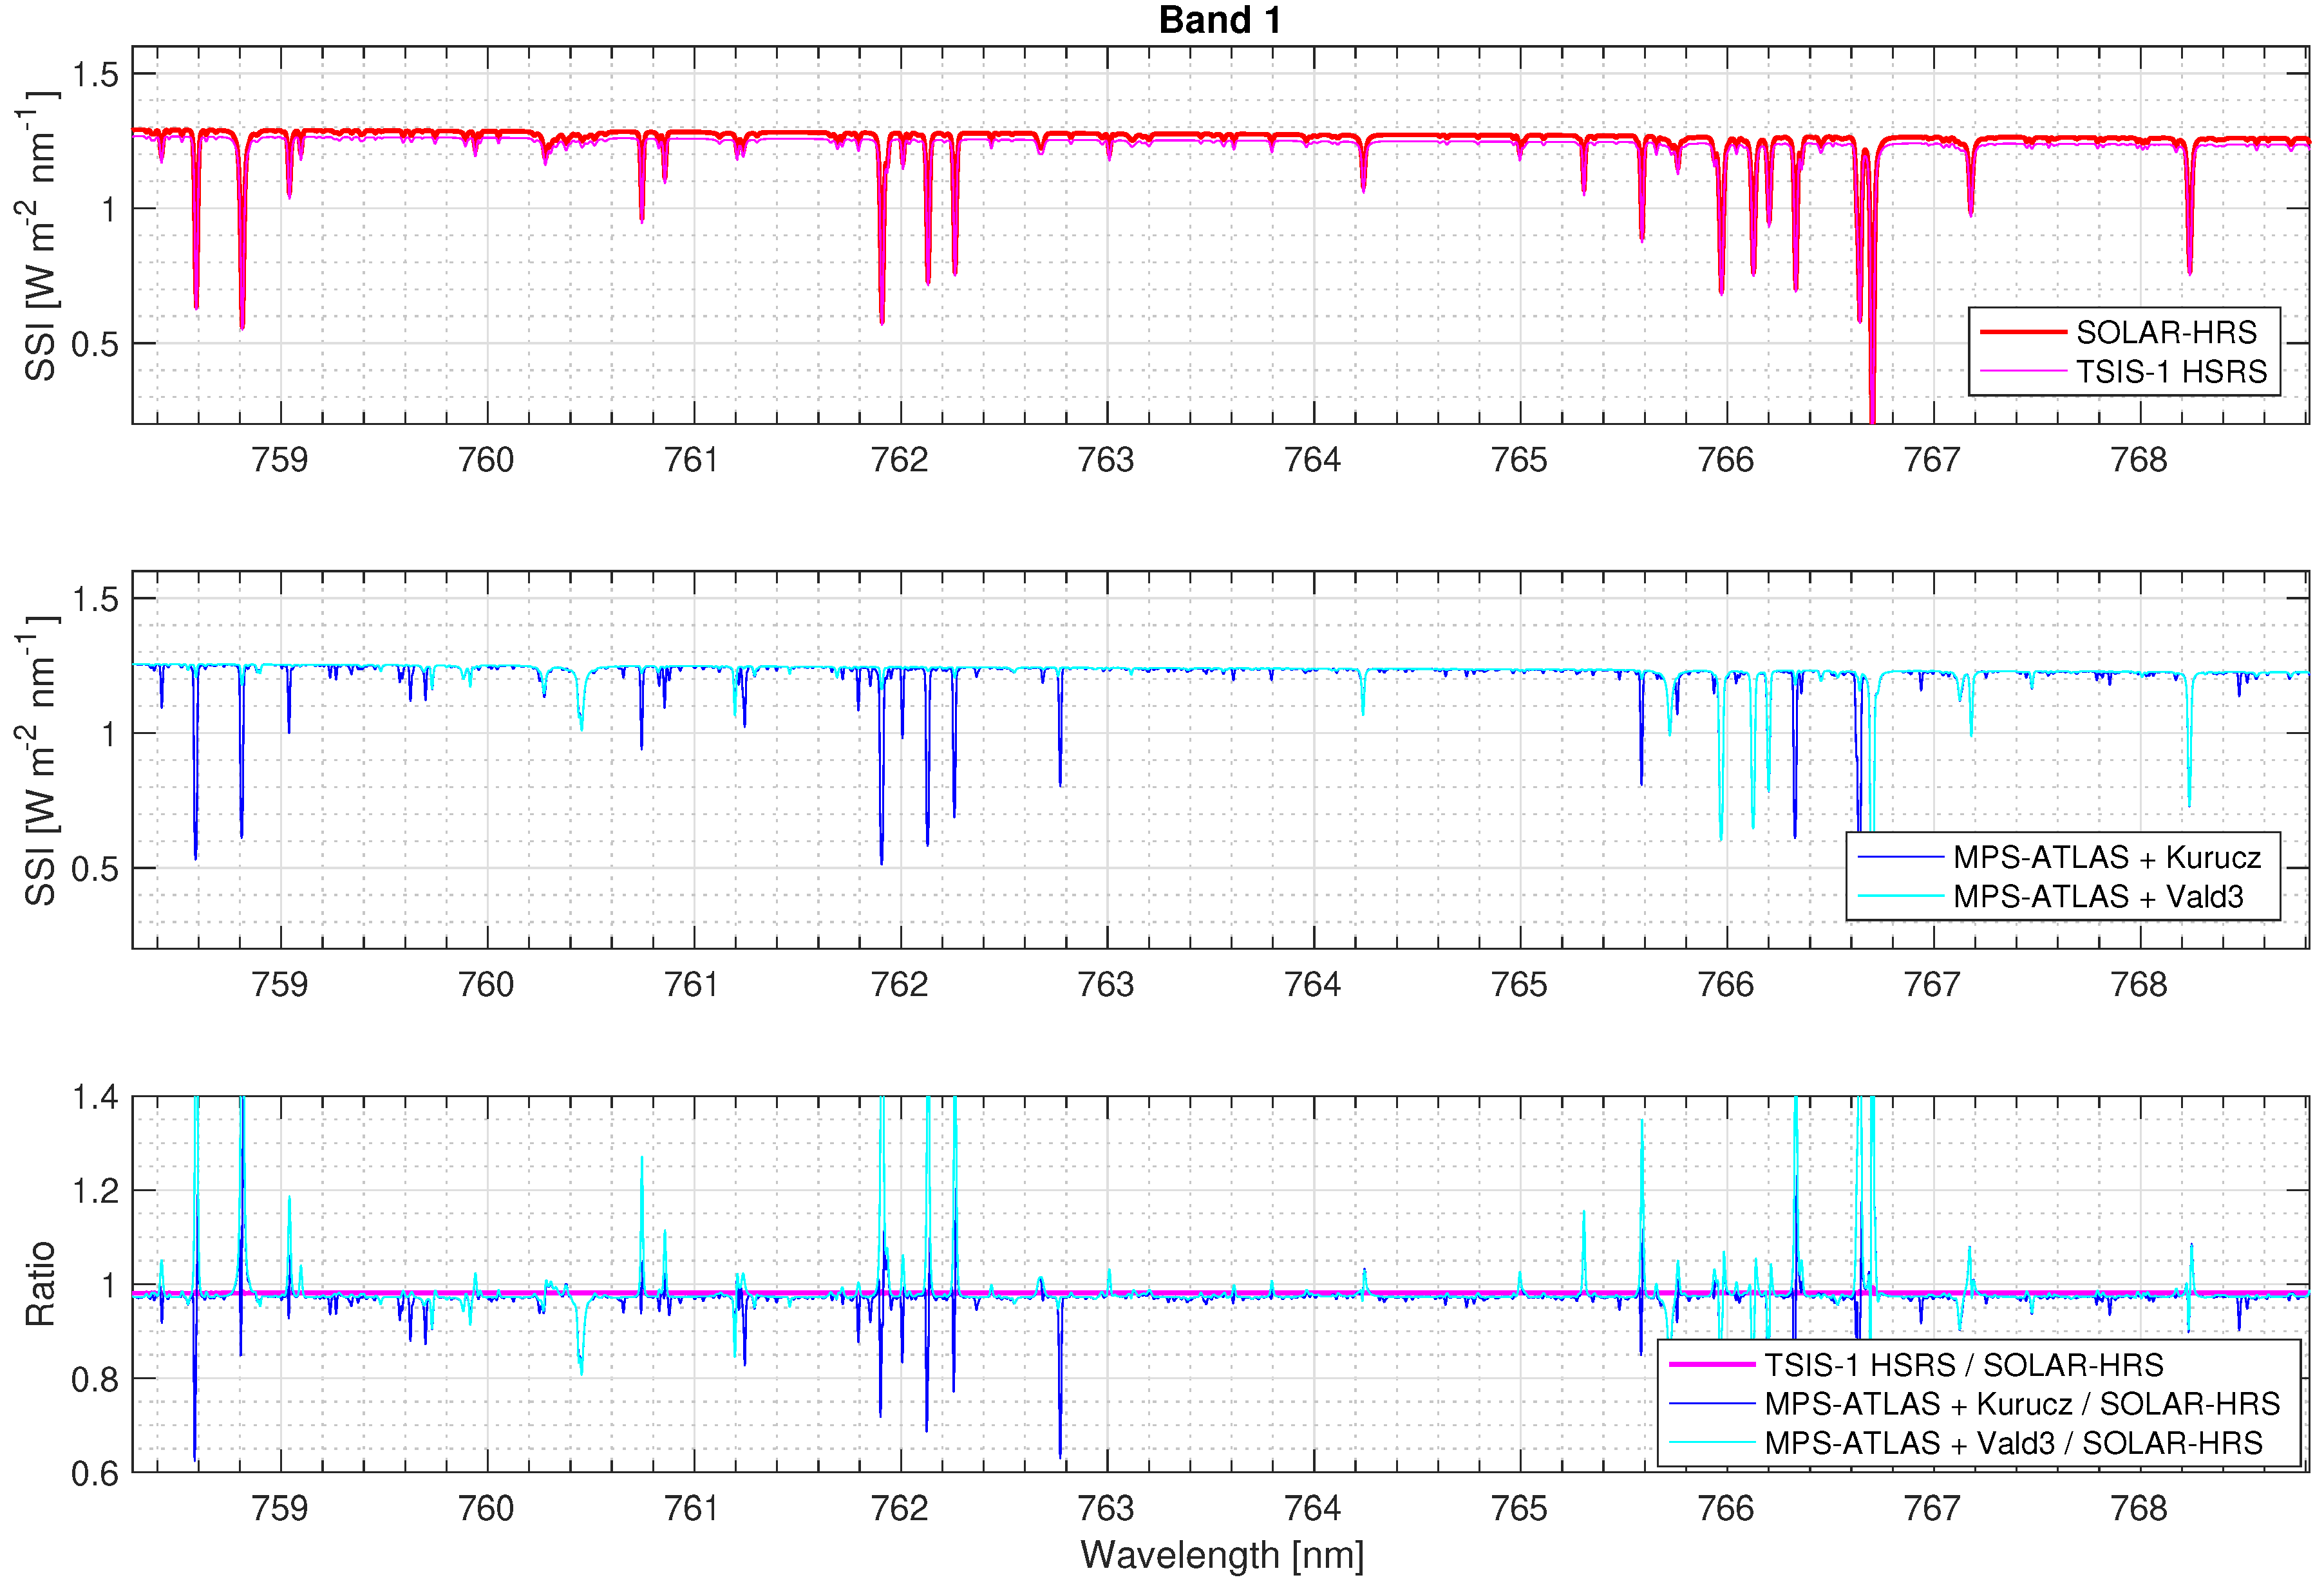
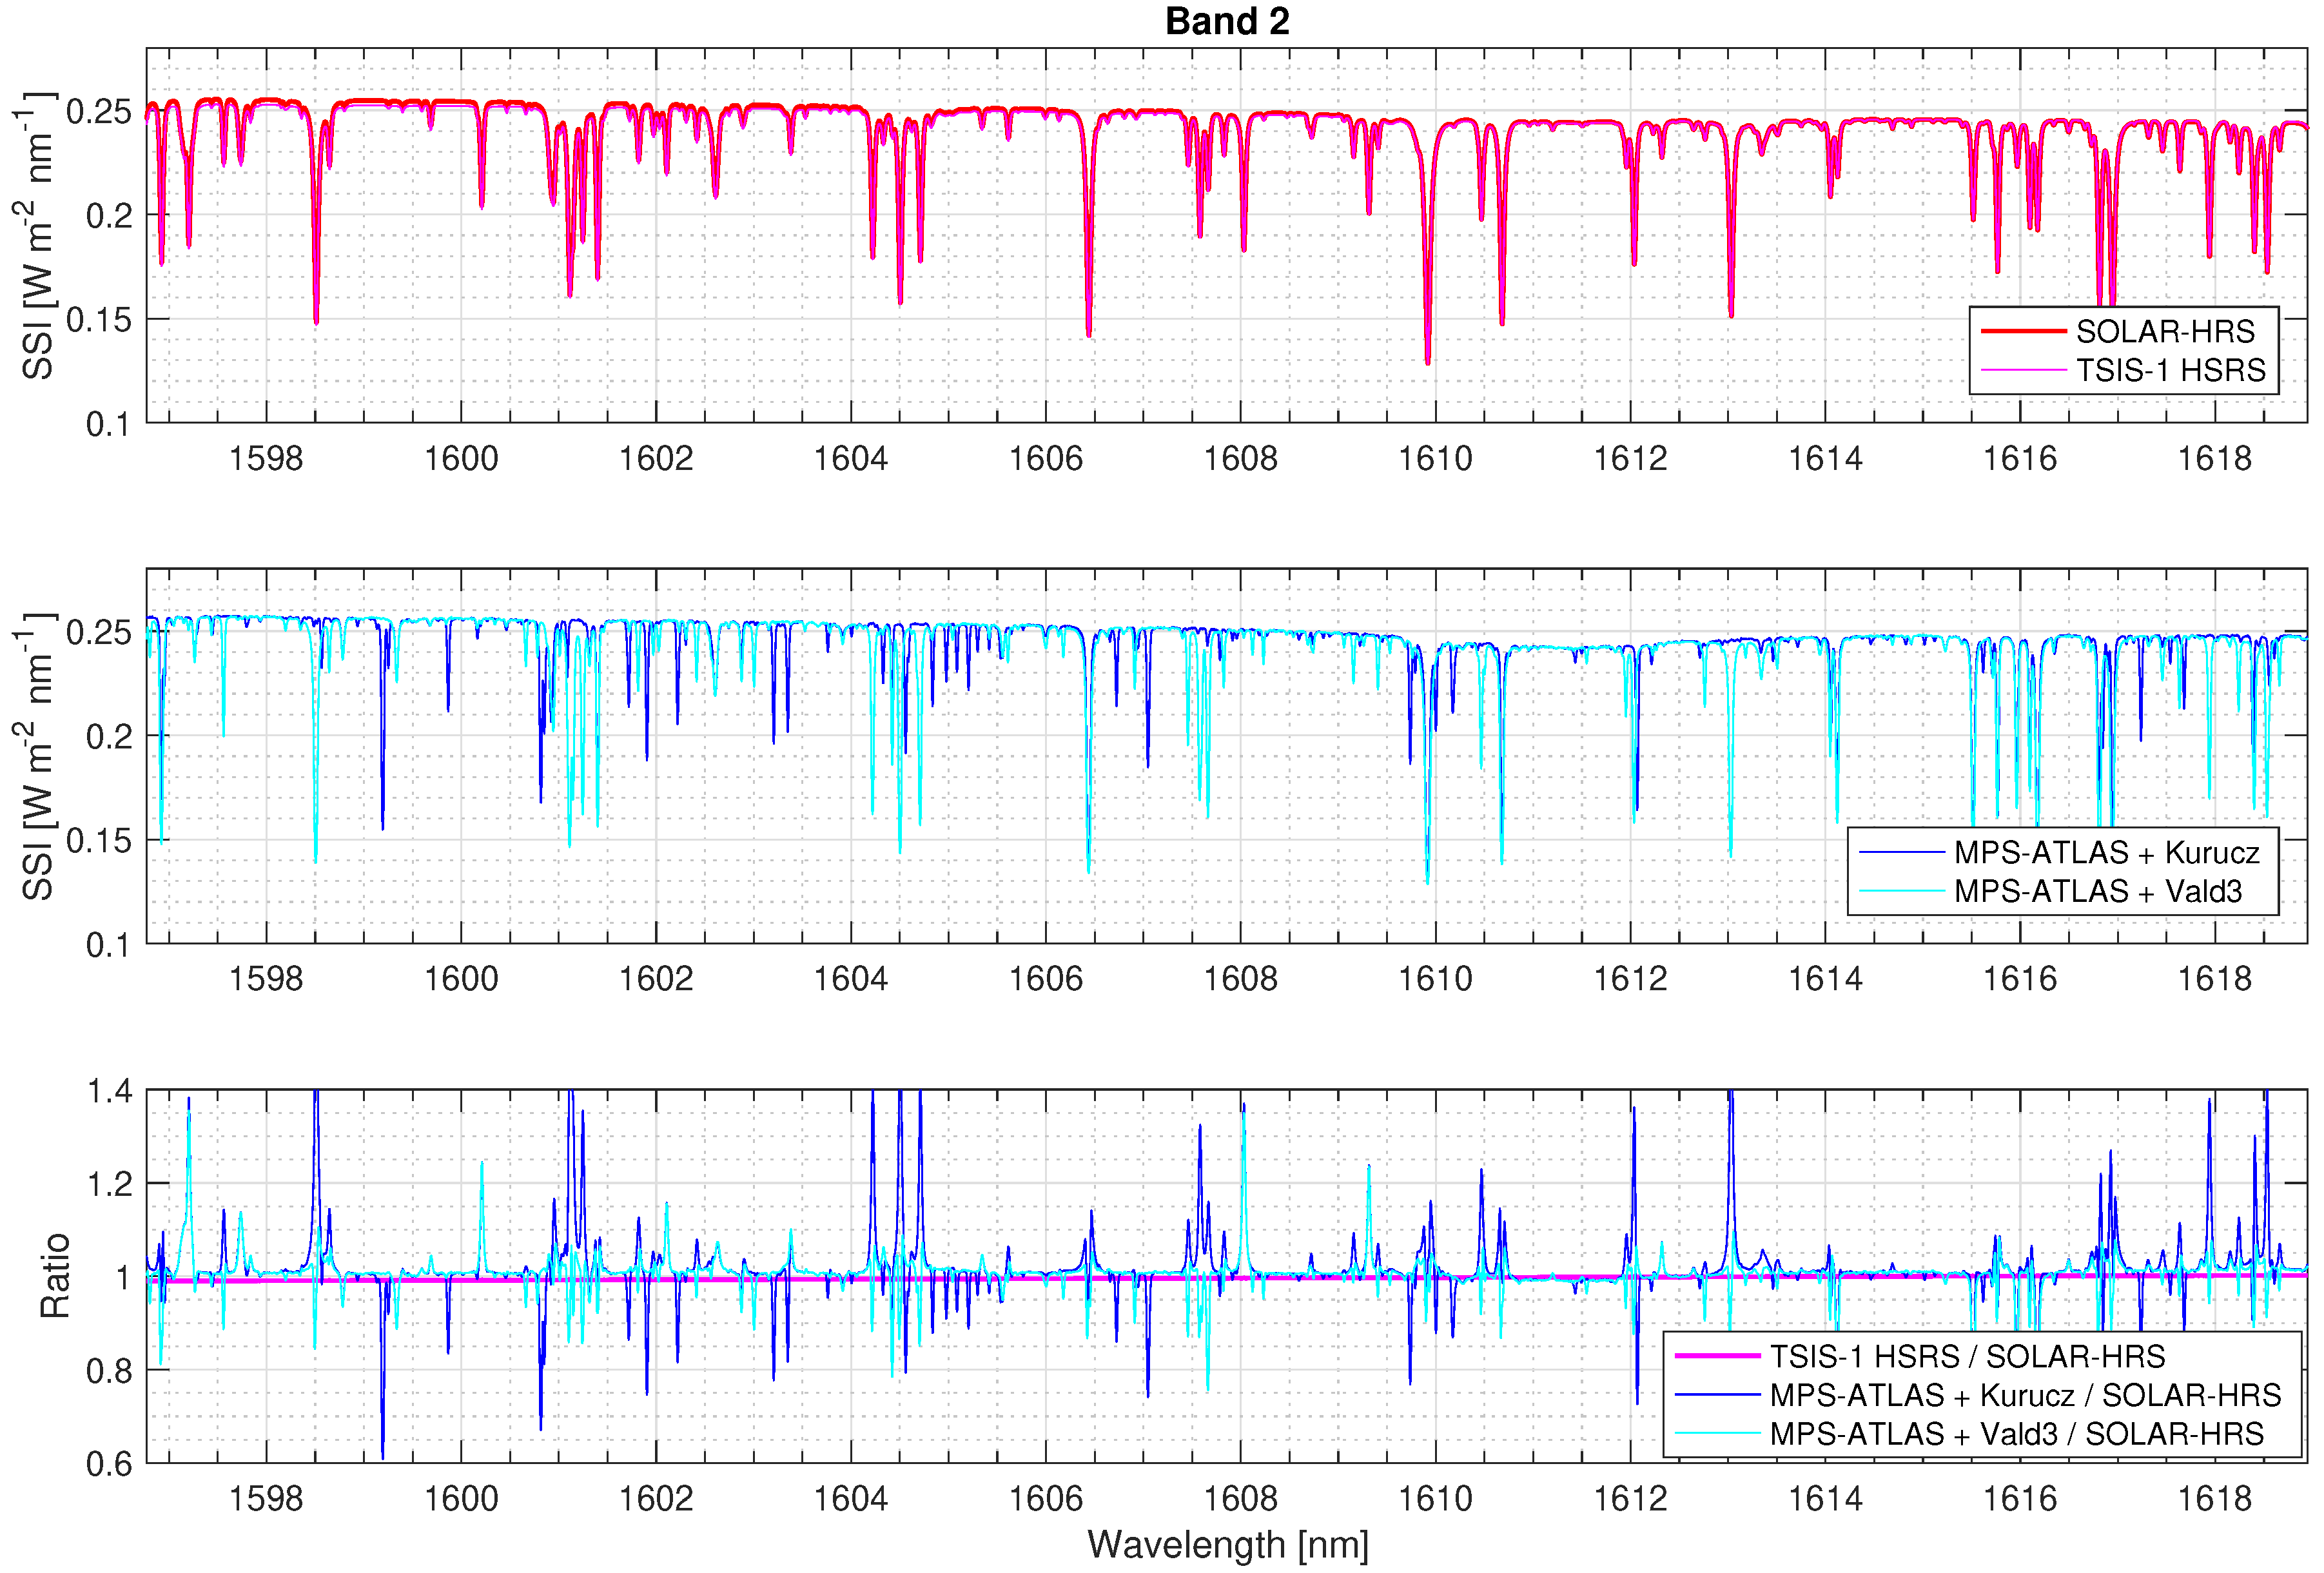
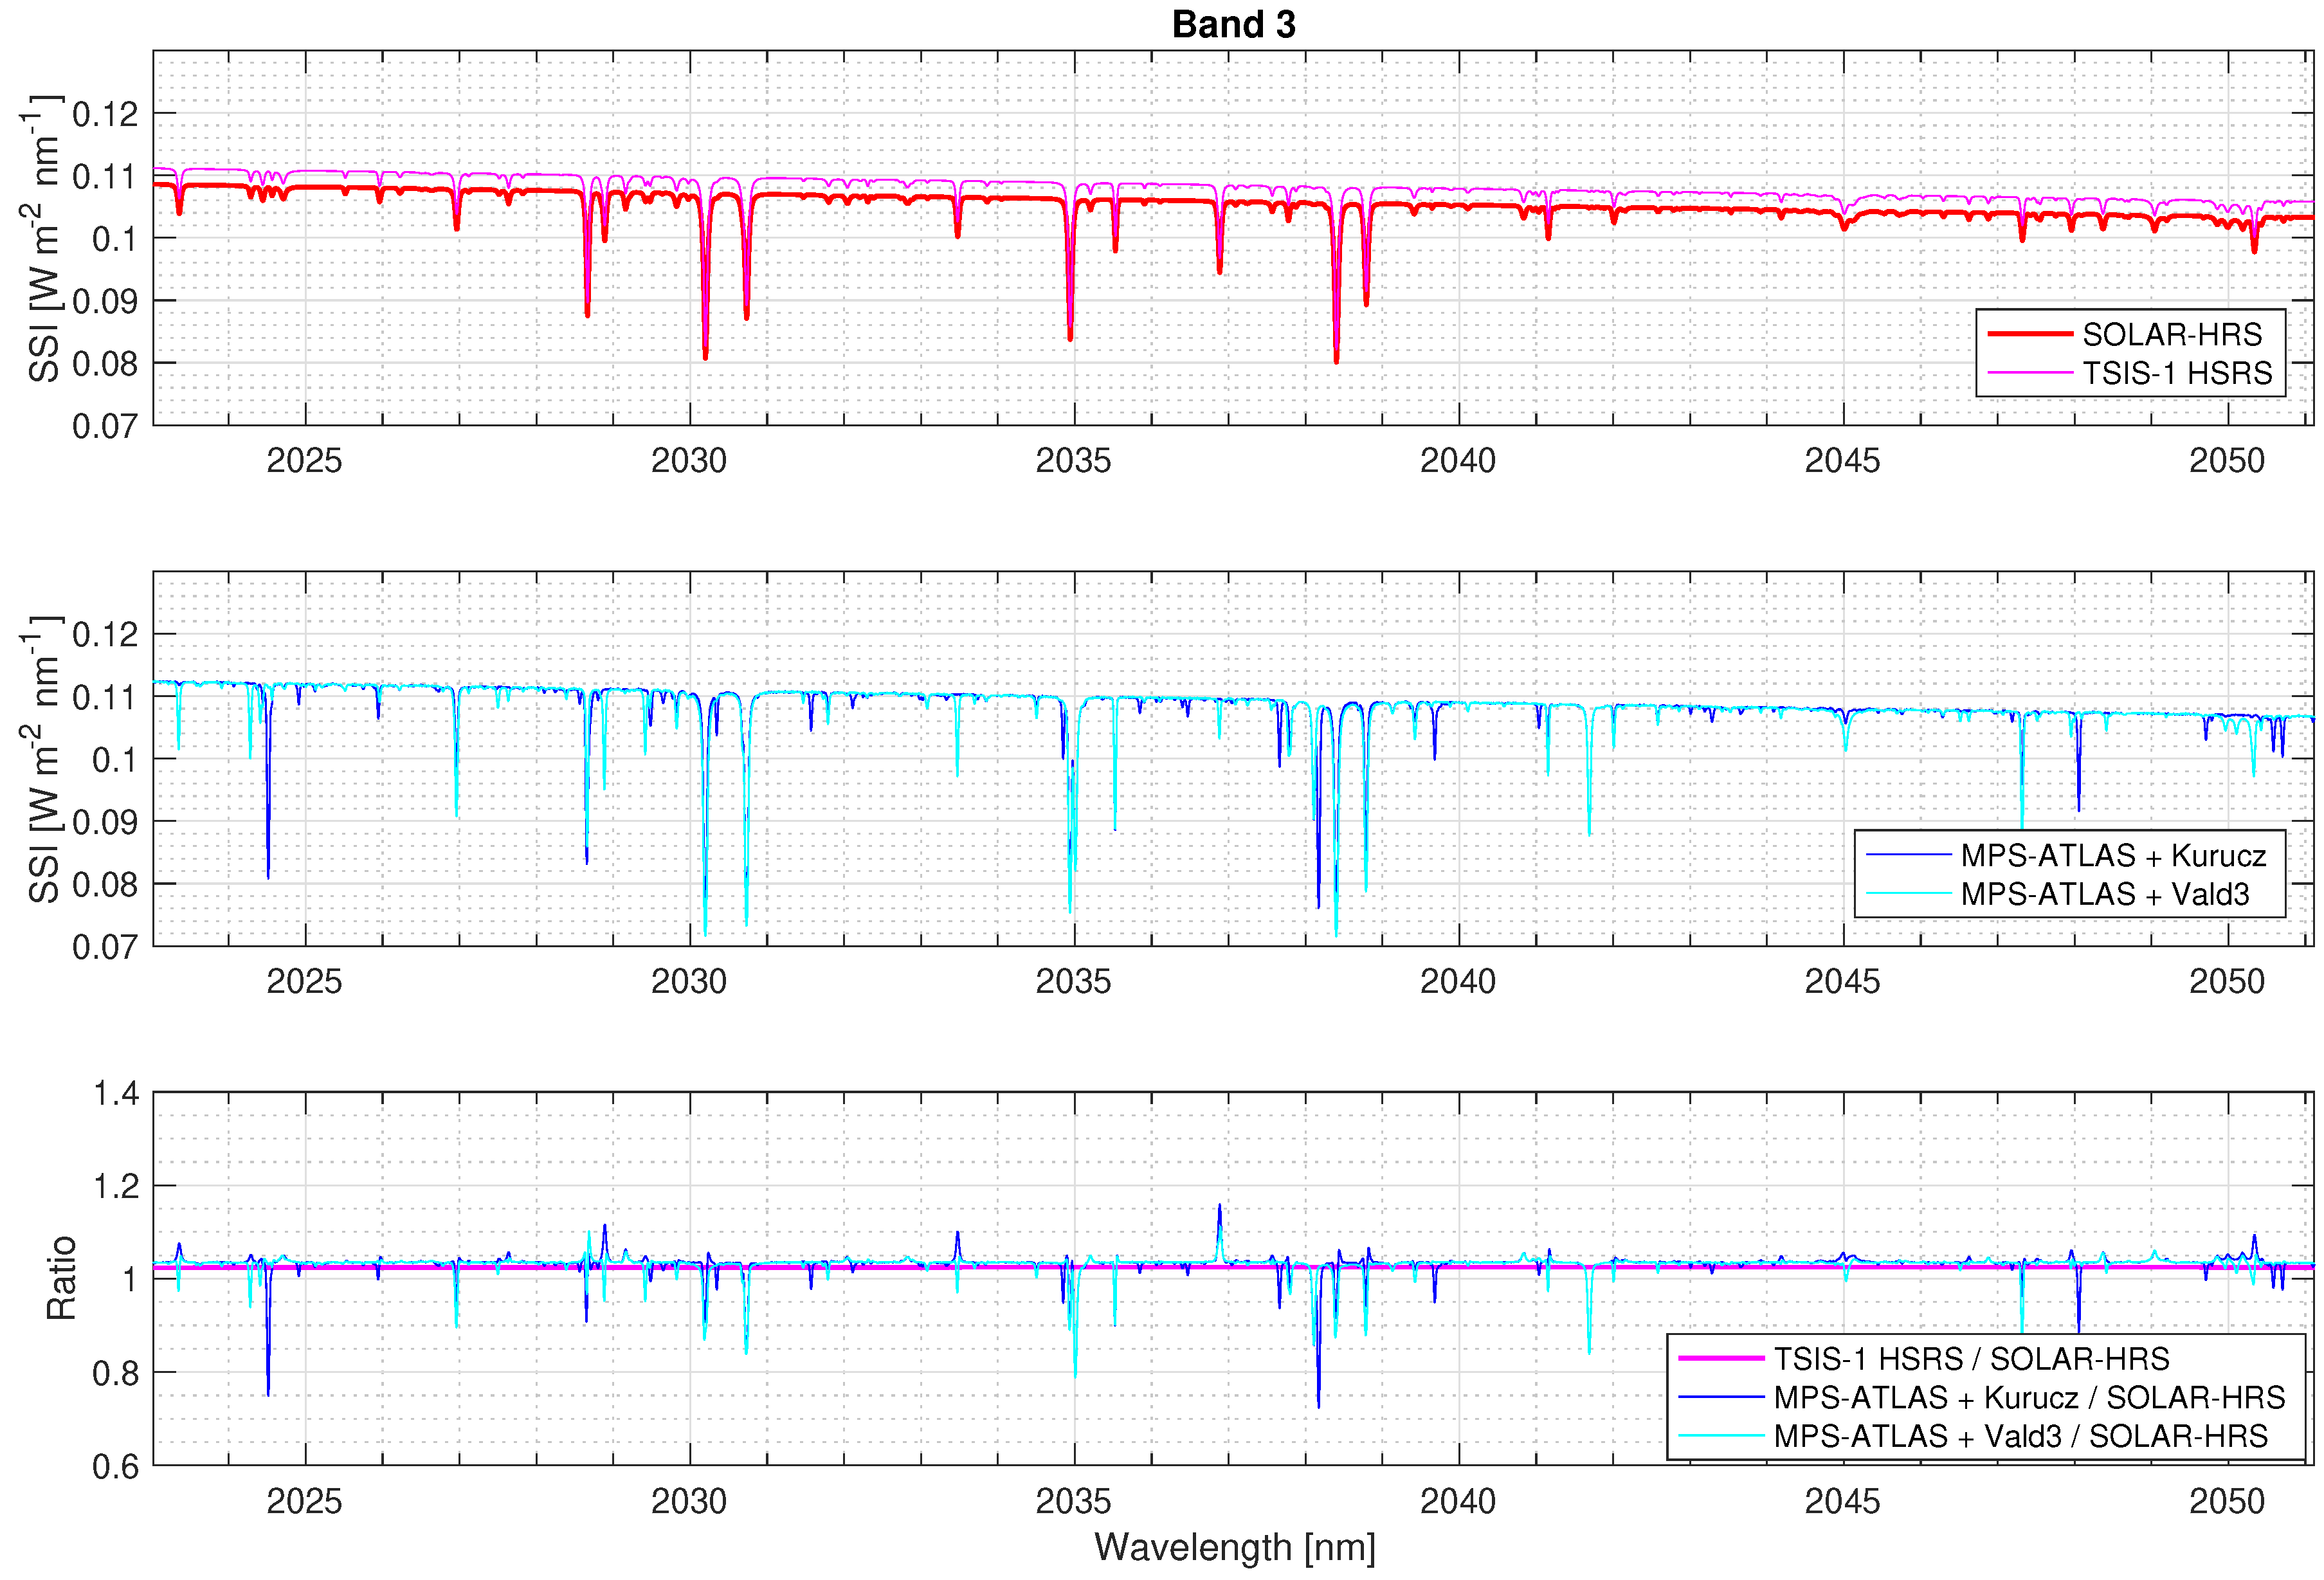
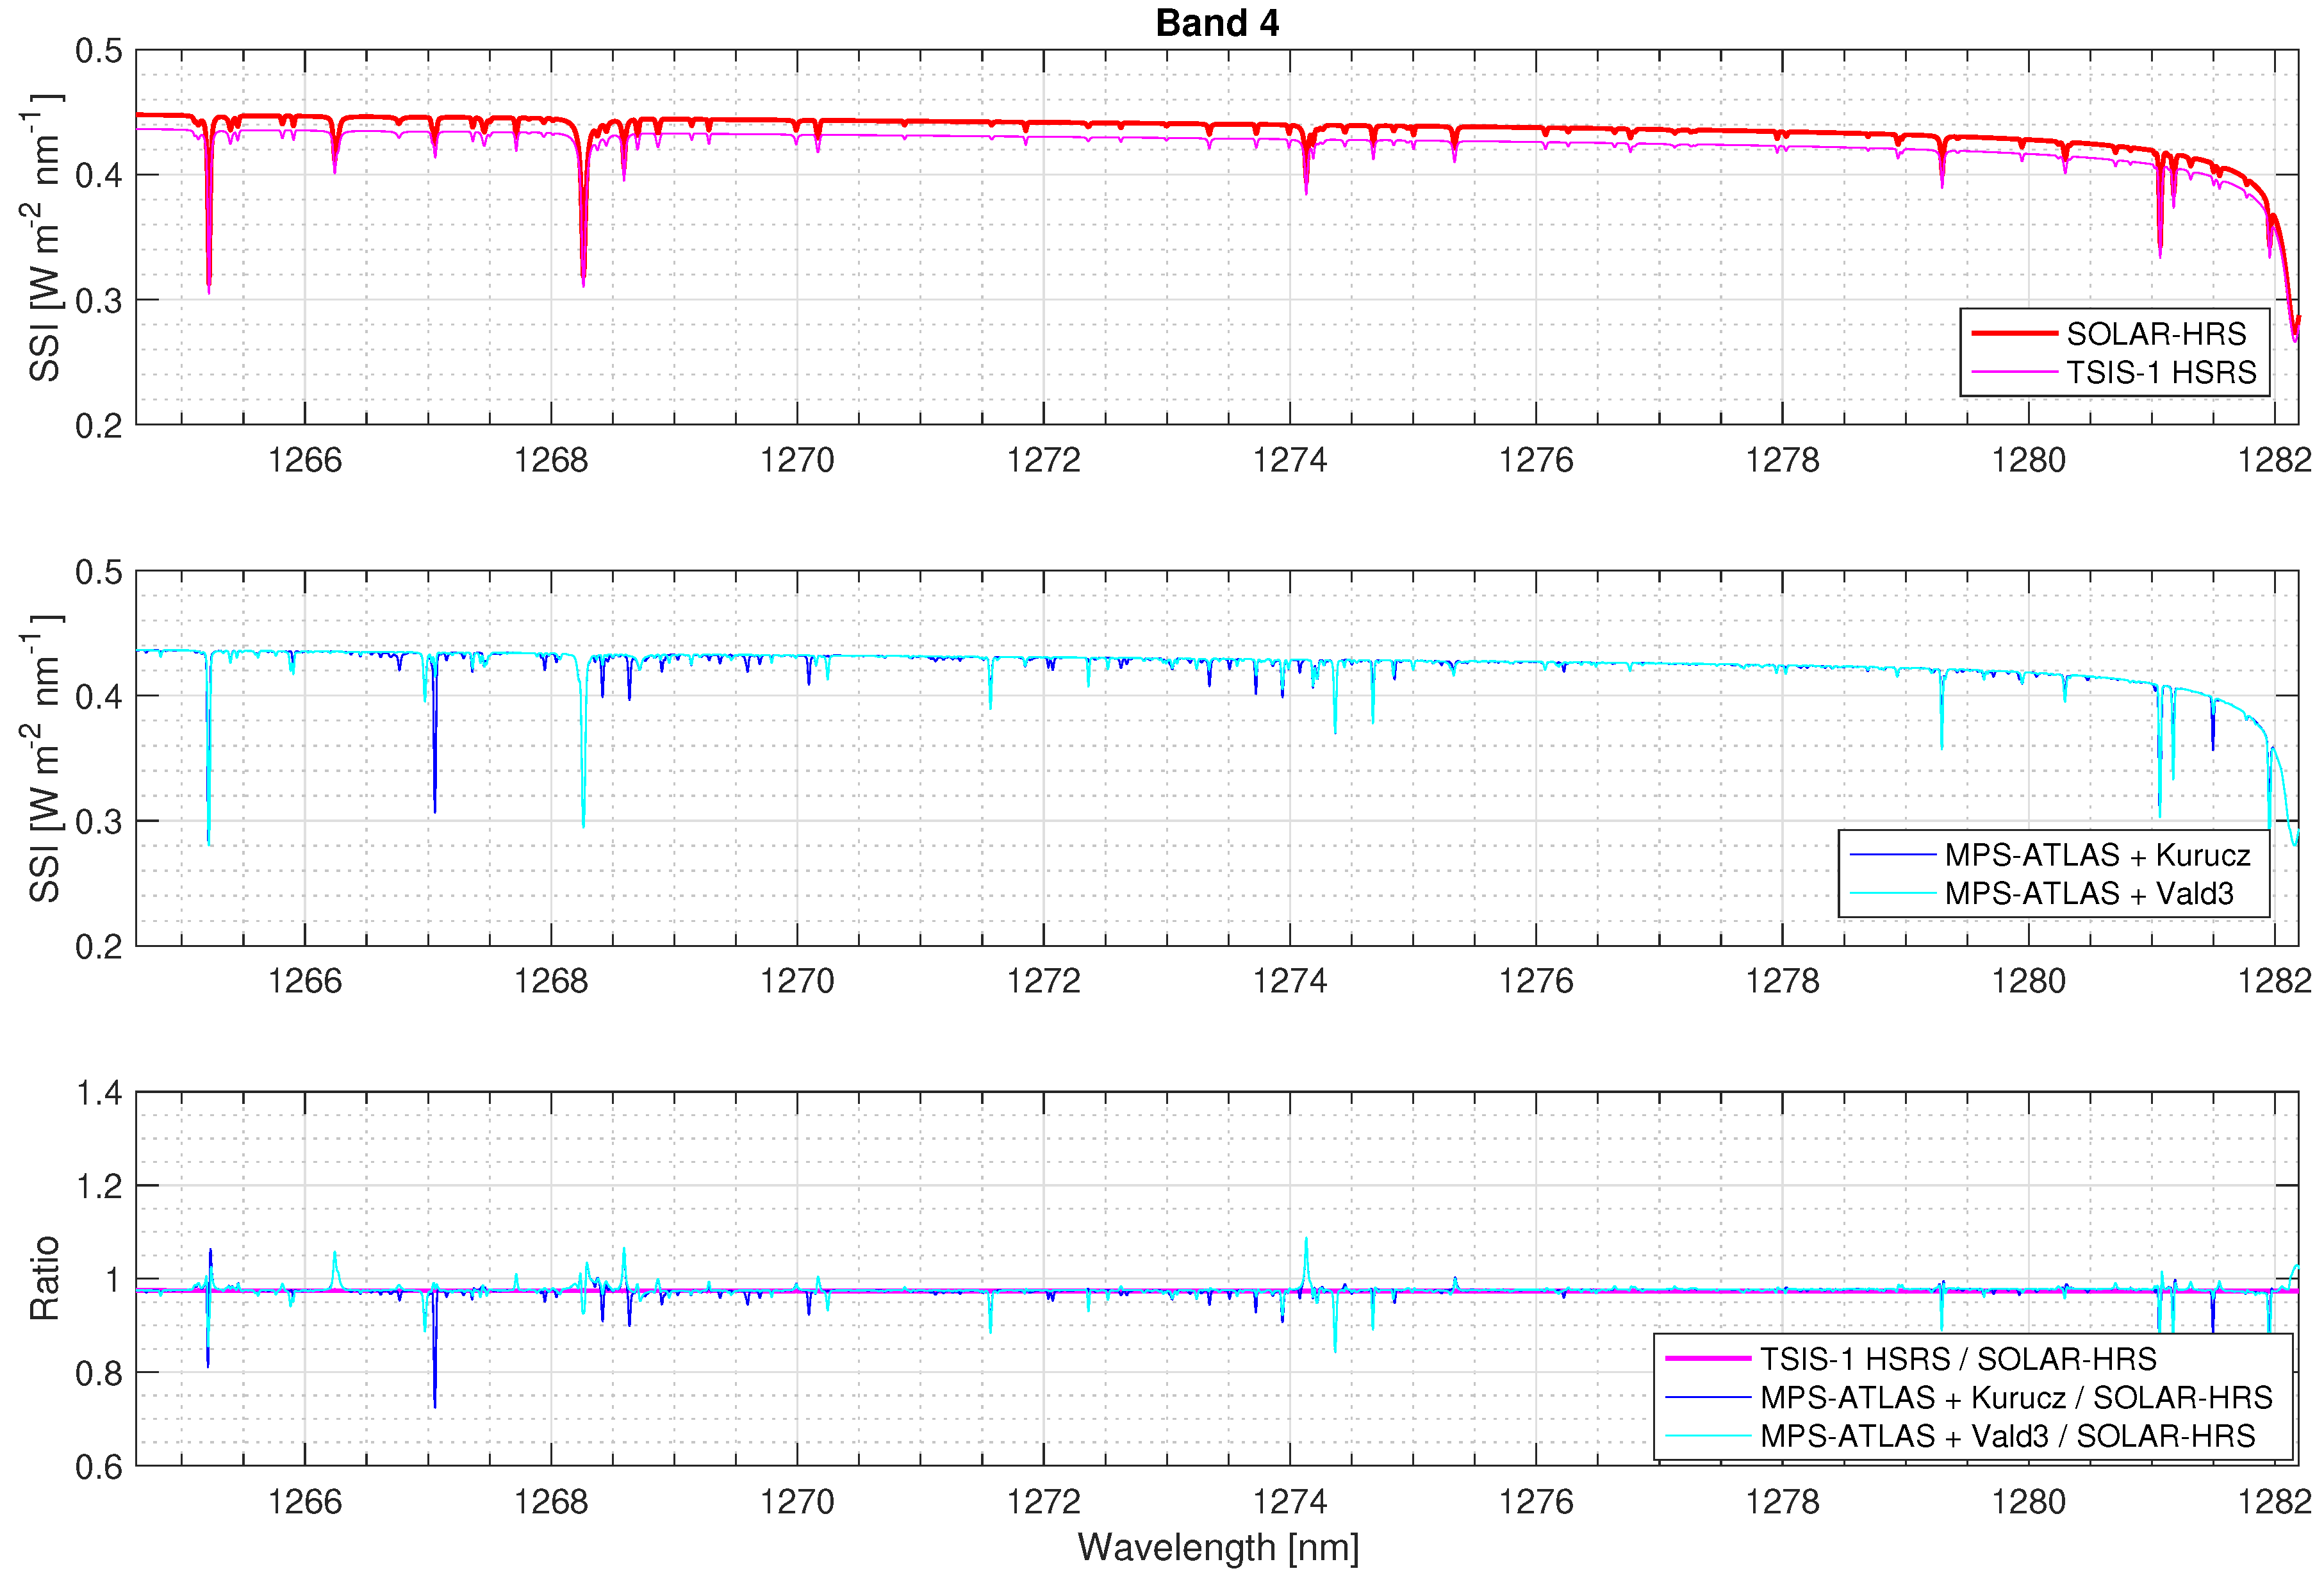
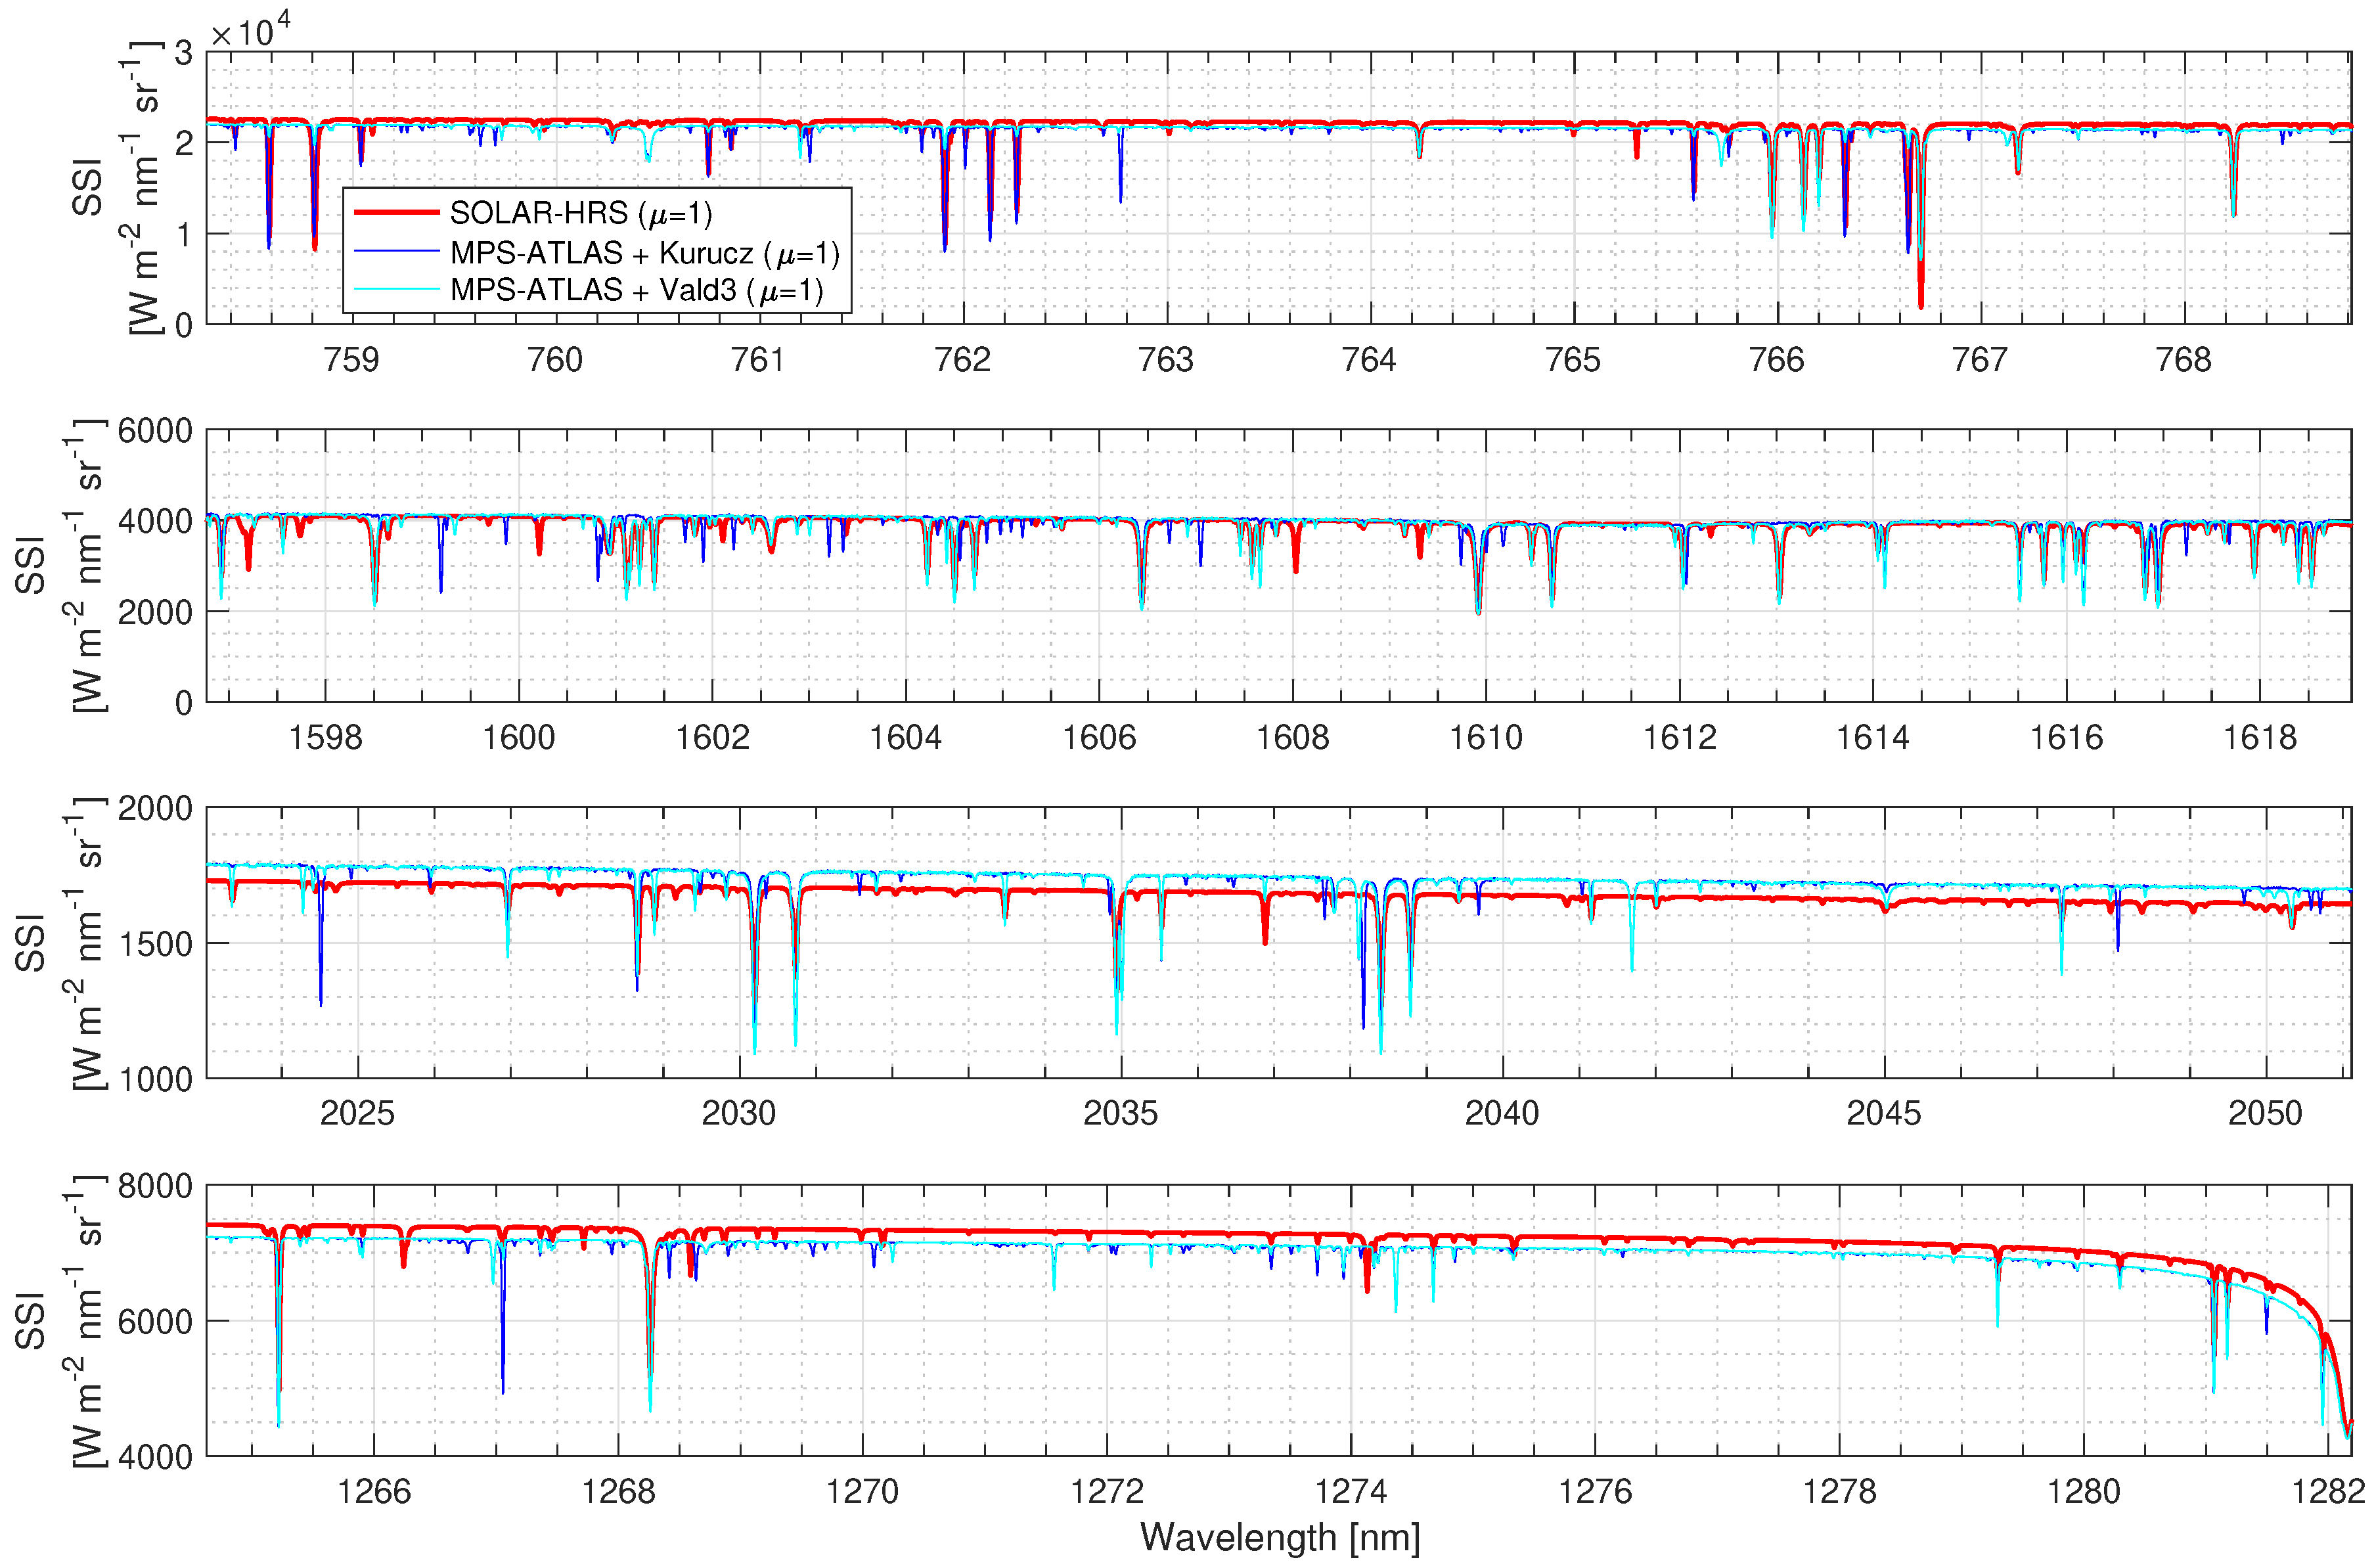
Figure 5, Figure 6, Figure 7 and Figure 8 show the solar irradiance values in the MicroCarb bands (B1, B2, B3, and B4) for the different disk-integrated spectra (SOLAR-HRS, TSIS-1 HSRS, and MPS-ATLAS with Kurucz and Vald3 linelists). Between SOLAR-HRS and TSIS-1 HSRS, the relative difference is smaller than 0.5% in all MicroCarb bands, demonstrating robust SOLAR-HRS disk-integrated central line positions and shapes (equivalent widths and central line depths).
The absolute levels between SOLAR-HRS and TSIS-1 HSRS spectra are excellent (∼2%). This shows the robustness of the radiometric uncertainties (k = 1) of the SOLAR-HRS disk-integrated spectrum for the different observation bands of the MicroCarb mission (B1: 0.92%; B2: 1.94%; B3: 1.25%; and B4: 0.41%). The B2 band is the least accurate. Around 1.6 m (the wavelength band that corresponds to the maximum brightness temperature of the Sun, where the minimum of the H opacity occurs), the SOLAR-HRS radiometric uncertainty is close to 2% and twice the expected value for MicroCarb’s scientific requirements.
A good knowledge of the absolute radiometric level of the SOLAR-HRS continuum disk-integrated spectrum is essential for MicroCarb to not disturb the inversion by erroneous residues. The spectra inversion tool, 4ARTIC, is based on the 4AOP radiative transfer code, one of whose inputs is the solar irradiance spectrum. 4ARTIC estimates the geophysical state (profiles of CO, HO, aerosols, surface albedo, surface pressure) by minimizing the difference between the theoretical spectrum and measured spectrum. An additional research investigation shows that an error in the radiometric level of the solar spectrum will result, during the inversion, in confusion between the levels of light reflected by the surface and light diffused by the atmosphere, which will induce an error in MicroCarb-estimated CO. Low-frequency variations in the continuum can also disturb the estimation of surface albedo or aerosols, with an impact on CO. Moreover, a good knowledge of the positions and shapes of the solar lines is also necessary to minimize the residues, which can otherwise disturb the inversion. In particular, badly modeled solar lines coinciding with atmospheric lines are particularly difficult to detect.
For Fraunhofer lines (existence, central line position, equivalent widths, and central line depths), significant discrepancies exist between SOLAR-HRS (or TSIS-1 HSRS) and the models (MPS-ATLAS). Some additional or missing Fraunhofer lines exist, and the depths of several solar lines are much deeper. Further studies should be conducted to remove ambiguities. The MPS-ATLAS models (for Kurucz and Vald3 linelists) seem questionable since there is good agreement between SOLAR-HRS (or TSIS-1 HSRS) and the high-resolution Thermal And Near-infrared Sensor for carbon Observation Fourier-Transform Spectrometer (TANSO-FTS) observations obtained during solar calibration scans of the Greenhouse Gases Observing Satellite (GOSAT) mission [51]. Between SOLAR-HRS and TANSO-FTS, the relative difference is smaller than 0.5% in several bands of TANSO-FTS observations (757.58–775.19 nm, 1562.5–1724.1 nm, 1923.1–2083.3 nm), demonstrating robust SOLAR-HRS disk-integrated central line positions and shapes (widths and central line depths).
Figure 9 compares the solar irradiance values in the MicroCarb bands (B1, B2, B3, and B4) for the different disk-center spectra (SOLAR-HRS and MPS-ATLAS with Kurucz and Vald3 linelists) in the 650–4400 nm wavelength range. The SOLAR-HRS disk-center spectrum is representative of a solar minimum. It is obtained from SOLAR-ISS, LDF from models, and SPTS data for the disk-center case ( = 1.0).
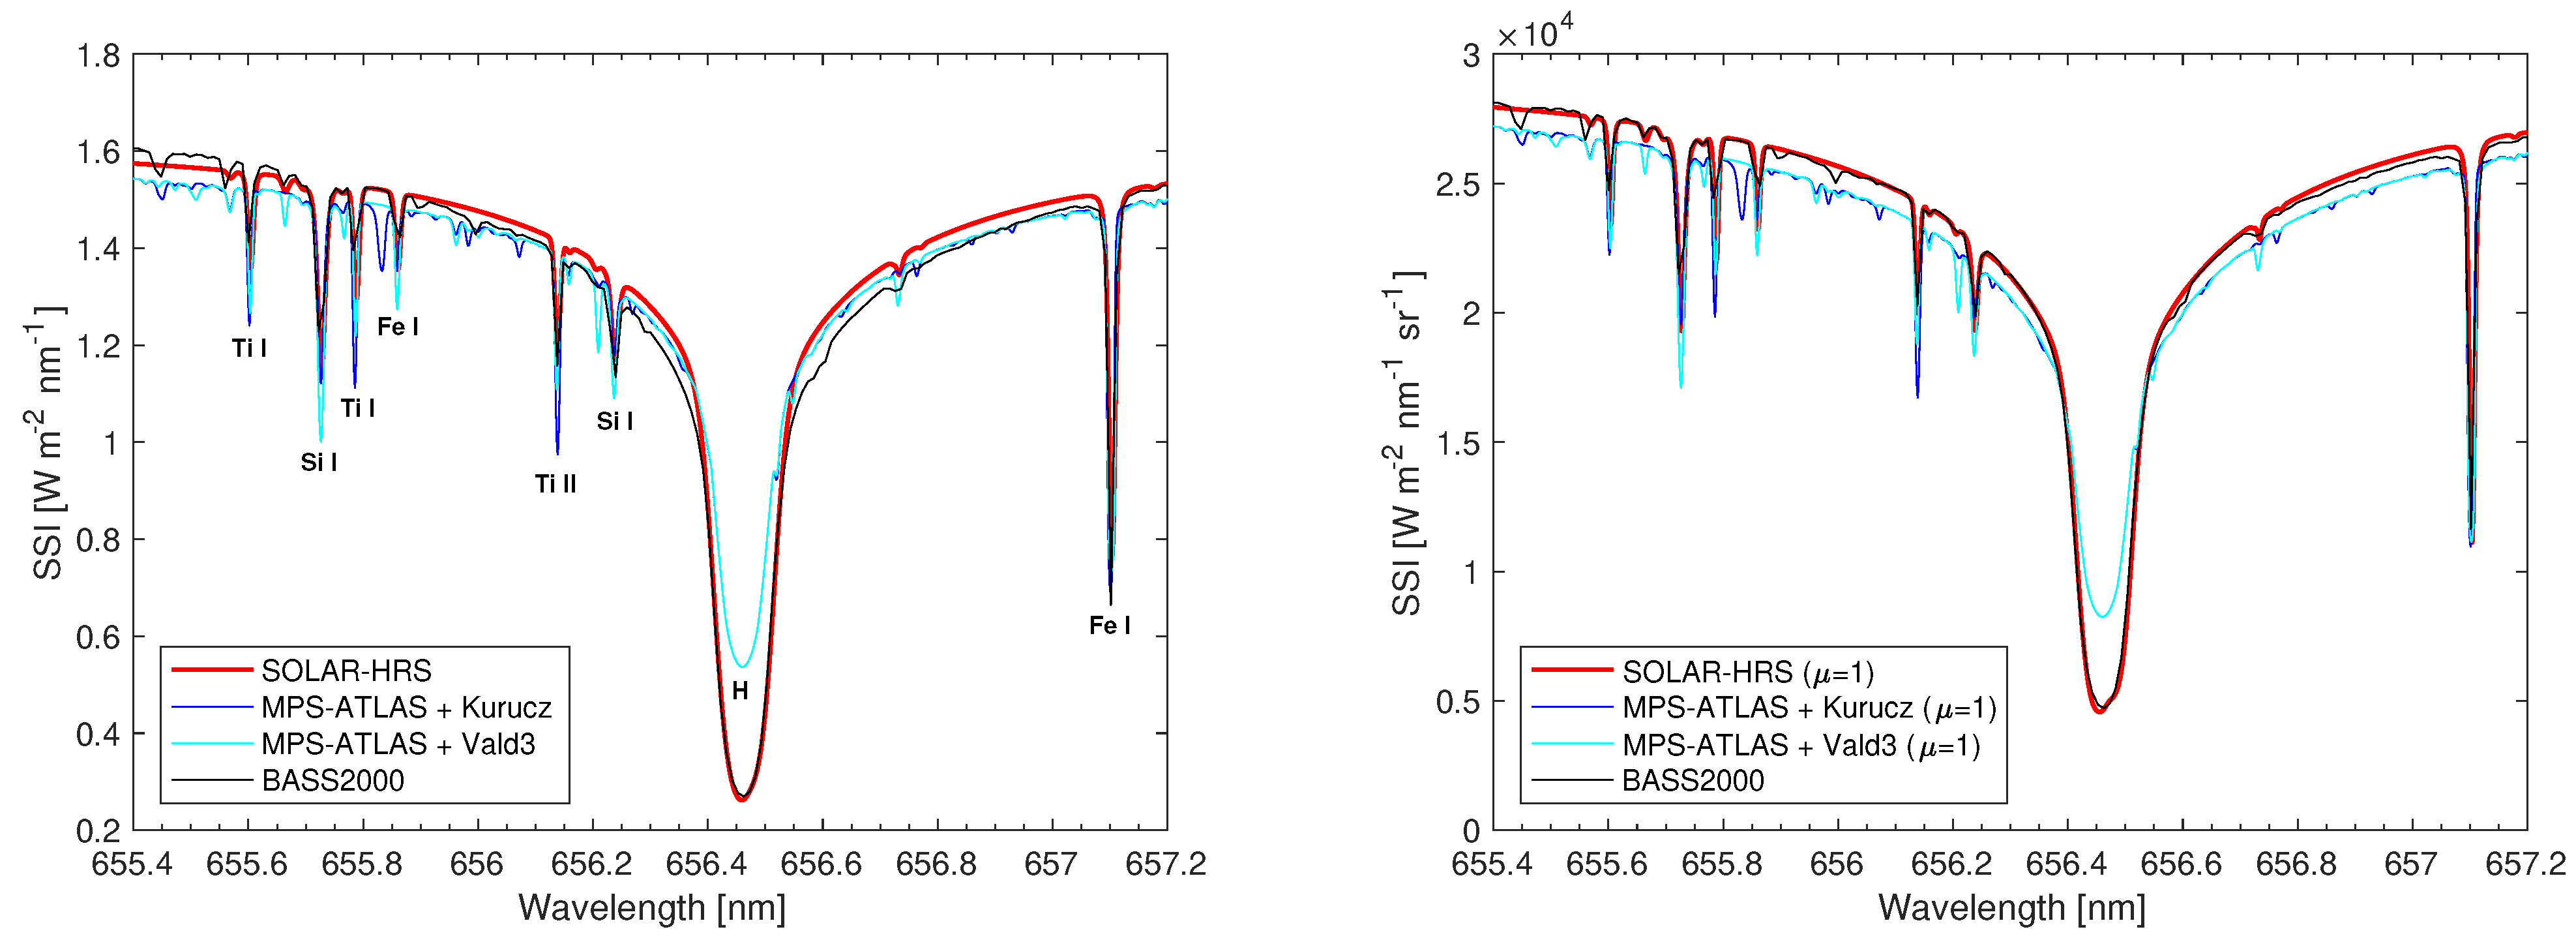
Figure 10 shows the spectral distributions around 656.46 nm of different solar spectra (SOLAR-HRS, MPS-ATLAS, and normalized high-resolution solar spectrum of BAse de données Solaire Sol (BASS2000, https://bass2000.obspm.fr/solar_spect.php)). These different spectral distributions are provided for the disk-integrated and disk-center cases. The Fraunhofer lines around the H-alpha wavelength (656.46 nm in vacuum) and associated solar elements are displayed (Figure 10, left). SOLAR-HRS, MPS-ATLAS (for Kurucz and Vald3 linelists), and BASS2000 are generally in good agreement. However, disparities exist and deserve to be discussed. The comparison between SOLAR-HRS and BASS2000 is not excellent for the disk-integrated spectral distribution, whereas it is for the disk-center spectral distribution. This seems logical, as the BASS2000 solar spectrum is based on Delbouille et al (1973) [3] solar spectral atlas, which is one of the most important collections of reference spectra of the Sun at the disk-center and in the visible domain. The comparison between SOLAR-HRS and BASS2000 at the center of the disk is excellent and highlights the quality of SOLAR-HRS new solar spectra. As for the comparison between SOLAR-HRS and the MPS-ATLAS models (for Kurucz and Vald3 linelists), there are significant differences for both the solar disk-integrated and disk-center cases. The position and the depth of the Fraunhofer solar lines are not always in good agreement. Differences between SOLAR-HRS and the models (MPS-ATLAS) can be explained by the fact that MPS-ATLAS is not suitable for the H-alpha line and should be calculated in NLTE. The use of another code (e.g., RH code [52] or NESSY—both give nice hydrogen lines) would allow for improved results and a good reproduction of the H-alpha solar line. For example, the RH radiative transfer code enables the calculation of emergent intensities from various viewing angles across different geometries. It supports the computation of multiple atomic and molecular transitions, considering both LTE and non-LTE conditions with complete or partial redistribution. This improvement would enable the determination of new spectra from models that can be compared to SOLAR-HRS, specifically in the hydrogen lines.
6. Discussion and Conclusions
SOLAR-HRS (disk-integrated) is a new high-resolution solar reference spectrum developed by normalizing high-spectral-resolution solar line data to the absolute irradiance scale of the SOLAR-ISS reference spectrum. In the 500–2000 nm wavelength range, the spectral resolution is between ∼0.0004 and 0.004 nm, and the absolute radiometric uncertainty is mainly less than 1%. The agreement with the TSIS-1 HSRS reference spectrum is excellent since the difference between SOLAR-HRS and TSIS-1 HSRS is close to 3% between 500 and 2000 nm. In terms of the Fraunhofer central line positions and shapes (equivalent widths and central line depths), the relative difference between SOLAR-HRS and TSIS-1 HSRS is very weak in the 500–2000 nm wavelength range. For the MicroCarb observation bands (B1 to B4), the SOLAR-HRS disk-integrated spectrum partially meets MicroCarb’s scientific requirements (Table 4).
SOLAR-HRS (disk-integrated) is a spectrum representative of a solar minimum. In the case of the MicroCarb mission, it is necessary to have the evolution of the disk-integrated SOLAR-HRS spectrum from 2024 to 2030. Then, one of the other aspects to be studied in the near future is that related to the variability in the solar spectral irradiance during a solar cycle, also known as the solar magnetic activity cycle, or Schwabe cycle, which is a nearly periodic 11-year change in the Sun’s activity. Beyond 500 nm, the variability in the solar spectral irradiance is less than 0.1% over an approximately 11-year cycle. This modification of the absolute radiometric level of the solar spectrum obviously has consequences regarding the inversion of MicroCarb data. Another effect to consider is the one related to the evolution of the Fraunhofer line shape during a solar cycle, which is not well known.
Furthermore, we implemented new high-resolution disk-integrated solar spectra based on solar modeling (MPS-ATLAS) with Kurucz and Vald3 solar linelists. Agreement with the 1D (MPS-ATLAS) model is less conclusive. The main limitation is the input solar linelists for Kurucz [44] and Vald3 [49]. We are impatiently awaiting the observations made by MicroCarb (launch scheduled in 2024–2025) in the four bands to contradict the different spectra developed (SOLAR-HRS and MPS-ATLAS).
We also created a unique new solar SOLAR-HRS disk-center spectrum in the 650.0–4400.0 nm wavelength range and several solar spectra (SOLAR-HRS intermediate cases) for ten different solar view angles from = 0.9 to = 0.05. We have additionally developed new solar spectra based on models (MPS-ATLAS) to enable comparisons. All these developments highlight the need to implement new European spacecraft instruments (SOLSPEC NG, SOLSPEC VIS, SOLSPEC NIR) to observe the Sun with very high accuracy. This study underlines the significance of accurately determining solar spectra to fulfill the requirements of atmospheric missions and remote sensing applications. It will enable, among other things, the provision of solar inputs necessary for the data analysis of our next French 6U CubeSat (Uvsq-Sat NG: 10 kg, 15 W, 60 × 24 × 36 cm, launch scheduled in 2025), which is dedicated to greenhouse gas observations and measurements of the Earth’s energy budget at the top of the atmosphere. Based on Inspire technology [53,54], Uvsq-Sat NG will carry a near-infrared spectrometer (1240–2000 nm, spectral resolution of 6 nm, spatial resolution of a few km). It requires multiple input parameters (SOLAR-HRS, albedo, airglow, etc.) to successfully invert the Uvsq-Sat NG data (Levenberg–Marquardt method), enabling the quantification of observed greenhouse gases (CO, CH, HO).
Author Contributions
M.M., A.S., P.K. and A.H. formulated and directed the methodology, results analysis, and preparation of the manuscript. All authors have read and agreed to the published version of the manuscript.
Funding
This work has received funding from Centre National d’Études Spatiales (CNES, France), Centre National de la Recherche Scientifique (CNRS, France), and Université de Versailles Saint-Quentin-en-Yvelines (UVSQ, France). This work is also supported by the Programme National Soleil Terre (PNST, France) of CNRS/INSU (France), co-funded by Centre National d’Études Spatiales (CNES, France) and Commissariat à l’énergie atomique (CEA, France).
Data Availability Statement
The solar reference spectra derived in this work are available at http://bdap.ipsl.fr/voscat_en/solarspectra.html, accessed on 13 March 2023.
Acknowledgments
The authors thank the LATMOS team, the MicroCarb team, the Uvsq-Sat NG team, Denis Jouglet (CNES), Charlotte Revel (CNES), Kader Amsif (CNES), Alexander Shapiro (Max Planck Institute for Solar System Research), Veronika Witzke (Max Planck Institute for Solar System Research), David Bolsée (BIRA-IASB), Nuno José dos Santos Pereira (BIRA-IASB), and Aurélie Reberac (LATMOS).
Conflicts of Interest
The authors declare no conflict of interest.
References
- Meftah, M.; Jouglet, D.; Revel, C. The SSHR Solar Reference Spectrum. In Proceedings of the AGU Fall Meeting Abstracts, New Orleans, LA, USA, 13–17 December 2021; Volume 2021, p. SH45B-2379. [Google Scholar]
- Moore, C.E.; Minnaert, M.G.J.; Houtgast, J. The Solar Spectrum 2935 A to 8770 A; National Bureau of Standards Monograph: Washington, DC, USA, 1966.
- Delbouille, L.; Roland, G.; Neven, L. Atlas Photometrique du Spectre Solaire de [lambda] 3000 a [lambda] 10000; Université de Liège: Liège, Belgium, 1973. [Google Scholar]
- Willson, R.C. Status of knowledge of the extraterrestrial solar ’constant’ and spectral distribution. In Proceedings of the Seminar on Testing Solar Energy Materials and Systems, Gaithersburg, MD, USA, 22–24 May 1978; pp. 75–82. [Google Scholar]
- Kurucz, R.L.; Furenlid, I.; Brault, J.; Testerman, L. Solar Flux Atlas from 296 to 1300 nm; National Solar Observatory: Sunspot, NM, USA, 1984. [Google Scholar]
- Fontenla, J.; White, O.R.; Fox, P.A.; Avrett, E.H.; Kurucz, R.L. Calculation of Solar Irradiances. I. Synthesis of the Solar Spectrum. Astrophys. J. 1999, 518, 480–499. [Google Scholar] [CrossRef]
- Thuillier, G.; Hersé, M.; Labs, D.; Foujols, T.; Peetermans, W.; Gillotay, D.; Simon, P.C.; Mandel, H. The Solar Spectral Irradiance from 200 to 2400 nm as Measured by the SOLSPEC Spectrometer from the Atlas and Eureca Missions. Solar Phys. 2003, 214, 1–22. [Google Scholar] [CrossRef]
- Chance, K.; Kurucz, R.L. An improved high-resolution solar reference spectrum for earth’s atmosphere measurements in the ultraviolet, visible, and near infrared. J. Quant. Spectrosc. Radiat. Transf. 2010, 111, 1289–1295. [Google Scholar] [CrossRef]
- Meftah, M.; Damé, L.; Bolsée, D.; Hauchecorne, A.; Pereira, N.; Sluse, D.; Cessateur, G.; Irbah, A.; Bureau, J.; Weber, M.; et al. SOLAR-ISS: A new reference spectrum based on SOLAR/SOLSPEC observations. Astron. Astrophys. 2018, 611, A1. [Google Scholar] [CrossRef]
- Coddington, O.M.; Richard, E.C.; Harber, D.; Pilewskie, P.; Woods, T.N.; Chance, K.; Liu, X.; Sun, K. The TSIS-1 Hybrid Solar Reference Spectrum. Geophys. Res. Lett. 2021, 48, e91709. [Google Scholar] [CrossRef]
- Gueymard, C.A. The sun’s total and spectral irradiance for solar energy applications and solar radiation models. Sol. Energy 2004, 76, 423–453. [Google Scholar] [CrossRef]
- Bhatt, R.; Doelling, D.R.; Coddington, O.; Scarino, B.; Gopalan, A.; Haney, C. Quantifying the Impact of Solar Spectra on the Inter-Calibration of Satellite Instruments. Remote Sens. 2021, 13, 1438. [Google Scholar] [CrossRef]
- Bolsee, D.; Pereira, N.; Decuyper, W.; Gillotay, D.; Yu, H.; Sperfeld, P.; Pape, S.; Cuevas, E.; Redondas, A.; Hernandez, Y. Accurate Determination of the TOA Solar Spectral NIR Irradiance Using a Primary Standard Source and Bouguer-Langley Technique. Sol. Phys. 2014, 289, 2433–2457. [Google Scholar] [CrossRef]
- Elsey, J.; Coleman, M.D.; Gardiner, T.; Shine, K.P. Can Measurements of the Near-Infrared Solar Spectral Irradiance be Reconciled? A New Ground-Based Assessment Between 4000 and 10,000 cm−1. Geophys. Res. Lett. 2017, 44, 10071–10080. [Google Scholar] [CrossRef]
- Pasternak, F.; Bernard, P.; Georges, L.; Pascal, V. The microcarb instrument. In Proceedings of the International Conference on Space Optics—ICSO 2016, Biarritz, France, 18–21 October 2016; Cugny, B., Karafolas, N., Sodnik, Z., Eds.; International Society for Optics and Photonics, SPIE: Bellingham, WA, USA, 2017; Volume 10562, p. 105621P. [Google Scholar] [CrossRef] [Green Version]
- Bréon, F.M. Monitoring the Carbon Cycle from Space. In Proceedings of the 40th COSPAR Scientific Assembly, Moscow, Russia, 2–10 August 2014; Volume 40, p. SIDL7-1-14. [Google Scholar]
- Bertaux, J.L.; Hauchecorne, A.; Lefèvre, F.; Bréon, F.M.; Blanot, L.; Jouglet, D.; Lafrique, P.; Akaev, P. The use of the 1.27 µm O2 absorption band for greenhouse gas monitoring from space and application to MicroCarb. Atmos. Meas. Tech. 2020, 13, 3329–3374. [Google Scholar] [CrossRef]
- Wu, K.; Palmer, P.I.; Wu, D.; Jouglet, D.; Feng, L.; Oda, T. Theoretical assessment of the ability of the MicroCarb satellite city-scan observing mode to estimate urban CO2 emissions. Atmos. Meas. Tech. 2023, 16, 581–602. [Google Scholar] [CrossRef]
- Shapiro, A.I.; Solanki, S.K.; Krivova, N.A.; Tagirov, R.V.; Schmutz, W.K. The role of the Fraunhofer lines in solar brightness variability. Astron. Astrophys. 2015, 581, A116. [Google Scholar] [CrossRef]
- Sukhodolov, T.; Rozanov, E.; Shapiro, A.I.; Anet, J.; Cagnazzo, C.; Peter, T.; Schmutz, W. Evaluation of the ECHAM family radiation codes performance in the representation of the solar signal. Geosci. Model Dev. 2014, 7, 2859–2866. [Google Scholar] [CrossRef] [Green Version]
- Sukhodolov, T.; Rozanov, E.; Ball, W.T.; Bais, A.; Tourpali, K.; Shapiro, A.I.; Telford, P.; Smyshlyaev, S.; Fomin, B.; Sander, R.; et al. Evaluation of simulated photolysis rates and their response to solar irradiance variability. J. Geophys. Res. 2016, 121, 6066–6084. [Google Scholar] [CrossRef] [Green Version]
- Shapiro, A.I.; Peter, H.; Solanki, S.K. Chapter 3—The Sun’s Atmospher. In The Sun as a Guide to Stellar Physics; Engvold, O., Vial, J.C., Skumanich, A., Eds.; Elsevier: Amsterdam, The Netherlands, 2019; pp. 59–85. [Google Scholar] [CrossRef]
- Borucki, W.J.; Koch, D.; Basri, G.; Batalha, N.; Brown, T.; Caldwell, D.; Caldwell, J.; Christensen-Dalsgaard, J.; Cochran, W.D.; DeVore, E.; et al. Kepler Planet-Detection Mission: Introduction and First Results. Science 2010, 327, 977–980. [Google Scholar] [CrossRef] [Green Version]
- Ricker, G.R.; Winn, J.N.; Vanderspek, R.; Latham, D.W.; Bakos, G.Á.; Bean, J.L.; Berta-Thompson, Z.K.; Brown, T.M.; Buchhave, L.; Butler, N.R.; et al. Transiting Exoplanet Survey Satellite (TESS). In Proceedings of the Space Telescopes and Instrumentation 2014: Optical, Infrared, and Millimeter Wave, Montreal, QC, Canada, 22–27 June 2014; SPIE: Bellingham, WA, USA, 2014; Volume 9143, p. 914320. [Google Scholar] [CrossRef] [Green Version]
- Sing, D.K. Stellar limb-darkening coefficients for CoRot and Kepler. Astron. Astrophys. 2010, 510, A21. [Google Scholar] [CrossRef] [Green Version]
- Claret, A.; Hauschildt, P.H.; Witte, S. New limb-darkening coefficients for Phoenix/1d model atmospheres. II. Calculations for 5000 K ≤ Teff≤ 10,000 K Kepler, CoRot, Spitzer, uvby, UBVRIJHK, Sloan, and 2MASS photometric systems. Astron. Astrophys. 2013, 552, A16. [Google Scholar] [CrossRef] [Green Version]
- Claret, A. Limb and Gravity-darkening Coefficients for the Space Mission CHEOPS. Res. Notes Am. Astron. Soc. 2021, 5, 13. [Google Scholar] [CrossRef]
- Kostogryz, N.M.; Witzke, V.; Shapiro, A.; Solanki, S.K.; Maxted, P.; Kurucz, R.; Gizon, L. Stellar limb darkening. I. A new MPS-ATLAS library for Kepler, TESS, CHEOPS, and PLATO passbands. Astron. Astrophys. 2022, 8, 14. [Google Scholar]
- Fontenla, J.M.; Curdt, W.; Haberreiter, M.; Harder, J.; Tian, H. Semiempirical Models of the Solar Atmosphere. III. Set of Non-LTE Models for Far-Ultraviolet/Extreme-Ultraviolet Irradiance Computation. Astrophys. J. 2009, 707, 482–502. [Google Scholar] [CrossRef] [Green Version]
- Fontenla, J.M.; Stancil, P.C.; Landi, E. Solar Spectral Irradiance, Solar Activity, and the Near-Ultra-Violet. Astrophys. J. 2015, 809, 157. [Google Scholar] [CrossRef] [Green Version]
- Shapiro, A.I.; Schmutz, W.; Schoell, M.; Haberreiter, M.; Rozanov, E. NLTE solar irradiance modeling with the COSI code. Astron. Astrophys. 2010, 517, A48. [Google Scholar] [CrossRef]
- Tagirov, R.V.; Shapiro, A.I.; Schmutz, W. NESSY: NLTE spectral synthesis code for solar and stellar atmospheres. Astron. Astrophys. 2017, 603, A27. [Google Scholar] [CrossRef] [Green Version]
- Witzke, V.; Shapiro, A.I.; Cernetic, M.; Tagirov, R.V.; Kostogryz, N.M.; Anusha, L.S.; Unruh, Y.C.; Solanki, S.K.; Kurucz, R.L. MPS-ATLAS: A fast all-in-one code for synthesising stellar spectra. Astron. Astrophys. 2021, 653, A65. [Google Scholar] [CrossRef]
- Kurucz, R. CD-ROM 13, ATLAS9 Stellar Atmosphere Programs and 2 km/s Grid; SAO: Cambridge, MA, USA, 1993. [Google Scholar]
- Husser, T.O.; Wende-von Berg, S.; Dreizler, S.; Homeier, D.; Reiners, A.; Barman, T.; Hauschildt, P.H. A new extensive library of PHOENIX stellar atmospheres and synthetic spectra. Astron. Astrophys. 2013, 553, A6. [Google Scholar] [CrossRef]
- Gröbner, J.; Kröger, I.; Egli, L.; Hülsen, G.; Riechelmann, S.; Sperfeld, P. The high-resolution extraterrestrial solar spectrum (QASUMEFTS) determined from ground-based solar irradiance measurements. Atmos. Meas. Tech. 2017, 10, 3375–3383. [Google Scholar] [CrossRef] [Green Version]
- Langley, S. The Bolometer and Radiant Energy; American Academy of Arts and Sciences: Cambridge, MA, USA, 1881. [Google Scholar]
- Toon, G.C. Solar Line List for the TCCON 2014 Data Release; California Institute of Technology: Pasadena, CA, USA, 2015. [Google Scholar] [CrossRef]
- Schöll, M.; Dudok de Wit, T.; Kretzschmar, M.; Haberreiter, M. Making of a solar spectral irradiance dataset I: Observations, uncertainties, and methods. J. Space Weather Space Clim. 2016, 6, A14. [Google Scholar] [CrossRef] [Green Version]
- Meftah, M.; Hochedez, J.F.; Irbah, A.; Hauchecorne, A.; Boumier, P.; Corbard, T.; Turck-Chièze, S.; Abbaki, S.; Assus, P.; Bertran, E.; et al. Picard SODISM, a Space Telescope to Study the Sun from the Middle Ultraviolet to the Near Infrared. Solar Phys. 2014, 289, 1043–1076. [Google Scholar] [CrossRef] [Green Version]
- Meftah, M.; Hauchecorne, A.; Irbah, A.; Cessateur, G.; Bekki, S.; Damé, L.; Bolsée, D.; Pereira, N. Solar Spectral Irradiance at 782 nm as Measured by the SES Sensor Onboard Picard. Solar Phys. 2016, 291, 1043–1057. [Google Scholar] [CrossRef] [Green Version]
- Witzke, V.; Duehnen, H.; Shapiro, A.; Przybylski, D.; Bhatia, T.; Cameron, R.; Solanki, S. Small-scale Dynamo in Cool Stars. II. The effect of metallicity. Astron. Astrophys. 2023, 669, A157. [Google Scholar] [CrossRef]
- Cernetic, M.; Shapiro, A.I.; Witzke, V.; Krivova, N.A.; Solanki, S.K.; Tagirov, R.V. Opacity distribution functions for stellar spectra synthesis. Astron. Astrophys. 2019, 627, A157. [Google Scholar] [CrossRef] [Green Version]
- Kurucz, R.L. ATLAS12, SYNTHE, ATLAS9, WIDTH9, et cetera. Mem. Della Soc. Astron. Ital. Suppl. 2005, 8, 14. [Google Scholar]
- Yelles Chaouche, L.; Cameron, R.H.; Solanki, S.K.; Riethmüller, T.L.; Anusha, L.S.; Witzke, V.; Shapiro, A.I.; Barthol, P.; Gandorfer, A.; Gizon, L.; et al. Power spectrum of turbulent convection in the solar photosphere. Astron. Astrophys. 2020, 644, A44. [Google Scholar] [CrossRef]
- Anusha, L.S.; Shapiro, A.I.; Witzke, V.; Cernetic, M.; Solanki, S.K.; Gizon, L. Radiative Transfer with Opacity Distribution Functions: Application to Narrowband Filters. Astrophys. J. Suppl. Ser. 2021, 255, 3. [Google Scholar] [CrossRef]
- Vögler, A.; Shelyag, S.; Schüssler, M.; Cattaneo, F.; Emonet, T.; Linde, T. Simulations of magneto-convection in the solar photosphere. Equations, methods, and results of the MURaM code. Astron. Astrophys. 2005, 429, 335–351. [Google Scholar] [CrossRef] [Green Version]
- Kurucz, R.L. Including all the lines. Can. J. Phys. 2011, 89, 417–428. [Google Scholar] [CrossRef]
- Ryabchikova, T.; Piskunov, N.; Kurucz, R.L.; Stempels, H.C.; Heiter, U.; Pakhomov, Y.; Barklem, P.S. A major upgrade of the VALD database. JPhysica Scr. 2015, 90, 054005. [Google Scholar] [CrossRef]
- Meftah, M.; Sarkissian, A.; Reberac, A. SOLAR-HRS: The HRS High-Resolution Extraterrestrial Solar Reference Spectra for Disk-Integrated, Disk-Center, and Intermediate Cases; LATMOS: Paris, France, 2022. [Google Scholar] [CrossRef]
- Kuze, A.; Suto, H.; Nakajima, M.; Hamazaki, T. Thermal and near infrared sensor for carbon observation Fourier-transform spectrometer on the Greenhouse Gases Observing Satellite for greenhouse gases monitoring. Appl. Opt. 2009, 48, 6716–6733. [Google Scholar] [CrossRef]
- Uitenbroek, H. Multilevel Radiative Transfer with Partial Frequency Redistribution. Astrophys. J. 2001, 557, 389–398. [Google Scholar] [CrossRef]
- Meftah, M.; Damé, L.; Keckhut, P.; Bekki, S.; Sarkissian, A.; Hauchecorne, A.; Bertran, E.; Carta, J.P.; Rogers, D.; Abbaki, S.; et al. UVSQ-SAT, a Pathfinder CubeSat Mission for Observing Essential Climate Variables. Remote Sens. 2019, 12, 92. [Google Scholar] [CrossRef] [Green Version]
- Meftah, M.; Boust, F.; Keckhut, P.; Sarkissian, A.; Boutéraon, T.; Bekki, S.; Damé, L.; Galopeau, P.; Hauchecorne, A.; Dufour, C.; et al. INSPIRE-SAT 7, a Second CubeSat to Measure the Earth’s Energy Budget and to Probe the Ionosphere. Remote Sens. 2022, 14, 186. [Google Scholar] [CrossRef]
Figure 1.
Disk-integrated solar spectra at one astronomical unit (SOLAR-HRS extraterrestrial spectrum, SOLAR-HRS at air mass 1.5) from a few nm to 4.4 m wavelengths, and absorption bands of atmospheric gases.
Figure 1.
Disk-integrated solar spectra at one astronomical unit (SOLAR-HRS extraterrestrial spectrum, SOLAR-HRS at air mass 1.5) from a few nm to 4.4 m wavelengths, and absorption bands of atmospheric gases.

Figure 2.
Disk-center solar spectra at one astronomical unit (SOLAR-HRS extraterrestrial spectrum, MPS-ATLAS spectra with Kurucz and Vald3 solar linelists).
Figure 2.
Disk-center solar spectra at one astronomical unit (SOLAR-HRS extraterrestrial spectrum, MPS-ATLAS spectra with Kurucz and Vald3 solar linelists).

Figure 3.
SOLAR-HRS and SOLAR-ISS disk-integrated spectra from 300 to 3000 nm.

Figure 4.
(left) SOLAR-HRS disk-integrated spectra from 300 to 3000 nm (high resolution and 1 nm spectral resolution using Gaussian convolution filters). (right) Comparisons between the SOLAR-HRS and the TSIS-1 HSRS and MPS-ATLAS (Kurucz and Vald3 linelists) spectra.
Figure 4.
(left) SOLAR-HRS disk-integrated spectra from 300 to 3000 nm (high resolution and 1 nm spectral resolution using Gaussian convolution filters). (right) Comparisons between the SOLAR-HRS and the TSIS-1 HSRS and MPS-ATLAS (Kurucz and Vald3 linelists) spectra.

Figure 5.
Disk-integrated SSI for SOLAR-HRS, TSIS-1 HSRS, and MPS-ATLAS—B1 band.

Figure 6.
Disk-integrated SSI for SOLAR-HRS, TSIS-1 HSRS, and MPS-ATLAS—B2 band.

Figure 7.
Disk-integrated SSI for SOLAR-HRS, TSIS-1 HSRS, and MPS-ATLAS—B3 band.

Figure 8.
Disk-integrated SSI for SOLAR-HRS, TSIS-1 HSRS, and MPS-ATLAS—B4 band.

Figure 9.
Disk-center ( = 1.0) SSI for SOLAR-HRS and MPS-ATLAS—B1, B2, B3, and B4 bands.

Figure 10.
Disk-integrated (left) and disk-center (right) spectra for SOLAR-HRS, MPS-ATLAS, and BASS2000 in the 655.4–657.2 nm wavelength range. The well-known H-alpha band (656.46 nm in vacuum) used for observing surface detail, hot spots, and prominences is in this wavelength range.
Figure 10.
Disk-integrated (left) and disk-center (right) spectra for SOLAR-HRS, MPS-ATLAS, and BASS2000 in the 655.4–657.2 nm wavelength range. The well-known H-alpha band (656.46 nm in vacuum) used for observing surface detail, hot spots, and prominences is in this wavelength range.


Table 1.
Main characteristics of the four narrow MicroCarb bands (B1, B2, B3, and B4). The MicroCarb satellite acquires spectra in lines characteristic of CO (at 1.6 and 2.0 m) and O (at 0.76 and 1.27 m). The absorption of specific wavelengths of sunlight in the Earth’s atmosphere is used to identify and quantify the concentrations of selected greenhouse gases (GHGs).
| Parameter | B1 | B2 | B3 | B4 |
|---|---|---|---|---|
| (nm) | 758.281 | 1596.772 | 2023.018 | 1264.630 |
| (nm) | 763.500 | 1607.900 | 2037.100 | 1273.400 |
| (nm) | 768.817 | 1618.946 | 2051.116 | 1282.191 |
| FWHM (nm) | 0.02966200 | 0.06226379 | 0.07900023 | 0.04932027 |
| Sampling (nm) | 0.01033519 | 0.02169470 | 0.02752621 | 0.01724485 |
| Atmospheric gas | O | CO | CO | O |
Table 2.
Scientific requirements for SOLAR-HRS disk-integrated spectrum and MicroCarb bands.
| Parameter | SOLAR-HRS | B1, B2, B3, and B4 |
|---|---|---|
| Wavelength range (nm) | 0.5–4400 | 763.5, 1607.9, 2037.1, and 1273.4 |
| Sampling resolution (nm) | <0.1 | <0.004 |
| Spectral resolution (nm) | <0.1 | 0.004 |
| Absolute uncertainty (%) | <2 | 1 |
| Central line position (nm) | <10 | 10 |
| Fraunhofer line shape (%) | <1 | 0.1 |
Table 3.
List of SOLAR-HRS and MPS-ATLAS spectra. All solar spectra are given at one astronomical unit.
Table 3.
List of SOLAR-HRS and MPS-ATLAS spectra. All solar spectra are given at one astronomical unit.
| Dataset Name | Data Type | Wavelength Coverage | Spectral Resolution | Sampling |
|---|---|---|---|---|
| SOLAR-HRS Disk-integrated spectrum | Composite Solar spectral irradiance | 0.5–4399.1 nm | SOLAR-ISS (<300 nm): <1.0 nm QASUMEFTS (300–380 nm): <0.025 nm SPTS (>380 nm): <0.01 nm | <0.02 nm |
| SOLAR-HRS Disk-center ( = 1.0) | Composite Solar spectral irradiance | 650.0–4399.1 nm | SPTS: <0.01 nm | <0.02 nm |
| SOLAR-HRS Intermediate cases Solar positions = 1.0, 0.9, 0.8, 0.7, 0.6, 0.5, 0.4, 0.3, 0.2, 0.1, 0.05 | Composite Solar spectral irradiance | 650.0–4399.1 nm | SPTS: <0.01 nm | <0.02 nm |
| SOLAR-HRS AM1.5 Disk-integrated spectrum | Composite Solar spectral irradiance | 0.5–4399.1 nm | SOLAR-ISS (<300 nm): <0.1 nm QASUMEFTS (300–380 nm): <0.025 nm SPTS (>380 nm): <0.01 nm | <0.02 nm |
| SOLAR-HRS AM1.5 (air) Disk-integrated spectrum | Composite Solar spectral irradiance | 0.5–4399.1 nm | SOLAR-ISS (<300 nm): <0.1 nm QASUMEFTS (300–380 nm): <0.025 nm SPTS (>380 nm): <0.01 nm | <0.02 nm |
| MPS-ATLAS-Kurucz Disk-integrated spectrum | Solar model | 250.0–5000.0 nm | <0.01 nm | <0.01 nm |
| MPS-ATLAS-Kurucz Disk-center ( = 1.0) | Solar model | 250.0–5000.0 nm | <0.01 nm | <0.01 nm |
| MPS-ATLAS-Vald3 Disk-integrated spectrum | Solar model | 250.0–5000.0 nm | <0.01 nm | <0.01 nm |
| MPS-ATLAS-Vald3 Disk-center ( = 1.0) | Solar model | 250.0–5000.0 nm | <0.01 nm | <0.01 nm |
Table 4.
Current status of the SOLAR-HRS disk-integrated spectrum in the MicroCarb bands.
| Parameter | B1, B2, B3 and B4 | Current Status |
|---|---|---|
| Sampling resolution (nm) | <0.004 | OK |
| Spectral resolution (nm) | 0.004 | OK |
| Absolute uncertainty (%) | 1 | NOK ⟹ 1.94% for B2 |
| Central line position (nm) | 10 | Difficult to assess |
| Fraunhofer line shape (%) | 0.1 | NOK ⟹ 0.5% for all bands |
Disclaimer/Publisher’s Note: The statements, opinions and data contained in all publications are solely those of the individual author(s) and contributor(s) and not of MDPI and/or the editor(s). MDPI and/or the editor(s) disclaim responsibility for any injury to people or property resulting from any ideas, methods, instructions or products referred to in the content. |
© 2023 by the authors. Licensee MDPI, Basel, Switzerland. This article is an open access article distributed under the terms and conditions of the Creative Commons Attribution (CC BY) license (https://creativecommons.org/licenses/by/4.0/).
Share and Cite
MDPI and ACS Style
Meftah, M.; Sarkissian, A.; Keckhut, P.; Hauchecorne, A. The SOLAR-HRS New High-Resolution Solar Spectra for Disk-Integrated, Disk-Center, and Intermediate Cases. Remote Sens. 2023, 15, 3560. https://doi.org/10.3390/rs15143560
AMA Style
Meftah M, Sarkissian A, Keckhut P, Hauchecorne A. The SOLAR-HRS New High-Resolution Solar Spectra for Disk-Integrated, Disk-Center, and Intermediate Cases. Remote Sensing. 2023; 15(14):3560. https://doi.org/10.3390/rs15143560
Chicago/Turabian StyleMeftah, Mustapha, Alain Sarkissian, Philippe Keckhut, and Alain Hauchecorne. 2023. "The SOLAR-HRS New High-Resolution Solar Spectra for Disk-Integrated, Disk-Center, and Intermediate Cases" Remote Sensing 15, no. 14: 3560. https://doi.org/10.3390/rs15143560
Note that from the first issue of 2016, this journal uses article numbers instead of page numbers. See further details here.