Article

Influences of Ecological Restoration Programs on Ecosystem Services in Sandy Areas, Northern China

1
State Key Laboratory of Desert and Oasis Ecology, Xinjiang Institute of Ecology and Geography, Chinese Academy of Sciences, Urumqi 830011, China
2
Research Centre for Ecology and Environment of CA, Chinese Academy of Sciences, Urumqi 830011, China
3
College of Grassland Science, Shanxi Agriculture University, Jinzhong 030801, China
4
School of Geographic Sciences, Xinyang Normal University, Xinyang 464000, China
5
College of Geography and Remote Sensing Sciences, Xinjiang University, Urumqi 830046, China
6
College of Geographic Science and Tourism, Xinjiang Normal University, Urumqi 830054, China
7
Xinjiang Laboratory of Lake Environment and Resources in Arid Zone, Urumqi 830054, China
*
Author to whom correspondence should be addressed.
Remote Sens. 2023, 15(14), 3519; https://doi.org/10.3390/rs15143519
Submission received: 19 May 2023 / Revised: 8 July 2023 / Accepted: 11 July 2023 / Published: 12 July 2023
(This article belongs to the Special Issue Integrating Earth Observations into Ecosystem Service Models)

Abstract

:
Ecosystem services (ESs) are important for supporting human development. However, a changing climate and anthropogenic impacts are resulting in the degradation of dryland ecosystems to varying degrees. While there has been the global implementation of Ecological Restoration Programs (ERPs) to restore degraded ecosystems, there remains limited comprehensive assessment of their impacts on ESs of drylands. In this study, the sandy areas of northern China were used as the study area. The RUSLE, RWEQ, CASA, and InVEST models were used to simulate four major ESs: soil conservation (SC), sand fixation (SF), carbon sequestration (CS), and water yield (WY). The study aimed to evaluate the influences of various ERPs on major ESs. The dominant factors affecting the overall benefits provided by ESs were also identified. Since ERPs were implemented, forest areas have increased by 2.8 × 10⁴ km2, whereas the areas of cropland, shrubland, and grassland have decreased. There were generally increasing trends in SF, SC, and CS, whereas there was a decreasing trend in WY. We then used a scenario-based simulation approach to eliminate the influence of climate variability on ESs. The results showed increasing trends in SF, SC, and CS, whereas there were minimal changes in WY. The results suggested that although ERPs can significantly increase regional ESs, unregulated expansion in vegetation can result in a water crisis and affect regional water security.

1. Introduction

The various services presented by natural ecosystems that are beneficial to human development are known as ecosystem services (ESs) [1,2]. The United Nations (UN) initiated the Millennium Ecosystem Assessment in 2001, established the first system for the integrated assessment of ESs, and provided a detailed characterization of the connections between ecosystems, their services, and global-scale human welfare [3]. Several subsequent studies have emphasized that while human societies continue to be dependent on services provided by natural ecosystems, growth in human populations and urbanization are placing increasing pressure on ecosystems [4,5], with different ESs being affected to varying degrees [6,7]. The changing climate has been identified as an additional pressure on global ESs [8,9,10]. The collective effects of a changing climate and anthropogenic activities represent a significant hindrance to the UN’s Sustainable Development Goals (SDGs) related to the protection of terrestrial ecosystems and achieving human food security [11].
Most existing assessments of ESs within the context of the SDGs focused on alleviating the impacts of climate change and the degradation of land [12,13,14]. Dryland ecosystems supply a variety of typical ES functions, including sand fixation (SF) and soil conservation (SC) [15,16]. The assessment of ESs of dryland ecosystems has been neglected due to their sparse vegetation and low human populations, which has in turn contributed to significant variability in outcomes of existing assessments. However, a changing climate and intensifying anthropogenic activities are posing increasing threats to drylands, including frequent dust storms [17], the dramatic shrinkage of some terminal lakes [18], and increased land desertification [19]. These challenges can result in significant impacts on the health of human populations; the unsustainable use of water resources, which reduce economic and social development; and a decline in regional ESs. Therefore, there is an urgent need for further quantitative evaluations of dryland ESs.
Various ERPs have been put in place globally to address the deterioration of dryland ecosystems. These include several ERPs in the Mediterranean region [20] and on the Colorado Plateau [21]. The impacts of unsustainable cultivation, overgrazing, unsustainable forestry, and over-exploitation of groundwater [22,23,24] have resulted in severe land degradation in almost all regions of northern China between 1950 and 2000 [25]. The Chinese government attempted to address this situation by proposing several ambitious ecological restoration programs (ERPs) in the 1980s, which aimed to protect the ecological environment and halt desertification [26,27]. These ERPs contain the Three Northern Protected Forest Restoration Project (“Great Green Wall Project”) and the Grain for Green and Soil and Water Conservation programs, which have achieved remarkable results, including an increase in green areas of 66.07 million hectares in the northern region by 2015 [28]. The expansion of vegetation resulting from the ERPs has contributed significantly to global vegetation greening [29]. Comprehensive ESs assessments to identify the dominant factors contributing to significant increases in ESs under the implementation of ERPs remain limited.
Currently, there are studies focusing on the effectiveness of ecological engineering (EE) and its impact on ESs. Li, et al. [30] investigated the influence of EE on ESs in the Loess Plateau. Jiang, et al. [31] quantified the changes in ESs in the Beijing–Tianjin sandstorm source region following the implementation of ERPs. However, previous studies evaluating the effectiveness of ecological engineering (EE) in northern China mainly focused on the response of a single ES, such as SC, SF, WY, carbon sequestration (CS) to ERPs. For instance, Xie, et al. [32] assessed the reaction of the SC capacity of vegetation to a changing climate and anthropogenic activities; Du, et al. [33] used the RWEQ (Revised Wind Erosion Equation) to evaluate the impacts of EE on soil wind erosion (SL) in North China. Most previous studies on SC services have concentrated on soil water erosion (SE) in the Loess Plateau, whereas there has been less attention on other regions, such as the Tianshan Mountains [34,35,36]. In addition, there have been limited comprehensive evaluations of the impacts of EE on multiple ESs in northern China, which has a limited understanding of ERPs in arid regions.
The current research has an objective to evaluate the impacts of various ERPs on major ESs of dryland ecosystems, focusing on the Three Northern Protected Forest Restoration Project in North China as a research region. The goal of the current research will (1) analyze land use and cover change (LUCC) in North China after the implementation of the ERPs; (2) assess the spatiotemporal variability of four ESs—SC, SF, CS, and WY—in the eco-engineering area; and (3) isolate the effects of eco-engineering on ESs and the underlying mechanisms within the context of climate. This study focuses on exploring the impacts of ERPs implementation on regional ESs. It aims to deepen our understanding of ecological engineering practices and potentially provide scientific foundations for future engineering projects.

2. Materials and Methods
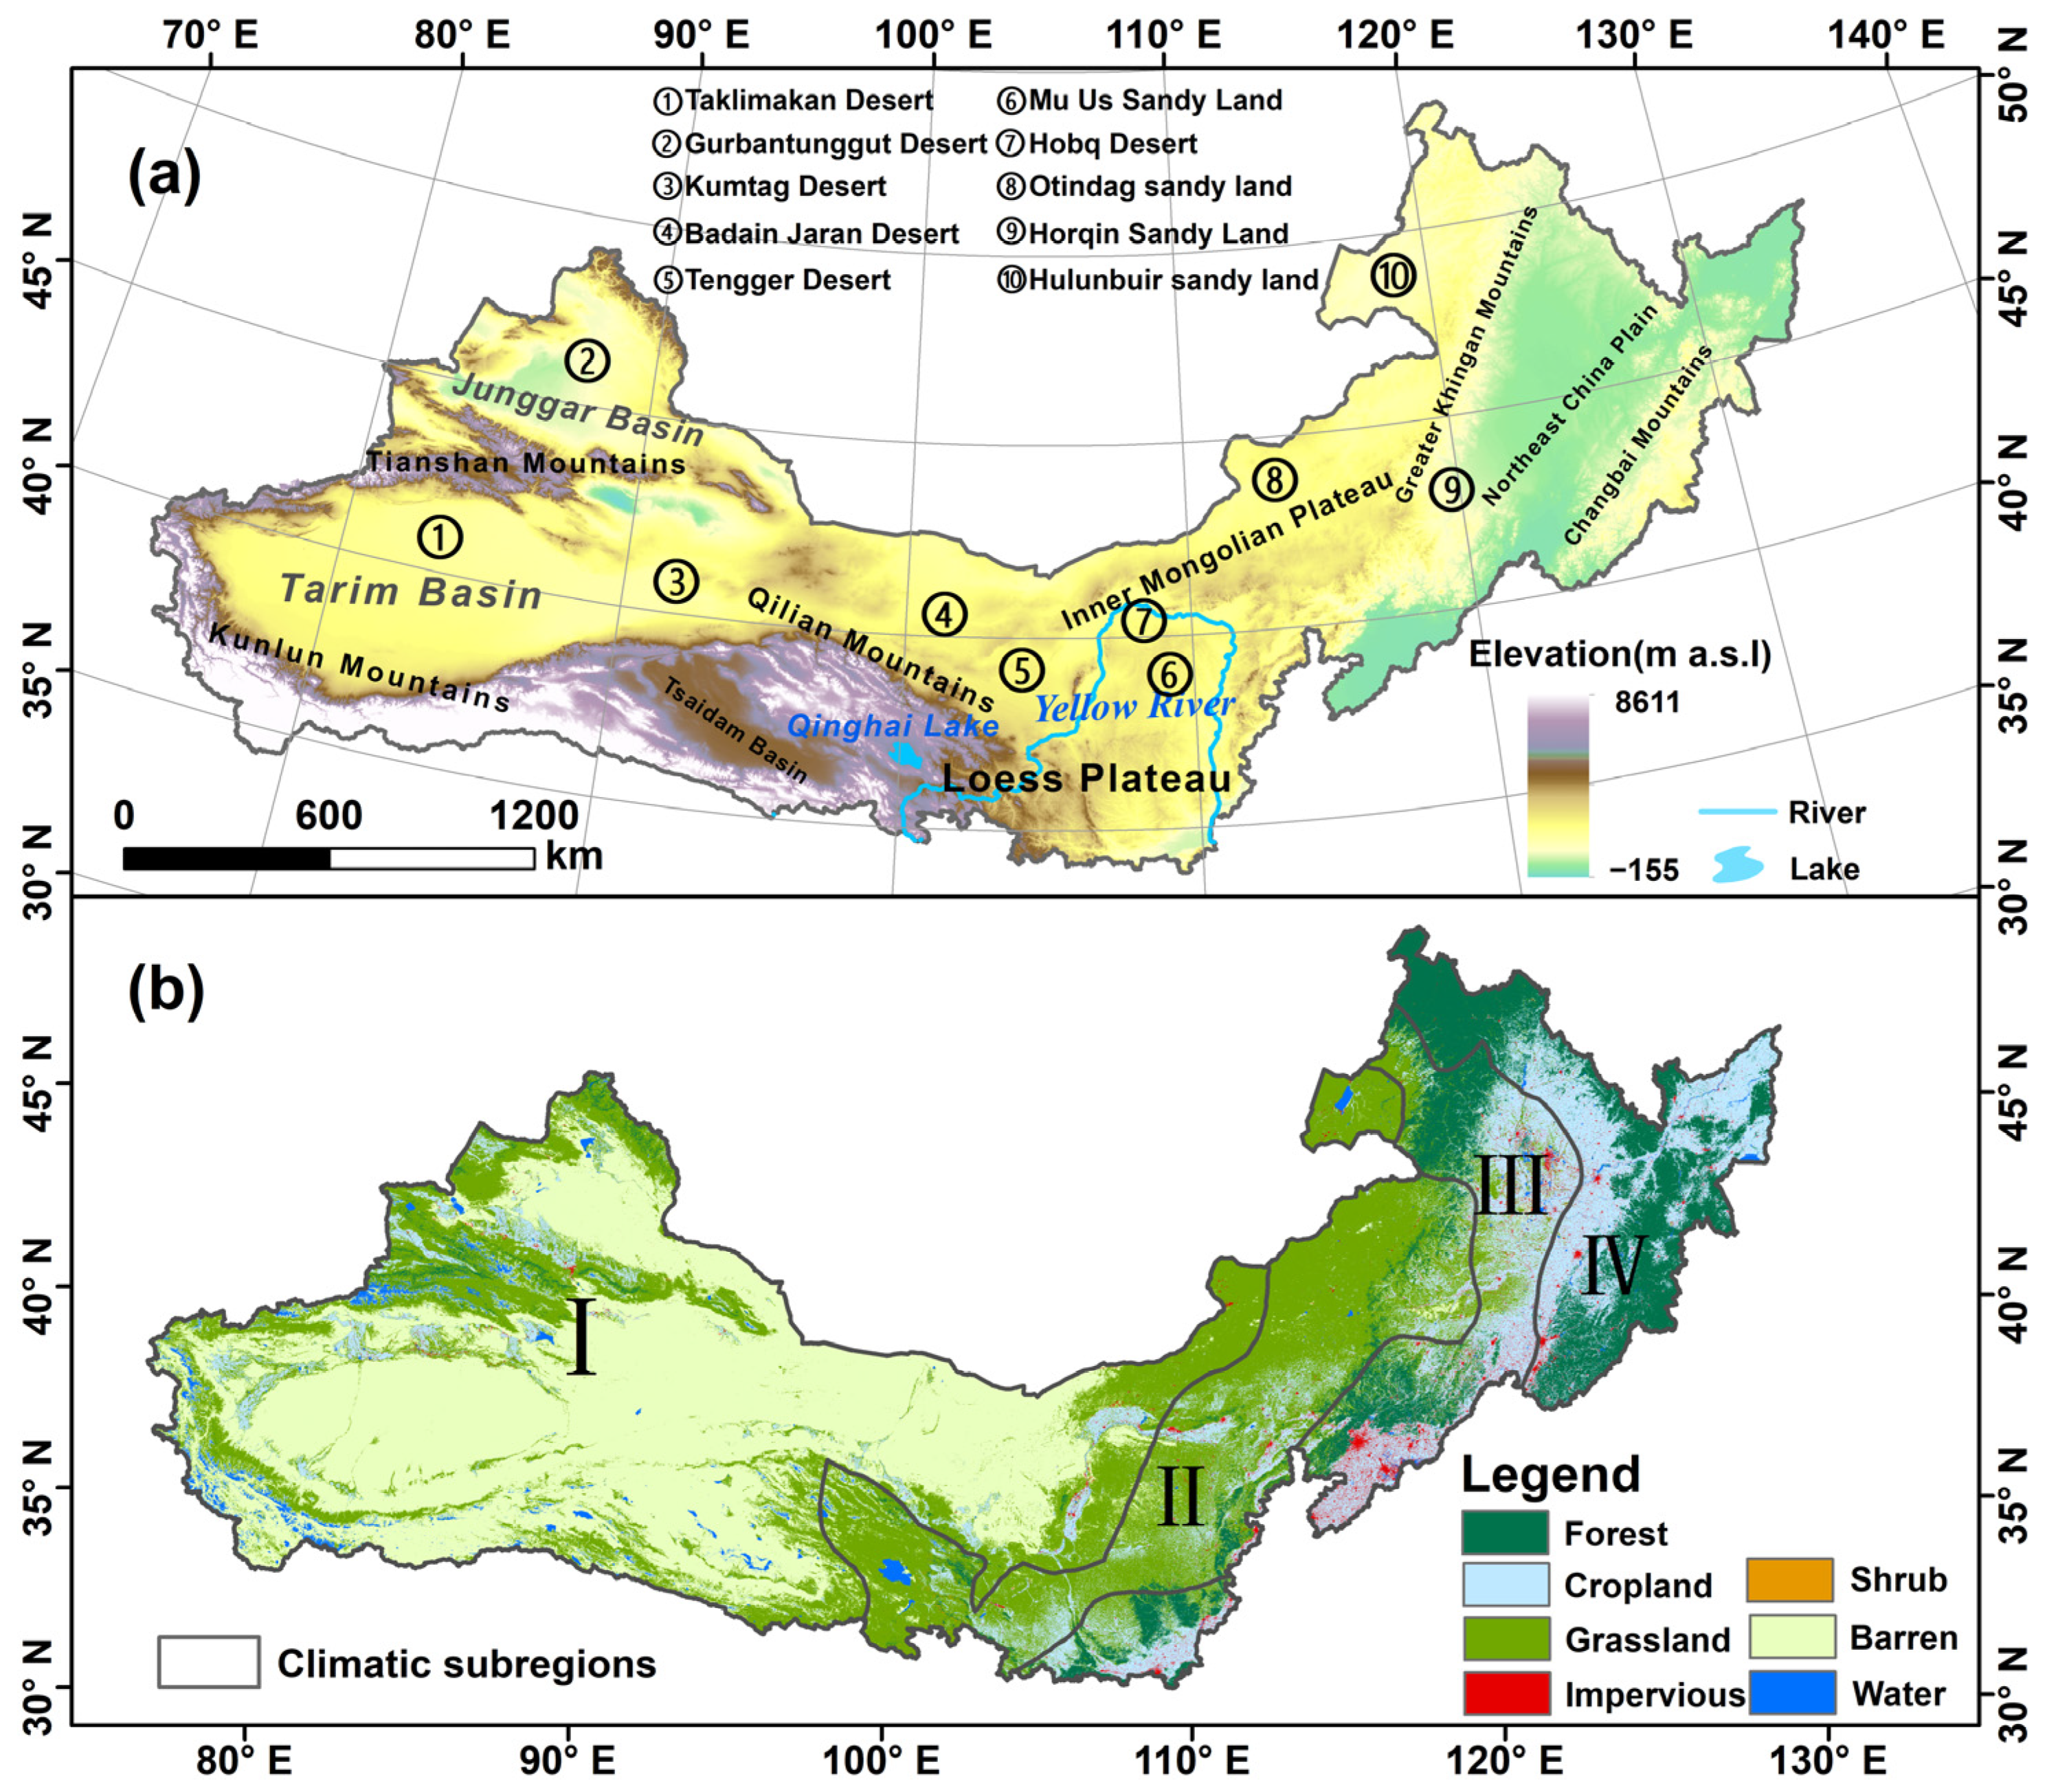
2.1. Study Area

The current research focused on the area of execution of the Three Northern Protected Forests Program (TNR) in northern China, in which several ERPs have been put into operation over the past 40 years [37]. The TNR program is scheduled to be completed by 2050, and consists of three phases. Currently, two phases have been completed, and the third phase is currently in progress. The main objective of the initial phase is to prevent land desertification and control soil erosion through the establishment of extensive forested areas. The main objective of the third phase is to address the problems identified during the earlier phases of the engineering works (such as over-exploitation of groundwater, ageing of existing trees beyond their physiological stage, and inappropriate planning of the scope of works) and to further promote the establishment of protective forests based on these improvements. The study area extends from 73°26′–135°5′N, 33°50′–53°19′E and falls mainly within north-central, northeastern, and northwestern China. The implementation area of the TNR constitutes ±46% of the total area of China (±4.5 million km2). The altitude varies between −155 and 8600 m above sea level (abs) and has a terrain that decreases from west to east (Figure 1a). Deserts in the TNR cover an area of ±1 million km2, encompassing 84% of the desert area in China [38]. Although the large section of the area covered by the TNR is severely impacted by wind erosion [39], soil water erosion is more severe than wind erosion in some regions, such as the Tianshan Mountains, the Loess Plateau, and the Greater Khingan Mountains [40,41,42].
The TNR has a variable climate, with temperate provisions in the northwest and temperate monsoon provisions in the northeast and north-central regions. The Chinese Academy of Sciences climate zoning scheme divided the TNR into humid, semi-humid, semi-arid, and arid areas from east to west (Figure 1b). Precipitation in the region reduces gradually from east to west and south to north. The mean yearly temperature in most areas fluctuates between 3 °C and 9 °C and the region has an average yearly wind velocity between 2 and 5 m/s. The atmospheric circulation and topography of the TNR result in maximum wind speeds of up to 15–20 m/s in some areas [43]. The main type of vegetation in the western part of the TNR is grassland, whereas forest and agricultural land dominate the eastern part. The dominant types of the earth in the research region from west to east are brown soil, aeolian sandy soil, and black soil.

2.2. Data Sources

2.2.1. Climate Dataset

The climate dataset employed in the present research included precipitation, temperature, wind velocity, total solar radiation, the depth of snow, soil moisture, and potential evapotranspiration data. There were insufficient measured meteorological station data for a large-scale integrated assessment since the majority of the study area comprises semi-arid and arid regions with few meteorological stations. Therefore, the present study used temperature, precipitation, wind speed, soil moisture, and total solar radiation datasets from the ERA5 land meteorological reanalysis dataset. Unlike meteorological station data, ERA5 data are produced using numerical weather models and data assimilation techniques that effectively overcome the sparsity problem of ground observations [44]. The ERA5 data are considered to be among the most accurate meteorological re-analysis data globally [45,46] and were widely applied in climate change studies in North China [47,48,49]. The present research uses the long-term daily snow depth data for China [50] and GLEAM v3.6 potential evaporation dataset [51,52]. Table 1 provides more details of the meteorological dataset employed in the present research. All meteorological datasets used were resampled to 1 km.

2.2.2. Vegetation Data

Two datasets of Normalized Difference Vegetation Index (NDVI) were utilized to represent the vegetation dynamics of the surface: (1) the GIMMS-NDVI3g dataset for 1982–2000 produced by the AVHRR sensor with temporal and spatial resolutions of 15 d and 1/12-degree lat./lon. grid, respectively; and (2) the MOD13A2 product for 2001–2020 given by the Moderate-resolution Imaging Spectroradiometer (MODIS) V.6, having temporal and spatial resolutions of 16 d and 1 km, respectively. These two NDVI datasets are applied differently due to their differences in sensors, spectral characteristics, and resolutions [53]. Therefore, the current study constructed a statistical regression model using data from the same period for both NDVI products, corrected for both products, following which the GIMMS NDVI products were resampled to 1 km.

2.2.3. Other Dataset
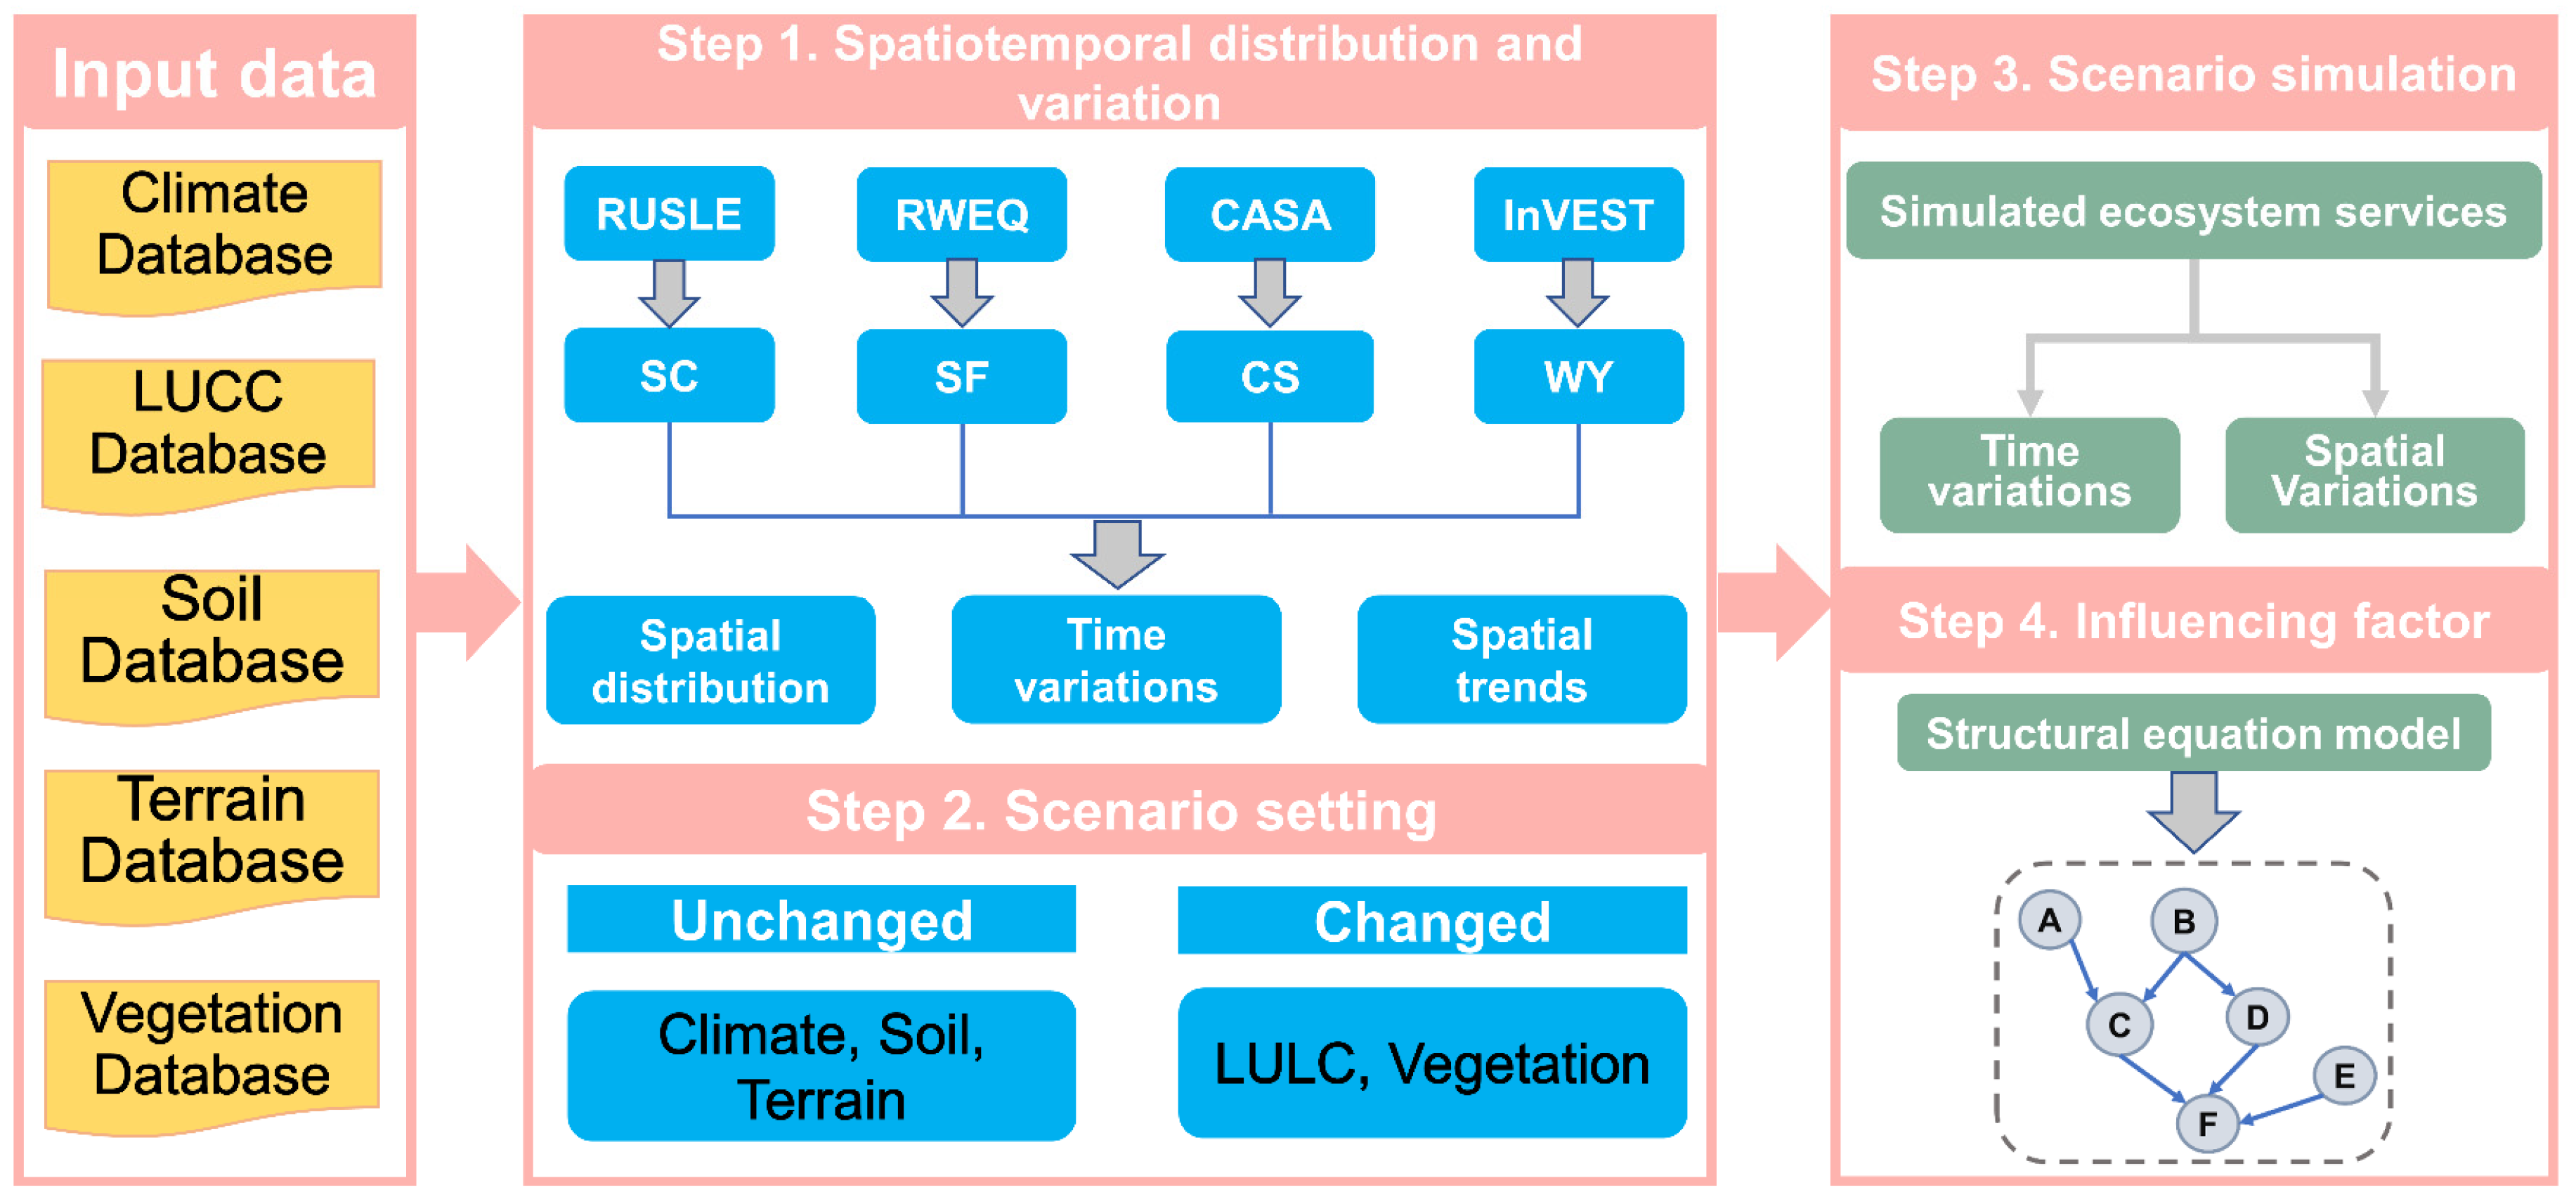
The present study used the dataset of the land cover produced from the Annual China Land Cover (CLCD) based on the LANDSAT series of remote sensing imagery and provides annual land cover dynamics at a 30 m spatial resolution covering 1990–2020. This product’s accuracy (average overall accuracy of 79.30 ± 1.99%) exceeds those of ESACCI_LC, MCD12Q1, GlobeLand30, and FROM_GLC, details of which can be found in Yang and Huang [54]. Resampling based on the 1 km spatial resolution of datasets was conducted.
Data for terrain (elevation, slope, and slope length) were provided by NASA’s ASTER GDEM V3 product with a 30 m spatial resolution. The Harmonized World Soil Database (HWSD) V1.2 provided a 1 km spatial resolution of the soil data.

2.3. Method

2.3.1. Soil Conservation (SC) Approach

The present study applied the RUSLE (Revised Universal Soil Loss Equation) to simulate SE and SC functions between 1982 and 2020 [55]. Ma et al. [56] conducted a meta-analysis and found that the RUSLE showed the best performance for estimating regional SE when compared to other models. The RUSLE has been widely used for studies of ES functions and regional soil erosion [57,58]. The structure of the RUSLE can be expressed as:
S E = R × K × L S × C × P
SC = R × K × L S × 1 C × P
where SE represents soil erosion (t km−2 yr−1), SC denotes soil conservation (t km−2 yr−1), R represents the erosion caused by rainfall–runoff, K denotes the factor of soil erosion, LS denotes the factor of topography, C represents the factor of cover management, and P denotes the factor of support routine. Table S1 provides the formulae for each factor.

2.3.2. Sand Fixation (SF) Approach

The RWEQ was originally used to estimate field-scale wind-induced soil erosion. However, further refinement of the model has allowed its extended application for simulating regional-scale SL [59,60], and the RWEQ was applied in different regions around the globe [17,61,62]. Therefore, the present study applied the RWEQ to simulate SF from 1982 to 2020. The structure of the RWEQ model can be expressed as:
S F = S L s S L
S L = 2 z S 2 Q m a x e z s 2
Q m a x = μ q W F · E F · S C F · K · C O G
S = μ s a W F · E F · S C F · K · C O G μ s b
where SLs is soil loss due to erosion caused by winds when the provisions of bare soil exist; SL denotes actual loss of the soil when the provisions of vegetation exist (t km−2 yr−1); SF represents sand fixation (t km−2 yr−1); Qmax represents the capacity of the highest transport; S denotes the length of the critical field; z denotes the length to the edge of the upwind field (m); and WF, EF, SCF, K′, and COG represents the influences of climate, soil, and vegetation on SL, respectively. The parameters μ q , μ s a , μ s b refer to Du, Liu, Jia, Li and Fan [33]. Table S2 describes the principle and calculation formulae used in this equation.

2.3.3. Carbon Sequestration (CS) Model

NPP (Net Primary Production) represents the rate of organic carbon retained by vegetation through photosynthesis. NPP can therefore be used to characterize the capacity of vegetation for carbon sequestration [63]. The foundation of the CASA (Carnegie–Ames–Stanford Approach) is a theory of efficacy f light use, which states that the carbon quantity caught by vegetation using photosynthesis has been determined by PAR (photosynthetically active radiation), the highest efficiency of light utilization of the vegetation, and the degree to which environmental stress limits the efficiency of use [64]. The CASA model has been shown to have good accuracy in estimating vegetation NPP in different regions [65]. Therefore, the vegetation’s annual NPP is simulated by the CASA model in the current study, which covers 1982 to 2020. The structure of the CASA is:
N P P x , t = A P A R x , t × ε x , t
where NPP is net primary production (gC m−2 yr−1), APAR represents actual PAR absorbed by the vegetation, and ε denotes the efficiency of light utilization of the vegetation. Table S3 lists the principles and formulae for APAR and ε .

2.3.4. Water Yield (WY) Approach

The present study calculated WY from 1990 to 2020 by applying the Annual Water Yield method of the InVEST model [66]. This methodology utilizes the principle of water balance, in which WY has been determined by the water supply (precipitation)–water consumption (evaporation) balance:
W Y x = 1 E T x P x × P x
where WY is water yield (mm), p represents precipitation (mm), and ET denotes evaporation (mm). The model uses the Budyko framework to calculate evapotranspiration [67], with Table S4 detailing the principles and equations.

2.3.5. Overall Benefit of Ecosystem Services (ESs)

The overall benefit of ESs can act as an indicator of the overall quality of multiple ESs. The impacts of ERPs on ESs were comprehensively assessed by calculating the overall benefit (OB) of ESs. Since there are differences in numerical magnitude among different ESs and these differences cannot be directly compared, the present study first standardized each ES, following which processed values were summed to calculate the OB for ESs as follows:
E S b z = E S i E S m i n E S m a x E S m i n
O B = 1 n i = 1 n E S b z
where ESbz denotes the normalized ES score; ESi represents the functional score of the ith ES; ESmax and ESmin are the highest and smallest scores of the ith ES, respectively; and OB represents the combined benefit of the n ES.

2.3.6. Shannon’s Diversity Index (SHDI)

The present study assessed the heterogeneity of the region’s land use by calculating the Shannon’s Diversity Index (SHDI) in Fragastats 4.2 software. The index is sensitive to the balanced distribution of each kind of land use/land cover (LULC) in the region, with the land use fragmentation in the region being positively correlated with SHDI [68]:
S H D I = i = 1 n P i ln P i
where Pi characterizes the fraction of category i LULC types over the whole area and n represents the whole number of types of LULC in the area.

2.3.7. Screening the Impact of ERPs on Ecosystem Services (ESs)

Human impacts on ESs occur mainly through alterations in LULC and vegetation type, whereas climate change impacts ESs mainly through changes in climate attributes, such as precipitation, temperature, and wind velocity. Therefore, in this study we used a scenario-based simulation approach to distinguish between the impacts of ERPs and climate change on ESs [33]. The specific workflow of this study is as follows: First, we used four models (RUSLE, RWEQ, CASA, InVEST) to analyse the spatial characteristics and temporal trends of SC, SF, CS, and WY (Figure 2, step 1), considering climate, soil, and terrain as constant factors, while LULC and vegetation were set as variable factors (Figure 2, step 2). We then entered the configured factors into the above models to obtain scenario-based ESs. We then compared the ESs under the scenario assumptions with the actual ESs to identify the impact of ERPs on ESs (Figure 2, step 3). Finally, we used a structural equation model to quantitatively analyse the influences of each factor on the ESs (Figure 2, step 4). To ensure the reliability of our simulation results, we compared them with other datasets or published studies [69,70,71]. These comparisons showed a high degree of consistency, indicating the reliability of our results (Table S5).

2.3.8. Data Analysis

The present study calculated regional-scale trends for each ES using unary linear regression at a p < 0.05 significance level:
k s l o p e = n × i = 1 n i × A i i = 1 n i i = 1 n A i n × i = 1 n i 2 i = 1 n A i 2
where kslope represents the slope of the trend and n is the length of time being analyzed; kslope > 0 and kslope < 0 represent upward and downward trends, respectively.
The structural equation model (SEM) is a multivariate statistical technique that combines path analysis and simultaneous equation modelling [72]. SEM can quantify the direct and indirect causal relationships among multiple variables [73], making it widely applicable for identifying and attributing complex relationships among various factors in earth science and ecology [74]. In our study, we used SEM to analyse the effects of climate variables and vegetation dynamics on the OB of ESs.

3. Results

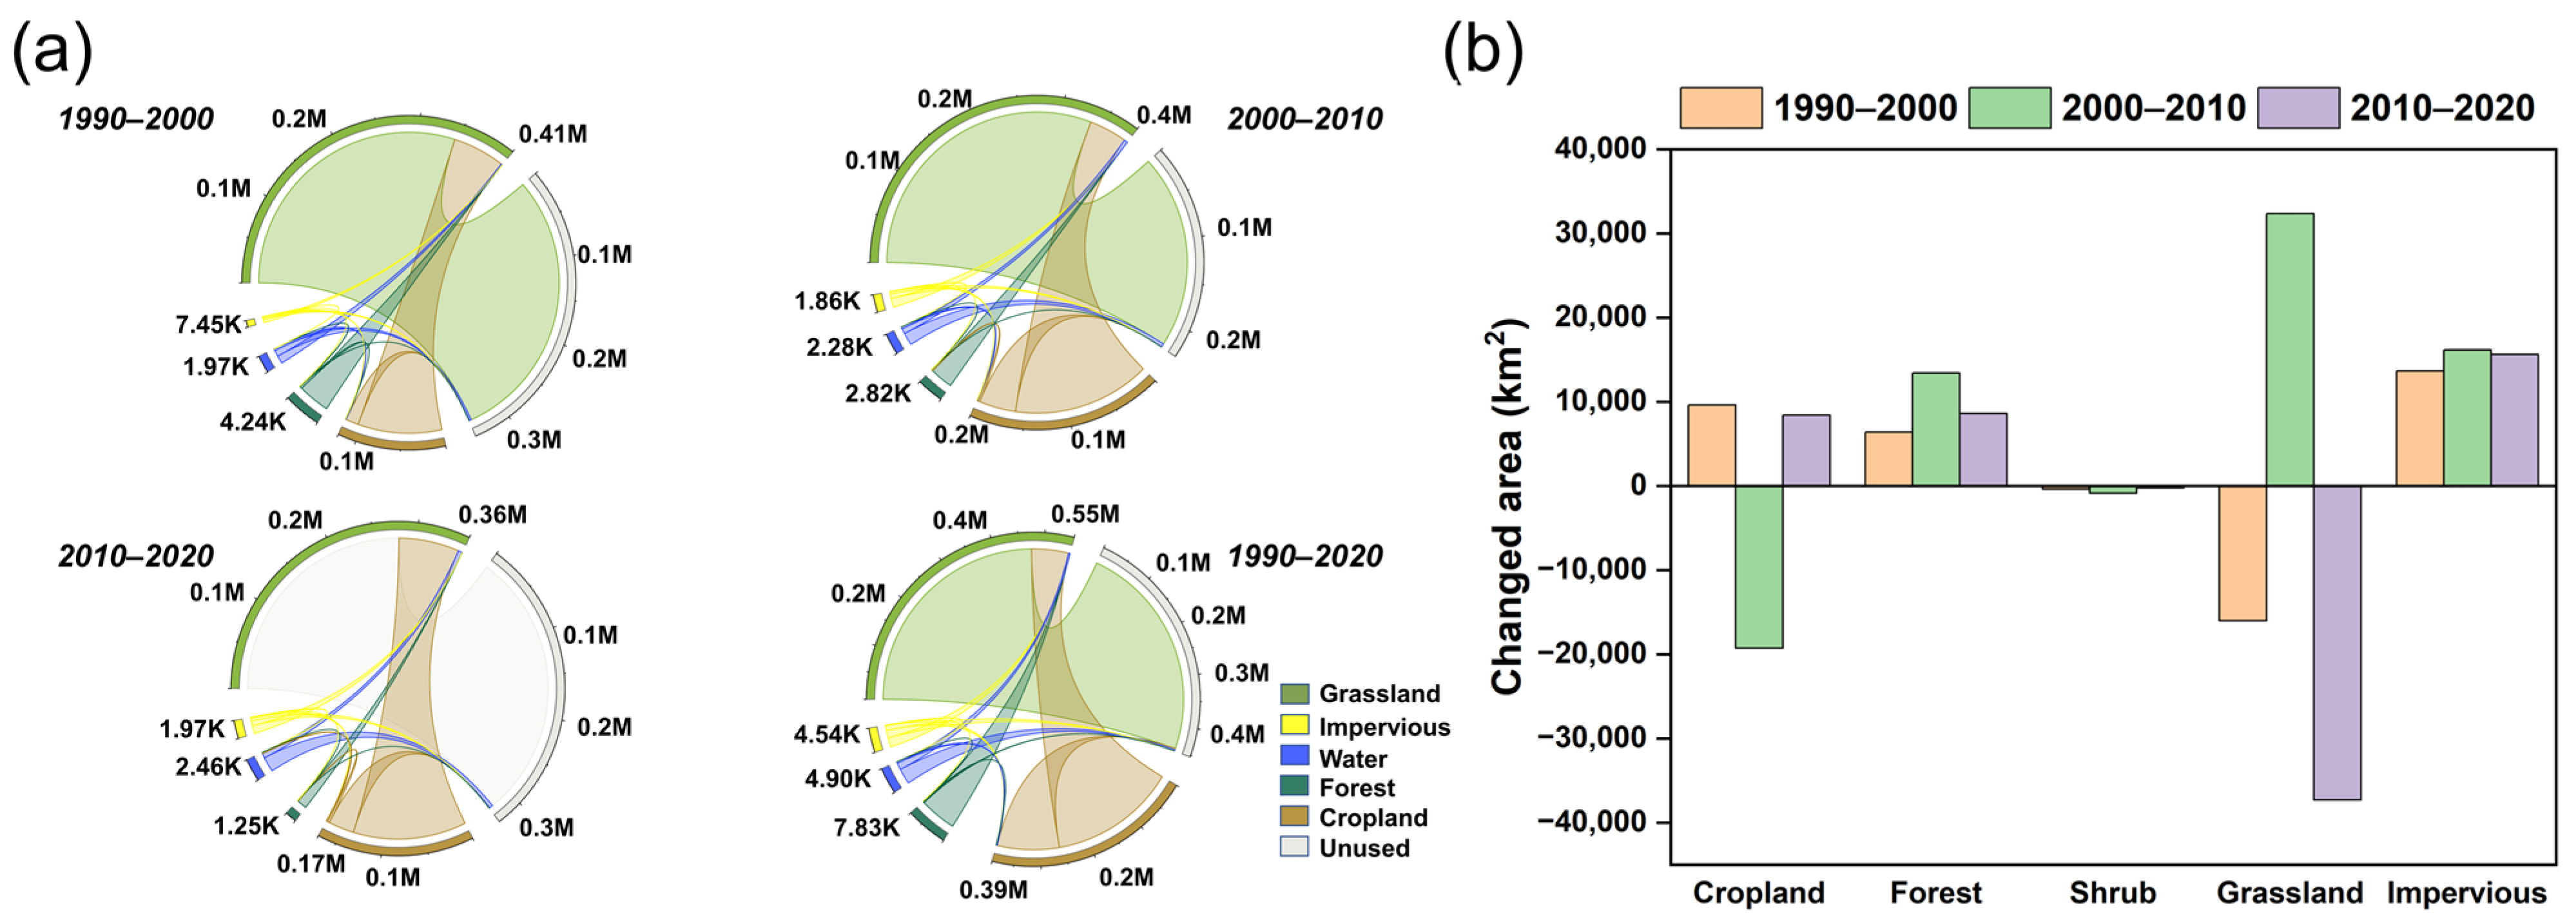
3.1. Alterations in Land Cover

The current study examined alterations in LULC in the TNR 1990 to 2020. Forest land of 1.3 × 10⁴ km2 was converted to cropland between 1990 and 2000; 1.2 × 10⁴ km2 of cropland was transformed to grassland between 2000 and 2010; and 1.4 × 10⁴ km2 of grassland was converted to forest between 2010 and 2020. Around 12.06% of the region’s area underwent alterations in LULC from 1990 to 2020 (Figure 3a). There was an initial increase in cropland area, followed by a decrease, and then another increase between 1990 and 2020. The trend in change in the area of grassland was the opposite of that of cropland. The areas of forest and impervious cover increased over the past 30 years, whereas that of shrubland decreased. The areas of cropland, shrubland, and grassland had decreased in 2020 compared to that in 1990, with a decrease in grassland of 2.0 × 10⁴ km2, whereas those of impervious area and forest had increased by 4.5 × 10⁴ km2 and 2.8 × 10⁴ km2, respectively (Figure 3b).

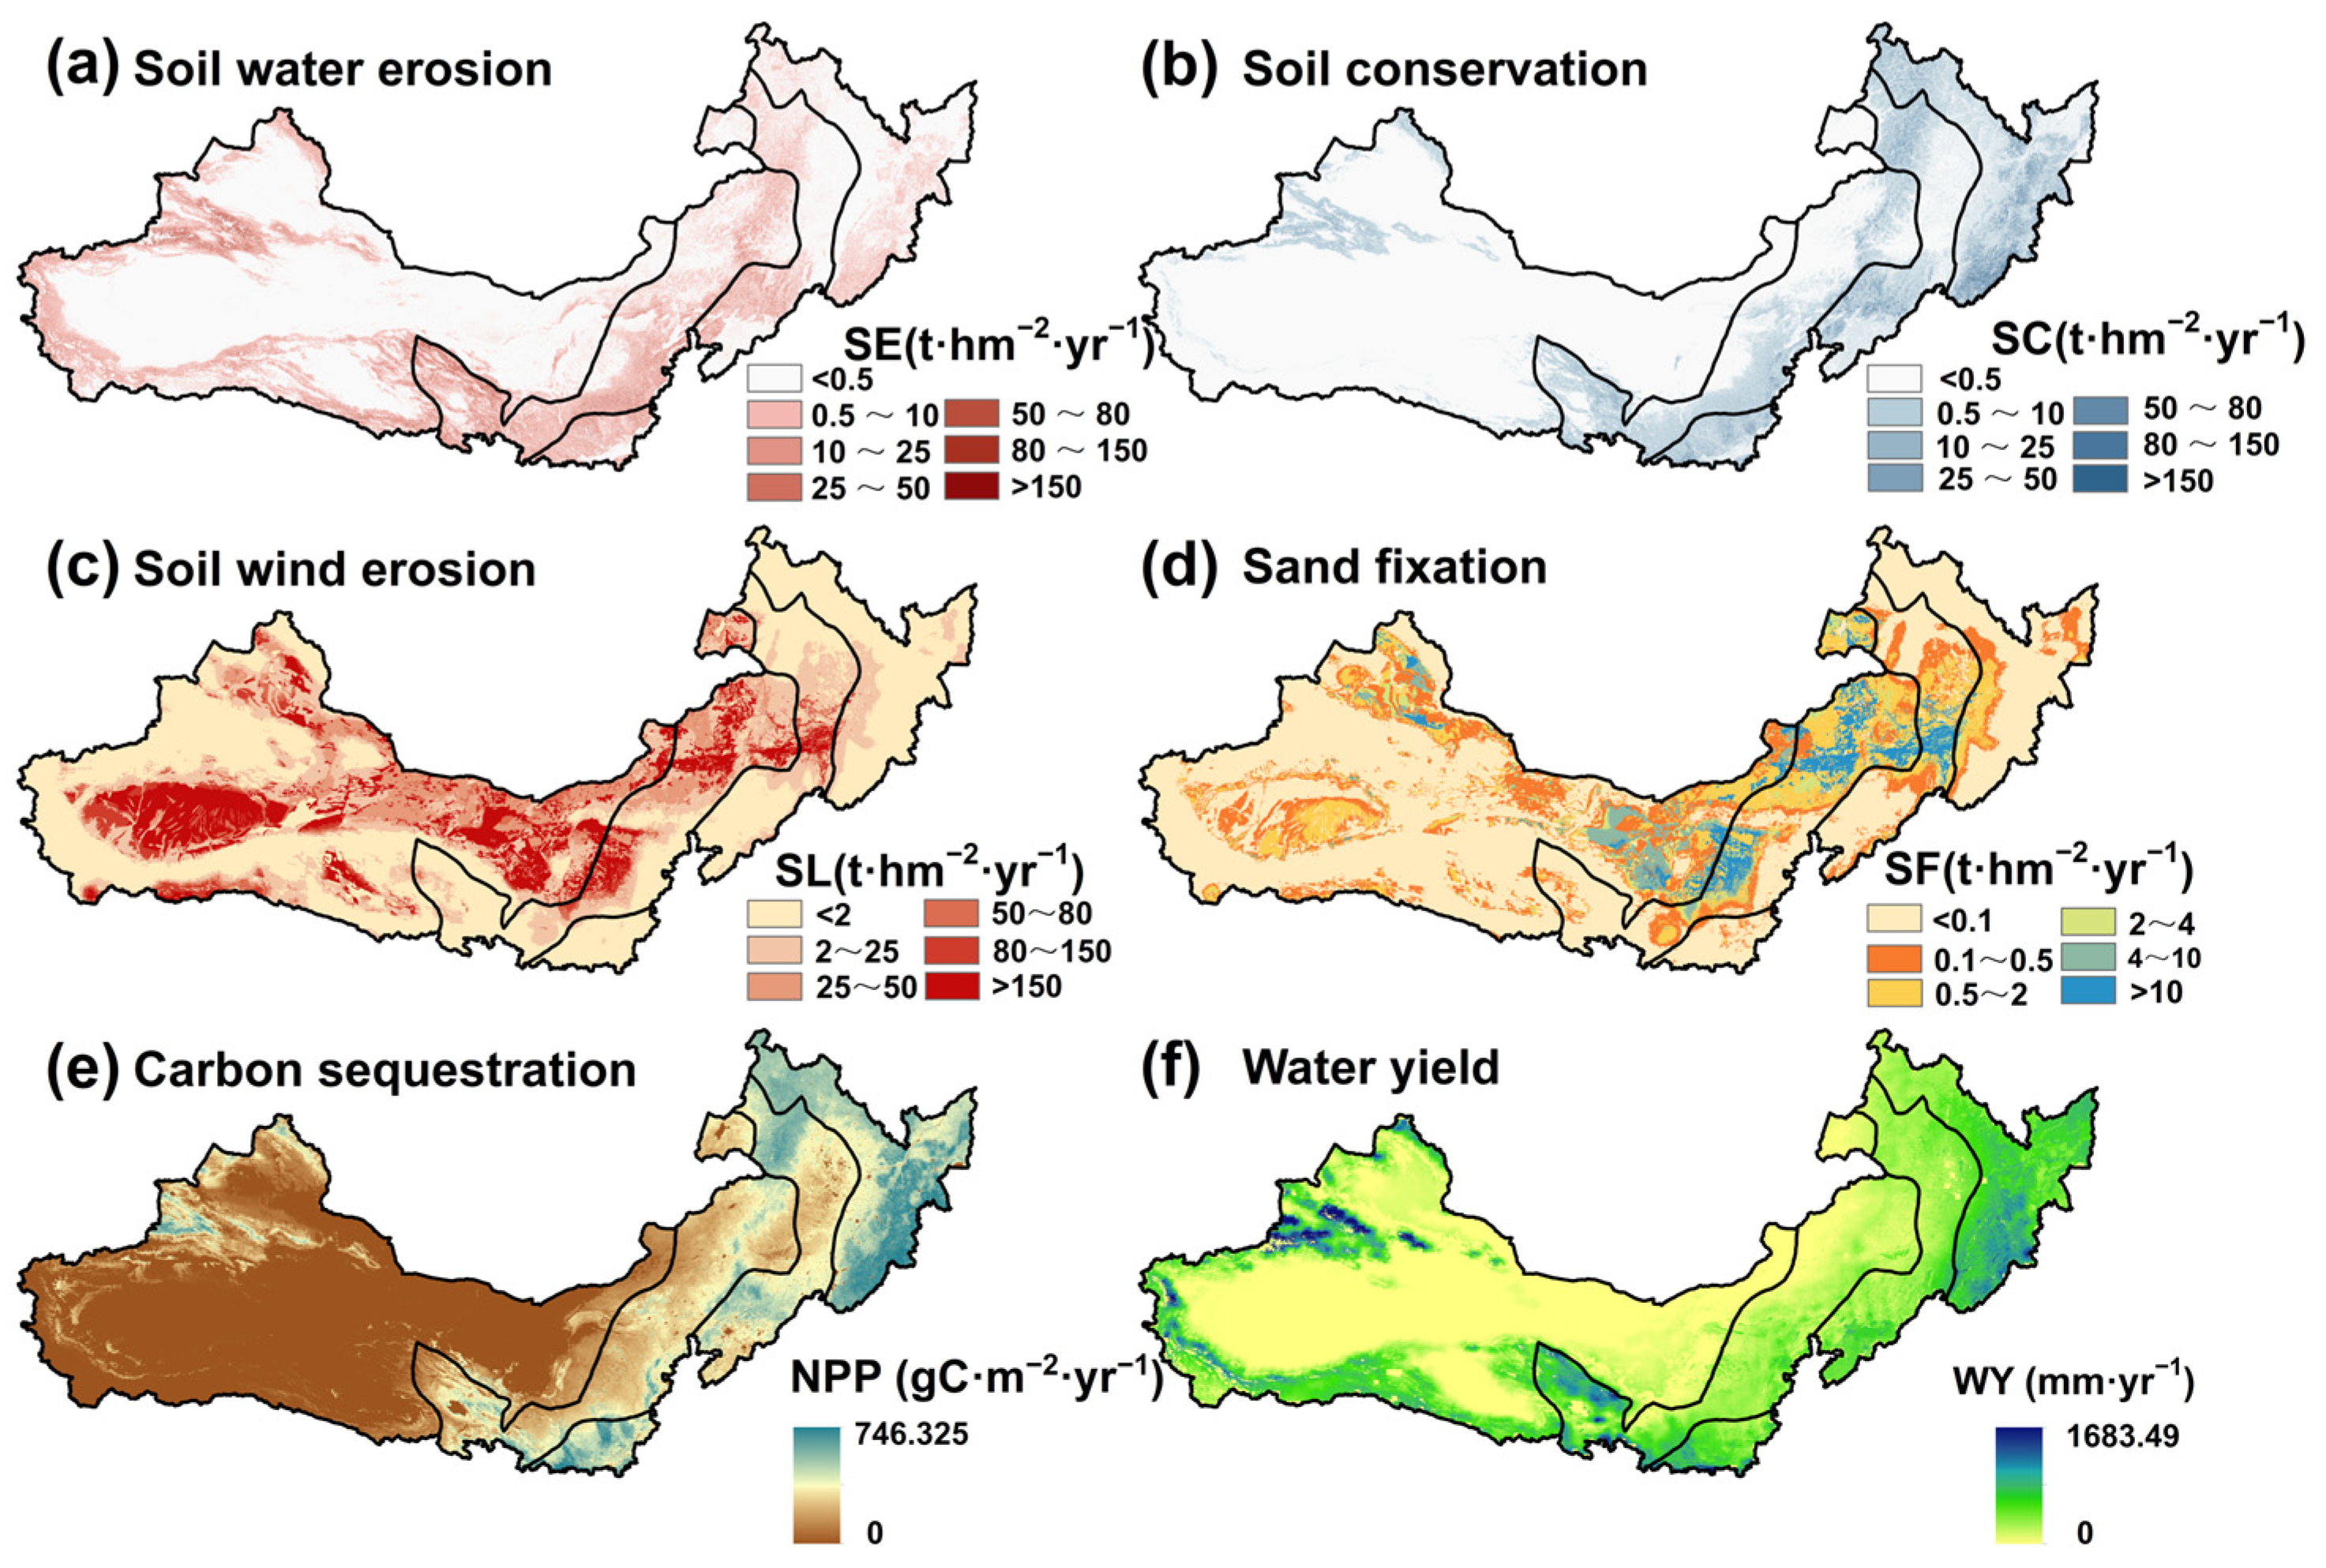
3.2. Spatial Distributions of Soil Erosion and Ecosystem Services (ESs)

The areas experiencing severe SE were mainly the Changbai Mountains, Greater Khingan Mountains, Loess Plateau, Qilian Mountains, and Tianshan Mountains (Figure 4a). The distribution over space of SC functions was consistent with that of SE in most areas, except for in the western regions where SC was lower (Figure 4b). As shown in Figure 4c, the SL occurred widely across the study area, with the highest SL occurring in semi-arid and arid areas, such as the Badain Jaran Desert, the Taklimakan Desert, and the Otindag Sandy Land. High SF occurred mainly in semi-arid areas (Figure 4d). NPP decreased from east to west, with a higher NPP in the Changbai and Greater Khingan Mountains. The distribution of WY over space was similar to that of NPP, with areas of high water production capacity distributed in mountainous areas with higher rainfall (Figure 4e,f).

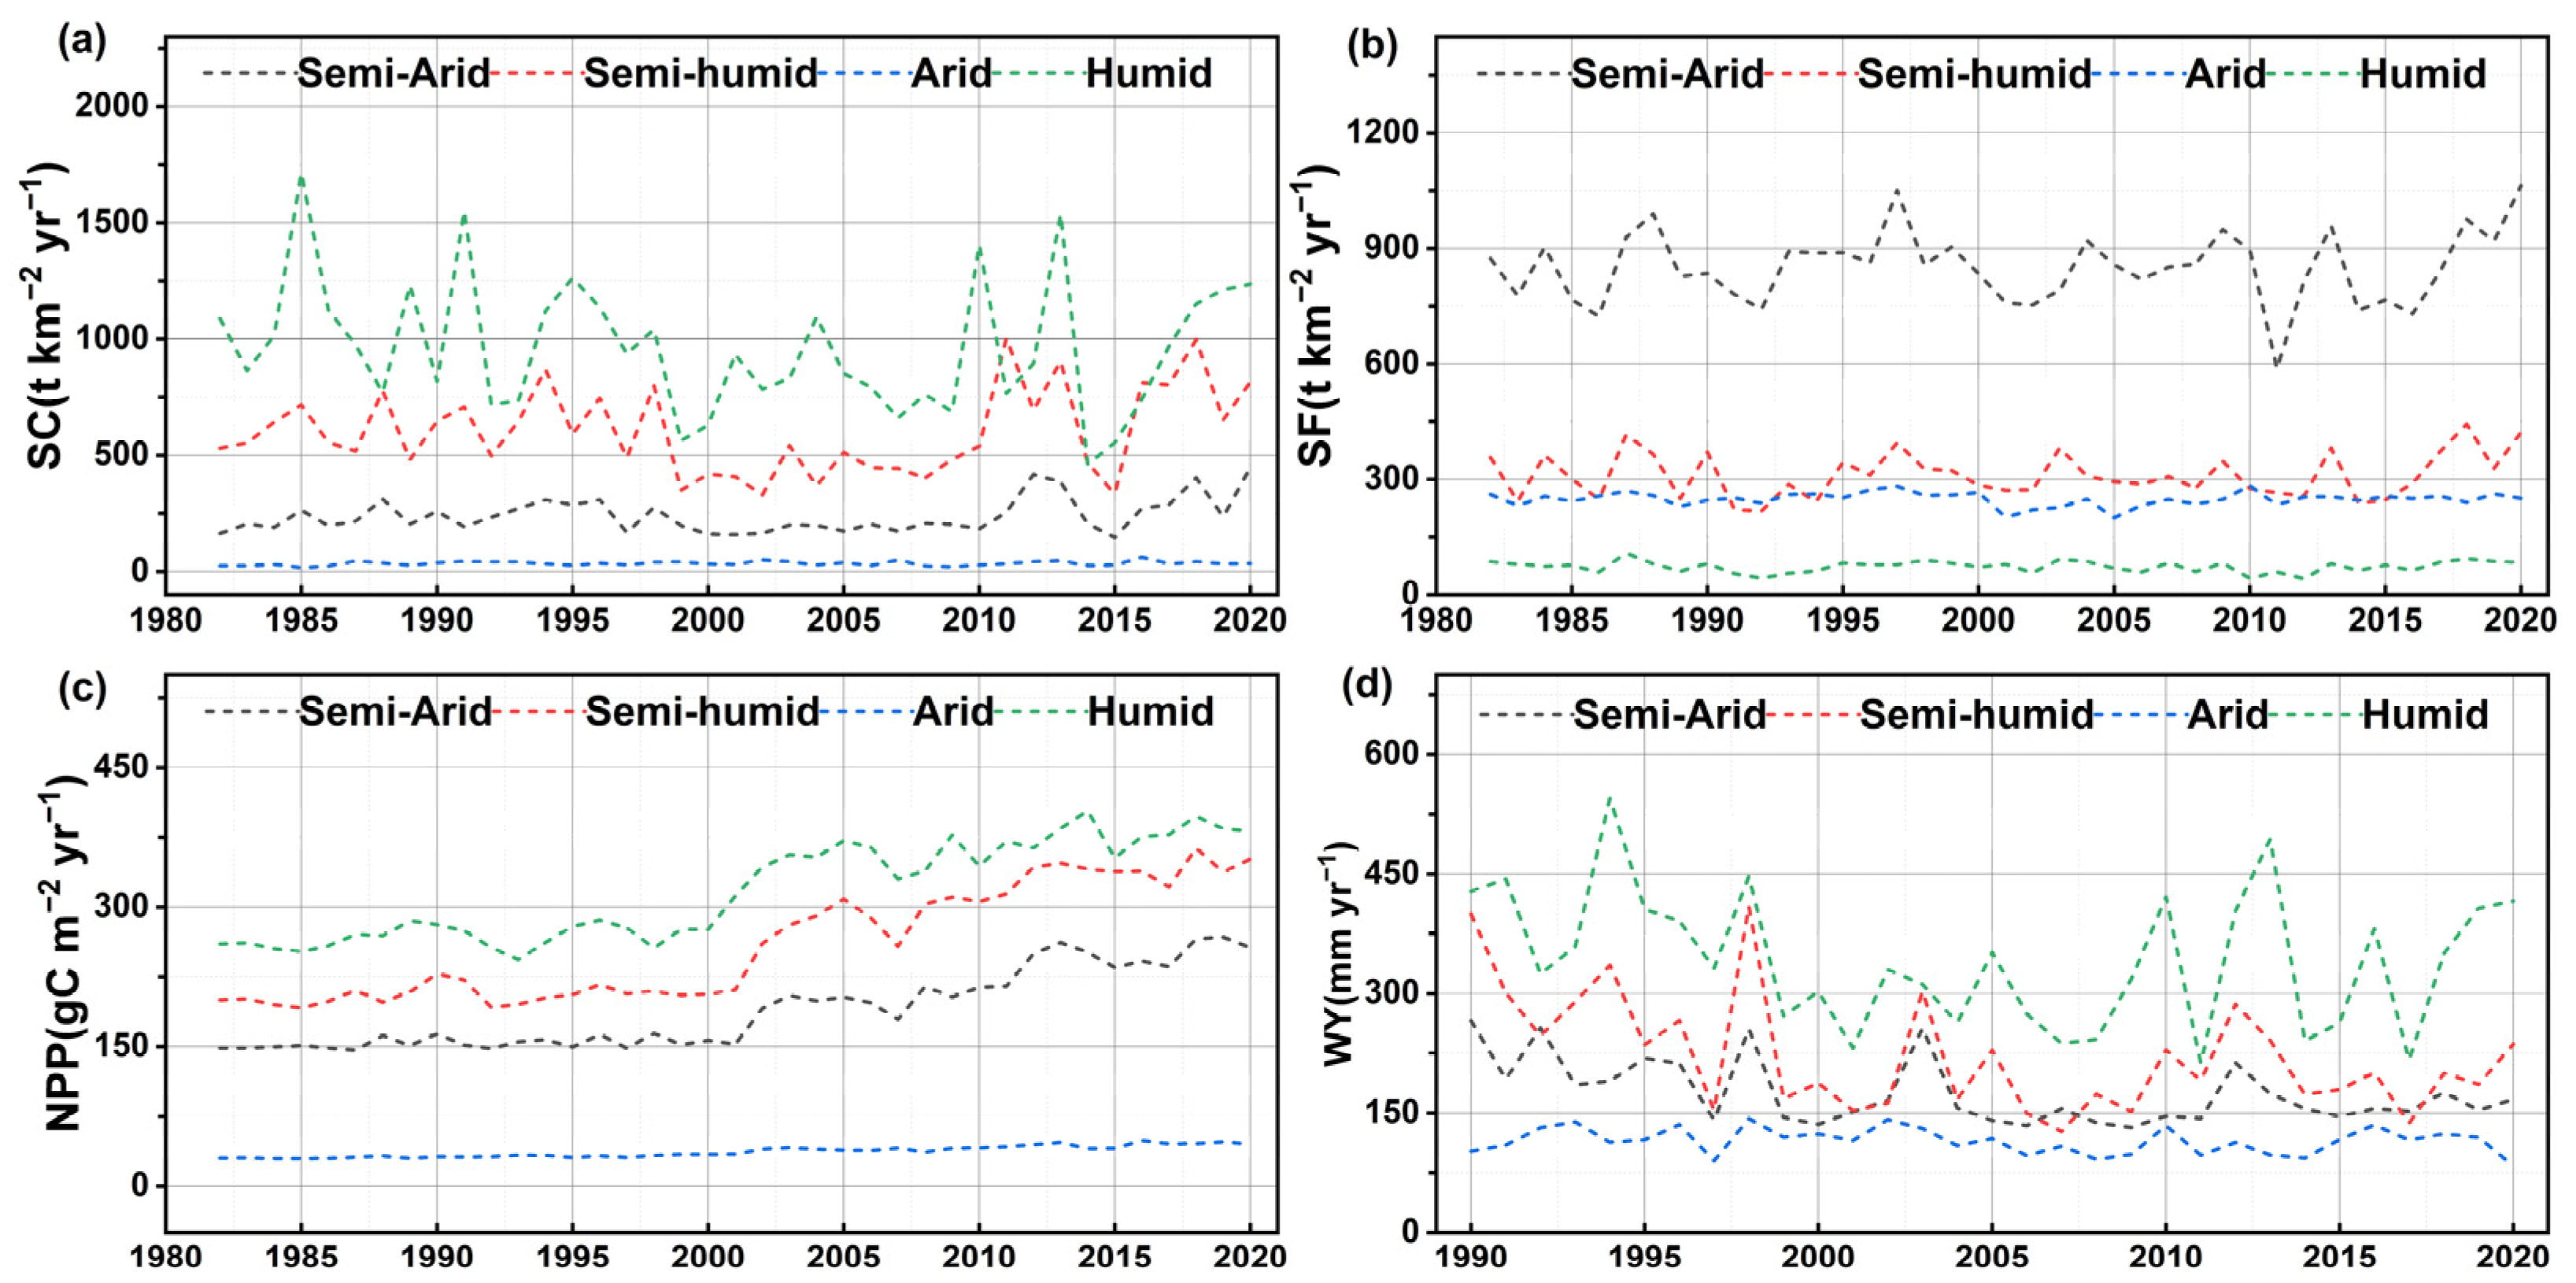
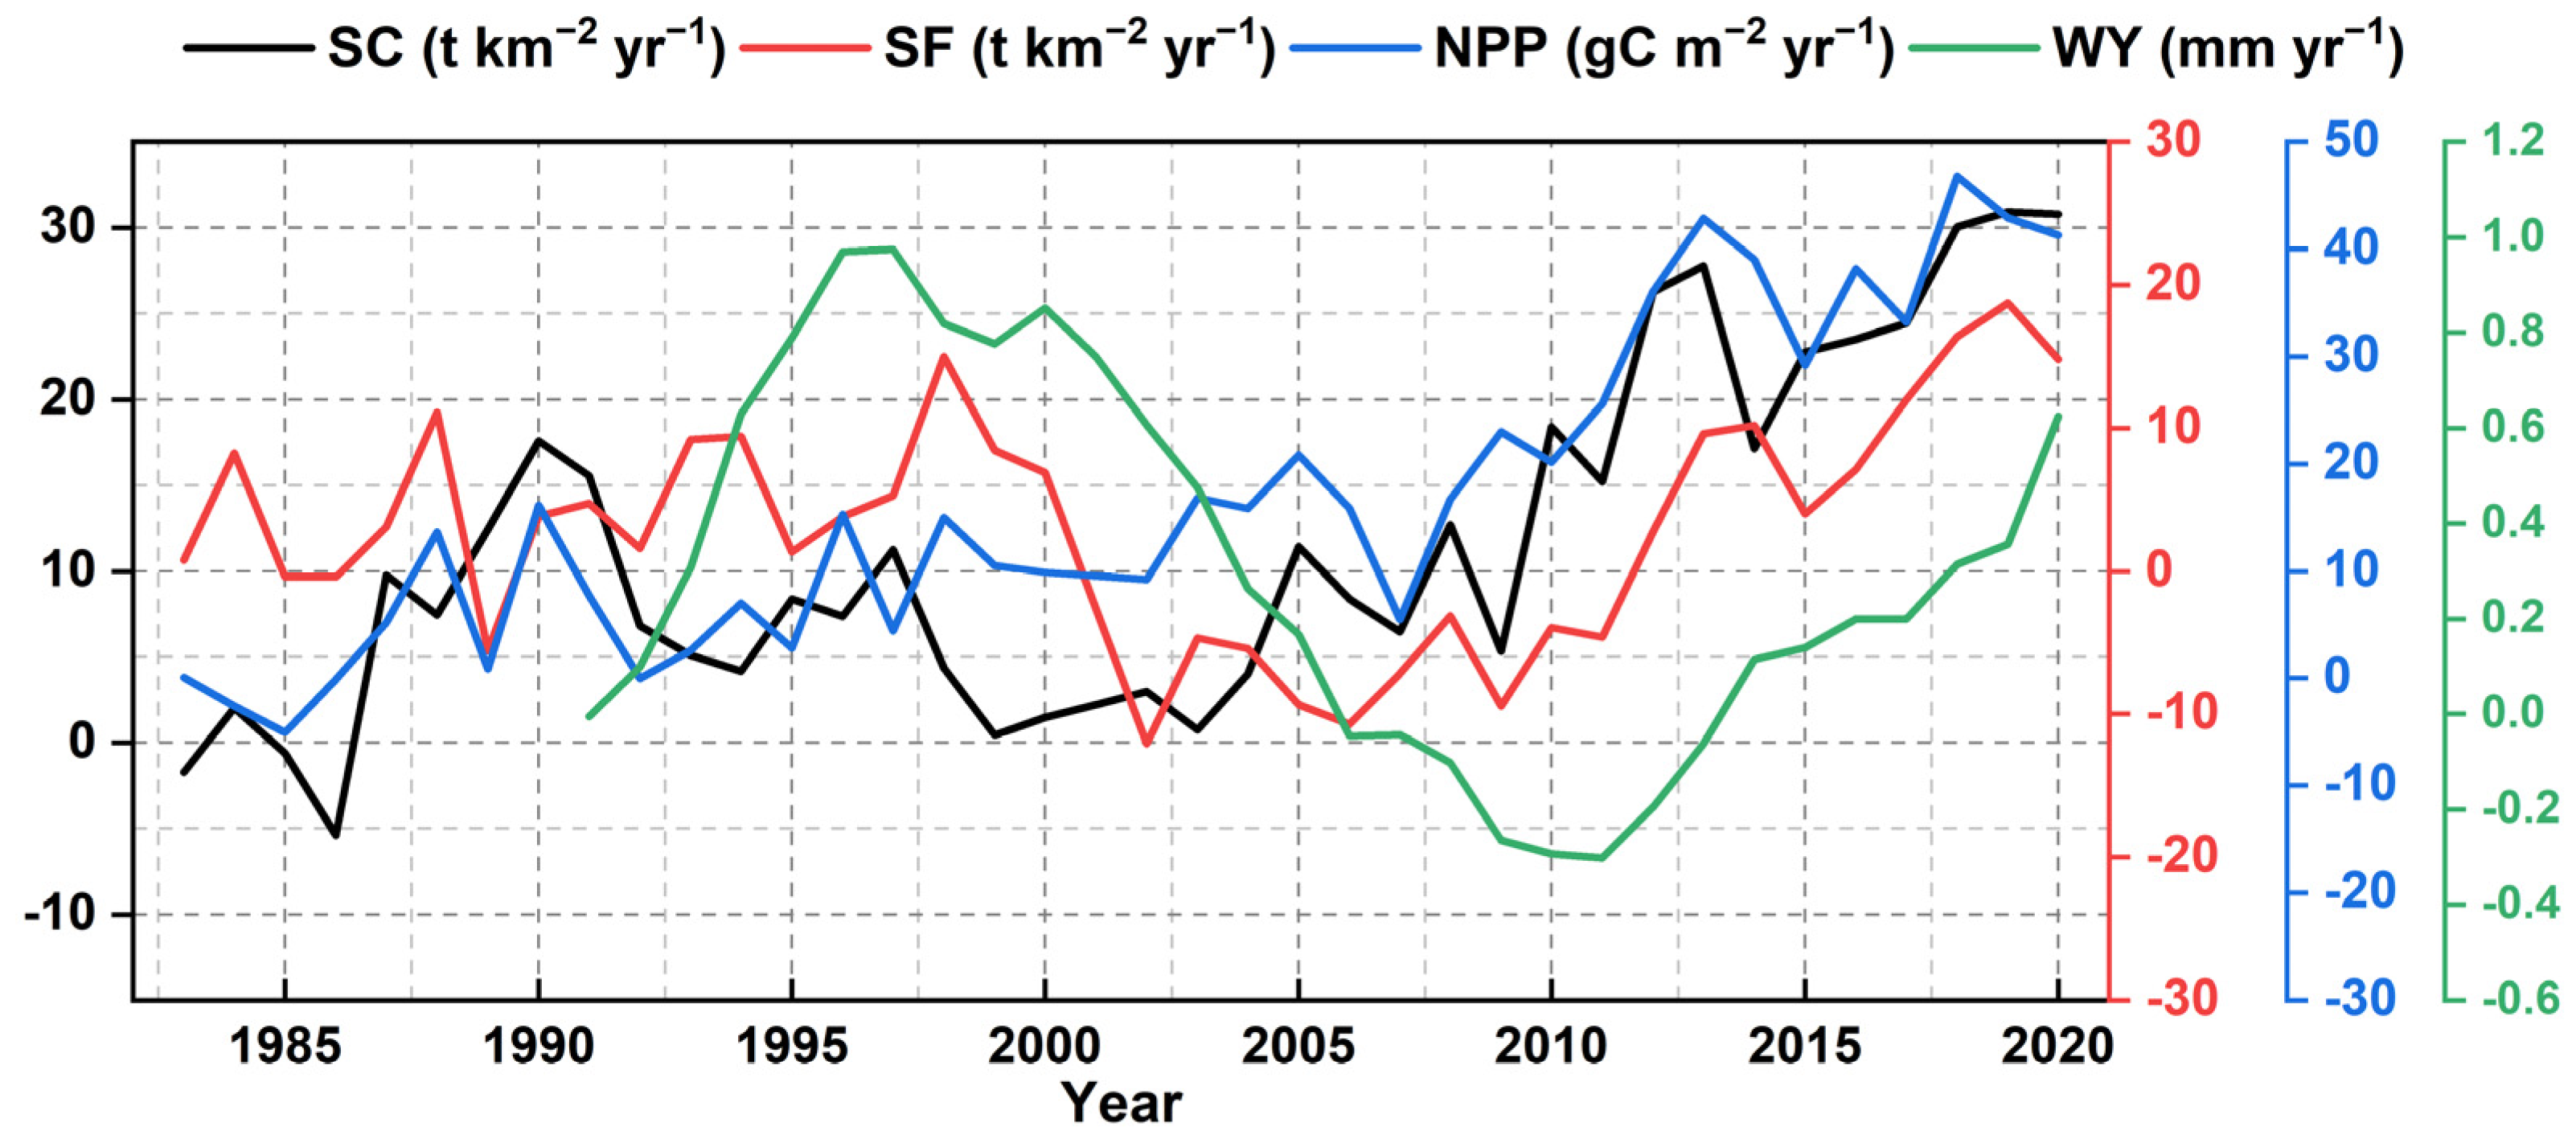
3.3. Temporal Variations in Ecosystem Services (ESs)

The differences in landscape types within the study area are mainly influenced by a combination of precipitation, monsoon patterns, and topography (mountains and plateaus). Figure 5a shows the temporal variations in SC services across different climatic zones. There were substantial fluctuations in SC services in the humid zone, whereas those in the semi-arid and semi-humid areas showed consistent, slight upward trends. The SC services in the arid zone remained relatively constant due to weaker soil erosion. In contrast, the SF services in the semi-arid zone noticeably exceeded those in the remaining three climatic zones. The SF services in the semi-humid and semi-arid areas similarly demonstrated clear upward trends, whereas those in the arid and humid zones showed no significant changes. Although SL was severe in the arid zone, most of the land of this zone was barren with poor vegetation cover, leading to weak inhibition of SL. Despite high vegetation cover in the humid zone, the few deserts or sandy areas in this zone resulted in only slight SL and lower SF values (Figure 5b). NPP in all climate zones, besides that in the arid zone, remained relatively stable before 2000 but exhibited clear upward trends after 2000 (Figure 5c). There was a relatively constant temporal variation in WY in the arid zone, whereas those of the remaining climatic zones showed fluctuating downward trends (Figure 5d).

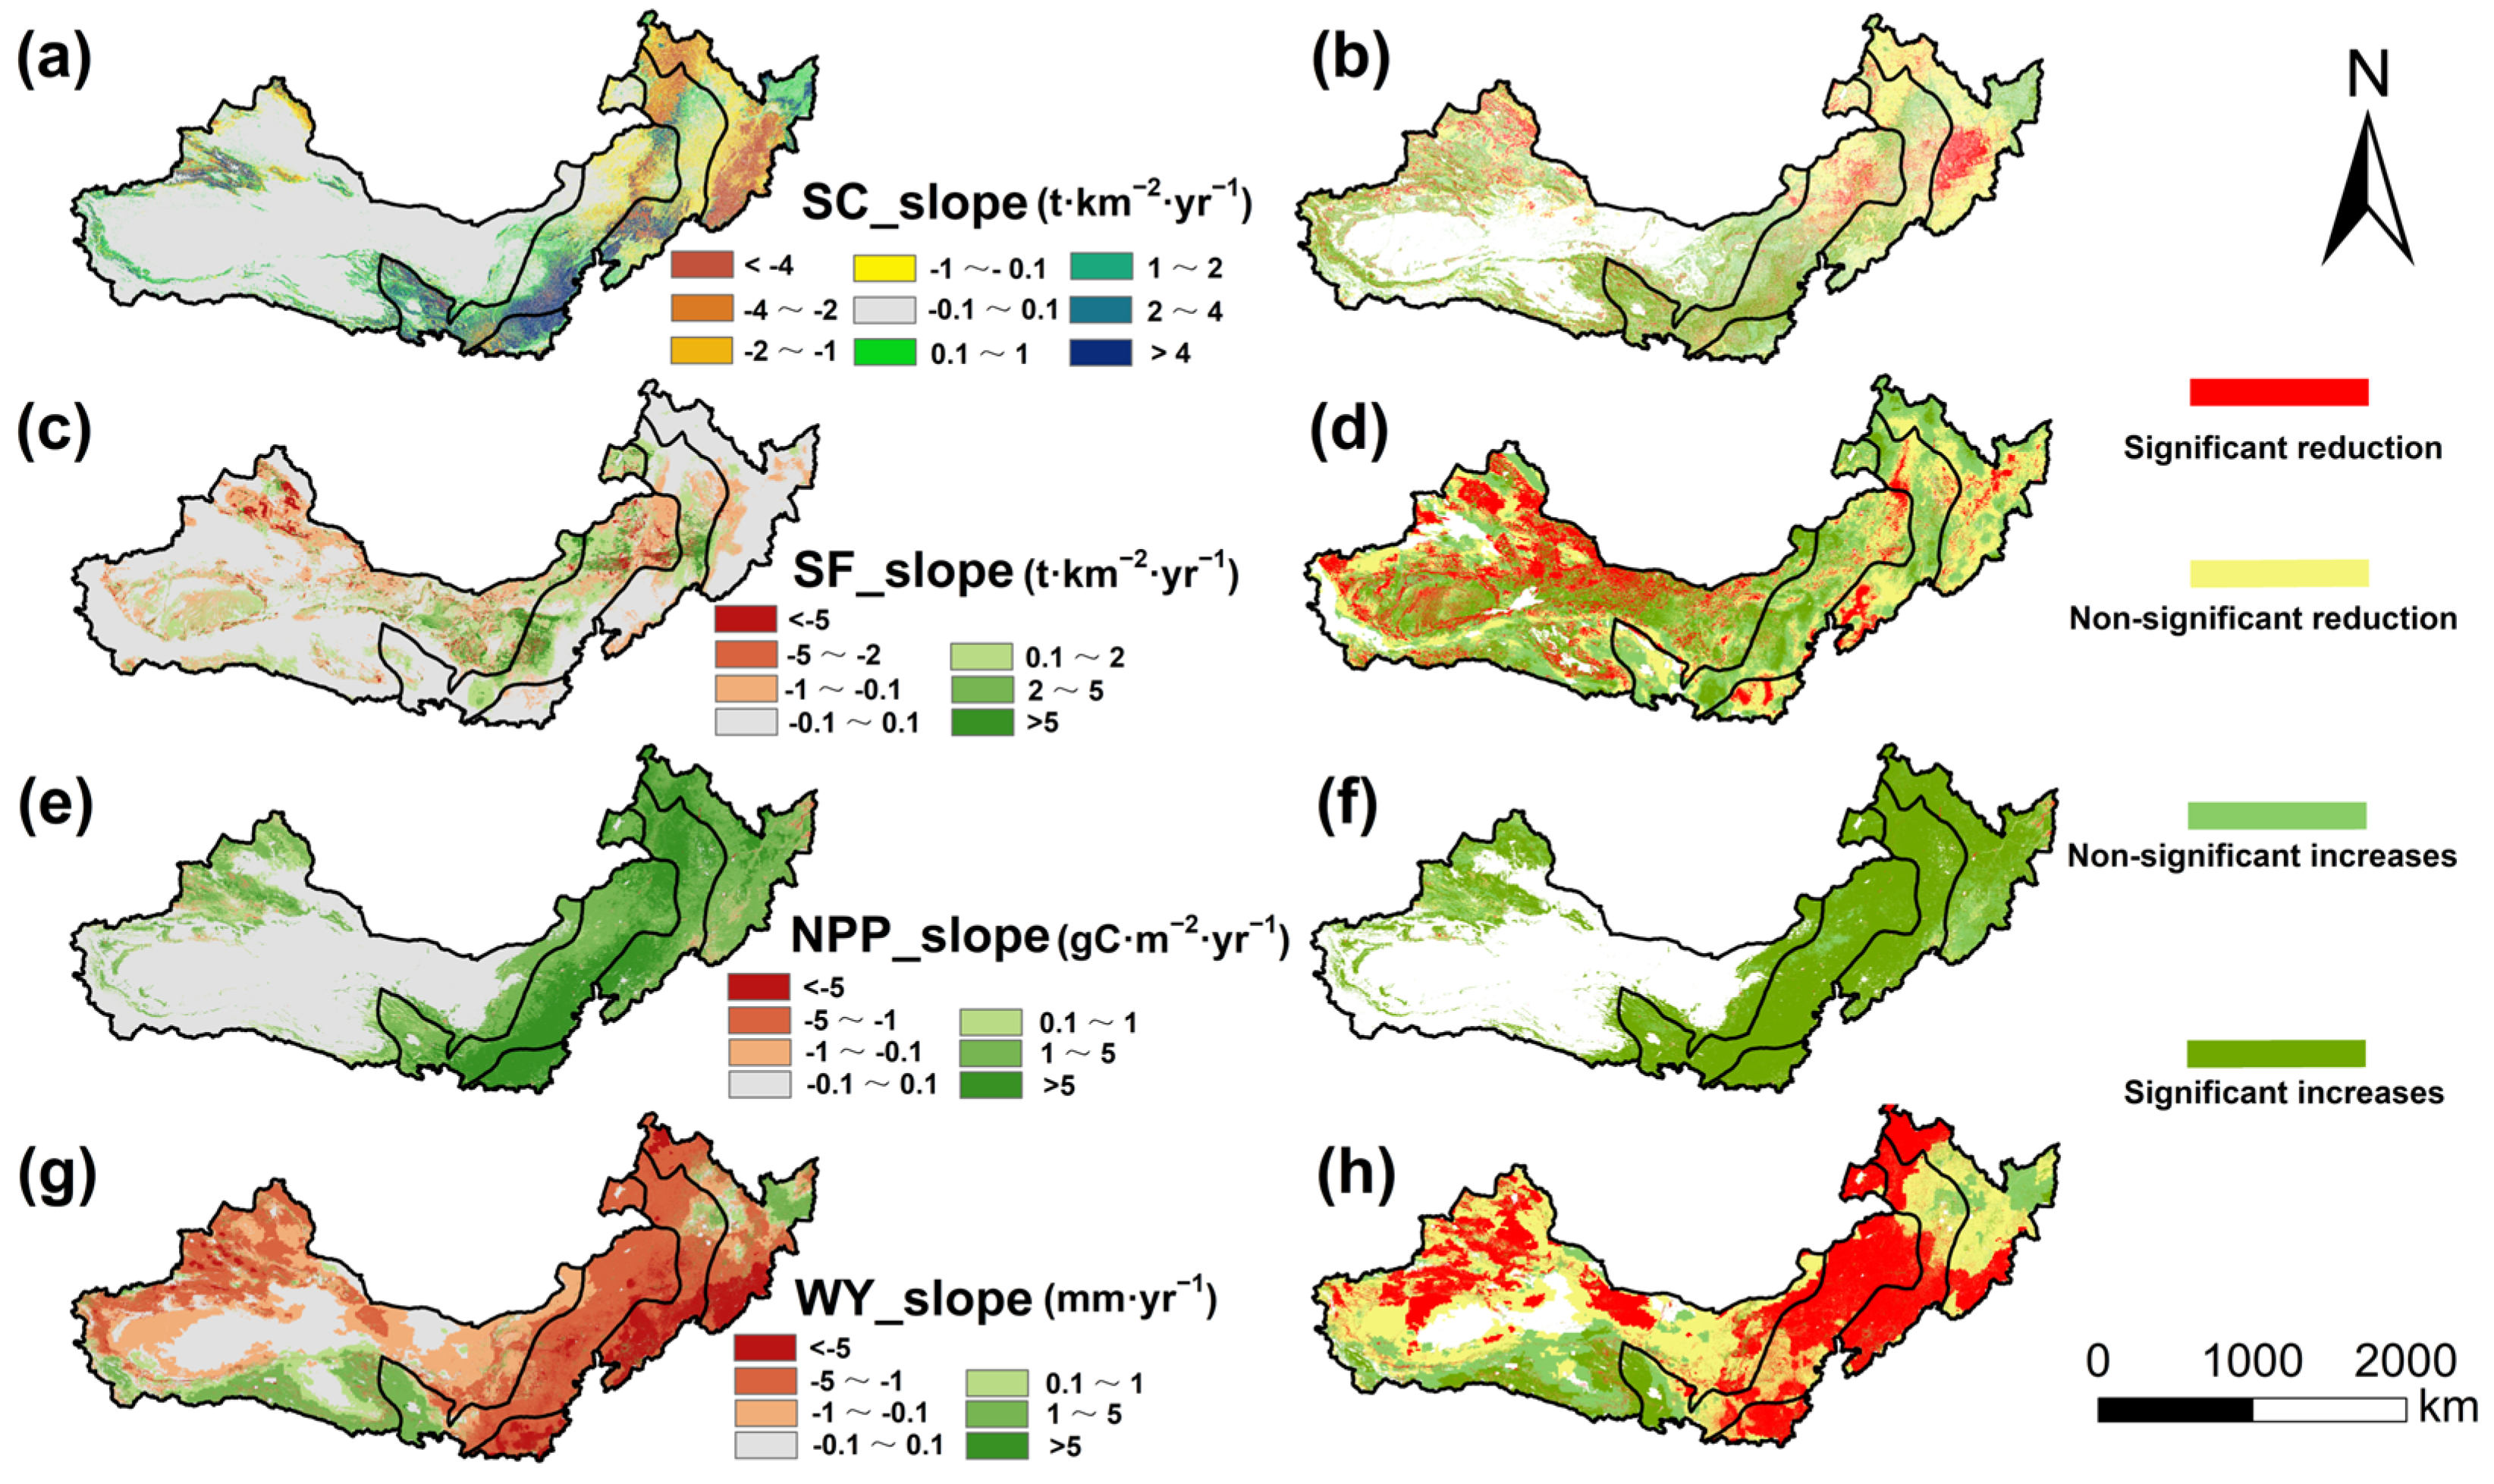
3.4. Spatial Variations in Ecosystem Services (ESs)

Figure 6 illustrates the spatial trends of the four ESs and their significance. Significant decreases and increases in SC services occurred in 6.63% and 11.87% of the study area, respectively. Regions with rapidly increasing SC services were concentrated in the Loess Plateau and Tianshan Mountains, whereas those with rapidly decreasing SC services were mainly distributed in the Changbai Mountains (Figure 6a,b). Significant increases and decreases in SF services occurred in 14.72% and 16.94% of the total area, respectively. Regions with rapidly increasing SF services were mainly in semi-arid deserts, such as the Mu Us Sandy Land, whereas those with rapidly decreasing SF services were mainly distributed in the Gurbantunggut Desert (Figure 6c,d). There were significant increases and decreases in CS services in 47.62% and 0.42% of the study area, respectively. Areas with rapidly increasing CS services were concentrated in the Loess Plateau and the Greater Khingan Mountains (Figure 6e,f). As shown in Figure 6g,h, WY decreased in most regions, with significant decreases occurring in 35.19% of the area, which were predominantly concentrated in the east and Tianshan Mountains in the west, whereas there was an increasing trend in WY in 7.09% of the area, which was predominantly concentrated in the Qilian Mountains.

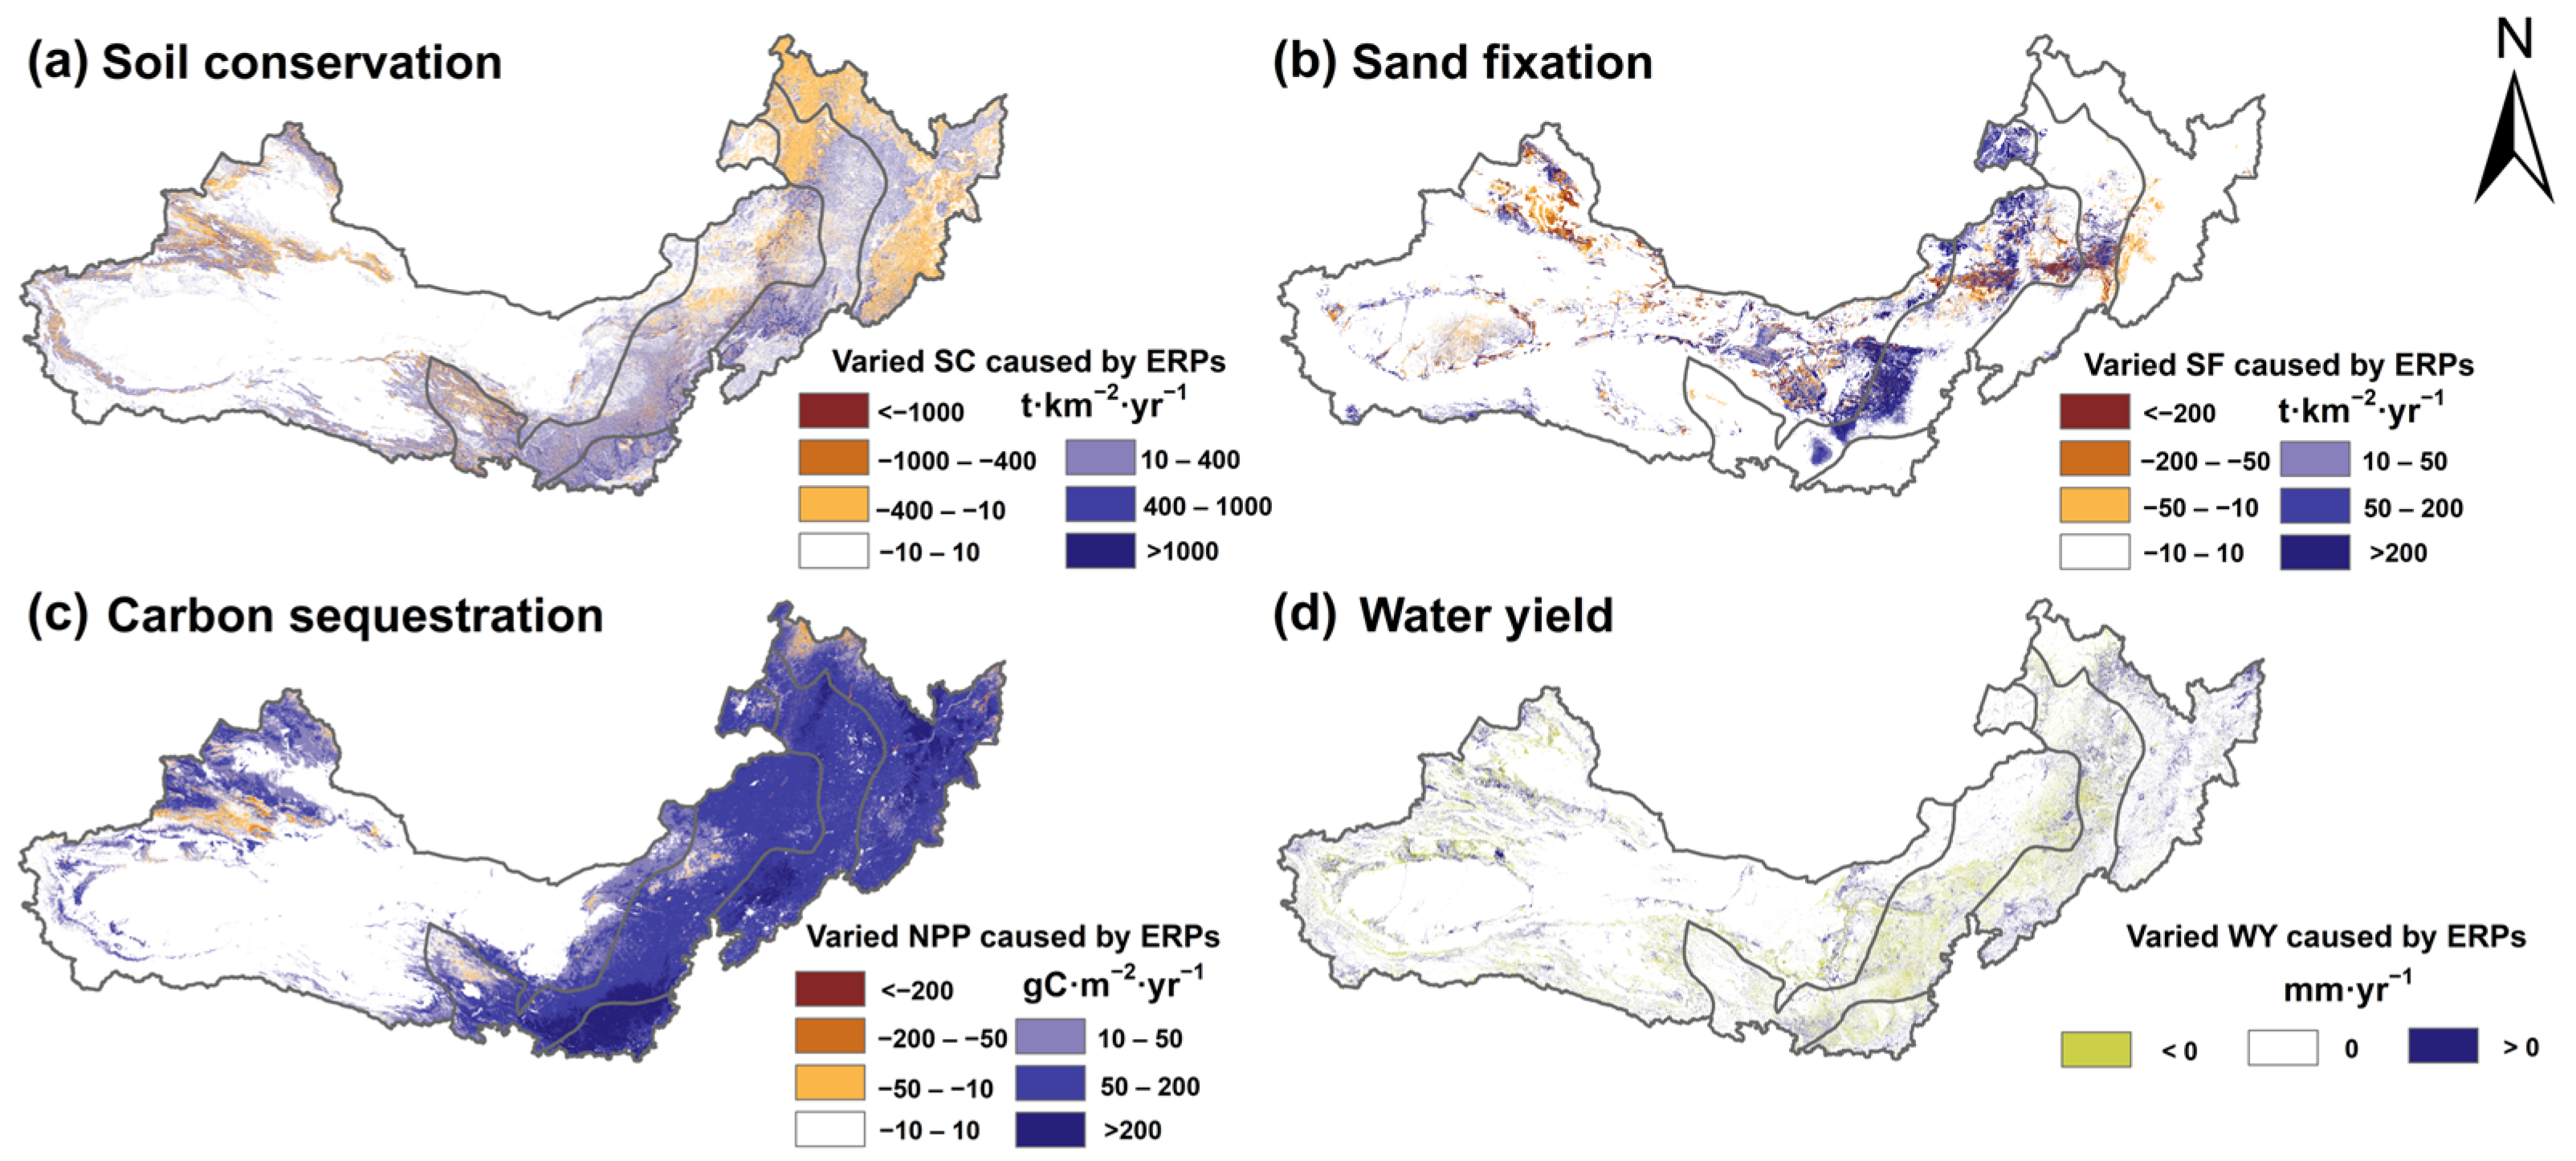
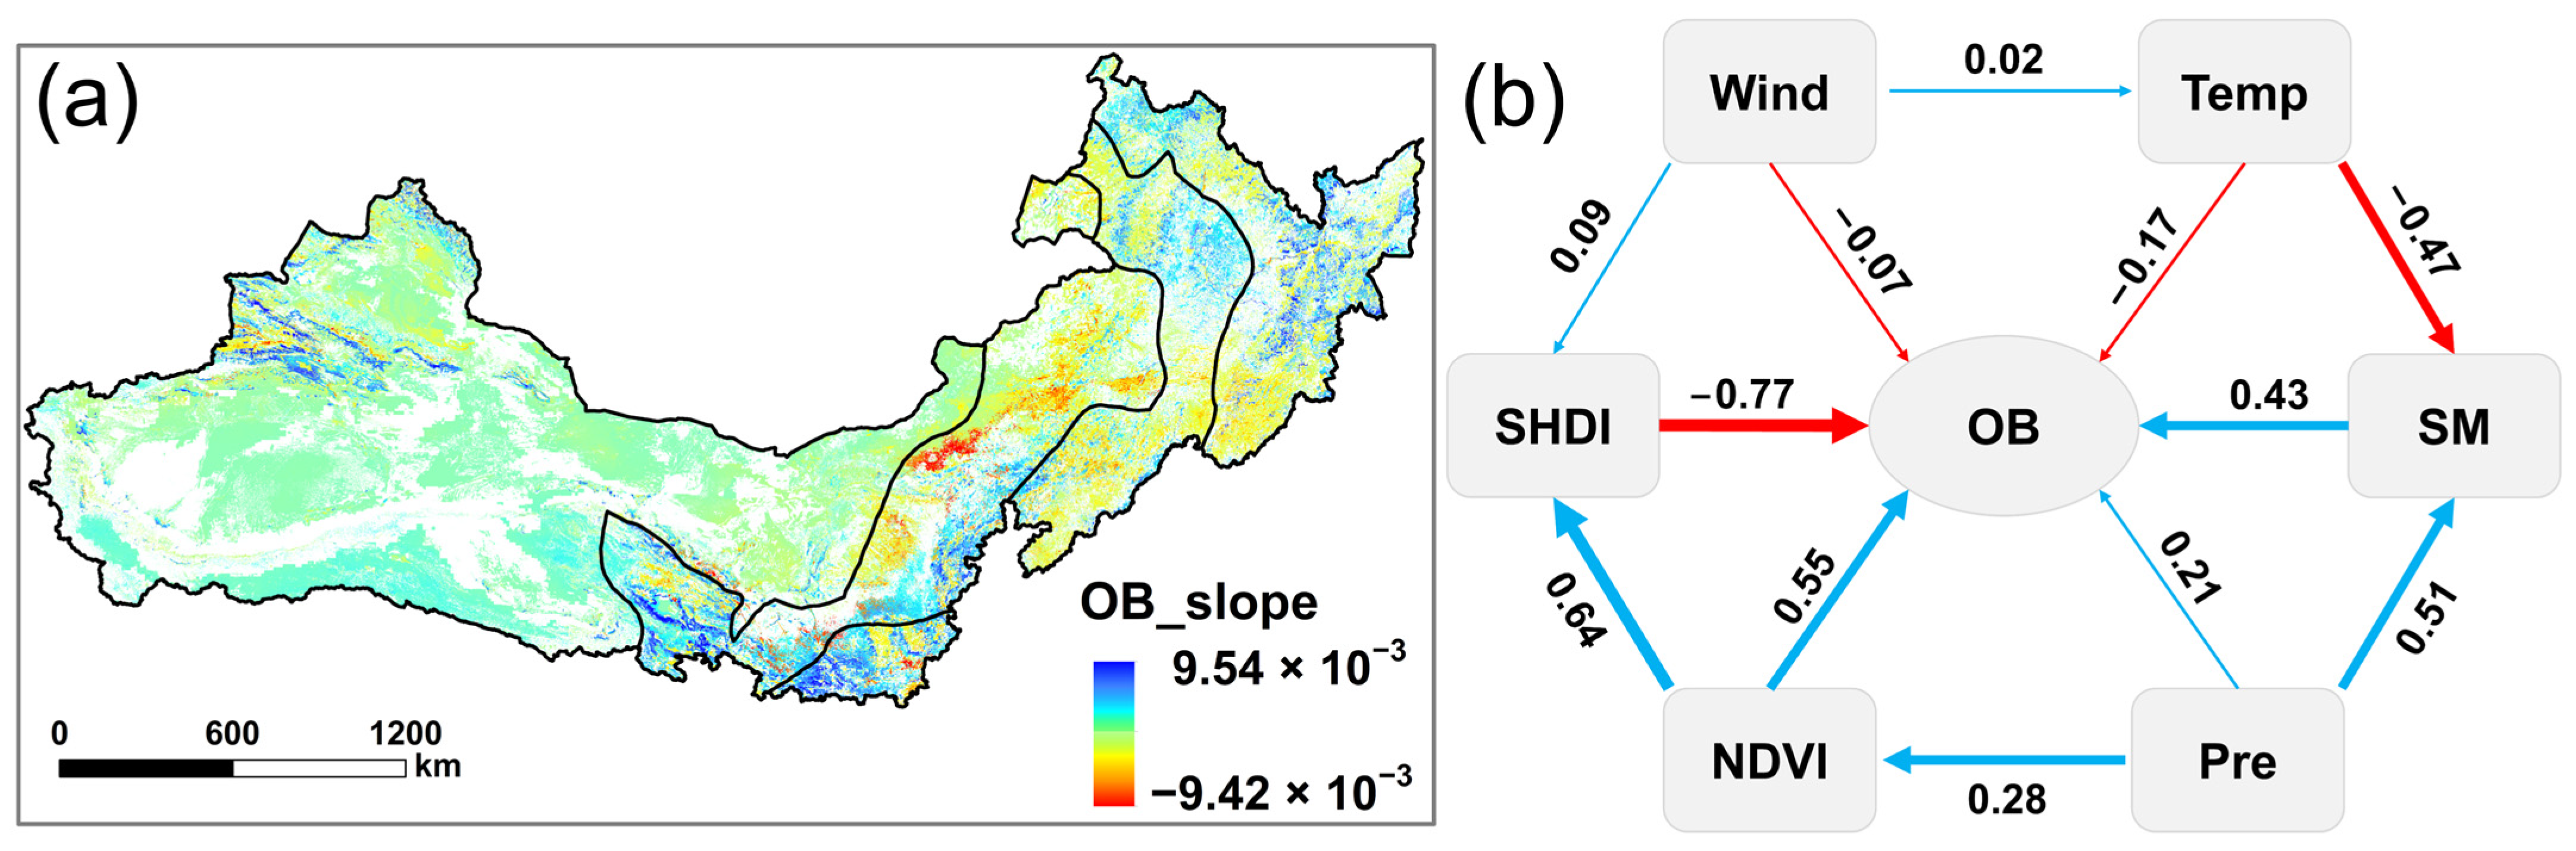
3.5. The Effects of ERPs on Ecosystem Services (ESs)

The distinctions in the four ESs between the reference periods (1982, 1990, and 2020), with positive and negative values indicating the promotion and suppression of ESs by ERPs, are shown in Figure 7. The results showed relatively stable SC, SF, and CS before 2000, after which they increased. On the other hand, there was little overall change in WY, with a gradual increase before 2000, followed by a gradual decrease from 2000 to 2010, and a gradual increase from 2010 to 2020. In 2020, the SC, SF, CS, and WY services increase by 30.77 t km−2 yr−1, 14.80 t km−2 yr−1, 41.28 g C m−2 yr−1, and 0.62 mm yr−1, respectively, compared to the base year. These results suggest that while large-scale vegetation expansion increased SC, SF, and SC, it had no significant impact on WY. Figure 8 shows the differences in ESs over space between the base year and 2020. SF rose substantially in the region called the Loess Plateau, whereas it decreased in the Changbai and Greater Khingan Mountains, respectively (Figure 8a). Areas with increases and decreases in SC were mainly in the northeast and northwest, respectively (Figure 8b). Moreover, for the Tianshan Mountains region, most regions experienced an increase in CS (Figure 8c). There were no overall spatial differences in WY, with decreases mainly concentrated in the Loess Plateau (Figure 8d).

4. Discussion

4.1. The Impacts of Environmental Attributes on Ecosystem Services (ESs)

As shown in Figure 9a, the region of the TNR with an upward tendency in OB exceeded that with a decreasing trend. Figure 9b shows the standardized path coefficients between different environmental factors and OB. The negative path coefficient between SHDI and OB indicated inhibition of ESs by land fragmentation. The path coefficient between NDVI and OB of 0.55 indicated that vegetation greening promoted ESs, which is consistent with the inference by Liu et al. [75]. Precipitation (Pre) and soil moisture (SM) had positive correlations with OB, whereas the opposite relationship was found for wind speed and temperature. SHDI and NDVI had stronger influences on OB, whereas those of the different meteorological factors were relatively small. An evaluation of the impacts of land cover/utilization change on soil erosion in China by Chi et al. [76] found that EE was beneficial for preventing the erosion of the soil. Quantitative research on the effects of climate on SF in Inner Mongolia determined that precipitation and temperature caused positive and negative impacts on SF, respectively, such as the outcomes in the research by Ref. [77]. Wu et al. [78] compared the impacts of the activities conducted by humans and the climate regarding SF and found that variation in wind speed had the greatest effect on SF. Their results were inconsistent with the findings of the present study, which determined that wind speed showed a relatively minor impact on OB. This discrepancy can be attributed to wind speed being the main driver of soil erosion, thereby directly affecting SF, whereas wind speed has relatively small impacts on other ES functions.

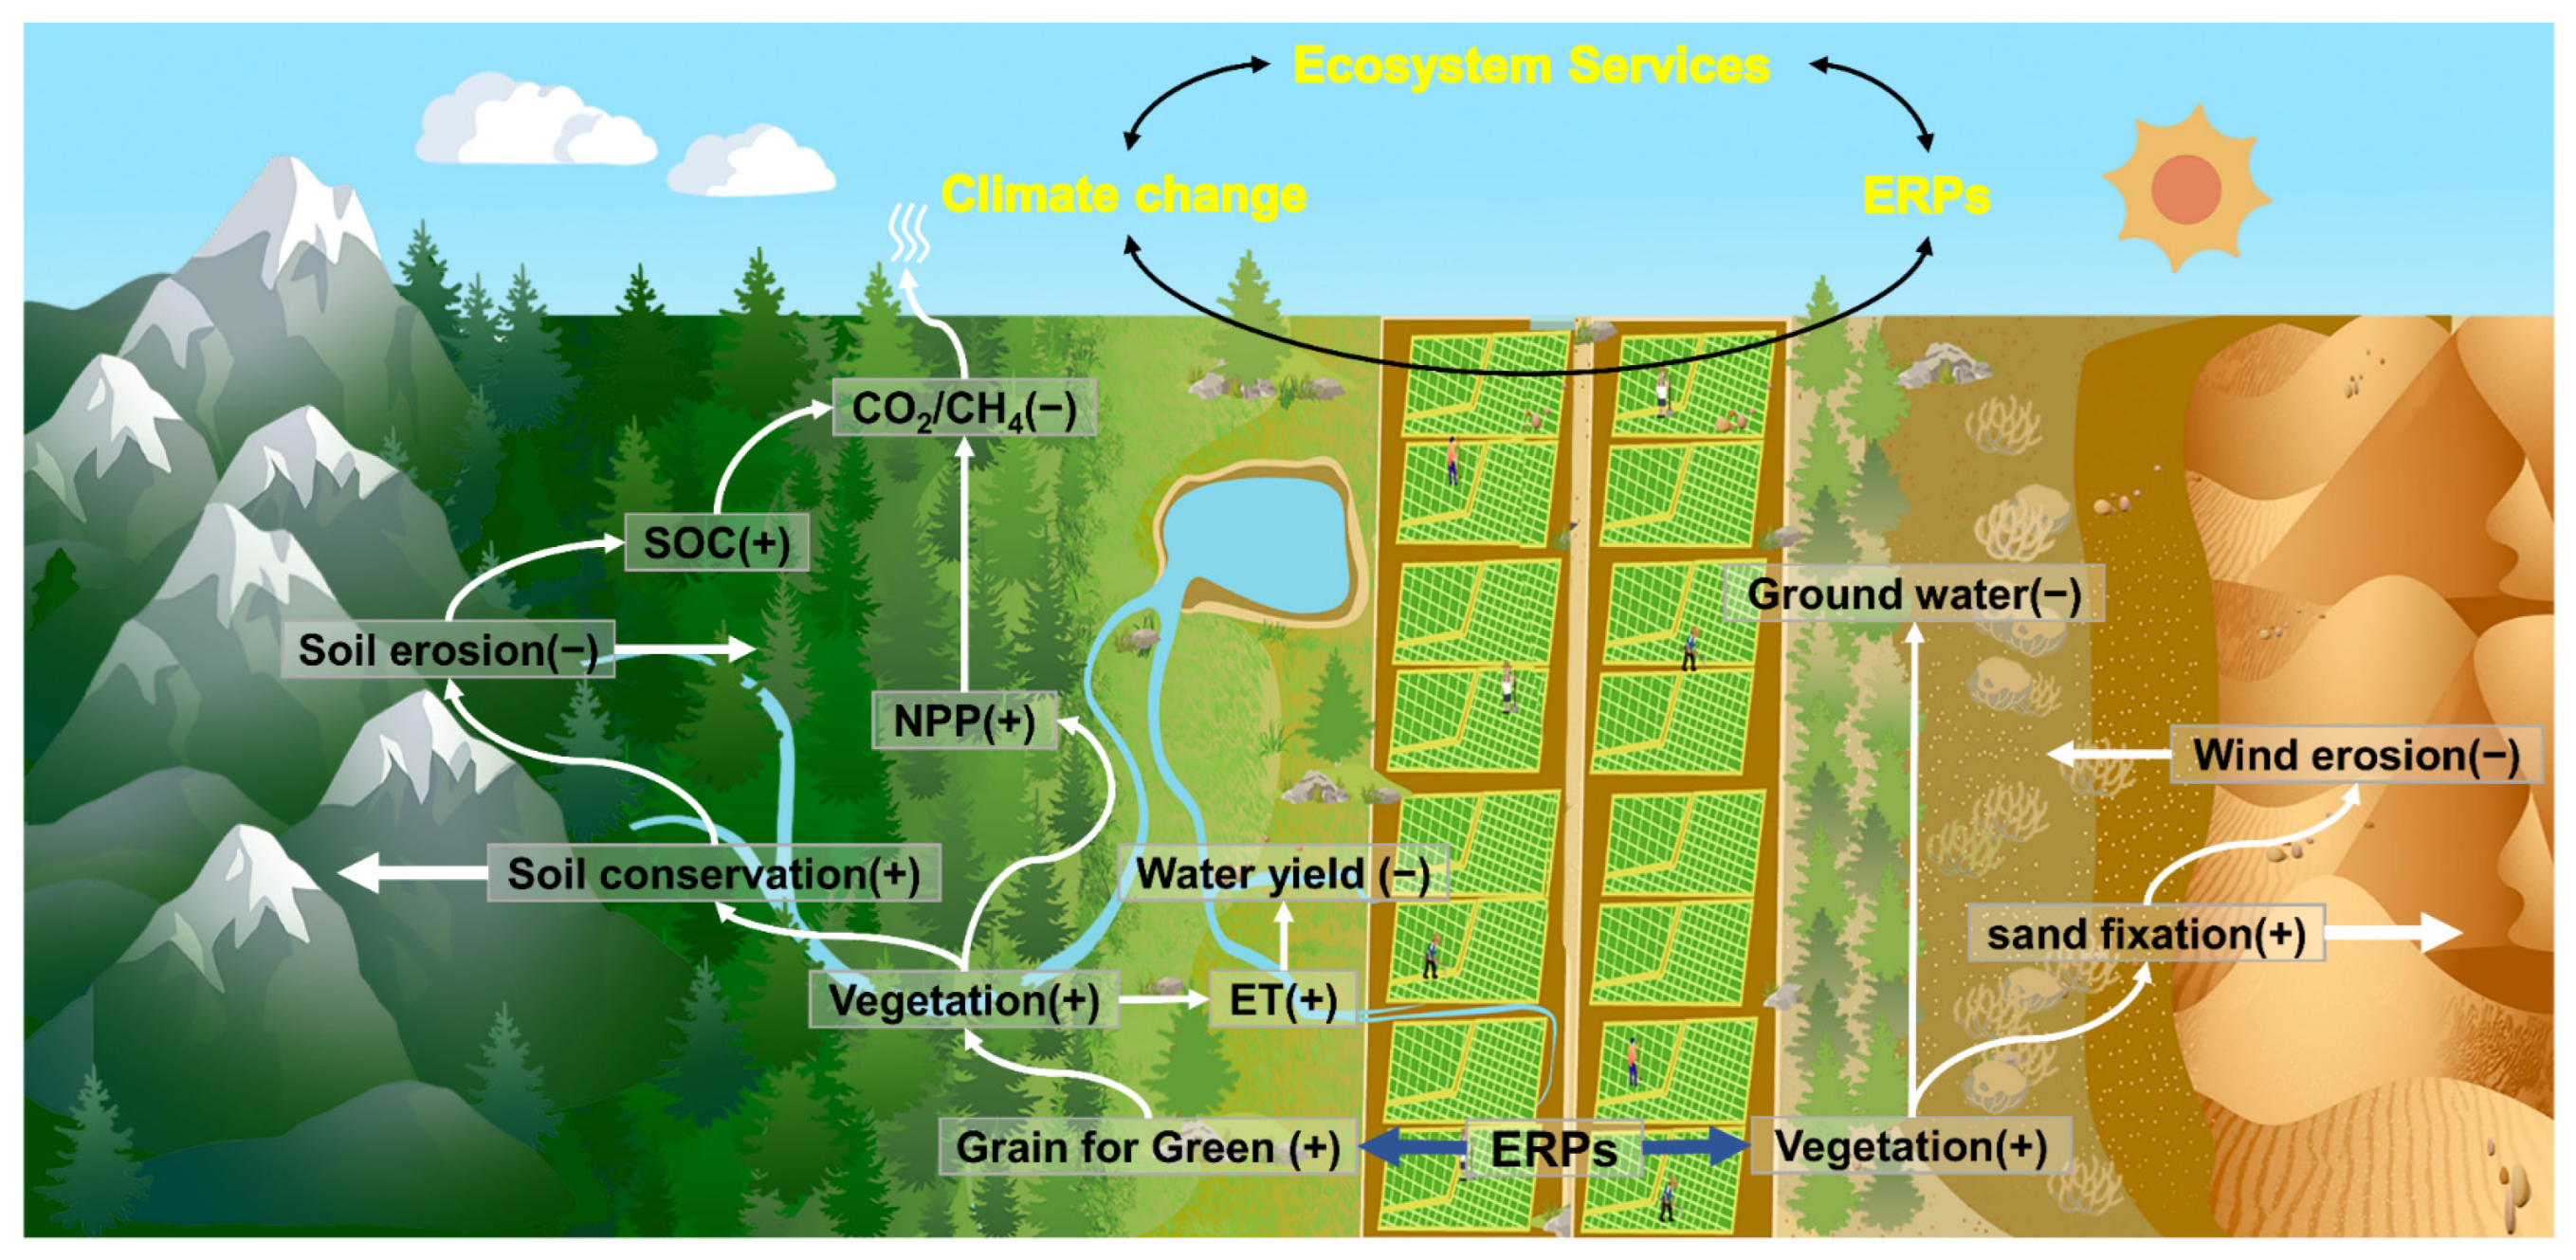
4.2. Feedback between ERPs, a Changing Climate, and Ecosystem Services (ESs)

In recent decades, the drylands of northern China have faced an escalating threat of desertification, and the loss of vegetation has exacerbated problems, such as soil wind erosion and soil water erosion. The main goal of several ERPs implemented in the drylands in China is vegetation restoration. This signifies that these ERPs play a crucial role in driving significant LULC changes. For example, the aim of the Three Northern Protected Forest Restoration Project is the regulation of desertification through afforestation [79], whereas the Grain for Green Program aims for ecological conservation through the conversion of farmland and barren hillsides to forests [80,81]. The establishment of these ERPs has undoubtedly improved the vegetation cover of drylands in China [82] and has considerably increased the capacity of vegetation for CS [83,84], which will alter biogeochemical and biogeophysical processes and mitigate global warming [85,86]. The current research identified a significant decline in SL and an increase in SF in the northeast (Figure 10), which are comparable the results of some different studies [33,38,76,78]. However, there was no significant impact of EE on SF in the arid western location. This outcome can perhaps be due to the limited resources of water in the area and the cultivation of vegetation unsuitable for arid environments, leading to an increase in groundwater consumption. The latter practice results in a low survival rate of cultivated vegetation as well as negative impacts on indigenous vegetation [87]. The third phase (2020–2050) of the Three Northern Protected Forest Restoration Project will focus on planting water-efficient and drought-tolerant vegetation that is more suitable for arid areas [88].
The implementation of ERPs can increase the ecological service functions of ecosystems. For example, eco-engineering improves air quality for areas experiencing wind-driven sand erosion [89]; the expansion of vegetation increases CS [90], thereby ameliorating climate changes [91]. The present study showed that ERPs increased ecological benefits, with increases in all three studied ESs (SC, SF, and CS), although there was a considerable trend of decreasing WY in some areas between 1990 and 2020. Some studies have found that ERPs resulted in unintended consequences [92]. For example, afforestation programs at a large-scale increased surface evaporation, decreased surface runoff, and increased groundwater depletion, resulting in increased competition for water resources between the ecosystem and locals [93]. Also, a study of the Chinese Loess Plateau showed that the re-vegetation program undermined the sustainable utilization of local water resources [94]. Therefore, careful consideration of local climatic conditions and technical management capacity is required before implementing ERPs, as well as the selection of vegetation adapted to local environmental conditions.

5. Conclusions

Ecological restoration programs affect regional ESs by changing land cover. Our study analyzed the alterations in the land cover in the sandy regions of North China since the large-scale implementation of an ecological project. The forest area of the region rose by 2.8 × 10⁴ km2 between 1990 and 2020, whereas the areas of cropland, shrubland, and grassland decreased. The spatiotemporal trends in the four studied ESs in the boreal sand region of China were, namely, SC, wind, SF, carbon sequestration (CS), and WY. The results showed increasing trends in all studied ESs, except for WY. However, this result considered the collective impacts of a changing climate and anthropogenic activities. The present study then distinguished between the impacts of eco-engineering and a changing climate on ESs by including average climate factors in the simulation model. The SC, SF, CS, and WY services increased by 30.77 t km−2 yr−1, 14.80 t km−2 yr−1, 41.28 g C m−2 yr−1, and 0.62 mm yr−1, respectively, in 2020 under the average climate scenario compared to the base year.
The structural equation modeling isolates the main factors regulating the combined benefits of ESs. The outcomes indicated that the land cover and vegetation alterations caused relatively sizable effects on ESs, with soil moisture among the climate factors having the greatest impact on ESs. Although vegetation expansion benefits ESs, the increased water consumption by vegetation results in the unsustainable use of arid-zone water resources. Hence, the implementation of ERPs needs to be preceded by a comprehensive consideration of the local environment and the development of sound implementation strategies.

Supplementary Materials

The following supporting information can be downloaded at: https://www.mdpi.com/article/10.3390/rs15143519/s1, Table S1: Descriptions of parameters for the Revised Universal Soil Loss Equation (RUSLE); Table S2: Descriptions of parameters for the revised wind erosion equation (RWEQ); Table S3: Descriptions of parameters for the Carnegie-Ames-Stanford approach (CASA) model; Table S4: Descriptions of parameters for the Water yield model; Table S5: Comparison of simulated. References [69,70,71,95,96] are cited in the supplementary materials

Author Contributions

Conceptualization, S.X.; methodology, S.X.; software, S.X. and X.M.; validation, X.M.; formal analysis, S.X.; investigation, Y.S., Y.L., Y.W., J.L., K.Q. and X.Y.; resources, S.X.; data curation, S.X.; writing—original draft preparation, S.X.; writing—review and editing, Y.S., Y.L., Y.W., J.L., K.Q., X.Y. and X.M.; resources, W.Y. and X.M.; visualization, Y.S., Y.L., Y.W., J.L., K.Q. and X.Y.; supervision, X.M.; funding acquisition, W.Y. and X.M. All authors have read and agreed to the published version of the manuscript.

Funding

This research was funded by the China Postdoctoral Science Foundation (2021M703470), the Open Project of Key Laboratory, Xinjiang Uygur Autonomous Region (2023D04073), the National Natural Science Foundation (42101302), and the Third Xinjiang Scientific Expedition Program (2021xjkk0903) for their sponsorship.

Data Availability Statement

Not applicable.

Acknowledgments

We want to thank the editor and anonymous reviewers for their valuable comments and suggestions to this paper.

Conflicts of Interest

The authors declare no conflict of interest.

References

  1. Costanza, R.; d’Arge, R.; De Groot, R.; Farber, S.; Grasso, M.; Hannon, B.; Limburg, K.; Naeem, S.; O’neill, R.V.; Paruelo, J. The value of the world’s ecosystem services and natural capital. Nature 1997, 387, 253–260. [Google Scholar] [CrossRef]
  2. Kremen, C. Managing ecosystem services: What do we need to know about their ecology? Ecol. Lett. 2005, 8, 468–479. [Google Scholar] [CrossRef]
  3. Millennium Ecosystem Assessment. Ecosystems and Human Well-Being; Island Press: Washington, DC, USA, 2005; Volume 5. [Google Scholar]
  4. Daily, G.C.; Matson, P.A. Ecosystem services: From theory to implementation. Proc. Natl. Acad. Sci. USA 2008, 105, 9455–9456. [Google Scholar] [CrossRef] [PubMed]
  5. Carpenter, S.R.; Mooney, H.A.; Agard, J.; Capistrano, D.; DeFries, R.S.; Díaz, S.; Dietz, T.; Duraiappah, A.K.; Oteng-Yeboah, A.; Pereira, H.M. Science for managing ecosystem services: Beyond the Millennium Ecosystem Assessment. Proc. Natl. Acad. Sci. USA 2009, 106, 1305–1312. [Google Scholar] [CrossRef]
  6. Costanza, R.; De Groot, R.; Sutton, P.; Van der Ploeg, S.; Anderson, S.J.; Kubiszewski, I.; Farber, S.; Turner, R.K. Changes in the global value of ecosystem services. Glob. Environ. Chang. 2014, 26, 152–158. [Google Scholar] [CrossRef]
  7. Hasan, S.S.; Zhen, L.; Miah, M.G.; Ahamed, T.; Samie, A. Impact of land use change on ecosystem services: A review. Environ. Dev. 2020, 34, 100527. [Google Scholar] [CrossRef]
  8. Mooney, H.; Larigauderie, A.; Cesario, M.; Elmquist, T.; Hoegh-Guldberg, O.; Lavorel, S.; Mace, G.M.; Palmer, M.; Scholes, R.; Yahara, T. Biodiversity, climate change, and ecosystem services. Curr. Opin. Environ. Sustain. 2009, 1, 46–54. [Google Scholar] [CrossRef]
  9. Scholes, R.J. Climate change and ecosystem services. Wiley Interdiscip. Rev. Clim. Chang. 2016, 7, 537–550. [Google Scholar] [CrossRef]
  10. Harris, J.A.; Hobbs, R.J.; Higgs, E.; Aronson, J. Ecological Restoration and Global Climate Change; Wiley Online Library: Hoboken, NJ, USA, 2006; Volume 14, pp. 170–176. [Google Scholar]
  11. Wood, S.L.; Jones, S.K.; Johnson, J.A.; Brauman, K.A.; Chaplin-Kramer, R.; Fremier, A.; Girvetz, E.; Gordon, L.J.; Kappel, C.V.; Mandle, L. Distilling the role of ecosystem services in the Sustainable Development Goals. Ecosyst. Serv. 2018, 29, 70–82. [Google Scholar] [CrossRef] [Green Version]
  12. Seppelt, R.; Dormann, C.F.; Eppink, F.V.; Lautenbach, S.; Schmidt, S. A quantitative review of ecosystem service studies: Approaches, shortcomings and the road ahead. J. Appl. Ecol. 2011, 48, 630–636. [Google Scholar] [CrossRef]
  13. Rounsevell, M.; Dawson, T.; Harrison, P. A conceptual framework to assess the effects of environmental change on ecosystem services. Biodivers. Conserv. 2010, 19, 2823–2842. [Google Scholar] [CrossRef]
  14. Weiskopf, S.R.; Rubenstein, M.A.; Crozier, L.G.; Gaichas, S.; Griffis, R.; Halofsky, J.E.; Hyde, K.J.; Morelli, T.L.; Morisette, J.T.; Muñoz, R.C. Climate change effects on biodiversity, ecosystems, ecosystem services, and natural resource management in the United States. Sci. Total Environ. 2020, 733, 137782. [Google Scholar] [CrossRef] [PubMed]
  15. Tao, W. Aeolian desertification and its control in Northern China. Int. Soil Water Conserv. Res. 2014, 2, 34–41. [Google Scholar] [CrossRef] [Green Version]
  16. Song, S.; Yu, D.; Li, X. Impacts of changes in climate and landscape pattern on soil conservation services in a dryland landscape. CATENA 2023, 222, 106869. [Google Scholar] [CrossRef]
  17. Li, J.; Ma, X.; Zhang, C. Predicting the spatiotemporal variation in soil wind erosion across Central Asia in response to climate change in the 21st century. Sci. Total Environ. 2020, 709, 136060. [Google Scholar] [CrossRef] [PubMed]
  18. Dou, X.; Ma, X.; Huo, T.; Zhu, J.; Zhao, C. Assessment of the environmental effects of ecological water conveyance over 31 years for a terminal lake in Central Asia. CATENA 2022, 208, 105725. [Google Scholar] [CrossRef]
  19. Ma, X.; Zhu, J.; Yan, W.; Zhao, C. Projections of desertification trends in Central Asia under global warming scenarios. Sci. Total Environ. 2021, 781, 146777. [Google Scholar] [CrossRef] [PubMed]
  20. Nunes, A.; Oliveira, G.; Mexia, T.; Valdecantos, A.; Zucca, C.; Costantini, E.A.; Abraham, E.M.; Kyriazopoulos, A.P.; Salah, A.; Prasse, R. Ecological restoration across the Mediterranean Basin as viewed by practitioners. Sci. Total Environ. 2016, 566, 722–732. [Google Scholar] [CrossRef] [Green Version]
  21. Winkler, D.E.; Backer, D.M.; Belnap, J.; Bradford, J.B.; Butterfield, B.J.; Copeland, S.M.; Duniway, M.C.; Faist, A.M.; Fick, S.E.; Jensen, S.L. Beyond traditional ecological restoration on the Colorado Plateau. Restor. Ecol. 2018, 26, 1055–1060. [Google Scholar] [CrossRef] [Green Version]
  22. Wang, T.; Wu, W.; Xue, X.; Sun, Q.; Chen, G. Study of spatial distribution of sandy desertification in North China in recent 10 years. Sci. China Ser. D Earth Sci. 2004, 47, 78–88. [Google Scholar] [CrossRef]
  23. Zhu, Z.; Wang, T. Trends of desertification and its rehabilitation in China. Desertif. Control Bull. 1993, 22, 27–30. [Google Scholar]
  24. Yang, X.; Zhang, K.; Jia, B.; Ci, L. Desertification assessment in China: An overview. J. Arid Environ. 2005, 63, 517–531. [Google Scholar] [CrossRef]
  25. Wang, T.; Xue, X.; Zhou, L.; Guo, J. Combating aeolian desertification in northern China. Land Degrad. Dev. 2015, 26, 118–132. [Google Scholar] [CrossRef]
  26. Bryan, B.A.; Gao, L.; Ye, Y.; Sun, X.; Connor, J.D.; Crossman, N.D.; Stafford-Smith, M.; Wu, J.; He, C.; Yu, D. China’s response to a national land-system sustainability emergency. Nature 2018, 559, 193–204. [Google Scholar] [CrossRef]
  27. Ouyang, Z.; Zheng, H.; Xiao, Y.; Polasky, S.; Liu, J.; Xu, W.; Wang, Q.; Zhang, L.; Xiao, Y.; Rao, E. Improvements in ecosystem services from investments in natural capital. Science 2016, 352, 1455–1459. [Google Scholar] [CrossRef]
  28. Li, Z.; Wang, S.; Li, C.; Ye, C.; Gao, D.; Chen, P. The trend shift caused by ecological restoration accelerates the vegetation greening of China’s drylands since the 1980s. Environ. Res. Lett. 2022, 17, 044062. [Google Scholar] [CrossRef]
  29. Piao, S.; Wang, X.; Park, T.; Chen, C.; Lian, X.; He, Y.; Bjerke, J.W.; Chen, A.; Ciais, P.; Tømmervik, H. Characteristics, drivers and feedbacks of global greening. Nat. Rev. Earth Environ. 2020, 1, 14–27. [Google Scholar] [CrossRef] [Green Version]
  30. Li, Y.; Li, Y.; Fang, B.; Wang, Q.; Chen, Z. Impacts of ecological programs on land use and ecosystem services since the 1980s: A case-study of a typical catchment on the Loess Plateau, China. Land Degrad. Dev. 2022, 33, 3271–3282. [Google Scholar] [CrossRef]
  31. Jiang, C.; Nath, R.; Labzovskii, L.; Wang, D. Integrating ecosystem services into effectiveness assessment of ecological restoration program in northern China’s arid areas: Insights from the Beijing-Tianjin Sandstorm Source Region. Land Use Policy 2018, 75, 201–214. [Google Scholar] [CrossRef]
  32. Xie, S.; Mo, X.; Hu, S.; Liu, S. Contributions of climate change, elevated atmospheric CO2 and human activities to ET and GPP trends in the Three-North Region of China. Agric. For. Meteorol. 2020, 295, 108183. [Google Scholar] [CrossRef]
  33. Du, H.; Liu, X.; Jia, X.; Li, S.; Fan, Y. Assessment of the effects of ecological restoration projects on soil wind erosion in northern China in the past two decades. CATENA 2022, 215, 106360. [Google Scholar] [CrossRef]
  34. Du, H.; Dou, S.; Deng, X.; Xue, X.; Wang, T. Assessment of wind and water erosion risk in the watershed of the Ningxia-Inner Mongolia Reach of the Yellow River, China. Ecol. Indic. 2016, 67, 117–131. [Google Scholar] [CrossRef]
  35. Jiang, C.; Zhang, H.; Zhang, Z.; Wang, D. Model-based assessment soil loss by wind and water erosion in China’s Loess Plateau: Dynamic change, conservation effectiveness, and strategies for sustainable restoration. Glob. Planet. Chang. 2019, 172, 396–413. [Google Scholar] [CrossRef]
  36. Guo, X.; Shao, Q. Spatial pattern of soil erosion drivers and the contribution rate of human activities on the Loess Plateau from 2000 to 2015: A boundary line from northeast to southwest. Remote Sens. 2019, 11, 2429. [Google Scholar] [CrossRef] [Green Version]
  37. Cao, S.; Chen, L.; Shankman, D.; Wang, C.; Wang, X.; Zhang, H. Excessive reliance on afforestation in China’s arid and semi-arid regions: Lessons in ecological restoration. Earth-Sci. Rev. 2011, 104, 240–245. [Google Scholar] [CrossRef]
  38. Jiang, C.; Zhang, H.; Zhao, L.; Yang, Z.; Wang, X.; Yang, L.; Wen, M.; Geng, S.; Zeng, Q.; Wang, J. Unfolding the effectiveness of ecological restoration programs in combating land degradation: Achievements, causes, and implications. Sci. Total Environ. 2020, 748, 141552. [Google Scholar] [CrossRef] [PubMed]
  39. Shen, Y.; Zhang, C.; Wang, X.; Zou, X.; Kang, L. Statistical characteristics of wind erosion events in the erosion area of Northern China. CATENA 2018, 167, 399–410. [Google Scholar] [CrossRef]
  40. Fu, B.; Liu, Y.; Lü, Y.; He, C.; Zeng, Y.; Wu, B. Assessing the soil erosion control service of ecosystems change in the Loess Plateau of China. Ecol. Complex. 2011, 8, 284–293. [Google Scholar] [CrossRef]
  41. Xu, S.; Wang, X.; Ma, X.; Gao, S. Risk Assessment and Prediction of Soil Water Erosion on the Middle Northern Slope of Tianshan Mountain. Sustainability 2023, 15, 4826. [Google Scholar] [CrossRef]
  42. Xie, Y.; Lin, H.; Ye, Y.; Ren, X. Changes in soil erosion in cropland in northeastern China over the past 300 years. CATENA 2019, 176, 410–418. [Google Scholar] [CrossRef]
  43. Duan, H.; Yan, C.; Tsunekawa, A.; Song, X.; Li, S.; Xie, J. Assessing vegetation dynamics in the Three-North Shelter Forest region of China using AVHRR NDVI data. Environ. Earth Sci. 2011, 64, 1011–1020. [Google Scholar] [CrossRef]
  44. Amjad, M.; Yilmaz, M.T.; Yucel, I.; Yilmaz, K.K. Performance evaluation of satellite-and model-based precipitation products over varying climate and complex topography. J. Hydrol. 2020, 584, 124707. [Google Scholar] [CrossRef]
  45. Muñoz-Sabater, J.; Dutra, E.; Agustí-Panareda, A.; Albergel, C.; Arduini, G.; Balsamo, G.; Boussetta, S.; Choulga, M.; Harrigan, S.; Hersbach, H. ERA5-Land: A state-of-the-art global reanalysis dataset for land applications. Earth Syst. Sci. Data 2021, 13, 4349–4383. [Google Scholar] [CrossRef]
  46. Xu, J.; Ma, Z.; Yan, S.; Peng, J. Do ERA5 and ERA5-land precipitation estimates outperform satellite-based precipitation products? A comprehensive comparison between state-of-the-art model-based and satellite-based precipitation products over mainland China. J. Hydrol. 2022, 605, 127353. [Google Scholar] [CrossRef]
  47. Su, T.; Sun, S.; Wang, S.; Xie, D.; Li, S.; Huang, B.; Ma, Q.; Qian, Z.; Feng, G.; Feng, T. Spatiotemporal Variation of Actual Evapotranspiration and Its Relationship with Precipitation in Northern China under Global Warming. Remote Sens. 2022, 14, 4554. [Google Scholar] [CrossRef]
  48. Zeng, J.; Yuan, X.; Ji, P.; Shi, C. Effects of meteorological forcings and land surface model on soil moisture simulation over China. J. Hydrol. 2021, 603, 126978. [Google Scholar] [CrossRef]
  49. Jiang, K.; Pan, Z.; Pan, F.; Wang, J.; Han, G.; Song, Y.; Zhang, Z.; Huang, N.; Ma, S.; Chen, X. Influence patterns of soil moisture change on surface-air temperature difference under different climatic background. Sci. Total Environ. 2022, 822, 153607. [Google Scholar] [CrossRef] [PubMed]
  50. Dai, L.; Che, T.; Ding, Y. Inter-calibrating SMMR, SSM/I and SSMI/S data to improve the consistency of snow-depth products in China. Remote Sens. 2015, 7, 7212–7230. [Google Scholar] [CrossRef] [Green Version]
  51. Martens, B.; Miralles, D.G.; Lievens, H.; Van Der Schalie, R.; De Jeu, R.A.; Fernández-Prieto, D.; Beck, H.E.; Dorigo, W.A.; Verhoest, N.E. GLEAM v3: Satellite-based land evaporation and root-zone soil moisture. Geosci. Model Dev. 2017, 10, 1903–1925. [Google Scholar] [CrossRef] [Green Version]
  52. Miralles, D.G.; Holmes, T.; De Jeu, R.; Gash, J.; Meesters, A.; Dolman, A. Global land-surface evaporation estimated from satellite-based observations. Hydrol. Earth Syst. Sci. 2011, 15, 453–469. [Google Scholar] [CrossRef] [Green Version]
  53. Tian, F.; Fensholt, R.; Verbesselt, J.; Grogan, K.; Horion, S.; Wang, Y. Evaluating temporal consistency of long-term global NDVI datasets for trend analysis. Remote Sens. Environ. 2015, 163, 326–340. [Google Scholar] [CrossRef]
  54. Yang, J.; Huang, X. The 30 m annual land cover dataset and its dynamics in China from 1990 to 2019. Earth Syst. Sci. Data 2021, 13, 3907–3925. [Google Scholar] [CrossRef]
  55. Renard, K.G.; Foster, G.R.; Weesies, G.A.; Porter, J.P. RUSLE: Revised universal soil loss equation. J. Soil Water Conserv. 1991, 46, 30–33. [Google Scholar]
  56. Ma, X.; Zhao, C.; Zhu, J. Aggravated risk of soil erosion with global warming–A global meta-analysis. CATENA 2021, 200, 105129. [Google Scholar] [CrossRef]
  57. Dou, X.; Ma, X.; Zhao, C.; Li, J.; Yan, Y.; Zhu, J. Risk assessment of soil erosion in Central Asia under global warming. CATENA 2022, 212, 106056. [Google Scholar] [CrossRef]
  58. Ganasri, B.; Ramesh, H. Assessment of soil erosion by RUSLE model using remote sensing and GIS-A case study of Nethravathi Basin. Geosci. Front. 2016, 7, 953–961. [Google Scholar] [CrossRef] [Green Version]
  59. Fryrear, D.; Bilbro, J.; Saleh, A.; Schomberg, H.; Stout, J.; Zobeck, T. RWEQ: Improved wind erosion technology. J. Soil Water Conserv. 2000, 55, 183–189. [Google Scholar]
  60. Youssef, F.; Visser, S.; Karssenberg, D.; Bruggeman, A.; Erpul, G. Calibration of RWEQ in a patchy landscape; a first step towards a regional scale wind erosion model. Aeolian Res. 2012, 3, 467–476. [Google Scholar] [CrossRef] [Green Version]
  61. Yang, G.; Sun, R.; Jing, Y.; Xiong, M.; Li, J.; Chen, L. Global assessment of wind erosion based on a spatially distributed RWEQ model. Prog. Phys. Geogr. Earth Environ. 2022, 46, 28–42. [Google Scholar] [CrossRef]
  62. Buschiazzo, D.E.; Zobeck, T.M. Validation of WEQ, RWEQ and WEPS wind erosion for different arable land management systems in the Argentinean Pampas. Earth Surf. Process. Landf. J. Br. Geomorphol. Res. Group 2008, 33, 1839–1850. [Google Scholar] [CrossRef]
  63. Melillo, J.M.; McGuire, A.D.; Kicklighter, D.W.; Moore, B.; Vorosmarty, C.J.; Schloss, A.L. Global climate change and terrestrial net primary production. Nature 1993, 363, 234–240. [Google Scholar] [CrossRef]
  64. Monteith, J.L. Solar radiation and productivity in tropical ecosystems. J. Appl. Ecol. 1972, 9, 747–766. [Google Scholar] [CrossRef] [Green Version]
  65. Yu, D.; Shi, P.; Shao, H.; Zhu, W.; Pan, Y. Modelling net primary productivity of terrestrial ecosystems in East Asia based on an improved CASA ecosystem model. Int. J. Remote Sens. 2009, 30, 4851–4866. [Google Scholar] [CrossRef]
  66. Redhead, J.; Stratford, C.; Sharps, K.; Jones, L.; Ziv, G.; Clarke, D.; Oliver, T.; Bullock, J. Empirical validation of the InVEST water yield ecosystem service model at a national scale. Sci. Total Environ. 2016, 569, 1418–1426. [Google Scholar] [CrossRef] [Green Version]
  67. Xu, X.; Liu, W.; Scanlon, B.R.; Zhang, L.; Pan, M. Local and global factors controlling water-energy balances within the Budyko framework. Geophys. Res. Lett. 2013, 40, 6123–6129. [Google Scholar] [CrossRef]
  68. Shi, P.; Zhang, Y.; Li, Z.; Li, P.; Xu, G. Influence of land use and land cover patterns on seasonal water quality at multi-spatial scales. CATENA 2017, 151, 182–190. [Google Scholar] [CrossRef]
  69. Zhang, H.; Fan, J.; Cao, W.; Harris, W.; Li, Y.; Chi, W.; Wang, S. Response of wind erosion dynamics to climate change and human activity in Inner Mongolia, China during 1990 to 2015. Sci. Total Environ. 2018, 639, 1038–1050. [Google Scholar] [CrossRef]
  70. Li, J.; He, H.; Zeng, Q.; Chen, L.; Sun, R. A Chinese soil conservation dataset preventing soil water erosion from 1992 to 2019. Sci. Data 2023, 10, 319. [Google Scholar] [CrossRef]
  71. Li, Y.; Chen, P.; Niu, Y.; Liang, Y.; Wei, T. Dynamics and attributions of ecosystem water yields in China from 2001 to 2020. Ecol. Indic. 2022, 143, 109373. [Google Scholar] [CrossRef]
  72. Ullman, J.B.; Bentler, P.M. Structural equation modeling. In Handbook of Psychology, 2nd ed.; John Wiley & Sons, Inc.: Hoboken, NJ, USA, 2012; Volume 2. [Google Scholar]
  73. Hou, D.; Al-Tabbaa, A.; Chen, H.; Mamic, I. Factor analysis and structural equation modelling of sustainable behaviour in contaminated land remediation. J. Clean. Prod. 2014, 84, 439–449. [Google Scholar] [CrossRef]
  74. Fan, Y.; Chen, J.; Shirkey, G.; John, R.; Wu, S.R.; Park, H.; Shao, C. Applications of structural equation modeling (SEM) in ecological studies: An updated review. Ecol. Process. 2016, 5, 19. [Google Scholar] [CrossRef] [Green Version]
  75. Liu, Y.; Lü, Y.; Fu, B.; Harris, P.; Wu, L. Quantifying the spatio-temporal drivers of planned vegetation restoration on ecosystem services at a regional scale. Sci. Total Environ. 2019, 650, 1029–1040. [Google Scholar] [CrossRef] [PubMed]
  76. Chi, W.; Zhao, Y.; Kuang, W.; He, H. Impacts of anthropogenic land use/cover changes on soil wind erosion in China. Sci. Total Environ. 2019, 668, 204–215. [Google Scholar] [CrossRef]
  77. Li, D.; Xu, D.; Wang, Z.; You, X.; Zhang, X.; Song, A. The dynamics of sand-stabilization services in Inner Mongolia, China from 1981 to 2010 and its relationship with climate change and human activities. Ecol. Indic. 2018, 88, 351–360. [Google Scholar] [CrossRef]
  78. Wu, J.; Zheng, X.; Zhao, L.; Fan, J.; Liu, J. Effects of Ecological Programs and Other Factors on Soil Wind Erosion between 1981–2020. Remote Sens. 2022, 14, 5322. [Google Scholar] [CrossRef]
  79. Zhang, Y.; Peng, C.; Li, W.; Tian, L.; Zhu, Q.; Chen, H.; Fang, X.; Zhang, G.; Liu, G.; Mu, X. Multiple afforestation programs accelerate the greenness in the ‘Three North’region of China from 1982 to 2013. Ecol. Indic. 2016, 61, 404–412. [Google Scholar] [CrossRef]
  80. Deng, L.; Liu, G.b.; Shangguan, Z.p. Land-use conversion and changing soil carbon stocks in C hina’s ‘Grain-for-Green’Program: A synthesis. Glob. Chang. Biol. 2014, 20, 3544–3556. [Google Scholar] [CrossRef]
  81. Lei, D.; Shangguan, Z.-P.; Rui, L. Effects of the grain-for-green program on soil erosion in China. Int. J. Sediment Res. 2012, 27, 120–127. [Google Scholar]
  82. Li, C.; Fu, B.; Wang, S.; Stringer, L.C.; Wang, Y.; Li, Z.; Liu, Y.; Zhou, W. Drivers and impacts of changes in China’s drylands. Nat. Rev. Earth Environ. 2021, 2, 858–873. [Google Scholar] [CrossRef]
  83. Lu, F.; Hu, H.; Sun, W.; Zhu, J.; Liu, G.; Zhou, W.; Zhang, Q.; Shi, P.; Liu, X.; Wu, X. Effects of national ecological restoration projects on carbon sequestration in China from 2001 to 2010. Proc. Natl. Acad. Sci. USA 2018, 115, 4039–4044. [Google Scholar] [CrossRef] [Green Version]
  84. Tong, X.; Brandt, M.; Yue, Y.; Horion, S.; Wang, K.; Keersmaecker, W.D.; Tian, F.; Schurgers, G.; Xiao, X.; Luo, Y. Increased vegetation growth and carbon stock in China karst via ecological engineering. Nat. Sustain. 2018, 1, 44–50. [Google Scholar] [CrossRef]
  85. Swann, A.L.; Fung, I.Y.; Chiang, J.C. Mid-latitude afforestation shifts general circulation and tropical precipitation. Proc. Natl. Acad. Sci. USA 2012, 109, 712–716. [Google Scholar] [CrossRef] [PubMed]
  86. Zeng, Z.; Piao, S.; Li, L.Z.; Zhou, L.; Ciais, P.; Wang, T.; Li, Y.; Lian, X.; Wood, E.F.; Friedlingstein, P. Climate mitigation from vegetation biophysical feedbacks during the past three decades. Nat. Clim. Chang. 2017, 7, 432–436. [Google Scholar] [CrossRef]
  87. Cao, S. Why Large-Scale Afforestation Efforts in China Have Failed to Solve the Desertification Problem; ACS Publications: Washington, DC, USA, 2008. [Google Scholar]
  88. Chu, X.; Zhan, J.; Li, Z.; Zhang, F.; Qi, W. Assessment on forest carbon sequestration in the Three-North Shelterbelt Program region, China. J. Clean. Prod. 2019, 215, 382–389. [Google Scholar] [CrossRef]
  89. Song, S.; Zhang, Y.; Cao, W.; Xu, D. Ecological restoration can enhance the radiation benefit of sand fixation service: A simulated evidence of Xilingol League, China. J. Environ. Manag. 2023, 328, 116947. [Google Scholar] [CrossRef] [PubMed]
  90. Piao, S.; Fang, J.; Ciais, P.; Peylin, P.; Huang, Y.; Sitch, S.; Wang, T. The carbon balance of terrestrial ecosystems in China. Nature 2009, 458, 1009–1013. [Google Scholar] [CrossRef]
  91. Bonan, G.B.; Pollard, D.; Thompson, S.L. Effects of boreal forest vegetation on global climate. Nature 1992, 359, 716–718. [Google Scholar] [CrossRef]
  92. Wang, X.; Ge, Q.; Geng, X.; Wang, Z.; Gao, L.; Bryan, B.A.; Chen, S.; Su, Y.; Cai, D.; Ye, J. Unintended consequences of combating desertification in China. Nat. Commun. 2023, 14, 1139. [Google Scholar] [CrossRef]
  93. Menz, M.H.; Dixon, K.W.; Hobbs, R.J. Hurdles and opportunities for landscape-scale restoration. Science 2013, 339, 526–527. [Google Scholar] [CrossRef]
  94. Feng, X.; Fu, B.; Piao, S.; Wang, S.; Ciais, P.; Zeng, Z.; Lü, Y.; Zeng, Y.; Li, Y.; Jiang, X. Revegetation in China’s Loess Plateau is approaching sustainable water resource limits. Nat. Clim. Chang. 2016, 6, 1019–1022. [Google Scholar] [CrossRef]
  95. Teng, H.; Liang, Z.; Chen, S.; Liu, Y.; Rossel, R.A.V.; Chappell, A.; Yu, W.; Shi, Z. Current and future assessments of soil erosion by water on the Tibetan Plateau based on RUSLE and CMIP5 climate models. Sci. Total Environ. 2018, 635, 673–686. [Google Scholar] [CrossRef] [PubMed]
  96. Ma, X.; Zhu, J.; Yan, W.; Zhao, C. Assessment of soil conservation services of four river basins in Central Asia under global warming scenarios. Geoderma 2020, 375, 114533. [Google Scholar] [CrossRef]
Figure 1. Geographical characterization of the Three Northern Protected Forests Program (TNR). (a) Location and spatial distributions of elevation of the TNR; (b) spatial distributions of the main types of land cover in 2010 and the four climatic sub-regions: Ⅰ, Arid zones; Ⅱ, Semi-Arid zones; Ⅲ, Semi-humid zones; Ⅳ, Humid zones.
Remotesensing 15 03519 g001
Figure 2. The methodological framework used in the present study. The process represented in the flow diagram focused on eliminating confounding factors, such as climate, when evaluating the impact of environmental engineering on ESs.
Remotesensing 15 03519 g002
Figure 3. Land use and cover change (LUCC) within the Three Northern Protected Forests Program (TNR) between 1990 and 2020. (a) The transfer in land use/land cover (LULC); (b) and net alteration in LULC area. K and M denote kilo and million, respectively.
Remotesensing 15 03519 g003
Figure 4. Soil erosion (erosion caused by wind and water) and the distributions over space of the four main ESs within the Three Northern Protected Forests Program (TNR). (a) SE, soil water erosion; (b) SC, soil conservation services; (c) SL, soil wind erosion; (d) SF, sand fixation services; (e) NPP, net primary production (CS, carbon sequestration) services; (f) WY, water yield services.
Remotesensing 15 03519 g004
Figure 5. Temporal variations in the main ESs in the Three Northern Protected Forests Program (TNR) under different climate zones. (a) SC services; (b) SF services; (c) NPP production (CS, carbon sequestration) services; (d) WY—water yield (water production) services.
Remotesensing 15 03519 g005
Figure 6. Spatial variabilities in the four ESs within the Three Northern Protected Forests Program (TNR) region (left, (a,c,e,g)) and their significance (right, (b,d,f,h)). (a) SC service; (c) SF service; (e) NPP production (CS, carbon sequestration) service; (g) WY—water yield service.
Remotesensing 15 03519 g006
Figure 7. Differences in the four main ESs in the Three Northern Protected Forests Program region (TNR) from the base year to 2020 under a constant climate factor scenario.
Remotesensing 15 03519 g007
Figure 8. Spatial differences in four ESs in the Three Northern Protected Forests Program (TNR) region in 2020 and the base year under a constant climate factor scenario. (a) SC services; (b) SF services; (c) NPP production (CS, carbon sequestration) services; (d) WY—water yield services. ERP represents an ecological restoration program.
Remotesensing 15 03519 g008
Figure 9. Spatial trends in overall benefits (OB) of ESs and a multi-element structural equation model. (a) The trend in the spatial variation of OB; (b) the structural equation model between OB and other environmental factors. The red and blue lines are indicative of negative and positive impacts, respectively, whereas the thicknesses of the lines are proportional to the coefficient magnitudes. Pre-annual precipitation; SM—soil moisture; Temp—annual mean temperature; Wind—annual mean wind speed.
Remotesensing 15 03519 g009
Figure 10. Conceptual map of feedback between ESs and climate change in the implementation of ecological restoration programs (ERPs). Corresponding symbols in brackets “+”, and “−” indicate increasing and decreasing trends, respectively. SOC—soil organic carbon; ET—land surface evapotranspiration; NPP—net primary production.
Remotesensing 15 03519 g010
Table 1. Data utilized in the present research.
NameTemporal ResolutionSpatial ResolutionPeriodResource
TemperatureDaily0.1° × 0.1°1982–2020ERA5-land
Precipitation
Wind speed
Total solar radiation
Soil moisture
Snow depthDaily0.25° × 0.25°1982–2020Long-term daily snow depth for China
Potential evapotranspirationMonth0.25° × 0.25°1982–2020GLEAM v3.6 datasets
NDVI15 d8 km1982–2015GIMMS-NDVI3g
16 d1 km2001–2020MOD13A2
Land coverAnnual30 m1990–2020China land cover dataset
DEM datasetN/A30 m2019ASTER GDEM V3
Soil datasetN/A1 km2013HWSD V1.2
Note: N/A indicates data with no temporal resolution.
Disclaimer/Publisher’s Note: The statements, opinions and data contained in all publications are solely those of the individual author(s) and contributor(s) and not of MDPI and/or the editor(s). MDPI and/or the editor(s) disclaim responsibility for any injury to people or property resulting from any ideas, methods, instructions or products referred to in the content.

