Article

E-Agriculture Planning Tool for Supporting Smallholder Cocoa Intensification Using Remotely Sensed Data

1
Sydney Institute of Agriculture, School of Life and Environmental Sciences, The University of Sydney, Sydney, NSW 2015, Australia
2
Facultad de Ciencias Físicas y Matemáticas, Universidad de Chile, Santiago 8330111, Chile
3
Cocoa Board of Papua New Guinea, Head Office, Kokopo P.O. Box 532, Papua New Guinea
4
The James Hutton Institute, Craigiebuckler, Aberdeen AB15 8QH, UK
*
Author to whom correspondence should be addressed.
Remote Sens. 2023, 15(14), 3492; https://doi.org/10.3390/rs15143492
Submission received: 7 May 2023 / Revised: 22 June 2023 / Accepted: 7 July 2023 / Published: 11 July 2023

Abstract

:
Remote sensing approaches are often used to monitor land cover change. However, the small physical size (about 1–2 hectare area) of smallholder orchards and the cultivation of cocoa (Theobroma cocoa L.) under shade trees make the use of many popular satellite sensors inefficient to distinguish cocoa orchards from forest areas. Nevertheless, high-resolution satellite imagery combined with novel signal extraction methods facilitates the differentiation of coconut palms (Cocos nucifera L.) from forests. Cocoa grows well under established coconut shade, and underplanting provides a viable opportunity to intensify production and meet demand and government targets. In this study, we combined grey-level co-occurrence matrix (GLCM) textural features and vegetation indices from Sentinel datasets to evaluate the sustainability of cocoa expansion given land suitability for agriculture and soil capability classes. Additionally, it sheds light on underexploited areas with agricultural potential. The mapping of areas where cocoa smallholder orchards already exist or can be grown involved three main components. Firstly, the use of the fine-resolution C-band synthetic aperture radar and multispectral instruments from Sentinel-1 and Sentinel-2 satellites, respectively. Secondly, the processing of imagery (Sentinel-1 and Sentinel-2) for feature extraction using 22 variables. Lastly, fitting a random forest (RF) model to detect and distinguish potential cocoa orchards from non-cocoa areas. The RF classification scheme differentiated cocoa (for consistency, the coconut–cocoa areas in this manuscript will be referred to as cocoa regions or orchards) and non-cocoa regions with 97 percent overall accuracy and over 90 percent producer’s and user’s accuracies for the cocoa regions when trained on a combination of spectral indices and GLCM textural feature sets. The top five variables that contributed the most to the model were the red band (B4), red edge curve index (RECI), blue band (B2), near-infrared (NIR) entropy, and enhanced vegetation index (EVI), indicating the importance of vegetation indices and entropy values. By comparing the classified map created in this study with the soil and land capability legacy information of Bougainville, we observed that potential cocoa regions are already rated as highly suitable. This implies that cocoa expansion has reached one of many intersecting limits, including land suitability, political, social, economic, educational, health, labour, and infrastructure. Understanding how these interactions limit cocoa productivity at present will inform further sustainable growth. The tool provides inexpensive and rapid monitoring of land use, suitable for a sustainable planning framework that supports responsible agricultural land use management. The study developed a heuristic tool for monitoring land cover changes for cocoa production, informing sustainable development that balances the needs and aspirations of the government and farming communities with the protection of the environment.

1. Introduction

The Autonomous Region of Bougainville (Bougainville) is the easternmost island of Papua New Guinea (PNG). The economy depends on subsistence agriculture, cash crops, including coconut and cocoa, and small-scale mining (https://bougainvillenews.files.wordpress.com/2018/06/bougainville-strategic-plan-2018-2022.pdf (accessed on 19 July 2021)). To meet the ambitious targets set by PNG’s government [1], opportunities for cocoa production need a kickstart by establishing an E-agriculture strategy (E-Ag strategy) that promotes balanced land use for sustainable economic, social, and environmental development [2]. This renewed focus on cocoa production should prioritise intensification, aiming for increased yield per hectare rather than expansion through deforestation [3]. Cocoa thrives under established coconut palm shade, making cocoa expansion within existing coconut plantations a viable intensification opportunity. Further, it has been reported that coconut plantations can be distinguished [4] from forested areas with ease, unlike cocoa smallholder orchards that are difficult to distinguish from other vegetation covers, such as natural forest [5]. Therefore, we hypothesise that remote sensing can help distinguish areas where cocoa is established or where it can potentially be grown by classifying areas under coconut palm. In this manuscript, the coconut–cocoa areas will be referred to as potential cocoa regions or orchards for consistency.
Numerous studies have investigated land cover classification at local, regional, and global scales using remote sensing (RS) platforms to extract valuable information and capture land cover changes. For large-scale crop type mapping, studies have focused on using the Moderate Resolution Imaging Spectroradiometer (MODIS) [6,7,8,9,10], which provides high temporal resolution and potential daily monitoring of land use changes. However, the spatial resolution of MODIS (250–1000 m), having the potential to provide the areal coverage required [11,12], may not be sufficient to resolve the expected land use changes in smallholder areas (<1 ha) due to potential errors caused by pixel mixing between different classes and land cover heterogeneity.
To address the aforementioned issues, researchers have used data retrieved from satellites with higher spatial resolution, such as Landsat (30 m) [13,14,15], or Sentinel-1 and Sentinel-2 (10 and 20 m) [16,17,18,19,20]. In addition to improved resolution, Landsat and Sentinel-2 provide visible and near-infrared (NIR) data that better interpret differences within an area. Sentinel-2 offers three bands in the red-edge region, which are crucial for crop type mapping [21].
Forkuor et al. [21] showed that Sentinel-2 improved the classification accuracy in rural Burkina Faso by 4 percent compared to Landsat bands. Persson et al. [22] found that the red-edge and short-wave bands of Sentinel-2 were particularly effective in discriminating tree classification. Therefore, land cover classification can be enhanced by utilising the spectral information in the red-edge region of the spectrum provided by Sentinel-2, along with its high spatial resolution compared to other platforms like MODIS and Landsat. Combining Sentinel-1 and Sentinel-2 may further improve these enhancements [23,24].
Moreover, synthetic aperture radar data can help overcome data noise caused by clouds and shadows in surface reflectance data [25]. More significantly, the application of grey-level co-occurrence matrix (GLCM) textural features and indices to very high-resolution imagery can address the issue of canopy heterogeneity [26,27,28,29,30]. This approach has proven successful in differentiating between coconut plantations and native forests [29].
Additionally, this study offers an opportunity to assess the relationship between regions where cocoa can be grown and the main soils of Bougainville, as well as agricultural land capabilities, using legacy information. The current study focuses on monitoring changes in the land area used for coconut palm plantations and with the potential to sustain cocoa production, by combining remote sensing information, machine learning algorithms and agricultural capability legacy data. Generally, cocoa grows well on deep, well-drained, and reasonably fertile soil [31]. The maps created in this study also have the potential to contribute to report on the Sustainable Development Goals of the United Nations (UN-SDGs) and the E-agriculture initiative implemented by the PNG government.
Specifically, this paper aims to:
(a)
Investigate cocoa intensification opportunities by classifying areas under coconut palm as proxies for locations where cocoa is already grown or can be cultivated.
(b)
Explore cocoa expansion opportunities based on highly suitable and capable areas for agricultural production that are not currently utilised.
(c)
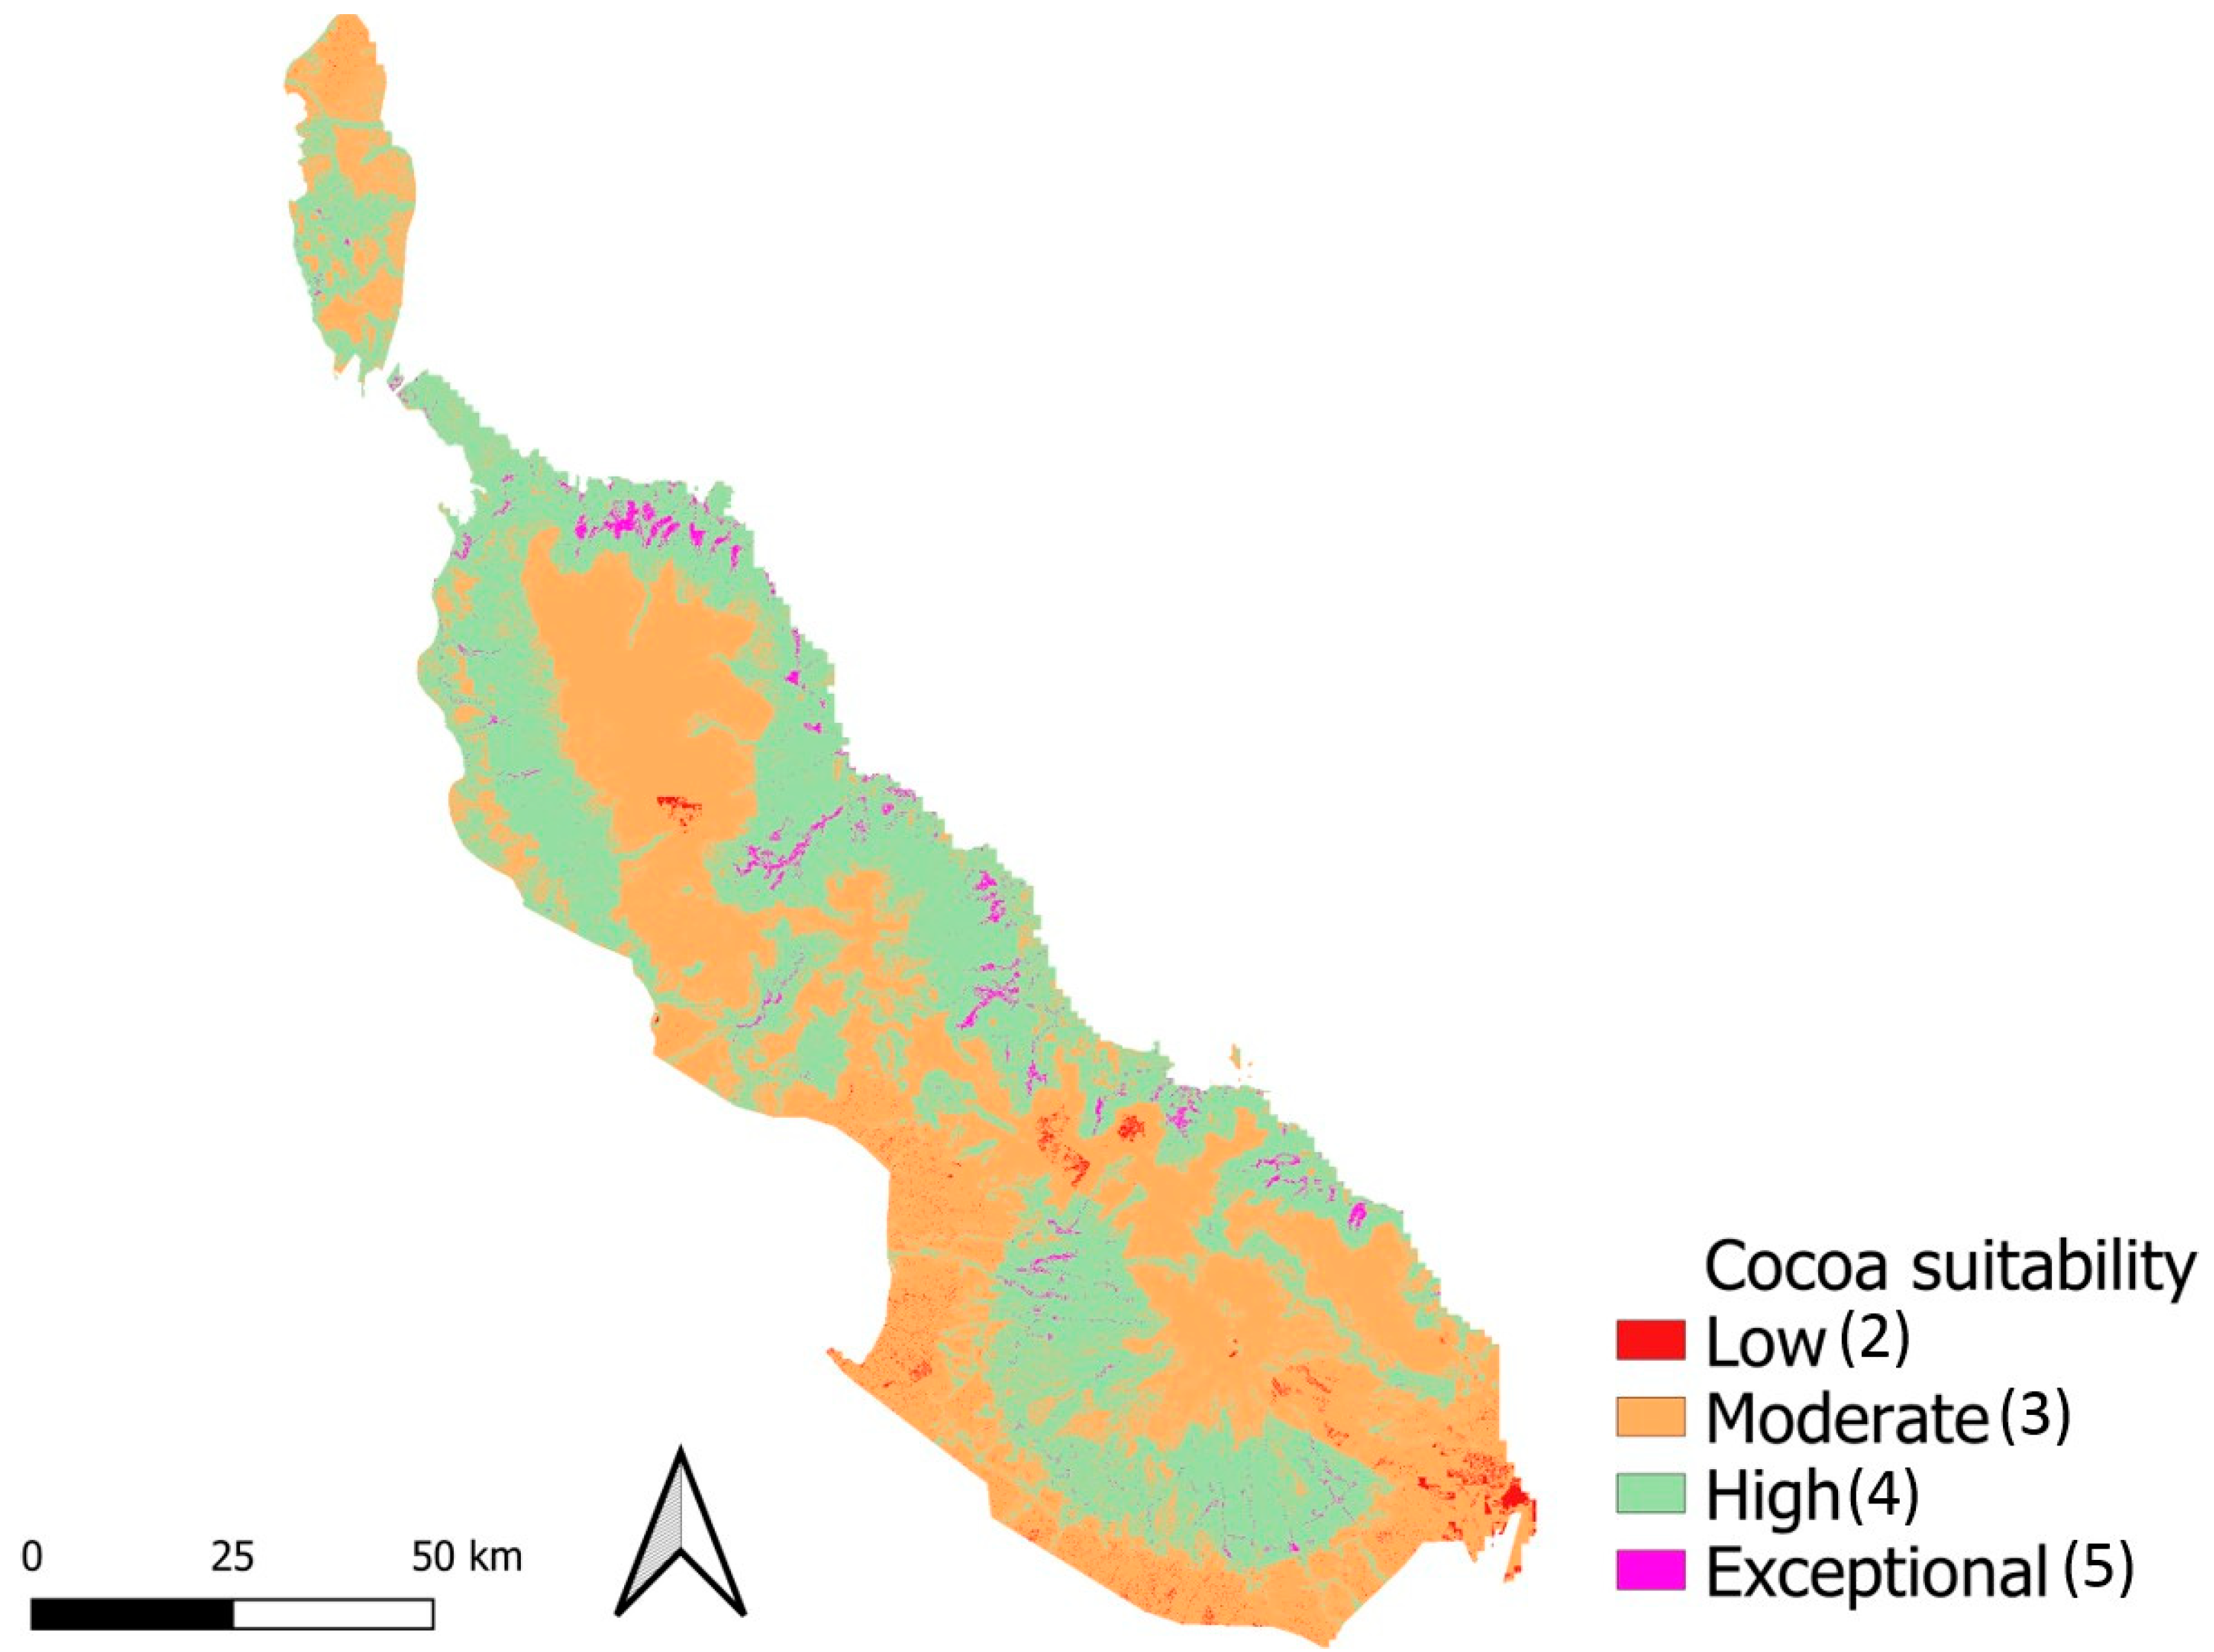
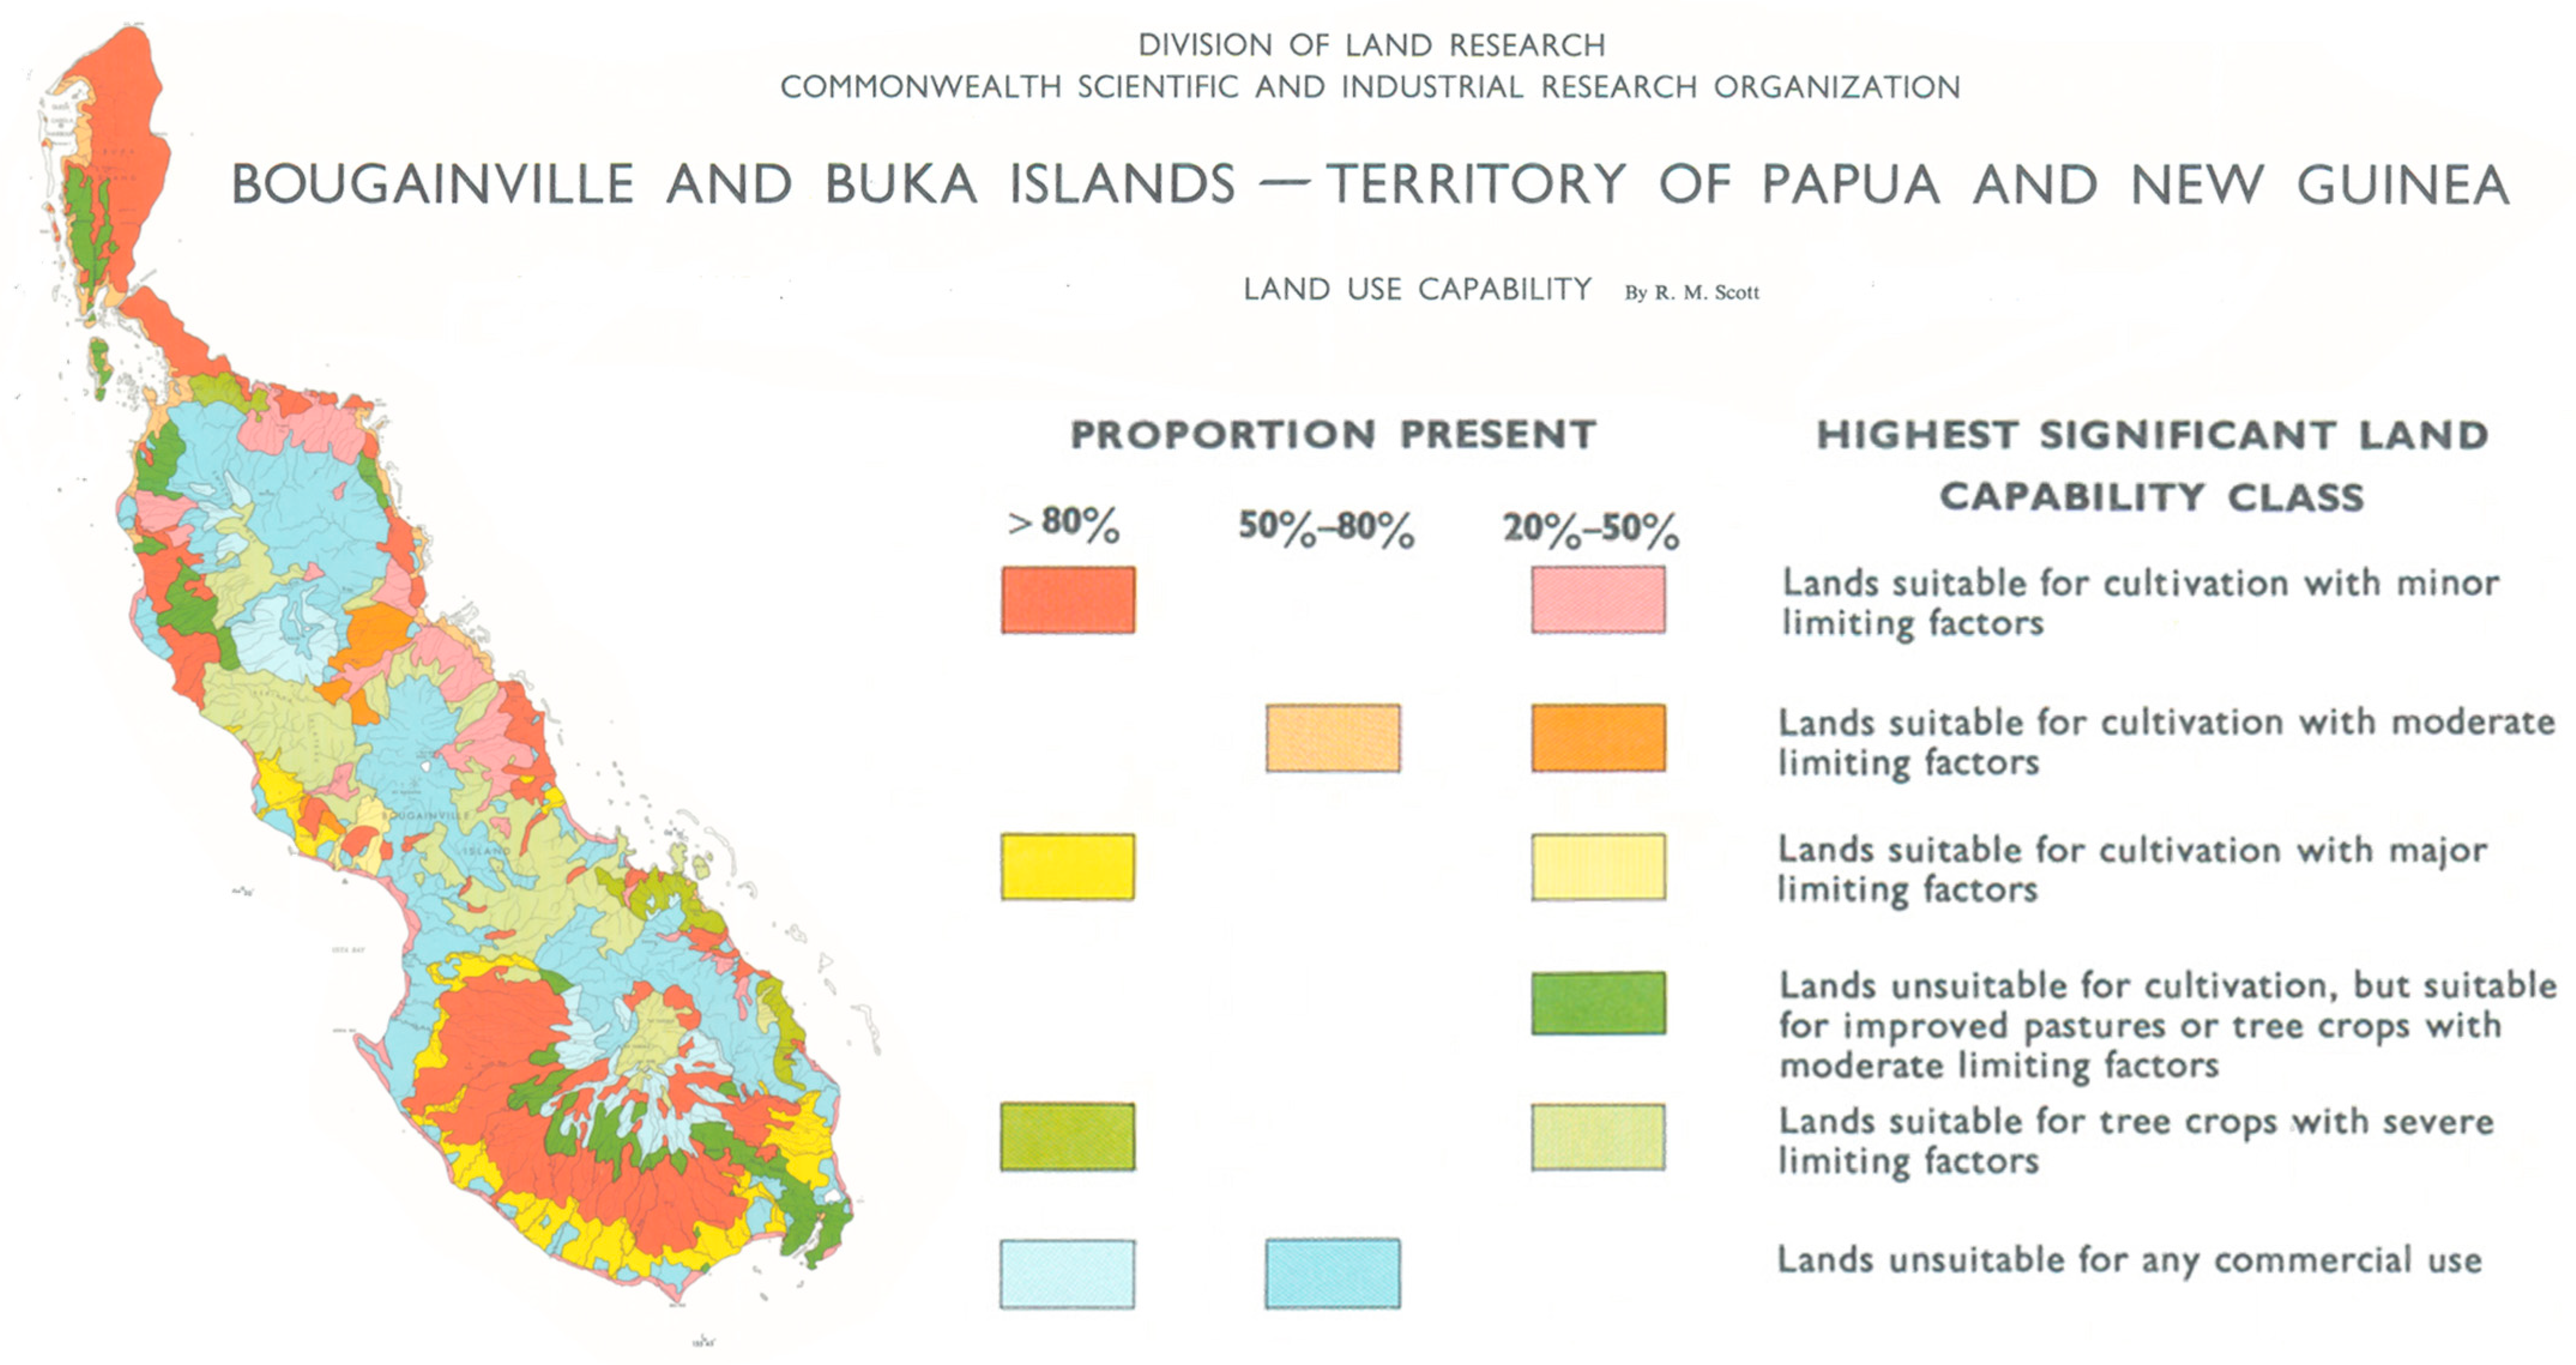
Examine the sustainability of cocoa production by comparing the resulting potential cocoa maps with legacy information, that is, soil/land capability/cocoa suitability maps.
(d)
Explore the potential use of this tool as a land cover change monitoring tool for measuring deforestation in the future, particularly as evidence to address the PNG E-Ag strategy and UN-SDGs.

2. Materials and Methods
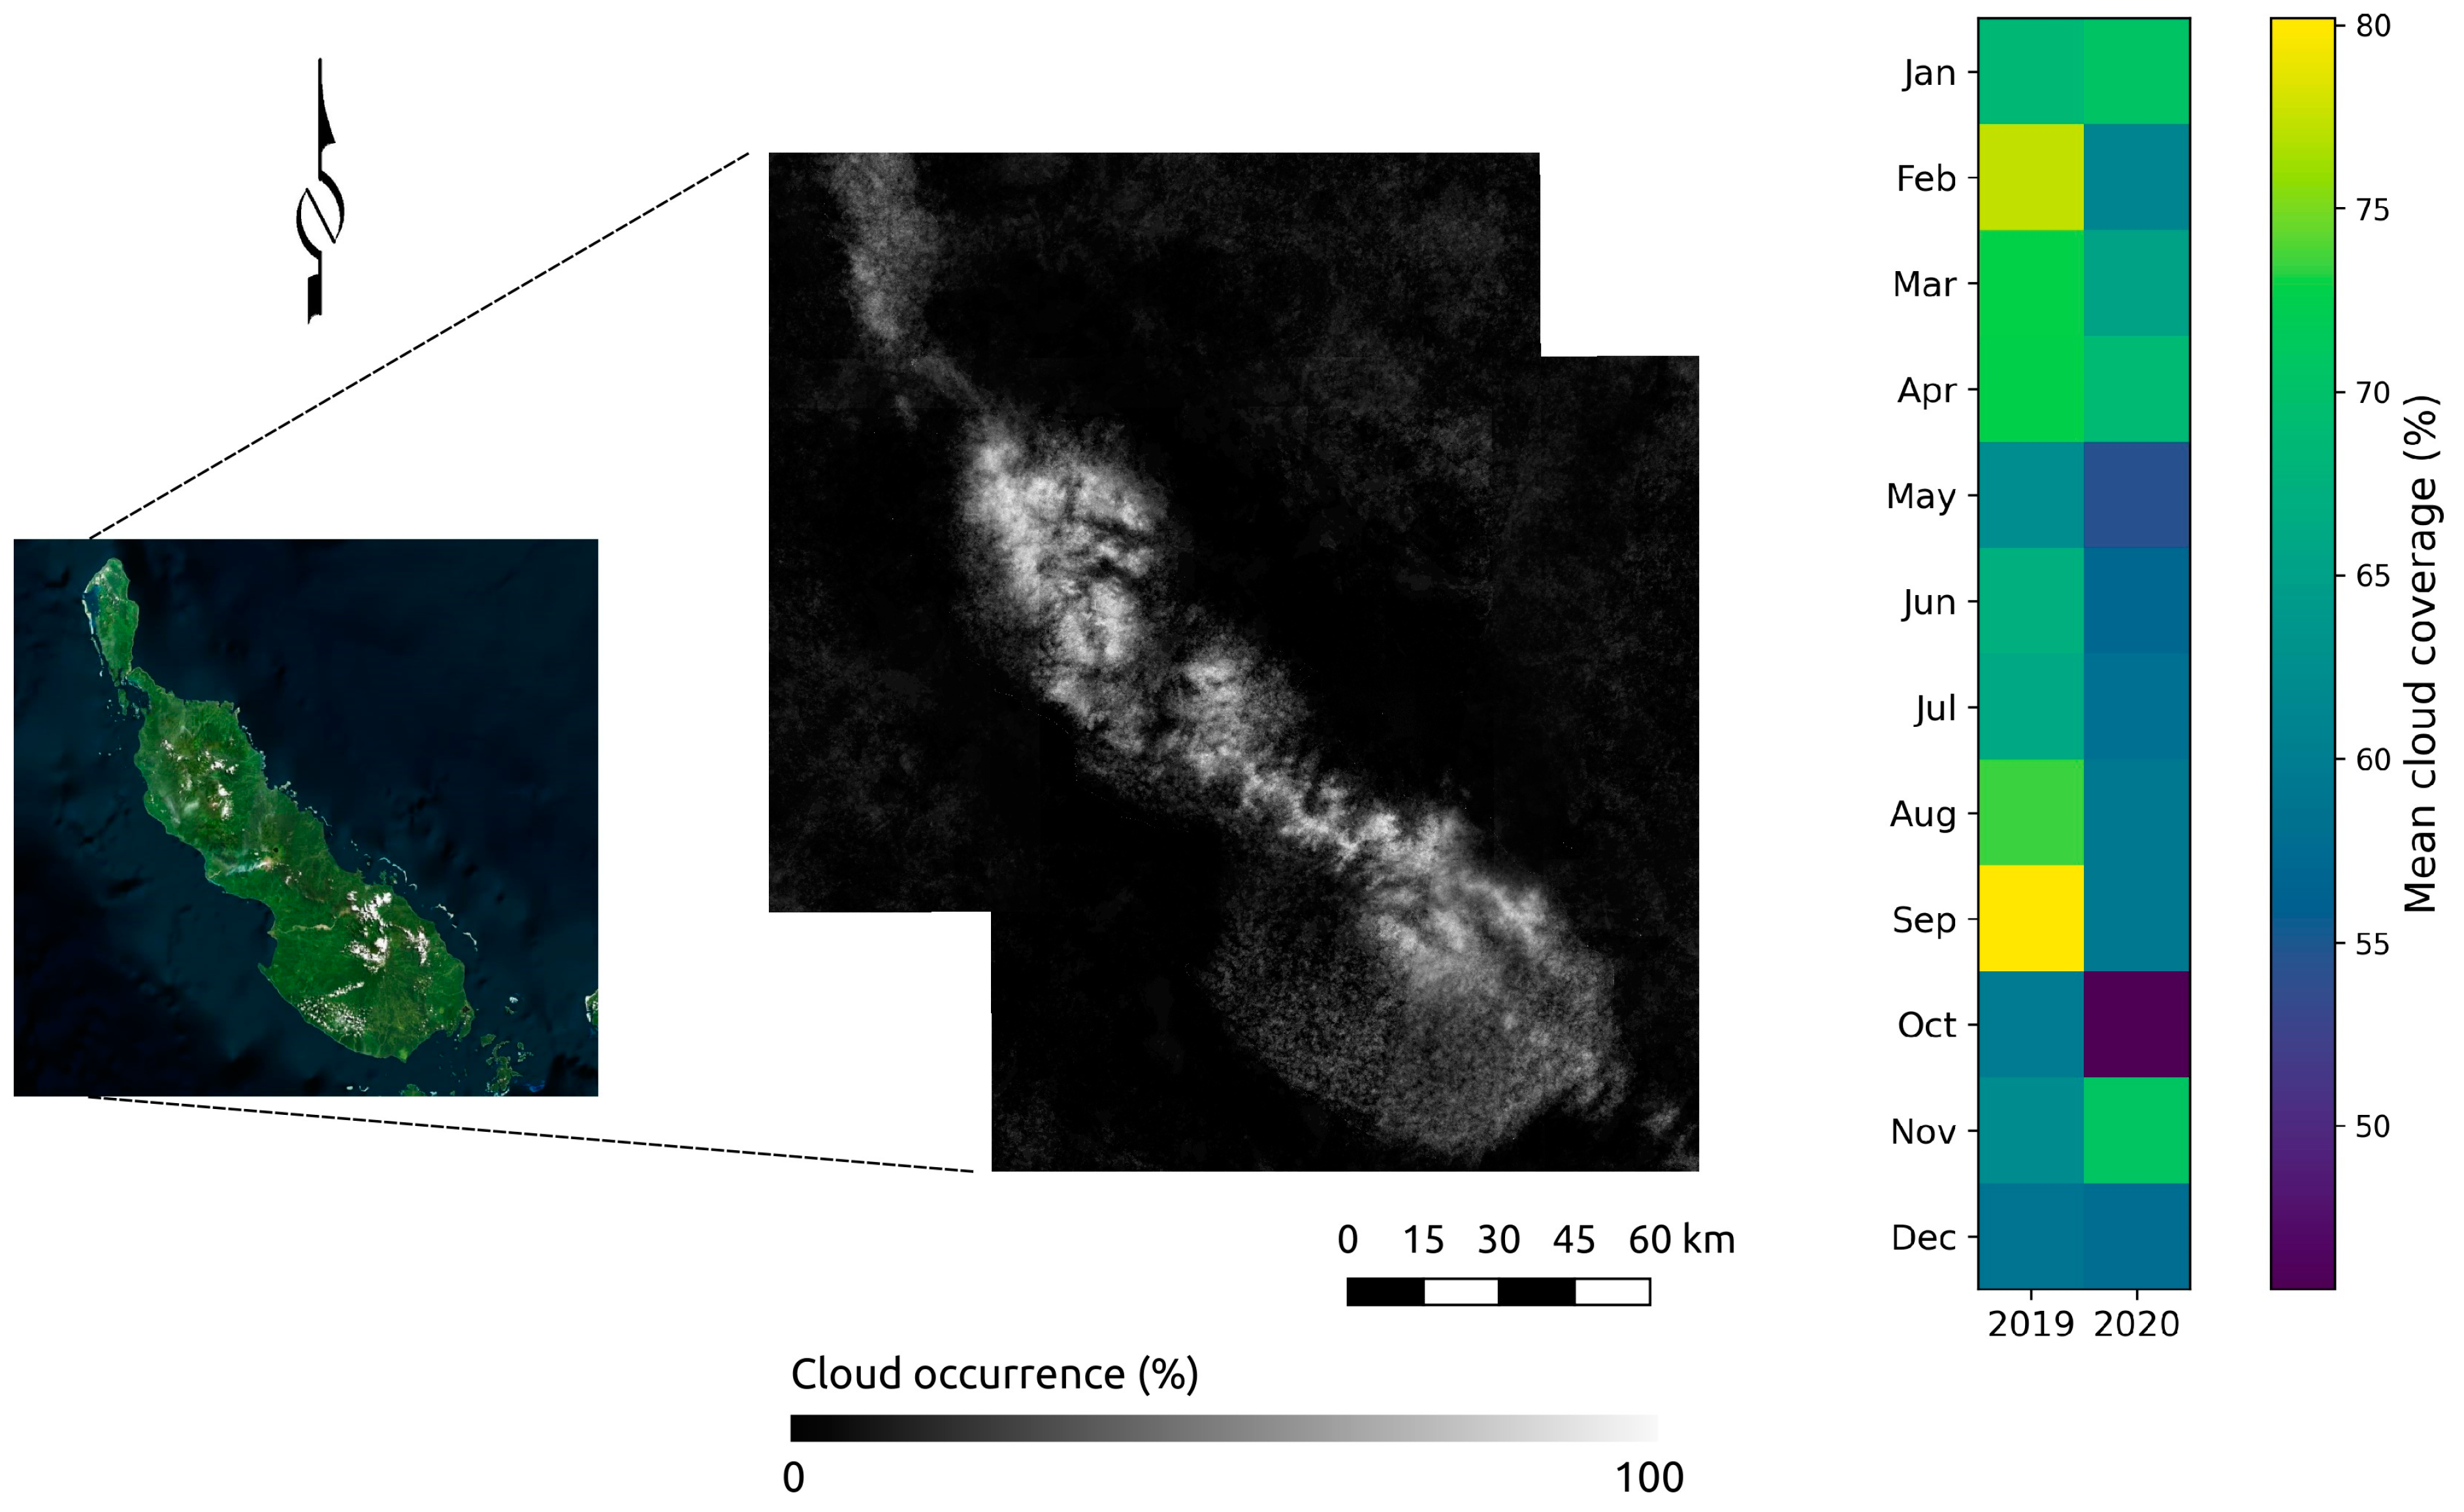
2.1. Study Area

The study was conducted in the Autonomous Region of Bougainville, Papua New Guinea, which covers an area of 9318 km2. This region was chosen based on its potential for Theobroma cocoa L. (Cocoa) production. A significant area in Bougainville is used for agriculture, with cocoa and coconut being the primary cash crops [2,32]. Therefore, we anticipate observing a relation between land capability classes and the cocoa orchard potential in the classified map. Figure 1 shows the elevation, mean annual temperature, and annual rainfall for Bougainville obtained from WorldClim version 1 [33].

2.2. Datasets Used and Preprocessing

This study used two main datasets for the detection of potential areas for cocoa orchards. These datasets included the tiles of synthetic aperture radar (SAR) from Sentinel-1 and surface reflectance data from Sentinel-2 (Sentinel-2 MSI, Level-2A) satellites [34], which were processed through Google Earth Engine [35]. Ancillary data, such as a terrain slope obtained from the processing Shuttle Radar Topography Mission (SRTM) at a spatial resolution of 30 m, was also incorporated into the study [36]. The Sentinel datasets were filtered to limit their extent to the study region and the date range from 2019 to 2020.
Surface reflectance images that contained more than 20% of clouds, stored in the “cloud pixel percentage” property of the collection, were filtered out. An additional cloud mask was applied to the collection by appending cloud probability scenes of Sentinel-2, processed through the s2cloudless library [37], and setting a threshold of cloud probability to 30% [38]. Due to the high occurrence of clouds in the study region (Figure 2), the masked surface reflectance collection was averaged. After processing the Sentinel-2 data, raw bands (B2-B8A and B11) were extracted and used as covariates to calculate vegetation indices, which were combined with the raw bands. Six vegetation indices were calculated for different calendar years using the visible, near-infrared (NIR), and red edge bands. Table 1 shows the vegetation indices used, which can capture specific vegetative features, such as leaf greenness, tree height, and systematic cocoa block planting, compared to a forest that may contain vegetation of various shapes and sizes.
The vegetation indices include the enhanced vegetation index (EVI), the normalised difference moisture index (NDMI), and the chlorophyll index green (Chlgreen), which are visible NIR-based indices. Additionally, The Vogelmann Red Edge Index (VREI), the chlorophyll red edge index (CIr), and the red edge curve index (RECI) were used. The RECI was derived to describe the vegetation curve in the region between the red edge band 1 (RE1; 698 nm) and the NIR (899 nm). The SAR data were filtered to a single vertical transmit and vertical receive (VV) co-polarisation to maximise the number of images in the region. The SAR data were also filtered to the Interferometric Wide Swath (IW) mode of operation, which is the primary acquisition mode that leads to images of a 250 km swath at 5 m by 20 m resolution. Furthermore, to remove edge effects, a mask was applied to remove all pixels with less than −30 dB from the collection. As coconut plantations (potential cocoa orchards) exhibit similar spectral patterns to forests but display a strong homogeneity in terms of vegetation growth, the grey-level co-occurrence matrix (GLCM) texture features analysis was employed [39]. The GLCM with a square kernel of three pixels was applied to distinguish between forests and potential cocoa orchards. From this analysis, angular second moment (VVasm), variance (VVvar), inverse different moments (VVidm), and entropy (VVent) bands were selected and used in the detection.
To quantitatively and qualitatively evaluate the results and assess the sustainability of potential cocoa expansion, a comparison was conducted using independent datasets of cocoa orchards [40], soil series in Bougainville [41], the cocoa suitability map from Papua New Guinea [41], and land use capability maps [42]. These were compared with the map of potential cocoa orchards developed in this work (refer to Section 2.3).
The cocoa suitability map [41] identified cocoa suitability classes in PNG using a multicriteria decision analysis, considering three biophysical and two market access criteria (Figure 3). This map was used to establish a proxy for sustainability evaluation by comparing the areas where cocoa can be grown under coconut palm plantations with the identified suitability classes.
The land use capability map for Bougainville in Figure 4 shows the areas suitable for cultivation based on various aspects describing soil, physiography, access limitations, and hazards. The land suitability in this map ranges from class I to class V, indicating lands unsuitable for cultivation to lands exceptionally suitable for any commercial use, respectively.
The soil map of Bougainville (Figure 5) presents the major soil types (http://worldmap.harvard.edu/data/geonode:DSMW_RdY (accessed on 23 April 2021)) found within the province. We ranked the soil types based on their capability for cocoa production using the following principles:
  • Acrisols with a clay-rich subsoil (present in southeast Bougainville), were ranked as having low suitability for cocoa due to acidic conditions, low fertility, and the need for management.
  • Luvisols with a clay-rich subsoil (present in north Bougainville—Lonahan), corresponding to fertile soils, were ranked as having a moderate suitability.
  • Other soil types categorised are:
    (a)
    Relatively young soils or soils with very little or no profile development, or very homogenous sands with moderate fertility, predominately Cambisols (present in central Bougainville), were ranked as having moderate suitability.
    (b)
    Soils strongly influenced by water, such as Fluvisols (present in south and central west Bougainville around Siwai), were ranked as being moderately suitable for cocoa as they require drainage management.
    (c)
    Soils of volcanic origin, that is, Andosols (main soil type of Bougainville spread across central and south), were ranked as exceptional because they are deep and present adequate physical soil properties for cocoa.

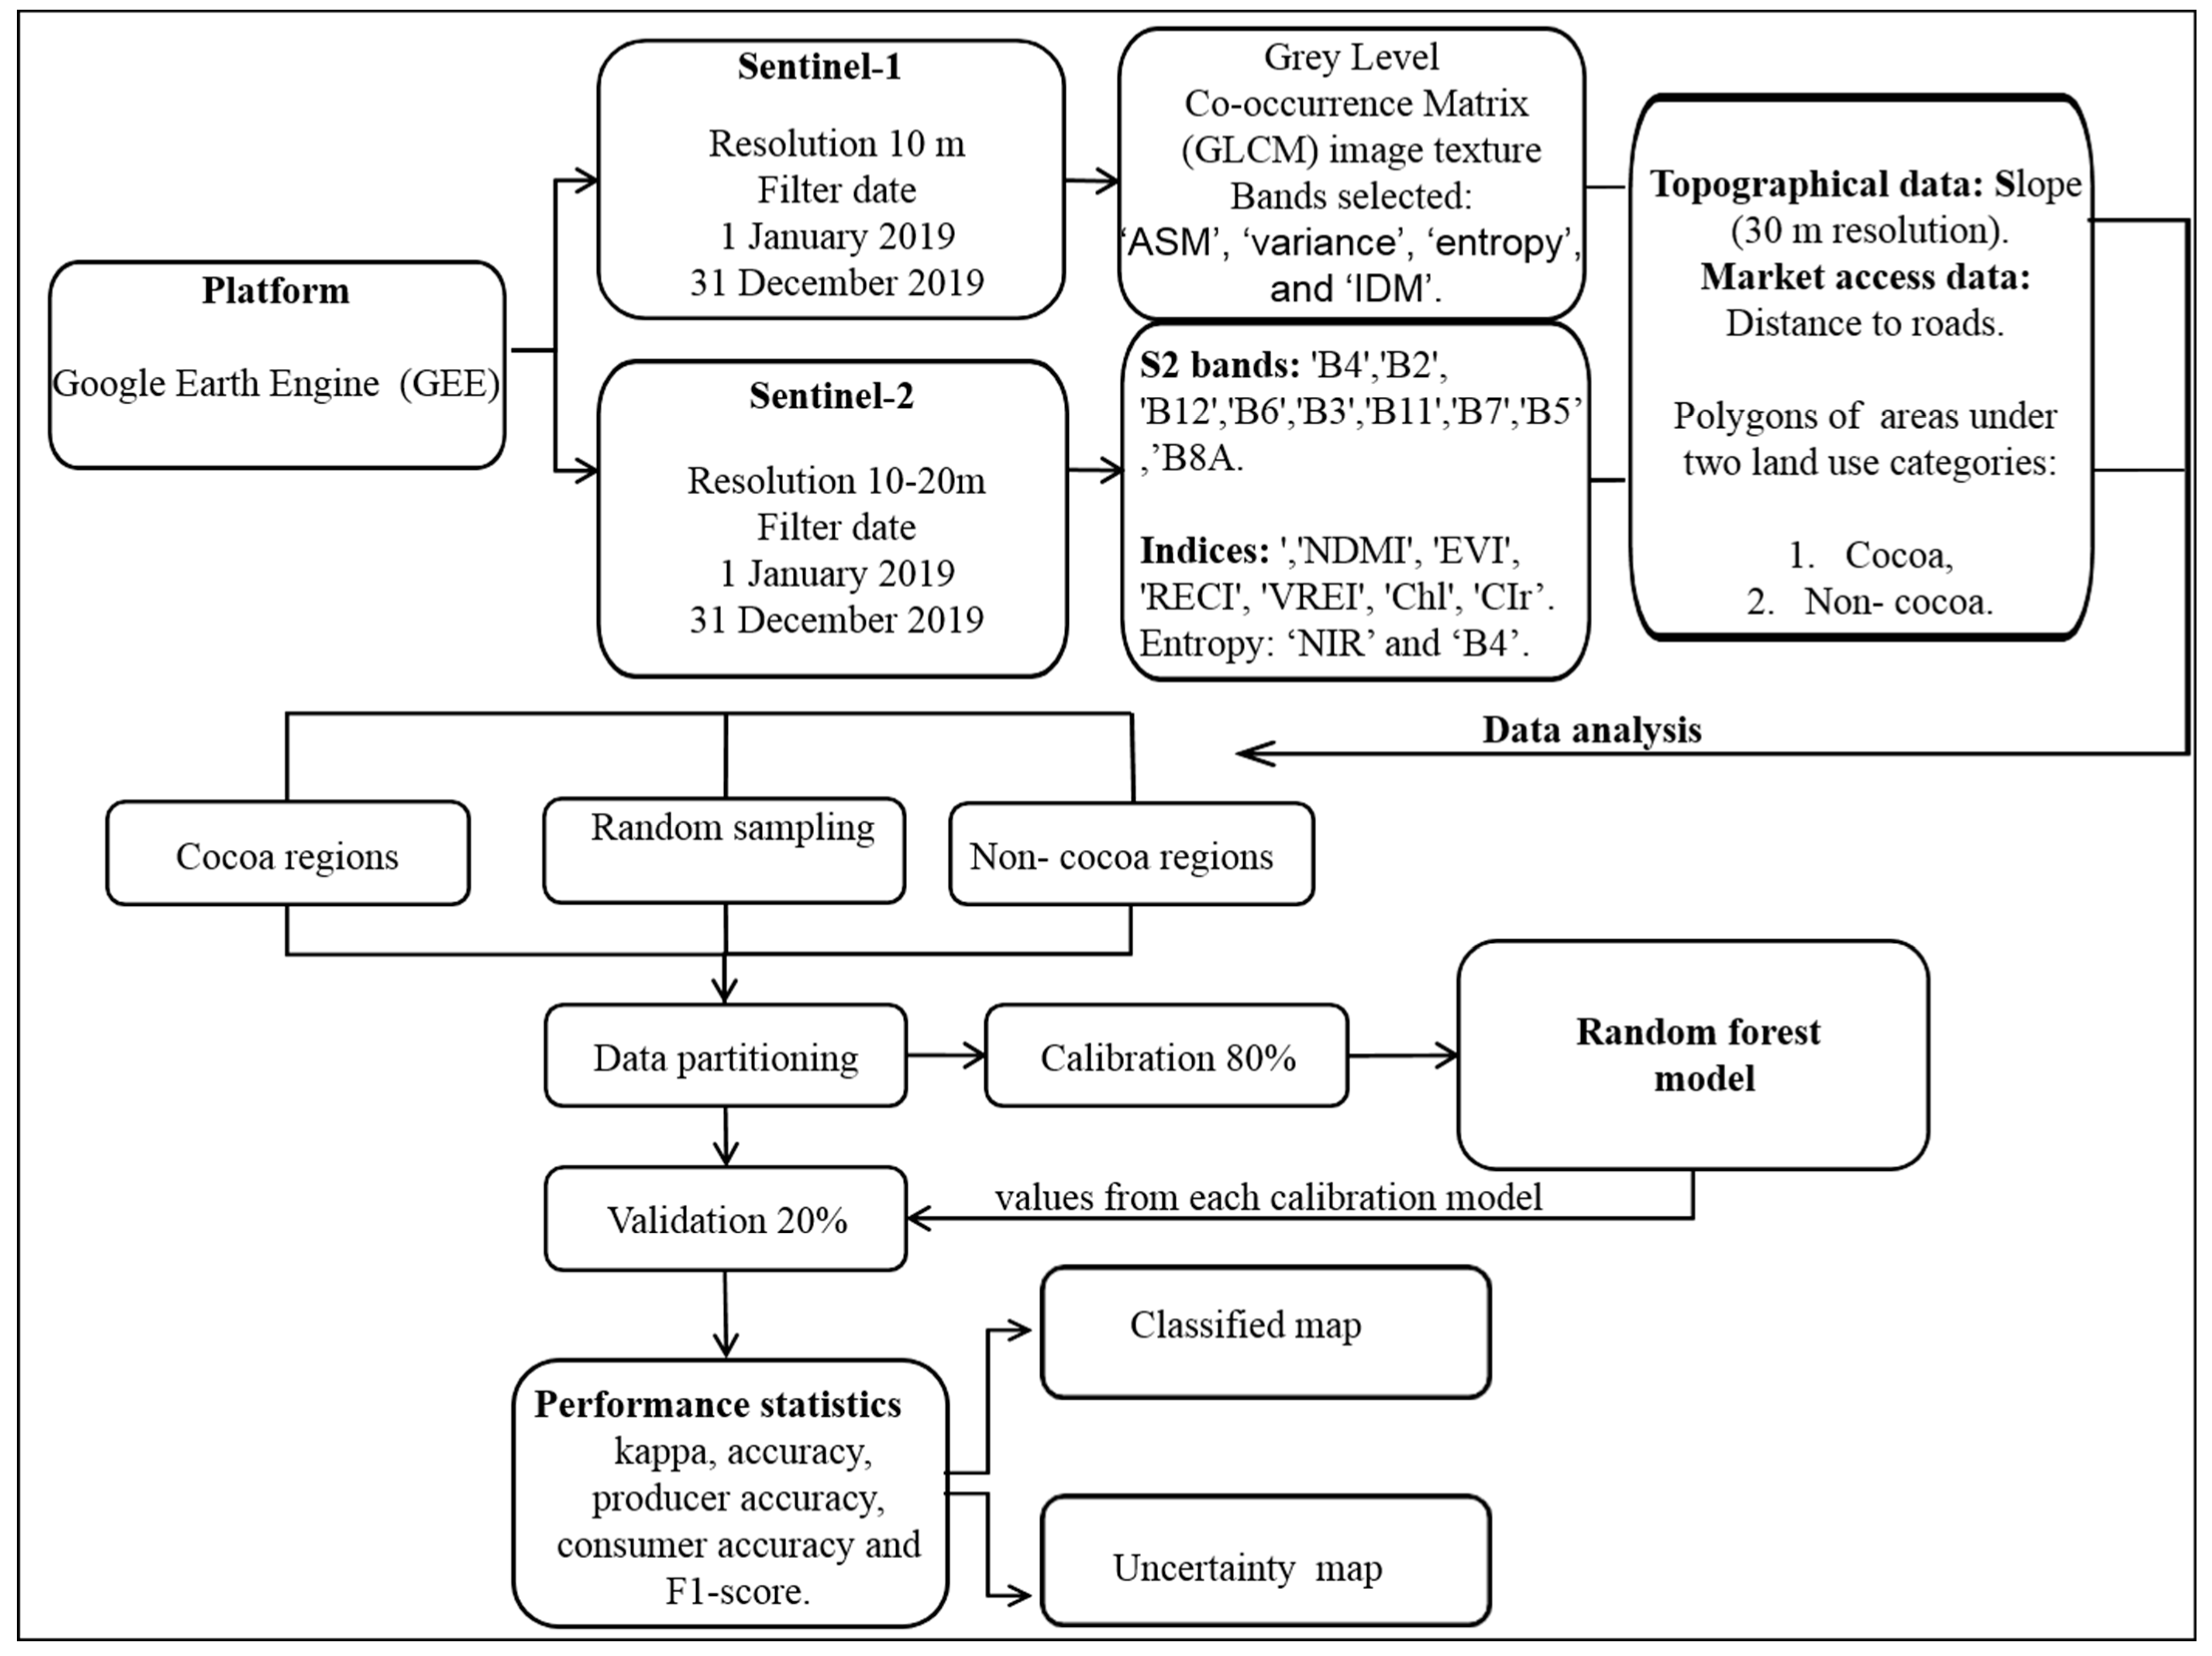
2.3. Detection of Potential Cocoa Orchards and Uncertainty Estimation

All the different rasters derived from Sentinel collections for each calendar year were stacked together with the slope of the terrain and the distance to roads to create a single multi-band image used for potential cocoa orchard detection (Figure 6). To achieve this, a random forest model with 250 decision trees was used. This algorithm was selected because it outperformed other classifiers, including Support Vector Machines (SVM), Classification and Regression Trees (CART), Gradient Tree Boost, and Naïve Bayes [43] (Supplementary Materials Table S1). The supervised classification was conducted by sampling anchor pixels from polygons drawn in two land use classes, including coconut orchards and others (such as water, roads, forest, and bare land). A total of 268 polygons were drawn from known potential cocoa orchards (coconut plantations) and randomly sampled based on pixels. The sampling order was randomised and limited to 20,000 samples. Additionally, 444 polygons from other land uses were drawn, sampled, randomised, and from these, another 60,000 samples were selected. These two categories were combined, randomised again, and split into training, validation, and testing subsets in proportions of 10%, 80%, and 10%, respectively.
Table 1. Vegetation indices used in this study.
IndexEquationSource
Enhanced vegetation index (EVI) EVI = 2.5 NIR     red NIR   +   6   ×   red     7.5   ×   blue   +   1 [44]
Normalised difference moisture index (NDMI) NDMI = NIR     SWIR 1 NIR   +   SWIR 1 [45]
Chlorophyll index green (ChI green) ChI   green = NIR green     1 [46]
Vogelmann Red Edge Index (VREI) VREI = NIR Red   Edge [47]
Chlorophyll index red edge (CIr) CIr = Red   Edge   3 Red   Edge   1     1 [48]
Red edge curve index (RECI) RECI = Red   Edge 2     Red   Edge 1   ×   NIR Red   Edge 1 Proposed in this study
To assess the uncertainty of the classification, the output of the random forest model was set to the probability mode to obtain probabilities for correct pixel-based classifications. These probabilities were used to evaluate the uncertainty using the normalised Shannon entropy [49]:
H P = i = 1 n p i   ln p i S m a x
where pi is the probability of class i, n is the number of classes, and Smax corresponds to ln n. The normalised Shannon entropy ranges from 0 to 1, where 0 implies total certainty about the classification and 1 for a total uncertainty [50].

2.4. Validation of Classification

For this analysis, a holdout cross-validation analysis was subsequently applied to the sample subsets for the data corresponding to the calendar year 2019. This allowed the development of a confusion matrix, from which the performance was evaluated using metrics such as kappa, overall accuracy, f1-score, consumer’s accuracy, and producer’s accuracy [51]. The kappa metric compares the agreement obtained to the agreement obtained by chance [52]. The overall accuracy is the ratio between correctly classified samples and the total samples. The f1-score corresponds to the harmonic mean between precision and recall. The producer’s accuracy for each class is calculated by dividing the number of correctly classified samples by the total number of samples per column in the confusion matrix, while the consumer’s accuracy is the correctly classified samples per class divided by the total samples per row.
In simple terms:
(a)
The producer’s accuracy (relates to omission errors) represents how well reference pixels of the land-use type are classified.
(b)
The omission error refers to excluding a pixel that should have been included in the class (i.e., omission error = 1 − producer’s accuracy).
(c)
The consumer’s accuracy (relates to commission errors) represents the probability that a pixel classified into a given category represents that category on the ground.
(d)
The commission error refers to including a pixel in a class when it should have been excluded (i.e., commission error = 1 − consumer’s accuracy).
Since cocoa orchards are expected to have a multidecadal lifespan, all samples previously selected for detection through the random forest algorithm (training and validation from 2019) were combined and used as a validation source for the year 2020.

3. Results

The results showcase the classification conducted in this study involving three main components. First, the use of the finer resolution Sentinel-1 and Sentinel-2 imagery (Figure 6); second, the processing of imagery (Sentinel-1 and Sentinel-2) for feature extraction using all the 22 variables together; third, fitting the RF model to detect potential cocoa orchards. An attempt has also been made to find relationships between this classified map and soil and land capability legacy information. Therefore, the following subsections of the results report on the main components.

3.1. Classification Performance

The classification accuracy was above 90% for both the calibration and validation datasets (Table 2). The model provided a high overall calibration accuracy (0.99) as well as a high validation accuracy (0.97). This high overall accuracy needs to consider the imbalance between classes, as machine learning classification can be greatly influenced by imbalance in classes [53]. A decline in the more conservative Kappa accuracy for the validation model (0.929) still shows a very good performance in the classification. However, Kappa results should be taken with caution as they refer to an agreement by chance instead of the actual agreement, which may lead to a wide range of values, even if the overall accuracy is high, and difficulties in comparing Kappa coefficients [54].
The source of errors when evaluating the producer’s and consumer’s accuracy is mainly in the non-cocoa classified regions, which implies larger omission errors (false negatives). Furthermore, the commission error is higher for non-cocoa regions compared to potential cocoa regions. This is reflected in the lower consumer’s accuracy for non-cocoa regions (0.977) compared to cocoa regions (0.992), which also represents within-class errors in a map (false positives). These results, which imply the combination of different metrics (i.e., Kappa coefficient, overall accuracy, f1-score, producer’s accuracy, and consumer’s accuracy) show a reliable performance in the classification, even considering the particular limitations indicated, providing a robust calibration dataset of areas with cocoa potential. This can be used to assess future land changes, providing a tool utilisable by government policymakers responsible for monitoring and reporting on land cover changes.
Additionally, the resulting map was compared against the independent dataset of known cocoa orchards [40] (Figure 5). All the cocoa farms from the independent dataset are within the classified areas with cocoa potential, which is consistent with the general land capability map for Bougainville shown in Figure 4.
Following a robust optimisation process, the RF model created in this study shows classification reliability. In this study, the top five variables contributing the most to the RF model were B4 (red), RECI, B2 (blue), NIR entropy, and EVI (Figure 7). The B4 and B2 represent raw bands, which are strongly absorbed by vegetation. Similarly, EVI relies on red, NIR, and blue bands, and varies depending on changes in the canopy structure [55]. These covariates provide insights into the vegetation types. On the other hand, RECI is based on differences in the red edge range of the wavelength spectrum and the ratio between NIR and red edge bands. The red edge wavelengths exhibit high reflectance variations in vegetation [56] and are known to be good indicators of the vegetation physiological status [57]. Entropy in the NIR and red bands corresponds to a textural analysis of images as it uses the pixel neighbourhood (kernel) for calculation. When applied to these wavelengths, entropy helps distinguish between land uses with different reflectance characteristics. All surface reflectance-derived bands took precedence over SAR and ancillary data.
Although multi-collinearity does not impact the performance of random forest results [58,59,60], it can lead to unreliable feature rankings [61]. Therefore, Figure 8 presents the correlogram of covariates from the samples. Bands in the visible and red edge wavelength spectrum exhibit high correlation, and a similar pattern can be observed among indices calculated from reflectance band combinations. As a result, the importance of covariates must be taken with caution.

3.2. Detection of Potential Cocoa Orchards

The classified area with the potential for cocoa expansion (under coconut plantations, Figure 9a) accounts for 5% of Bougainville’s total area (479.97 km2), as assessed by the degree of uncertainty map, which ranges from 0.20 to >0.80 (Figure 9b). Some observations align clearly with the land capability map (Figure 4). Areas with high uncertainty (Figure 9b) correspond to regions with significant variability in land capabilities (Figure 4).
This relationship is further illustrated in Figure 10, where most lands with cocoa potential are located along the coast in the central region, in line with the identified land capability in Figure 4. Similarly, the limited or unsuitable land classification in the south (Figure 4) aligns with the regions of non-cocoa potential in Figure 10. There is a notable coincidence of cocoa potential in both maps for the western region (Figure 4 and Figure 10). Additional examples of good and poor detection for cocoa potential are provided in Figure 11.
This heuristic tool offers users the opportunity to assess the potential for cocoa expansion, evaluate land cover change, and detect deforestation.
Comparing the soil map with the classified map of cocoa potential (Table 3) and quantifying the extent of lands with cocoa potential in each soil type, it becomes evident that local farmers have successfully chosen where cocoa may be produced. The majority of land with potential for cocoa expansion have Luvisols and Andosols and a few with Acrisols. The distinction between the use of the Cambisols in the central part of Bougainville and the moderately suitable Fluvisols and Luvisols is likely influenced by limited road accessibility in the central region. From this, we understand that suitability to produce cocoa depends mainly on soil capability and market access constraints amongst other biophysical variables (e.g., climate).

4. Discussion

Native forests throughout the tropics face an increasing threat from human-induced land use changes and climate change [62,63] and there is the need to support the livelihoods of smallholders, including those growing cocoa [2,32]. Previously, it has been nearly impossible to accurately map cocoa orchard distribution, as cocoa trees are identified as forests in traditional satellite images [64]. However, regularly planted coconut-dominated canopies can be easily detected [29]. Coconut is a common shade tree in the cocoa production systems of PNG [65]. Therefore, this study has identified an opportunity for a systematic and broad-scale assessment of coconut to evaluate the areas that can be used for cocoa intensification.
We used freely available Sentinel-1 and Sentinel-2 satellite imageries and successfully identified the processing required to discriminate the coconut classification from the surrounding forest [29] and overcame the high frequency of cloud cover associated with the region. Our results demonstrate that combining remote sensing techniques using very high-resolution imagery, GLCM textural analysis, vegetation indices, and a RF classifier gave an overall validation accuracy of 97 percent for potential cocoa and non-cocoa classification. These results were not entirely a surprise given the huge body of successful work along similar lines [26,27,28,29,30]. Additionally, the confusion matrix helped reveal the sources of errors; based on this, it will be possible to improve the classification accuracy in the future, perhaps by adding more polygons/pixels from non-cocoa regions.
Further, we expect the top five covariates used in the model (B4, RECI, B2, NIR entropy, and EVI) to differentiate between systematically planted cocoa (4 m spacing) and coconut (12 m spacing) trees and their associated cropping cycle from the forest. For example, the red edge and NIR bands are probably able to capture information on planting patterns, the colour of leaves, and the height of cocoa (average 3–5 m) and coconut (average 15–25 m) trees from the forest [66]. We cannot undertake this analysis at this stage, and this will require some ground-based data to create a calibration dataset to distinguish cocoa from coconut trees. The land capability was mapped (Figure 4) in 1967 in Bougainville without the use of finer scale information currently available [42]. The map illustrates the general land suitability for cultivation across the island, but not to the scale needed for the current monitoring of intensification or expansion potential. While the 1967 map and our remote sensing effort cannot be compared directly due to differences in methodology, the general trend shows that the area under cocoa complements the regions that are suitable for cultivation, as shown by the coincidence of uncertainties (Figure 9 and Figure 10) with land capability (Figure 4). Therefore, we propose consulting the legacy data to assess the importance of land capability on present cocoa orchard dynamics [67].
Studies on land suitability [65,68] show that much is known about the capability of a given area to be able to grow cocoa trees in PNG. However, there are still uncertainties around many aspects of interactions between soil capability and conditions [30]. For example, the highly suitable Andisols of Bougainville may have low magnesium and calcium with high but unavailable phosphorous [69]. These are of the type 1 class (soils with no physical limitation to root development within 1.5 m of the surface) [68]. This shows that these soils can produce cocoa with additional nutrient management required to maintain or enhance soil conditions based on deficiencies [70] using fertilisers [30].
We found that most farmers already grow plantations where the soil is suitable, and these results can be used to identify local limitations for more targeted and effective soil management through training opportunities. The map can help understand the spatial extent for future intensification of cocoa farming and can be used as a tool for preemptive decisions of where extension services and demonstration sites for soil/land management can be directed to improve cocoa and coconut production and their value chain (https://bougainvillenews.files.wordpress.com/2018/06/bougainville-strategic-plan-2018-2022.pdf accessed on 19 July 2021).
For sustainable intensification purposes, an attempt has been made to investigate the suitability of areas where cocoa can potentially grow under coconut plantations. Specifically, this addresses the challenges outlined in the PNG E-Ag Strategy (https://png-data.sprep.org/dataset/papua-new-guinea-e-agriculture-strategy-20172023/resource/379a5244-5b98-4b72-95e6 accessed on 19 July 2021) developed in accordance with the framework proposed by the FAO ITU E-agriculture Strategy Guide (http://www.fao.org/3/a-i5564e.pdf accessed on 19 July 2021). This approach and the resulting data and interpretation presented here provide a monitoring and evaluation framework for land cover change and suitability for intensification. Further, we outline two main impacts of the study:
(a) As a land cover change monitoring tool: Comparing the 2019 and 2020 data, a preliminary analysis of the spatial distribution of potential cocoa regions indicates an increase in area under plantations within 1 year. For the 2019 classified map, the total area under crop production is 479.97 km2 and an increase in the plantations by 7.31 km2 is seen (Table 4). This result shows an increase in plantations in Bougainville from the year 2019 to 2020. This land use change is not insignificant, since it represents a growth of 1.52% of plantation extent in one year. Changes of this magnitude should be monitored and managed to avoid damage to natural ecosystems. Therefore, the calibration dataset created in this study can be used as a cocoa expansion and monitoring tool to quantify short- and long-term changes in land cover.
(b) Sustainable cocoa intensification: Comparing the cocoa suitability map (Figure 3) to the classified map, we see that (Table 5) plantations (coconut and coconut–cocoa) are currently grown in highly suitable areas. This is important because unsustainable development implies using land resources beyond their limits, and therefore, coconut–cocoa orchard expansion towards unsuitable lands can be used as an indicator of unsustainable development. Further, planned roads would also create new deforestation hotspots via the rapid expansion of logging, mining, and oil-palm plantations [71].
Since our results show that coconut and cocoa are already produced in highly and exceptionally suitable areas, this sets a limit to their potential expansion in a sustainable manner. Yet, these values should not be used as absolute. For instance, extremely suitable areas for cocoa production are under plantations in about 20% of their extent. This does not mean that the remaining 80% of these areas could be used for cocoa plantations. These regions may have excellent potential for cocoa, but they might be prioritised for other uses (e.g., residential, environmental protection, horticulture, etc.). Income diversification has been shown as a significant factor in smallholder wealth in Bougainville [2]. In this regard, economically sustainable agriculture must consider expansion limits to foster ecosystem functioning and biodiversity, which is commonly affected by agriculture, while intensification has proven insufficient on its own to cope with this issue [72].
Being an understory tree, cocoa’s intensification can be considered a sustainable cash crop in a multi-layered forest system [73,74], adopting agroforestry principles [75]. The mapping shows great potential for intensification as an understory crop with coconut. It is expected that the cocoa grown in this type of farming system holds enormous potential for environmental [75] and cultural [76] conservation in regions under pressure from climate change, deforestation, and mono-cropping [63,76,77,78].

5. Conclusions

This study combined grey-level co-occurrence matrix (GLCM) textural features and vegetation indices from Sentinel datasets to evaluate the sustainability of cocoa expansion in given land suitability classes for agriculture and soil capability classes. We mapped areas where cocoa smallholder orchards either already exist or can be grown by using fine-resolution C-band synthetic aperture radar and multispectral instruments from Sentinel-1 and Sentinel-2 satellites, respectively. Further, the processing of imagery (Sentinel-1 and Sentinel-2) for feature extraction using 22 variables was conducted as was fitting an RF model to detect and distinguish cocoa orchards from non-cocoa areas. We were able to differentiate potential cocoa and non-cocoa regions with 97 percent overall accuracy and over 90 percent producer’s and user’s accuracies.
Our planning tool provides a foundation for sustainable cocoa production in other coconut-growing regions by identifying the opportunity to intensify cocoa and coconut intercropping. Secondly, this work addresses the regional needs aspired to by the Bougainville government by identifying the land cover change in relation to land capability to meet the sustainability goals set in the Bougainville Strategic Plan 2018–2022. Demand for sustainably produced cocoa must be supported with technology, extension services, and consultation with governmental and non-governmental organisations. Further assessment on sustainability needs to be evaluated by defining a cocoa production extent threshold for sustainable development and the difficulty in its formulation or quantification. We need empirical and quantitative ways to assess it, therefore, this is a huge field for future work, along with region-specific research to identify sustainable production plans.

Supplementary Materials

The following supporting information can be downloaded at: https://www.mdpi.com/article/10.3390/rs15143492/s1, Table S1: Performance of different classification algorithms for cocoa plantation detection.

Author Contributions

Conceptualisation, K.S. and I.F.; methodology, K.S., I.F. and D.A.-S.; software, K.S., I.F. and D.A.-S.; validation, K.S., I.F. and D.A.-S.; formal analysis, K.S., I.F. and D.A.-S.; investigation, K.S., I.F., D.A.-S. and D.I.G.; resources, D.J.F., D.I.G. and D.Y.; data curation, K.S. and I.F.; writing—original draft preparation, K.S., I.F. and D.A.-S.; writing—review and editing, D.J.F., D.I.G., D.Y., C.F., J.B., B.M. and A.S.; visualisation, K.S., I.F. and D.A.-S.; supervision, D.J.F. and D.I.G.; project administration, D.J.F.; funding acquisition, D.J.F. and D.I.G. All authors have read and agreed to the published version of the manuscript.

Funding

This study is supported by the Australian Centre for International Agricultural Research projects: ‘SLAM/2019/109’ Optimising soil management and health in Papua New Guinea integrated and ‘HORT/2014/094’ Developing the cocoa value chain in Bougainville.

Data Availability Statement

Data for validation were used from publicly available information at https://www.aciar.gov.au/publication/technical-publications/analysis-nutritional-constraints-cocoa-production-papua-new-guinea-final-report (accessed on 1 April 2021).

Acknowledgments

Ignacio Fuentes was funded by the ANID FONDECYT Postdoctoral Project No. 3220317.

Conflicts of Interest

The authors declare no conflict of interest.

References

  1. Department of Agriculture and Livestock Papua New Guinea (DAL). 2017. Available online: https://www.agriculture.gov.pg/cocoa/ (accessed on 19 October 2021).
  2. Guest, D.I.; Butubu, J.; van Ogtrop, F.; Hall, J.; Vinning, G.; Walton, M. Poverty, education and family health limit disease management and yields on smallholder cocoa farms in Bougainville. CABI One Health 2023. [Google Scholar] [CrossRef]
  3. Byerlee, D.; Stevenson, J.; Villoria, N. Does intensification slow crop land expansion or encourage deforestation? Glob. Food Secur. 2014, 3, 92–98. [Google Scholar] [CrossRef]
  4. Vermote, E.F.; Skakun, S.; Becker-Reshef, I.; Saito, K. Remote sensing of coconut trees in tonga using very high spatial resolution worldview-3 data. Remote Sens. 2020, 12, 3113. [Google Scholar] [CrossRef]
  5. Asubonteng, K.O. Identification of Land Use-Cover Transfer Hotspots in Ejisu-Juabeng District, Ghana. Master’s Thesis, Kwame Nkrumah University of Science and Technology, Kumasi, Ghana, 2007. [Google Scholar]
  6. Mu, Q.; Zhao, M.; Running, S.W. Improvements to a MODIS global terrestrial evapotranspiration algorithm. Remote Sens. Environ. 2011, 115, 1781–1800. [Google Scholar] [CrossRef]
  7. Wardlow, B.D.; Egbert, S.L. Large-area crop mapping using time-series MODIS 250 m NDVI data: An assessment for the US Central Great Plains. Remote Sens. Environ. 2008, 112, 1096–1116. [Google Scholar] [CrossRef]
  8. Zeng, L.; Wardlow, B.D.; Wang, R.; Shan, J.; Tadesse, T.; Hayes, M.J.; Li, D. A hybrid approach for detecting corn and soybean phenology with time-series MODIS data. Remote Sens. Environ. 2016, 181, 237–250. [Google Scholar] [CrossRef]
  9. Chen, Y.; Lu, D.; Moran, E.; Batistella, M.; Dutra, L.V.; Sanches, I.D.; da Silva, R.F.B.; Huang, J.; Luiz, A.J.B.; de Oliveira, M.A.F. Mapping croplands, cropping patterns, and crop types using MODIS time-series data. Int. J. Appl. Earth Obs. Geoinf. 2018, 69, 133–147. [Google Scholar] [CrossRef]
  10. Massey, R.; Sankey, T.T.; Congalton, R.G.; Yadav, K.; Thenkabail, P.S.; Ozdogan, M.; Meador, A.J.S. MODIS phenology-derived, multi-year distribution of conterminous us crop types. Remote Sens. Environ. 2017, 198, 490–503. [Google Scholar] [CrossRef]
  11. Lobell, D.B.; Asner, G.P. Cropland distributions from temporal unmixing of MODIS data. Remote Sens. Environ. 2004, 93, 412–422. [Google Scholar] [CrossRef]
  12. Ouzemou, J.-E.; El Harti, A.; Lhissou, R.; El Moujahid, A.; Bouch, N.; El Ouazzani, R.; Bachaoui, E.M.; El Ghmari, A. Crop type mapping from pansharpened Landsat 8 NDVI data: A case of a highly fragmented and intensive agricultural system. Remote Sens. Appl. Soc. Environ. 2018, 11, 94–103. [Google Scholar] [CrossRef]
  13. Tatsumi, K.; Yamashiki, Y.; Torres, M.A.C.; Taipe, C.L.R. Crop classification of upland fields using random forest of time-series Landsat 7 ETM+ data. Comput. Electron. Agric. 2015, 115, 171–179. [Google Scholar] [CrossRef]
  14. Al-Shammari, D.; Fuentes, I.; Whelan, B.; Filippi, P.; Bishop, T. Mapping of cotton fields within-season using phenology-based metrics derived from a time series of landsat imagery. Remote Sens. 2020, 12, 3038. [Google Scholar] [CrossRef]
  15. Janssen, L.L.; Middelkoop, H. Knowledge-based crop classification of a landsat thematic mapper image. Int. J. Remote Sens. 1992, 13, 2827–2837. [Google Scholar] [CrossRef]
  16. Feng, S.; Zhao, J.; Liu, T.; Zhang, H.; Zhang, Z.; Guo, X. Crop type identification and mapping using machine learning algorithms and sentinel-2 time series data. IEEE J. Sel. Top. Appl. Earth Obs. Remote Sens. 2019, 12, 3295–3306. [Google Scholar] [CrossRef]
  17. Immitzer, M.; Vuolo, F.; Atzberger, C. First experience with sentinel-2 data for crop and tree species classifications in central Europe. Remote Sens. 2016, 8, 166. [Google Scholar] [CrossRef]
  18. Rudiyanto; Minasny, B.; Shah, R.M.; Che Soh, N.; Arif, C.; Indra Setiawan, B. Automated near-real-time mapping and monitoring of rice extent, cropping patterns, and growth stages in Southeast Asia using Sentinel-1 time series on a Google Earth Engine platform. Remote Sens. 2019, 11, 1666. [Google Scholar] [CrossRef] [Green Version]
  19. Zhang, H.; Kang, J.; Xu, X.; Zhang, L. Accessing the temporal and spectral features in crop type mapping using multi-temporal Sentinel-2 imagery: A case study of Yi’an County, Heilongjiang province, China. Comput. Electron. Agric. 2020, 176, 105618. [Google Scholar] [CrossRef]
  20. Gumma, M.K.; Tummala, K.; Dixit, S.; Collivignarelli, F.; Holecz, F.; Kolli, R.N.; Whitbread, A.M. Crop type identification and spatial mapping using sentinel-2 satellite data with focus on field-level information. Geocarto Int. 2020, 37, 1833–1849. [Google Scholar] [CrossRef]
  21. Forkuor, G.; Dimobe, K.; Serme, I.; Tondoh, J.E. Landsat-8 vs. sentinel-2: Examining the added value of sentinel-2′s red-edge bands to land-use and land-cover mapping in Burkina Faso. GISci. Remote Sens. 2018, 55, 331–354. [Google Scholar] [CrossRef]
  22. Persson, M.; Lindberg, E.; Reese, H. Tree species classification with multi-temporal sentinel-2 data. Remote Sens. 2018, 10, 1794. [Google Scholar] [CrossRef] [Green Version]
  23. Van Tricht, K.; Gobin, A.; Gilliams, S.; Piccard, I. Synergistic use of radar sentinel-1 and optical sentinel-2 imagery for crop mapping: A case study for Belgium. Remote Sens. 2018, 10, 1642. [Google Scholar] [CrossRef] [Green Version]
  24. Campos-Taberner, M.; García-Haro, F.J.; Martínez, B.; Sánchez-Ruíz, S.; Gilabert, M.A. A copernicus sentinel-1 and sentinel-2 classification framework for the 2020+ European common agricultural policy: A case study in València (Spain). Agronomy 2019, 9, 556. [Google Scholar] [CrossRef] [Green Version]
  25. Ferrant, S.; Selles, A.; Le Page, M.; Herrault, P.-A.; Pelletier, C.; Al-Bitar, A.; Mermoz, S.; Gascoin, S.; Bouvet, A.; Saqalli, M.; et al. Detection of irrigated crops from sentinel-1 and sentinel-2 data to estimate seasonal groundwater use in south India. Remote Sens. 2017, 9, 1119. [Google Scholar] [CrossRef] [Green Version]
  26. Bricher, P.K.; Lucieer, A.; Shaw, J.; Terauds, A.; Bergstrom, D.M. Mapping sub-Antarctic cushion plants using random forests to combine very high resolution satellite imagery and terrain modelling. PLoS ONE 2013, 8, e72093. [Google Scholar] [CrossRef]
  27. Wang, T.; Zhang, H.; Lin, H.; Fang, C. Textural–spectral feature-based species classification of mangroves in Mai Po Nature Reserve from Worldview-3 imagery. Remote Sens. 2016, 8, 24. [Google Scholar] [CrossRef] [Green Version]
  28. Numbisi, F.N.; Van Coillie, F.; De Wulf, R. Delineation of cocoa agroforests using multiseason Sentinel-1 SAR images: A low grey level range reduces uncertainties in GLCM texture-based mapping. ISPRS Int. J. Geo-Inf. 2019, 8, 179. [Google Scholar] [CrossRef] [Green Version]
  29. Burnett, M.W.; White, T.D.; McCauley, D.J.; De Leo, G.A.; Micheli, F. Quantifying coconut palm extent on pacific islands using spectral and textural analysis of very high resolution imagery. Int. J. Remote Sens. 2019, 40, 7329–7355. [Google Scholar] [CrossRef]
  30. Abu, I.-O.; Szantoi, Z.; Brink, A.; Robuchon, M.; Thiel, M. Detecting cocoa plantations in Côte d’Ivoire and Ghana and their implications on protected areas. Ecol. Indic. 2021, 129, 107863. [Google Scholar] [CrossRef]
  31. Singh, K.; Sanderson, T.; Field, D.; Fidelis, C.; Yinil, D. Soil security for developing and sustaining Papua New Guinea soil under cocoa. Geoderma Reg. 2019, 17, e00212. [Google Scholar] [CrossRef]
  32. Walton, M.; Hall, J.; Guest, D.; Butubu, J.; Vinning, G.; Black, K.; Beardsley, J. Applying one health methods to improve cocoa production in Bougainville: A case study. One Health 2020, 10, 100143. [Google Scholar] [CrossRef]
  33. Hijmans, R.J.; Cameron, S.E.; Parra, J.L.; Jones, P.G.; Jarvis, A. Very high resolution interpolated climate surfaces for global land areas. Int. J. Climatol. 2005, 25, 1965–1978. [Google Scholar] [CrossRef]
  34. Drusch, M.; Del Bello, U.; Carlier, S.; Colin, O.; Fernandez, V.; Gascon, F.; Hoersch, B.; Isola, C.; Laberinti, P.; Martimort, P.; et al. Sentinel-2: Esa’s optical high-resolution mission for GMES operational services. Remote Sens. Environ. 2012, 120, 25–36. [Google Scholar] [CrossRef]
  35. Gorelick, N.; Hancher, M.; Dixon, M.; Ilyushchenko, S.; Thau, D.; Moore, R. Google earth engine: Planetary-scale geospatial analysis for everyone. Remote Sens. Environ. 2017, 202, 18–27. [Google Scholar] [CrossRef]
  36. Crippen, R.; Buckley, S.; Belz, E.; Gurrola, E.; Hensley, S.; Kobrick, M.; Lavalle, M.; Martin, J.; Neumann, M.; Nguyen, Q.; et al. Nasadem global elevation model: Methods and progress. Int. Arch. Photogramm. Remote Sens. Spat. Inf. Sci. 2016, XLI-B4, 125–128. [Google Scholar] [CrossRef] [Green Version]
  37. Sanchez, A.H.; Picoli, M.C.A.; Camara, G.; Andrade, P.R.; Chaves, M.E.D.; Lechler, S.; Soares, A.R.; Marujo, R.F.; Simões, R.E.O.; Ferreira, K.R.; et al. Comparison of cloud cover detection algorithms on sentinel–2 images of the amazon tropical forest. Remote Sens. 2020, 12, 1284. [Google Scholar] [CrossRef] [Green Version]
  38. Fuentes, I.; Scalzo, R.; Vervoort, R.W. Volume and uncertainty estimates of on-farm reservoirs using surface reflectance and LiDAR data. Environ. Model. Softw. 2021, 143, 105095. [Google Scholar] [CrossRef]
  39. Haralick, R.M.; Shanmugam, K.; Dinstein, I.H. Textural features for image classification. IEEE Trans. Syst. Man Cybern. 1973, SMC-3, 610–621. [Google Scholar] [CrossRef] [Green Version]
  40. Nelson, P.; Webb, M.; Berthelsen, S.; Curry, G.; Yinil, D.; Fidelis, C. Nutritional Status of Cocoa in Papua New Guinea; Technical Report; Australian Centre for International Agricultural Research (ACIAR): Canberra, Australia, 2011.
  41. Singh, K.; Fuentes, I.; Fidelis, C.; Yinil, D.; Sanderson, T.; Snoeck, D.; Minasny, B.; Field, D.J. Cocoa suitability mapping using multi-criteria decision making: An agile step towards soil security. Soil Secur. 2021, 5, 100019. [Google Scholar] [CrossRef]
  42. Scott, R.; Heyligers, P.; Speight, J.; Saunders, J.; McAlpine, J. No. 20 lands of Bougainville and Buka islands, territory of Papua and New Guinea. CSIRO Land Res. Surv. 1967, 2010, 1–196. [Google Scholar]
  43. Badillo, S.; Banfai, B.; Birzele, F.; Davydov, I.I.; Hutchinson, L.; Kam-Thong, T.; Siebourg-Polster, J.; Steiert, B.; Zhang, J.D. An introduction to machine learning. Clin. Pharmacol. Ther. 2020, 107, 871–885. [Google Scholar] [CrossRef] [Green Version]
  44. Gao, X.; Huete, A.R.; Ni, W.; Miura, T. Optical–biophysical relationships of vegetation spectra without background contamination. Remote Sens. Environ. 2000, 74, 609–620. [Google Scholar] [CrossRef]
  45. Gao, B.-C. Ndwi—A normalized difference water index for remote sensing of vegetation liquid water from space. Remote Sens. Environ. 1996, 58, 257–266. [Google Scholar] [CrossRef]
  46. Gitelson, A.A.; Vina, A.; Ciganda, V.; Rundquist, D.C.; Arkebauer, T.J. Remote estimation of canopy chlorophyll content in crops. Geophys. Res. Lett. 2005, 32. [Google Scholar] [CrossRef] [Green Version]
  47. Vogelmann, J.; Rock, B.; Moss, D. Red edge spectral measurements from sugar maple leaves. Int. J. Remote Sens. 1993, 14, 1563–1575. [Google Scholar] [CrossRef]
  48. Gitelson, A.A.; Viña, A.; Arkebauer, T.J.; Rundquist, D.C.; Keydan, G.; Leavitt, B. Remote estimation of leaf area index and green leaf biomass in maize canopies. Geophys. Res. Lett. 2003, 30. [Google Scholar] [CrossRef] [Green Version]
  49. Saco, P.M.; Carpi, L.C.; Figliola, A.; Serrano, E.; Rosso, O.A. Entropy analysis of the dynamics of el niño/southern oscillation during the Holocene. Phys. A Stat. Mech. Its Appl. 2010, 389, 5022–5027. [Google Scholar] [CrossRef]
  50. Fuentes, I.; Padarian, J.; Iwanaga, T.; Vervoort, R.W. 3d lithological mapping of borehole descriptions using word embeddings. Comput. Geosci. 2020, 141, 104516. [Google Scholar] [CrossRef]
  51. Fitzgerald, R.W.; Lees, B.G. Assessing the classification accuracy of multisource remote sensing data. Remote Sens. Environ. 1994, 47, 362–368. [Google Scholar] [CrossRef]
  52. van Vliet, J.; Bregt, A.K.; Hagen-Zanker, A. Revisiting Kappa to account for change in the accuracy assessment of land-use change models. Ecol. Model. 2011, 222, 1367–1375. [Google Scholar] [CrossRef]
  53. Sharififar, A.; Sarmadian, F. Coping with imbalanced data problem in digital mapping of soil classes. Eur. J. Soil Sci. 2023, 74, e13368. [Google Scholar] [CrossRef]
  54. Foody, G.M. Explaining the unsuitability of the kappa coefficient in the assessment and comparison of the accuracy of thematic maps obtained by image classification. Remote Sens. Environ. 2020, 239, 111630. [Google Scholar] [CrossRef]
  55. Huete, A.; Didan, K.; Miura, T.; Rodriguez, E.P.; Gao, X.; Ferreira, L.G. Overview of the radiometric and biophysical performance of the MODIS vegetation indices. Remote Sens. Environ. 2002, 83, 195–213. [Google Scholar] [CrossRef]
  56. Seager, S.; Turner, E.L.; Schafer, J.; Ford, E.B. Vegetation’s red edge: A possible spectroscopic biosignature of extraterrestrial plants. Astrobiology 2005, 5, 372–390. [Google Scholar] [CrossRef] [PubMed]
  57. Delegido, J.; Verrelst, J.; Meza, C.M.; Rivera, J.P.; Alonso, L.; Moreno, J. A red-edge spectral index for remote sensing estimation of green LAI over agroecosystems. Eur. J. Agron. 2013, 46, 42–52. [Google Scholar] [CrossRef]
  58. Shah, A.D.; Bartlett, J.W.; Carpenter, J.; Nicholas, O.; Hemingway, H. Comparison of random forest and parametric imputation models for imputing missing data using MICE: A CALIBER study. Am. J. Epidemiol. 2014, 179, 764–774. [Google Scholar] [CrossRef] [Green Version]
  59. Grange, S.K.; Carslaw, D.C. Using meteorological normalisation to detect interventions in air quality time series. Sci. Total Environ. 2019, 653, 578–588. [Google Scholar] [CrossRef]
  60. Srisa-An, C. Guideline of collinearity-avoidable regression models on time-series analysis. In Proceedings of the 2021 2nd International Conference on Big Data Analytics and Practices (IBDAP), Bangkok, Thailand, 26–27 August 2021; IEEE: Piscataway, NJ, USA, 2021; pp. 28–32. [Google Scholar]
  61. Toloşi, L.; Lengauer, T. Classification with correlated features: Unreliability of feature ranking and solutions. Bioinformatics 2011, 27, 1986–1994. [Google Scholar] [CrossRef] [Green Version]
  62. Hansen, M.C.; Stehman, S.V.; Potapov, P.V.; Loveland, T.R.; Townshend, J.R.; DeFries, R.S.; Pittman, K.W.; Arunarwati, B.; Stolle, F.; Steininger, M.K.; et al. Humid tropical forest clearing from 2000 to 2005 quantified by using multi- temporal and multiresolution remotely sensed data. Proc. Natl. Acad. Sci. USA 2008, 105, 9439–9444. [Google Scholar] [CrossRef]
  63. Seddon, A.W.; Macias-Fauria, M.; Long, P.R.; Benz, D.; Willis, K.J. Sensitivity of global terrestrial ecosystems to climate variability. Nature 2016, 531, 229–232. [Google Scholar] [CrossRef] [Green Version]
  64. Kroeger, A.; Bakhtary, H.; Haupt, F.; Streck, C. Eliminating Deforestation from the Cocoa Supply Chain; World Bank: Washington, DC, USA, 2017. [Google Scholar]
  65. Hanson, L.W.; Bourke, R.M.; Yinil, D.S. Cocoa and Coconut Growing Environments in Papua New Guinea: A Guide for Research and Extension Activities; Australian Agency for International Development: Canberra, Australia, 1998.
  66. Astola, H.; Häme, T.; Sirro, L.; Molinier, M.; Kilpi, J. Comparison of sentinel-2 and landsat 8 imagery for forest variable prediction in boreal region. Remote Sens. Environ. 2019, 223, 257–273. [Google Scholar] [CrossRef]
  67. Garbarino, M.; Weisberg, P.J. Land-use legacies and forest change. Landsc. Ecol. 2020, 35, 2641–2644. [Google Scholar] [CrossRef]
  68. Freyne, D.; Bleeker, P.; Wayi, B.; Jeffery, P. Root Development of Cocoa in Papua New Guinea Soils; Land Utilisation Section, Department of Agriculture and Livestock: Port Moresby, Papua New Guinea, 1996; ISBN 9980998903.
  69. Fahmy, F. Soil and leaf analyses in relation to the nutrition of tree crops in Papua New Guinea. In Proceedings of the Conference on Classification and Management of Tropical Soils, Kuala Lumpur, Malaysia, 15–20 August 1980; Number L-0224. Malaysian Society of Soil Science: Kuala Lumpur, Malaysia, 1980. [Google Scholar]
  70. Singh, K.; Aitkenhead, M.; Fidelis, C.; Yinil, D.; Sanderson, T.; Snoeck, D.; Field, D.J. Optimization of spectral preprocessing for estimating soil condition on small farms. Soil Use Manag. 2022, 38, 150–163. [Google Scholar] [CrossRef]
  71. Alamgir, M.; Sloan, S.; Campbell, M.J.; Engert, J.; Kiele, R.; Porolak, G.; Mutton, T.; Brenier, A.; Ibisch, P.L.; Laurance, W.F. Infrastructure expansion challenges sustainable development in Papua New Guinea. PLoS ONE 2019, 14, e0219408. [Google Scholar] [CrossRef] [PubMed] [Green Version]
  72. Dudley, N.; Alexander, S. Agriculture and biodiversity: A review. Biodiversity 2017, 18, 45–49. [Google Scholar] [CrossRef]
  73. Wessel, M. Shade and nutrition. In Cocoa; 1985; pp. 166–194. Available online: https://research.wur.nl/en/publications/shade-and-nutrition (accessed on 19 July 2021).
  74. Dawoe, E.; Isaac, M.E.; Quashie Sam, J. Litter fall and litter nutrient dynamics under cocoa ecosystems in lowland humid Ghana. Plant Soil 2020, 330, 55–64. [Google Scholar] [CrossRef]
  75. de Sousa, K.; van Zonneveld, M.; Holmgren, M.; Kindt, R.; Ordoñez, J.C. The future of coffee and cocoa agroforestry in a warmer Mesoamerica. Sci. Rep. 2019, 9, 8828. [Google Scholar] [CrossRef] [Green Version]
  76. Isaac, M.E.; Dawoe, E.; Sieciechowicz, K. Assessing local knowledge use in agroforestry management with cognitive maps. Environ. Manag. 2009, 43, 1321–1329. [Google Scholar] [CrossRef]
  77. Wade, A.S.; Asase, A.; Hadley, P.; Mason, J.; Ofori-Frimpong, K.; Preece, D.; Spring, N.; Norris, K. Management strategies for maximizing carbon storage and tree species diversity in cocoa-growing landscapes. Agric. Ecosyst. Environ. 2010, 138, 324–334. [Google Scholar] [CrossRef]
  78. Tondoh, J.E.; Kouamé, F.N.; Guéi, A.M.; Sey, B.; Koné, A.W.; Gnessougou, N. Ecological changes induced by full-sun cocoa farming in Côte d’Ivoire. Glob. Ecol. Conserv. 2015, 3, 575–595. [Google Scholar] [CrossRef] [Green Version]
Figure 1. Bougainville study region. Climatic and elevation characteristics are in the lower panels.
Remotesensing 15 03492 g001
Figure 2. Cloud occurrence in Sentinel-2 collection.
Remotesensing 15 03492 g002
Figure 3. Cocoa suitability map of Bougainville adapted from Singh et al. [41]. Numbers refer to land suitability classes for cocoa cultivtaion.
Remotesensing 15 03492 g003
Figure 4. Bougainville legacy map of land capability produced in 1967 [42].
Remotesensing 15 03492 g004
Figure 5. The (a) soil map of Bougainville and (b) soil validation points [40].
Remotesensing 15 03492 g005
Figure 6. Flowchart of the supervised classification of cocoa.
Remotesensing 15 03492 g006
Figure 7. Relevant bands and indices by their importance from the random forest classification. Raw bands (B2, B4, B7, B12, B5, B3, B11, and B6) were extracted and used as covariates as well as to calculate vegetation indices, which were used with the raw bands. Six vegetation indices were calculated for different calendar years using the visible, near-infrared (NIR), and red edge bands. Vegetation indices include the enhanced vegetation index (EVI), the normalised difference moisture index (NDMI), and the chlorophyll index green (Chl), which are visible NIR-based indices, the Vogelmann Red Edge Index (VREI), the chlorophyll red edge index (CIr), the red edge curve index (RECI), vertical transmit and vertical receive (VV), angular second moment (VVasm), variance (VVvar), inverse different moments (VVidm), and entropy (VVent).
Remotesensing 15 03492 g007
Figure 8. Correlogram of covariates used in the random forest algorithm.
Remotesensing 15 03492 g008
Figure 9. The (a) cocoa potential classification map of Bougainville with green areas identified as regions with cocoa potential and non-green as non-cocoa regions and (b) uncertainty map of cocoa orchards in Bougainville.
Remotesensing 15 03492 g009
Figure 10. Zoomed-in sections of classified map: (a) North; (b) Central; (c) South, and (d) West Bougainville.
Remotesensing 15 03492 g010
Figure 11. Example of zoomed-in satellite and classified areas. Images (AD) represent examples of good detection of potential cocoa orchards (under coconut plantations) and (EH) represent examples of poor detection.
Remotesensing 15 03492 g011
Table 2. Classification accuracy for calibration and validation datasets.
DatasetKappaOverall AccuracyProducer’s AccuracyConsumer’s AccuracyF1-Score
Calibration0.9990.998Cocoa region: 0.999Cocoa region: 0.999Cocoa region: 0.999
Non-cocoa: 0.998Non-cocoa: 0.999Non-cocoa: 0.999
Validation0.9290.974Cocoa region: 0.992Cocoa region: 0.992Cocoa region: 0.983
Non-cocoa: 0.918Non-cocoa: 0.977Non-cocoa: 0.948
Table 3. Cocoa grown in Bougainville on different soil types.
Soil TypeSoil Area (ha)Area of Cocoa Grown by Soil Type (%)
Af-Ferric Acrisol50,177.71.46
Bh-Humic Cambisol68,292.10.14
Je-Eutric Fluvisol98,743.78.34
LC-Chromic Luvisol43,727.022.32
TM-Andosol633,407.475.24
Table 4. A potential land cover monitoring tool. Area under cocoa in years 2019 and 2020 in Bougainville.
YearRegionArea (km2)
2019Non-cocoa8893.16
Cocoa479.97
2020Non-cocoa8885.85
Cocoa487.28
Change 2019–2020Non-cocoa−7.31
Cocoa7.31
Table 5. Suitability class areas for cocoa orchards in Bougainville and the corresponding planted areas.
Cocoa SuitabilityArea (ha)Area of Cocoa in Bougainville (%)Area of Cocoa within Class (%)
Suitability 1000
Suitability 28738.70.241.16
Suitability 3437,677.124.682.35
Suitability 4413,485.069.216.97
Suitability 512,467.15.8619.58
Disclaimer/Publisher’s Note: The statements, opinions and data contained in all publications are solely those of the individual author(s) and contributor(s) and not of MDPI and/or the editor(s). MDPI and/or the editor(s) disclaim responsibility for any injury to people or property resulting from any ideas, methods, instructions or products referred to in the content.

