
The Effects of Discharge Changes in Siberian Rivers on Arctic Sea-Ice Melting

1
State Key Laboratory of Cryospheric Science, Northwest Institute of Eco-Environment and Resources, Chinese Academy of Sciences, Lanzhou 730000, China
2
University of Chinese Academy of Sciences, Beijing 100049, China
*
Author to whom correspondence should be addressed.
Remote Sens. 2023, 15(14), 3477; https://doi.org/10.3390/rs15143477
Submission received: 24 May 2023
/
Revised: 2 July 2023
/
Accepted: 7 July 2023
/
Published: 10 July 2023
(This article belongs to the Section Ocean Remote Sensing)
Abstract
:Arctic river discharge is one of the important factors affecting sea-ice melting of Arctic shelf seas. However, such effects have not been given much attention. In this study, the changes in discharge of the Ob, Yenisei, and Lena Rivers and the sea ice of the Kara and Laptev Seas during 1979–2019 were analyzed. Substantial increases in discharge and heat from the discharge and decreases in sea ice concentration (SIC) were detected. The effects of changes in discharge and riverine heat on sea ice changes were investigated. The results showed that the influence of the discharge, accumulated discharge, heat, and accumulated heat on SIC mainly occurred at the beginning and final stages of sea-ice melting. Discharge accelerated the melting of sea ice by increasing the absorption of solar radiation as the impurities contained in the discharge washed to the sea ice surface during the initial and late stages of sea-ice melting. Changes in cumulative riverine heat from May to September greatly contributed to the SIC changes in the Kara and Laptev Seas at the seasonal scale. The SIC reduced by 1% when the cumulative riverine heat increased by 213.2 × 10⁶ MJ, 181.5 × 10⁶ MJ, and 154.6 × 10⁶ MJ in the Lena, Yenisei, and Ob Rivers, respectively, from May to September. However, even in the plume coverage areas in the Kara and Laptev Seas, discharge changes from the three rivers had a limited contribution to the reduction in SIC at annual scales. This work is helpful for understanding the changes in Arctic sea ice.
1. Introduction
The Arctic sea ice is the main habitat for many animals such as polar bears, seals, and seabirds. A reduction in sea ice can lead to shrinkage of their habitats and deteriorating living conditions, posing a threat to the ecosystem and biodiversity. Changes in Arctic sea ice also have significant impacts on shipping, fishing, and energy development [1,2,3]. Arctic sea ice has experienced rapid thinning and retreating over the past decades because of Arctic warming, with particularly dramatic changes since the 21st century [3,4,5]. The percentage of multi-year sea ice was 75% in the mid-1980s, and it dropped below 33% in 2018 [6,7]. The decrease in sea ice, in turn, impacts climate change. The Arctic Ocean is the freshest and most river-influenced ocean, receiving 11% of the world’s river discharge but containing only 1% of the world’s marine water [8,9]. Discharge from north-flowing rivers into the Arctic Ocean has changed markedly [10,11,12]. Discharge from the Lena, Yenisei, and Ob Rivers draining into the seas has increased by 7.4–22.0% during 1936–2019 [13]. Both the sea-ice melting and inflow of discharge into the Arctic Ocean begin at the edge position of the ocean and then advance toward the center. Therefore, studying the effects of discharge changes on regional sea-ice melting is of great significance for understanding the mechanisms behind sea-ice melting and the feedback between sea ice and climate change, protecting the Arctic ecosystem, and promoting international trade. Nevertheless, to date, there has been limited research on the effects of Siberian river discharge on sea ice.
It has been suggested that sea ice concentration (SIC) and discharge from some Arctic rivers have a negative correlation around the estuary in spring and a significant positive correlation just north of the estuary in summer [14]. Large amounts of heat, suspended particulate matter, and colored dissolved organic matter are carried into the Arctic Ocean by discharge from Arctic rivers [15,16,17]. Riverine heat from Arctic rivers directly contributes to the sea-ice melting in spring, summer, and autumn or inhibits the sea-ice formation in late autumn and early winter by warming the ocean [18]. A considerable influence of warm discharge from the Mackenzie River on Arctic sea-ice melting was found, with the help of the powerful Beaufort Gyre fragmented sea ice [19]. Furthermore, Park et al. (2020) estimated that 10% of the reduction in thickness of the Arctic regional sea ice was attributed to riverine heat during 1980–2015 [18]. However, a study using a stable isotope (δ18O) to derive the fractions of sea ice meltwater and river water in the ocean concluded that the riverine heat is too small to melt the observed sea ice loss in the process of sea-ice melting, and impurities contained in the discharge accelerate sea-ice melting by decreasing the sea ice albedo and increasing solar radiation absorption when they are flushed onto the sea ice surface [20,21].
Previous limited studies have made some progress in clarifying the effects of river discharge and riverine heat on Arctic sea-ice melting, but these gains are obviously far from enough due to the deficiency of observational data and complexity of the influencing process. In this study, (1) the monthly and annual long-term variations in discharge and heat of the Ob, Yenisei, and Lena Rivers, and SIC in the river plume coverage area of the Kara and Laptev Seas were analyzed; (2) the effects of monthly and annual discharge and riverine heat changes on SIC changes during the river unfreeze period were investigated, in particular, the absorbance data obtained from the Arctic Great Rivers Observatory were used to study the effect of monthly discharge changes on sea ice changes; and (3) the effects of riverine heat on SIC within a melting cycle from May to October were principally explored. This work is of great significance to understand the decay of Arctic sea ice.
2. Study Area
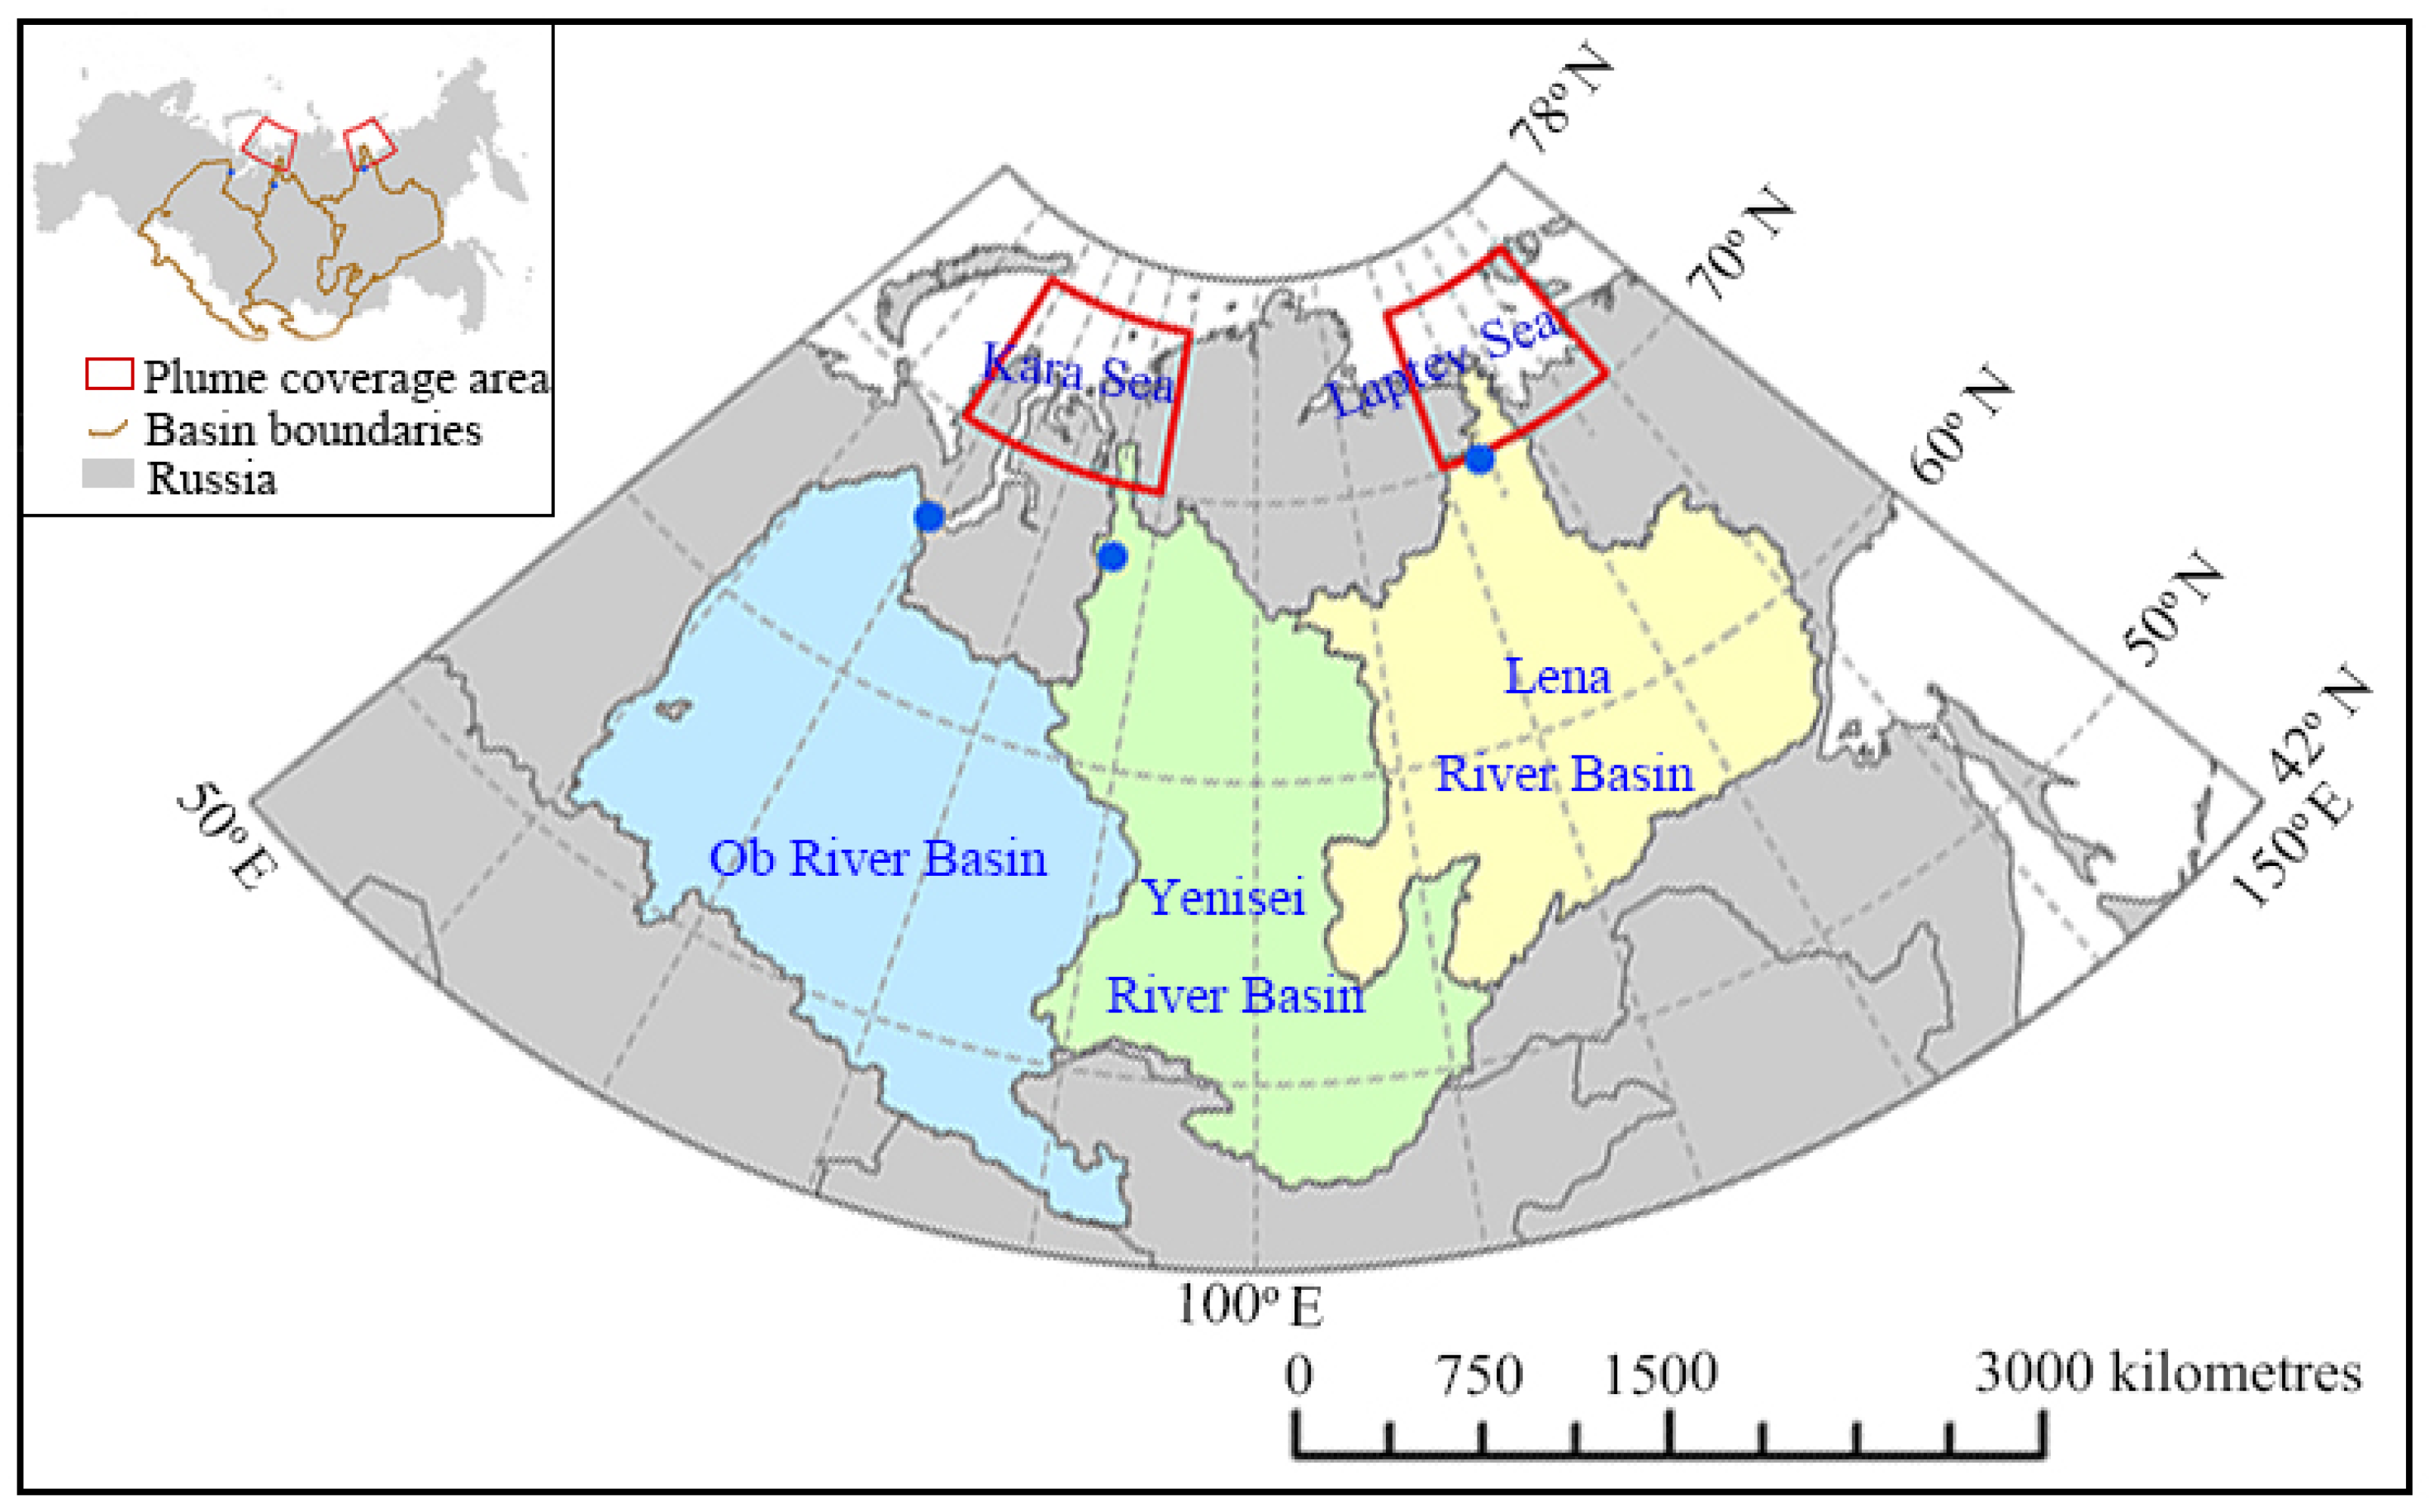
These rivers are the three largest rivers in the Arctic region in terms of basin area and discharge with drainage areas of 299 × 104 km2, 244 × 104 km2, and 243 × 104 km2, and average annual discharges of 407 km3 yr−1, 591 km3 yr−1, and 543 km3 yr−1, respectively [11,22,23,24]. The Kara and Laptev Seas are the primary seas into which the discharge of the three largest rivers enter. The river plumes from the three largest rivers extend for hundreds of kilometers in the Kara and Laptev Seas in latitude and longitude [25,26,27,28]. Therefore, the main coverage areas of the plumes in the Kara and Laptev Seas could be regarded as typical areas for studying the effects of discharge changes on sea-ice melting. We demarcated 68°E–90°E, 70°N–76°N in the Kara Sea and 120°E–140°E, 70°N–76°N in the Laptev Sea (Figure 1) as the study areas based on satellite observations and some situ measurements in 2016, during which the annual discharge of the Ob, Yenisei, and Lena Rivers (228,145.60 m3/s, 149,907.37 m3/s, and 131,218.70 m3/s, respectively) were all close to the multiyear annual average value (194,153.51 m3/s, 175,833.99 m3/s, and 124,323.99 m3/s, respectively) [29,30]. The study areas in the Kara and Laptev Seas cover an area of 22.6 × 10⁴ km2 and 23.4 ×10⁴ km2, respectively.
3. Materials and Methods
3.1. Data
3.1.1. Discharge and Absorbance Data
The Russian Hydrometeorological Service has been responsible for the discharge observation and archival management of Siberian rivers since the late 1930s, and the dataset has passed the quality validation standards of research institutions (e.g., Arctic and Antarctic Research Institute and Woods Hole Oceanographic Institution) [31]. In our study, discharge data from January 1979 to December 2019 on monthly scales and absorbance data on irregular dates from 2 June 2009 to 3 February 2017 on daily scales at the estuary station (Figure 1) were selected from the Arctic Great Rivers Observatory. There are some gaps in the discharge data (Ob River: January 2000–March 2000; Yenisei River: January 2000–April 2000, November 2000–December 2000, January 2002–February 2002, November 2002–March 2003, December 2003–March 2004, November 2004–December 2004, December 2006–January 2007) (https://arcticgreatrivers.org/data/) (accessed on 5 October 2021). We take the average discharge of two years with equal time (usually 1 year) from the year of missing data.
3.1.2. Riverine Heat Data
The heat carried by the river into the Arctic shelf seas is mainly determined by discharge and water temperature at the estuary [32,33]. In this study, the riverine heat was calculated using the equation below [34]:
where H represents monthly riverine heat (106 MJ); ‘86400’ is a constant that represents the number of seconds in a day; Cp (4.184 J/(°C g)) is the specific heat of river water; and ρ (106 g/m3) is the water density. The change in water density with temperature is negligible relative to the water temperature range of 0 to 20 °C; Q and T represent the monthly mean value of discharge (m3/s) and river water temperature (°C) around the estuary, respectively; and m represents the number of days with discharge and temperature data. However, it was a challenge to acquire a long-term sequence of river water temperature owing to the data limitation in the study area. Park et al. (2020) simulated Siberian river water temperature using a coupled hydrological and biogeochemical model (CHANGE) [18]. The simulated river temperature data were consistent with values at hydrological observation near estuaries when WATCH Forcing-Data ERA-Interim was used as input [35]. The simulated daily river temperature data at the hydrological observations near estuaries from January 1979 to December 2016 were finally selected to calculate the riverine heat.
H = 86400Cp·ρ·Q·T·(m/1012)
3.1.3. Sea Ice Concentration Data
The U.S. National Snow and Ice Data Center provides both monthly and daily sea ice index products, which contain SIC data throughout the Antarctic and the Arctic (https://nsidc.org/data/G02135/versions/3?qt-data_set_tabs=2#qt-data_set_tabs) (accessed on 10 May 2020). These data were developed by the NASA team, which do not require external parameters and can ensure the inversion process accuracy [36]. The monthly datasets are considered more reliable because they average out the errors in the daily products [37]. The products have a time span from November 1978 to the present with a spatial resolution of 25 km × 25 km [36]. The products have been widely used to study the changes in polar sea ice [38,39]. Monthly SIC data from January 1979 to December 2019 in our study area were selected for further analysis.
3.2. Methods
3.2.1. Theil-Sen Median Trend and Mann-Kendall Test
Compared with linear trend fitting, the Theil–Sen Median trend method can avoid the impact of missing data on the analysis results and eliminate the interference of outliers on time series data [40,41]. Therefore, it is reliable for analyzing time series data. The MK trend test is a non-parametric test method that does not require the sample to follow a specific distribution and is not affected by a few outliers [42]. It is widely used for trend significance analysis and detecting change points in time series data of precipitation, runoff, temperature, and other variables [43]. These two methods are often used together, and they were applied to investigate the changing trends of discharge, riverine heat, and SIC in this study [41,42,43,44].
3.2.2. Detrending and Pearson Correlation Analysis
The detrending method was developed in the process of studying the mechanism of DNA behavior [45]. Using this method to analyze time series can avoid the obvious pseudo-correlation phenomenon caused by the trend, and the detrending method has become a typical tool to explore the characteristics of long-term memory of climatic and hydrological series [46]. Pearson correlation analysis refers to the analysis of two or more variables that are correlated to measure the degree of correlation between the two variables, which has been widely used in previous studies [47,48,49]. The two methods were used to examine the correlation between the discharge/riverine heat and SIC during the sea ice melt season.
4. Results
4.1. Seasonality and Monthly Variations in Discharge, Riverine Heat, and SIC
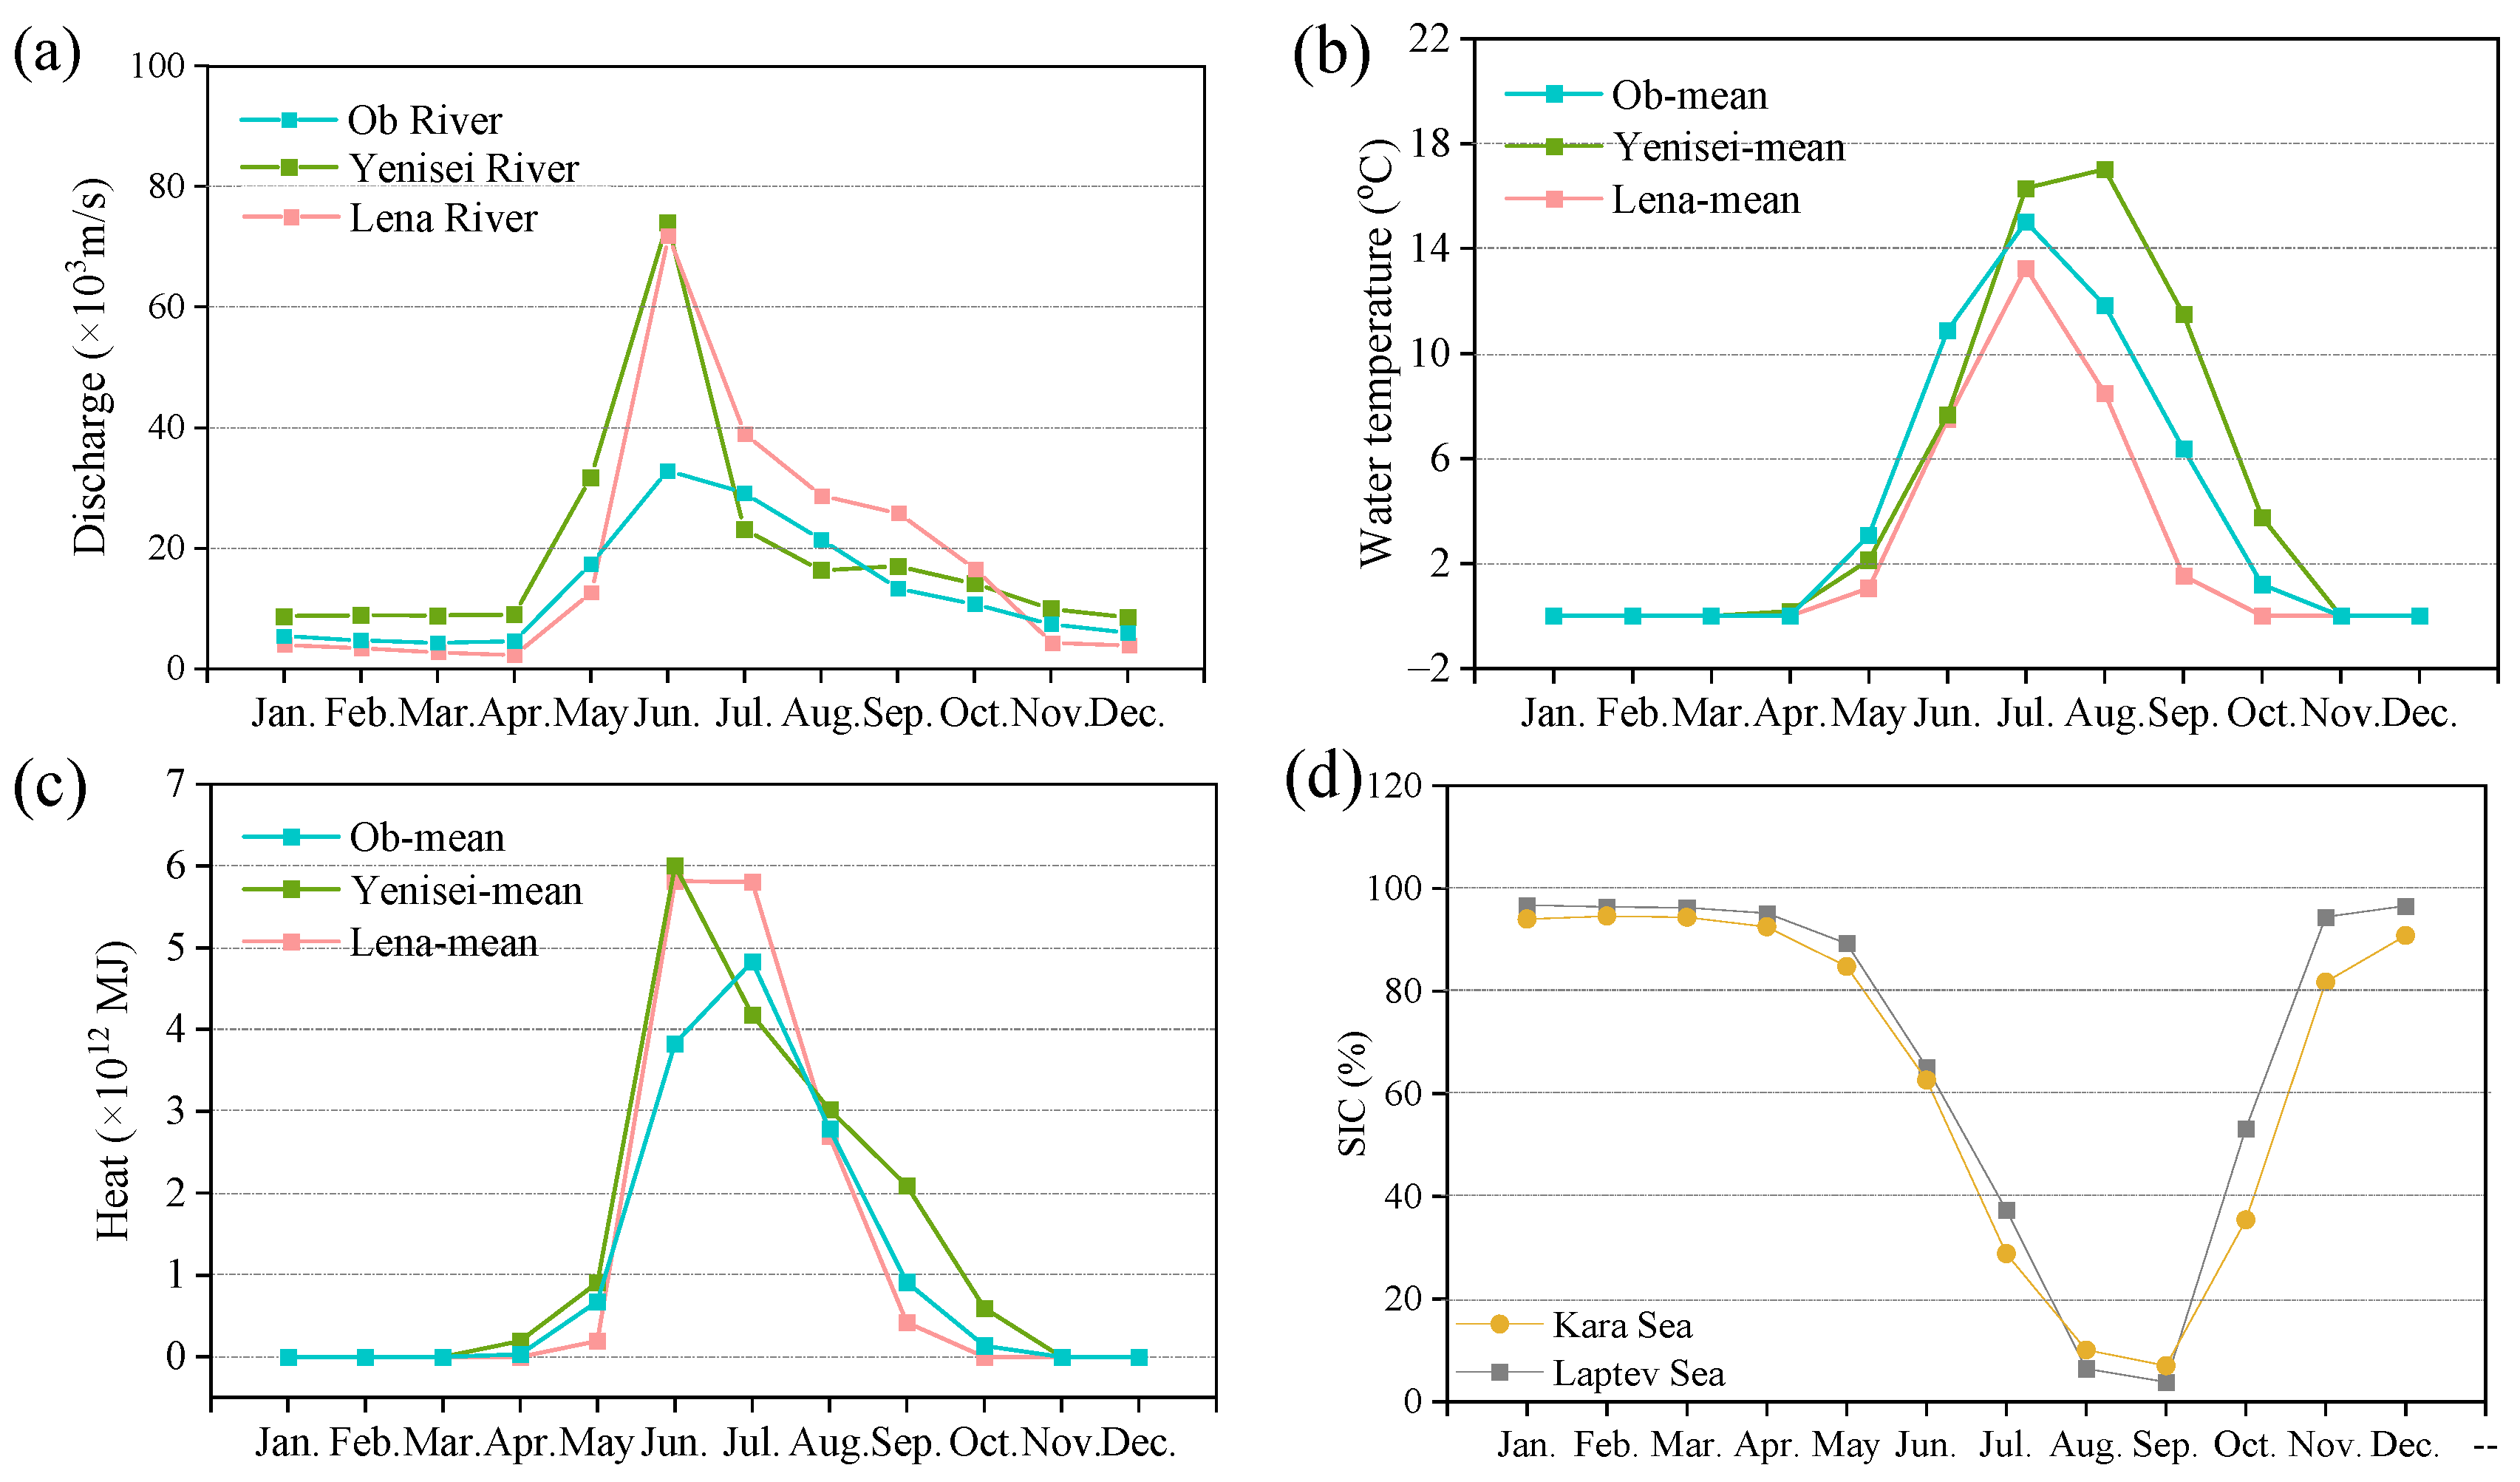
The Ob, Yenisei, and Lena Rivers had similar seasonal distributions in multiyear monthly mean discharge (1979–2019) (Figure 2a). A large portion of discharge from the three rivers flowed to the Arctic Ocean in May–October, and the discharge accounted for only 9.5–23.4% of the annual discharge in November–April. The rivers were at or near the freezing point during November–April when the river temperature was around 0 degrees Celsius (Figure 2b). River temperatures reached above 0 degrees Celsius from May to October, during which the rivers released heat into the Arctic Ocean (Figure 2b,c). The occurrence time of the maximum river heat was synchronized with or 1 month later than the maximum discharge (Figure 2c). The SIC in the Laptev Sea during November–April and the Kara Sea during December–April was above 90% and in a relatively stable state, but it changed dramatically from May to October due to sea-ice melting (Figure 2d). The maximum and minimum SIC of each region appeared in March and September, respectively.
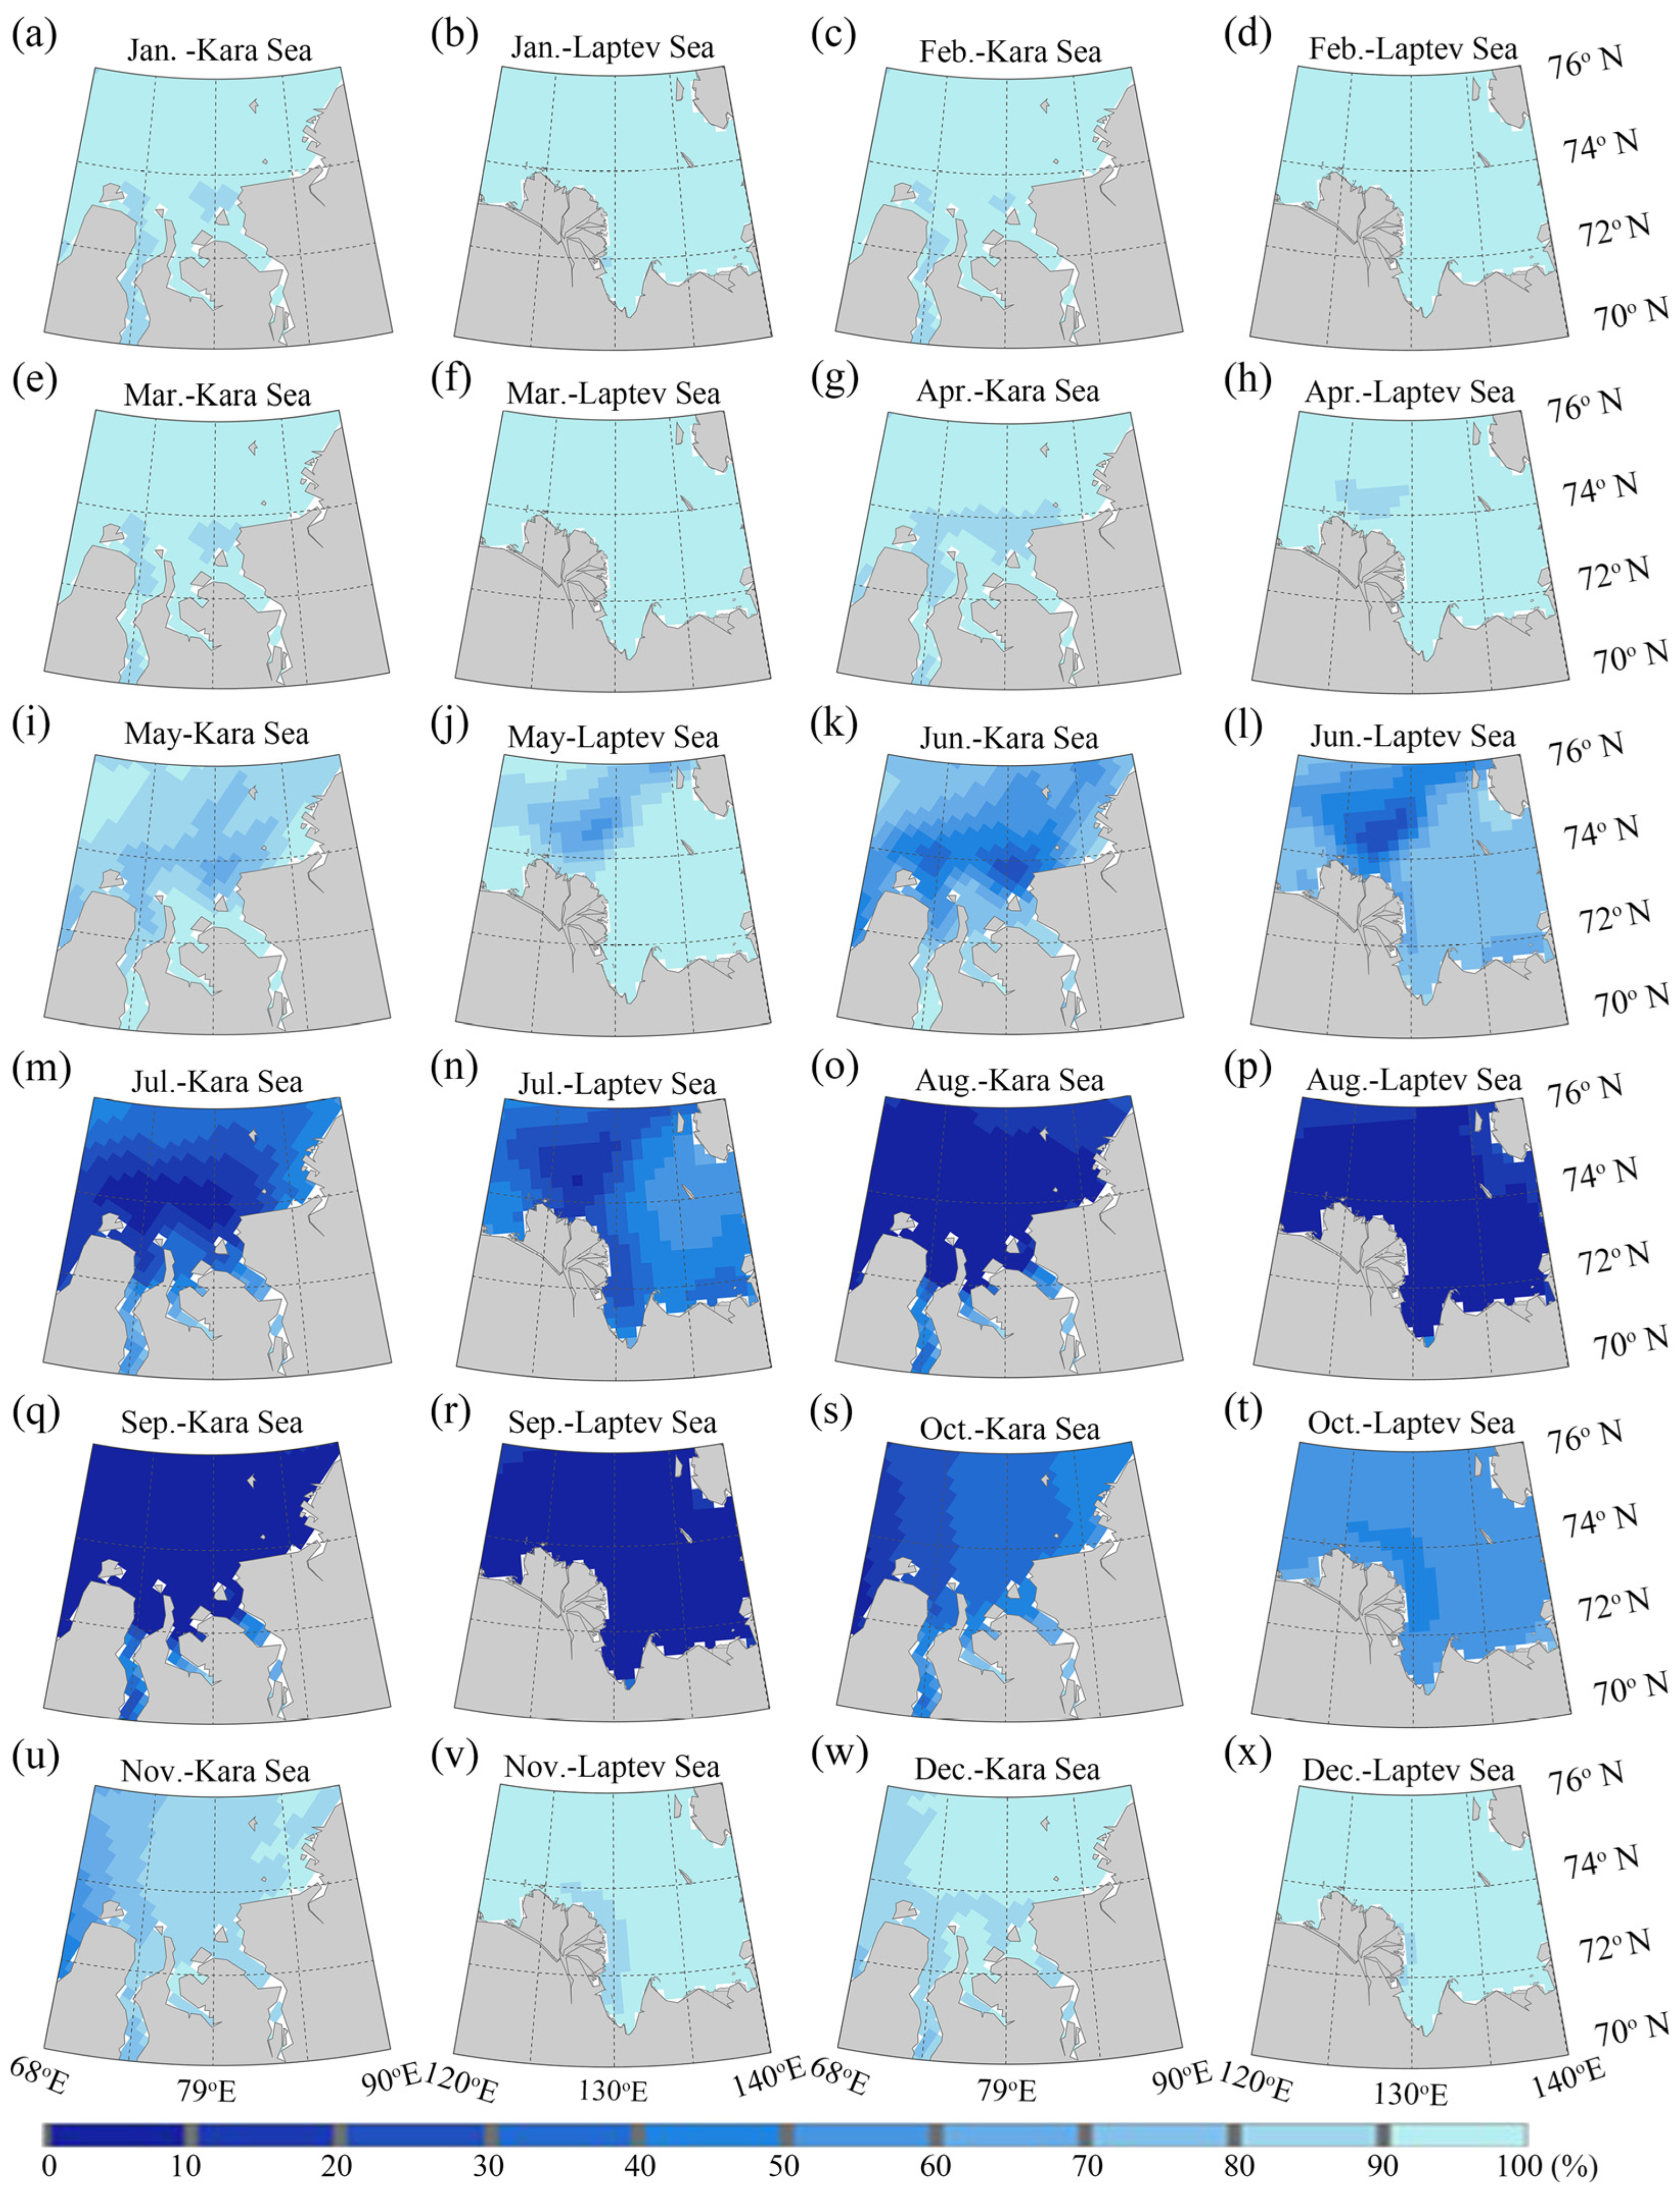
The spatial distribution of monthly mean SIC showed that most of the study areas were almost completely frozen from January to April (SIC > 90%), and a slight sea ice melt occurred only in the Kara Sea estuary and the region of 124°E–130°E, 70°N–76°N in the Laptev Sea (80% < SIC < 90%) (Figure 3a–h). The SIC in the Kara and Laptev Seas experienced extensive declines since May, with sea ice gradually melting from south to north and west to east between May and September (Figure 3i–r). The SIC was at its lowest in September, after which sea ice began to freeze in the opposite direction of melting, and most of the Kara and Laptev Seas were frozen again in December (Figure 3s–x).
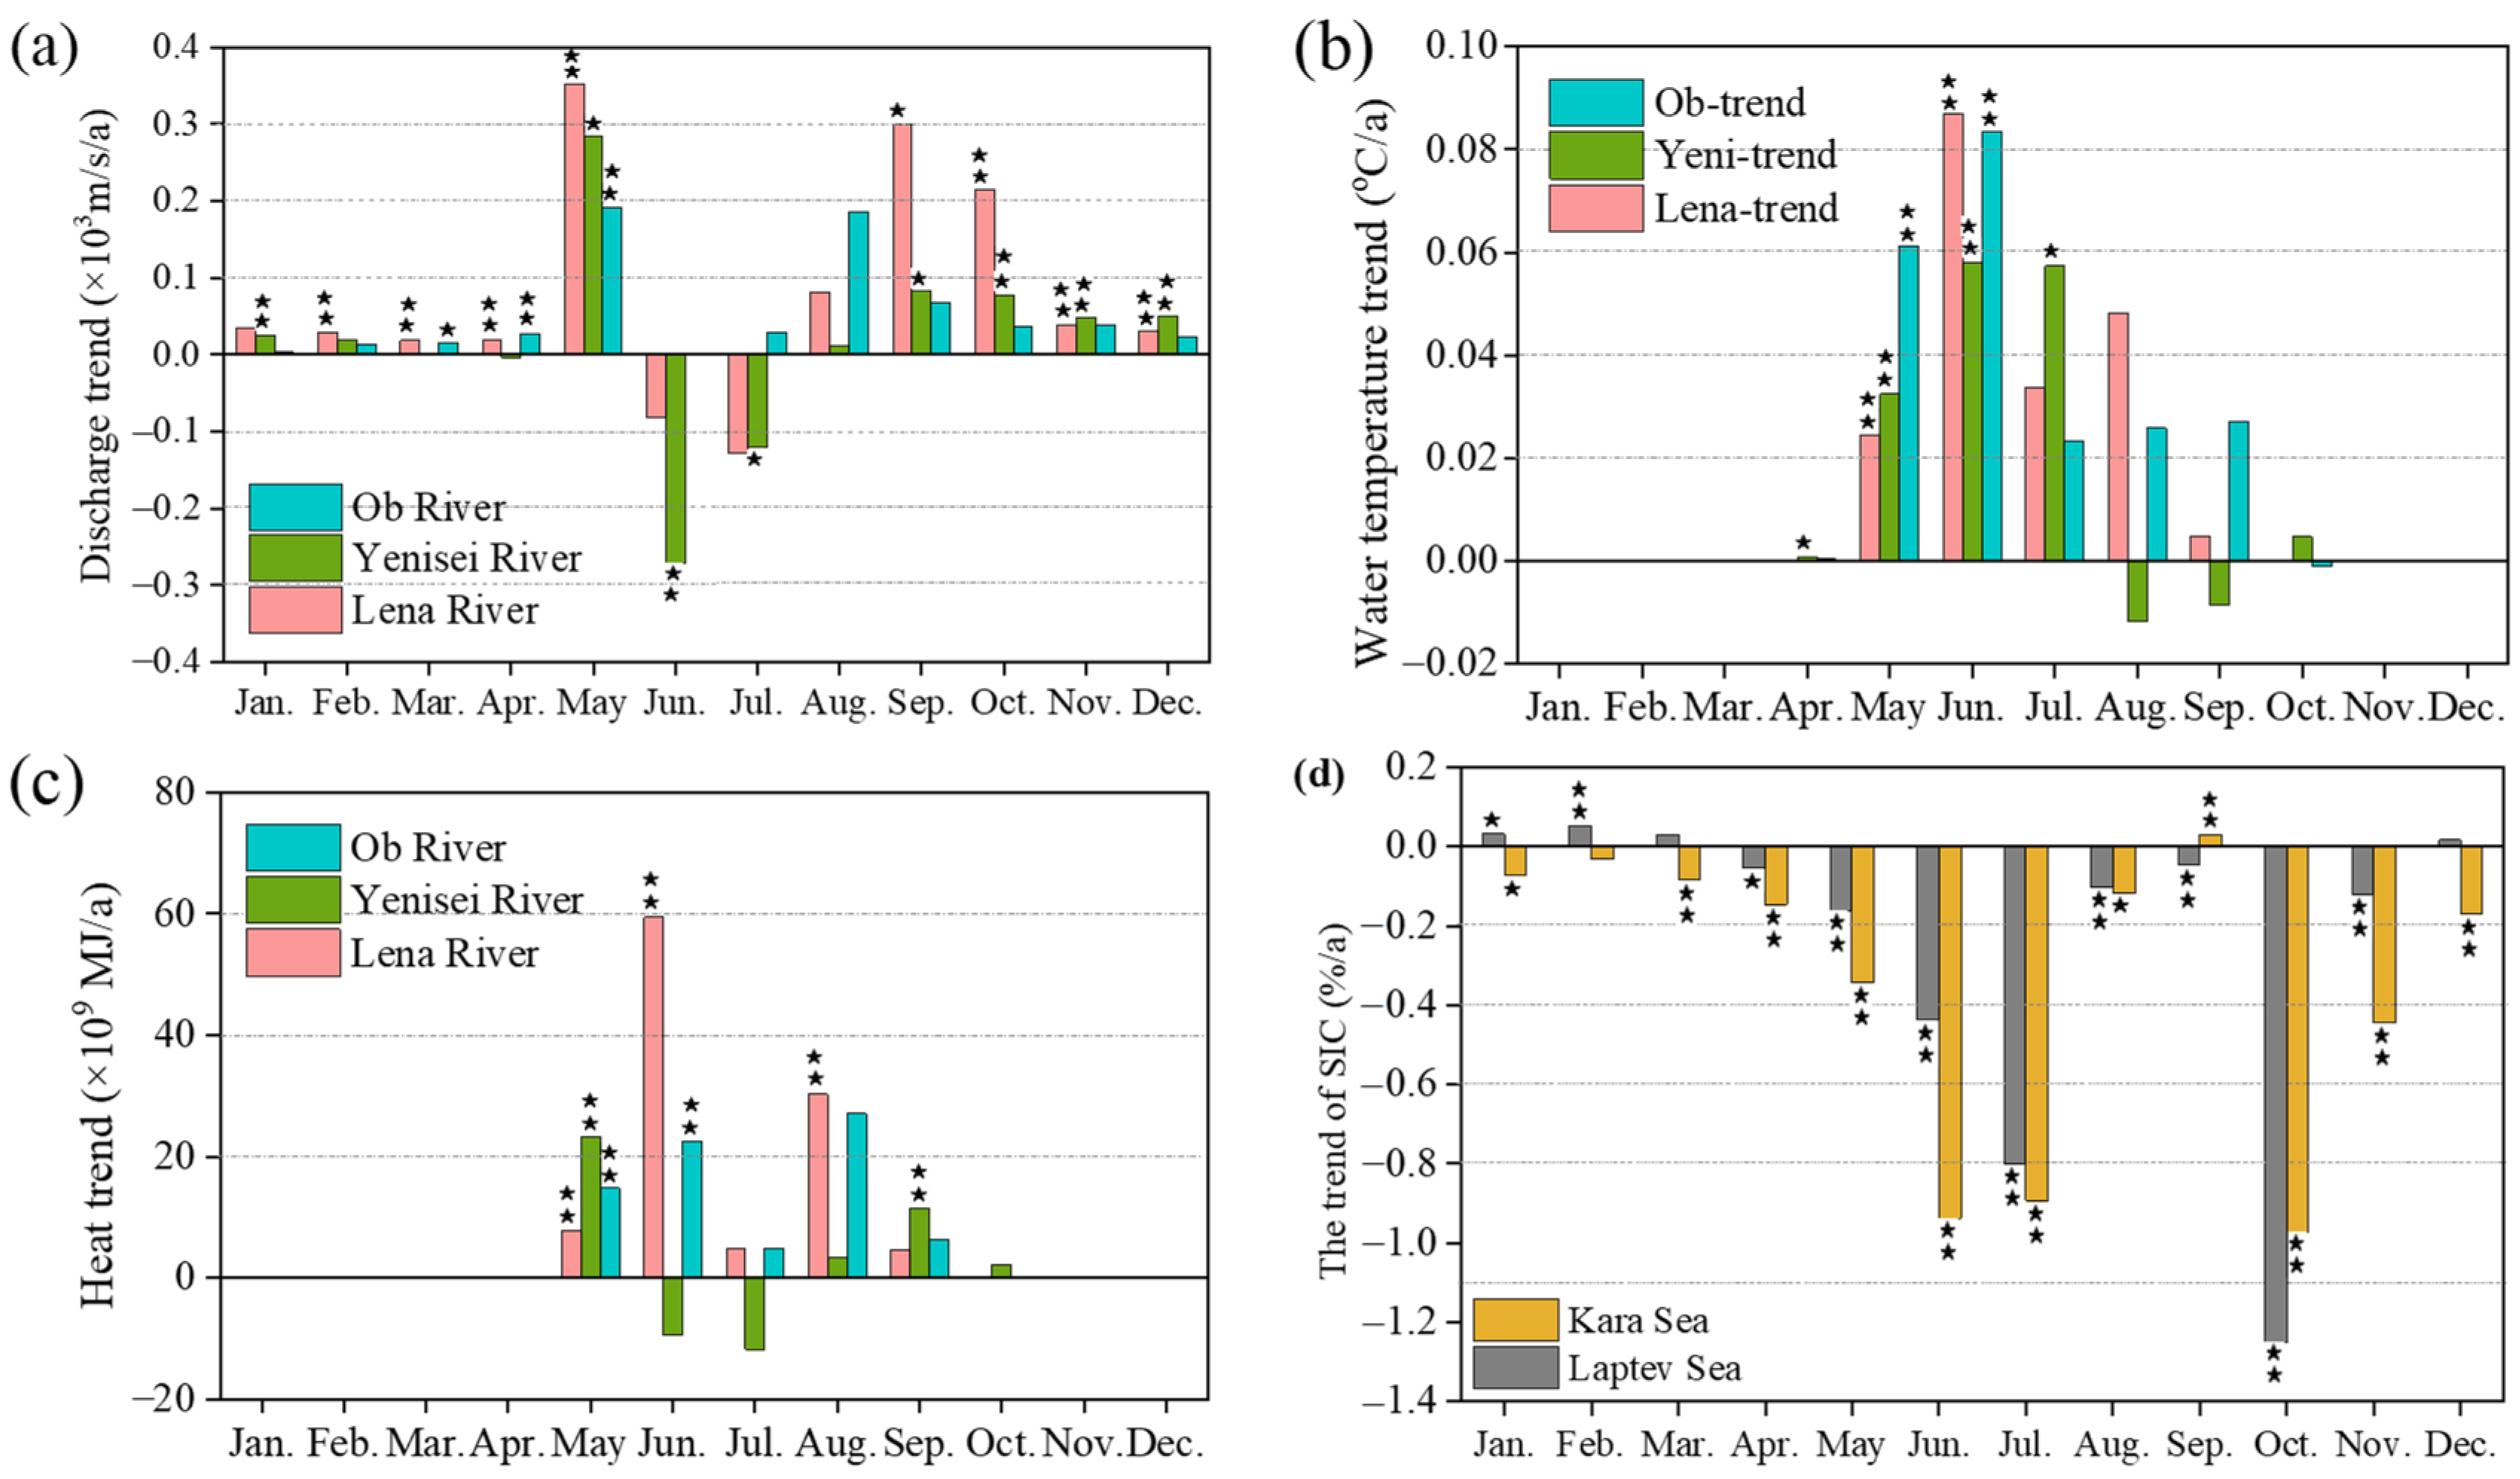
Trend analysis revealed that discharge in these three rivers increased throughout the year except June and July in the Yenisei and Lena Rivers (Figure 4a). The influencing factors and processes of runoff change are complicated. The variations in river water temperature and riverine heat mainly occurred in the unfrozen months from May to October (Figure 4b,c). The river temperature and heat of the three rivers showed an increasing trend in May–October, except for the temperature in August–October and the heat in June–July. Especially, the river water temperature in May–June and the riverine heat in May of the three rivers increased significantly (p < 0.05). The SIC in the Kara Sea decreased every month except September (Figure 4d). The SIC in Laptev Sea exhibited an increasing trend in December–March and a significant (p < 0.05) decreasing trend in April–November. The maximum amplitude of the monthly mean SIC variation in the Kara and Laptev Seas occurred in October, with rates of 0.97%/a and 1.25%/a, respectively.
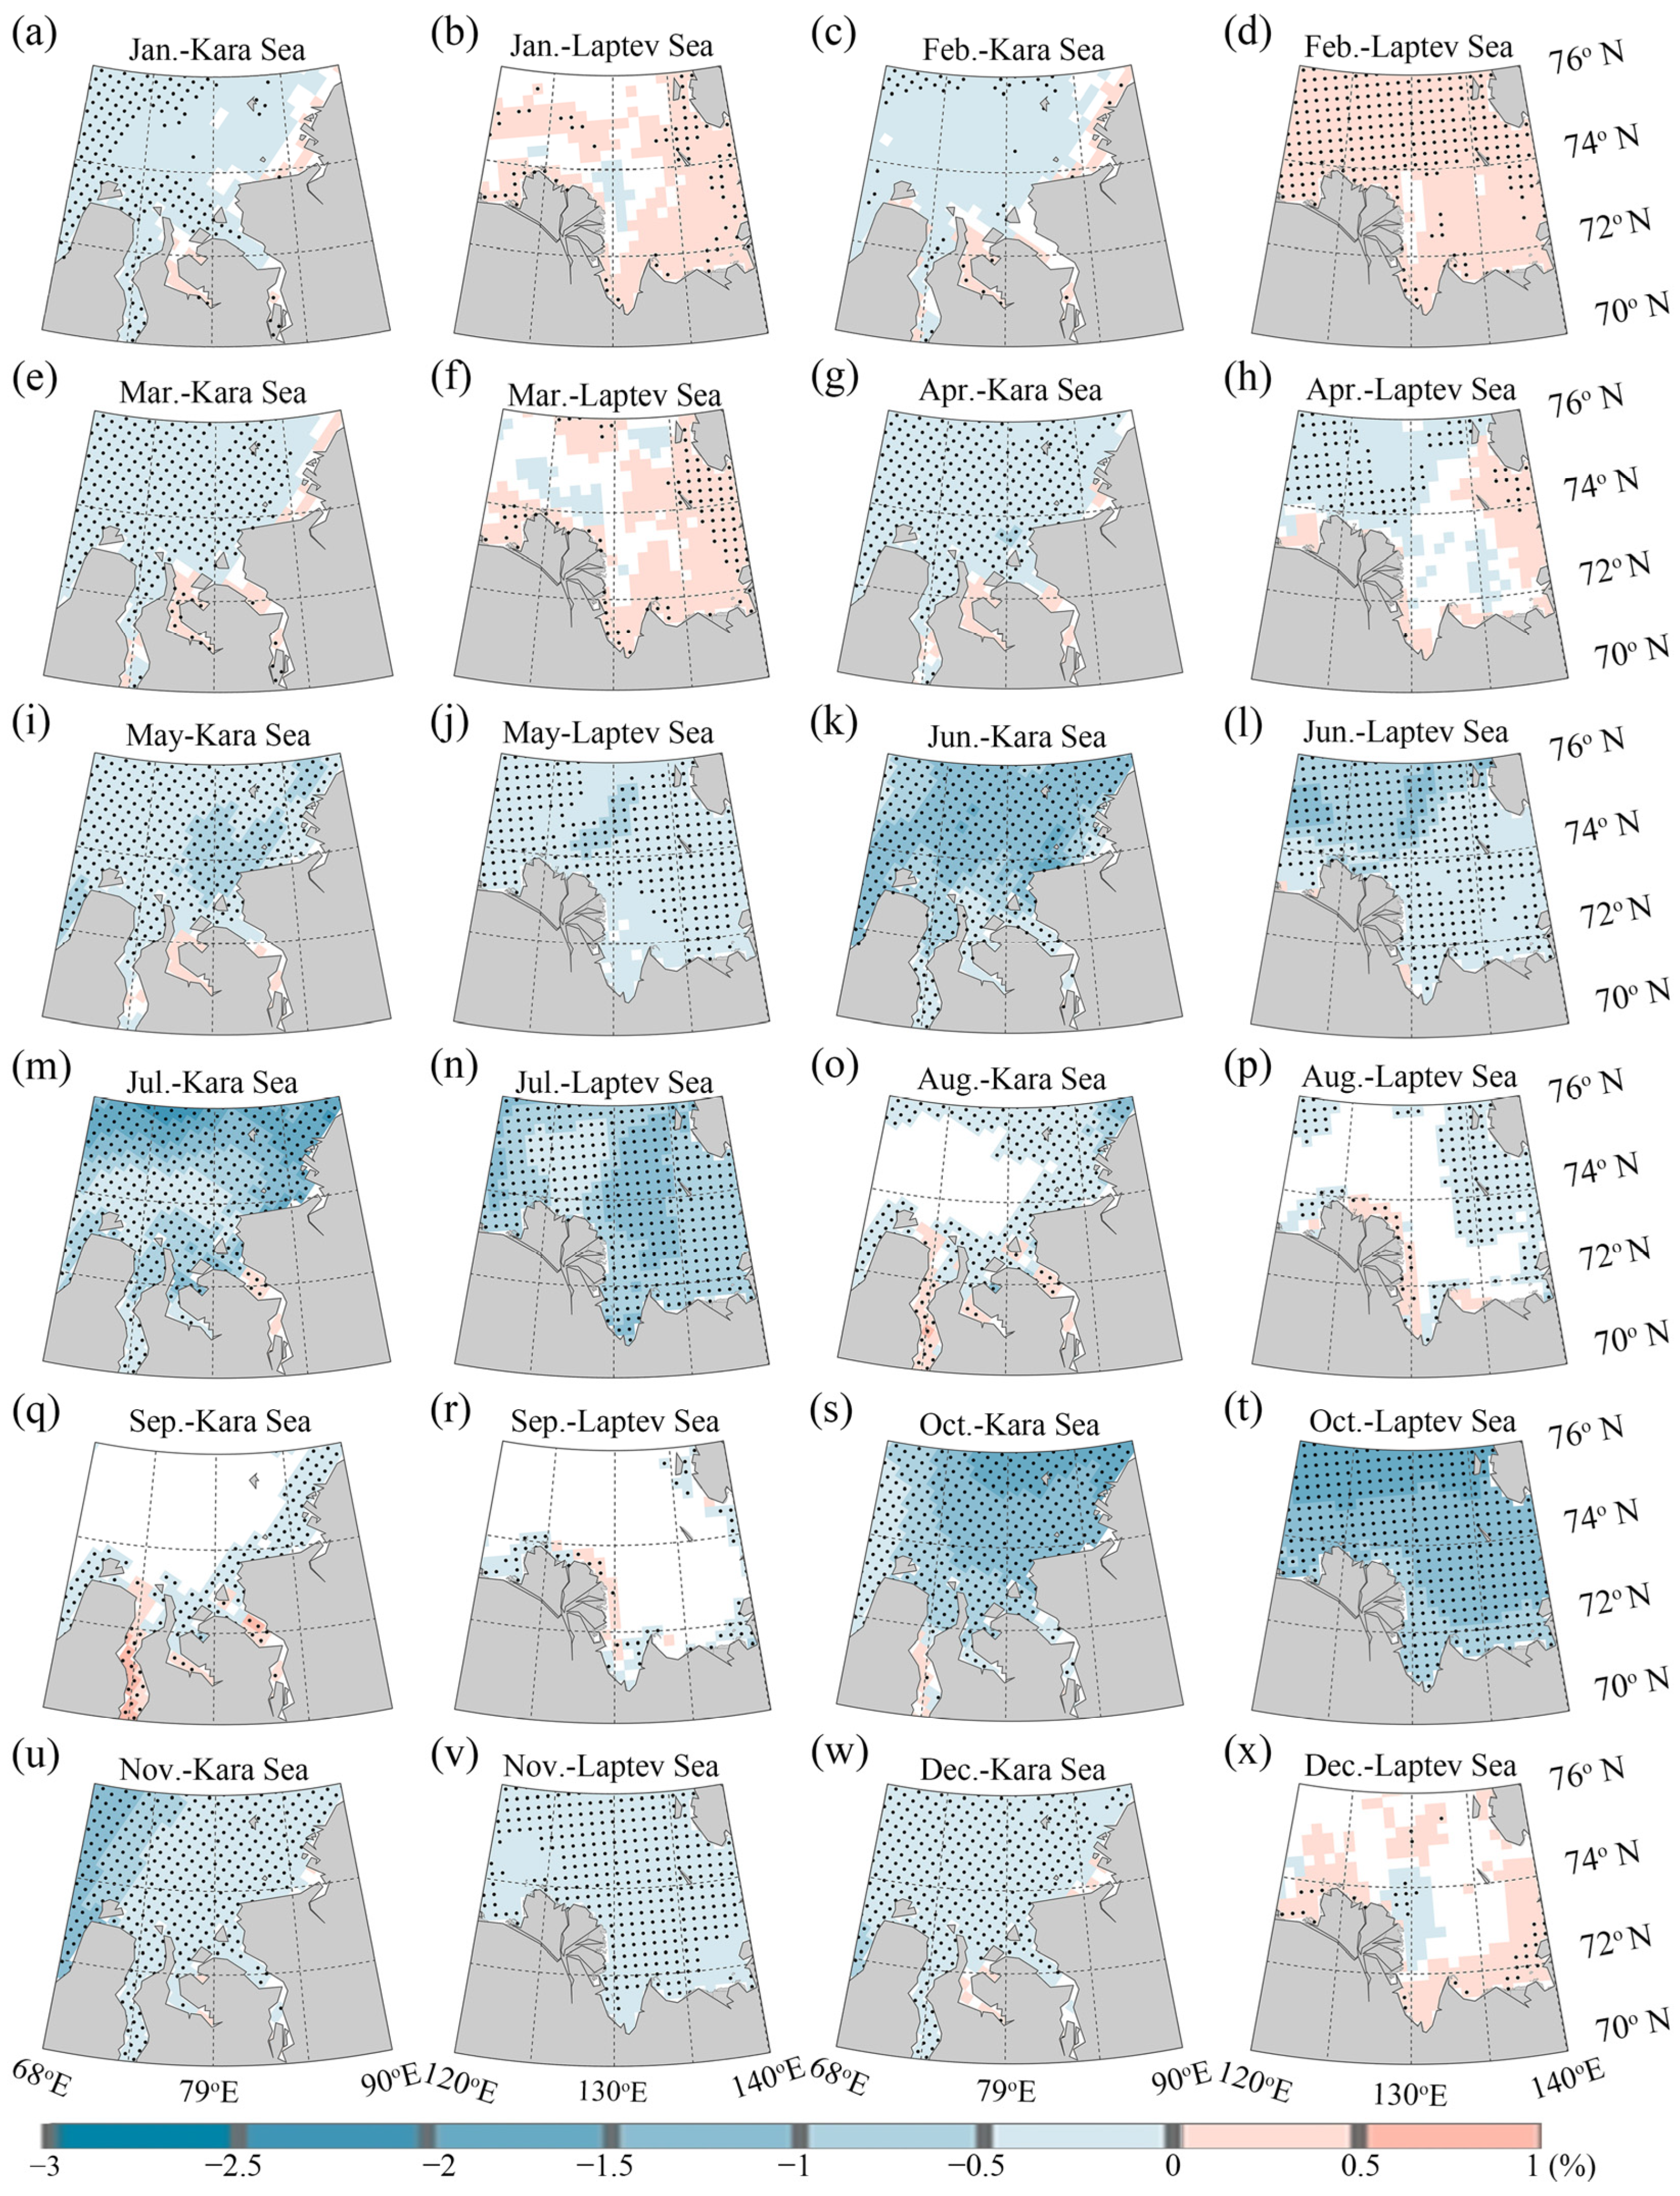
The SIC mainly had a slight and significant (p < 0.05) decreasing trend in a large-scale area of the Kara Sea, except for February, but a slight and significant (p < 0.05) increasing trend in different areas of the Laptev Sea in January–April and December (Figure 5a–h,w–x). The SIC in almost all areas of the Kara and Laptev Seas showed a significant decreasing trend (p < 0.05), with a maximum rate of more than 2.5%/a in May–July and October–November (Figure 5i–n,s–v). There was no change trend in the SIC in most areas of the two seas, and a small and significant (p < 0.05) decreasing or increasing trend only appeared in a few areas in August and September.
4.2. Variations in Annual Discharge, Riverine Heat, and SIC
The discharge of the Ob, Yenisei, and Lena Rivers from May to October accounted for 76.6%–90.5% of the annual discharge, and almost all of the heat from the three rivers was transported into the Arctic Ocean during this period. The melting of sea ice also occurred mainly in May–October. Therefore, the annual variations were analyzed in the case where the sum of discharge and mean SIC from May to October were treated as the annual discharge and annual mean SIC, respectively (Figure 6). The annual discharge showed an insignificant (p > 0.05) increasing trend in the Ob and Lena Rivers and decreasing trend in the Yenisei River during 1979–2019 (Figure 6a–c). The results were different from the variation during 1936–2015, during which the annual discharge showed an insignificant increasing trend (p > 0.05) in the Ob River, and a significant increasing trend (p < 0.05) in the Yenisei and Lena Rivers of 0.73 km3/a and 1.28 km3/a, respectively [11]. Annual riverine heat showed an insignificant (p > 0.05) increasing trend in the Ob and Yenisei Rivers, and a significant increase (p < 0.01) in the Lena River of 110,282.06 × 106 MJ/a during 1979–2016 (Figure 6d–f). The annual SIC in the Kara and Laptev Seas both showed a significant decreasing trend (p < 0.01) at rates of 0.37%/a and 0.18%/a, respectively (Figure 6g,h).
4.3. Effects of Monthly Discharge and Riverine Heat on SIC
Previous studies have shown that the routing time of the Lena, Yenisei, and Ob Rivers within the basin is 1–2, 1–2, and 4 months, respectively [50]. Referring to the routing time throughout the basin and taking into account the uncertainty of the discharge movement time in a given section of the river basin and in the two seas, we investigated the response of monthly changes in SIC to changes in discharge and riverine heat in the current month, as well as changes in the cumulative discharge and riverine heat from May to the current month.
The correlations between the regional mean SIC and the discharge of the three corresponding rivers in the current month showed that the correlations were all negative in May and October and positive in June and July (Table 1). The regional mean SIC was negatively correlated with the discharge from the Ob River but positively correlated with the discharge from the Yenisei River, and was negatively correlated with the discharge of the Lena River in August and September in the corresponding seas. In particular, the correlations between the regional mean SIC and discharge of the three corresponding rivers in May, the regional mean SIC of the Kara Sea and discharge of the Yenisei River, and the regional mean SIC of the Laptev Sea and discharge of the Lena River were significant (p < 0.05) in June and October. The regional mean SIC and the cumulative discharge from the three corresponding rivers were negatively correlated except for the correlations between the SIC and the cumulative discharge from the Yenisei River in the Kara Sea, and the cumulative discharge from the Lena River in the Laptev Sea was positive in June and July (Table 2). Particularly, the correlation between the SIC in the Kara Sea and the cumulative discharge from the Ob River in June was significant (p < 0.05).
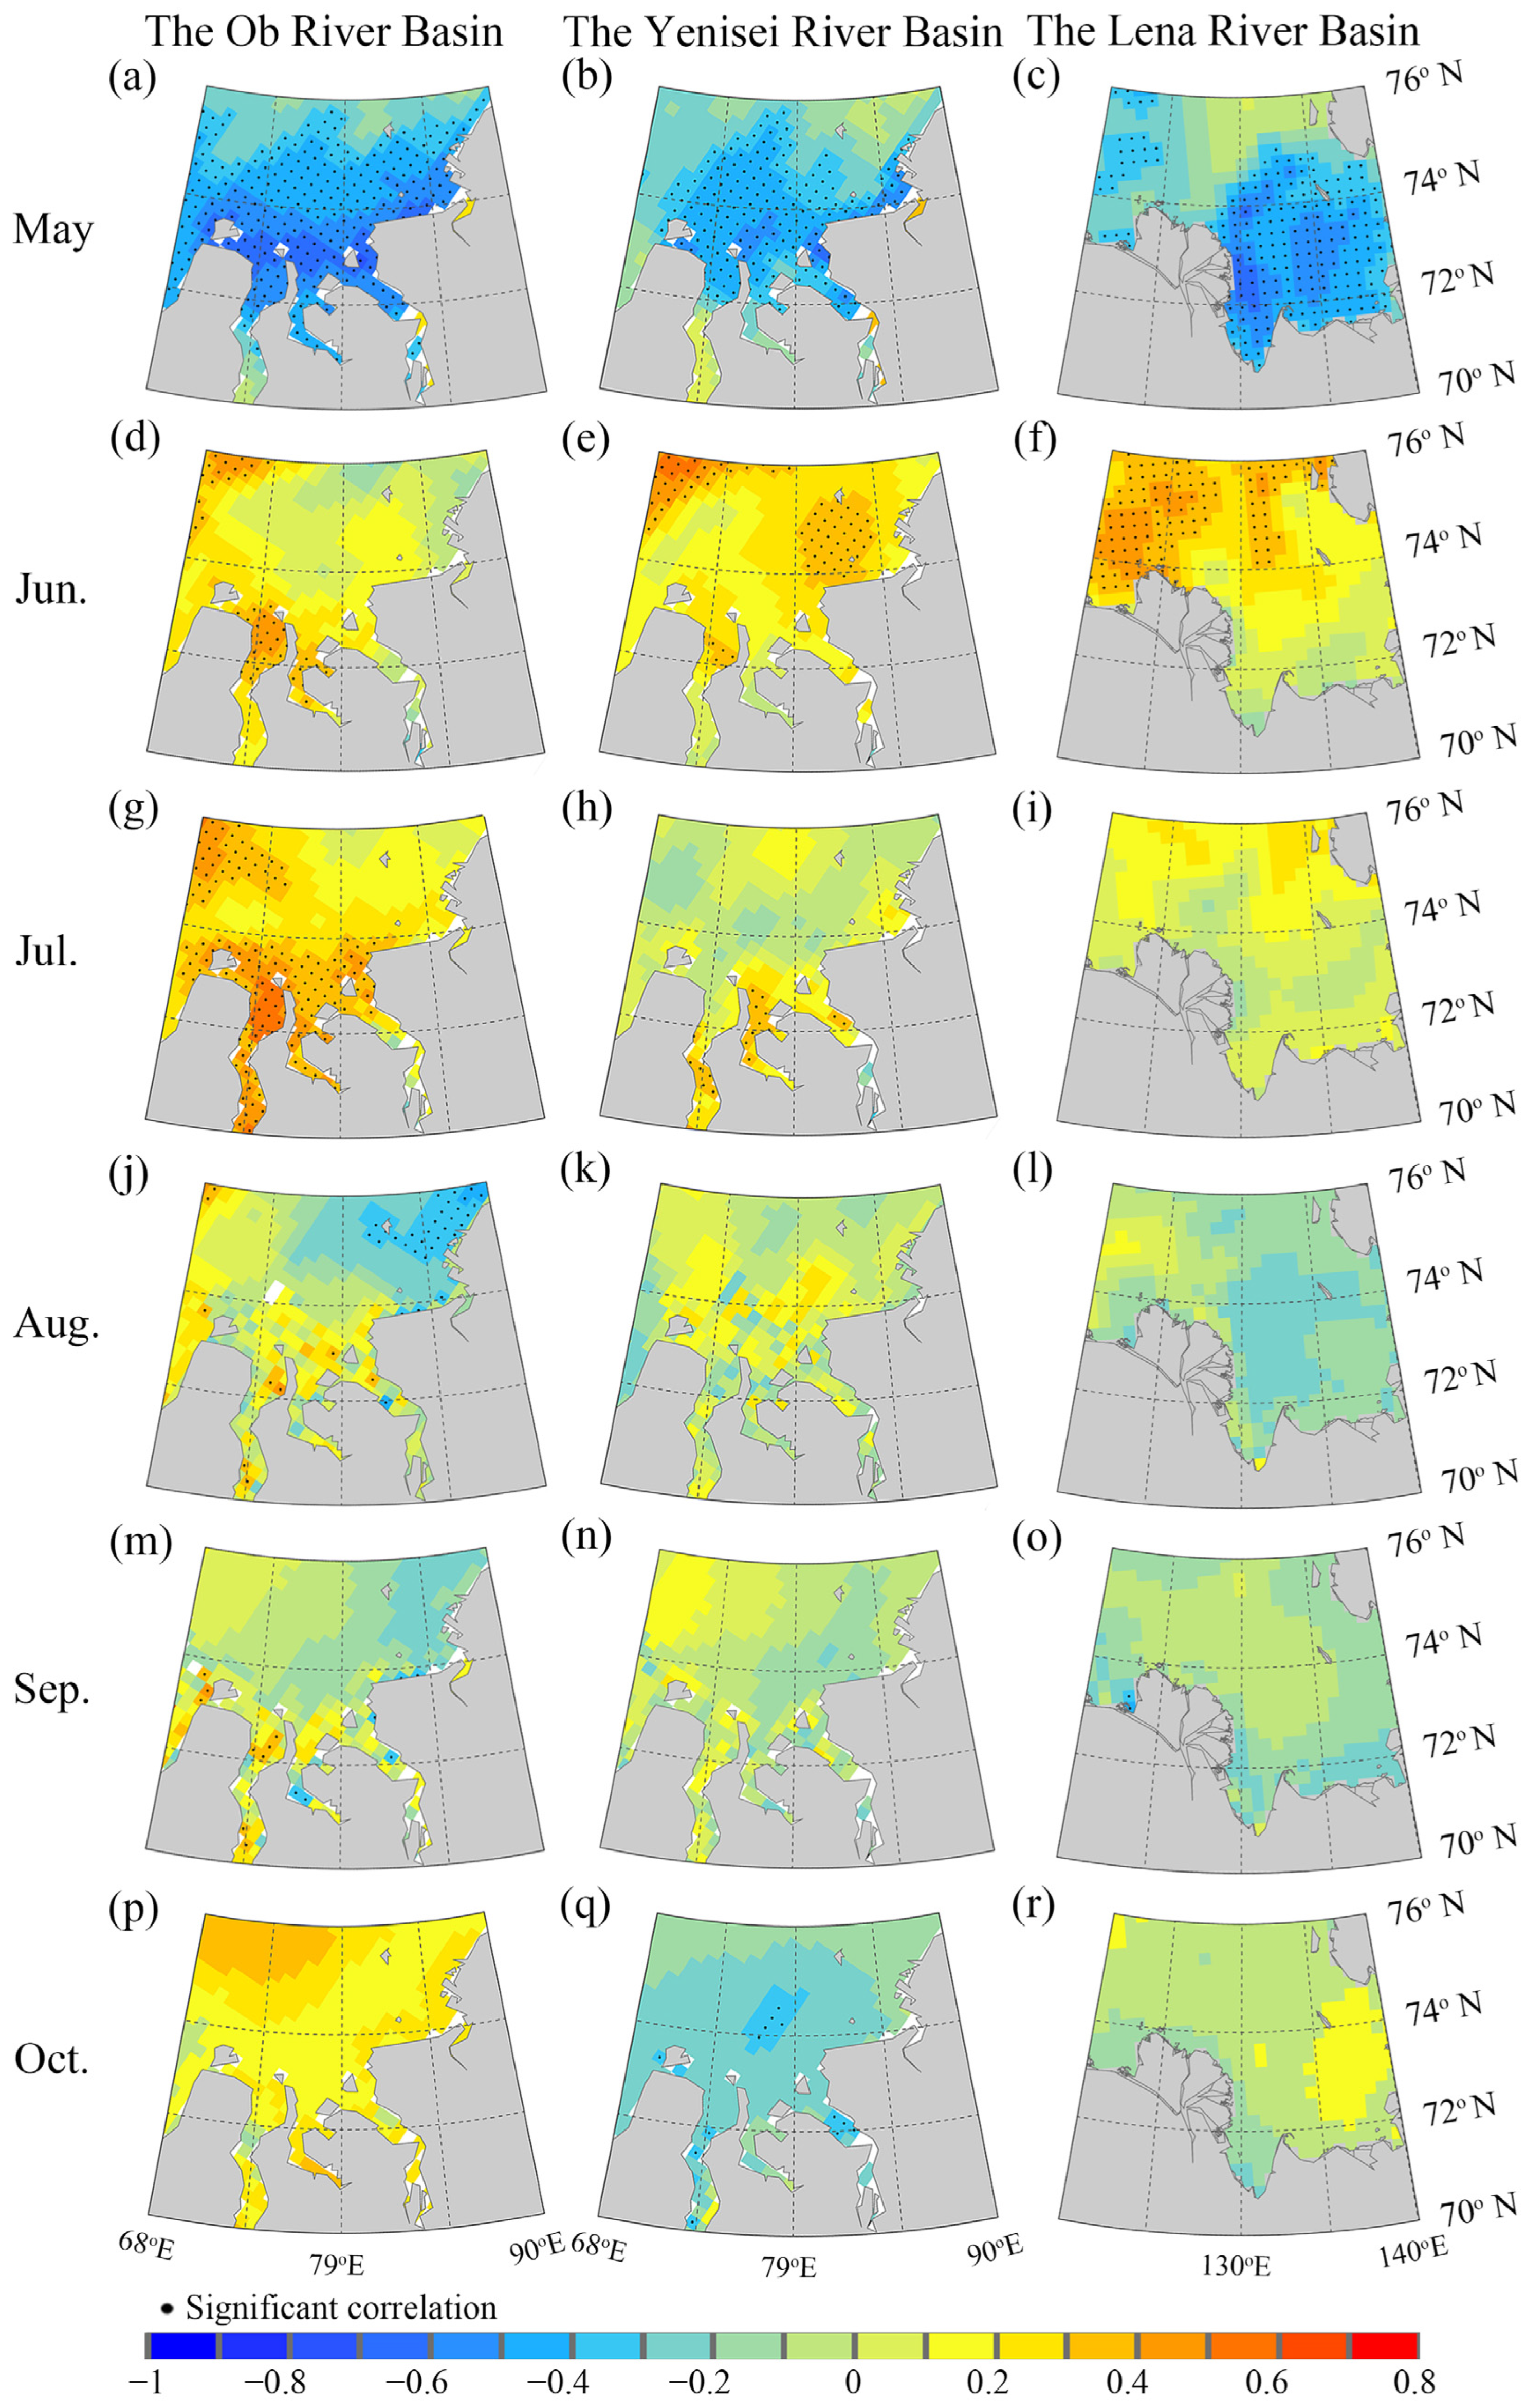
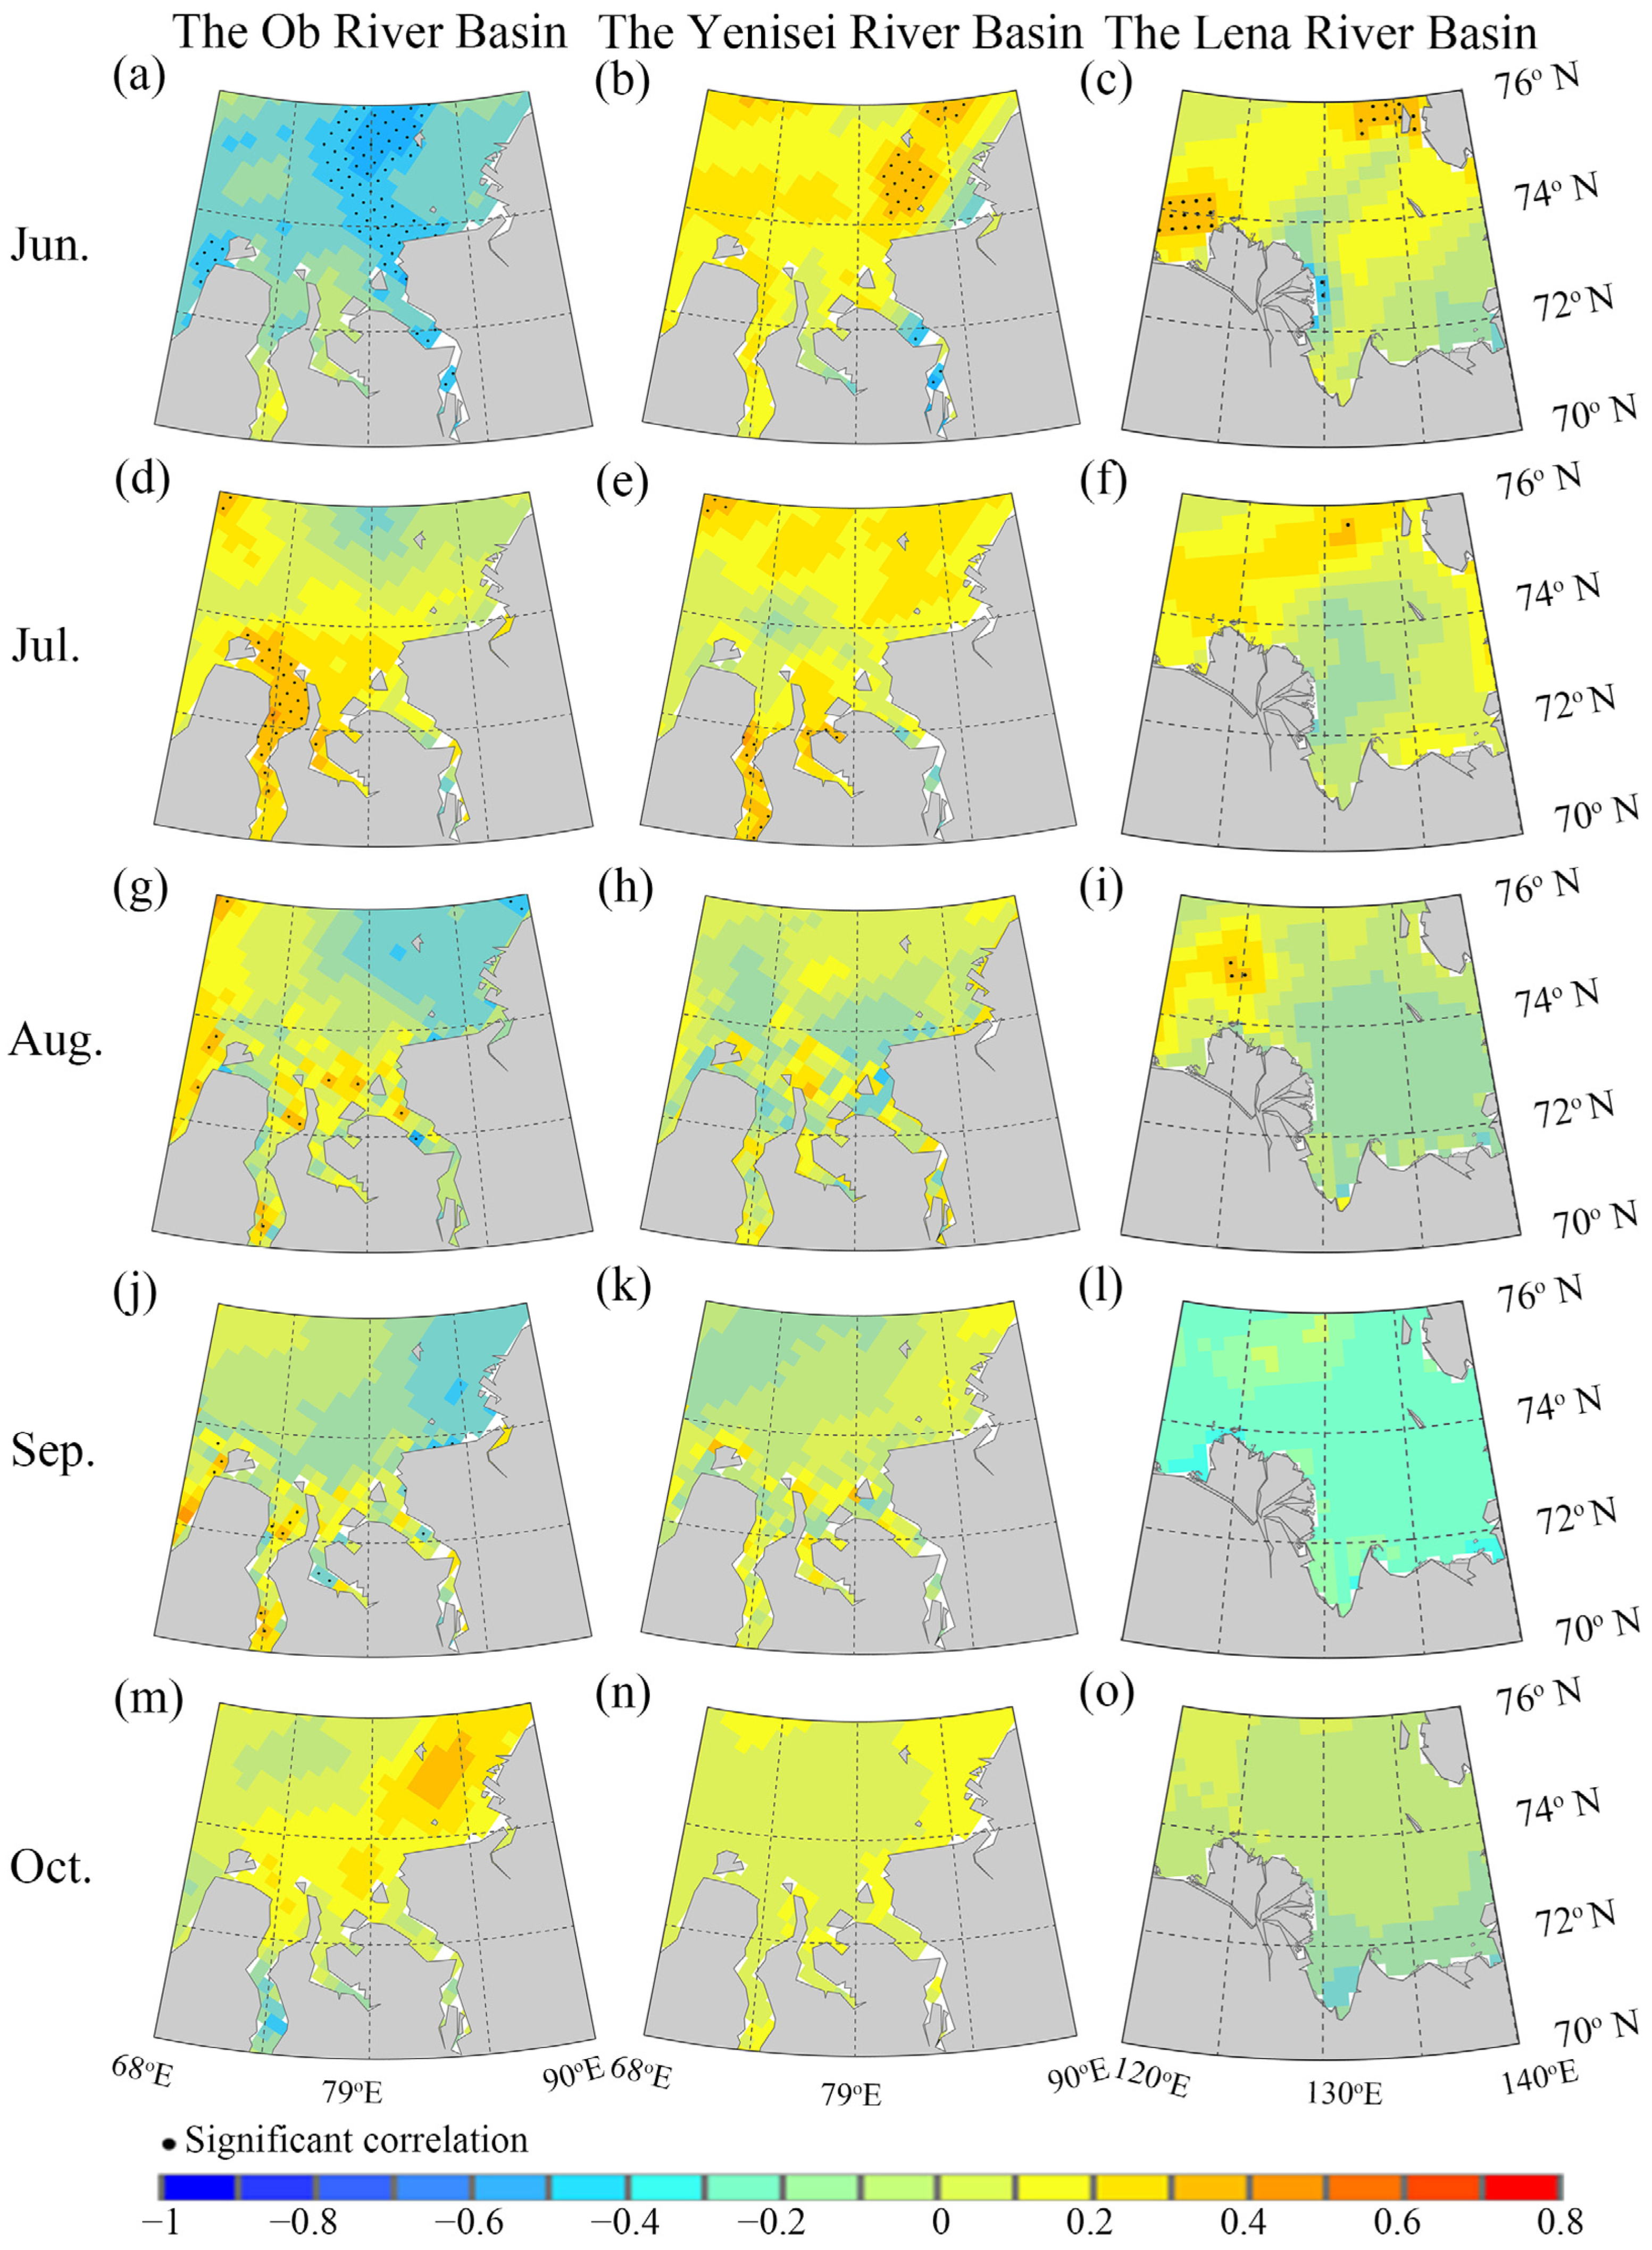
The spatial distribution of correlations between the SIC and discharge in the current month showed that a significant negative correlation (p < 0.05) occurred mainly in May and was distributed mainly around the estuary (Figure 7a–c). The correlation became stronger with the proximity to the estuary, with the maximum correlation coefficient reaching 0.6–0.7. A significant positive correlation (p < 0.05) occurred in the correlation between the SIC and discharge in June–July, and the distribution was irregular (Figure 7d–i). A significant correlation (p < 0.05) between the SIC and discharge in the current month rarely occurred in August–October (Figure 7j–r). In the relationship between SIC and accumulated discharge, a significant negative correlation (p < 0.05) mainly occurred between the SIC in the Kara Sea in June and the accumulated discharge of the Ob River from May to June in the region of 74°E–84°E, 73°N–76°N (Figure 8).
The regional mean SIC in the Kara Sea was negatively correlated with the heat of the Ob River in May–June, August, and October, and the heat of the Yenisei River in May, August, and October (Table 3). The regional mean SIC in the Laptev Sea was negatively correlated with the heat of the Lena River in May–September. Particularly, the negative correlation between the SIC and heat from the Ob and Yenisei Rivers in May and October, and that of the heat from the Lena River in May–June and August–September were significant (p < 0.05) in the corresponding seas. The correlations between the regional mean SIC in the study area and the cumulative heat of the three corresponding rivers from May to the current month were all negative (Table 4). In particular, the regional mean SIC was significantly and negatively correlated with the cumulative heat from the Ob River from May to June and the cumulative heat from the Lena River from May to each current month in the corresponding seas.
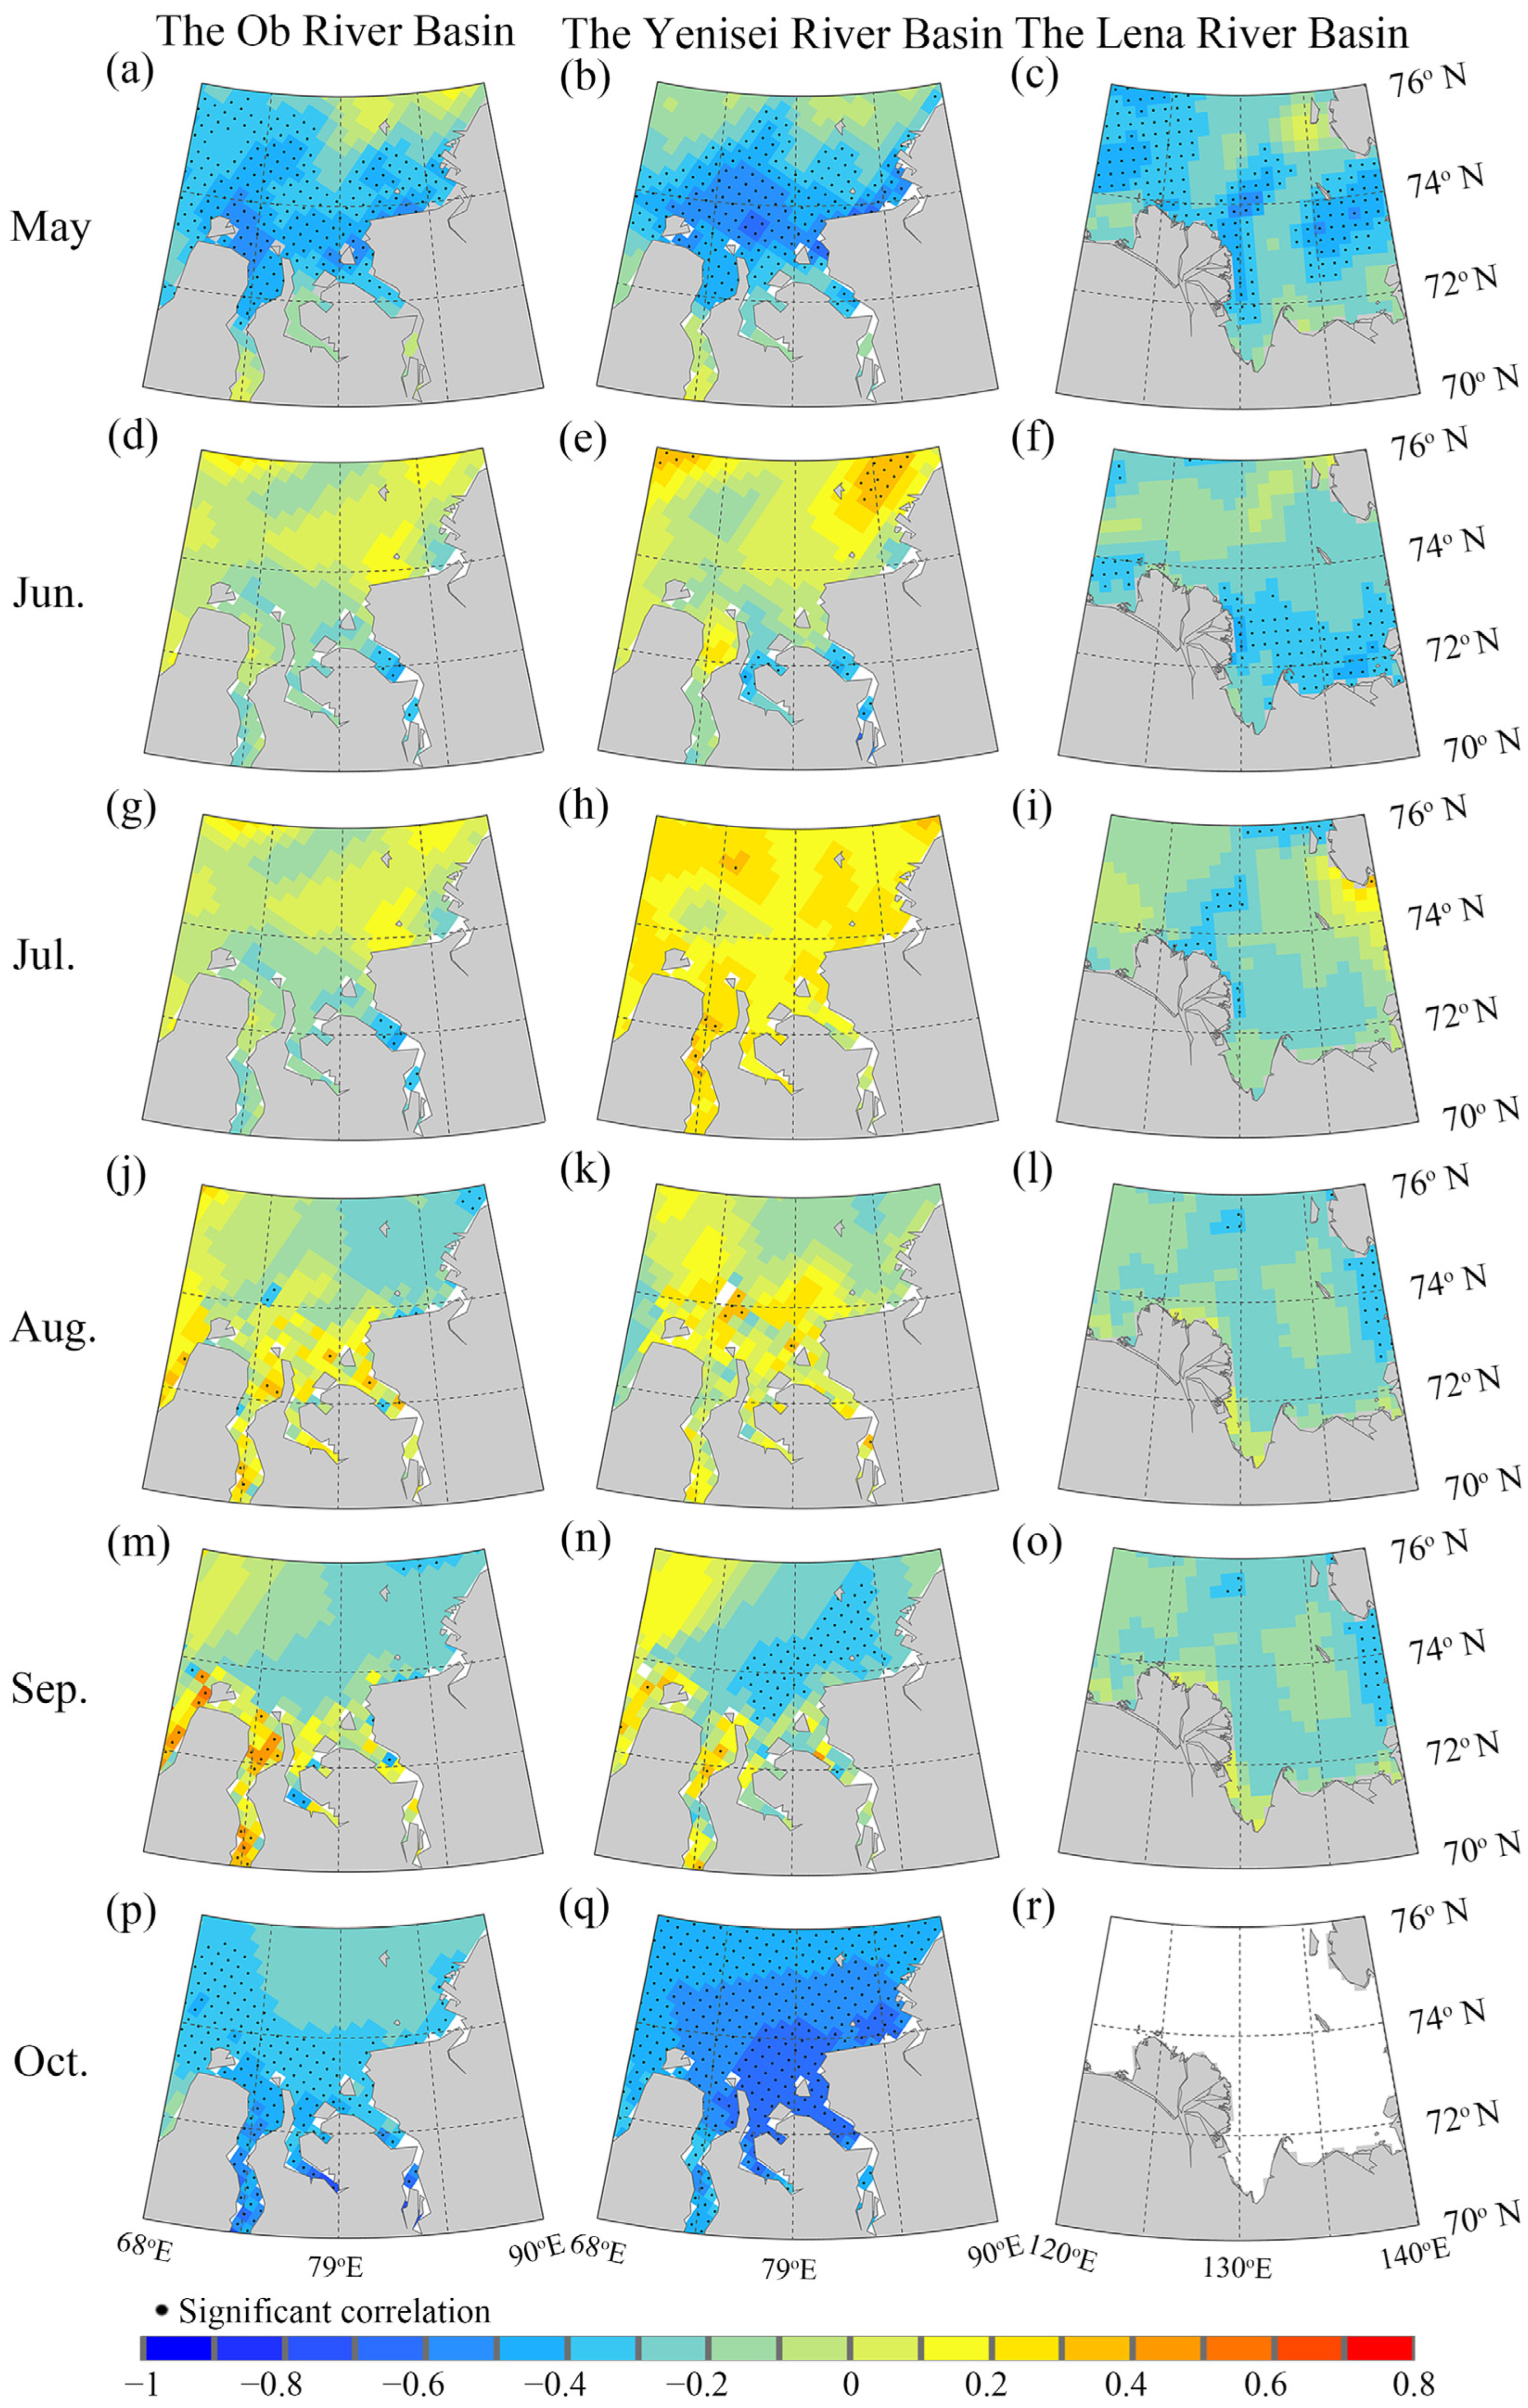
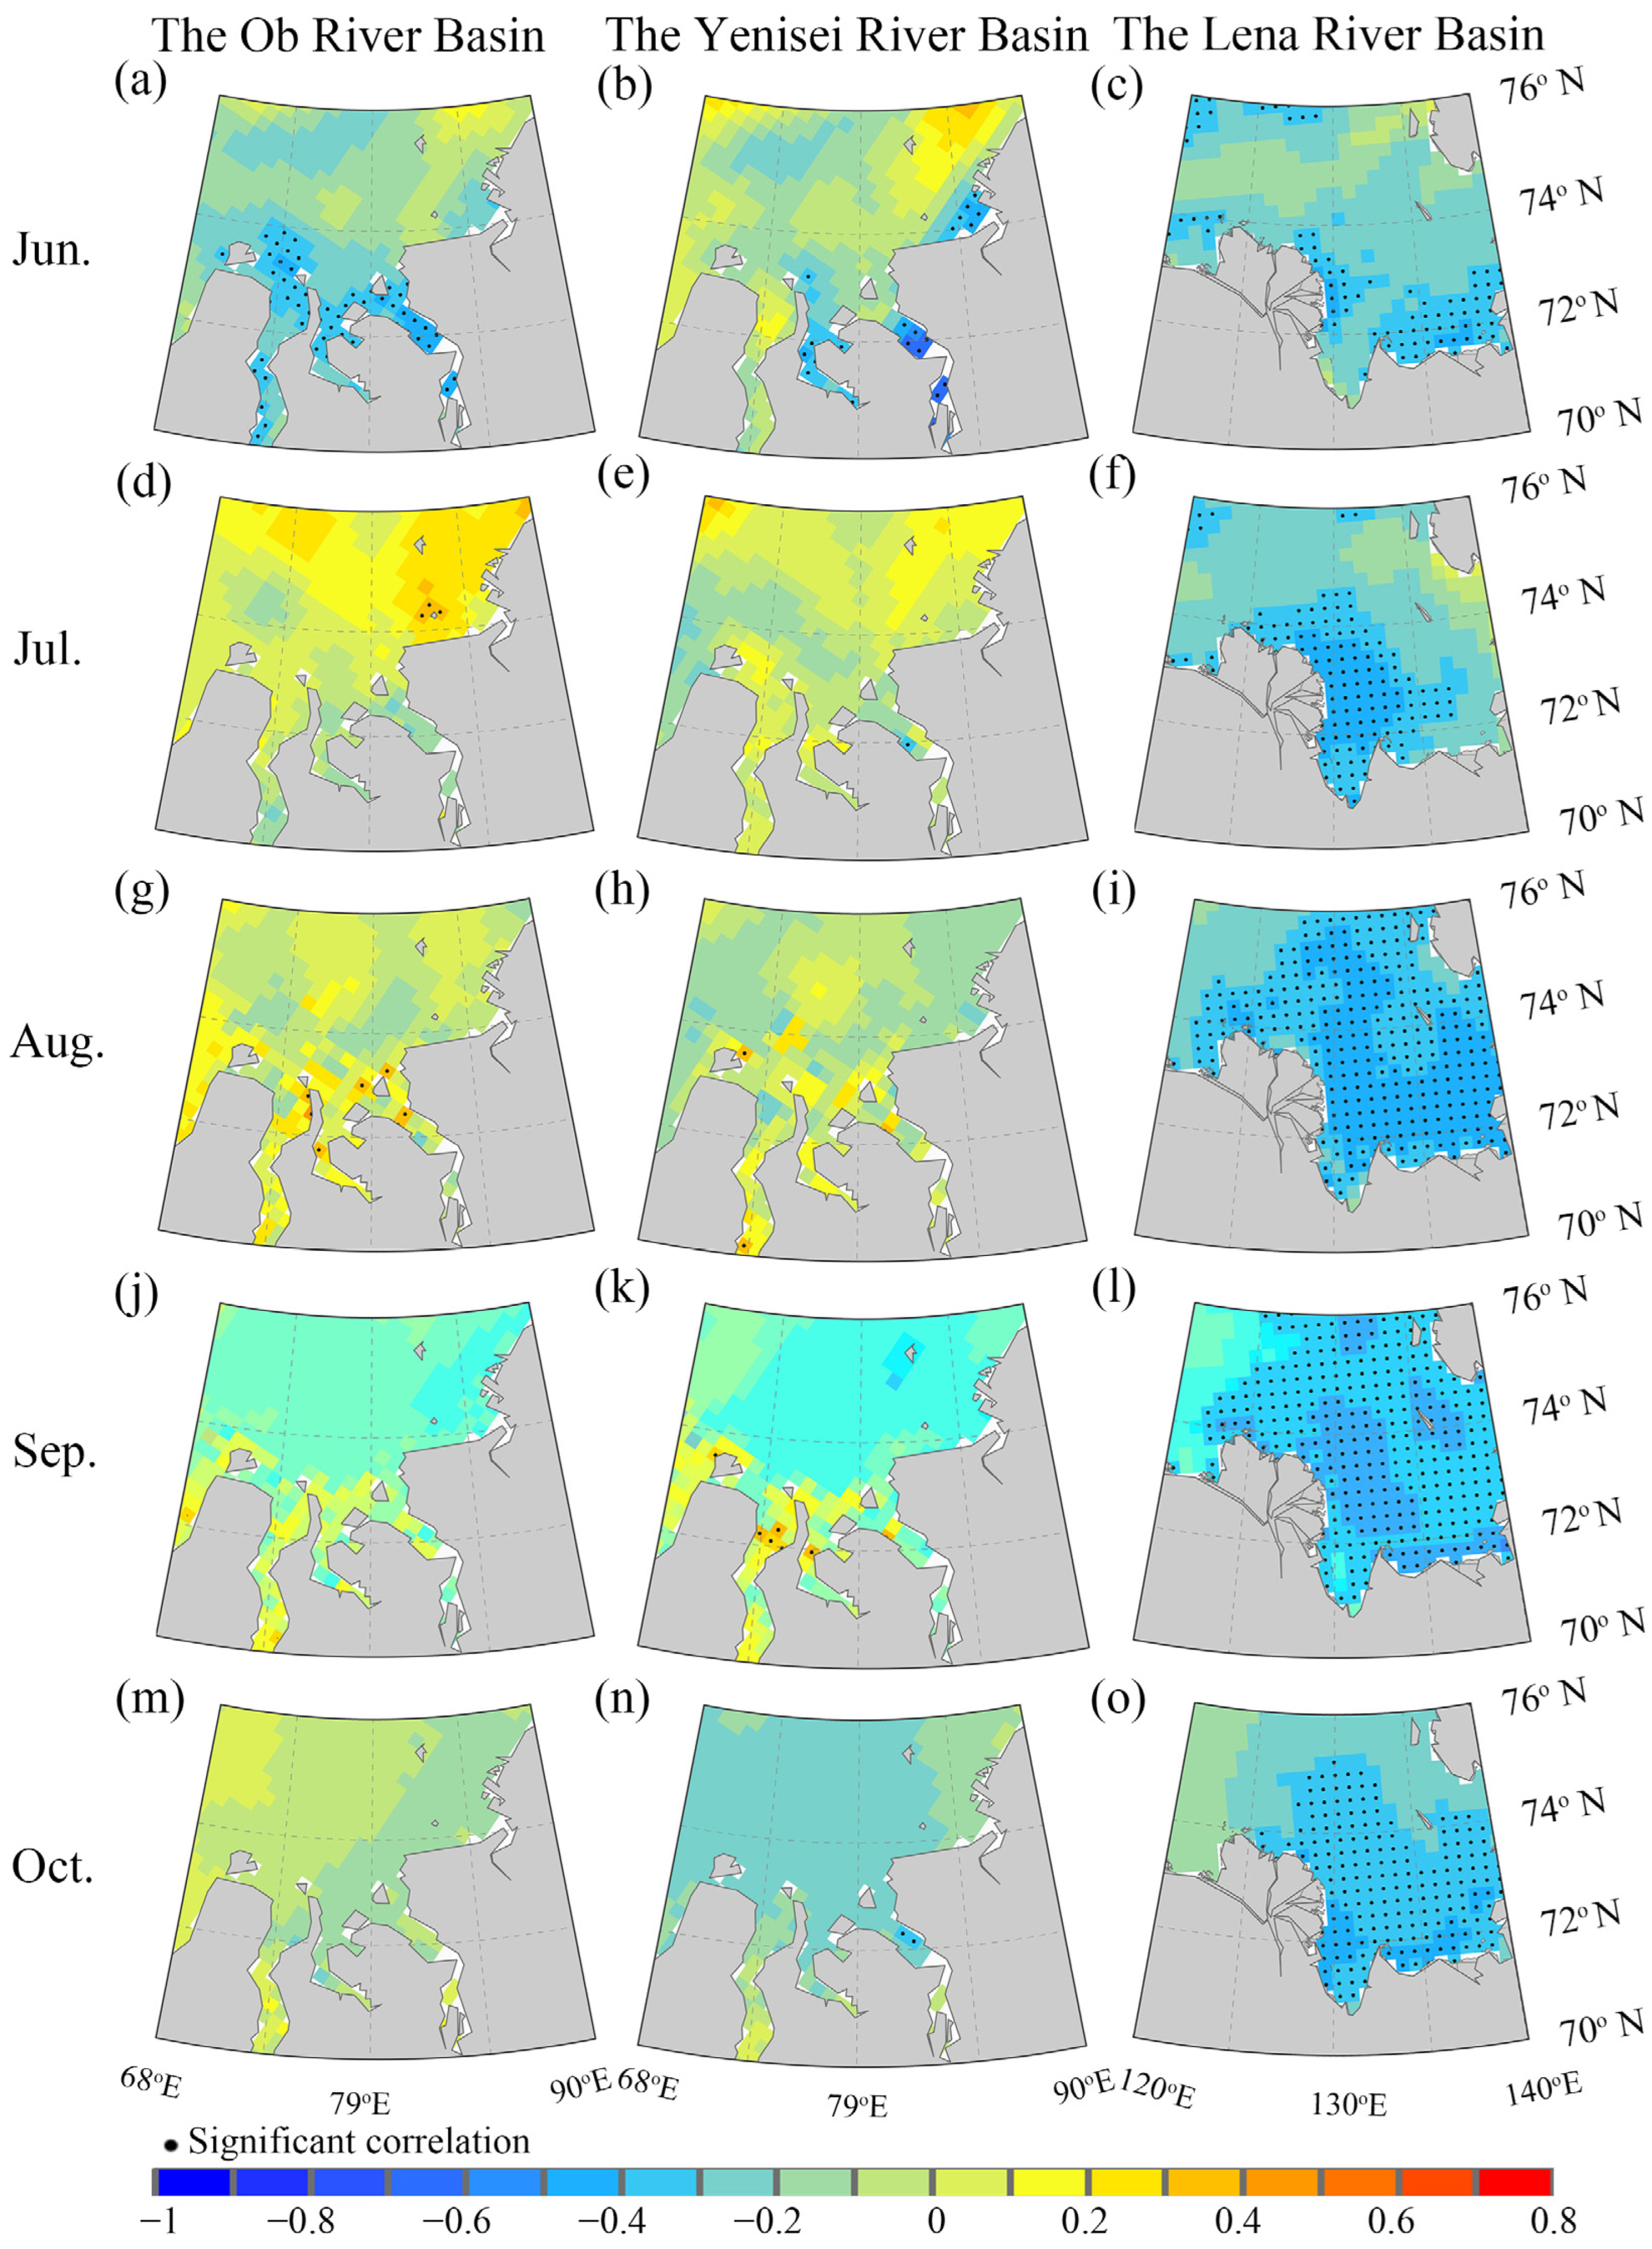
The significant negative correlations (p < 0.05) between the SIC and heat from the Ob and Yenisei Rivers in May and October and the heat from the Lena River in May in the corresponding seas were also mainly distributed around the estuaries, with the maximum correlation coefficient near estuaries up to 0.6–0.7 (Figure 9). Significant negative correlations (p < 0.05) also occurred in the relationships between the SIC in June–September and riverine heat in the current month in the study areas, which showed a small or sporadic distribution in space. The areas with a significant negative correlation (p < 0.05) between the SIC in the Kara Sea in June and the accumulated heat from the Ob and Yenisei Rivers from May to June sporadically distributed near the estuary, and between the SIC in the Laptev Sea in June–October and the accumulated heat from the Lena River from May to the current month were relatively widely distributed near the estuary (Figure 10).
The above results showed that the influence of the discharge and accumulated discharge in the three rivers and the heat and accumulated heat of the Ob and Yenisei River on SIC mainly occurred in May, June, and October at the beginning and final stages of sea-ice melting. Riverine heat and accumulated heat in the Lena River had a significant effect on SIC changes in all months except the effect of heat in July and October on SIC in the current month.
4.4. Seasonality Effects of Discharge and Riverine Heat on SIC
The results of monthly effects of discharge on SIC showed that discharge accelerated the melting of sea ice by increasing the absorption of solar radiation as the impurities it contained washed to the sea ice surface during the initial and late stages of sea-ice melting, but riverine heat accelerated the melting of sea ice once it came into contact with sea ice. Therefore, we further investigated the seasonality effects of riverine heat on SIC. As shown in Figure 2, the Ob and Yenisei Rivers still conveyed heat into the sea, but the Lena River conveyed no heat into the sea in October, and the SIC increased a lot from September to October in the Kara Sea. This indicated that climate change and other factors have a greater influence on SIC than riverine heat, resulting in an increase in SIC from September to October in the Kara Sea. Therefore, the influences of riverine heat and accumulated riverine heat in the three rivers on the SIC of the plume cover areas in the Kara and Laptev Sea during May–September were investigated.
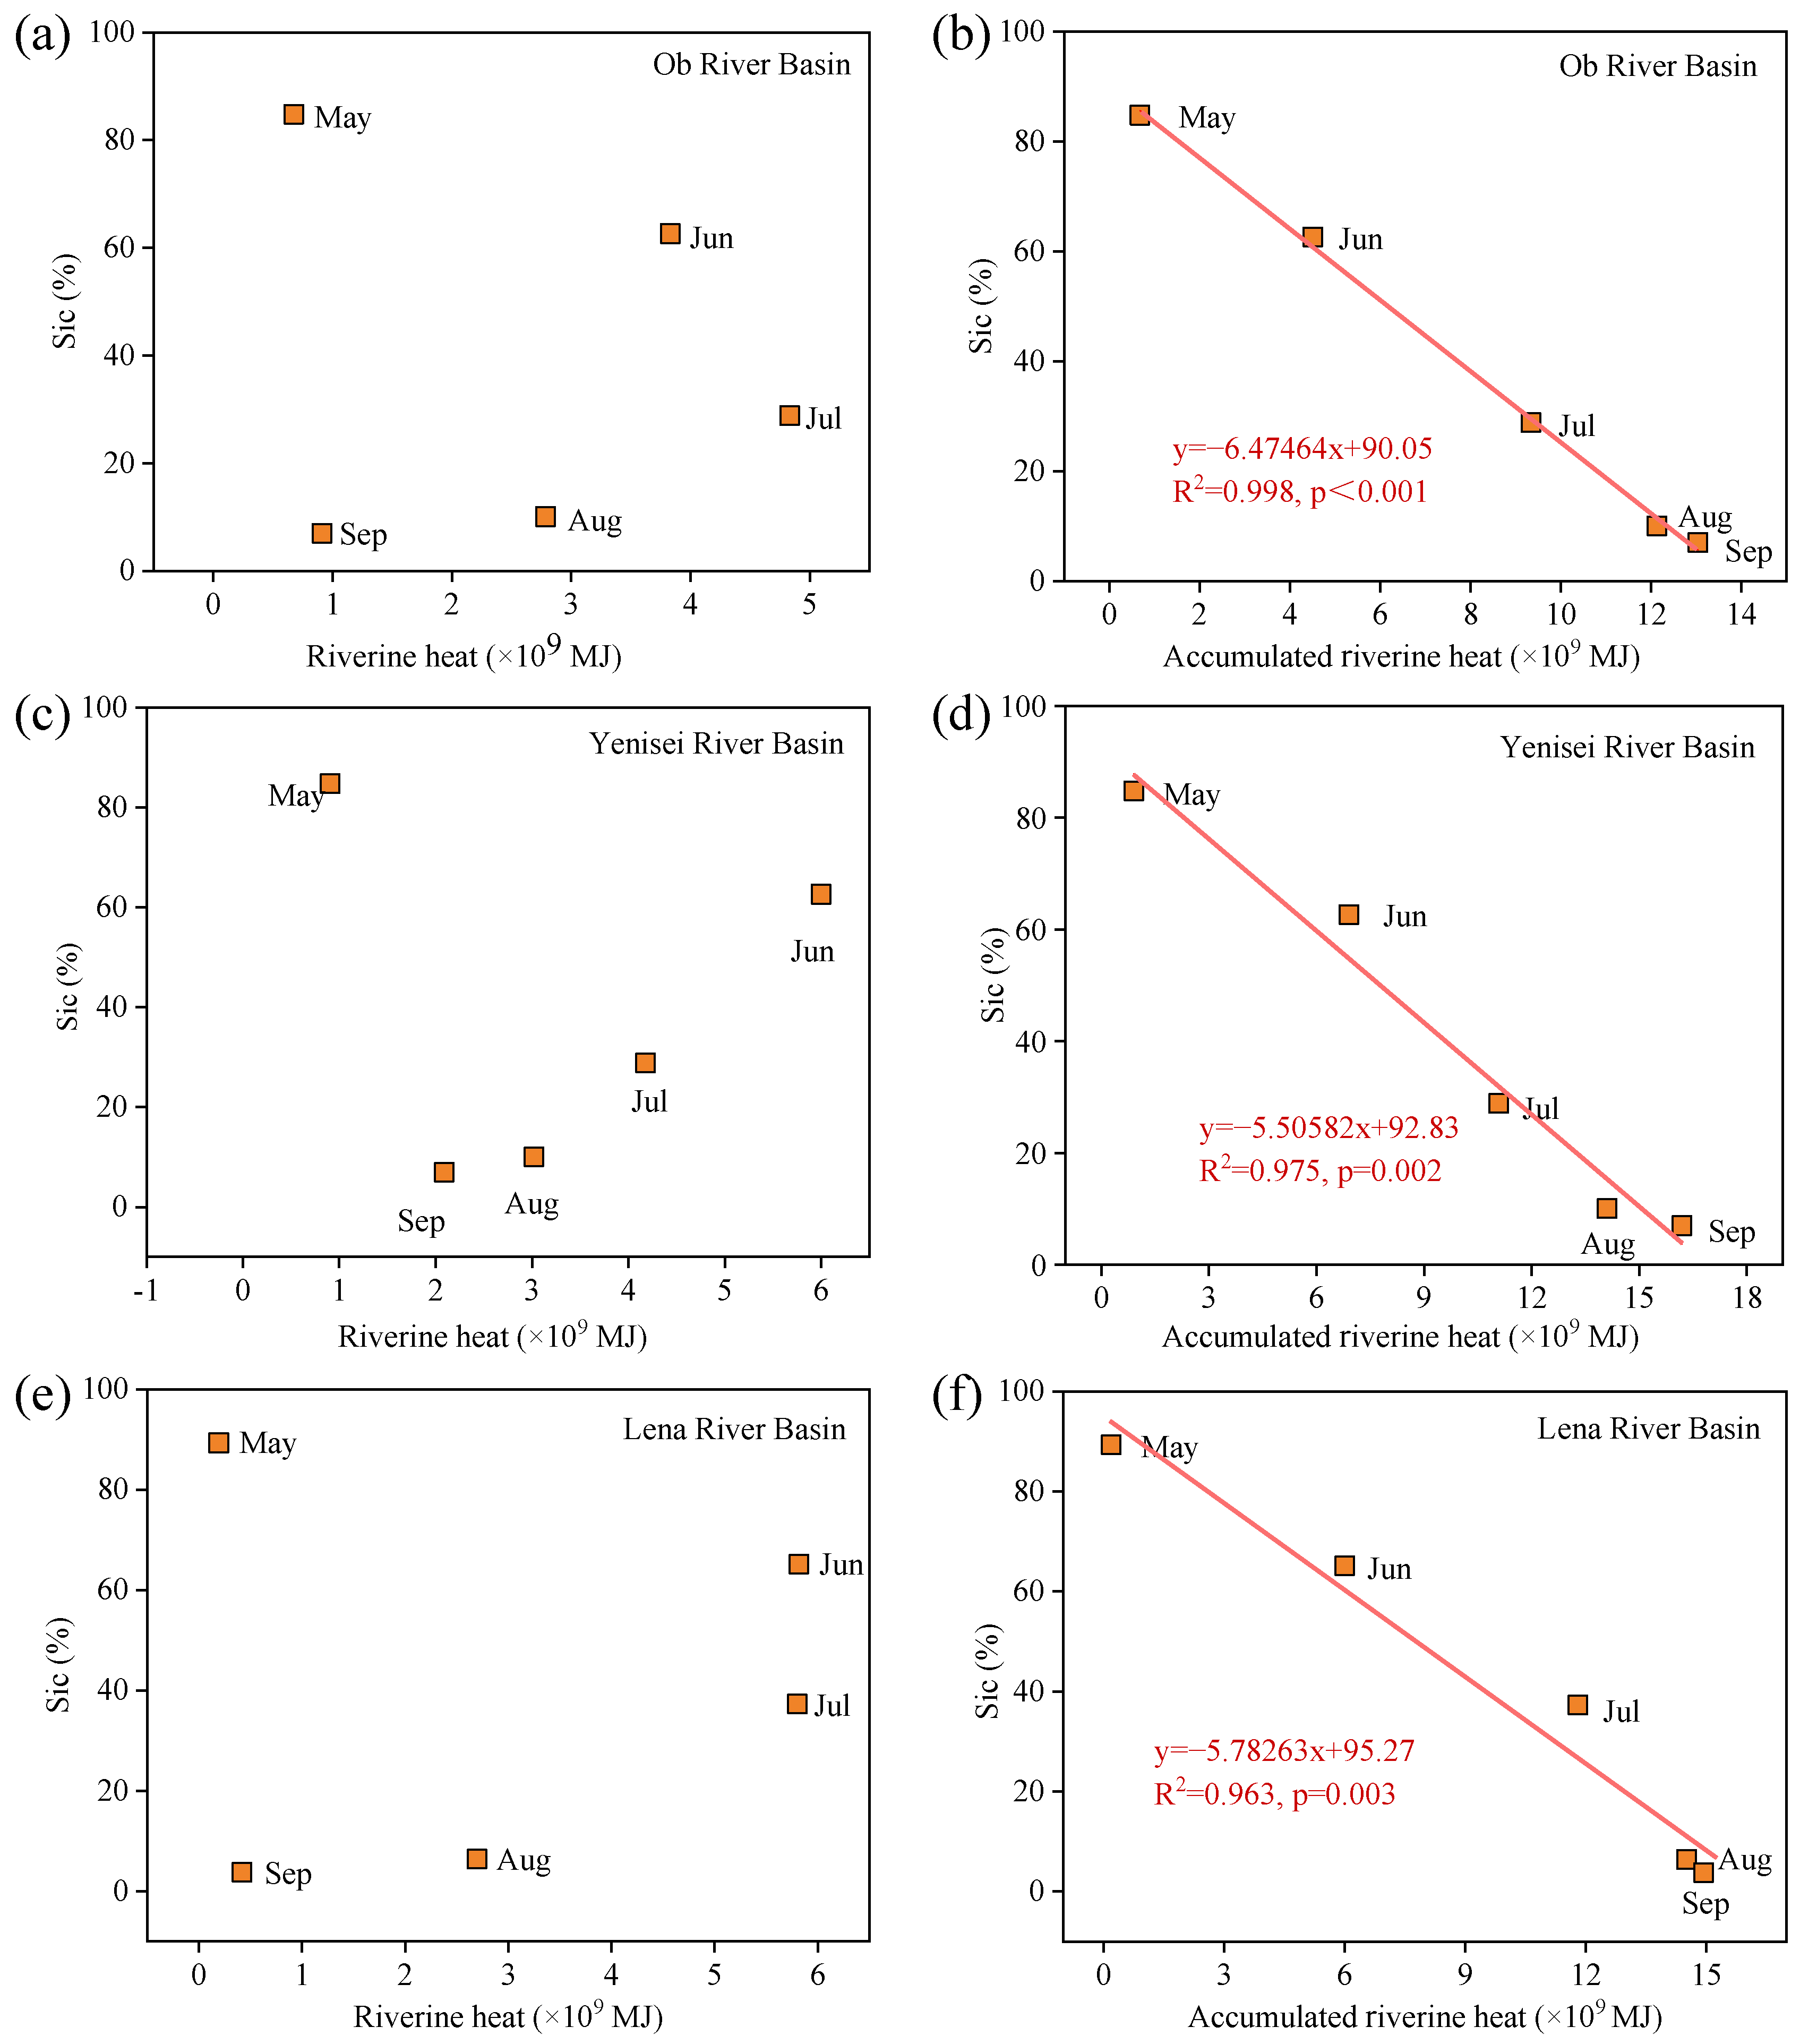
The seasonality correlation indicated that the SIC was not significantly (p < 0.05) associated with the heat of the corresponding rivers, but was significantly (p < 0.05) and strongly correlated with the cumulative heat of the corresponding rivers from May to September, with the correlation coefficient reaching 0.963–0.998 (Figure 11). The linear regression equation showed that the SIC reduced by 1% when the cumulative riverine heat increased by 154.6 × 10⁶ MJ, 181.5 × 10⁶ MJ, and 213.2 × 10⁶ MJ in the Ob, Yenisei, and Lena Rivers, respectively, from May to September.
4.5. Effects of Annual Discharge and Riverine Heat on SIC
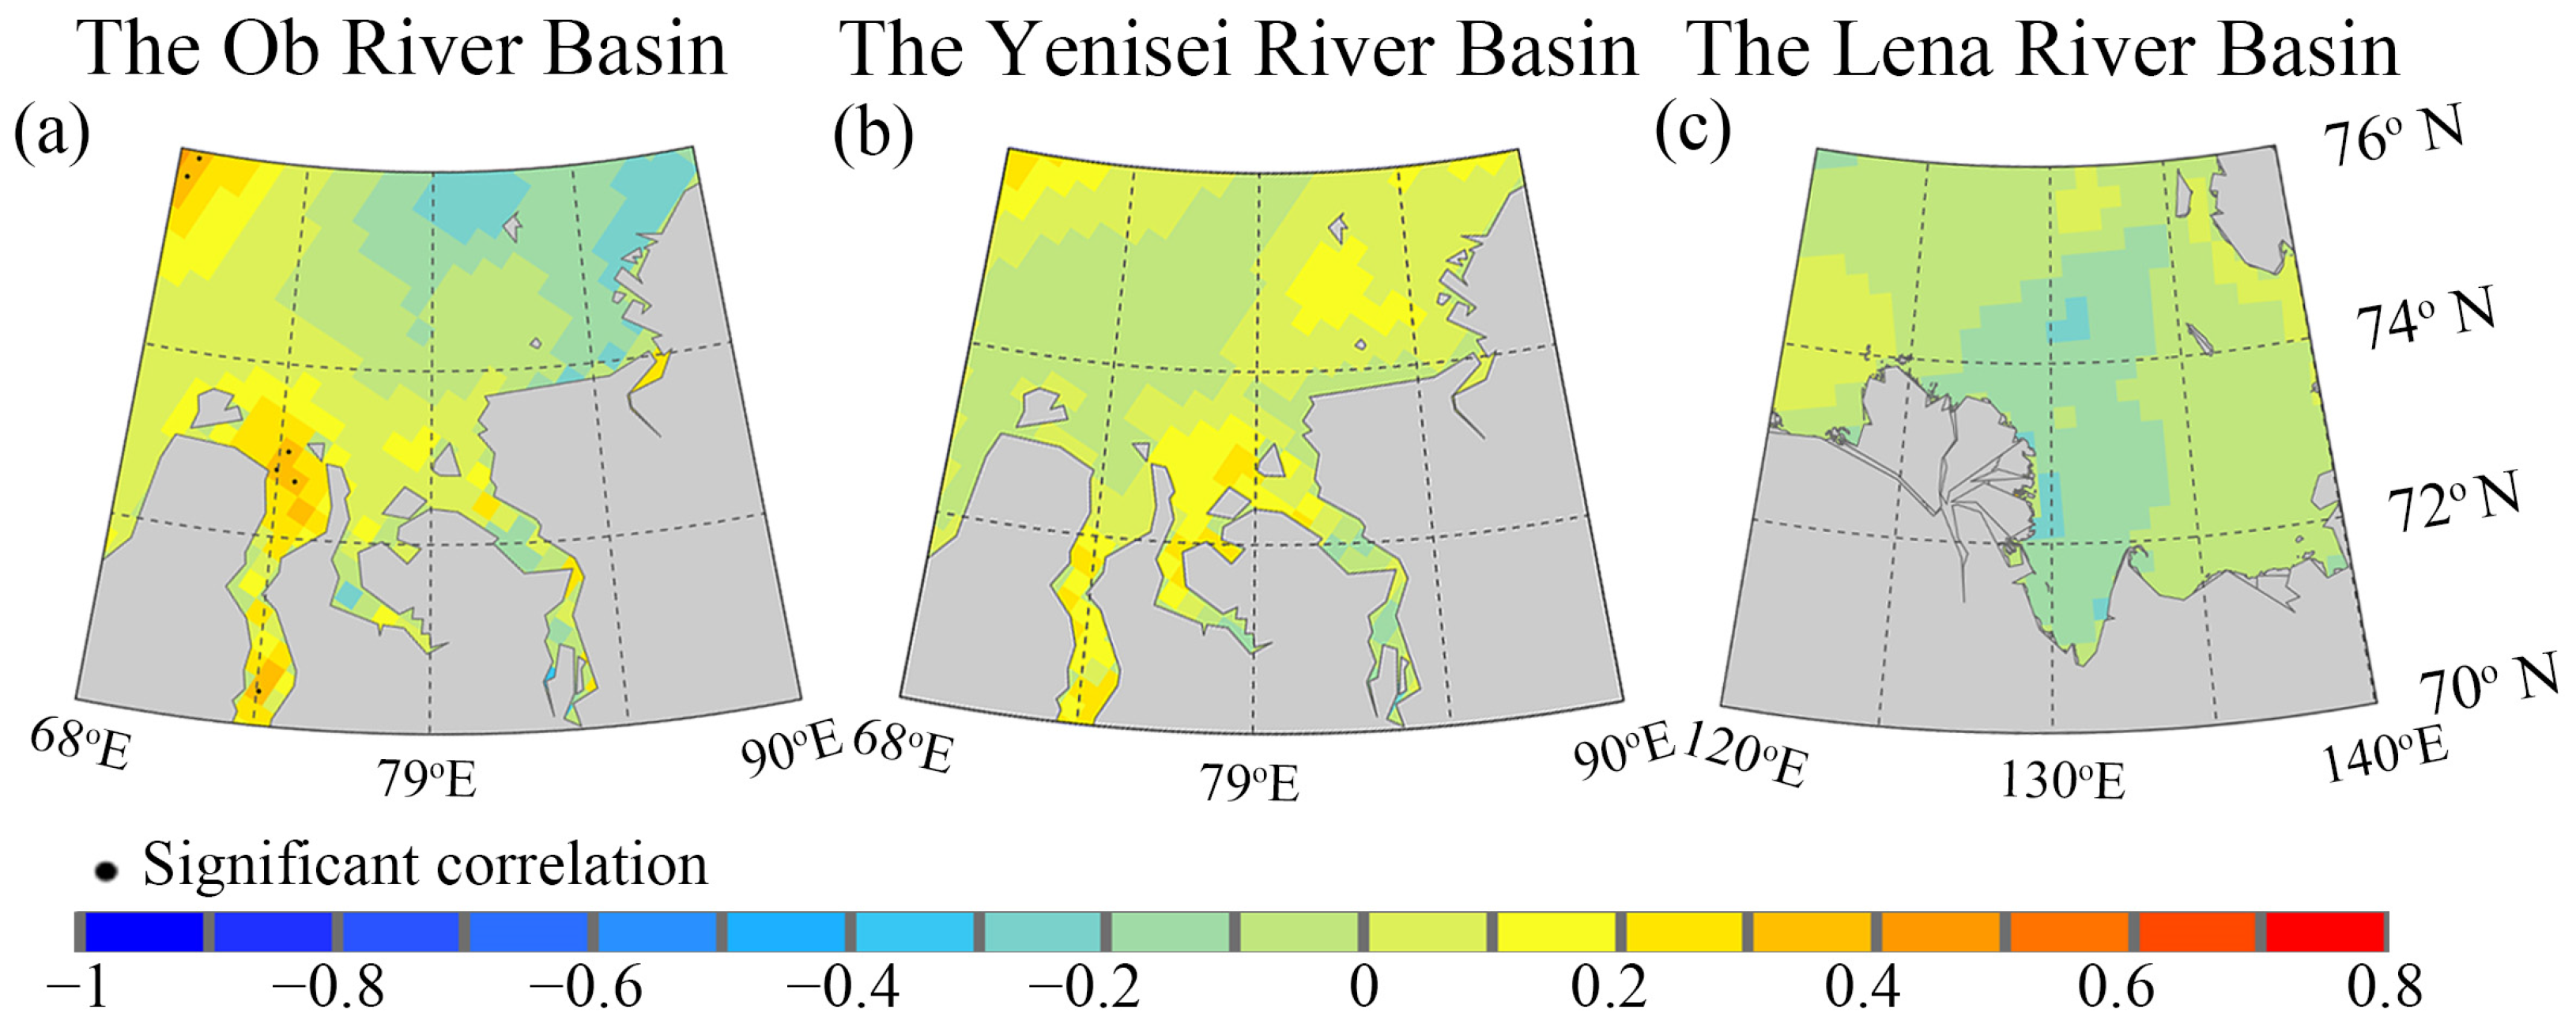
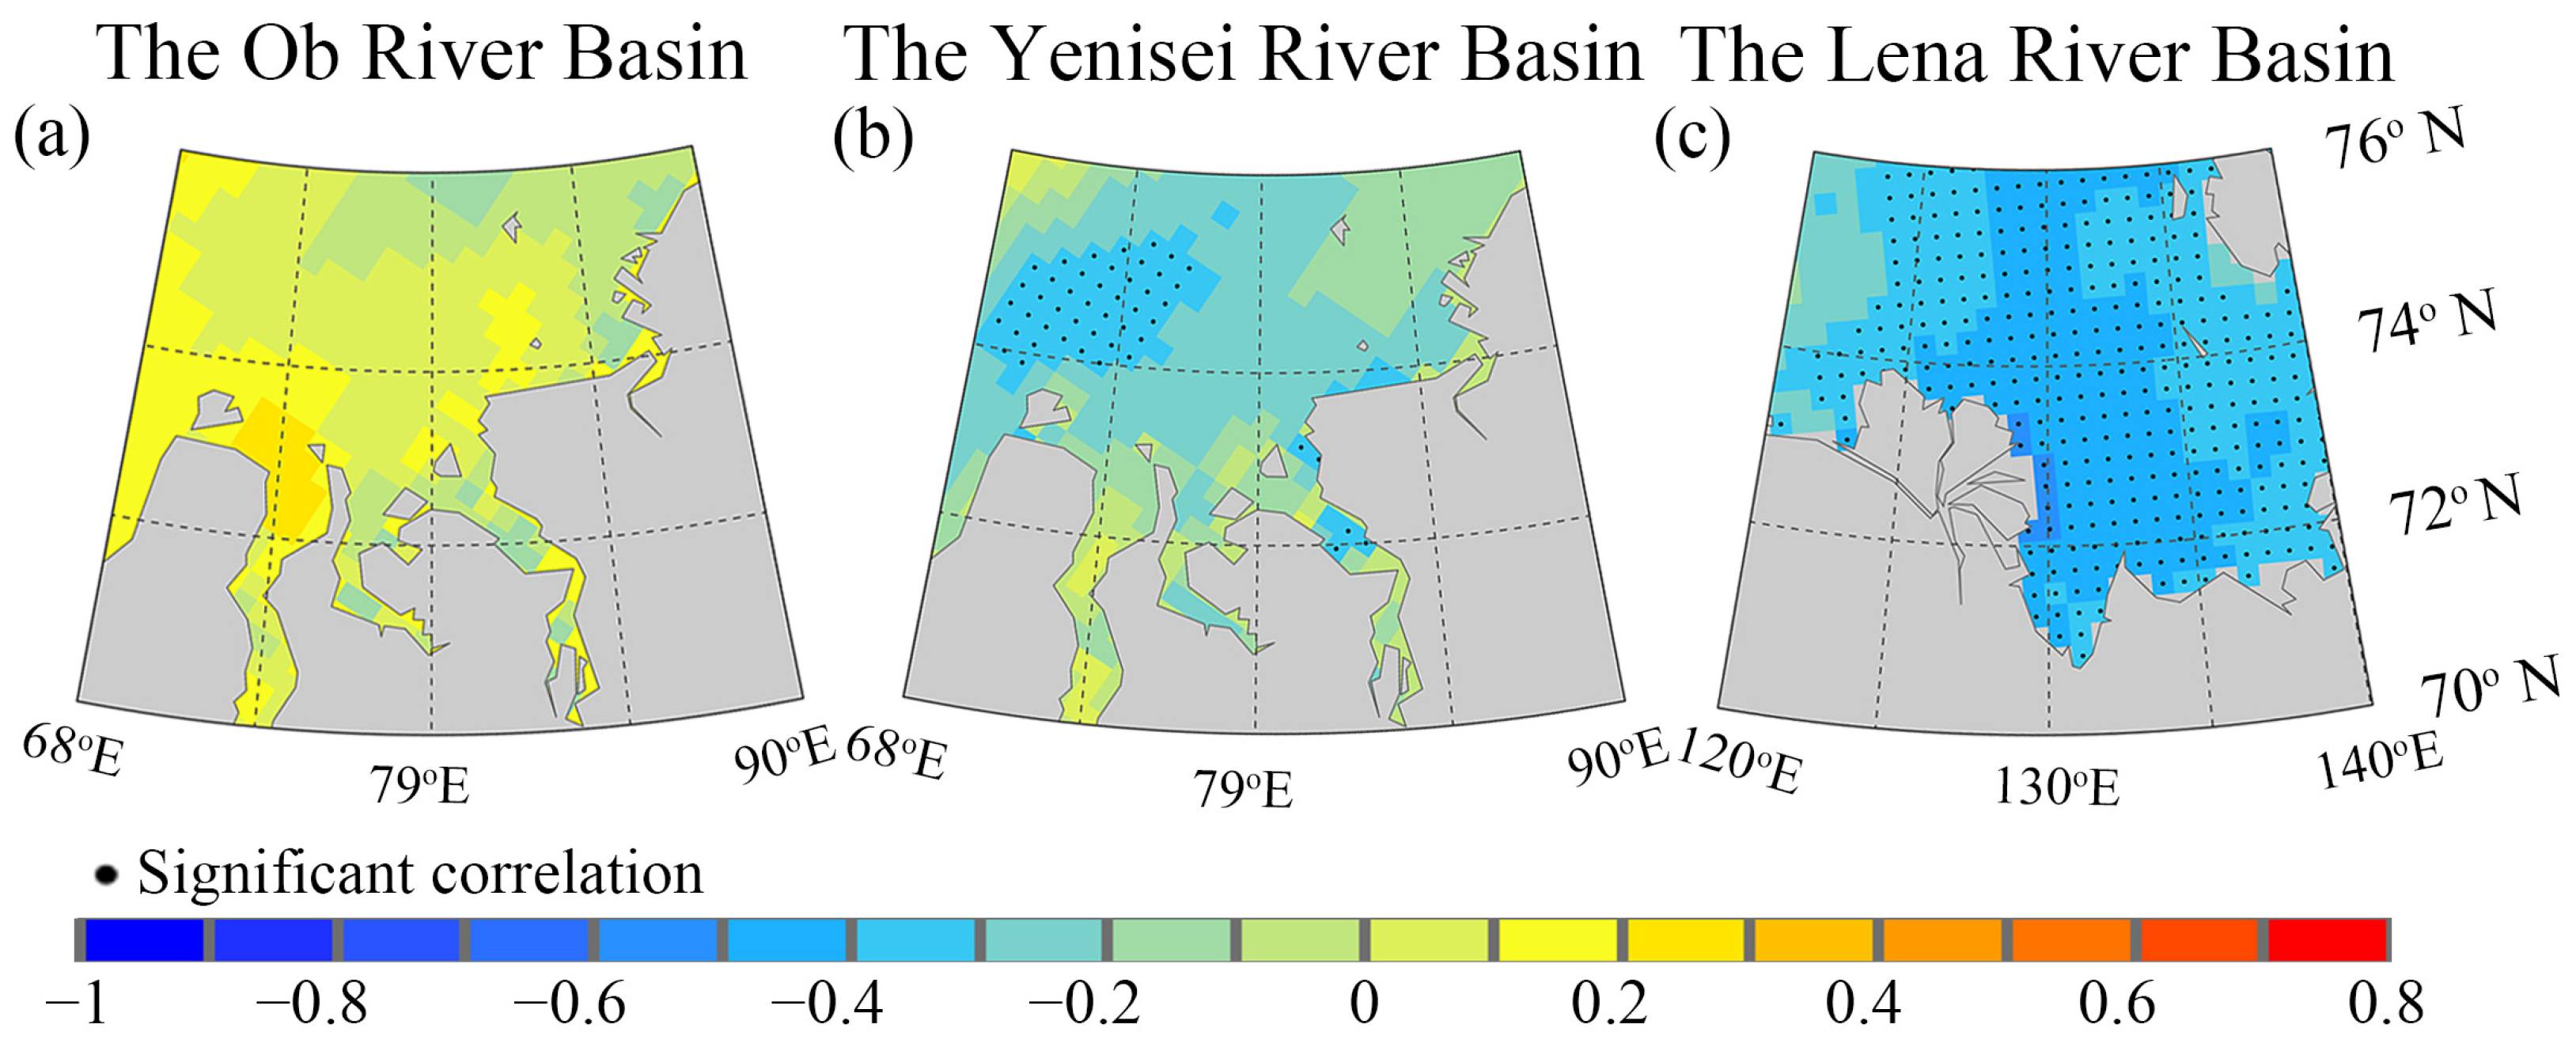
The regional mean SIC in the Kara and Laptev Seas and the discharge of the corresponding rivers showed an insignificant negative correlation (p < 0.05) on an annual scale (Table 5). There were also almost no areas with a significant negative correlation (p < 0.05) between the annual SIC and annual discharge of the corresponding rivers (Figure 12a–c). The annual regional average SIC in the Kara Sea was not significantly (p < 0.05) correlated with the riverine heat of the Ob or Yenisei river (p < 0.05), while the annual regional average SIC in the Laptev Sea was significantly (p < 0.05) correlated with riverine heat of the Lena River (Table 6). The spatial correlation showed that there was almost no significant correlation (p < 0.05) between the annual SIC in any part of the Kara Sea and the riverine heat of the Ob River (Figure 13a). The significant and negative correlation (p < 0.05) between the annual SIC in the Kara Sea and riverine heat of the Yenisei River only occurred in the range of 74°N–75.2°N and 68°E–77°E (Figure 13b). The areas with a significant and negative correlation (p < 0.05) between the annual SIC and heat of the Lena River occupied most of the Laptev Sea, and a strong correlation was found at the estuary, with a correlation coefficient of 0.5–0.6 (Figure 13c).
5. Discussion
5.1. Drivers of the Changes in Discharge, Riverine Heat, and SIC
The variations in discharge and heat are the result of a combination of climate change and human activities [17]. The maximum discharge of the three rivers only occurred in June and is dominated by snowmelt [11]. The increase in discharge in spring and decrease in discharge in summer are mainly related to an earlier snowmelt period [51]. The increased discharge in summer and autumn is associated with the increase in precipitation in summer and autumn [12]. Permafrost degradation and reservoir regulation are the main factors contributing to the increase in winter discharge [24,52]. The variation in riverine heat is determined by both discharge and river temperature [17]. The occurrence time of the maximum river heat was synchronized with or 1 month later than the maximum discharge. The time lag is caused by the time difference between the peak of the river water temperature and discharge [32]. The sea-ice melting is mainly related to the influence of large-scale atmospheric forcing. However, in marginal sea areas, river discharge also contributes to sea-ice melting [53,54,55,56,57]. The maximum and minimum SIC of each region appeared in March and September, respectively, which is the same time as the maximum and minimum values of the entire Arctic Ocean [58]. The annual variations in SIC are mainly attributed to the variation in summer and autumn [57]. The increase in sea ice during the cold season is highly dependent on the amount of heat stored in regional water masses [59,60].
5.2. The Effects of Mechanisms of Discharge and Riverine Heat on SIC
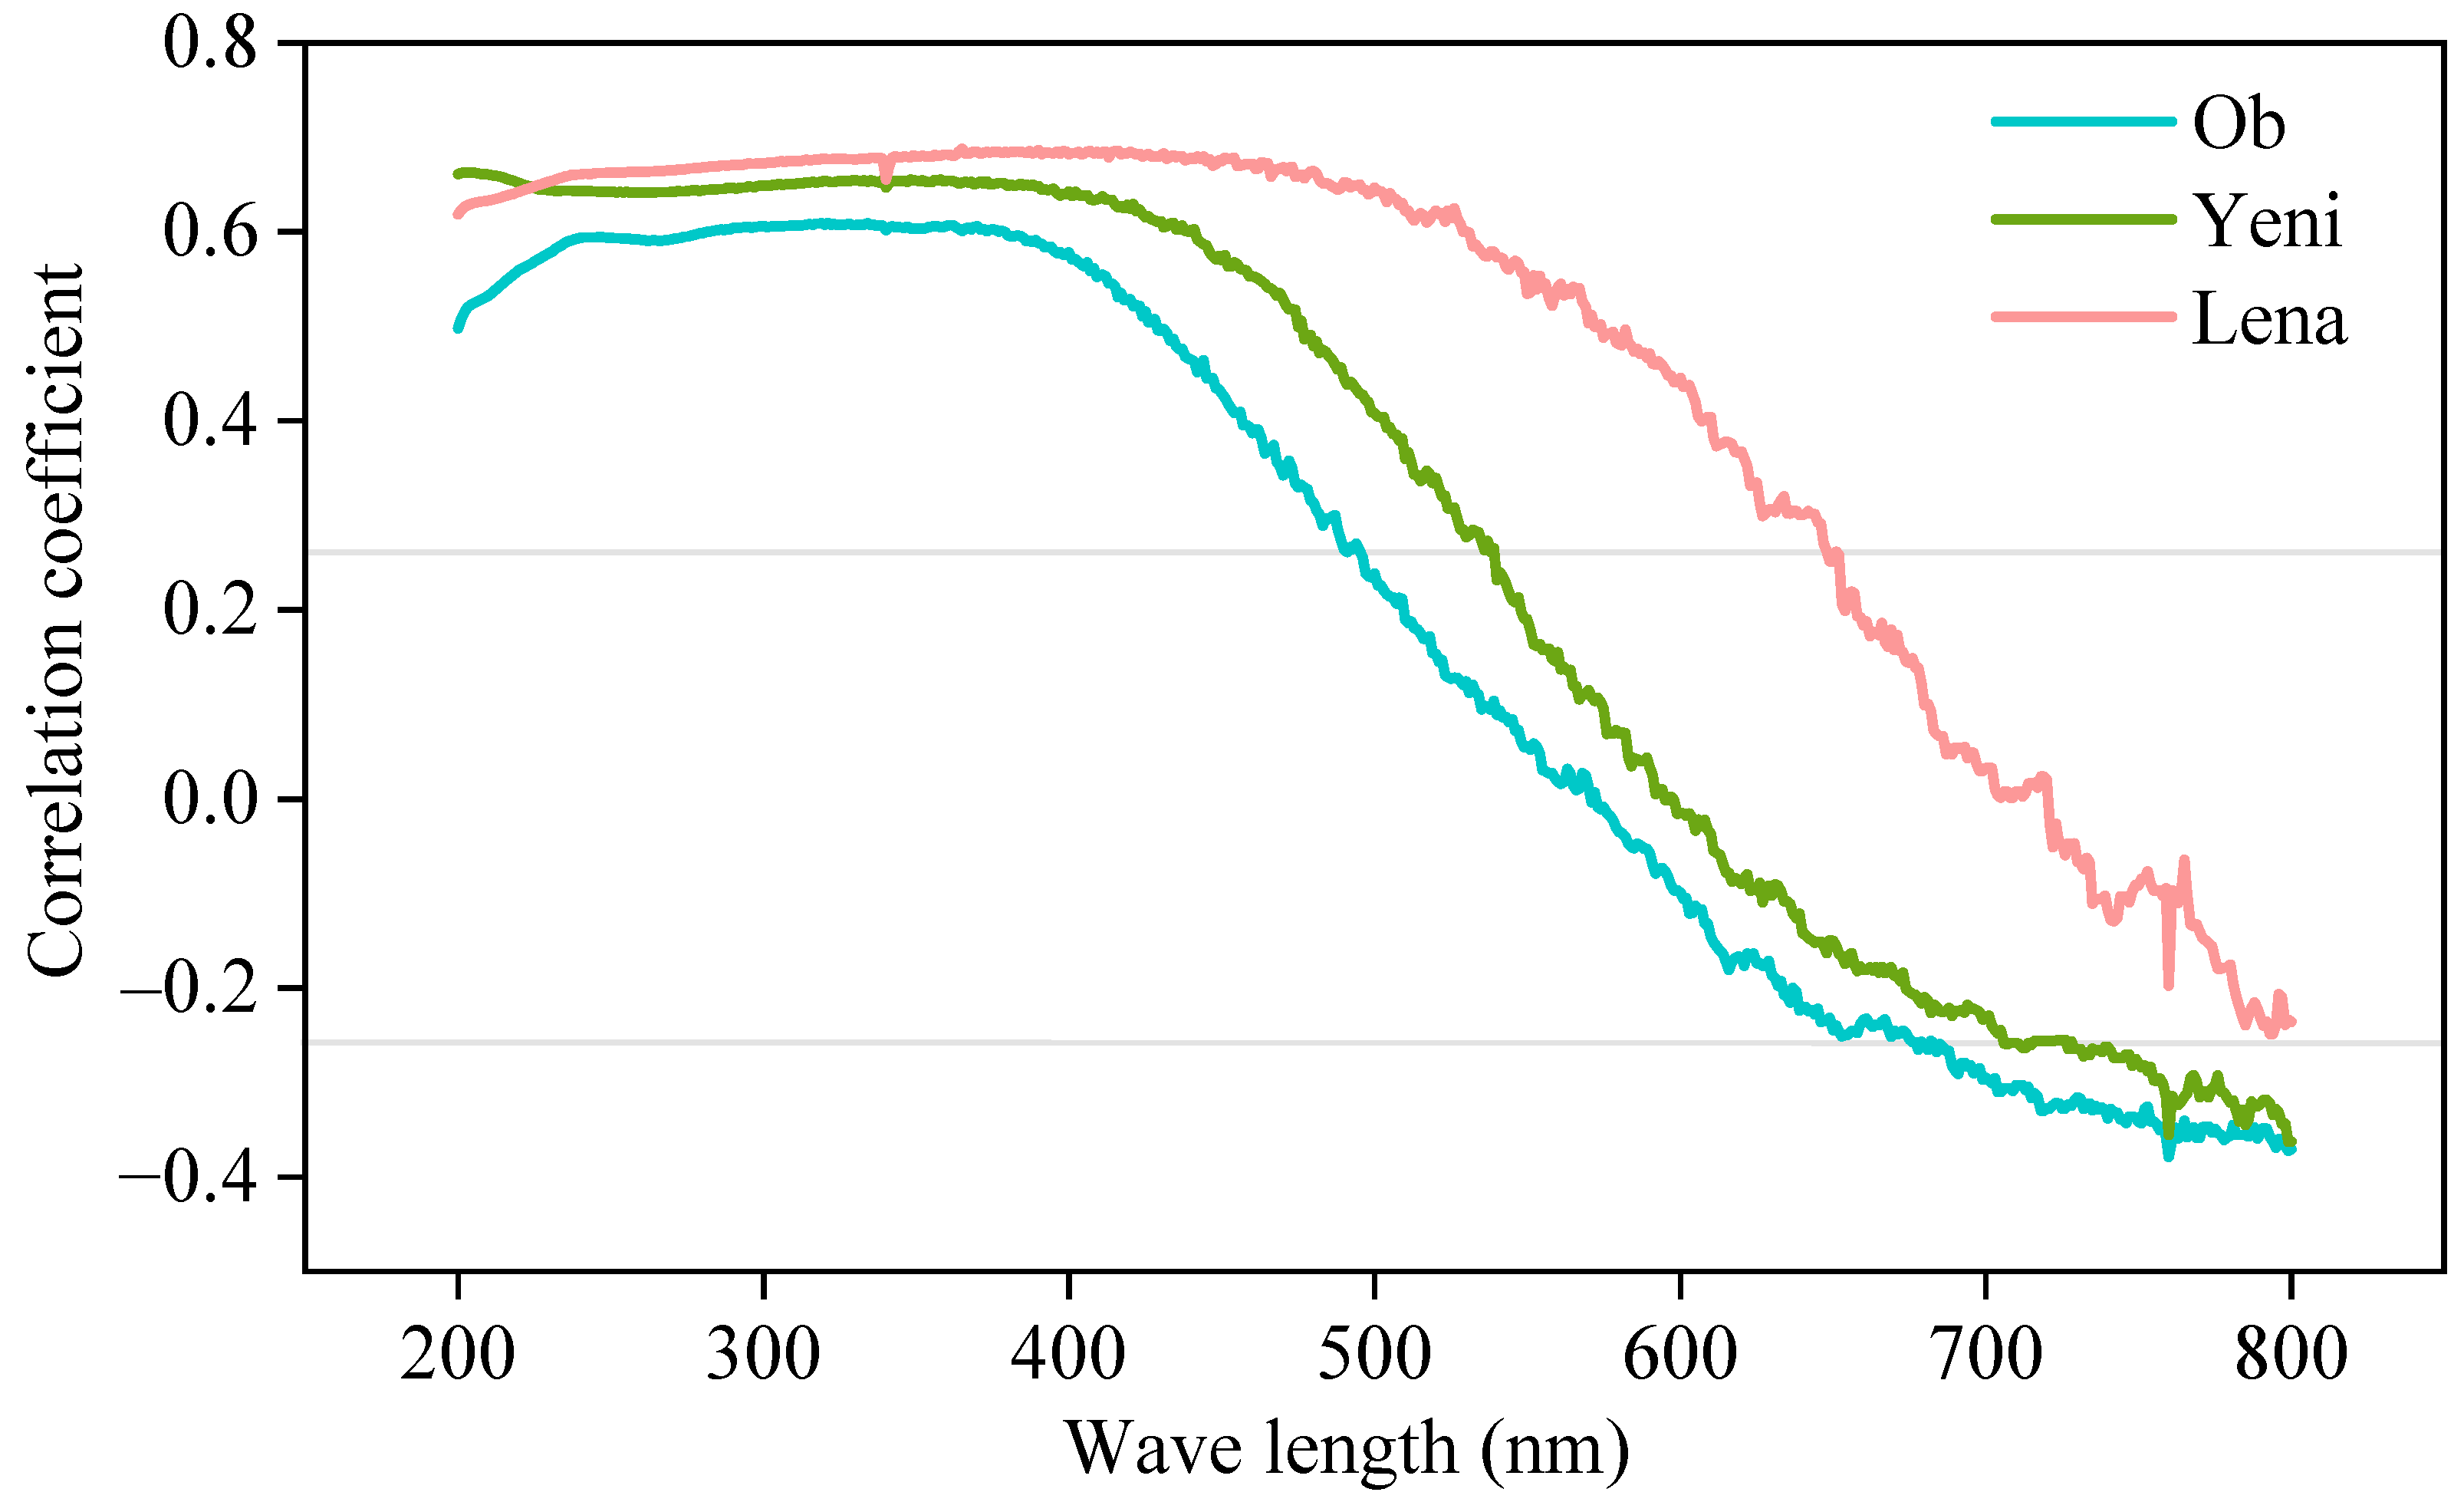
Discharge can drain both underneath and onto sea ice during the melting of land-fast sea ice, with turbid discharge usually extending tens of kilometers on the sea ice and covering the ice surface in a short time [15,61,62]. It was suggested that SIC and discharge from some Arctic rivers have a negative or positive correlation [14]. But the possible reasons have not been explained. It was also suggested that the loss of sea ice caused by discharge cannot be attributed entirely to the riverine heat, and suspended particles and dissolved organic matter contained in the discharge accelerate sea-ice melting by increasing solar radiation absorption when they are flushed onto the sea ice surface [20]. However, this study has not been supported by impurity and absorbance data. Mu et al., 2019 suggested that the greater the discharge from Arctic rivers, the higher the concentration of impurities such as dissolved organic carbon, particulate organic carbon, total mercury, and methylmercury [63]. In addition, the correlation between discharge and absorbance at different wavelengths was analyzed using absorbance data from the Arctic Great Rivers Observatory. It was shown that the absorption of short waves (Ob and Yenisei River Basins less than 550 nm, Lena River Basin less than 650 nm) by discharge increased significantly with the increase in discharge (Figure 14). Therefore, our results further and more convincingly illustrated the fact that increased discharge increased shortwave absorption and then promoted sea-ice melting. Studies of the effects of discharge from the Mackenzie River on sea ice in spring and summer in 2012 have shown that the temperature of the sea water before and after warm discharge enters the sea is very large [19]. The interannual caloric contribution of heat from the Ob, Yenisey, Lena, Kolyma, and Mackenzie Rivers to sea ice loss was studied, and the annual effect of the Lerner River heat on sea ice has been studied in detail [18]. Previous studies have either focused on short-term effects or have not performed comprehensive studies of all rivers. This study comprehensively analyzed the effects of river heat on sea ice on monthly, annual, and interannual timescales in the three largest Arctic rivers.
6. Conclusions
In this study, variations in discharge of the Ob, Yenisei, and Lena Rivers and SIC and SIE in the Kara and Laptev Seas were analyzed during 1979–2019. The effects of changes in discharge and riverine heat on sea ice changes were investigated. The following are the main conclusions:
The monthly (May–October) and annual discharge and riverine heat of the three rivers mainly showed an increasing trend, whereas monthly (May–October) and annual SIC mainly showed a decreasing trend.
The influence of the discharge and accumulated discharge in the three rivers, and the heat and accumulated heat of the Ob and Yenisei River on SIC mainly occurred at the beginning and final stages of sea-ice melting. Riverine heat and accumulated heat in the Lena River had a significant effect on SIC changes in all months except the effect of heat in July and October on SIC in the current month. Discharge accelerated the melting of sea ice by increasing the absorption of solar radiation as the impurities it contained washed to the sea ice surface during the initial and late stages of sea-ice melting.
Changes in cumulative riverine heat from May to September greatly contributed to the SIC changes in the Kara and Laptev Seas. The SIC reduced by 1% when cumulative riverine heat increased by 213.2 × 10⁶ MJ, 181.5 × 10⁶ MJ, and 154.6 × 10⁶ MJ in the Lena, Yenisei, and Ob Rivers, respectively.
Even in the plume coverage areas in the Kara and Laptev Seas, changes in annual discharge from the three rivers and the heat of the Ob River had little impact on the reduction in SIC. The Yenisei River heat has a slight effect on changes in SIC in the 74°N–75.2°N and 68°E–77°E regions, the heat of the Lena River has a significant (p < 0.05) effect on the SIC in most parts of the Laptev Sea, and the influence degree decreases with the distance from the estuary.
Author Contributions
D.H. processed data and wrote the manuscripts; S.K. and M.X. were responsible for presenting the scientific conceptualization, logic, and structure; J.C., C.Y. and Q.Y. provided some resources and useful ideas and reviewed the manuscripts. All authors have read and agreed to the published version of the manuscript.
Funding
This study was supported by the International partnership program of Chinese Academy of Sciences (131B62KYSB20180003), the National Key Research and Development Program of China (2020YFA0608504), National Natural Science Foundation of China (42276261), the project of State Key Laboratory of Cryospheric Science (SKLCS-ZZ-2023) and Youth Innovation Promotion Association CAS (2019414).
Data Availability Statement
The data are contained within Section 3 of the article.
Acknowledgments
We would like to thank all those who contributed to this work.
Conflicts of Interest
The authors declare that they have no conflict of interest to this research.
References
- Post, E.; Bhatt, U.S.; Bitz, C.M.; Brodie, J.F.; Fulton, T.L.; Hebblewhite, M.; Walker, D.A. Ecological consequences of sea-ice decline. Science 2013, 341, 519–524. [Google Scholar] [CrossRef] [PubMed] [Green Version]
- Alabia, I.D.; Molinos, J.G.; Hirata, T.; Mueter, F.J.; David, C.L. Pan-Arctic marine biodiversity and species co-occurrence patterns under recent climate. Sci. Rep. 2023, 13, 4076. [Google Scholar] [CrossRef] [PubMed]
- Chen, J.L.; Kang, S.C.; Guo, J.M.; Xu, M.; Zhang, Z.M. Variation of sea ice and perspectives of the Northwest Passage in the Arctic Ocean. Adv. Clim. Chang. Res. 2021, 12, 447–455. [Google Scholar] [CrossRef]
- Comiso, J.C.; Meier, W.N.; Gersten, R. Variability and trends in the Arctic sea ice cover: Results from different techniques. J. Geophys. Res. Oceans 2017, 122, 6883–6900. [Google Scholar] [CrossRef] [Green Version]
- Serreze, M.C.; Meier, W.N. The Arctic’s sea ice cover: Trends, variability, predictability, and comparisons to the Antarctic. Ann. N. Y. Acad. Sci. 2019, 1436, 36–53. [Google Scholar] [CrossRef]
- Kwok, R. Arctic sea ice thickness, volume, and multiyear ice coverage: Losses and coupled variability (1958–2018). Environ. Res. Lett. 2018, 13, 105005. [Google Scholar] [CrossRef]
- Maslanik, J.A.; Fowler, C.; Stroeve, J.; Drobot, S.; Zwally, J.; Yi, D.; Emery, W. A younger, thinner Arctic ice cover: Increased potential for rapid, extensive sea-ice loss. Geophys. Res. Lett. 2007, 34, 497–507. [Google Scholar] [CrossRef] [Green Version]
- Shiklomanov, I.A.; Shiklomanov, A.I. Climatic change and dynamics of river discharge into the Arctic Ocean. Water Resour. 2003, 30, 593–601. [Google Scholar] [CrossRef]
- Vörösmarty, C.J.; Hinzman, L.D.; Peterson, B.J.; Bromwich, D.H.; Hamilton, L.C.; Morison, J.; Romanovsky, V.E.; Sturm, M.; Webb, R.S. The Hydrological Cycle and Its Role in Arcticand Global Environmental Change: A Rationale and Strategy for Synthesis Study, 3rd ed.; Arctic Research Consortium of the U.S.: Fairbanks, AK, USA, 2001; p. 84. [Google Scholar]
- Magritsky, D.V.; Frolova, N.L.; Evstigneev, V.M.; Povalishnikova, E.S.; Kireeva, M.B.; Pakhomova, O.M. Long-term changes of river water inflow into the seas of the Russian Arctic sector. Polarforschung 2018, 87, 177–194. [Google Scholar]
- Shiklomanov, A.; Déry, S.; Tretiakov, M.; Yang, D.Q.; Magritsky, M.; Georgiadi, A.; Tang, W.Q. River Freshwater Flux to the Arctic Ocean. In Arctic Hydrology, Permafrost and Ecosystems, 1st ed.; Yang, D., Kane, D., Eds.; Springer: Cham, Switzerland; Berlin/Heidelberg, Germany, 2021; pp. 703–738. [Google Scholar]
- Xu, M.; Kang, S.C.; Wang, X.M.; Wu, H.; Hu, D.D.; Yang, D.Q. Climate and hydrological changes in the Ob River Basin during 1936–2017. Hydrol. Process. 2019, 34, 1821–1836. [Google Scholar] [CrossRef]
- Wang, P.; Huang, Q.W.; Pozdniakov, S.P.; Liu, S.Q.; Ma, N.; Wang, T.Y.; Zhang, Y.Q.; Yu, J.J.; Xie, J.X.; Fu, G.B.; et al. Potential role of permafrost thaw on increasing Siberian river discharge. Environ. Res. Lett. 2021, 16, 034046. [Google Scholar] [CrossRef]
- Li, P.; Zhang, Z.; Liu, J. Dominant climate factors influencing the Arctic runoff and association between the Arctic runoff and sea ice Acta. Oceanol. Sin. 2010, 29, 10–20. [Google Scholar] [CrossRef]
- Dean, K.G.; Stringer, W.J.; Ahlnas, K.; Searcy, C.; Weingartner, T. The influence of river discharge on the thawing of sea ice, Mackenzie River Delta: Albedo and temperature analyses. Polar Res. 1994, 13, 83–94. [Google Scholar] [CrossRef]
- Whitefield, J.; Winsor, P.; McClelland, J.; Menemenlis, D. A new river discharge and river temperature climatology data set for the pan-Arctic region. Ocean Model. 2015, 88, 1–15. [Google Scholar] [CrossRef]
- Yang, D.; Kane, D. River Heat Flux into the Arctic Ocean. In Arctic Hydrology, Permafrost and Ecosystems, 1st ed.; Yang, D., Kane, D., Eds.; Springer: Cham, Switzerland; Berlin//Heidelberg, Germany, 2021; pp. 739–761. [Google Scholar]
- Park, H.; Watanabe, E.; Kim, Y.; Polyakov, I.; Oshima, K.; Zhang, X.D.; Kimball, J.S.; Yang, D.Q. Increasing riverine heat influx triggers Arctic sea ice decline and oceanic and atmospheric warming. Sci. Adv. 2020, 6, eabc4699. [Google Scholar] [CrossRef]
- Nghiem, S.V.; Hall, D.K.; Rigor, I.G.; Li, P.; Neumann, G. Effects of Mackenzie River discharge and bathymetry on sea ice in the Beaufort Sea. Geophys. Res. Lett. 2014, 41, 873–879. [Google Scholar] [CrossRef] [Green Version]
- Bauch, D.; Hölemann, J.A.; Nikulina, A.; Wegner, C.; Janout, M.A.; Timokhov, L.A.; Kassens, H. Correlation of river water and local sea-ice melting on the Laptev Sea shelf (Siberian Arctic). J. Geophys. Res. Oceans 2013, 118, 550–561. [Google Scholar] [CrossRef] [Green Version]
- Letscher, R.T.; Hansell, D.A.; Kadko, D. Rapid removal of terrigenous dissolved organic carbon over the Eurasian shelves of the Arctic Ocean. Mar. Chem. 2011, 123, 78–87. [Google Scholar] [CrossRef]
- McClellan, J.W. Increasing river discharge in the Eurasian Arctic: Consideration of dams, permafrost thaw, and fires as potential agents of change. J. Geophys. Res. 2004, 109, D18102. [Google Scholar] [CrossRef] [Green Version]
- Yang, D.; Kane, D.L.; Hinzman, L.D.; Zhang, X.B.; Zhang, T.J.; Ye, H.Y. Siberian Lena River hydrologic regime and recent change. J. Geophys. Res. Atmos. 2002, 107, 4694. [Google Scholar] [CrossRef]
- Yang, D.; Ye, B.; Kane, D.L. Streamflow changes over Siberian Yenisei river basin. J. Hydrol. 2004, 296, 59–80. [Google Scholar] [CrossRef]
- Dukhovskoy, D.; Johnson, M.; Proshutinsky, A. Arctic decadal variability from an idealized atmosphere-ice-ocean model: 2. Simulation of decadal oscillations. J. Geophys. Res. 2006, 111, C06029. [Google Scholar] [CrossRef] [Green Version]
- Thibodeau, B.; Bauch, D.; Kassens, H.; Timokhov, L.A. Interannual variations in river water content and distribution over the Laptev Sea between 2007 and 2011: The Arctic Dipole connection. Geophys. Res. Lett. 2014, 41, 7237–7244. [Google Scholar] [CrossRef] [Green Version]
- Zatsepin, A.G.; Zavialov, P.O.; Kremenetskiy, V.V.; Poyarkov, S.G.; Soloviev, D.M. The upper desalinated layer in the Kara Sea. Oceanology 2010, 50, 657–667. [Google Scholar] [CrossRef]
- Zavialov, P.O.; Izhitskiy, A.S.; Osadchiev, A.A.; Pelevin, V.V.; Grabovskiy, A.B. The structure of thermohaline and bio-optical fields in the upper layer of the Kara Sea in September 2011. Oceanology 2015, 55, 461–471. [Google Scholar] [CrossRef]
- Osadchiev, A.A.; Pisareva, M.N.; Spivak, E.A.; Shchuka, S.A.; Semiletov, I.P. Freshwater transport between the Kara, Laptev, and East-Siberian seas. Sci. Rep. 2020, 10, 13041. [Google Scholar] [CrossRef]
- Osadchiev, A.A.; Frey, D.I.; Shchuka, S.A.; Tilinina, N.D.; Morozov, E.G.; Zavialov, P.O. Structure of the Freshened Surface Layer in the Kara Sea During Ice-Free Periods. J. Geophys. Res. Oceans 2021, 126, e2020JC016486. [Google Scholar] [CrossRef]
- Shiklomanov, A.I. Arctic Great Rivers Observatory. Discharge Dataset. 2020. Available online: https://arcticgreatrivers.org/data/ (accessed on 30 September 2021).
- Lammers, R.B.; Pundsack, J.W.; Shiklomanov, A.I. Variability in river temperature, discharge, and energy flux from the Russian pan-Arctic landmass. J. Geophys. Res. Biogeosci. 2007, 112, 398–408. [Google Scholar] [CrossRef] [Green Version]
- Liu, B.Z.; Yang, D.Q.; Ye, B.S.; Berezovskaya, S. Long-term open-water season stream temperature variations and changes over Lena River Basin in Siberia. Glob. Planet. Chang. 2005, 48, 96–111. [Google Scholar] [CrossRef] [Green Version]
- Elshin, Y. River heat runoff in the European part of Russia. Meteorol. Hydrol. 1981, 9, 85–93. [Google Scholar]
- Park, H.; Yoshikawa, Y.; Yang, D.Q.; Oshima, K. Warming water in Arctic terrestrial rivers under climate change. J. Hydrometeorol. 2017, 18, 1983–1995. [Google Scholar] [CrossRef]
- Cavalieri, D.J.; Parkinson, C.L.; Gloersen, P.; Zwally, H.J. Sea Ice Concentrationsfrom Nimbus-7 SMMR and DMSP SSM/I-SSMIS Passive Microwave Data; Version 1; NASA National Snow and Ice Data Center Distributed ActiveArchive Center: Boulder, CO, USA, 1996. [Google Scholar] [CrossRef]
- Fetterer, F.K. Updated daily. In Sea Ice Index; Version 3; [Indicate Subset Used]; NSIDC—National Snow and Ice Data Center: Boulder, CO, USA, 2017. [Google Scholar] [CrossRef]
- Kwok, R.; Rothrock, D.A. Decline in Arctic sea ice thickness from submarine and ICESat records: 1958–2008. Geophys. Res. Lett. 2009, 36, L15501. [Google Scholar] [CrossRef] [Green Version]
- Cavalieri, D.J.; Parkinson, C.L. Arctic sea ice variability and trends, 1979–2010. Cryosphere 2012, 6, 881–889. [Google Scholar] [CrossRef] [Green Version]
- Sen, P.K. Estimates of the regression coefficient based on Kendall’s tau. J. Am. Stat. Assoc. 1968, 63, 1379–1389. [Google Scholar] [CrossRef]
- Theil, H. A rank-invariant method of linear and polynomial regression analysis. Indag. Math. 1950, 12, 173. [Google Scholar]
- Kendall, M.G. A New Measure of Rank Correlation. Biometrika 1938, 30, 81–93. [Google Scholar] [CrossRef]
- Mann, H.B. Nonparametric Tests Against Trend. Econometrica 1945, 13, 245–259. [Google Scholar] [CrossRef]
- Qu, S.; Wang, L.; Lin, A.; Zhu, H.; Yuan, M. What drives the vegetation restoration in Yangtze River basin, China: Climate change or anthropogenic factors? Ecol. Indic. 2018, 90, 438–450. [Google Scholar] [CrossRef]
- Peng, C.K.; Buldyrev, S.V.; Havlin, S. Mosaic organization of DNA nucleotides. Phys. Rev. E 1994, 49, 1685–1689. [Google Scholar] [CrossRef] [Green Version]
- Matsoukas, C.; Islam, S.; Rodriguez-lturbe, I. Detrended fluctuation analysis of rainfall and streamflow time series. J. Geophys. Res. 2000, 105, 29165–29172. [Google Scholar] [CrossRef]
- Zuo, D.; Han, Y.; Xu, Z.; Li, P.; Ban, C.; Sun, W.; Pang, B.; Peng, D.; Kan, G.; Zhang, R. Time-lag effects of climatic change and drought on vegetation dynamics in an alpine river basin of the Tibet Plateau, China. J. Hydrol. 2021, 600, 126532. [Google Scholar] [CrossRef]
- Chu, H.; Venevsky, S.; Wu, C.; Wang, M. NDVI-based vegetation dynamics and its response to climate changes at Amur-Heilongjiang River Basin from 1982 to 2015. Sci. Total Environ. 2019, 650, 2051–2062. [Google Scholar] [CrossRef] [PubMed]
- Cui, L.F.; Wang, Z.D.; Deng, L.H.; Qu, S. Vegetation Dynamics and Their Relations with Climate Change at Seasonal Scales in the Yangtze River Basin, China. Appl. Ecol. Environ. Res. 2020, 18, 3543–3556. [Google Scholar] [CrossRef]
- Rawlins, M. Regional and Basin Streamflow Regimes and Changes: Climate Impact and Human Effect. Arct. Hydrol. Permafr. Ecosyst. 2021, 33, 159–186. [Google Scholar]
- Yang, D.Q.; Zhao, Y.Y.; Armstrong, R.; Robinson, D.; Brodzik, M. Streamflow response to seasonal snow cover mass changes over large Siberian watersheds. J. Geophys. Res.-Earth Surf. 2007, 112, F02S22. [Google Scholar] [CrossRef] [Green Version]
- Lin, H.; Cheng, X.; Zheng, L.; Peng, X.Q.; Feng, W.; Peng, F.K. Recent Changes in Groundwater and Surface Water in Large Pan-Arctic River Basins. Remote Sens. 2022, 14, 607. [Google Scholar] [CrossRef]
- Alexandrov, V.T.; Martin, T.; Kolatschek, J.; Eicken, H.; Kreyscher, M.; Makshtas, A.P. Sea ice circulation in the Laptev Sea and ice export to the Arctic Ocean: Results from satellite remote sensing and numerical modelling. J. Geophys. Res. Oceans 2000, 105, 17143–17159. [Google Scholar] [CrossRef] [Green Version]
- Bareiss, J.; Eicken, H.; Helbig, A.; Martin, T. Impact of river discharge and regional climatology on the decay of sea ice in the Laptev Sea during spring and early summer. Arct. Antarct. Alp. Res. 1999, 31, 214–229. [Google Scholar] [CrossRef]
- Bareiss, J.; Goergen, K. Spatial and temporal variability of sea ice in the Laptev Sea: Analyses and review of satellite passive-microwave data and model results, 1979 to 2002. Glob. Planet. Chang. 2005, 48, 28–54. [Google Scholar] [CrossRef]
- Dmitrenko, I.A. Atmospherically forced sea-level variability in western Hudson Bay, Canada. Ocean Sci. 2021, 17, 1367–1384. [Google Scholar] [CrossRef]
- Kumar, A.; Yadav, J.; Mohan, R. Spatio-temporal change and variability of Barents-Kara sea ice, in the arctic: Ocean and atmospheric implications. Sci. Total Environ. 2020, 753, 142046. [Google Scholar] [CrossRef] [PubMed]
- Schroeder, D. Arctic Sea Ice; Centre for Polar Observation and Modelling, Department of Meteorology, University of Reading: Reading, UK, 2021; pp. 154–196. [Google Scholar]
- Årthun, M.; Schrum, C. Ocean surface heat flux variability in the Barents Sea. J. Mar. Syst. 2010, 83, 88–98. [Google Scholar] [CrossRef] [Green Version]
- Smedsrud, L.H.; Sorteberg, A.; Kloster, K. Recent and future changes of the Arctic sea-ice cover. Geophys. Res. Lett. 2008, 35, L20503. [Google Scholar] [CrossRef] [Green Version]
- Alkire, M.B.; Trefry, J.H. Transport of spring floodwater from rivers under ice to the Alaskan Beaufort Sea. J. Geophys. Res. Oceans 2006, 111, C12008. [Google Scholar] [CrossRef] [Green Version]
- Overeem, I.; Nienhuis, J.H.; Piliouras, A. Ice-dominated Arctic deltas. Nat. Rev. Earth Environ. 2022, 3, 225–240. [Google Scholar] [CrossRef]
- Mu, C.C.; Zhang, F.; Chen, X.; Ge, S.M.; Mu, M.; Jia, L.; Wu, Q.B.; Zhang, T.J. Carbon and mercury export from the Arctic rivers and response to permafrost degradation. Water Res. 2019, 161, 54–60. [Google Scholar] [CrossRef]
Figure 1.
Locations of the three Siberian river basins and the main coverage areas of the plumes in the Arctic Ocean. The red box on the left indicates the main plume coverage area of the Ob and Yenisei River Basin in the Kara Sea. The red box on the right indicates the main plume coverage area of the Lena River Basin in the Laptev Sea. The blue dots indicate the location of hydrological stations at estuaries.

Figure 2.
Monthly mean value of (a) discharge, (b) river water temperature, (c) riverine heat, and (d) SIC.
Figure 2.
Monthly mean value of (a) discharge, (b) river water temperature, (c) riverine heat, and (d) SIC.

Figure 3.
Spatial distribution of monthly mean SIC in (a,b) January, (c,d) February, (e,f) March, (g,h) April, (i,j) May, (k,l) June, (m,n) July, (o,p) August, (q,r) September, (s,t) October, (u,v) November, and (w,x) December in the study area during 1979–2019.
Figure 3.
Spatial distribution of monthly mean SIC in (a,b) January, (c,d) February, (e,f) March, (g,h) April, (i,j) May, (k,l) June, (m,n) July, (o,p) August, (q,r) September, (s,t) October, (u,v) November, and (w,x) December in the study area during 1979–2019.

Figure 4.
Trends in monthly (a) discharge, (b) river water temperature, (c) riverine heat, and (d) spatially averaged SIC in the study area. * indicated significance level at 95%. ** indicated significance level at 99%.
Figure 4.
Trends in monthly (a) discharge, (b) river water temperature, (c) riverine heat, and (d) spatially averaged SIC in the study area. * indicated significance level at 95%. ** indicated significance level at 99%.

Figure 5.
Significant (p < 0.05) change trends in monthly SIC in (a,b) January, (c,d) February, (e,f) March, (g,h) April, (i,j) May, (k,l) June, (m,n) July, (o,p) August, (q,r) September, (s,t) October, (u,v) November, and (w,x) December in the study area.
Figure 5.
Significant (p < 0.05) change trends in monthly SIC in (a,b) January, (c,d) February, (e,f) March, (g,h) April, (i,j) May, (k,l) June, (m,n) July, (o,p) August, (q,r) September, (s,t) October, (u,v) November, and (w,x) December in the study area.

Figure 6.
Variations in (a–c) annual mean discharge and (d–f) riverine heat in the three Siberia Rivers, and (g,h) SIC.
Figure 6.
Variations in (a–c) annual mean discharge and (d–f) riverine heat in the three Siberia Rivers, and (g,h) SIC.

Figure 7.
Spatial distribution of correlations between SIC in the two seas in May–October and discharge from the corresponding rivers in the current month for the (a,d,g,j,m,p) Ob River, (b,e,h,k,n,q) Yenisei River, and (c,f,i,l,o,r) Lena River.
Figure 7.
Spatial distribution of correlations between SIC in the two seas in May–October and discharge from the corresponding rivers in the current month for the (a,d,g,j,m,p) Ob River, (b,e,h,k,n,q) Yenisei River, and (c,f,i,l,o,r) Lena River.

Figure 8.
Spatial distribution of correlations between SIC in the two seas in May–October and accumulated discharge from the corresponding rivers from May to the current month for the (a,d,g,j,m) Ob River, (b,e,h,k,n) Yenisei River, and (c,f,i,l,o) Lena River.
Figure 8.
Spatial distribution of correlations between SIC in the two seas in May–October and accumulated discharge from the corresponding rivers from May to the current month for the (a,d,g,j,m) Ob River, (b,e,h,k,n) Yenisei River, and (c,f,i,l,o) Lena River.

Figure 9.
Spatial distribution of correlations between SIC in the two seas in May–October and heat from the corresponding rivers in the current month for the (a,d,g,j,m,p) Ob River, (b,e,h,k,n,q) Yenisei River, and (c,f,i,l,o,r) Lena River.
Figure 9.
Spatial distribution of correlations between SIC in the two seas in May–October and heat from the corresponding rivers in the current month for the (a,d,g,j,m,p) Ob River, (b,e,h,k,n,q) Yenisei River, and (c,f,i,l,o,r) Lena River.

Figure 10.
Spatial distribution of correlations between SIC in the two seas in May–October and accumulated heat from the corresponding rivers from May to the current month for the (a,d,g,j,m) Ob River, (b,e,h,k,n) Yenisei River, and (c,f,i,l,o) Lena River.
Figure 10.
Spatial distribution of correlations between SIC in the two seas in May–October and accumulated heat from the corresponding rivers from May to the current month for the (a,d,g,j,m) Ob River, (b,e,h,k,n) Yenisei River, and (c,f,i,l,o) Lena River.

Figure 11.
Seasonality correlation between SIC in the two seas and riverine heat (a,c,e) or accumulated riverine heat from May to corresponding month (b,d,f) from the corresponding rivers.
Figure 11.
Seasonality correlation between SIC in the two seas and riverine heat (a,c,e) or accumulated riverine heat from May to corresponding month (b,d,f) from the corresponding rivers.

Figure 12.
Spatial distribution of correlations between annual SIC in the two seas and discharge from the corresponding rivers for the (a) Ob River, (b) Yenisei River, and (c) Lena River.
Figure 12.
Spatial distribution of correlations between annual SIC in the two seas and discharge from the corresponding rivers for the (a) Ob River, (b) Yenisei River, and (c) Lena River.

Figure 13.
Spatial distribution of correlations between annual SIC in the two seas and heat from the corresponding rivers for the (a) Ob River, (b) Yenisei River, and (c) Lena River.
Figure 13.
Spatial distribution of correlations between annual SIC in the two seas and heat from the corresponding rivers for the (a) Ob River, (b) Yenisei River, and (c) Lena River.

Figure 14.
Correlation between discharge and absorbance at different wavelengths.


Table 1.
Correlation between monthly SIC in the two seas and discharge from the corresponding rivers.
Table 1.
Correlation between monthly SIC in the two seas and discharge from the corresponding rivers.
| Discharge | ||||
|---|---|---|---|---|
| The Ob River | The Yenisei River | The Lena River | ||
| SIC of the Kara Sea/Laptev Sea | May | −0.679 ** | −0.532 ** | −0.530 ** |
| Jun. | 0.186 | 0.476 ** | 0.397 * | |
| Jul. | 0.229 | 0.24 | 0.076 | |
| Aug. | −0.259 | 0.04 | −0.235 | |
| Sep. | −0.045 | 0.241 | −0.202 | |
| Oct. | −0.016 | −0.426 ** | −0.392 * | |
* Significance level at 95%. ** Significance level at 99%.
Table 2.
Correlation between monthly SIC in the two seas and accumulated discharge from the corresponding rivers.
Table 2.
Correlation between monthly SIC in the two seas and accumulated discharge from the corresponding rivers.
| Discharge | ||||
|---|---|---|---|---|
| The Ob River | The Yenisei River | The Lena River | ||
| SIC of the Kara Sea/Laptev Sea | Jun. | −0.407 ** | 0.026 | 0.051 |
| Jul. | −0.011 | 0.276 | 0.019 | |
| Aug. | −0.227 | −0.091 | −0.067 | |
| Sep. | −0.033 | −0.014 | −0.198 | |
| Oct. | −0.162 | 0.077 | −0.255 | |
** Significance level at 99%.
Table 3.
Correlation between monthly SIC in the two seas and heat of the Ob and Yenisei Rivers (Lena River).
Table 3.
Correlation between monthly SIC in the two seas and heat of the Ob and Yenisei Rivers (Lena River).
| Riverine Heat | ||||
|---|---|---|---|---|
| The Ob River | The Yenisei River | The Lena River | ||
| SIC of the Kara Sea/Laptev Sea | May | −0.625 ** | −0.654 ** | −0.663 ** |
| Jun. | −0.213 | 0.113 | −0.434 ** | |
| Jul. | 0.158 | 0.136 | −0.221 | |
| Aug. | −0.245 | −0.092 | −0.381 * | |
| Sep. | 0.004 | 0.049 | −0.384 * | |
| Oct. | −0.325 * | −0.572 ** | 0 | |
* Significance level at 95%. ** Significance level at 99%.
Table 4.
Correlation between monthly SIC in the two seas and accumulated riverine heat of the Ob and Yenisei Rivers (Lena River).
Table 4.
Correlation between monthly SIC in the two seas and accumulated riverine heat of the Ob and Yenisei Rivers (Lena River).
| Riverine Heat | ||||
|---|---|---|---|---|
| The Ob River | The Yenisei River | The Lena River | ||
| SIC of the Kara Sea/Laptev Sea | Jun. | −0.428 ** | −0.153 | −0.473 ** |
| Jul. | −0.089 | −0.027 | −0.495 ** | |
| Aug. | −0.138 | −0.144 | −0.568 ** | |
| Sep. | −0.013 | −0.074 | −0.500 ** | |
| Oct. | −0.171 | −0.316 | −0.531 ** | |
** Significance level at 99%.
Table 5.
Correlation between annual SIC in the two seas and discharge in the Ob and Yenisei Rivers/Lena River.
Table 5.
Correlation between annual SIC in the two seas and discharge in the Ob and Yenisei Rivers/Lena River.
| Discharge | |||
|---|---|---|---|
| The Ob River | The Yenisei River | The Lena River | |
| Sic of the Kara Sea/Laptev Sea | −0.108 | 0.150 | −0.148 |
Table 6.
Correlation between annual SIC in the two seas and riverine heat of the Ob and Yenisei Rivers (Lena River).
Table 6.
Correlation between annual SIC in the two seas and riverine heat of the Ob and Yenisei Rivers (Lena River).
| Riverine Heat | |||
|---|---|---|---|
| The Ob River | The Yenisei River | The Lena River | |
| Sic of the Kara Sea/Laptev Sea | 0.150 | 0.171 | −0.443 ** |
** Significance level at 99%.
Disclaimer/Publisher’s Note: The statements, opinions and data contained in all publications are solely those of the individual author(s) and contributor(s) and not of MDPI and/or the editor(s). MDPI and/or the editor(s) disclaim responsibility for any injury to people or property resulting from any ideas, methods, instructions or products referred to in the content. |
© 2023 by the authors. Licensee MDPI, Basel, Switzerland. This article is an open access article distributed under the terms and conditions of the Creative Commons Attribution (CC BY) license (https://creativecommons.org/licenses/by/4.0/).
Share and Cite
MDPI and ACS Style
Hu, D.; Xu, M.; Kang, S.; Chen, J.; Yang, C.; Yang, Q. The Effects of Discharge Changes in Siberian Rivers on Arctic Sea-Ice Melting. Remote Sens. 2023, 15, 3477. https://doi.org/10.3390/rs15143477
AMA Style
Hu D, Xu M, Kang S, Chen J, Yang C, Yang Q. The Effects of Discharge Changes in Siberian Rivers on Arctic Sea-Ice Melting. Remote Sensing. 2023; 15(14):3477. https://doi.org/10.3390/rs15143477
Chicago/Turabian StyleHu, Didi, Min Xu, Shichang Kang, Jinlei Chen, Chengde Yang, and Qian Yang. 2023. "The Effects of Discharge Changes in Siberian Rivers on Arctic Sea-Ice Melting" Remote Sensing 15, no. 14: 3477. https://doi.org/10.3390/rs15143477
Note that from the first issue of 2016, this journal uses article numbers instead of page numbers. See further details here.