Article

Fiber Optic Acoustic Sensing to Understand and Affect the Rhythm of the Cities: Proof-of-Concept to Create Data-Driven Urban Mobility Models

1
Department of Signal Theory, Telematics and Communications, University of Granada, 18071 Granada, Spain
2
Research Center on Information and Communications Technology (CITIC), University of Granada, 18071 Granada, Spain
*
Author to whom correspondence should be addressed.
Remote Sens. 2023, 15(13), 3282; https://doi.org/10.3390/rs15133282
Submission received: 1 May 2023 / Revised: 20 June 2023 / Accepted: 21 June 2023 / Published: 26 June 2023
(This article belongs to the Special Issue Multi-Sensor Systems and Data Fusion in Remote Sensing II)

Abstract

:
In the framework of massive sensing and smart sustainable cities, this work presents an urban distributed acoustic sensing testbed in the vicinity of the School of Technology and Telecommunication Engineering of the University of Granada, Spain. After positioning the sensing technology and the state of the art of similar existing approaches, the results of the monitoring experiment are described. Details of the sensing scenario, basic types of events automatically distinguishable, initial noise removal actions and frequency and signal complexity analysis are provided. The experiment, used as a proof-of-concept, shows the enormous potential of the sensing technology to generate data-driven urban mobility models. In order to support this fact, examples of preliminary density of traffic analysis and average speed calculation for buses, cars and pedestrians in the testbed’s neighborhood are exposed, together with the accidental presence of a local earthquake. Challenges, benefits and future research directions of this sensing technology are pointed out.

1. Introduction

The UN’s Sustainable Development Goals Report for 2022 [1] includes the analysis of Goal 11 devoted to sustainable cities and communities stating that 99% of world’s urban population breathe polluted air and, depending on the region of the world, few city dwellers have convenient access to public transportation. In addition, often public spaces in congested urban areas play a vital role in social and economic life, but are not widely accessible. The first step to improve actual conditions in cities is learning realistic models of their present mobility patterns usable to monitor urban settlements, implement smart traffic management tools, and create sustainable smart mobility plans.
The paradigms of smart cities [2,3,4] and multimodal remote sensing [5,6] provide very useful tools to obtain data transformable into knowledge, to face the challenges stated. Massive amounts of data with very diverse formats and origins are analyzed using automatic signal processing and Big Data approaches combined to understand what happens and provide directions of change and improvement. Regarding the analysis of urban traffic, approaches from the massive data retrieval and pattern extraction based on artificial intelligence tools [7,8], traffic prediction models [9,10], to digital-twin based strategies [11,12] are oriented to modify urban traffic once analyzed.
There is a wide range of sensing technologies that contribute to the monitoring of urban traffic like, e.g., unmanned aerial vehicles [13], crowd-sensing of users’ mobile phones [14], traffic cameras [15], vehicles GPS [16], or satellite images [17]. The Internet of Vehicles (IoV) approach [18] provides vehicles with smart devices such as wireless sensors, onboard computers, GPS antennas, radar, etc., to collect and process large amounts of data while enabling information interaction between vehicles.
In this multi-modal urban sensing scenario, the usage of communication optical fibers as sensors to monitor mobility patterns has gained great interest. Distributed acoustic sensing [19,20] is an emergent sensing technology based on the Rayleigh scattering phenomenon occurring in an optical fiber when an interrogation light-wave faces its inhomogeneities. Depending on the fiber’s refraction index, part of the incoming light-wave is backscattered towards the interrogator and can be analyzed. If a local perturbation occurs along the fiber (e.g., vibrations or changes in the fiber’s strain or temperature produced by moving stimuli), its refraction index will change locally providing a proportional change in the properties of the backscattered light-wave coming from the spatial point where the perturbation occurred. This capability of demodulating the magnitude and location of the stimuli affecting the fiber, converts fibers into arrays of sensors adopting the concept of distributed sensing versus traditional point sensors. Vibrations and strain or temperature perturbations in the bandwidth of acoustic signals (up to the MHz regime) occurring along the fiber are registered.

1.1. Distributed Acoustic Sensing and Urban Traffic Monitoring Overview

Perturbations along the fiber modulate the backscattered light-wave that travels back to the interrogator. Once received, the stimuli demodulation can be performed in the time domain, receiving the name of Optical Time-Domain Reflectometry (OTDR). Conventional OTDR has been widely used to monitor static processes like fiber attenuation for fault detection in telecommunication cables. However, it is not suitable to detect local dynamic changes in the fiber refraction index, as expected in the distributed acoustic sensing. For such a purpose, several approximations based on the analysis of the phase of the backscattered light-wave have been proposed [21]. Coherent phase-OTDR [22,23] is based on the complete phase recovery of the interferometry signal provided by optical mixing of the backscattered and reference lights. It provides accurate dynamic measurements of strain at the cost of high system complexity (requisite of laser coherence) and contestable long-term stability. Phase-sensitive OTDR [24] is a simpler direct detection approach based only on intensity variations of the interferometry signal, opposite to the phase recovery needed in the coherent detection formulation. As a drawback, intensity variations of the interferometry signal do not show linear dependence with the perturbation applied. Perturbations are detected, but their quantification can only be achieved through a frequency sweep of consecutive probe pulses representing an increase of the measurement time and complexity. Chirped-pulse phase-sensitive OTDR (CP- Φ OTDR), mathematically formalized and demonstrated in 2016 [21,25], preserves the direct detection advantages of Phase-sensitive OTDR, avoiding the time-consuming frequency sweep needed. Consecutive interrogations are substituted by a single probe pulse with a linear chirp. If the chirp-induced spectral content is much larger than the pulse transform-limited bandwidth, the linear relationship between the time-domain signal and its spectrum allows for the mapping of perturbation-induced spectral shifts in the trace into local temporal trace delays. Then, the empirical mapping of trace delays and ongoing changes of its group refractive index [26] serves to quantify dynamic local perturbations along the fiber expected in distributed acoustic sensing.
The sensing possibilities of the distributed acoustic sensing (DAS) technology are used in a wide range of application fields like active seismology and vertical seismic profiles generation [27], gas or petroleum deposits detection [28], ambient noise interferometries of the Earth’s surface [29], passive seismic and volcano-seismic monitoring [30,31,32], security and perimeters surveillance [33], or big infrastructures health monitoring [34], among others.
In the scope of urban traffic monitoring, the usage of DAS has experienced an important growth in the last years. Its longer monitoring range compared to the spatial sparseness of point sensors due to their higher costs of installation and maintenance, its higher sampling rate compared to GPS or mobile phones, and its independence of weather conditions together with its preservation of anonymity, have made it an attractive option. Table 1 shows the most recent representative approaches of DAS for monitoring moving vehicles and pedestrians. Detection, counting, measuring speed and other traffic flow parameters are common objectives of all works. Signal processing is a key challenge for several reasons: the backscattered ray-trace has low SNR and many events are spatially and temporally overlapped, there are many sources of noise present in the sensing scenarios, and the sensing capacity is very much dependent on the characteristic of the materials solidary to the fiber among others. Frequency analysis and denoising strategies are common approaches. Supervised/unsupervised machine learning approximations are being proposed in the last few years. A new approach will be introduced in our algorithm in order to improve the performance of the system.

1.2. Contributions of This Work

In the general technology framework presented, this work describes a distributed acoustic sensing experiment deployed in the vicinity of the School of Techonology and Telecommunication Engineering of the University of Granada, Spain. For several months the mobility activity around the building has been recorded to explore the capacities of DAS to extract urban mobility patterns. The contributions we present and the rest of the work are organized as follows:
  • An implementation of the DAS technology in an urban environment with a wide variety of dynamic mobility patterns is presented. Section 2.1 describes the testbed used.
  • The signal processing needed, the different types of mobile elements sensed and feature extraction possibilities are exposed in Section 2.2Section 2.4, respectively.
  • Example applications derived from the processing of information obtained are shown in Section 3 followed by a reflection about this sensing approach and its possibilities and applications in Section 4.

2. Materials and Methods

The experiment described in this section lasted from the September 2022 until the 20 January 2023. Its main objective has been exploring the technology and obtaining preliminary strategy conclusions applicable to further sensing campaigns.

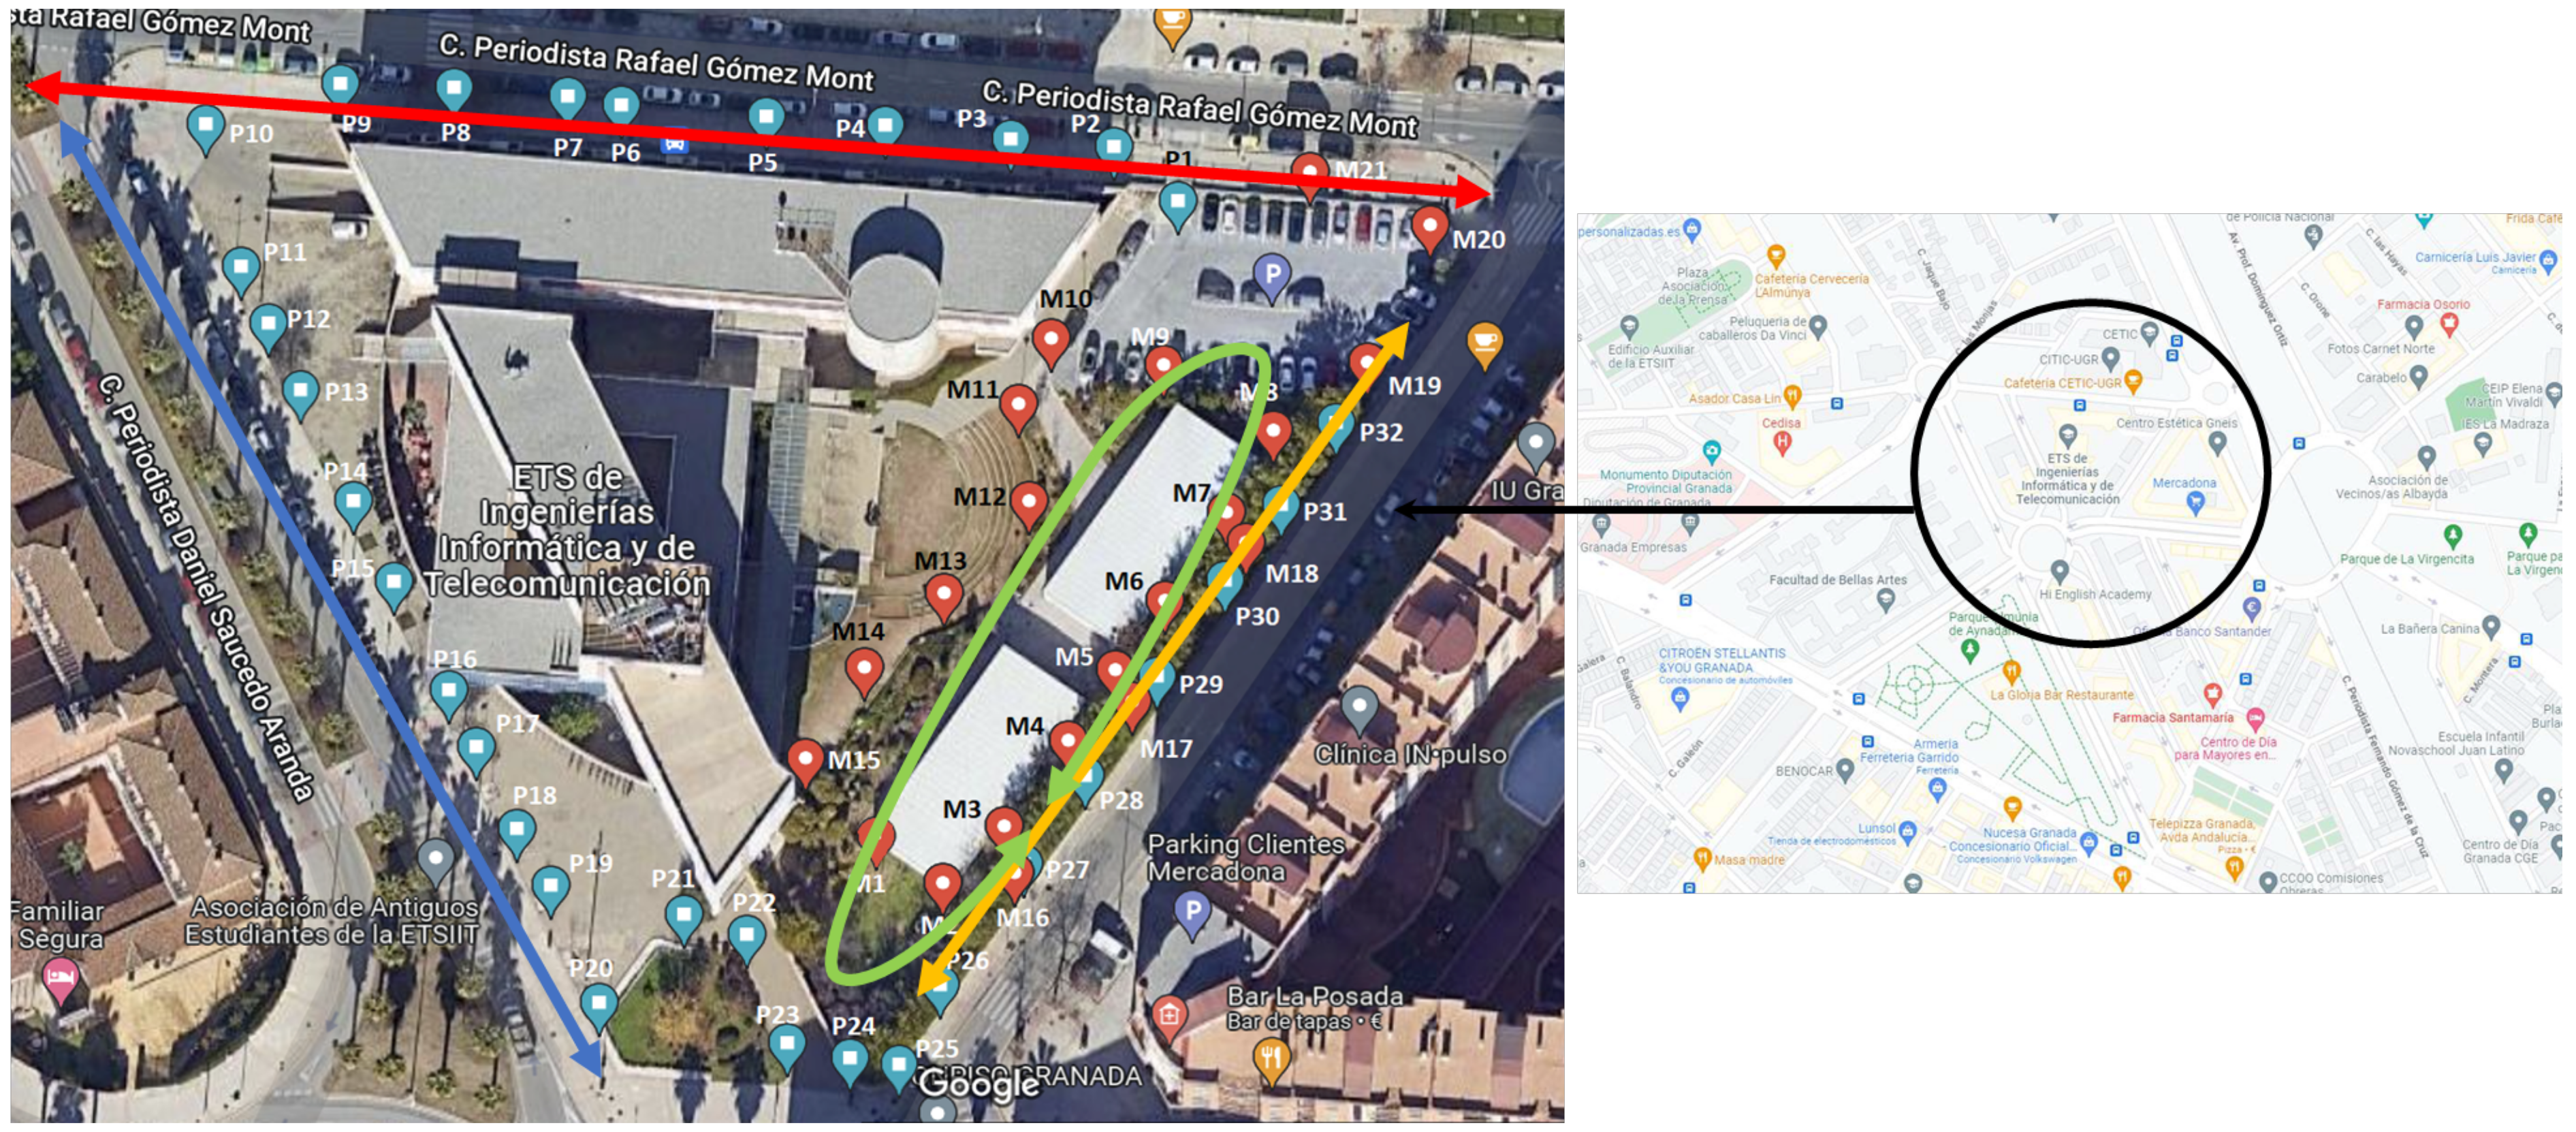
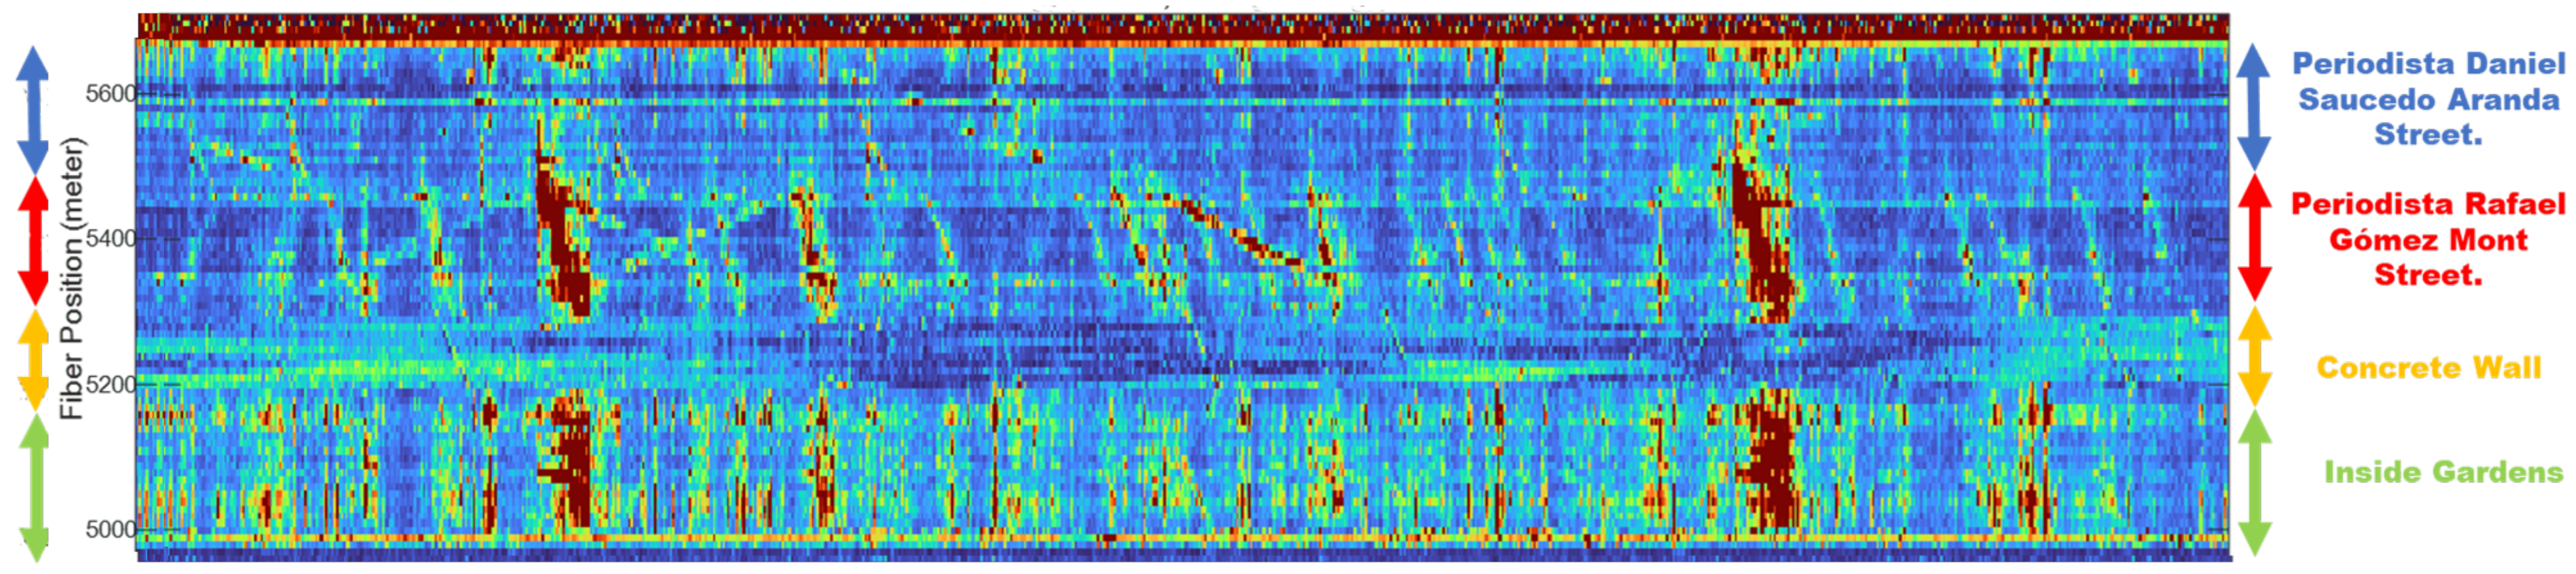
2.1. Testbed Description and Calibration Process

A dark fiber double-loop was buried for the specific sensing objective around the School of Technology and Telecommunication Engineering of the University of Granada, Spain (ETSIIT). A High-Fidelity Distributed Acoustic Sensor based on the CP- Φ OTDR technology ([21]) manufactured by the Spanish company Aragón PhotonicsTM has been used. The sensor has a 1 n strain sensitivity, 6 m minimum spatial resolution (gauge length) and up to 70 km reach. The setup provides strain-type data on near a kilometer of fiber, with 10 m spatial sampling and 250 Hz temporal sampling.
Figure 1 shows the triangle-shaped outer fiber loop comprising 2 streets of 140 and 170 m of length (red and blue double arrows), a concrete wall of 140 m of length (yellow double arrow), and an internal loop of 220 m (green oval arrow) surrounding a garden and two prefabricated lecture rooms. The fiber is always buried except for concrete wall section on which the fiber is uncovered, solidary to the wall for research purposes. Sampling points (P1-P32 and M1-M20) are depicted as a result of a calibration process carried our before monitoring activities. The sensor registers strain variations in the fiber resulting from stimuli like pedestrians, public or private buses, cars, bicycles, etc. These data are pre-processed for noise removal (see Section 2.2). Monitored strain registers can be directly processed or converted into 2D energy maps, commonly known as energy waterfalls, used as input to potential automatic labeling or classification systems.
Figure 2 shows the energy waterfall corresponding to the sensing circuit depicted in Figure 1 for 25 min. The X-axis represents time, while the Y-axis represents the spatial points of the extended double loop of the fiber. The color scale represents the strain’s energy on each spatial point along time. The colored double arrows on the sides of the waterfall indicate the portions of the school perimeter corresponding to each part of the Y-axis in the waterfall. It is notable that the internal loop sensing the inside garden suffers a kind of mechanical superconductivity. High energy appears simultaneously on many spatial points, connected to the existence of a mobile event in other region of the waterfall. This might be due to the existence of a deep concrete platform on top of which the garden and prefabricated lecture rooms were located. This simultaneous energy transmission becomes an specially challenging overlapping noise for sensing points M1-M20. Energy footprints related to events occurring in the inside garden are overlapped with useless mechanical conduction footprints related to activity in other areas. The criterion used to distinguish real mobility activity in the area from mechanical energy superconductivity is that while the first one will present a certain small slope (space will be gone through in a certain time), the former one will occur simultaneously in spatial positions separated from each other (that is, footprints would have somewhat infinite slope). Automatic event detection approaches applied to the registers for counting applications (see Section 3) will face this difficulty with the help of template matching strategies that favor real plausible slope values.

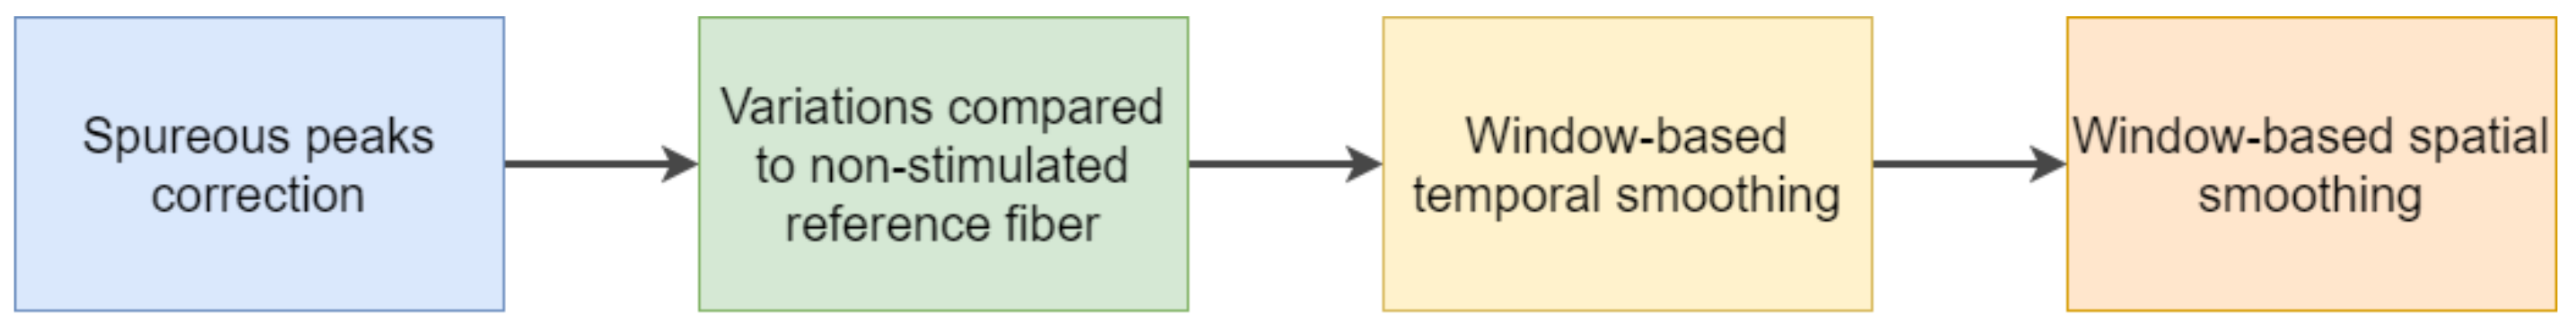
2.2. Signal Processing

DAS technology has several sources of noise due to optical noises and ground-to-fiber transfer effects, dependent on the fiber and characteristics and coupling [47]. In addition, backscattered traces are low power signals. For these reasons, denoising approaches are important to achieve quality SNRs. Added to these challenges, the occurrence of time and space overlapped stimuli is other source of noise that can mask the mobile events searched for. Our work presents a preliminary common denoising strategy devoted to the acquisition of a baseline database of mobility patterns usable in further applications. Approaches based on machine learning like [48] are considered for future implementations. Figure 3 shows the four denoising steps followed proposed by the sensor manufacturer Aragon Photonics: signal thresholding is carried out to compensate for spurious strain peaks based on the study of cumulative values. Then, signal variations are compared to those of a reference portion of the fiber without stimuli. For this purpose, the output of two consecutive median and mean filters applied to the reference strain is subtracted, obtaining the strain variation Δ ε signal used in the analysis. Finally, using an iterative process on both time and space dimension, temporal and spatial discontinuities are smoothed, again making use of a median filter.
Once the denoising step has been completed, a frequency analysis is performed. When a moving event approaches a given sensing point, there are two simultaneous effects taking place [43,46]. First there is a low-frequency (<3 Hz.) quasi-static deformation of the subsurface due its weight pressing down on the road/ground. Such deformation is transferred to the fiber leading to a strain of measurable amplitude, traveling at the speed of the mobile event and more easily localized in time. Secondly, the interaction between the vehicle tires/pedestrian and the road/ground generates high frequency (>3 Hz.) surface waves that travel away from the source point at seismic speeds usable in interferometry analysis. We have performed the reported two bands analysis during the experiments. Its results will be shown in Section 2.3 and Section 2.4.

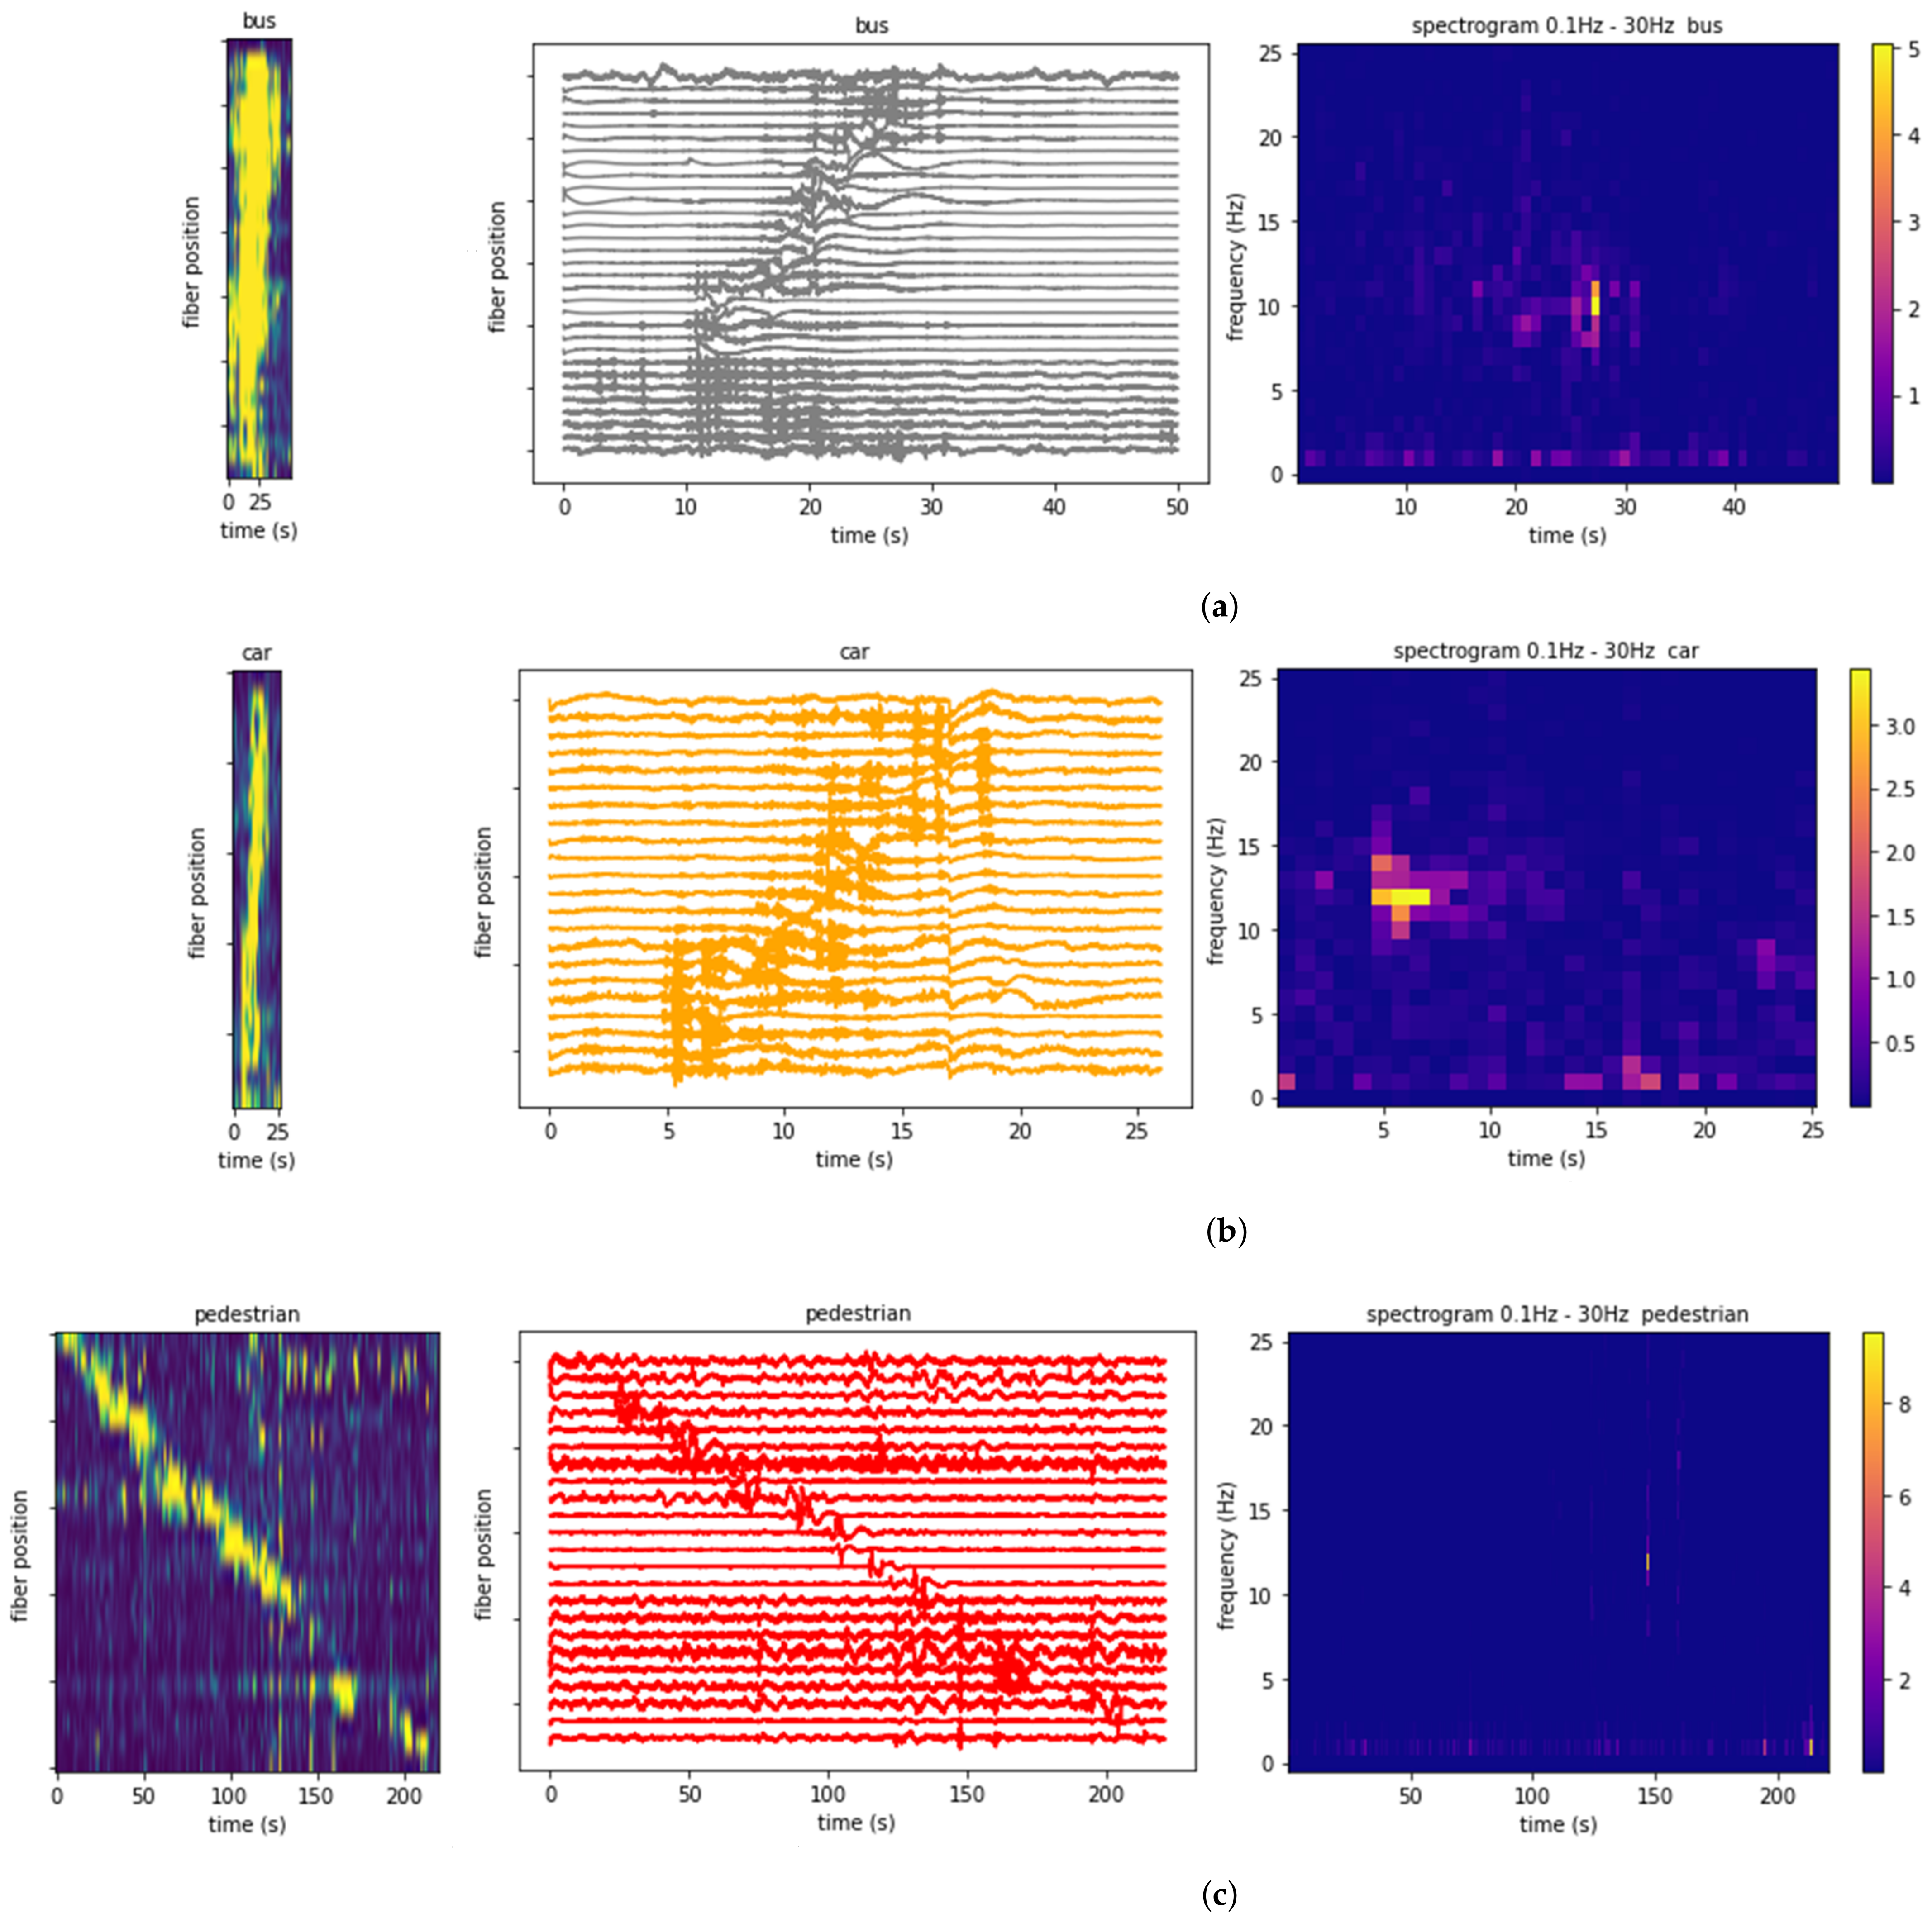
2.3. Types of Events Registered

The School of Technology and Telecommunication Engineering is located in the northwest of the city of Granada, relatively close a communication hub connecting the inner city to a several of highways around it. It is inserted in the middle of a neighborhood with buildings of homes. Public urban bus nº 9 goes through street Periodista Rafael Gómez Montero (see Figure 1). Mobility patterns of workers and students relating to the School have been continuously registered during the experiment together with those of the people living in the area or traveling through it. There are footprints of different types of vehicles interacting among them or with pedestrians often also monitored entering or exiting bus nº 9. Under a first approach, we have distinguished three basic types of events: buses, cars and pedestrians, with the objective of performing automatic detection and counting and creating a master database with labeled examples. Such a baseline database will permit further machine learning probabilistic approaches to find data classifiable as similar or different types of events, mixtures of them, out-of-distribution events, etc. Figure 4 shows three example representations of the footprint registered for a bus (Figure 4a), a car (Figure 4b) and a pedestrian (Figure 4c) moving parallel to the fiber in the testbed deployed. Their waterfalls, corresponding strain variation matrices along time and space and the spatially-averaged frequency spectrograms for the same footprints are depicted. Figures show that buses have higher energy due their higher weight producing higher strain variations. A basic speed calculation based on the slope of the footprint (space divided by time) shows that, as expected, the bus and the car have higher speeds than the pedestrian. Spatial-average power spectral densities suggest different frequency contents for the three types events that are further analyzed.
Figure 5 depicts the distribution of the frequencies with maximum energy for a small database of buses, cars and pedestrians registered in the testbed. The analysis is performed for the whole band of frequencies involved in the activity (from 0.1 Hz to 30 Hz) in the left column subfigure, for the quasi-static band of activity (band 0.1–5 Hz) in the central subfigure, and the high-frequency band (5 to 20 Hz) originated by the surface waves. Buses show a higher content of frequencies around 10 Hz that are not that present in cars nor pedestrians which generate very little surface waves. The low frequency band (center subfigure) often used because its simpler analysis and time location, might not be the optimal band when distinguishing different types of events. Analyzing the whole band provides more discriminative differences between events at the price of introducing some noise.

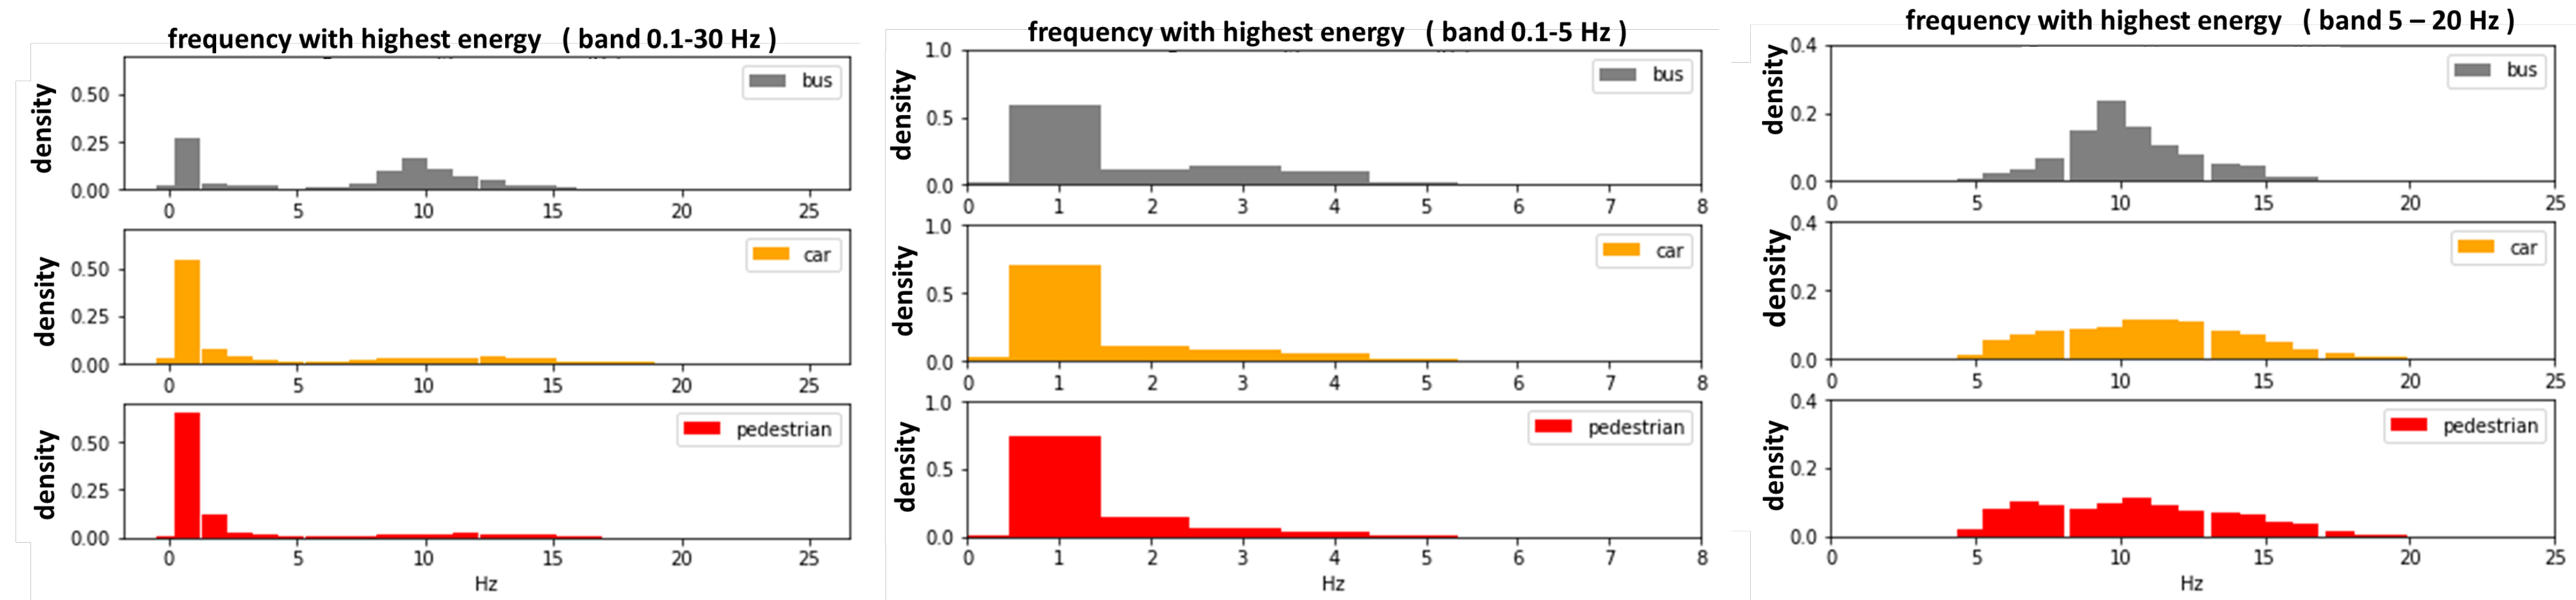
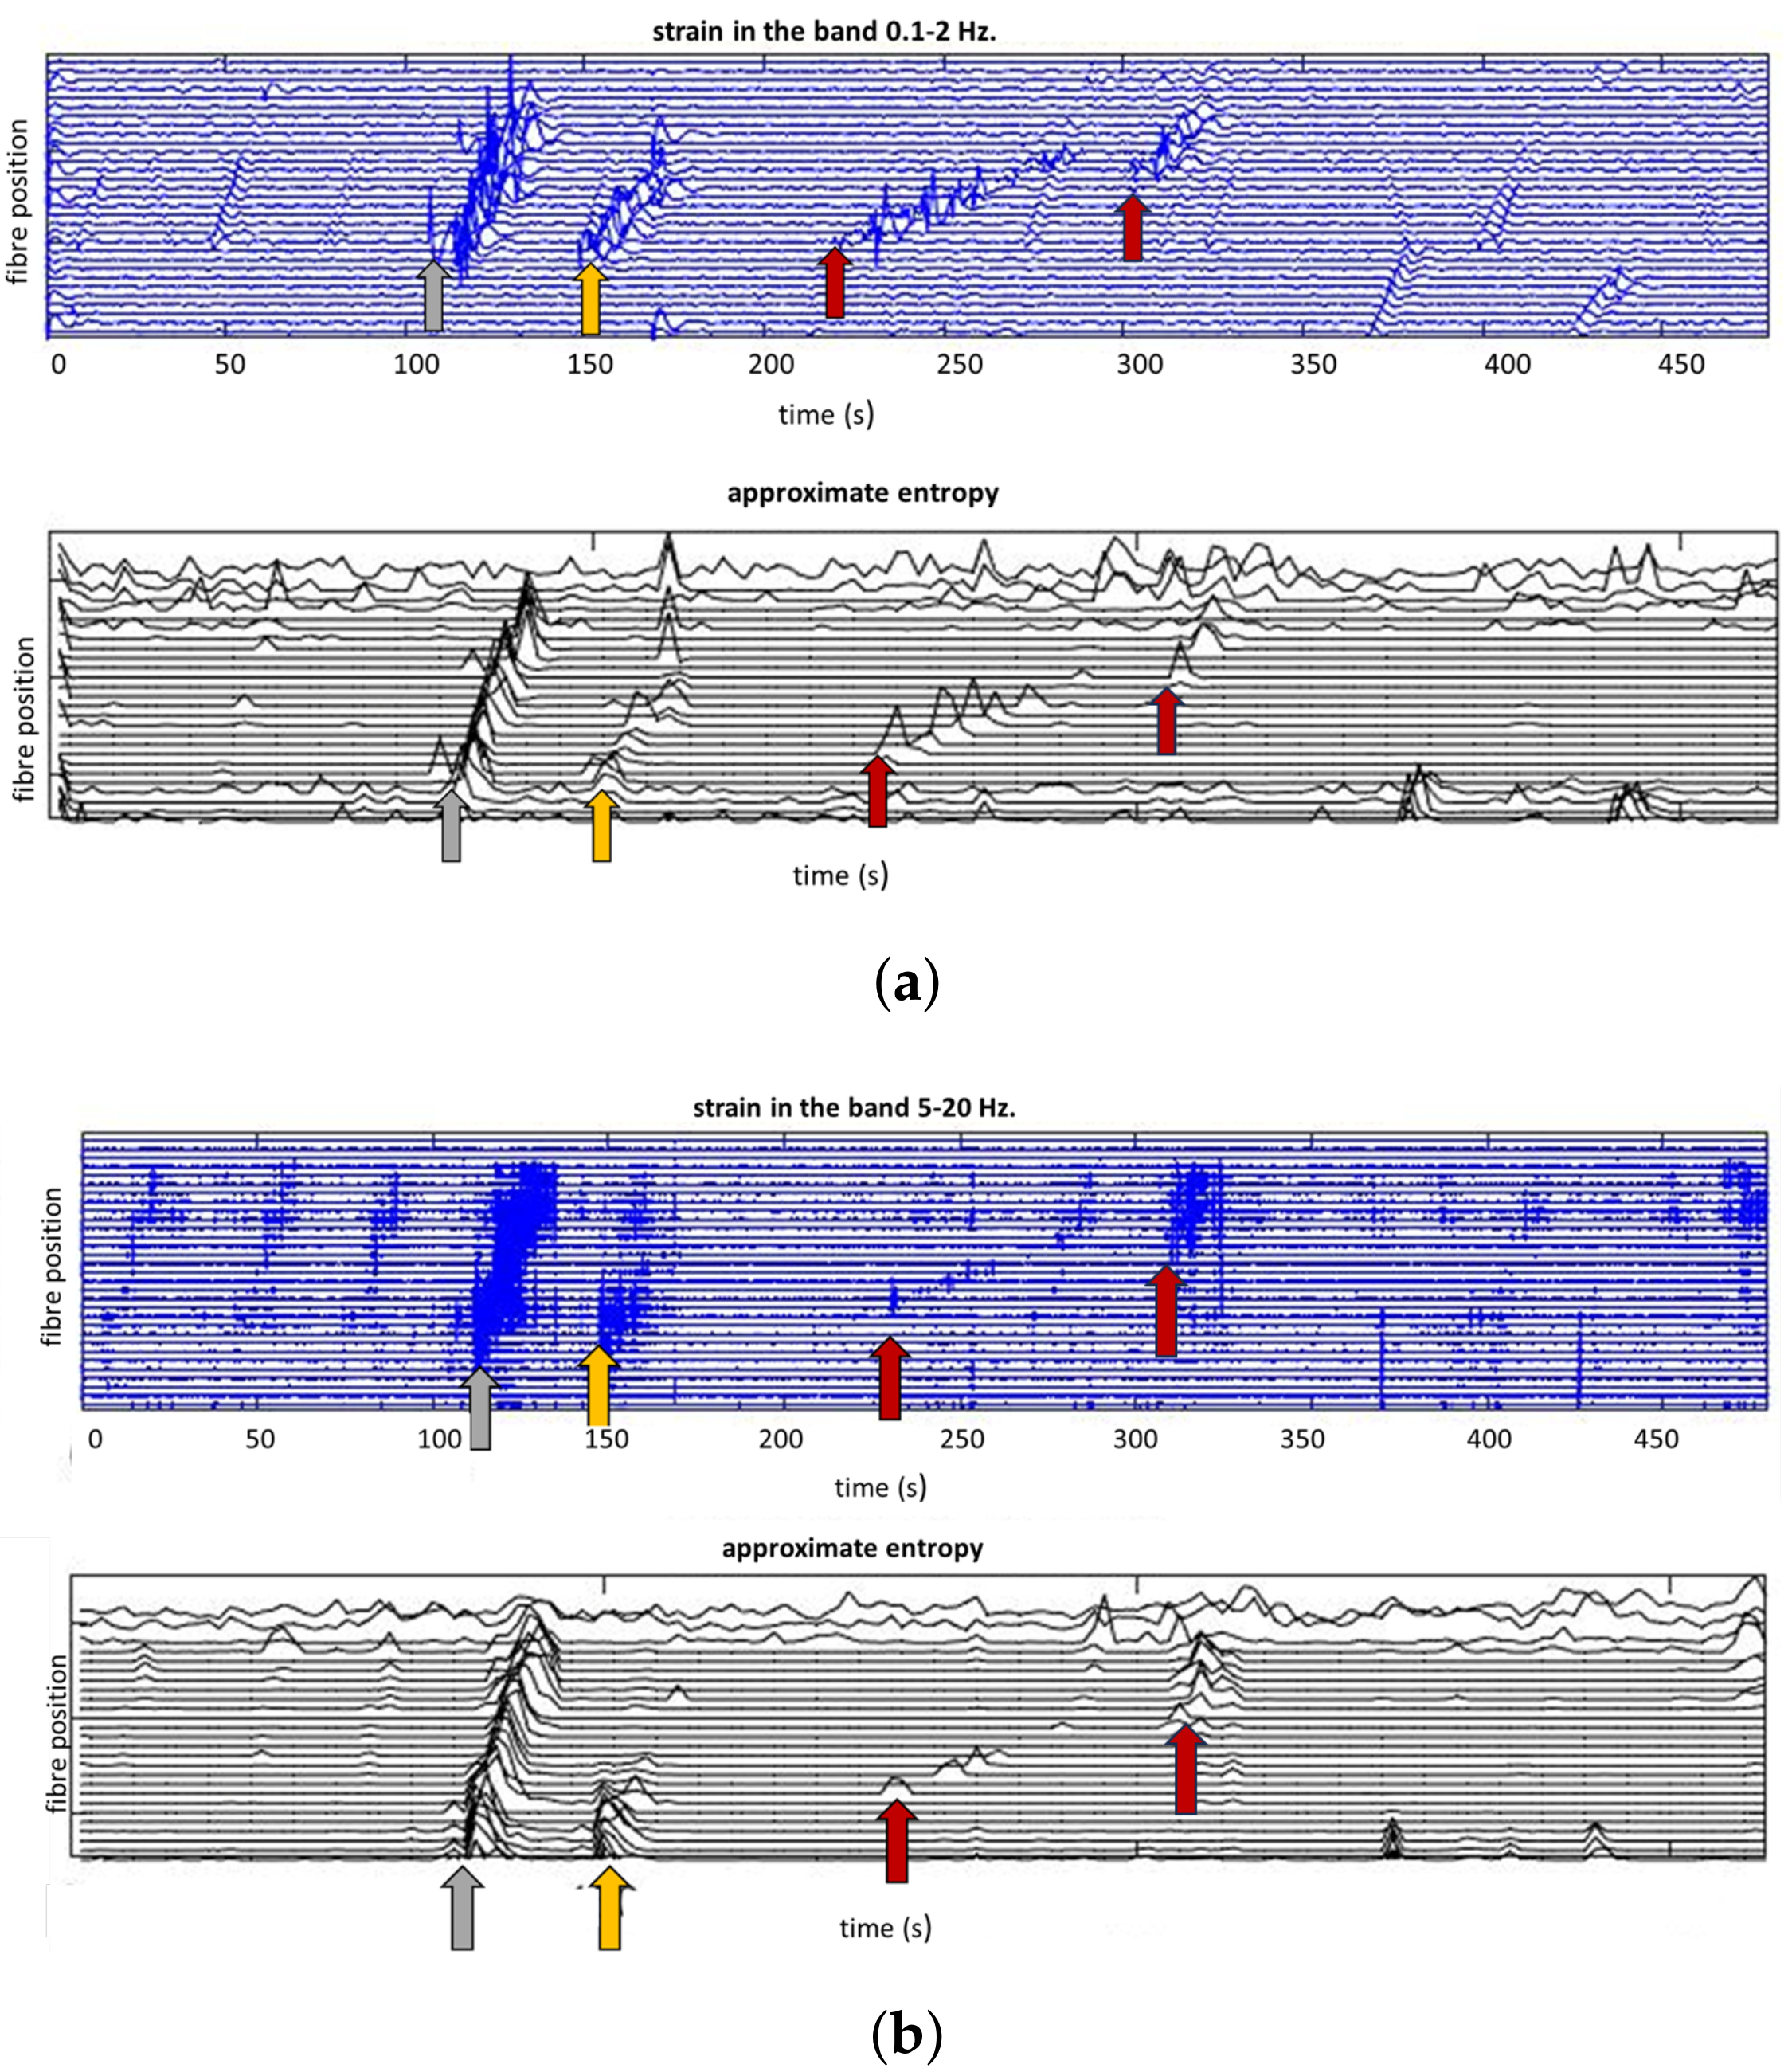
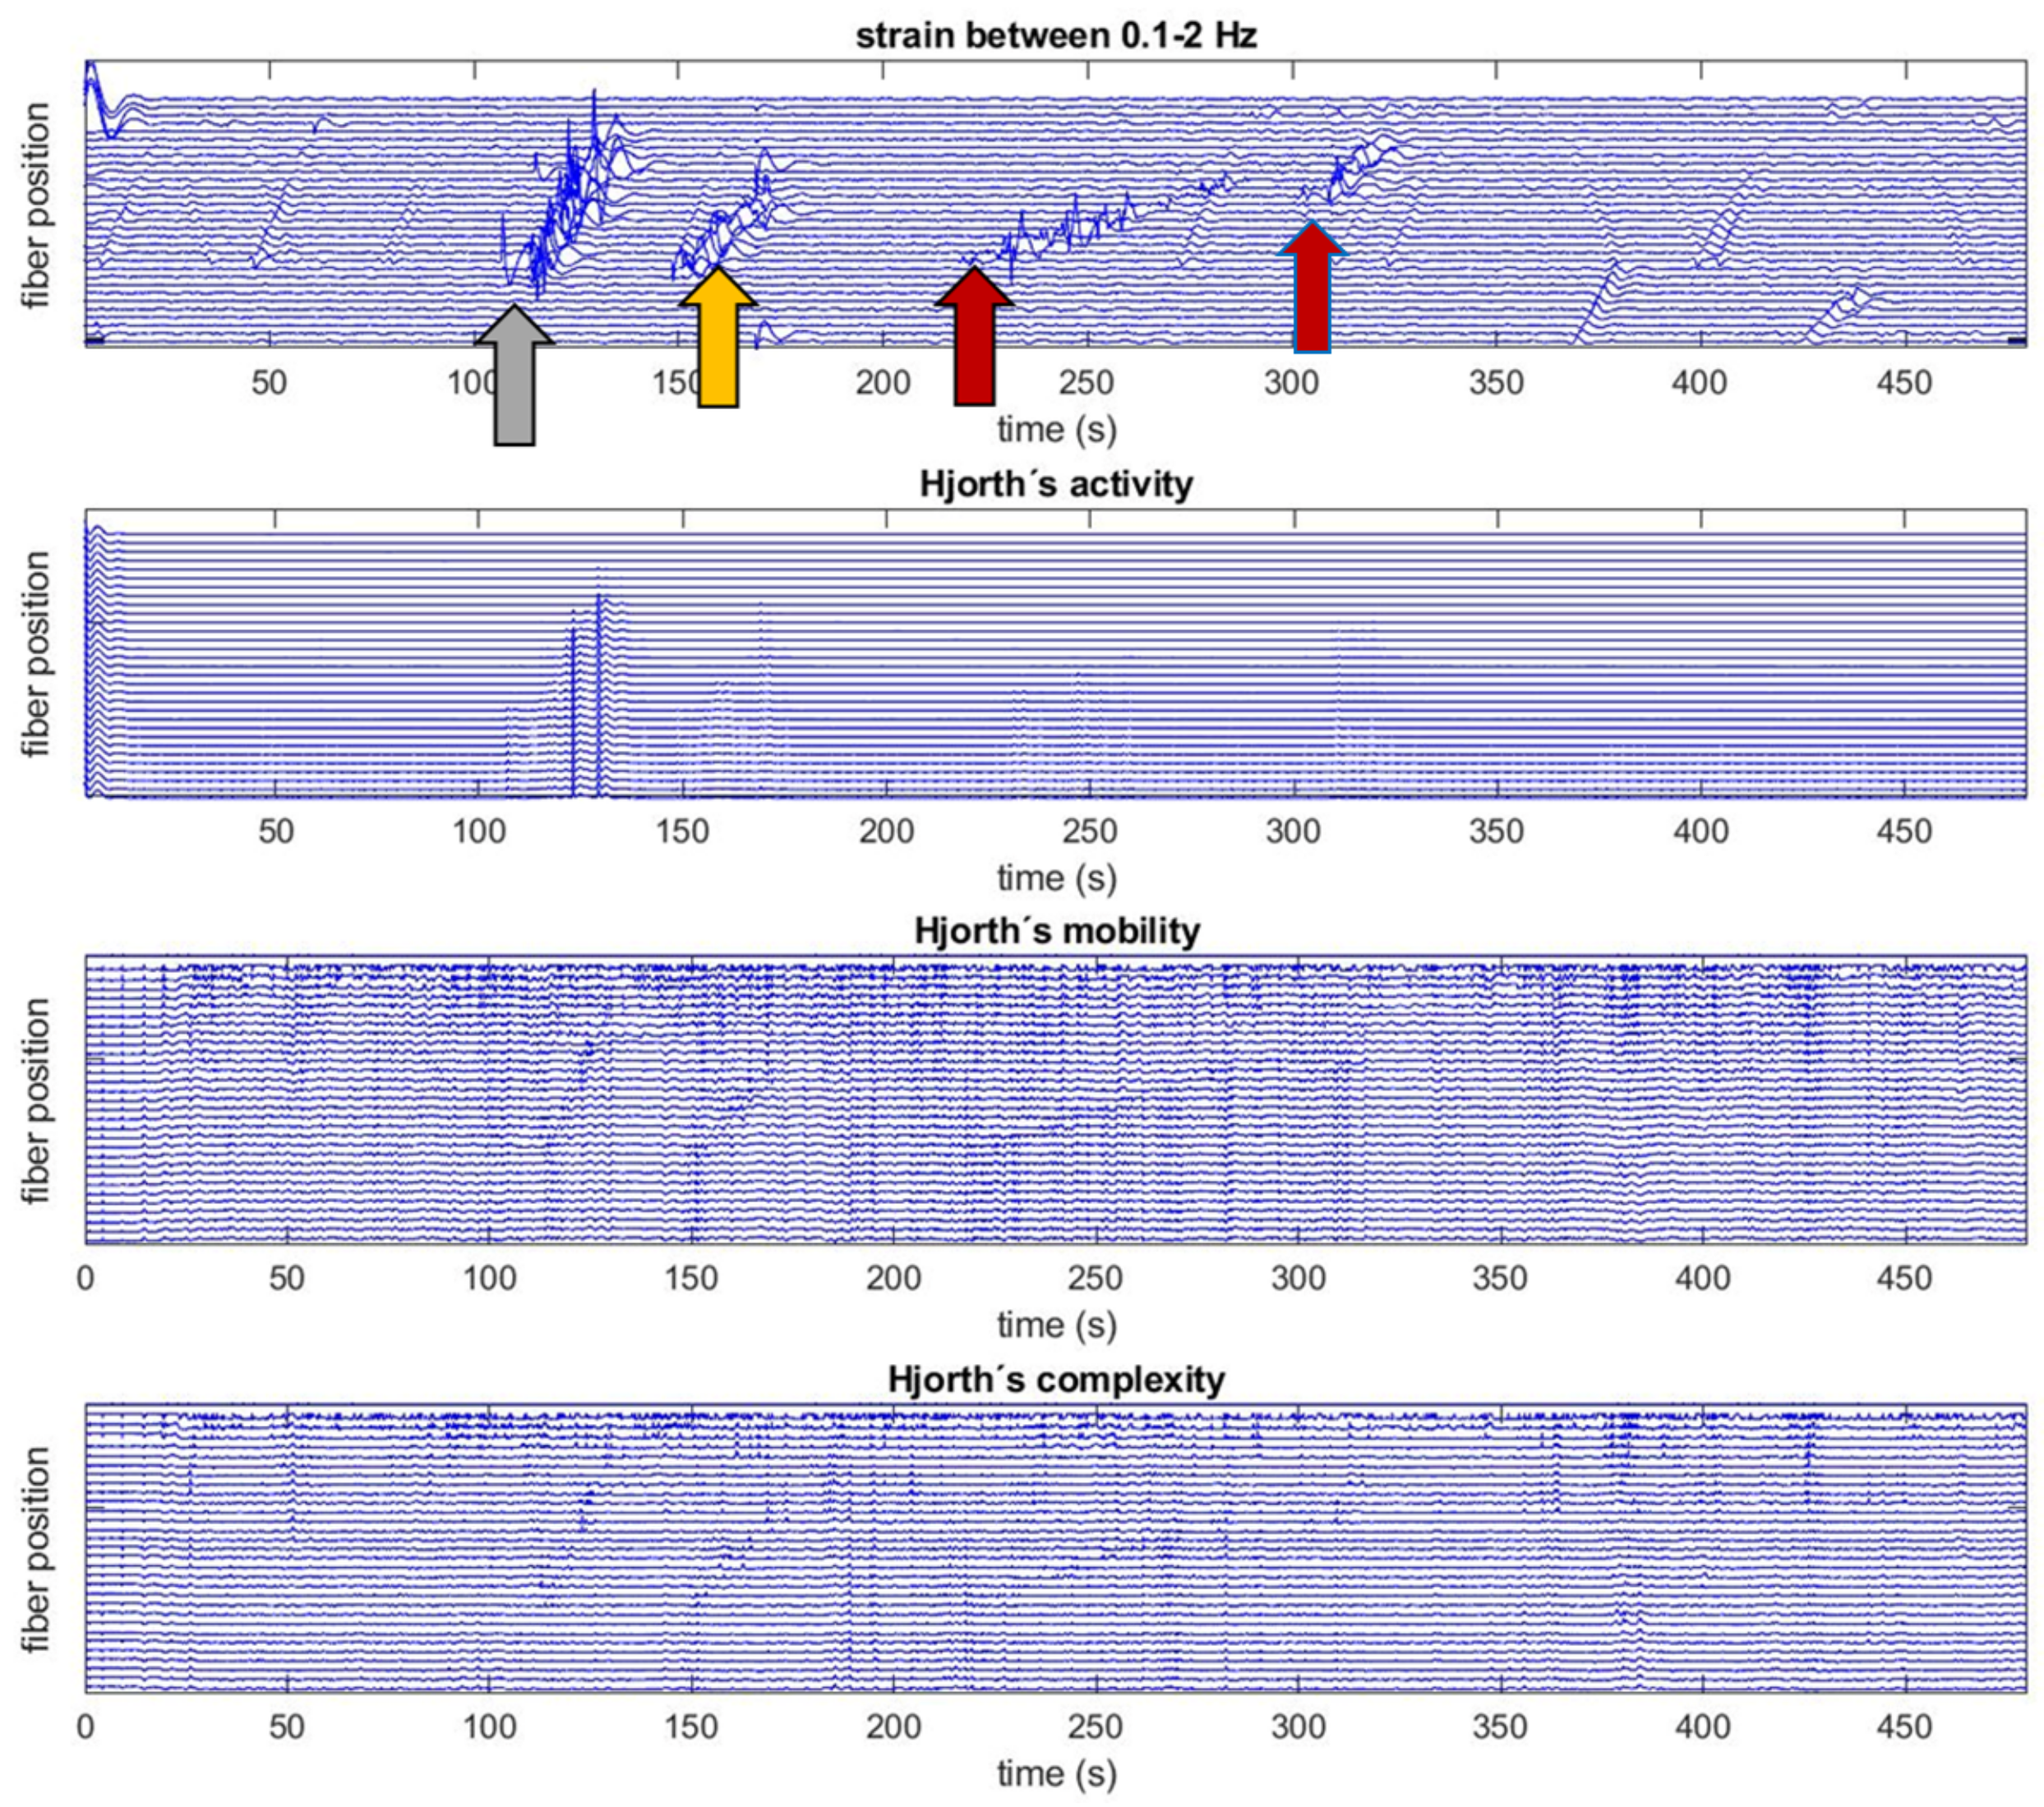
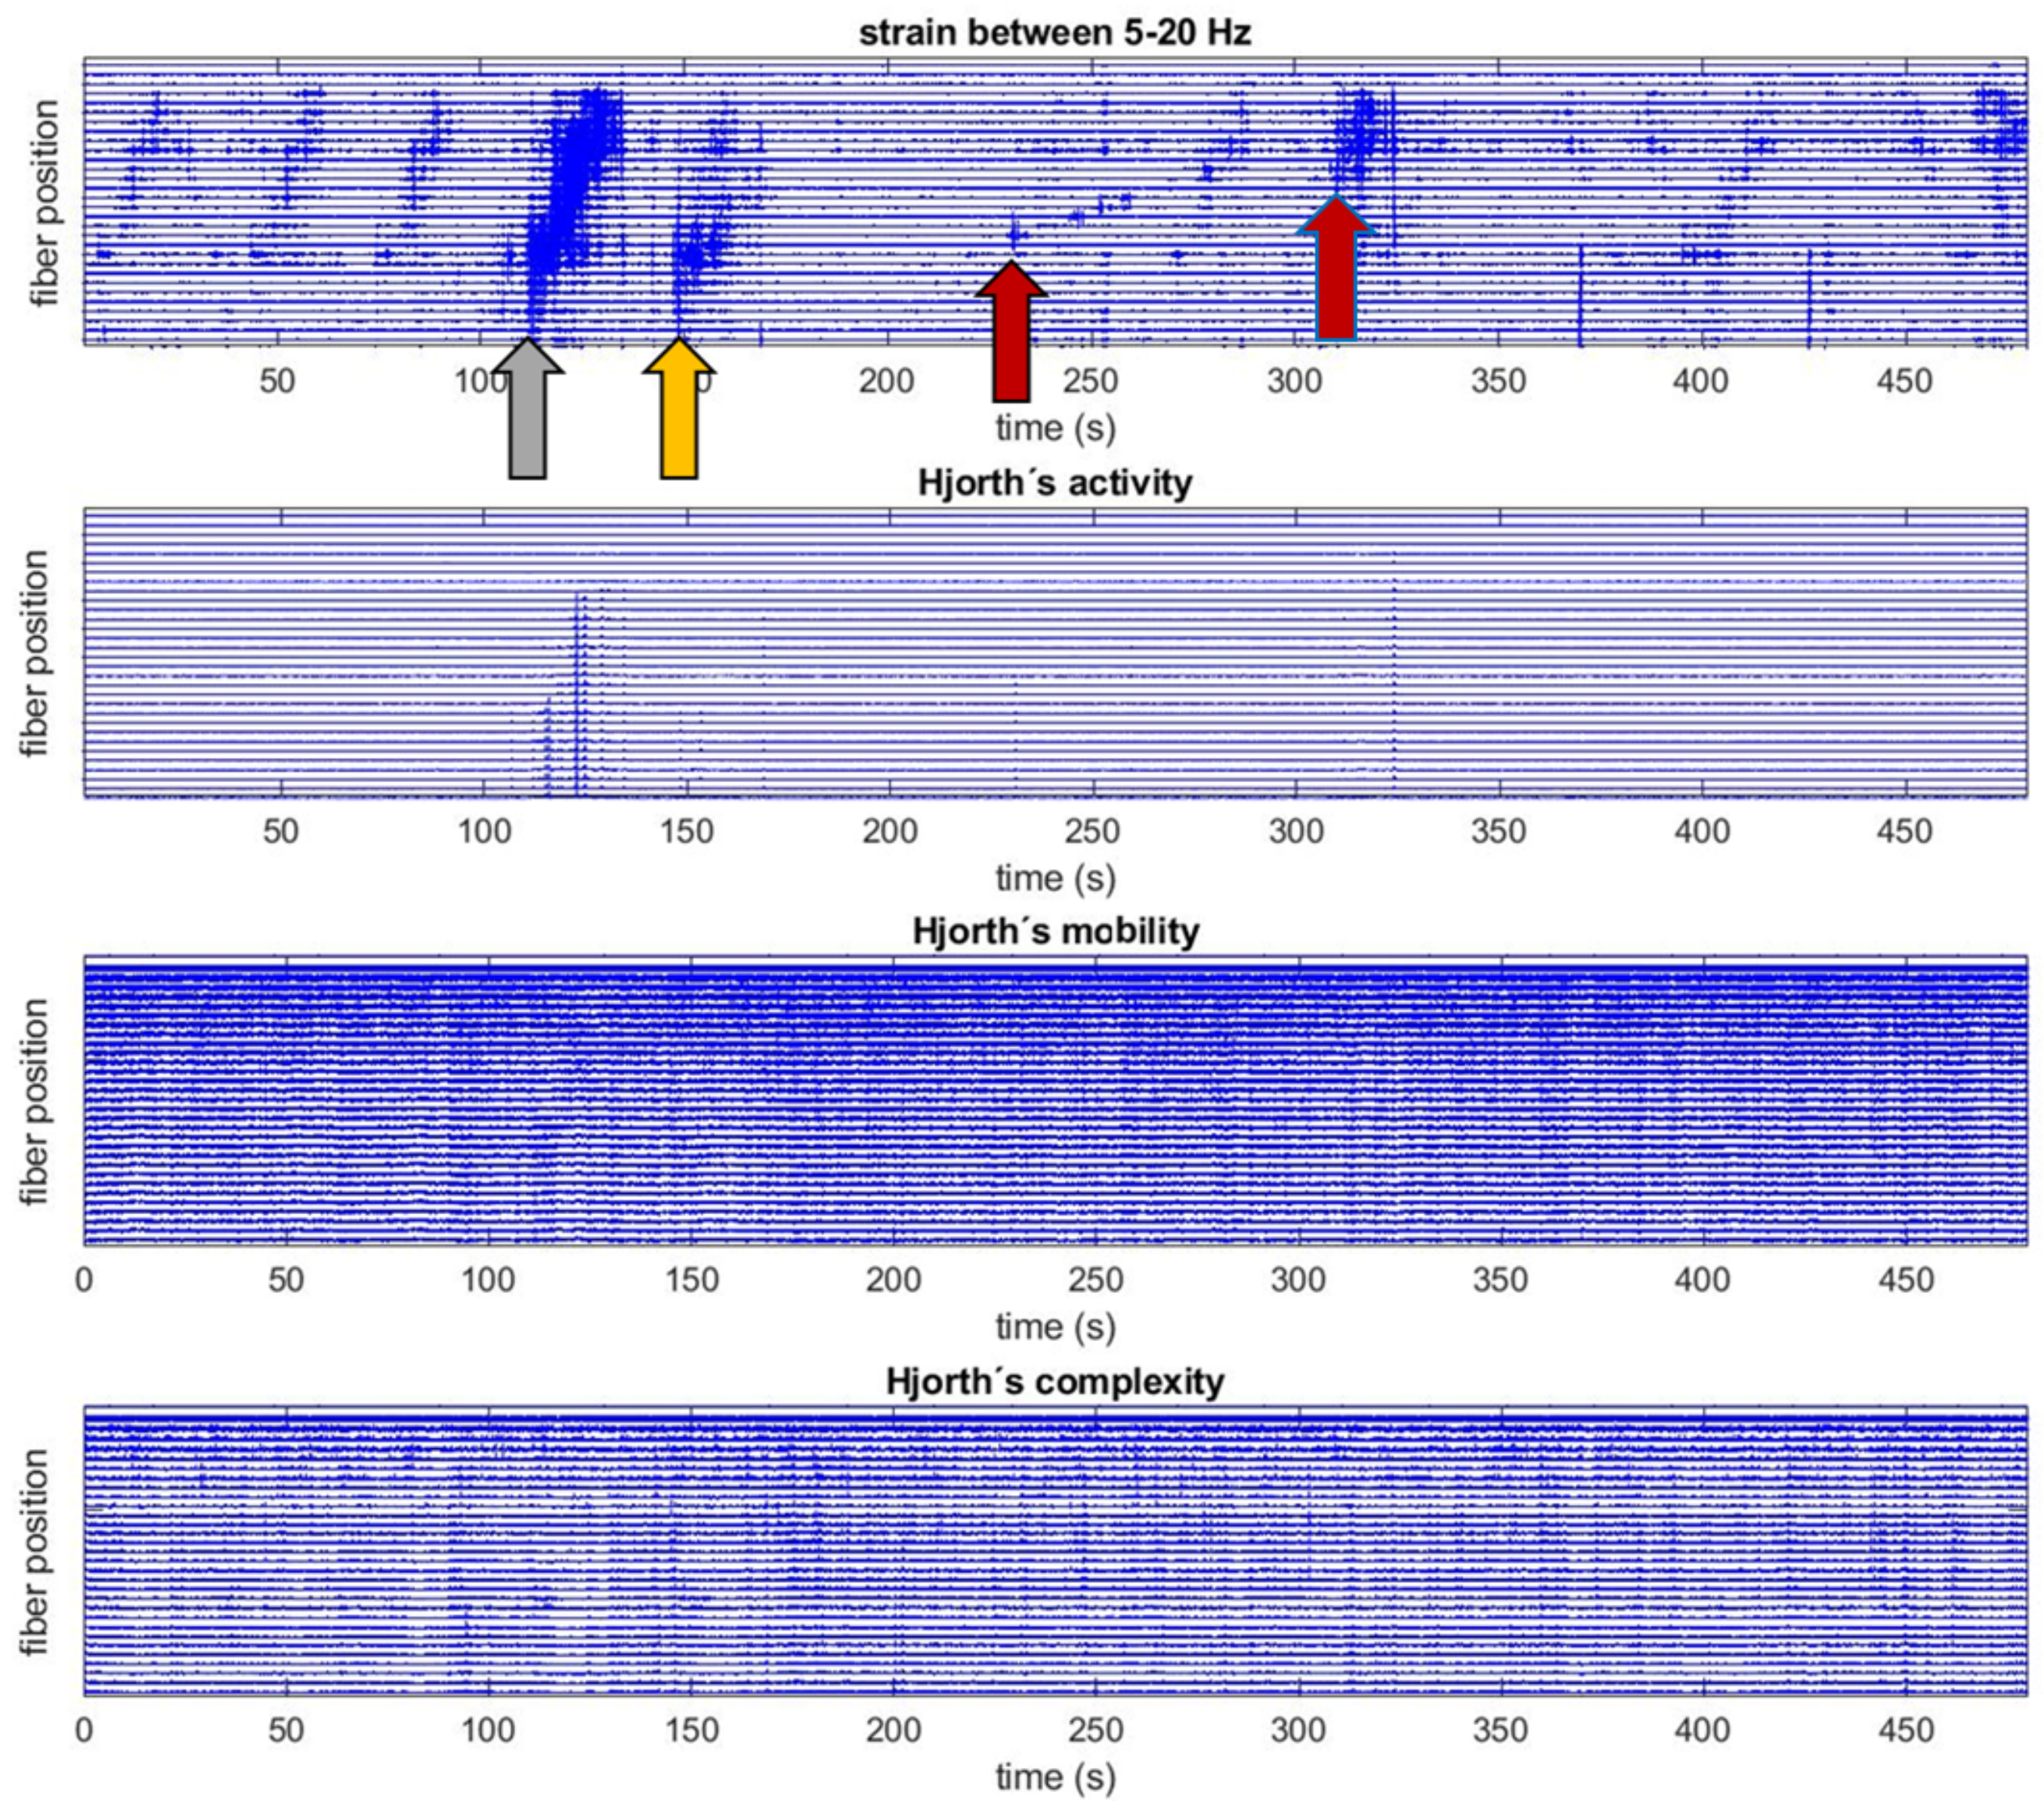
2.4. Characterization of the Events

There are several approximations to study the strain-variation time series registered. A possible analysis might include feature extraction, combination and measurement of their discriminative potential, and their contribution to the interpretability of the data. Otherwise, in the framework of Information Theory, many approaches focus on the complexity of the time series searching for information contents from a mathematical viewpoint without semantic analysis. In this framework, complexity is a magnitude widely used to quantify the intricacy of a time series allowing choice of the forecasting methods to be applied [49]. The higher the complexity, the more information provided by the time series. That is, complexity is low in regular time series and grows in chaotic ones. There are several methods to measure complexity, Shannon Entropy [50] being a very commonly used one. In recent literature, several other measures have been developed to quantify the changes in complexity for biological signals [51] like electroencephalograms (EEG) [52], electrocardiograms (ECG) [53,54] or magnetoencephalograms (MEG) [55]. Biological time series of a healthy person are more regular than those of a diseased person that become more complex. The same approximation is used in the fault diagnosis in machinery [56] or in financial time series analysis [57].
In the context of our proposal and due the nature of the signals, events generating strain variations in the fiber’s backscattered light (cars, buses or pedestrians passing by) will produce changes in the complexity measures. Based on this hypothesis, approximate entropy [58] (see Figure 6) and Hjorth parameters [59] (see Figure 7 and Figure 8) are analyzed by searching for their potential for mobile events discrimination and characterization. The well-known Hjorth parameters of activity, mobility and complexity, transversely used in all mentioned disciplines, are added to amplify the statistical information in the analysis.
Approximate entropy is calculated in the time domain. It measures the matches of a pattern along the signal, calculating then the logarithmic frequency of repeatable patterns. Time series containing many repetitive patterns have relatively small approximate entropy values (the time series is more regular), while more chaotic or complex processes show higher values. Hjorth parameters, although calculated in the time domain, also provide meaning in the frequency domain. Activity gives a measure of the squared standard deviation of the amplitude of the signal, being high if higher frequencies are present; mobility is obtained as the square root of variance of the first derivative of the signal divided by its variance. Complexity, defined as the ratio between the mobility of the first derivative and the mobility of the signal, indicates how the shape of a signal is similar to a pure sine wave providing an estimation of its bandwidth. Adapting window sizes to frequency bands and possible range of events duration, complexity measures have been analyzed for two frequency bands (0.1–2 Hz and 5–20 Hz) following the hypothesis of the different activity and events discriminability pointed out in Section 2.2. The result of the analysis is shown for the same strain variation segment in Figure 6, Figure 7 and Figure 8. Several events detected have been indicated with different color arrows, with gray, orange and red indicating the corresponding presence of a bus, a car or a pedestrian.
Results show the interesting potential of approximate entropy and Hjorth activity to highlight the presence of a mobile event, removing noise in the strain variation matrices to perform more accurate event detection. Exact event timing, important for applications like event’s velocity calculation, can be improved through these parameters. Hjorth’s mobility and complexity show a certain presence especially in the band 0.1–2 Hz that is under analysis for a better usage.

3. Results

This section points out potential applications of the DAS monitoring to extract relevant information for data-driven mobility models. Its objective is to show the flavors of what can be accomplished with a deeper analysis of the data obtained. Data monitored in the period from December 2022 to January 2023 have been analyzed and used as example.

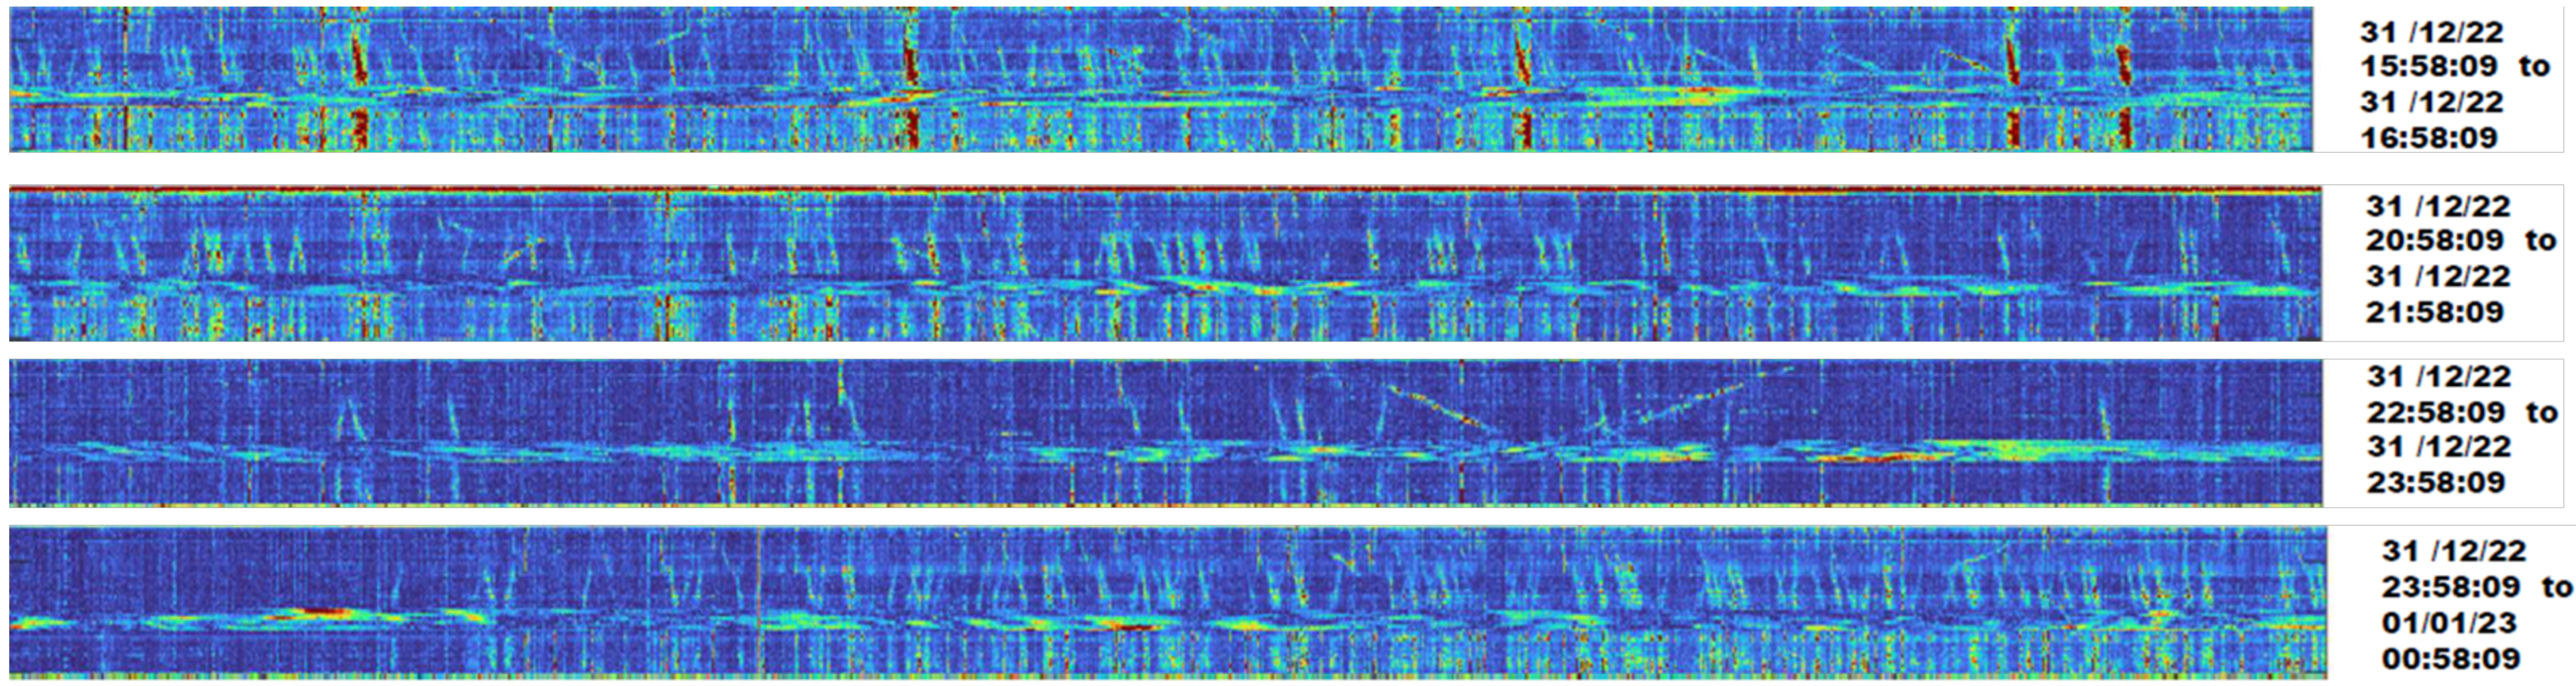
3.1. Example of Mobility Changes on New Year’s Eve

Continuous monitoring was carried during the evening and night of the 31st of December on New Years eve. Figure A1 in Appendix A shows four example waterfalls of one hour of duration at different times (31 December at 4:00 pm, 9:00 pm and 11:00 pm, and 1 January at 00:00 am). It can be seen that different traffic densities are observed at different times of the day. The last two subfigures show anthropologically interesting information about human behaviors on New Year’s Eve. Urban traffic is especially low from the 31 December at 11:00 pm until approximately 1 January at 00:30. Then, many cars start moving during the whole night. This information is highly compatible with the Spanish tradition of welcoming the new year inside homes with family or friends (eating 12 grapes together at exactly 1 January at 00:00) and going out to celebrate afterwards. Figure 9 provides the automatic counting of buses, cars and pedestrians during the mentioned 24 h. The counting has been performed using an image processing multiple template-matching approach over the waterfall images [60]. It is remarkable that the number of cars in the one hour gap starting at 00:58 am is higher than any other time of the day.

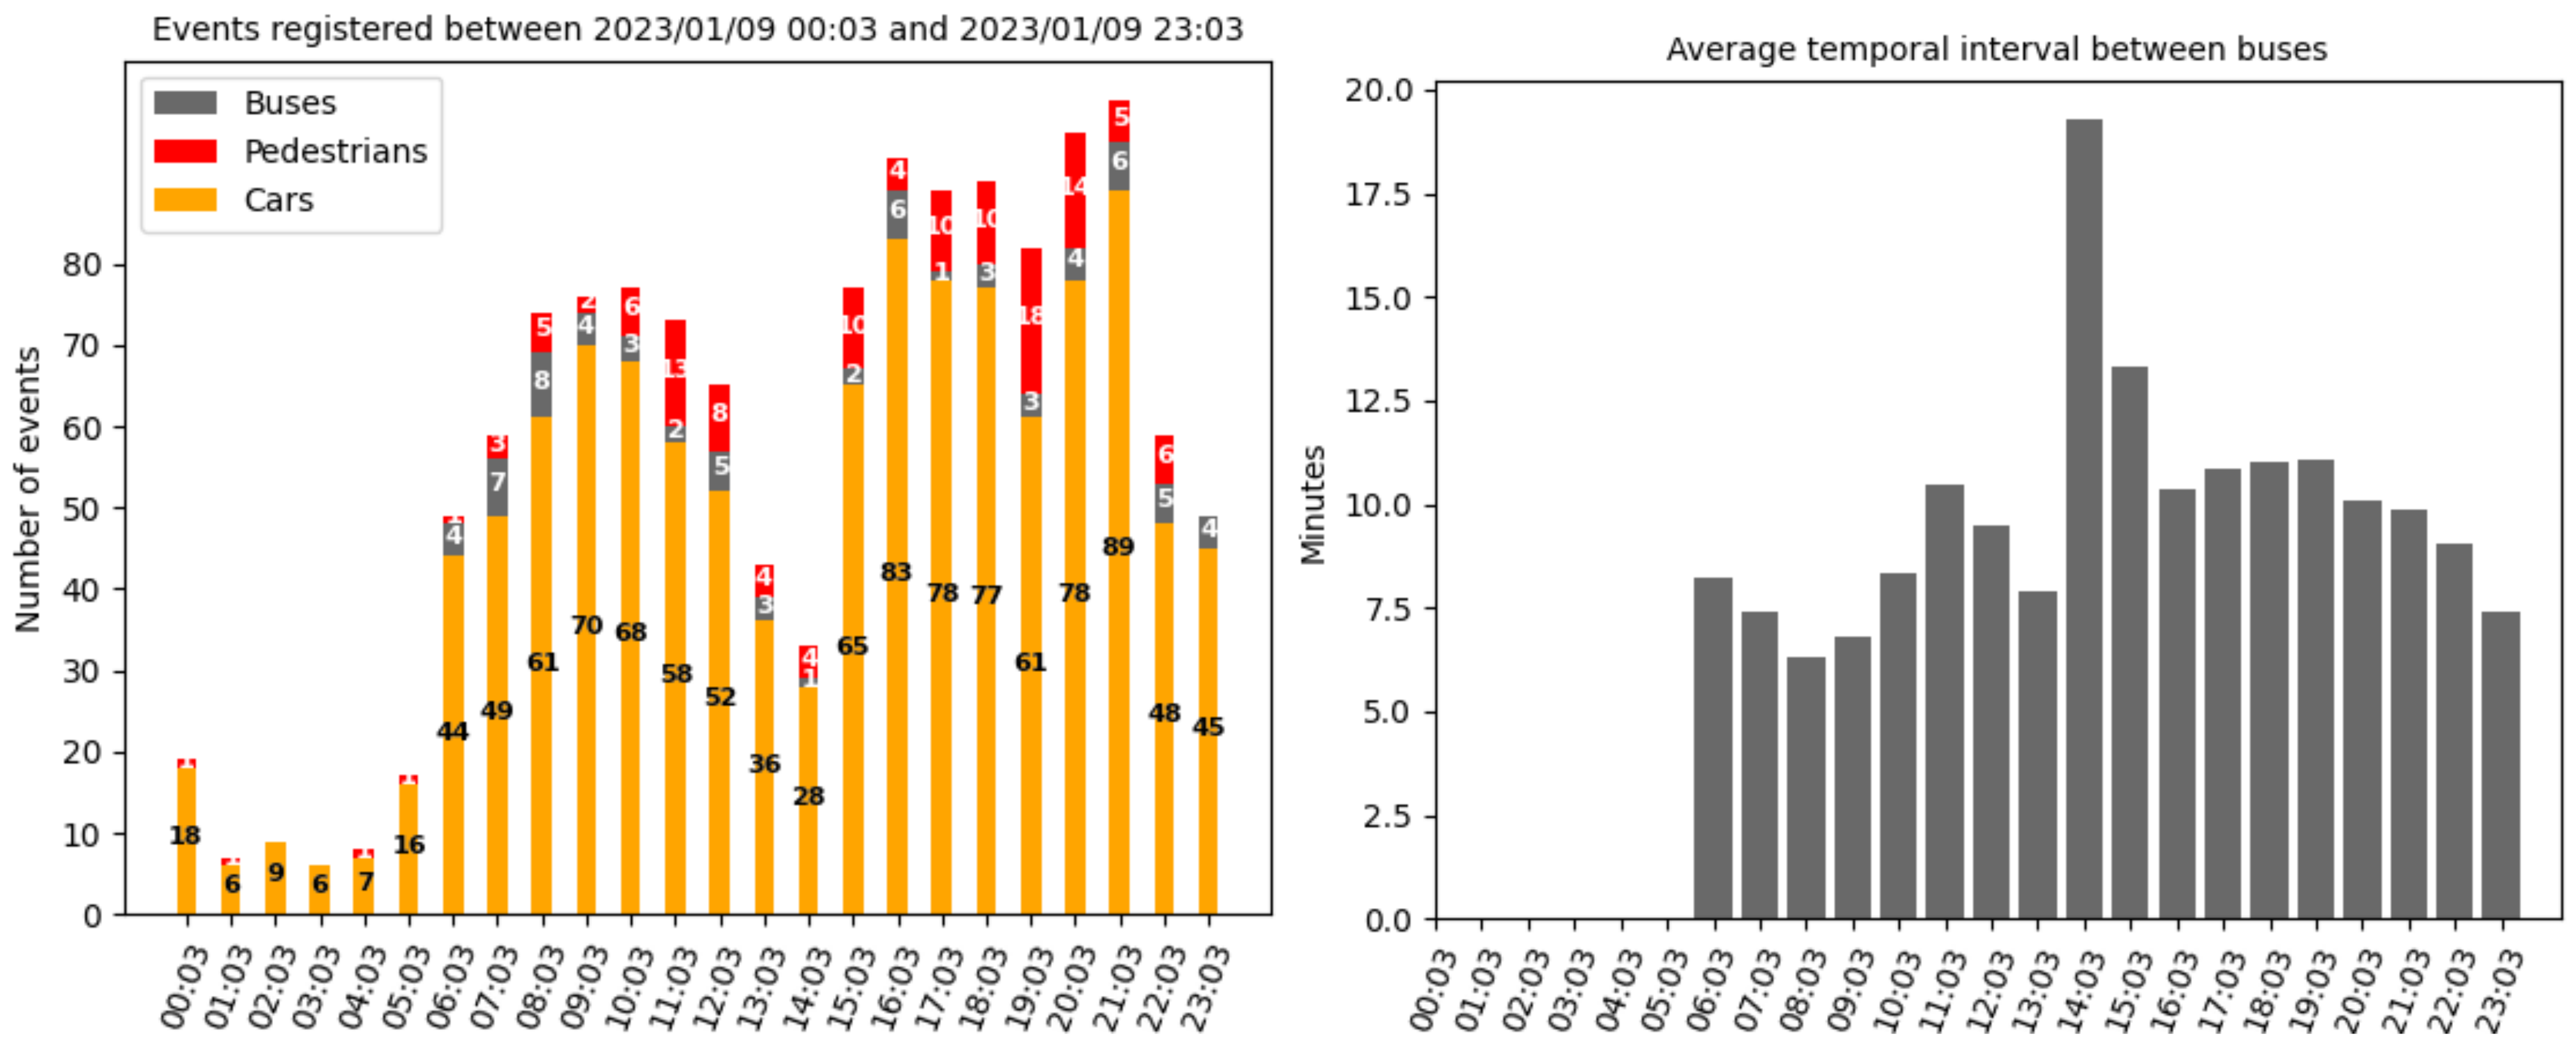
3.2. Example of Mobility during a Work Day

Figure 10 provides the same automatic counting of mobile events performed during a work day (Figure 10, left). Differences compared to the patterns found in New Year’s Eve (Section 3.1) are very clear. Traffic peaks are detected from 9:03 to 10:03 am and in the afternoon/evening when the density of pedestrians is also higher. It is remarkable the lower amount of buses and cars in the interval 14:00–15:00. The right subfigure depicts the time interval between buses registered during the same day. Discarding the sporadic presence of private buses that travel through Rafael Gomez Montero street, the figure mainly measures the frequency of public bus nº 9 that commutes this neighborhood to the center of Granada. The approximately constant rhythm of the bus is notable, with slightly higher intervals between buses in the hours with higher traffic density. A deeper analysis could be carried out, correlating these results with the traffic jam hours in other parts of the city. Figure 11 shows a preliminary speed analysis for the three types of events during the monitoring period. Average speeds with their standard deviations are plotted together with the number of events averaged. Speeds were calculated based on the waterfall event detection approach. Further improvements for more exact calculations based on characterization parameters described in Section 2.4 are under analysis.

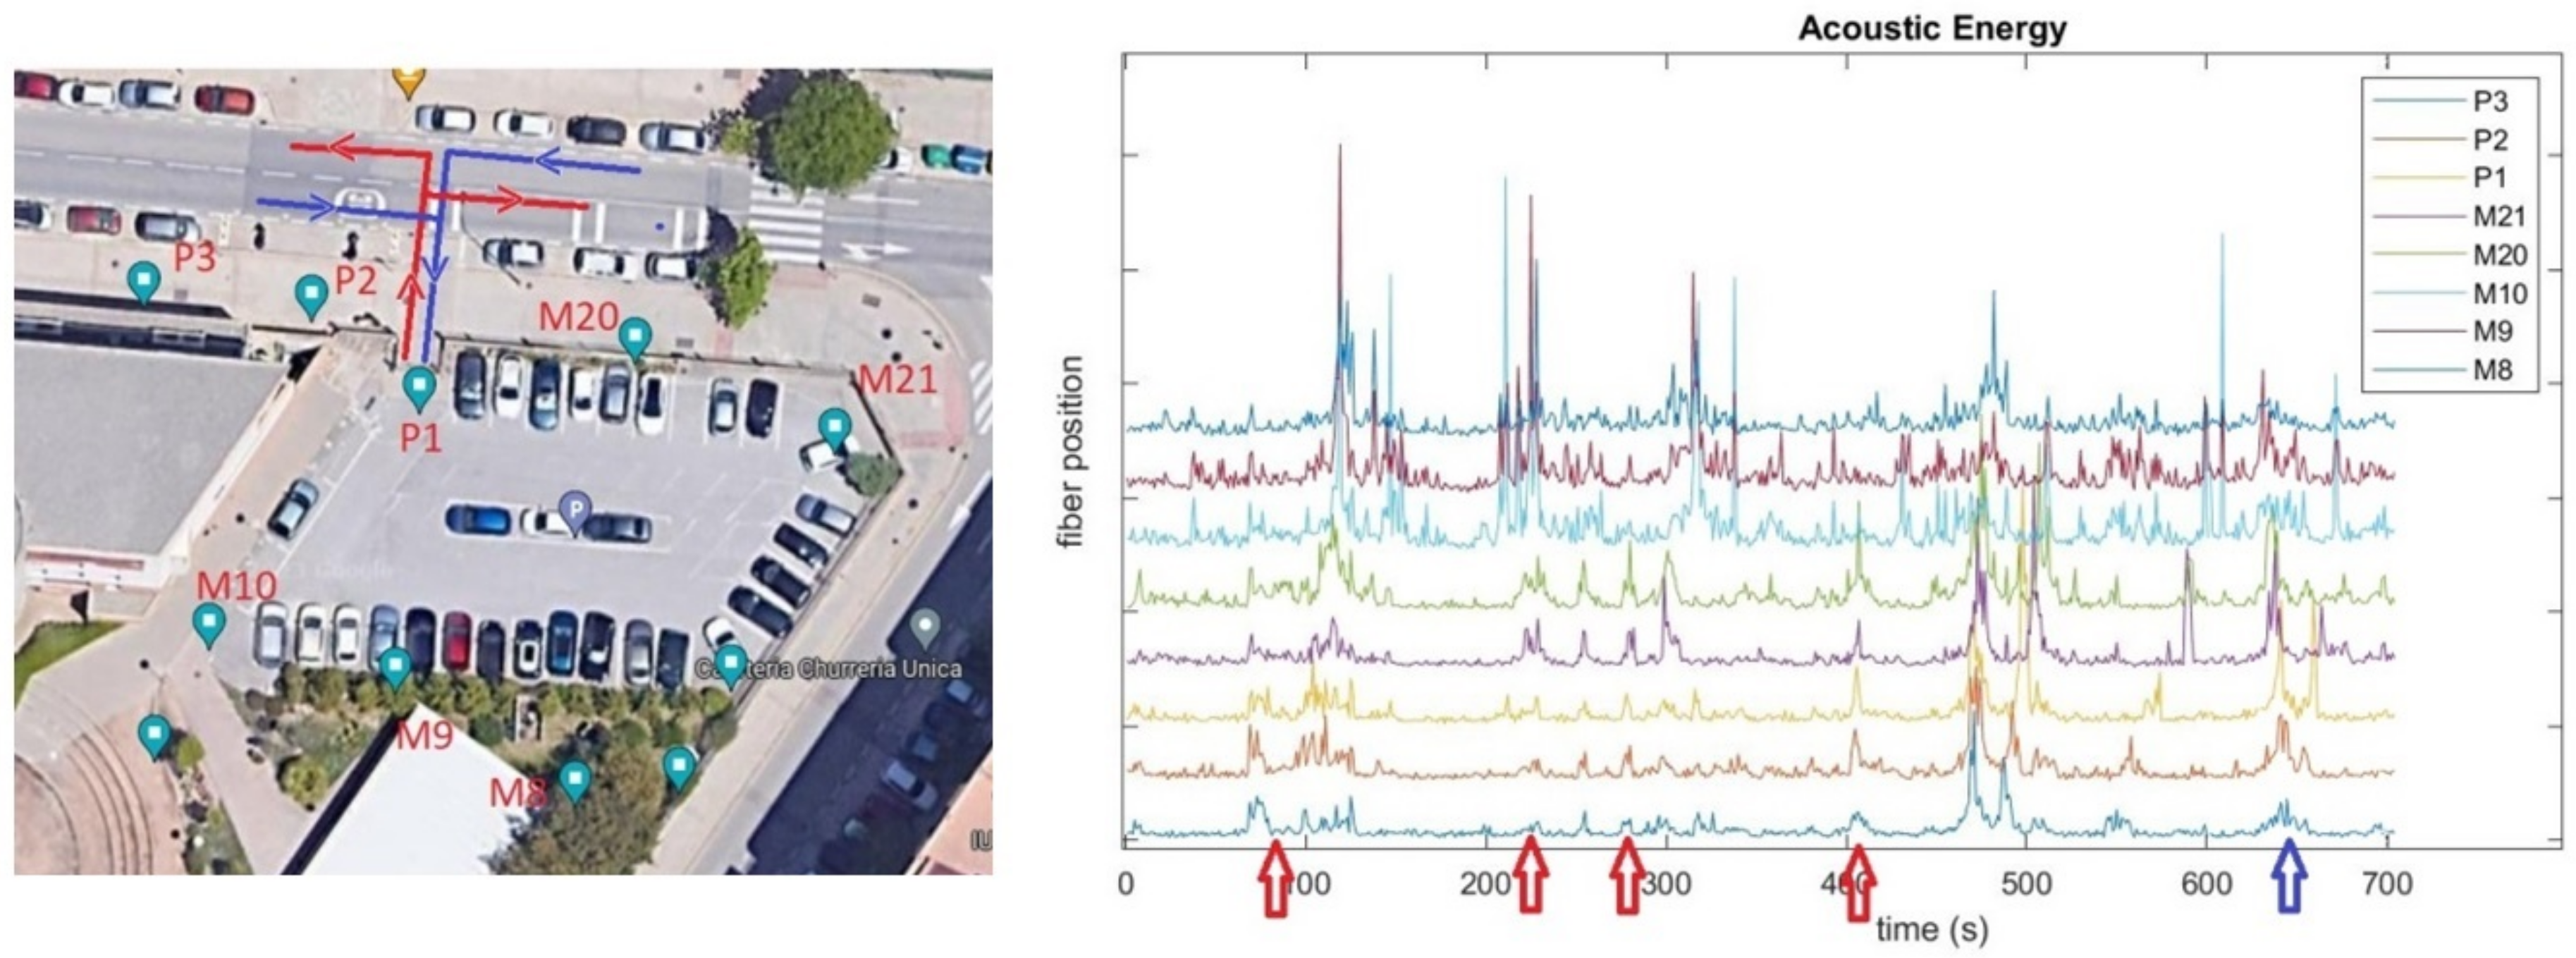
3.3. Monitoring Access to the Schools’s Surface Parking

The left-side subfigure in Figure 12 shows the amplified detail of the School of Engineering surface parking depicted in Figure 1. The right-side subfigure shows the strain variation registered at the fiber sensing positions P3, P2, P1, M20, M21, M19, M9 and M8, monitoring the parking and its entrance. The global activation of all sensing points at approximately 460 seconds is due to the presence of an urban bus passing by. Its high weight produces mechanical vibrations monitored by all the sensors under analysis. Entering the parking can only be occur following one of the two routes painted on blue in the left side of Figure 12, and vehicles leaving the parking may only follow the directions marked in red. Strain variations due to the presence of entering or exiting vehicles will be activated at fiber positions M10, M9, and M8 if the vehicle enters the parking. If the vehicle leaves the parking towards the left, fiber positions P1, P2 and P3 will be sequentially activated. That is what can be seen in the left-side subfigure during the seconds 100, 200 and 300, marked with red arrows.
Another vehicle leaves the parking around second 400 (see red arrow marked), being fiber positions P1, P2 and P3 inactive. It therefore can be concluded that the vehicle moves towards the right.
Finally, a vehicle entering the parking can be detected at second 650 (marked by a blue arrow). Positions P3, P2, and P1 are sequentially activated, and then positions inside the car park, following the sequence M10, M9, and M8.

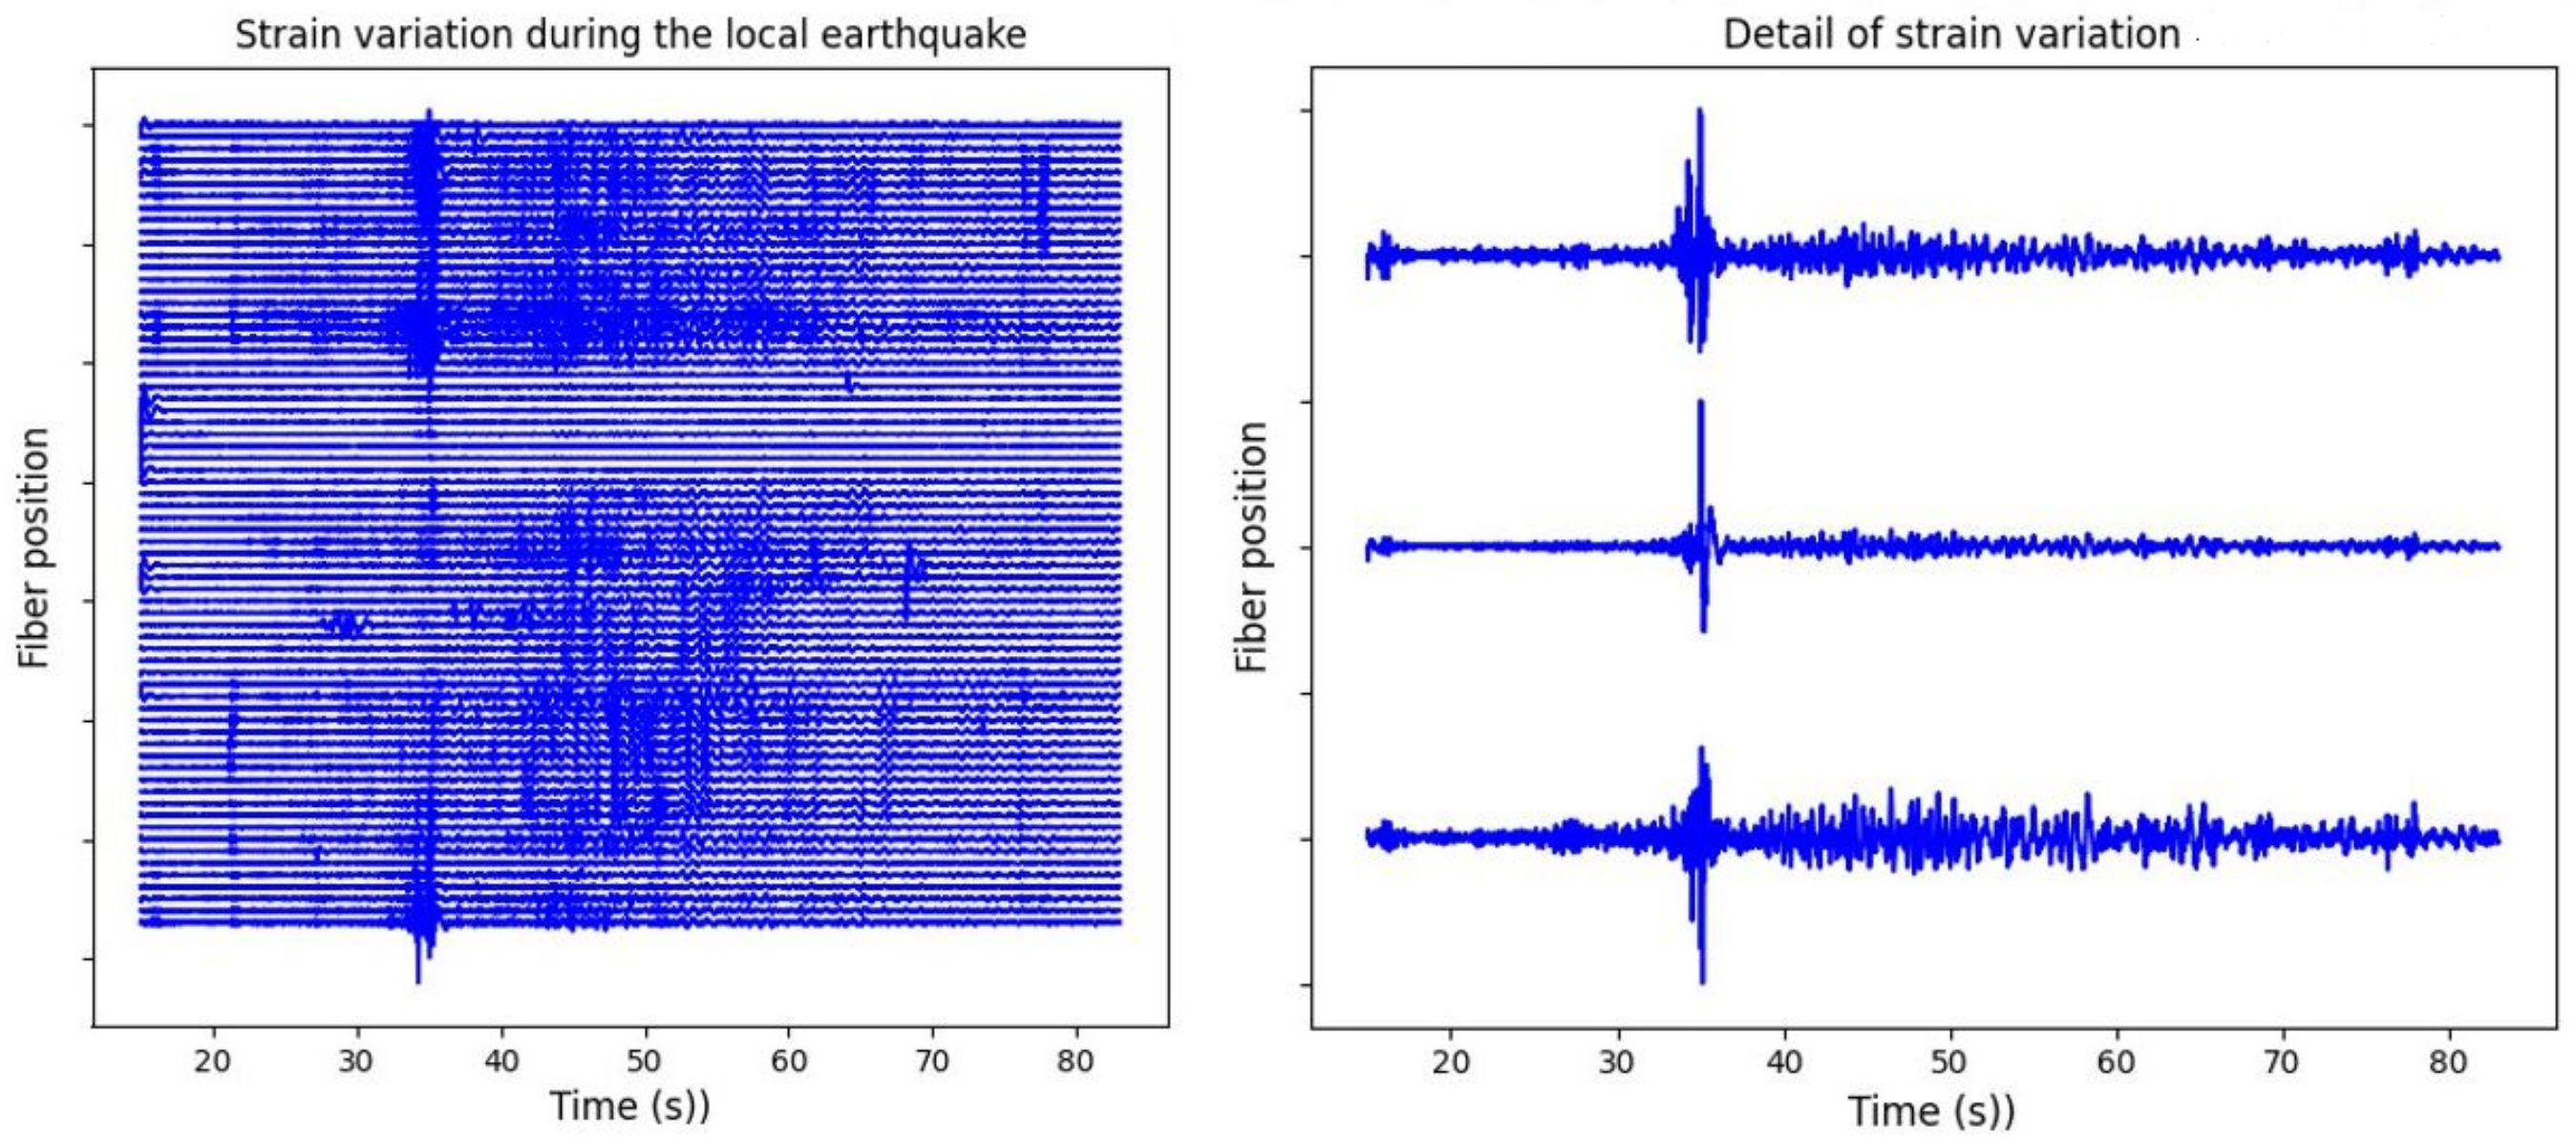
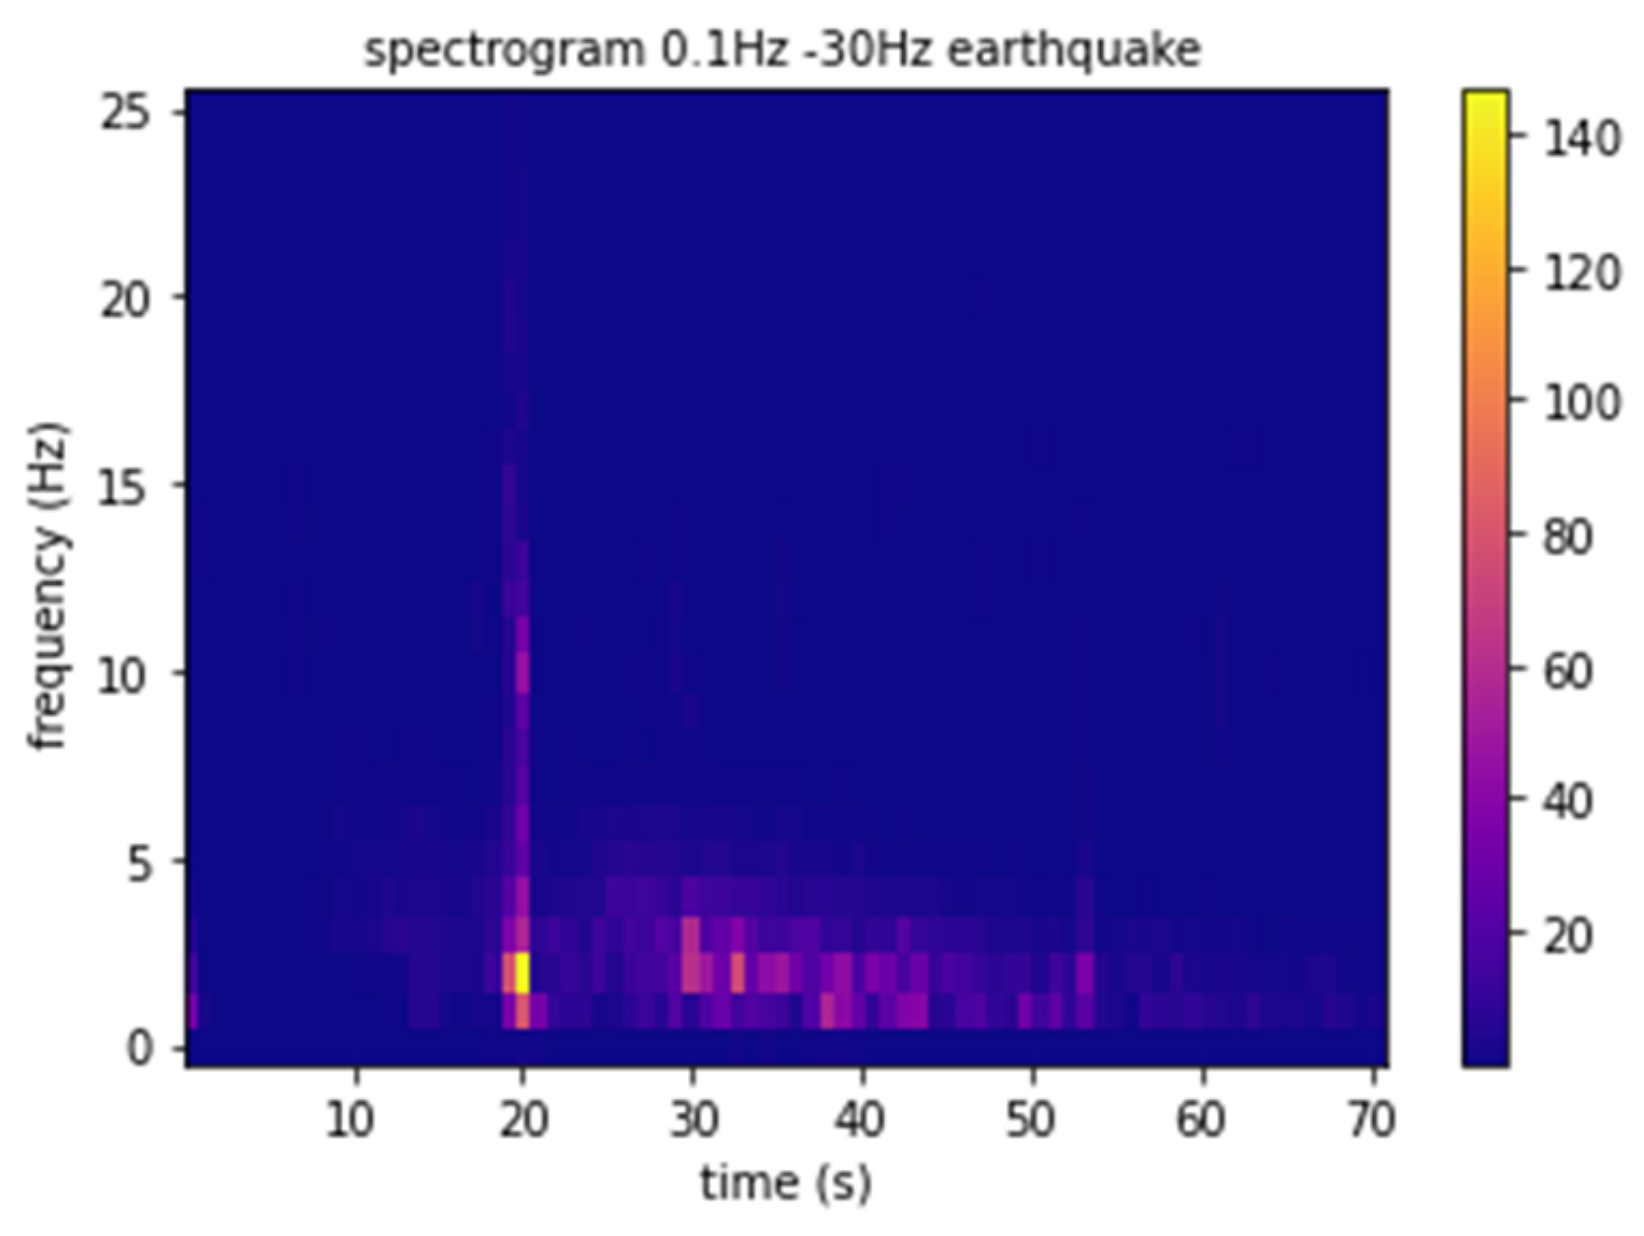
3.4. Urban Seismicity Monitoring

During the New Year’s Eve monitoring experiment, Figure A2 shows the energy footprint of a local earthquake with an epicenter in the region of Almería (with a distance of around 100 km to the testbed) registered the 31 December 2023 at 08:05:54 am local time, with depth = 0 km and magnitude 4 Mw [61]. Figure 13 shows how simultaneous and energetic strain variations are present in all spatial points with different magnitudes depending on the transmission properties of each ground portion. The concrete wall located approximately in the middle of the waterfall (see Figure 2) cannot register the earthquake being the wall somehow unlinked from the Earth’s movement. Figure 14 depicts the spatial-average frequency spectrogram during the earthquake, showing the well-known P-wave first arrival with higher frequency contents generated by a fracture source mechanism, followed by an S-wave with lower frequency contents extended longer in time with energy exponential decay [62].
Time-domain analysis of seismic P and S waves using a classic multi-component point geophone would provide separate vertical and horizontal components related to P and S phases, permitting polarization and shear waves analysis. Due to the single-component nature of the DAS array and its measure of strain-rate rather than particle motion or acceleration, it produces a single measurement of the changes in the fiber’s group refractive index originated by the projection of the three components along the fiber. Given its interest for the geophysical community, several approaches are under analysis at the moment to overcome this limitation like the usage of helically wound fibers to measure strains in three directions [63], usage of azimuthally varying 2D arrays for horizontal components sensing [64] and machine learning complementary analysis [65].

4. Discussion

The work presents an experimental testbed for distributed acoustic sensing in urban environments, devoted to the analysis of the mobility patterns in the surroundings of the School of Technology and Telecommunication Engineering of the University of Granada. Strain variations registered by the sensor are processed for noise reduction and filtered in convenient frequency bands, identifying three basic types of events (cars, buses and pedestrians) to initiate a preliminary automatic counting process. Hjorth parameters and approximate entropy are explored as possible processing approaches to improve automatic events detection and classification based on template matching. Several example applications of the technology are shown. Time dependent density of traffic, intervals of public bus arrivals, speed of pedestrian vehicles split into classes (to start with high/low weight vehicles) are monitorable without interruption anywhere in the city having an optical fiber installed. In addition, urban seismicity is also recordable with the subsequent interest for urban locations with risk of seismic hazards. The benefits of having data-driven mobility pattern models are many. Green urban planning strategies, sustainable development plans, smart traffic managing applications or emergency evacuation plans, among others, can be designed based on the knowledge provided by them.
Compared to other sensing technologies, the anonymity of the data, independence of weather conditions, no need of maintenance or power supply for point sensors, or long range and high spatial sampling frequency are remarkable advantages. The challenges of distributed acoustic sensing are several, opening an interesting research framework for future works. Strain variations have often low SNR and are dependent on the specific and changing ground and fiber properties. Robust calibration and advanced noise removing approaches are needed. The automatic detection and classification of events that are often overlapped and merged offer the possibility to explore automatic unsupervised and supervised approaches based on state-of-the-art machine learning strategies.

Author Contributions

Conceptualization, L.G., C.B., S.M. and J.C.S.; methodology, L.G., C.B., S.M. and M.T.; software, S.M., C.M., M.T.; formal analysis, L.G., C.B., S.M. and J.C.S.; investigation, L.G., C.B., S.M., M.T.; resources, L.G., J.C.S. and C.B.; writing—original draft preparation, L.G., C.B. and S.M.; writing—review and editing, L.G., S.M., M.T., C.M., J.C.S. and C.B.; funding acquisition, L.G. and C.B. All authors have read and agreed to the published version of the manuscript.

Funding

This research was funded by Grant B-TIC-542-UGR20 funded by “Consejería de Universidad, Investigación e Innovacción de la Junta de Andalucía” and by “ERDF A way of making Europe”.

Data Availability Statement

Given the descriptive nature of this work, no data have been generated.

Acknowledgments

We want to thank Aragon Photonics for his technical support. We also want to thank the support and helpful collaboration of the School of Technology and Telecommunication Engineering of the University of Granada, Spain, during the whole installation and experiment.

Conflicts of Interest

The authors declare no conflict of interest.

Appendix A

Figure A1. Example hours of traffic during the monitoring example carried out 21 December 2022 from 31 December 2022 10:58:08 to 1 January 2023 9:58:13.
Remotesensing 15 03282 g0a1
Figure A2. Example of local earthquake with magnitude 4 Mk with epicenter in Almería, registered by the sensor the 31 December 2022.
Remotesensing 15 03282 g0a2

References

  1. United Nations. The Sustainable Development Goals Report 2022; United Nations Publications: New York, NY, USA, 2022. [Google Scholar]
  2. Blasi, S.; Ganzaroli, A.; De Noni, I. Smartening sustainable development in cities: Strengthening the linkage between smart cities and SDGs. Sustain. Cities Soc. 2022, 80, 103793. [Google Scholar] [CrossRef]
  3. Biyik, C.; Abaresho, A.; Paz, A.; Ruiz, R.A.; Battarra, R.; Rogers, C.D.F.; Lizarraga, C. Smart Mobility Adoption: A Review of the Literature. J. Open Innov. Technol. Mark. Complex. 2021, 7, 146. [Google Scholar] [CrossRef]
  4. Savithramma, R.M.; Ashwini, B.P.; Sumathi, R. Smart Mobility Implementation in Smart Cities: A Comprehensive Review on State-of-art Technologies. In Proceedings of the 4th IEEE International Conference on Smart Systems and Inventive Technology (ICSSIT), Tirunelveli, India, 20–22 January 2022. [Google Scholar]
  5. Runyu, F.; Jun, L.; Weijing, S.; Wei, H.; Jning, Y.; Lizhe, W. Urban informal settlements classification via a transformer-based spatial-temporal fusion network using multimodal remote sensing andtime-series human activity data. Int. J. Appl. Earth Obs. Geoinf. 2022, 111, 102831. [Google Scholar]
  6. Ahyun, L.; Kang-Woo, L.; Kyong-Ho, K.; Sung-Woong, S. A Geospatial Platform to Manage Large-Scale Individual Mobility for an Urban Digital Twin Platform. Remote Sens. 2022, 14, 723. [Google Scholar]
  7. Loder, A.; Ambühl, L.; Menendez, M.; Axhausen, K.W. Understanding traffic capacity of urban networks. Sci. Rep. 2019, 9, 16283. [Google Scholar] [CrossRef] [PubMed] [Green Version]
  8. Serok, N.; Havlin, S.; Blumenfeld Lieberthal, E. Identification, cost evaluation, and prioritization of urban traffic congestions and their origin. Sci. Rep. 2022, 12, 13026. [Google Scholar] [CrossRef]
  9. Huang, A.J.; Agarwal, S. Physics-Informed Deep Learning for Traffic State Estimation: Illustrations With LWR and CTM Models. IEEE Open J. Intell. Transp. Syst. 2022, 3, 503–518. [Google Scholar] [CrossRef]
  10. Medina-Salgado, B.; Sánchez-DelaCruz, E.; Pozos-Parra, P.; Sierra, J.E. Urban traffic flow prediction techniques: A review. Sustain. Comput. Inform. Syst. 2022, 35, 100739. [Google Scholar] [CrossRef]
  11. Jafari, S.; Shahbazi, Z. Designing the Controller-Based Urban Traffic Evaluation and Prediction Using Model Predictive Approach. Appl. Sci. 2022, 12, 1992. [Google Scholar] [CrossRef]
  12. Wu, J.; Wang, X.; Dang, Y.; Zhihan, L. Digital twins and artificial intelligence in transportation infrastructure: Classification, application, and future research directions. Comput. Electr. Eng. 2022, 101, 107983. [Google Scholar] [CrossRef]
  13. Butila, E.V.; Boboc, R.G. Urban Traffic Monitoring and Analysis Using Unmanned Aerial Vehicles (UAVs): A Systematic Literature Review. Remote Sens. 2022, 14, 620. [Google Scholar] [CrossRef]
  14. Liu, Z.; Jiang, S.; Zhou, P.; Li, M. A Participatory Urban Traffic Monitoring System: The Power of Bus Riders. IEEE Trans. Intell. Transp. Syst. 2017, 18, 2851–2864. [Google Scholar] [CrossRef]
  15. Fredianelli, L.; Carpita, S.; Bernardini, M.; Del Pizzo, L.G.; Brocchi, F.; Bianco, F.; Licitra, G. Traffic Flow Detection Using Camera Images and Machine Learning Methods in ITS for Noise Map and Action Plan Optimization. Sensors 2022, 22, 1929. [Google Scholar] [CrossRef] [PubMed]
  16. Duan, Z.; Yang, Y.; Zhang, K.; Ni, Y.; Bajgain, S. Improved Deep Hybrid Networks for Urban Traffic Flow Prediction Using Trajectory Data. IEEE Access 2018, 6, 31820–31827. [Google Scholar] [CrossRef]
  17. Chen, Y.; Qin, R.; Zhang, G.; Albanwan, H. Spatial Temporal Analysis of Traffic Patterns during the COVID-19 Epidemic by Vehicle Detection Using Planet Remote-Sensing Satellite Images. Remote Sens. 2021, 13, 208. [Google Scholar] [CrossRef]
  18. Ji, B.; Zhang, X.; Mumtaz, S.; Han, C.; Li, C.; Wen, H.; Wang, D. Survey on the Internet of Vehicles: Network Architectures and Applications. IEEE Commun. Stand. Mag. 2020, 4, 34–41. [Google Scholar] [CrossRef]
  19. Bao, X.; Chen, L. Recent progress in Distributed Optic Sensors. Sensors 2012, 12, 8602–8639. [Google Scholar] [CrossRef] [Green Version]
  20. Lu, P.; Lalam, N.; Badar, M.; Liu, B.; Chorpening, B.; Buric, M.; Ohodnicki, P.R. Distributed optical fibre sensing: Review and perspective. Appl. Phys. Rev. 2019, 6, 041302. [Google Scholar] [CrossRef]
  21. Pastor-Graekks, J.; Martins, H.F.; Garcia-Ruiz, A.; Martin-Lopez, S.; Gonzalez-Herraez, M.R. Single-shot distributed temperature and strain tracking using direct detection phase-sensitive OTDR with chirped pulses. Opt. Express 2016, 24, 13122. [Google Scholar]
  22. Tu, G.; Zhang, X.; Zhang, Y.; Zhu, F.; Xia, L.; Nakarmi, B. The development of an Phi-OTDR system for quantitative vibration measurement. IEEE Photonics Technol. Lett. 2015, 27, 1349–1352. [Google Scholar] [CrossRef]
  23. Wang, Z.; Zhang, L.; Wang, S.; Xue, N.; Peng, F.; Fan, M.; Sun, W.; Qian, X.; Rao, J.; Rao, Y. Coherent Φ-OTDR based on I/Q demodulation and homodyne detection. Opt. Express 2016, 24, 853–858. [Google Scholar] [CrossRef] [PubMed]
  24. Juarez, J.C.; Taylor, H.F. Polarization discrimination in a phase-sensitive optical time-domain reflectometer intrusion-sensor system. Opt. Lett. 2005, 30, 3284–3286. [Google Scholar] [CrossRef] [PubMed]
  25. Fernández-Ruiz, M.R.; Costa, L.; Martins, F.H. Distributed Acoustic Sensing Using Chirped-Pulse Phase-Sensitive OTDR Technology. Sensors 2019, 19, 4368. [Google Scholar] [CrossRef] [PubMed] [Green Version]
  26. Koyamada, Y.; Imahama, M.; Kubota, K.; Hogari, K. Fiber-optic distributed strain and temperature sensing with very high measurand resolution over long range using coherent OTDR. J. Light. Technol. 2009, 27, 1142–1146. [Google Scholar] [CrossRef]
  27. Martuganova, E.; Stiller, M.; Norden, B.; Henninges, J.; Krawczyk, C.M. 3D deep geothermal reservoir imaging with wireline distributed acoustic sensing in two boreholes. Solid Earth 2002, 13, 1291–1307. [Google Scholar] [CrossRef]
  28. Young, C.; Shragge, J.; Schultz, W.; Haines, S.; Oren, C.; Simmons, J.; Collett, T.S. Advanced Distributed Acoustic Sensing Vertical Seismic Profile Imaging of an Alaska North Slope Gas Hydrate Field. Energy Fuels 2022, 36, 3481–3495. [Google Scholar] [CrossRef]
  29. Dou, S.; Lindsey, N.; Wagner, A.M.; Daley, T.M.; Freifeld, B.; Robertson, M.; Peterson, J.; Ulrich, C.; Martin, E.R.; Ajo-Franklin, J.B. Distributed Acoustic Sensing for Seismic Monitoring of The Near Surface: A Traffic-Noise Interferometry Case Study. Sci. Rep. 2017, 7, 11620. [Google Scholar] [CrossRef] [Green Version]
  30. Zhan, Z. Distributed acoustic sensing turns fiber-optic cables into sensitive seismic antennas. Seismol. Res. Lett. 2020, 91, 1–15. [Google Scholar] [CrossRef]
  31. Fernández-Ruiz, M.R.; Martins, H.F.; Williams, E.F.; Becerril, C.; Magalhães, R.; Costa, L.; Martin-Lopez, S.; Jia, Z.; Zhan, Z.; González-Herráez, M. Seismic Monitoring with Distributed Acoustic Sensing from the Near-Surface to the Deep Oceans. J. Light. Technol. 2022, 40, 1453–1463. [Google Scholar] [CrossRef]
  32. Jousset, P.; Currenti, G.; Schwarz, B.; Chalari, A.; Tilmann, F.; Reinsch, T.; Zuccarello, L.; Privitera, E.; Krawczyk, C.M. Fibre optic distributed acoustic sensing of volcanic events. Nat. Commun. 2022, 13, 1753. [Google Scholar] [CrossRef]
  33. Tejedor, J.; Macias-Guarasa, J.; Martins, H.F.; Pastor-Graells, J.; Corredera, P.; Martin-Lopez, S. Machine learning methods for pipeline surveillance systems based on distributed acoustic sensing: A review. Appl. Sci. 2017, 7, 841. [Google Scholar] [CrossRef] [Green Version]
  34. Bado, M.F.; Tonelli, D.; Poli, F.; Zonta, D.; Casas, J.R. Digital Twin for Civil Engineering Systems: An Exploratory Review for Distributed Sensing Updating. Sensors 2022, 22, 3168. [Google Scholar] [CrossRef] [PubMed]
  35. Martin, R.; Bruce, G. Monitoring Traffic Flow. International Patent PCT/GB2016/053330, 26 October 2016. [Google Scholar]
  36. Liu, H.; Ma, J.; Yan, W.; Liu, W.; Zhang, X.; Li, C. Traffic flow detection using distributed fiber optic acoustic sensing. IEEE Access 2018, 6, 68968–68980. [Google Scholar] [CrossRef]
  37. Hall, A.J.; Minto, C. Using fibre optic cables to deliver intelligent traffic management in smart cities. In Proceedings of the International Conference on Smart Insfrastructure and Construction, Cambridge, UK, 8–10 July 2019. [Google Scholar]
  38. Wang, X.; Williams, E.F.; Karrenbach, M.; González Herráez, M.; Martins , H.F.; Zhan, Z. Rose Parade Seismology: Signatures of Floats and Bands on Optical Fiber. Seismol. Res. Lett. 2020, 91, 2395–2398. [Google Scholar] [CrossRef]
  39. Jakkampudi, S.; Shen, J.; Weichen, L.; Dev, A.; Zhu, T.; Martin, E. Footstep detection in urban seismic data with a convolutional network. Lead. Edge 2020, 39, 654–660. [Google Scholar] [CrossRef]
  40. Liu, H.; Ma, J.; Xu, T.; Yan, W.; Ma, L.; Zhang, X. Vehicle Detection and Classification Using Distributed Fiber Optic Acoustic Sensing. IEEE Trans. Veh. Technol. 2020, 69, 1363–1374. [Google Scholar] [CrossRef]
  41. Lindsey, N.J.; Yuan, S.; Lellouch, A.; Gualtieri, L.; Lecocq, T.; Biondi, B. City-Scale Dark Fiber DAS Measurements of Infrastructure Use During the COVID-19 Pandemic. Geophys Res. Lett. 2020, 47, e2020GL089931. [Google Scholar] [CrossRef]
  42. Peng, Z.; Wen, H.; Jian, J.; Gribok, A.; Wang, M.; Huang, S.; Liu, H.; Mao, Z.H.; Chen, K.P. Identifications and classifications of human locomotion using Rayleigh-enhanced distributed fiber acoustic sensors with deep neural networks. Sci. Rep. 2020, 10, 21014. [Google Scholar] [CrossRef]
  43. Wang, X.; Zhan, Z.; Williams, E.F.; Herráez, M.G.; Martins, H.F.; Karrenbach, M. Ground vibrations recorded by fiber-optic cables reveal traffic response to COVID-19 lockdown measures in Pasadena, California. Commun. Earth Environ. 2021, 2, 160. [Google Scholar] [CrossRef]
  44. Ende, M.v.; Ferrari, A.; Sladen, A.; Richard, C. Next-Generation Traffic Monitoring with Distributed Acoustic Sensing Arrays and Optimum Array Processing. In Proceedings of the 2021 55th Asilomar Conference on Signals, Systems, and Computers, Pacific Grove, CA, USA, 31 October–3 November 2021; pp. 1104–1108. [Google Scholar]
  45. Wang, H.; Chen, Y.; Min, R.; Chen, Y. Urban DAS Data Processing and Its Preliminary Application to City Traffic Monitoring. Sensors 2022, 22, 9976. [Google Scholar] [CrossRef]
  46. Van den Ende, M.; Ferrari, A.; Sladen, A.; Richard, C. Deep Deconvolution for Traffic Analysis with Distributed Acoustic Sensing Data. IEEE Trans. Intell. Transp. Syst. 2022, 24, 2947–2962. [Google Scholar] [CrossRef]
  47. Lindsey, N.J.; Rademacher, H.; Ajo-Franklin, J.B. On the broadband instrument response of fiber-optic DAS arrays. J. Geophys. Res. Solid Earth 2020, 125, e2019JB018145. [Google Scholar] [CrossRef]
  48. Van den Ende, M.; Lior, I.; Ampuero, J.P.; Sladen, A. A Self-Supervised Deep Learning Approach for Blind Denoising and Waveform Coherence Enhancement in Distributed Acoustic Sensing Data. IEEE Trans. Neural Netw. Learn. Syst. 2021. early access. [Google Scholar] [CrossRef] [PubMed]
  49. Ponce-Flores, M.; Frausto-Solís, J.; Santamaría-Bonfil, G.; Pérez-Ortega, J.; González-Barbosa, J.J. Time Series Complexities and Their Relationship to Forecasting Performance. Entropy 2020, 22, 89. [Google Scholar] [CrossRef] [PubMed] [Green Version]
  50. Shannon, C.E. A Mathematical Theory of Communication. Bell Syst. Tech. J. 1948, 27, 379–423. [Google Scholar] [CrossRef] [Green Version]
  51. Gao, J.; Hu, J.; Tung, W. Entropy measures for biological signal analyses. Nonlinear Dyn. 2012, 68, 431–444, ISSN 0278-5846. [Google Scholar] [CrossRef]
  52. Fernández, A.; Gómez, G.; Hornero, R.; López-Ibor, J.J. Complexity and schizophrenia. Prog. Neuro Psychopharmacol. Biol. Psychiatry 2013, 45, 267–276, ISSN 0278-5846. [Google Scholar] [CrossRef]
  53. Chen, C.; Jin, Y.; Lo, I.L.; Zhao, H.; Sun, B.; Zhao, Q.; Zheng, J.; Zhang, X.D. Complexity Change in Cardiovascular Disease. Int. J. Biol. Sci. 2017, 13, 1320–1328. [Google Scholar] [CrossRef]
  54. Asgharzadeh-Bonab, A.; Chehel, M.; Mehri, A. Spectral entropy and deep convolutional neural network for ECG beat classification. Biocybern. Biomed. Eng. 2020, 40, 691–700, ISSN 0208-5216. [Google Scholar] [CrossRef]
  55. Rizal, A.; Hidayat, R.; Nugroho, H.A. Entropy measurement as features extraction in automatic lung sound classification. In Proceedings of the 2017 International Conference on Control, Electronics, Renewable Energy and Communications (ICCREC), Yogyakarta, Indonesia, 26–28 September 2017; pp. 93–97. [Google Scholar] [CrossRef]
  56. Li, Y.; Wang, X.; Liu, Z.; Liang, X.; Liang, X.; Si, S. The Entropy Algorithm and Its Variants in the Fault Diagnosis of Rotating Machinery: A Review. IEEE Access 2018, 6, 66723–66741. [Google Scholar] [CrossRef]
  57. Olbrys, J.; Majewska, E. Approximate entropy and sample entropy algorithms in financial time series analyses. Procedia Comput. Sci. 2022, 207, 255–264, ISSN 1877-0509. [Google Scholar] [CrossRef]
  58. Pincus, A. Approximate entropy as a measure of system complexity. Proc. Natl. Acad. Sci. USA 1991, 88, 2297–2301. [Google Scholar] [CrossRef] [PubMed] [Green Version]
  59. Hjorth, B. EEG analysis based on time domain properties. Electroencephalogr. Clin. Neurophysiol. 1970, 9, 306–310, ISSN 0013-4694. [Google Scholar] [CrossRef] [PubMed]
  60. Briechle, K.; Hanebeck, U. Template matching using fast normalized cross correlation. Proc. SPIE Int. Soc. Opt. Eng. 2001, 4387, 1–8. [Google Scholar]
  61. IGN. Earthquake information. Available online: https://www.ign.es/web/ign/portal/ultimos-terremotos/-/ultimos-terremotos/getDetails?evid=es2022zpswu (accessed on 25 June 2023).
  62. García, L.; Alguacil, G.; Titos, M.; Cocina, O.; De la Torre, A.Ç.; Benítez, C. Automatic S-Phase Picking for Volcano-Tectonic Earthquakes Using Spectral Dissimilarity Analysis. IEEE Geosci. Remote. Sens. Lett. 2020, 17, 874–878. [Google Scholar] [CrossRef]
  63. Baird, A.F. Modelling the response of helically wound DAS cables to microseismic arrivals. In Proceedings of the First EAGE Workshop on Fiber Optic Sensing, Amsterdam, The Netherlands, 9–11 March 2020; European Association of Geoscientists & Engineers: Amsterdam, The Netherlands, 2020; pp. 1–5. [Google Scholar]
  64. Hudson, T.S.; Baird, A.F.; Kendall, J.M.; Kufner, S.K.; Brisbourne, A.M.; Smith, A.M.; Butcher, A.; Chalari, A.; Clarke, A. Distributed Acoustic Sensing (DAS) for natural microseismicity studies: A case study from Antarctica. J. Geophys. Res. Solid Earth 2021, 126, e2020JB021493. [Google Scholar] [CrossRef]
  65. Jreij, S.F.; Trainor-Guitton, W.J.; Morphew, M.; Chen Ning, I.L. The Value of Information From Horizontal Distributed Acoustic Sensing Compared to Multicomponent Geophones Via Machine Learning. J. Energy Resour. Technol. 2021, 143, 010902. [Google Scholar] [CrossRef]
Figure 1. Google MapTM view of sensing testbed installed in the Telecommunication and Computer Science Engineering School of the University of Granada, Spain. Sensing points calibrated in the fiber with spacial resolution of 10 m are depicted. Red markpoints correspond to the internal fiber ring, while blue markpoints correspond to the external fiber ring. Four sensing areas are differentiated: Periodista Rafael Gómez Mont street (red arrows), Periodista Daniel Saucedo Aranda street (blue arrows), internal gardens of the School (green ellipsoid) and concrete wall in a side of the School perimeter (yellow arrows). Sensing points P1 and P10 are the respective entrances/exits of a surface and underground parking.
Remotesensing 15 03282 g001
Figure 2. Example of energy waterfall of 25 min for the fiber deployment described in Figure 1. All sensing points are depicted in the Y-axis, with the side color arrows indicating the spatial area corresponding to each segment of the Y-axis.
Remotesensing 15 03282 g002
Figure 3. Steps for baseline noise reduction in strain registers.
Remotesensing 15 03282 g003
Figure 4. Example visualizations of the canonic events detected in the monitoring testbed (bus, car and pedestrian). (a) Energy waterfall, strain variation and spatial-average power spectral density for a canonic bus example. (b) Energy waterfall, strain variation and spatial-average power spectral density for a canonic car example. (c) Energy waterfall, strain variation and spatial-average power spectral density for a canonic pedestrian example.
Remotesensing 15 03282 g004
Figure 5. Histograms of the frequency with highest energy for the three baseline events analyzed. Three frequency bands are studied: complete band from 0.1 Hz to 30 Hz (left), quasi-static band from 0.1 to 5 Hz (center) and high frequency band 5Hz to 20 Hz (right).
Remotesensing 15 03282 g005
Figure 6. Events detected in a segment of DAS register pointed at with red, yellow and gray arrows indicating the presence of pedestrian, car or bus, respectively. (a) shows strain variations and approximate entropy in the band 0.1–2 Hz. (b) shows strain variations and approximate entropy in the band from 5–20 Hz.
Remotesensing 15 03282 g006
Figure 7. Events detected in a segment of DAS register pointed at with red, yellow and gray arrows indicating the presence of pedestrian, car or bus, respectively. Strain-variation file segment processed in the band 0.1–2 Hz. Corresponding Hjorth parameters.
Remotesensing 15 03282 g007
Figure 8. Events detected in a segment of DAS register pointed at with red, yellow and gray arrows indicating the presence of pedestrian, car or bus, respectively. Strain-variation file segment processed in the band 5–20 Hz. Corresponding Hjorth parameters.
Remotesensing 15 03282 g008
Figure 9. Automatic counting of the number of cars, pedestrians and buses carried out during the monitoring example.
Remotesensing 15 03282 g009
Figure 10. Example hours of traffic during the monitoring example carried out January 9th 2023 from 09/01/2023 00:03:08 to 09/01/2023 23:03. Automatic counting of buses, pedestians and cars (left subfigure). Average time interval between buses in minutes (right subfigure).
Remotesensing 15 03282 g010
Figure 11. Average speed for the 3 types of events detected during the workday monitoring period.
Remotesensing 15 03282 g011
Figure 12. On the left, map and fiber position of outdoor parking; and on the right, acoustic energy detected at the fiber positions in the map along 600 s: vehicles entering (red arrows) and leaving (blue arrow) the park lot.
Remotesensing 15 03282 g012
Figure 13. Strain variation of the earthquake registered the 31 December 2023.
Remotesensing 15 03282 g013
Figure 14. Spatial-average power spectral density for the earthquake observed.
Remotesensing 15 03282 g014
Table 1. Traffic monitoring through DAS approaches.
ReferenceObjectiveSignal ProcessingSensing Scenario
patent, 2016, [35]vehicles detection, traffic flow, speed measurements[-][-]
journal, 2018, [36]vehicle detection and counting, speed estimationwavelet-threshold denoising and dual threshold detection.200 m. road in the NanShan Iron mine (China) during seismic trial
congress, 2019, [37]average speed, flow rate, queue detection, congestion detection, journey times, traffic count[-][-]
journal, 2020, [38]signatures of floats, bands, motorcyclesdetrending, filtering, noise removal, frequency analysis2.5 km of fiber underneath the Rose Parade route, Pasadena(USA)
congress, 2020, [39]detect pedestrian footstepconvolutional neural network5km Pennsylvania State University campus
journal, 2020, [40]vehicle detection and classification, vehicle count, speed measurementwavelet denoising, dual-threshold detection, feature extraction, vehicle classification with SVM320 m. campus road of Beijing Jiaotong University (China)
journal, 2020, [41]vehicle detection, counting and characterizationfrequency analysis, template matching4 km. Telecom. cable running through Palo Alto, CA, leased from Stanford University IT Services (USA)
journal, 2020, [42]human locomotion detection (walking, running, different shoes)frequency analysis, shallow and deep Neural Networks15-m-long hallway.
journal, 2021, [43]vehicle counting, traffic volume, average speeddetrending, filtering, noise removal, frequency analysis37 km. Caltech-Pasadena City DAS array (USA).
conference, 2021, [44]estimation of individual simultaneous vehicles velocity in multiple lane roadsfrequency domain MUSIC beamformingcommercial telecom. cable parallel to a main road in Toulon(France).
journal, 2022, [45]speed and volume estimate of traffic flowfrequency analysis, F-K filtering for noise removal50 km. of telecom. cable inside the city of Hangzhou (China).
journal, 2022, [46]counting and velocity estimation for individual vehicles in challenging scenarios without spatial/temporal separationself-supervised deconvolution autoencoder14 km. commercial telecomm. along a main road connecting Alba-la-Romaine, Saint-Thomé, and Valvignères (France).
Disclaimer/Publisher’s Note: The statements, opinions and data contained in all publications are solely those of the individual author(s) and contributor(s) and not of MDPI and/or the editor(s). MDPI and/or the editor(s) disclaim responsibility for any injury to people or property resulting from any ideas, methods, instructions or products referred to in the content.

