
Early Crop Mapping Based on Sentinel-2 Time-Series Data and the Random Forest Algorithm
by
Peng Wei
1,2,3,
Huichun Ye
2,3,
Shuting Qiao
1,2,3,
Ronghao Liu
1,
Chaojia Nie
2,3,
Bingrui Zhang
4,
Lijuan Song
5,6 and
Shanyu Huang
7,* 1
College of Water Resources Science and Engineering, Taiyuan University of Technology, Taiyuan 030024, China
2
International Research Center of Big Data for Sustainable Development Goals, Beijing 100094, China
3
Key Laboratory of Digital Earth Science, Aerospace Information Research Institute, Chinese Academy of Sciences, Beijing 100094, China
4
College of Geoscience and Surveying Engineering, China University of Mining and Technology, Beijing 100083, China
5
Institute of Agricultural Remote Sensing and Information, Heilongjiang Academy of Agricultural Sciences, Harbin 150086, China
6
School of Management, Heilongjiang University of Science and Technology, Harbin 150022, China
7
Academy of Agricultural Planning and Engineering, Beijing 100125, China
*
Author to whom correspondence should be addressed.
Remote Sens. 2023, 15(13), 3212; https://doi.org/10.3390/rs15133212
Submission received: 8 May 2023
/
Revised: 14 June 2023
/
Accepted: 17 June 2023
/
Published: 21 June 2023
(This article belongs to the Special Issue State-of-the-Art in Land Cover Classification and Mapping)
Abstract
:Early-season crop mapping and information extraction is essential for crop growth monitoring and yield prediction, and it facilitates agricultural management and rapid response to agricultural disasters. However, training classifiers by remote sensing classification features for early crop prediction can be challenging, as early-season mapping can only use remote sensing image data during part of the crop growth period. In order to overcome this limitation, this study takes the Sanjiang Plain as an example to investigate the earliest identification time of rice, maize and soybean based on Sentinel-2 time-series data and the random forest classification algorithm. Crop information extraction was then performed. Following the analysis of the remote sensing classification features by the random forest importance approach and the subsequent normalization, the optimal features greater than or equal to 0.5 have yielded quite results in early crop mapping, and their overall accuracy was the highest in early-season mapping. The overall accuracy was observed to improve by 5% for 10 to 20 days of delay. In addition, rice, maize, and soybean were mapped at the irrigation transplanting period (10 May), jointing stage (9 July) and flowering (29 July), with an overall accuracy of 90.4%, 90.0% and 90.9%, respectively. This study shows that features suitable for early crop classification can be selected by random forest importance analysis as well as the ability of remote sensing to extract crop acreage information within the reproductive period.
1. Introduction
The future of farmland crop types is under constant change as global temperatures increase, global urbanization accelerates, and land use changes [1]. Timely and accurate information on crop acreage and spatial distribution is key for regional crop production and food security [2,3,4], and it provides important information for crop growth monitoring, yield prediction, farm production management, and food security scenario analysis [5,6]. In particular, early-season crop mapping is important in agricultural management [7] as well as in rapid response to agricultural disasters [8].
Remote sensing technology is now widely used for the monitoring of agricultural information due to its advantages of large coverage, short detection period and low cost [9,10]. Methods for extracting crop acreage using remote sensing information are well established. For example, 24 agricultural land cover categories in Germany were mapped for 2017, 2018 and 2019 using a random forest classifier and intensive time-series data from Sentinel-2 and Landsat 8 in combination with monthly Sentinel-1 composites and environmental data [11]. In addition, the Cropland Data Layer (CDL) was created in the United States using medium-resolution satellite imagery [12]. Bingwen Qiu [13] et al. extracted national maize, rice, and wheat acreage in China using MODIS data based on phenology and thresholding methods. Esther Shupel Ibrahim et al. provide a mapping scheme based on freely available Sentinel-2A/B (S2) time series and very high-resolution SkySat data to map the main crops (maize and potato) and intercropping systems including these two crops on the Jos Plateau, Nigeria [14]. However, the majority of current studies train classifiers for crop mapping based on all available data in the current year, preventing their application to agricultural management in a timely manner [15].
Crop maps have made great progress in terms of the availability of free medium-resolution satellite imagery and the development of new algorithms and cloud computing infrastructure [16]. Google Earth Engine (GEE) offers the opportunity to process large-scale time-series images. Such time-series images can reflect crop phenology information, while vegetation indices indicate the response characteristics of vegetation to the given spectral band. Therefore, remote sensing images of multiple vegetation indices combined with time series can differentiate crops according to their different growth status information in different growing periods [17]. This in turn provides an opportunity to address the scarcity of remote sensing data for early-season mapping. However, remote sensing images contain a large number of classification features, which lead to a low computational efficiency for the classifier and a high computation cost. Therefore, there is a requirement to improve feature selection processes. By comparing different remote sensing classification features to select the most suitable features for crop classification, the number of input features can be reduced, which in turn improves the computational efficiency and learning ability of the classifier and leads to a higher classification accuracy [18,19].
The Sanjiang Plain is not only the “king of black soil wetlands” in China, with organic matter-rich soils and high fertility, but also a key area for food security and a high-quality commercial grain base in China [20]. The Sanjiang plain in the northeastern Heilongjiang Province crop sowing region has an area of approximately 3.86 million hm2. Grain production is dominated by rice, which is followed by maize and soybean. During the critical growth and development period, namely, the irrigated water transplanting period, rice is a mixture of water, rice and soil [21]. It is easily distinguished from other landcover classes using the time-series vegetation index method during this period. Moreover, maize and soybeans grown in the Sanjiang Plain have a similar growth period and spectral information. This makes it difficult to distinguish between them using the original spectral bands of remote sensing data. In addition, the spectral mixing phenomenon of maize and soybeans further complicates the process of distinguishing between these two crops.
In the current study, the earliest identifiable time (EIT) of rice, maize and soybean was investigated using the Sanjiang Plain as the study area. Sentinel-2 images collected in 2022 were combined with ground sample data of the Sanjiang Plain to train the random forest classifier and analyze different remote sensing classification features. The optimal remote sensing classification features were then selected to explore early-season mapping methods for crops in the Sanjiang Plain. The specific aims of the study were to: (1) detect the earliest identifiable time (EIT) for rice, maize and soybean; (2) optimize the classification features of the three crops; and (3) determine the reliability of the early-season mapping results compared with those of post-season mapping.
2. Materials and Methods
2.1. Study Area
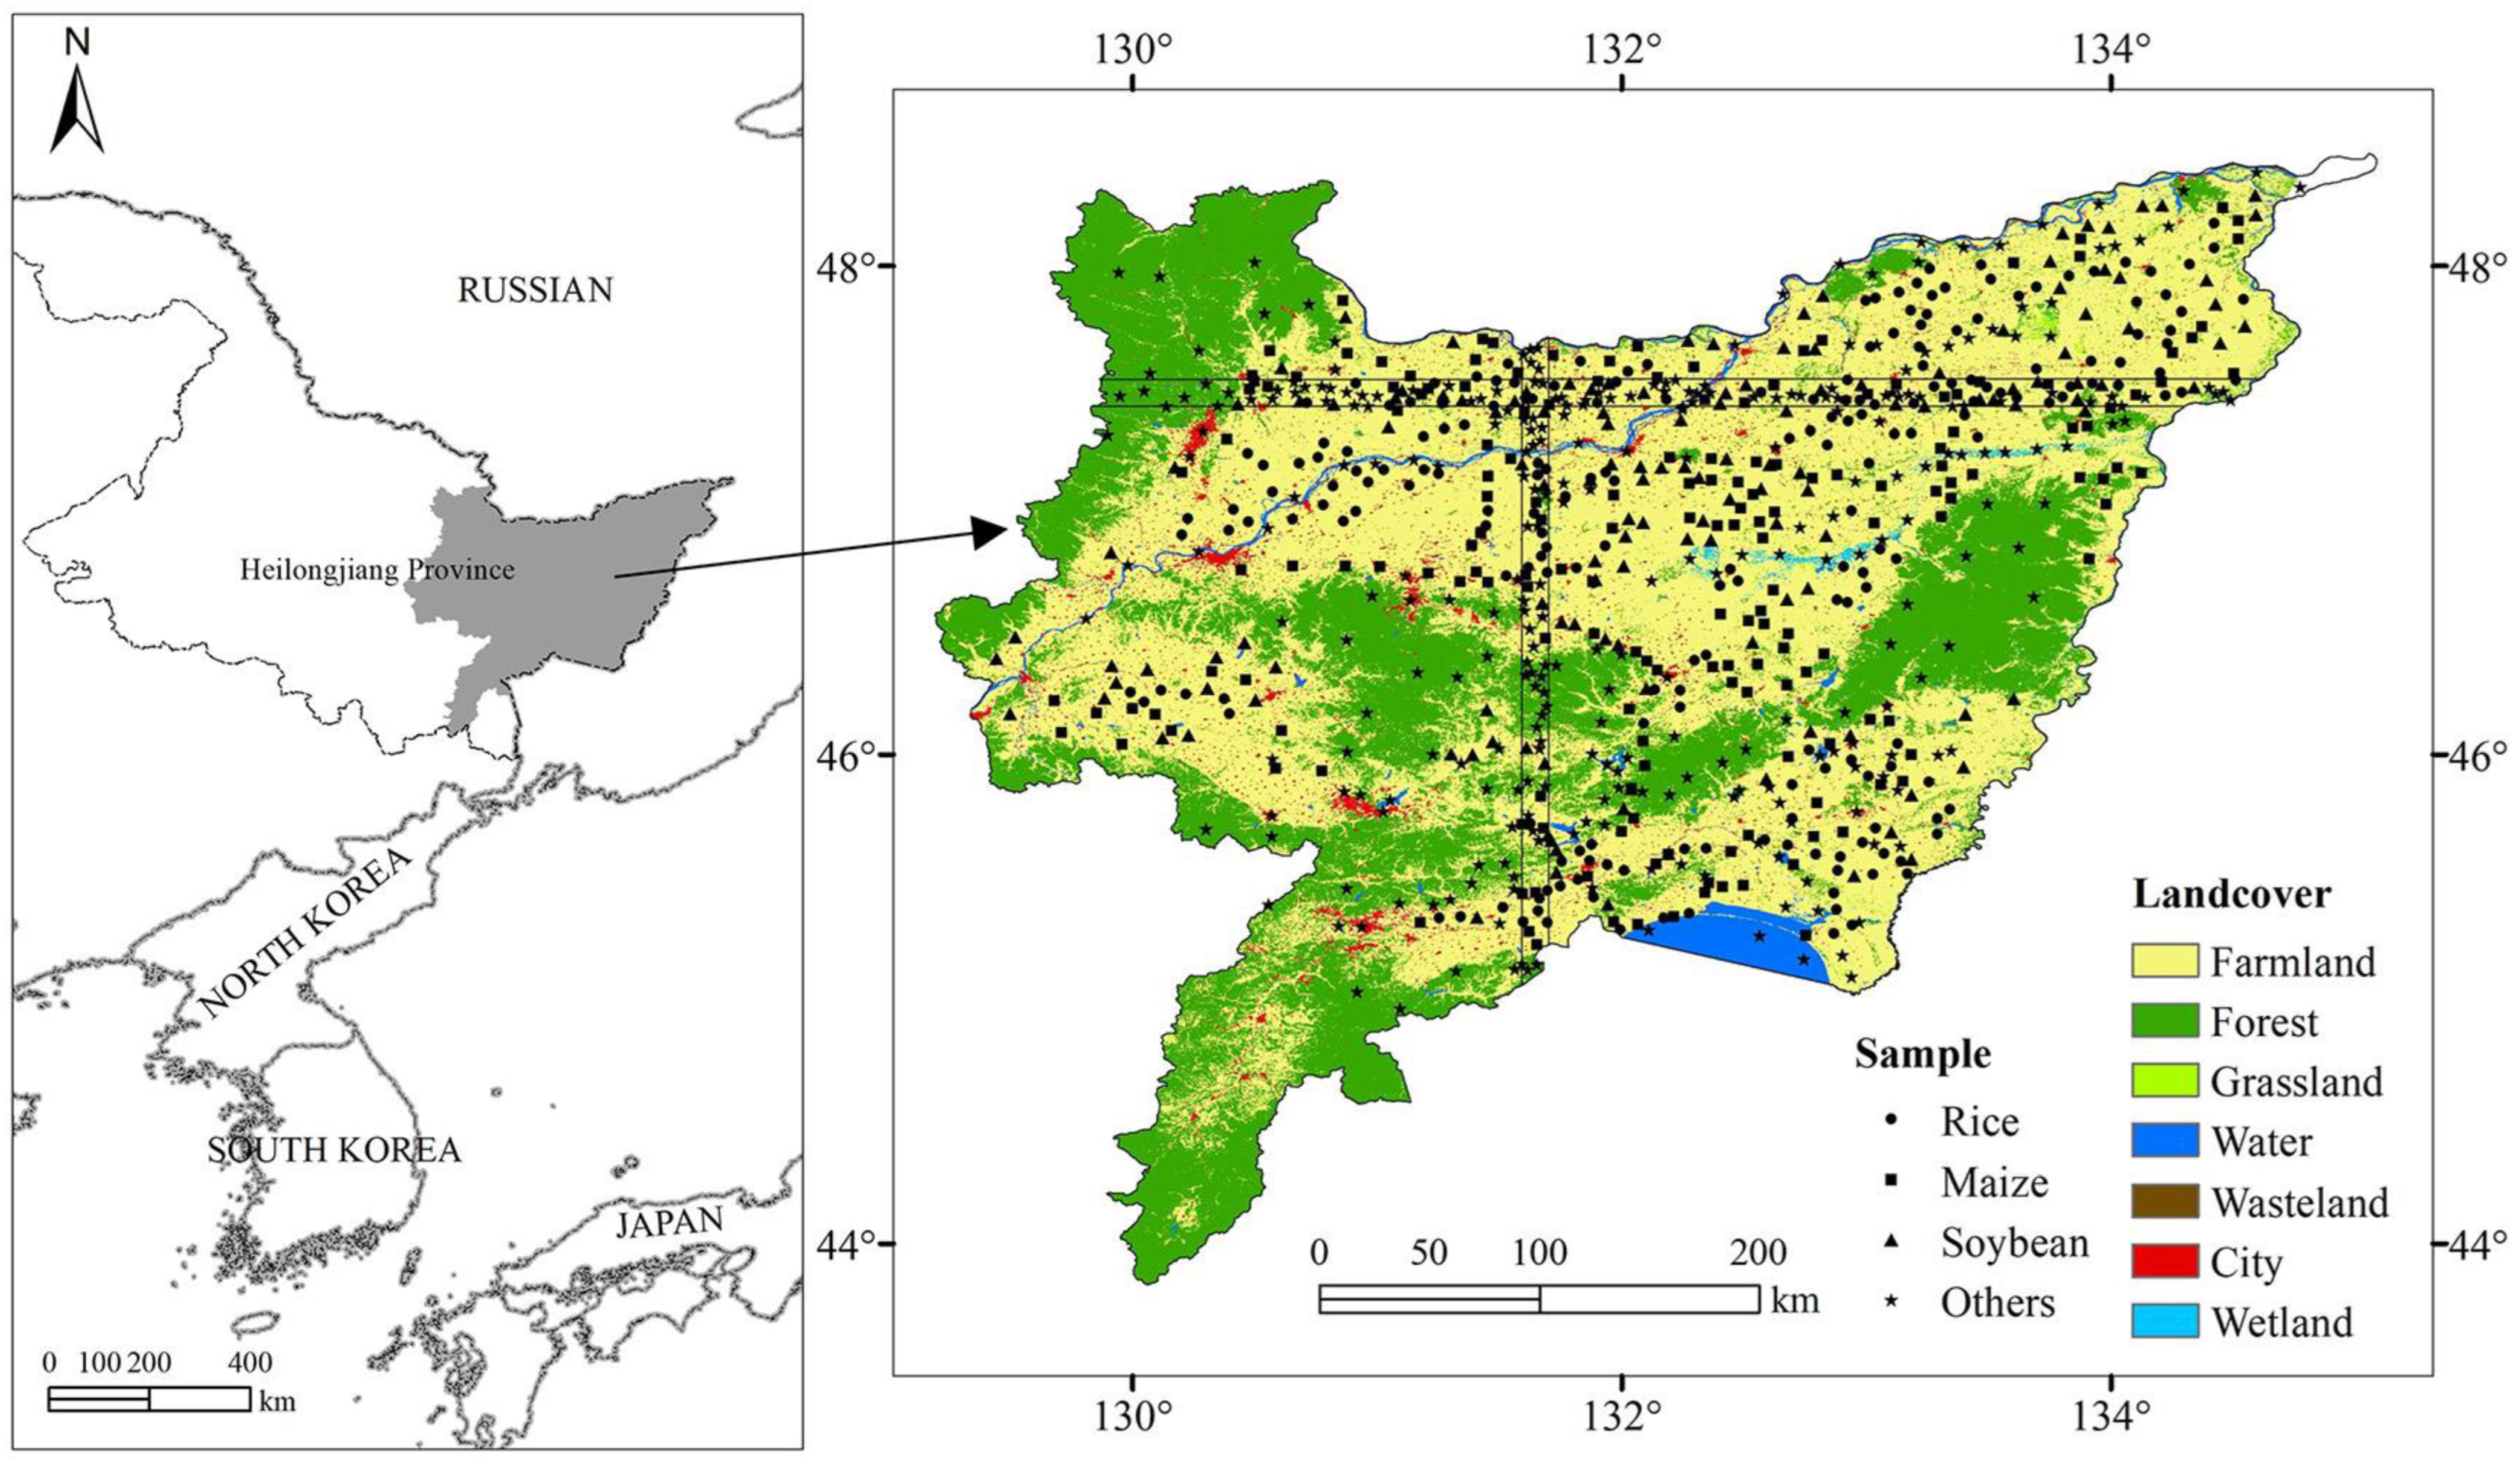
The Sanjiang Plain has a total land area of about 10.9 × 10⁴ km2 and is located in the northeastern part of Heilongjiang Province, China (131°26′~134°47′E, 44°48′~48°23′N, WGS-84), which is bounded by the Songhua River, Heilongjiang River, Ussuri River, Flexi River and the administrative area of Fujin City (Figure 1). It is an important commercial grain base in China. With 2400–2500 h of annual sunshine and 500–650 mm of annual precipitation, the Sanjiang Plain has a temperate humid and semi-humid continental monsoon climate with an average temperature of 21–22 °C in July, which is suitable for crop growth. Its main crops include rice, maize and soybeans. In this study, spring rice, spring maize and spring soybeans were selected as the surveyed cultivar. Each crop is harvested once per year due to low sunshine hours and accumulated heat. The growing period for these crops is generally concentrated in May to September. The total grain yield of the Sanjiang Plain can reach 15 million tons per year, and the per capita arable area and grain yield are above the national average.
2.2. Data Acquisition and Pre-Processing
2.2.1. Ground Reference Data
Ground data were collected in June to July 2022 in the Sanjiang Plain using GPS field surveys. The average temperature of the Sanjiang Plain in 2022 was 1.10 °C, with a maximum temperature of 32.0 °C and a minimum temperature of −42.6 °C. The annual rainfall was 664 mm, with June to September rainfall accounting for 77% of the year. In order to ensure the sufficient quality of sample points for the classification and to verify the accuracy, samples with obvious errors were eliminated from this study by the visual interpretation of Google Earth high-resolution images.
It is computationally intensive as well as time-consuming to construct a random forest classifier using multiple remote sensing classification feature time series of the Sanjiang Plain. In order to represent the early distribution of crops in the Sanjiang Plain both easily and quickly, a strip study area was selected as a representative region to infer and verify the early distribution of crops in the Sanjiang Plain. This reduces the pressure of the data processing and improves the efficiency of the classification model computation. An east–west strip and a north–south strip were constructed as strip study areas within the S2 satellite orbit coverage using ArcGIS, respectively (Figure 1). The image processing does not require the stitching of individual images within the S2 satellite orbit coverage, and thus, the memory used to process the data is reduced. The strip study area crosses the entire Sanjiang Plain at a regional scale and covers the target crops of rice, maize, and soybeans as well as representative features of forests, wetlands, cities, and water bodies. In addition, it is rich in sample points and can thus represent typical features of the Sanjiang Plain and meet the requirements for the early-season mapping of the target crops (Figure 1).
In order to make the classification results of the strip study area more representative, we performed a double validation. First validation: Initial validation was performed by 536 sample sites (120 rice, 125 maize, 121 soybean and 170 non-crop sample sites) collected in the strip study area, of which 70% were used for training and 30% were used for validation. Second validation: Secondary validation was conducted through 1064 sample sites (284 rice, 236 maize, 223 soybean, and 321 non-crop samples) in the entire region of the Sanjiang Plain, of which 70% were used for training and 30% were used for validation. The first validation was used to test the reliability of the findings from the strip study area, and the second validation was used to test the feasibility of applying the findings from the strip study area to the Sanjiang Plain and whether the classification results from the Sanjiang Plain could be generalized.
2.2.2. Satellite Imagery
Sentinel-2 (S2) consists of two satellites with a revisit period of 5 days and a resolution of 10–60 m, carrying a multispectral imager with 13 bands (four visible, three red-edge and two near-infrared bands, one water vapor band, and three short-wave infrared bands) that can be used to monitor vegetation, soil and water cover, land cover change, etc. S2 Level-1C with top-of-atmosphere reflectance was used, and they were widely used for crop classification. Sentinel-2 has the advantages of short revisit period, high spatial resolution, large number of bands, and fully open source, which not only allows monitoring seasonal changes in crop growth [23] but also significantly reduces the problem of mixed image elements. A relatively new door has been opened for large-scale plot-level crop mapping.
S2 images from 1 April to 27 October 2022 were selected, and a cloud masking method was used to eliminate the effect of clouds. Clouds are a form of water and have absorption features in the blue and cirrus bands as well as in all visible bands. Therefore, four bands (aerosol band, blue band, green band, and red band) and two spectral indices (normalized moisture index (NDMI) and normalized snow index (NDSI)) were used to detect the cloud pixels in the S2 imagery and remove them [24].
In order to eliminate the effect of the discontinuous time interval of the S2 data caused by varying observation dates from the different orbits of S2, the median value of the S2 observations was selected to generate the final image data across a 10-day interval. Linear interpolation [25] was employed to obtain images covering the whole time period using the 10-day time series. The Savitzky–Golay (SG) filter [26] was then used to smooth the images using a 70-day window and a third-order polynomial. The resultant images were used to calculate the vegetation indices.
2.3. Methods
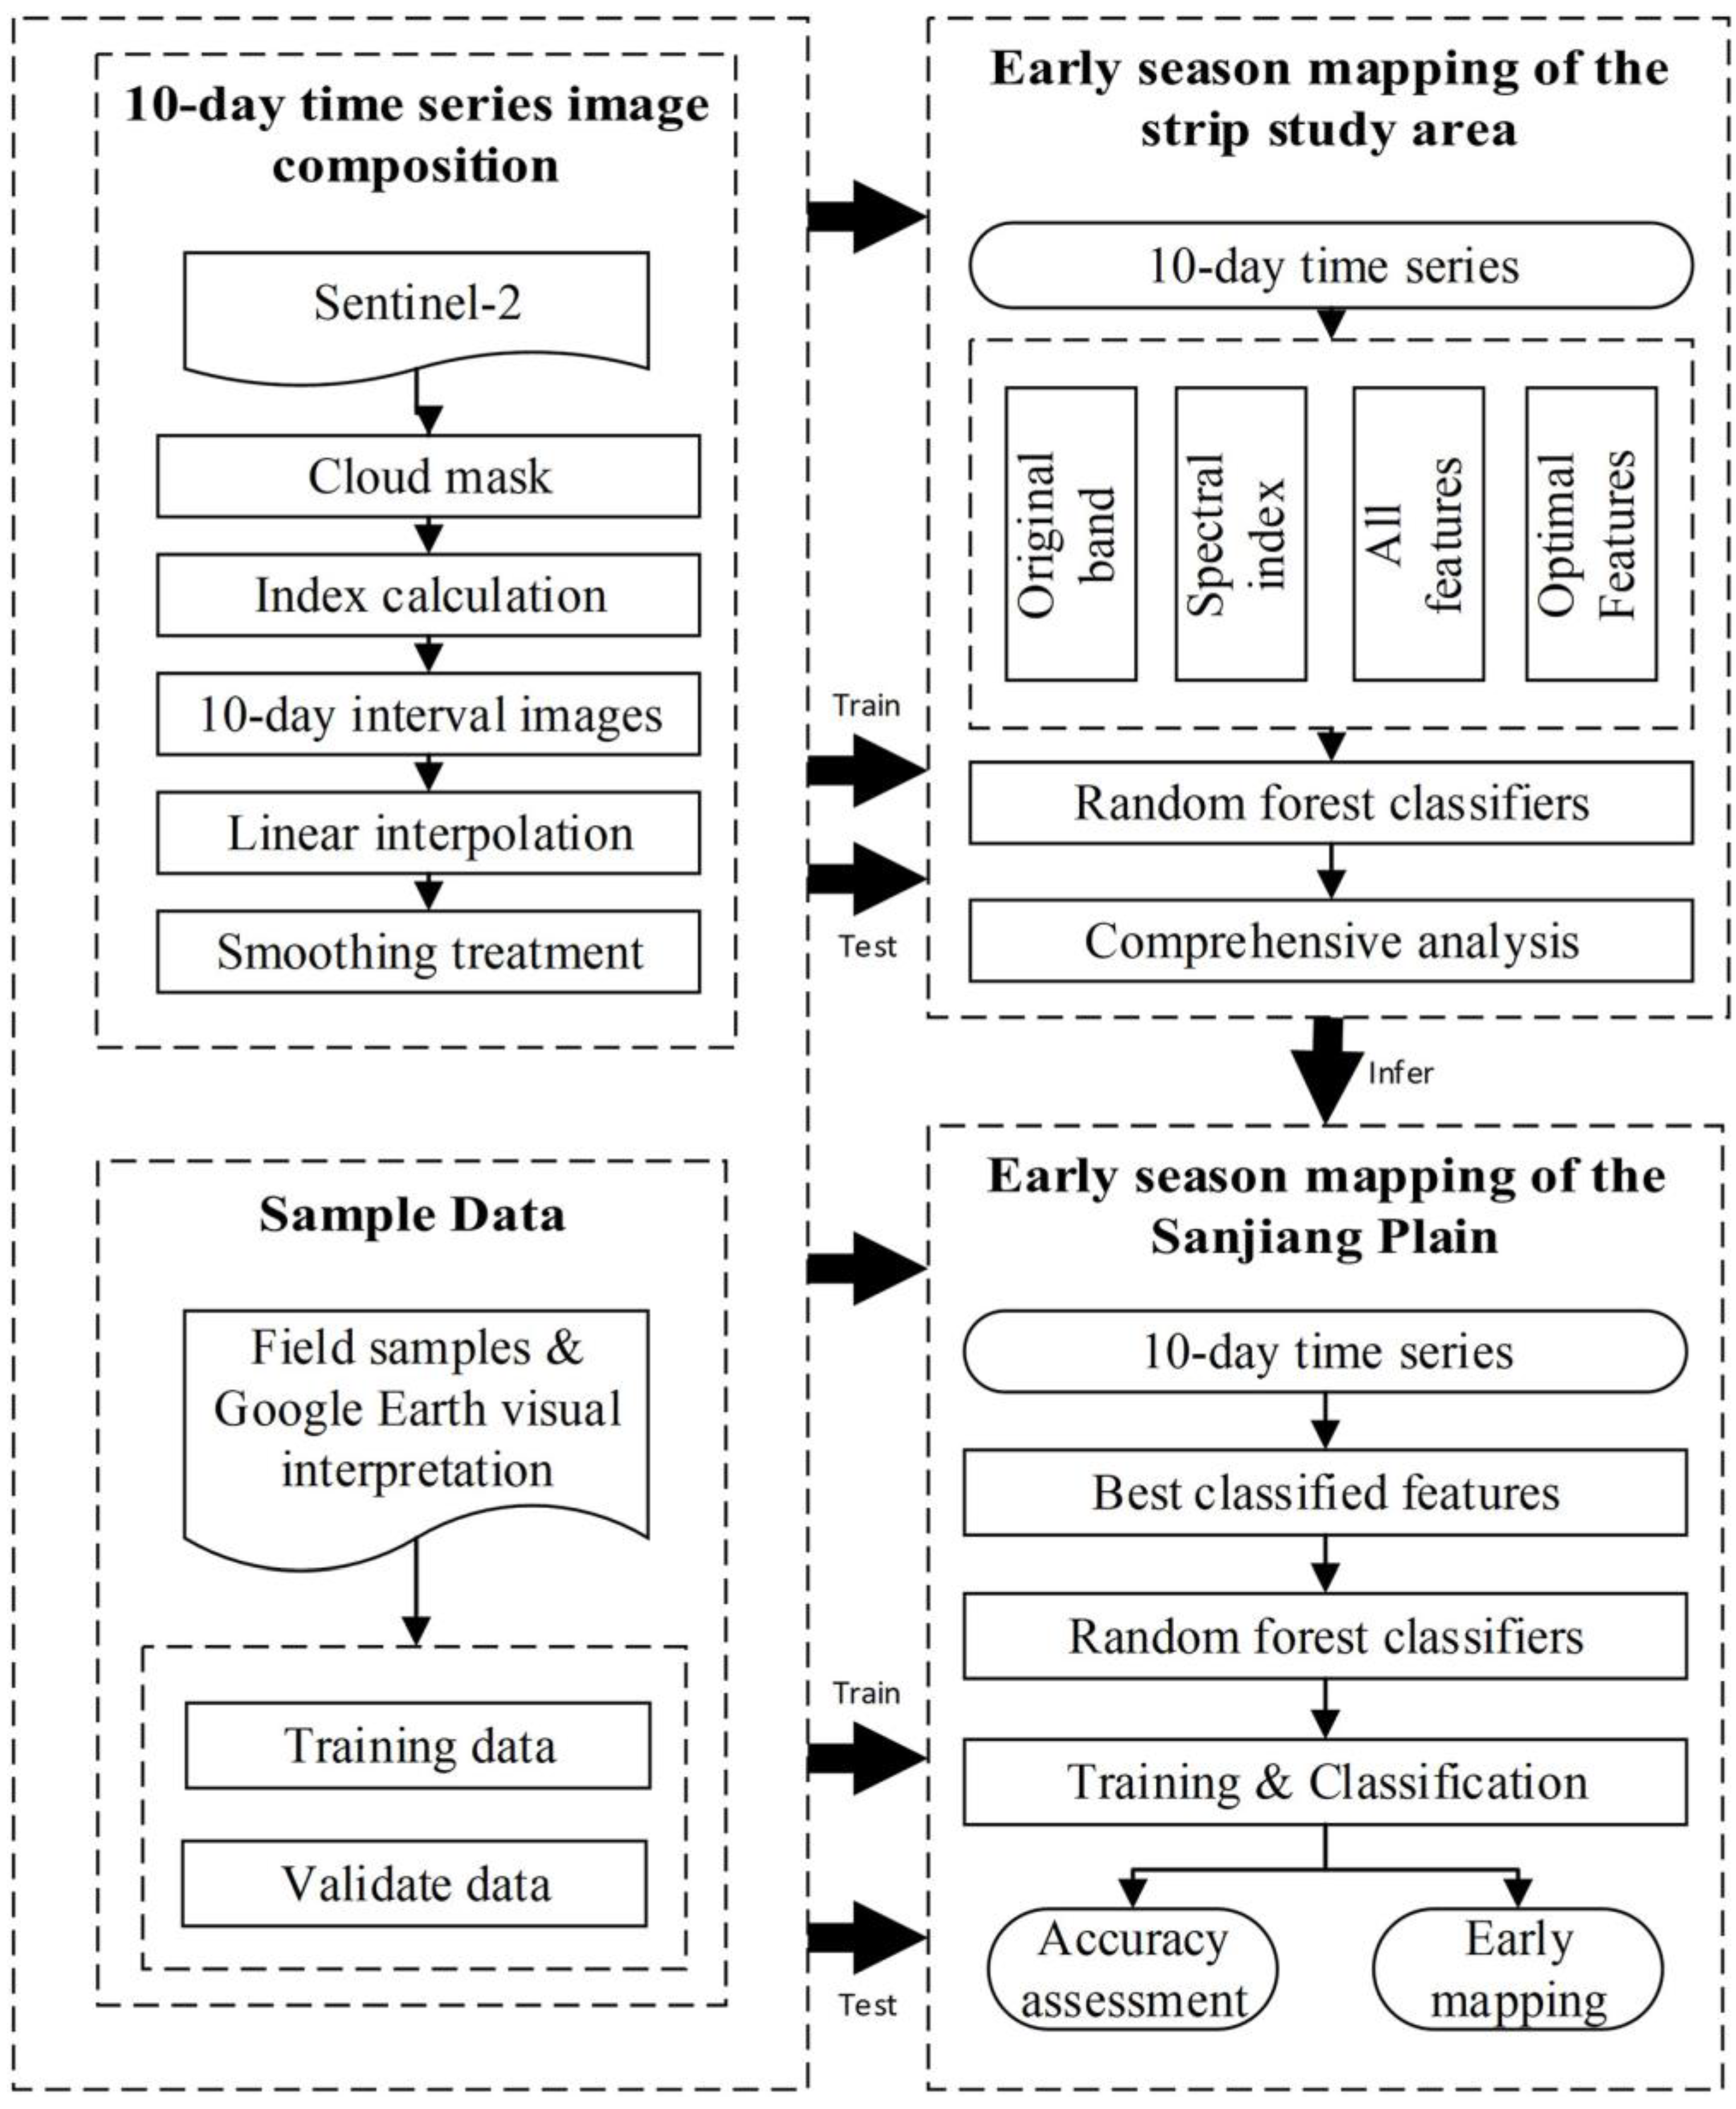
Figure 2 presents the flow chart developed for early-season crop mapping. First, the 10-day time-series images were synthesized with the surveyed ground sample points. The optimal classification scheme for the mapping of the Sanjiang Plain via the strip study area was then determined. Lastly, the early-season mapping was performed for the major crops in the Sanjiang Plain.
2.3.1. Feature Selection
The optimal taxonomic features were obtained by comparing and analyzing four schemes in the strip study area. These features were then applied to the early-season mapping of the Sanjiang Plain. The four schemes are the: (1) original band (F1); (2) spectral index (F2); (3) original band + spectral index (F3); and (4) optimal features (F4).
- Original band
The S2 image has 13 bands, including four visible, three red-edge and two near-infrared bands, one water vapor band, and three short-wave infrared bands. Among them, the blue band is susceptible to soil background and other factors, and it plays a strong role in the differentiation between soil and vegetation. The green is sensitive to different plant types, and it can be used to differentiate between vegetation types. The red band is the main absorption band of chlorophyll, and it is an important indicator of plant vigor status. The red edge band is sensitive to vegetation, and the near-infrared band can reflect the growth of vegetation as well as vegetation cover. The short-wave band can be used to improve the classification recognition of maize and soybean. Therefore, we selected the blue band (blue), green band (green), red band (red), red edge 1 band (red1), red edge 2 band (red2), red edge 3 band (red3), near infrared band (nir), short-wave band 1 (swir1), and short-wave band 2 (swir2).
- 2.
- Spectral indices
Seven spectral indices—Normalized Difference Vegetation Index (NDVI), Enhanced Vegetation Index (EVI), Land Surface Water Index (LSWI), Normalized Differential Senescent Vegetation Index (NDSVI), Normalized Difference Tillage Index (NDTI), Red Edge NDVI (RENDVI) and Red Edge Position (REP) —were selected as input variables. Among them, NDVI and EVI have been widely used to extract temporal features or phenological indicators of different crops [27,28]. LSWI is highly sensitive to water and soil moisture and can be used to identify rice and distinguish between maize and soybean [29]. NDSVI is related to the crop water content, and NDTI is related to crop cover. Thus, these two indices can distinguish between maize and soybean based on phenology [27]. RENDVI and REP can estimate canopy chlorophyll II and nitrogen content using the red-edge band, also aiding to distinguish between maize and soybean [30]. The specific calculation formula is shown in Table 1.
- 3.
- Original band + spectral index
The combination of original bands and spectral indices as classification features provides a large number of input variables to the classifier, allowing it to take full advantage of its own learning ability and improve the classification accuracy. In order to compare and analyze the original band and vegetation index to select the optimal features, we set the weights of all remote sensing features in the original band and vegetation index equally to 1.
- 4.
- Optimal features
The same features at different phenological periods and different features of the same phenological period have varying importance for crop mapping. In order to make full use of remote sensing classification features, this study compares the importance of different time-series remote sensing classification features for crop mapping by random forest importance analysis. The random forest importance analysis measures how much contribution each feature makes in the random forest by using the Gini index and the out-of-bag (OOB) error rate as evaluation metrics. The time series of remote sensing classification features with high importance were selected as the optimal features. A high number of classification features tends to lower the computational efficiency and redundancy of the training results. Therefore, the importance score of remote sensing classification time-series features is normalized, and the advantages and disadvantages of remote sensing classification time-series features with different normalization scores are compared and analyzed to select the optimal remote sensing classification features.
2.3.2. Random Forest
The random forest algorithm is an improved integrated learning method based on the decision tree algorithm, which uses a bootstrap sampling strategy with put-back to generate several independent training sets, and it constructs a decision tree on each training set by randomly selected features or linear combinations of features. Each tree is trained and classified based on a set of random observations, and the results of different classifications are determined by voting using the majority voting method to finally obtain the results of classifying the dataset.
The RF algorithm has the characteristics of fast, easy parameterization and strong robustness. It is proved to be more robust, more accurate and faster than many other classifiers such as maximum likelihood, single decision trees and single-layer neural networks [34]. In addition, the RF classifier is inherently insensitive to data noise, which can mitigate the effect of noise derived from the Top-of-Atmosphere Reflectance in this study to some degree.
2.3.3. Determination of Earliest Identifiable Time for Crops
The field preparation period for the main crops in the Sanjiang Plain is around the 100th day of the year (DOY), and the harvest date is around the 300th DOY. The random forest classifier is used for the classification with the following parameters: (1) numberOfTrees = 100 based on experience (when the number of trees increases, the accuracy rate increases slightly and the computational cost increases linearly [35]); (2) minLeafPopulation = 10 to limit the depth of each tree and avoid overfitting [35]; and (3) the other four parameters, including variablesPerSplit (the number of variables per split, the square root of the number of features by default), bagFraction (the fraction of input to bag per tree, 0.5 by default), outOfBagMode (whether the classifier should run in out-of-bag mode) and seed (random seed), were set by default in the Google Earth Engine. The earliest identifiable time (EIT) for the three crops in the Sanjiang Plain is defined as the first time that the random forest classifier accuracy reaches 90%.
2.3.4. Accuracy Assessment
Five validation metrics, namely the user accuracy (UA), production accuracy (PA), overall accuracy (OA), and Kappa coefficient, are determined by establishing confusion matrices through ground validation points. The validation metrics are defined as follows:
where n_ii is the value of the i-th row and i-th column in the confusion matrix; n_(i·) is the sum of the i-th row in the confusion matrix; n_(·i) is the sum of the i-th column in the confusion matrix; n is the total number of validation samples; and q is the number of rows of the confusion matrix.
The confusion matrix of the strip study area is used to compare and analyze different feature schemes to obtain the optimal classification features for the early-season mapping of the Sanjiang Plain. The confusion matrix of the Sanjiang Plain is employed to verify the results of the early-season mapping of the Sanjiang Plain.
3. Results
3.1. Impact of Different Remote Sensing Classification Features on Early-Season Mapping
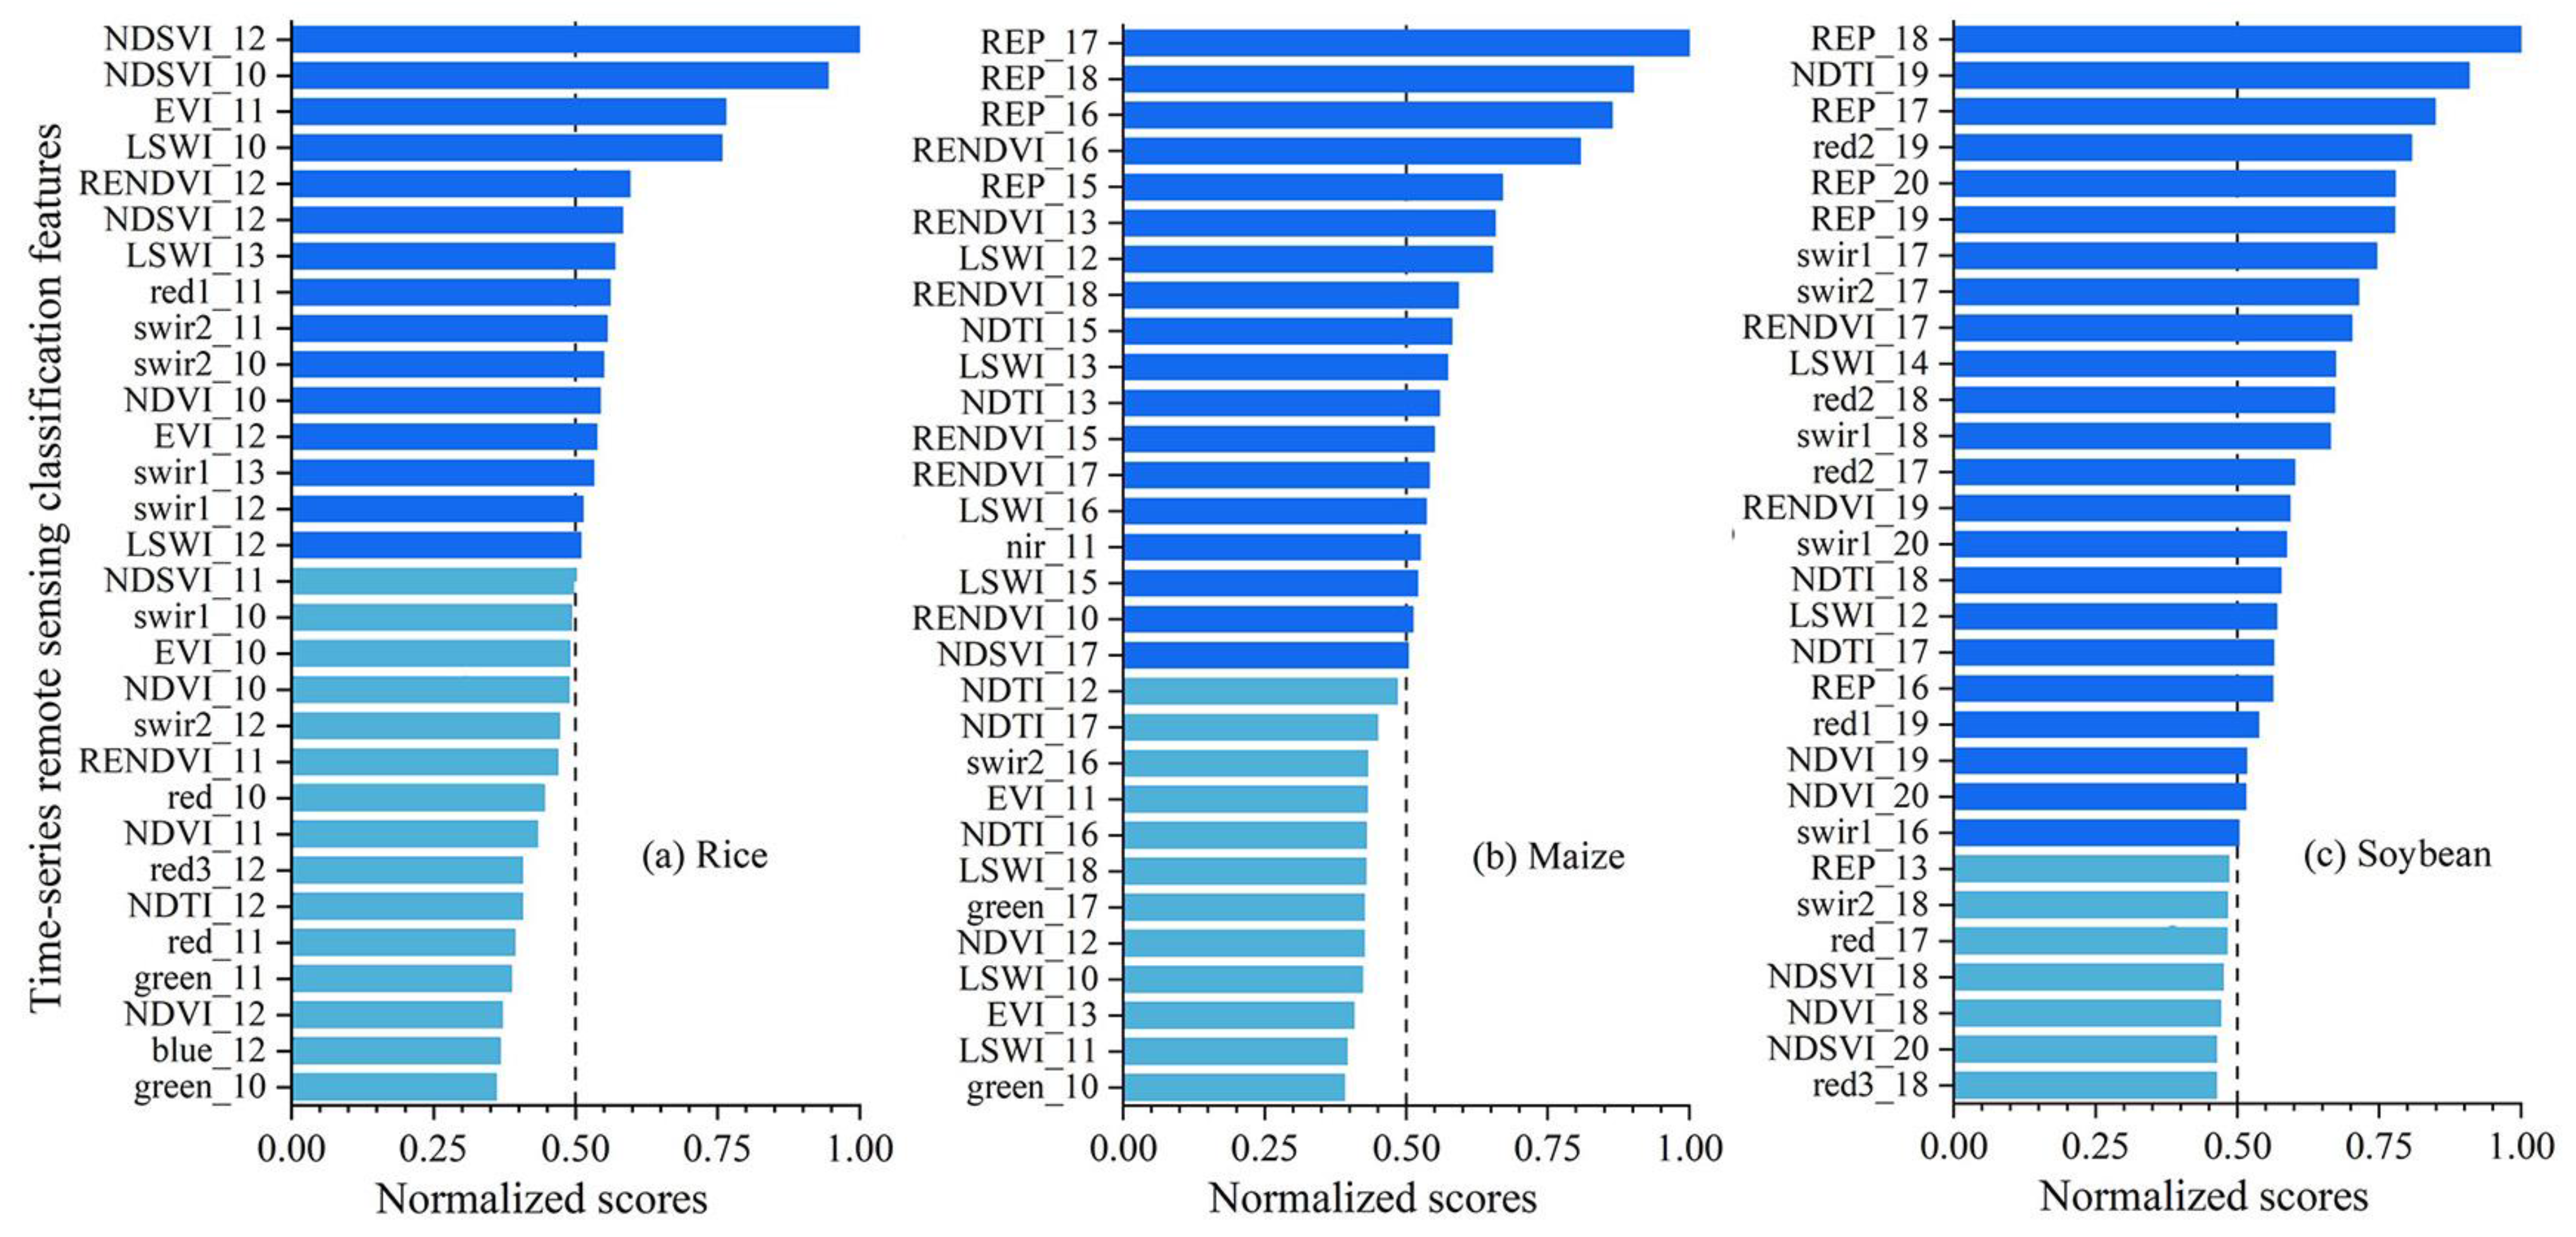
Figure 3 presents the normalized importance scores of different crop remote sensing time-series classification features for rice, maize and soybean at the earliest identifiable time (EIT). NDSVI and LSWI contribute the most to the early-season mapping of rice, and REP is a key taxonomic feature in the early-season mapping of maize and soybean.
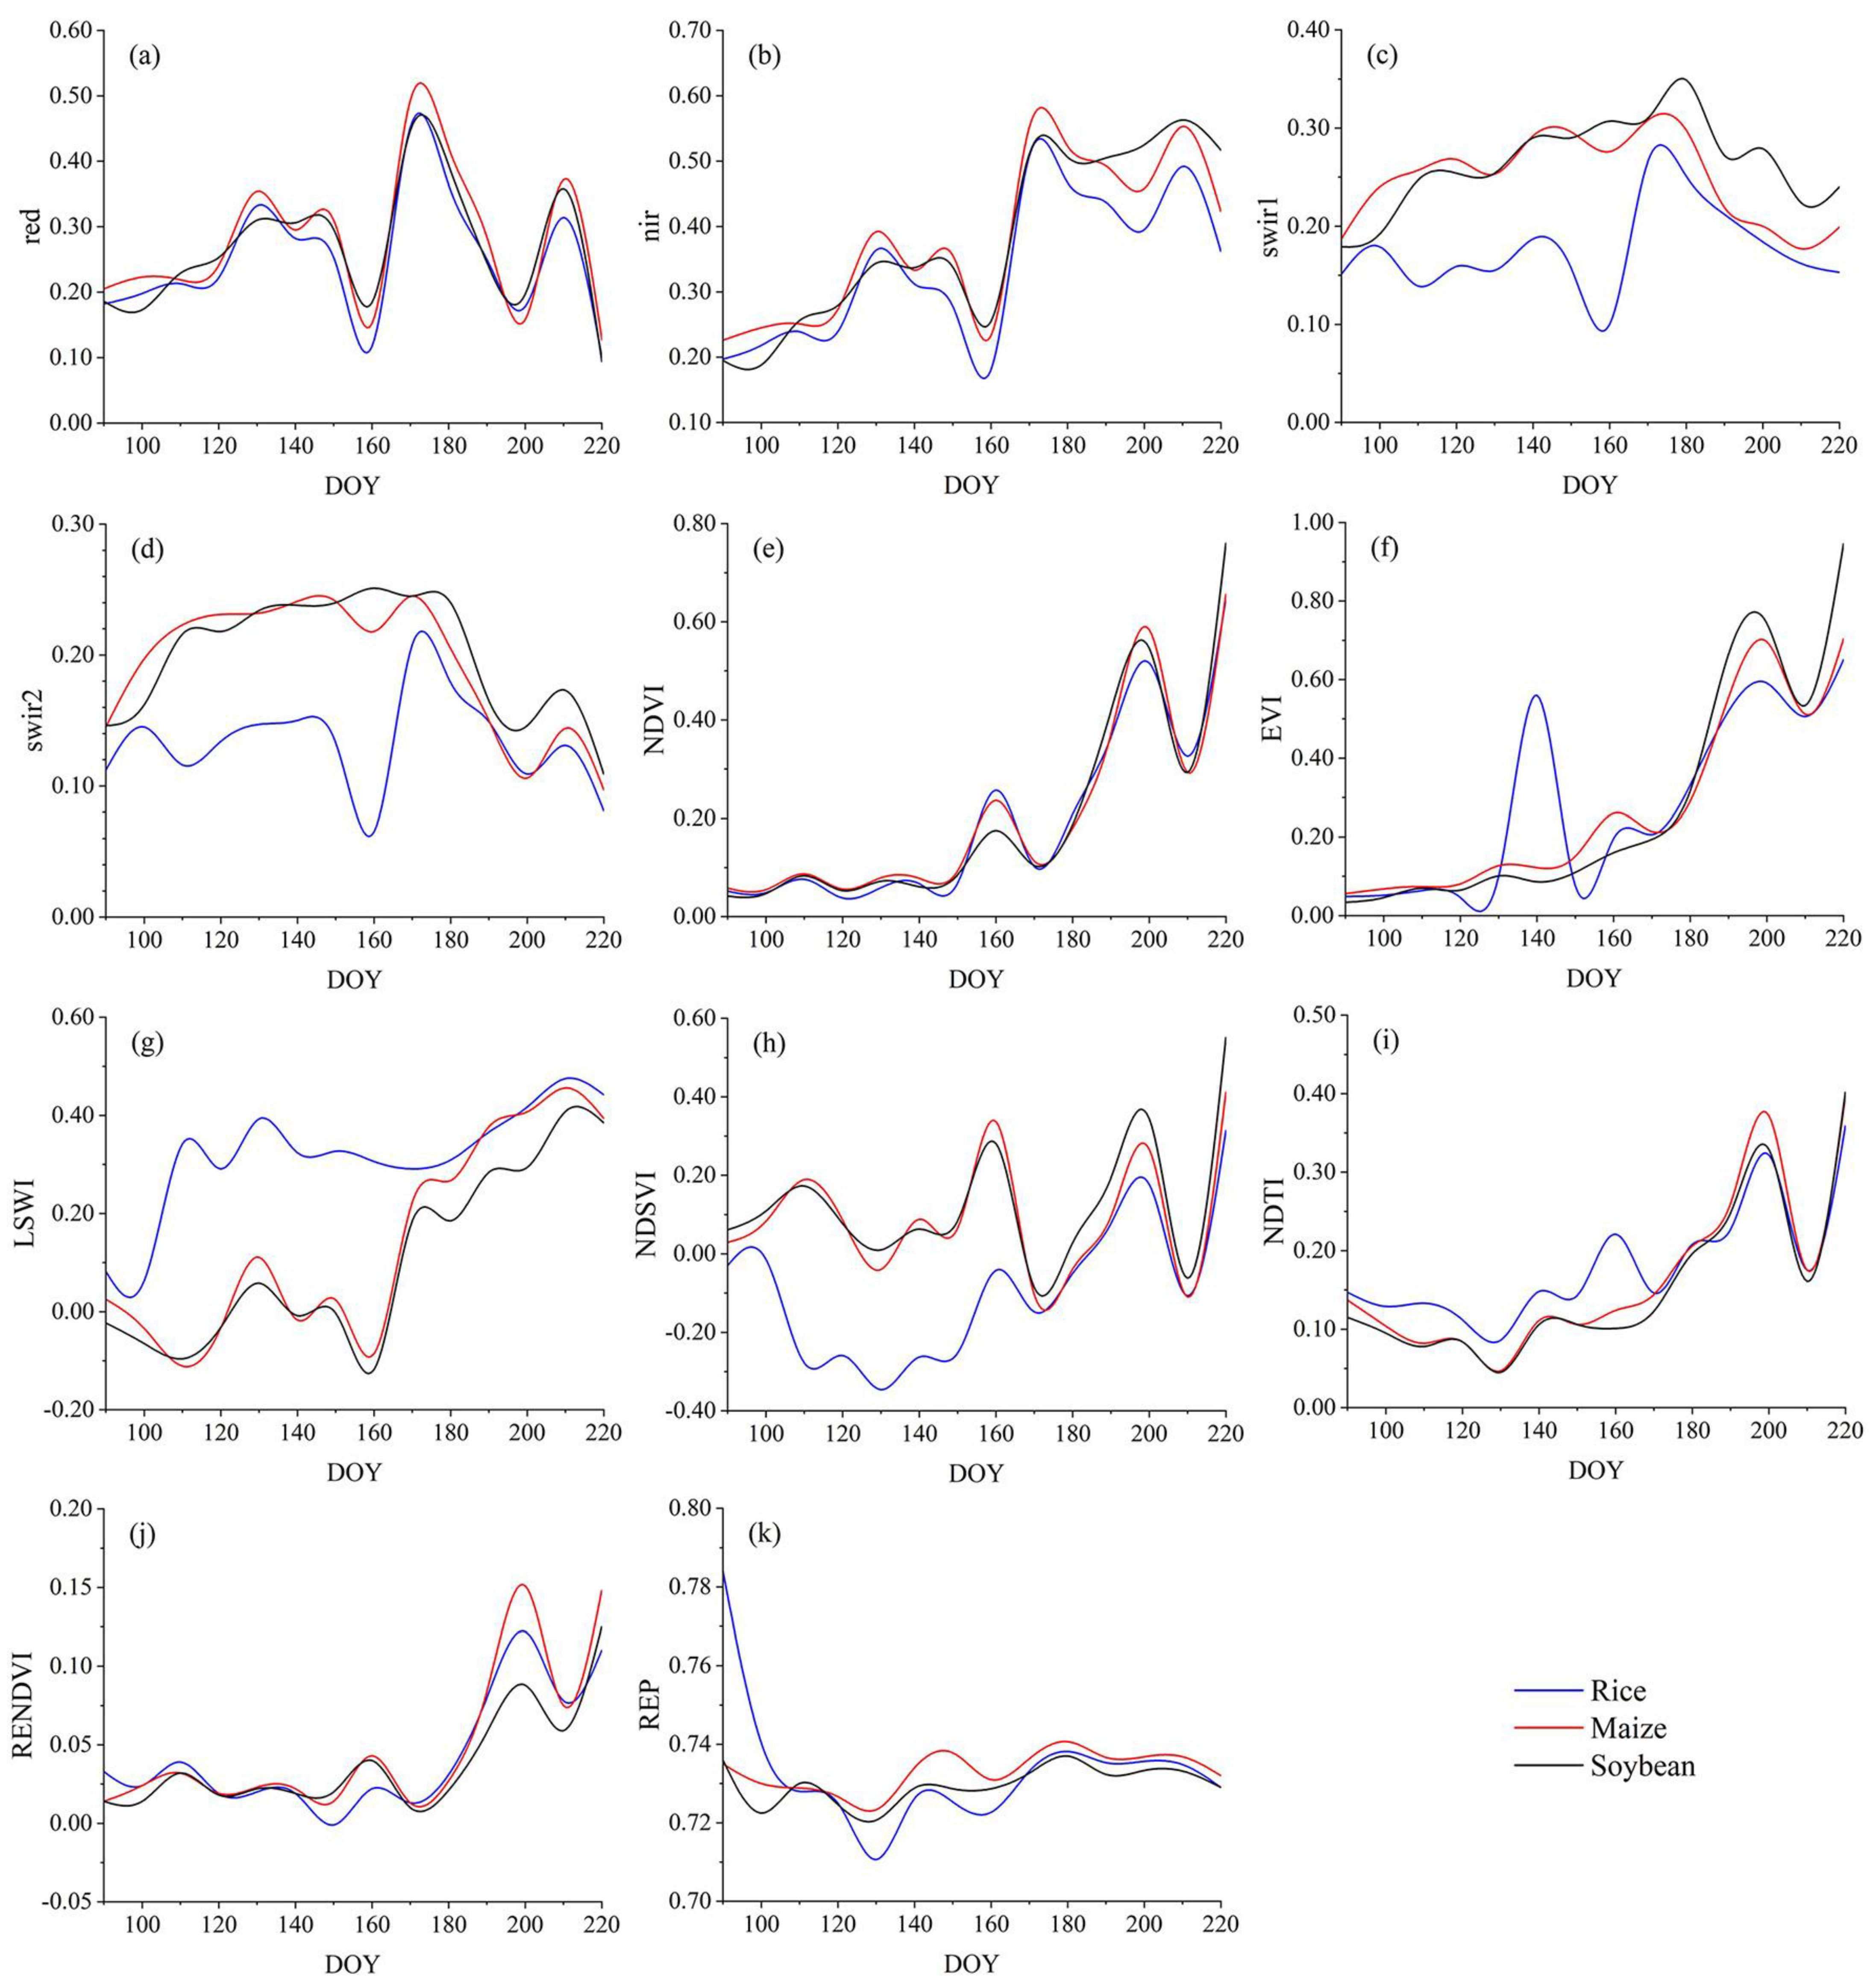
In order to specifically determine which time-series features are applicable to the early-season mapping of different crops, 10-day time-series curves of the different remotely sensed classification features of rice, maize, soybean and other features were plotted (Figure 4). Note that the 10-day time-series curves of other features are not shown in detail as rice, maize and soybean are easily distinguishable from other features. The bands of blue and green have similar trends to the red time-series curves, and red1, red2, and red3 are similar to the nir time-series curves. LSWI, NDSVI, EVI, swir1, and swir2 can distinguish rice from other landcover types. The differences between LSWI and NDSVI are maximized between the 100th and 120th DOY (rice sowing and irrigation transplanting period), which was followed by swir1 and swir2. Although maize and soybean exhibit similar time-series curves, significant changes in REP and RENDVI are observed between the 150th and 180th DOY (maize emergence and nodulation, and soybean seedling and differentiation), with large differences between swir1 and swir2 and between LSWI, NDTI and REP at other times.
In summary, the results reveal that the time-series remote sensing classification features with importance normalization scores greater than or equal to 0.50 for different crops are the most suitable input variables to construct classifiers for the classification process. Therefore, scheme F4 is the time-series remote sensing classification features with importance normalization scores greater than or equal to 0.50. The time-series remote sensing classification features of rice, maize and soybean greater than or equal to 0.50 are colored dark blue in Figure 3, which contains both F1 and F2 features; thus, it includes all the features useful for crop classification.
3.2. Earliest Identifiable Time of Different Crops
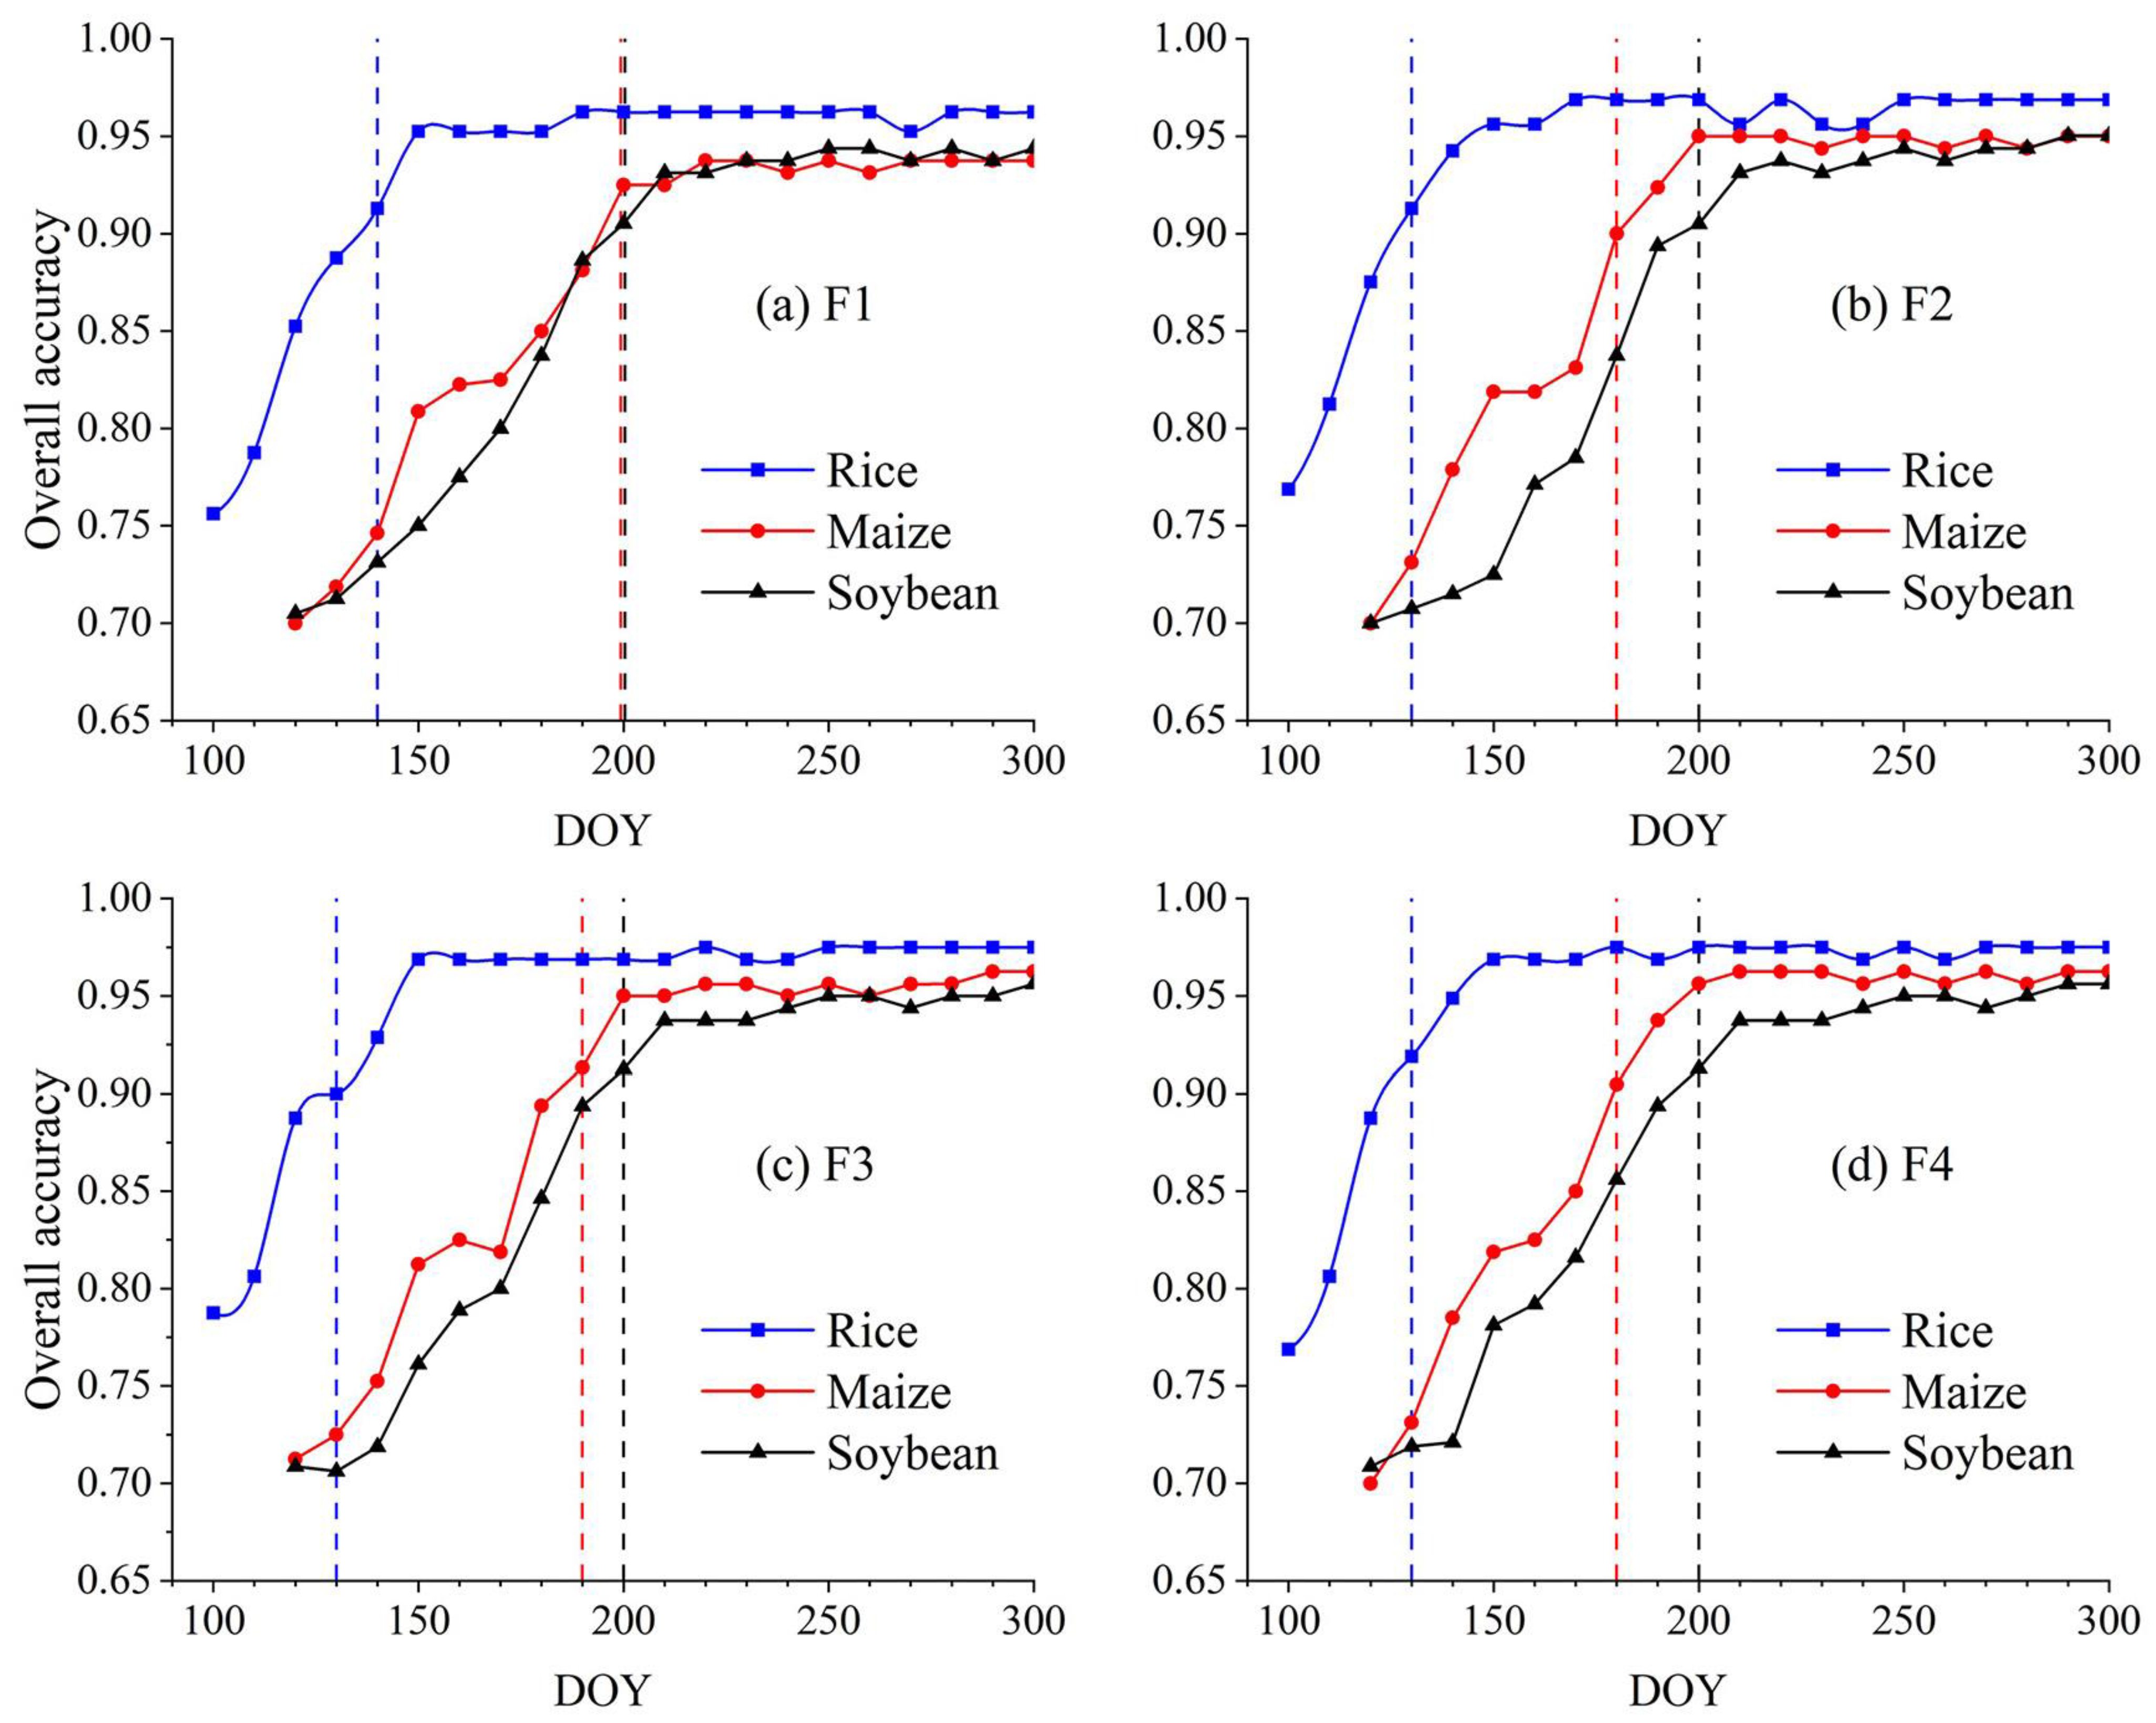
Figure 5 presents the overall classification accuracy under the four scenarios for rice, maize, and soybean for the 100th DOY (10 April) to the 300th DOY (27 October). Rice is the earliest identifiable and has the highest accuracy, while maize and soybean exhibit relatively late earliest identifiable times and have a slightly lower accuracy. The accuracies of corn and soybean exhibit similar upward trends, while the former is slightly more accurate and can be identified first. Among the four scenarios, F4 stands out in early-season mapping. Compared with F4, F1 rice EIT is delayed by 10 days, corn EIT is delayed by 20 days, and soybean EIT is the same. The three crops exhibit the same EIT under F2 and F4, while that of F3 maize is delayed by 10 days (and that of F3 rice and soybean is the same) when comparing with F4. Despite the EIT being the same under F4 and the other schemes, F4 has the highest overall accuracy. Thus, the EIT for rice, maize and soybean was determined based on F4 as the 130th, 180th and 200th DOY, with a 91.9%, 90.5% and 91.3% overall accuracy, respectively. This is approximately 4 months earlier for rice and 2 months earlier for maize and soybean compared with the crop-harvesting period.
This study defines the EIT as the first time that the overall accuracy of the crop classification reaches more than 90%. However, other studies adopt different overall accuracies. Therefore, we also report the time to first reach 80–95% overall accuracy for different crops in Table 2. Rice can reach more than 80% accuracy at the 110th DOY, while maize is observed to be relatively late to reach more than 80% accuracy (at the 150th DOY). Identifying soybean proves to be more difficult, reaching more than 80% accuracy at the 170th DOY. In contrast, rice is relatively easy to identify, and its accuracy can reach more than 95% at the 150th DOY.
3.3. Early-Season Mapping of the Sanjiang Plain and Best Classification Features
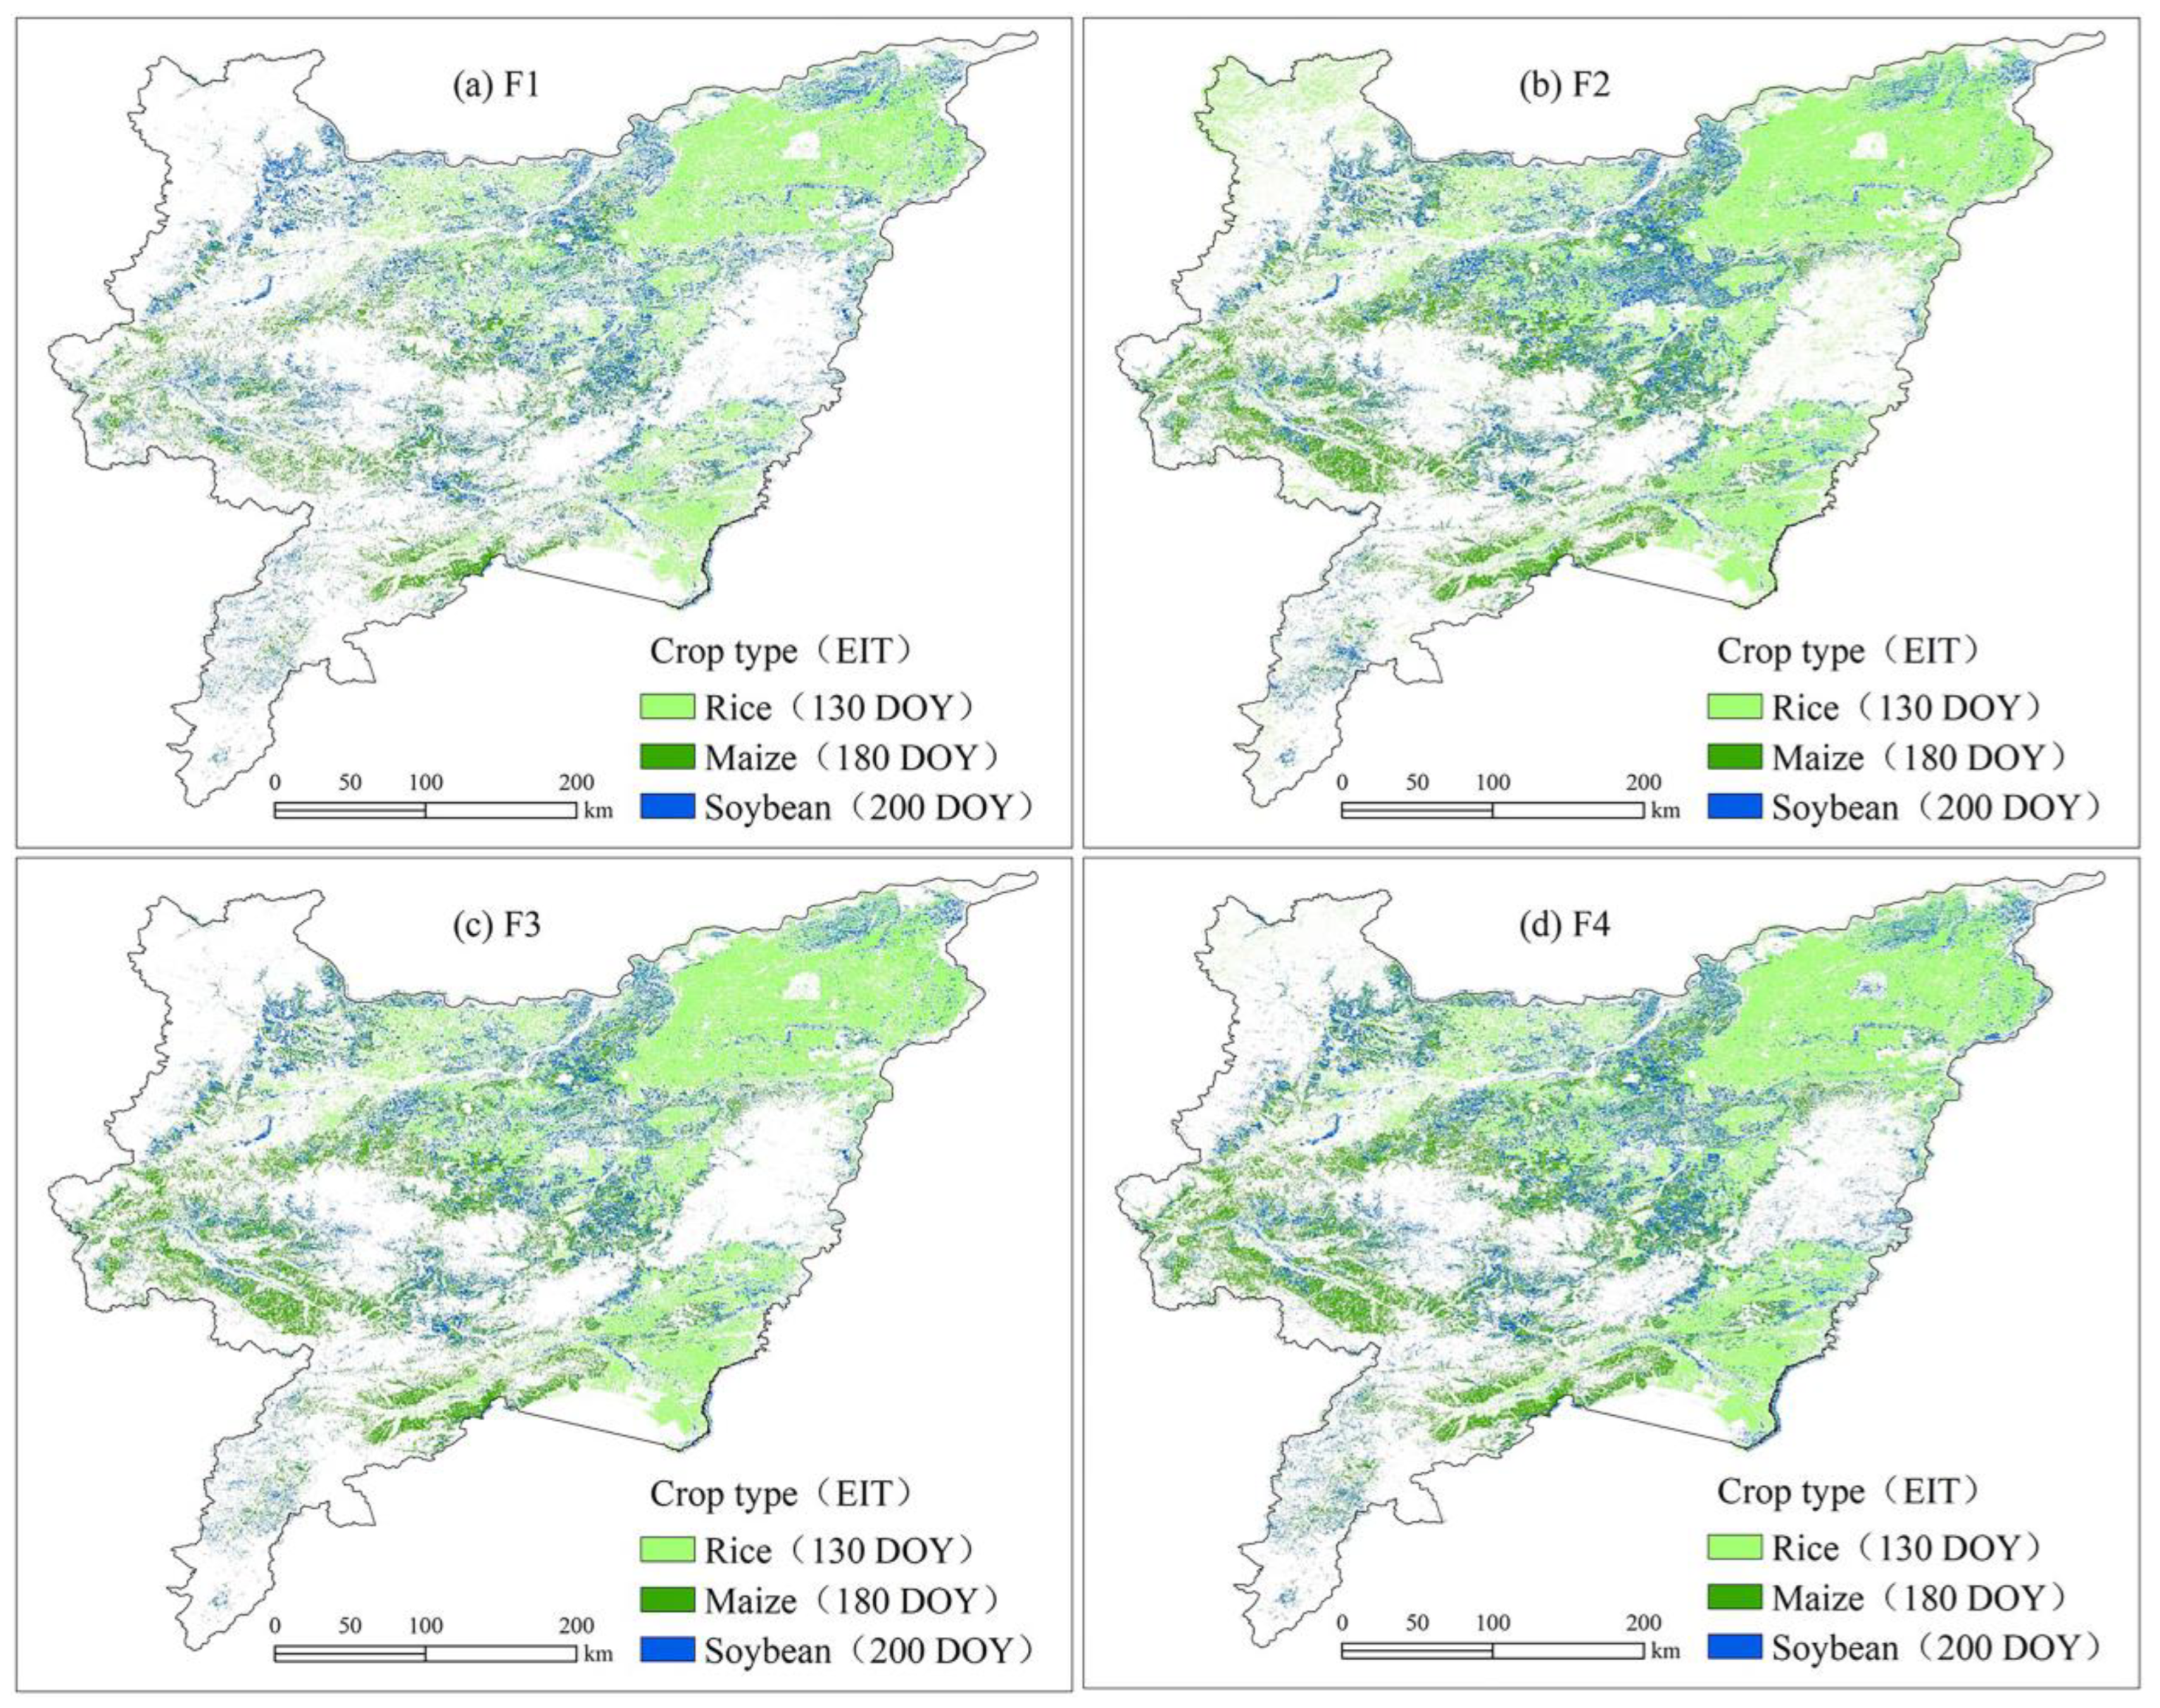
Based on schemes F1, F2, F2 and F4 for the classification in the Sanjiang Plain, the differences between the classification results and the striped study area were small and met the requirements for early-season mapping application. The differences between the rice and soybean classification results are the greatest, with the accuracy in the Sanjiang Plain approximately 15% lower than that in the strip study area. The maize classification differences are slightly smaller, fluctuating around 1% (Table 3). Figure 6 presents the classification results of different schemes for three crops in the Sanjiang Plain. The classification of rice is more accurate in the eastern part of the Sanjiang Plain, which was followed by the western region. The classification of maize exhibits less spatial variation, while that of soybean is more accurate in the central part of the Sanjiang Plain.
Scheme F4 is able to select the most suitable classification features by random forest importance analysis, taking the best and discarding the worst features. This not only improves the overall classification accuracy but also reduces the redundancy of the calculation results due to the extensive amount of data for large areas. Thus, F4 outperforms the other feature schemes in early-season mapping; it has the highest overall classification accuracy and optimizes the spatial distribution of the classification results. Therefore, we conclude that F4 is the best classification feature for the early-season mapping of major crops in the Sanjiang Plain.
4. Discussion
4.1. Factors Influencing Early Crop Mapping
A number of potential uncertainties can affect the accuracy of early-season crop mapping. First, whether or not satellite data are affected by clouds determines to a large extent the effectiveness of monitoring seasonal changes in crop growth [36]. Second, using linear interpolation based on adjacent pixels to fill missing values in time-series remote sensing images [37], the interpolation does not effectively reflect the true information of crop growth when high-quality observations are missing at the peaks (valleys). In this study, a special cloud-masking method is used to eliminate the influence of clouds to the maximum extent, and a Savitzjy–Golay (SG) filter is applied to smooth the time-series images to weaken the negative effects caused by linear interpolation. In addition, the optimal features are selected for training classification through feature filtering to minimize the impact of potential uncertainties on the accuracy of early-season mapping.
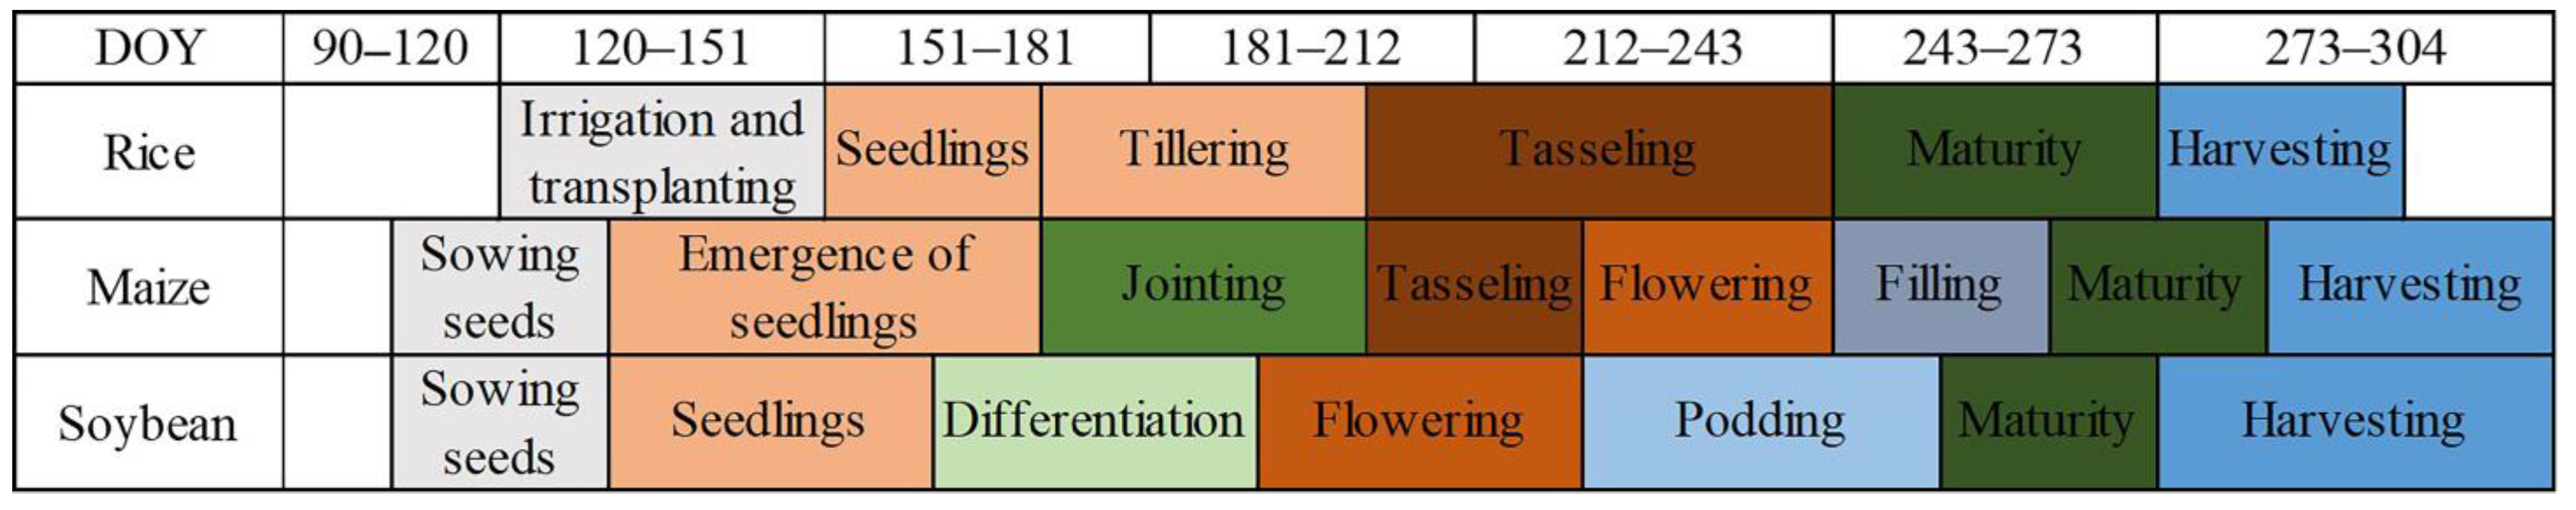
The number of remotely sensed classification features is critical for early mapping. A study used only three vegetation indices to construct time series for the early mapping of Heilongjiang crops using random forest [38]. Compared with them, since this study increases the number of remotely sensed classification features and selects features of high importance as input variables, the earliest identifiable time in this study was 10–20 days earlier, and the overall accuracy of this study was slightly higher at the same time. Therefore, many efforts have been devoted to exploring the importance of remotely sensed classification features in the classification of different crops [39,40,41]. However, the current study mainly focuses on the separability between remote sensing classification features and ignores the contribution of remote sensing classification features. By selecting the optimal classification features through random forest importance analysis, a higher classification accuracy can be achieved with fewer classification features, while computational complexity and time costs are also reduced. The optimal features of rice, maize and soybean were obtained respectively, achieving promising results in early mapping. In particular, rice is best distinguished from other features between the 120th and 150th DOY (irrigation and transplanting period). During this time, rice is subjected to irrigation and transplanting, and rice fields are covered with water, while maize and soybean are in the planting and seedling period with low vegetation cover. Maize can be easily identified between the 170th and 200th DOY (pulling stage), when the leaves become wider and plants have 7–9 leaves. This corresponds to the tillering stage of rice and the differentiation and flowering stage of soybean, and the vegetation cover of forest is higher than that of maize. Since maize and soybean have similar spectral features, it is generally difficult to distinguish between them [42,43]. However, individual spectral features from the 170th to the 210th DOY (jointing stage) produce differences, also for the differentiation of crops, and consequently, the overall accuracy of soybean improves rapidly. In particular, the largest differences in spectral features between soybean and maize are observed at the 200th DOY, when soybean and maize are at the flowering and tasseling stages, respectively (Figure 7).
4.2. Comparison of Early and Post-Season Crop Mapping
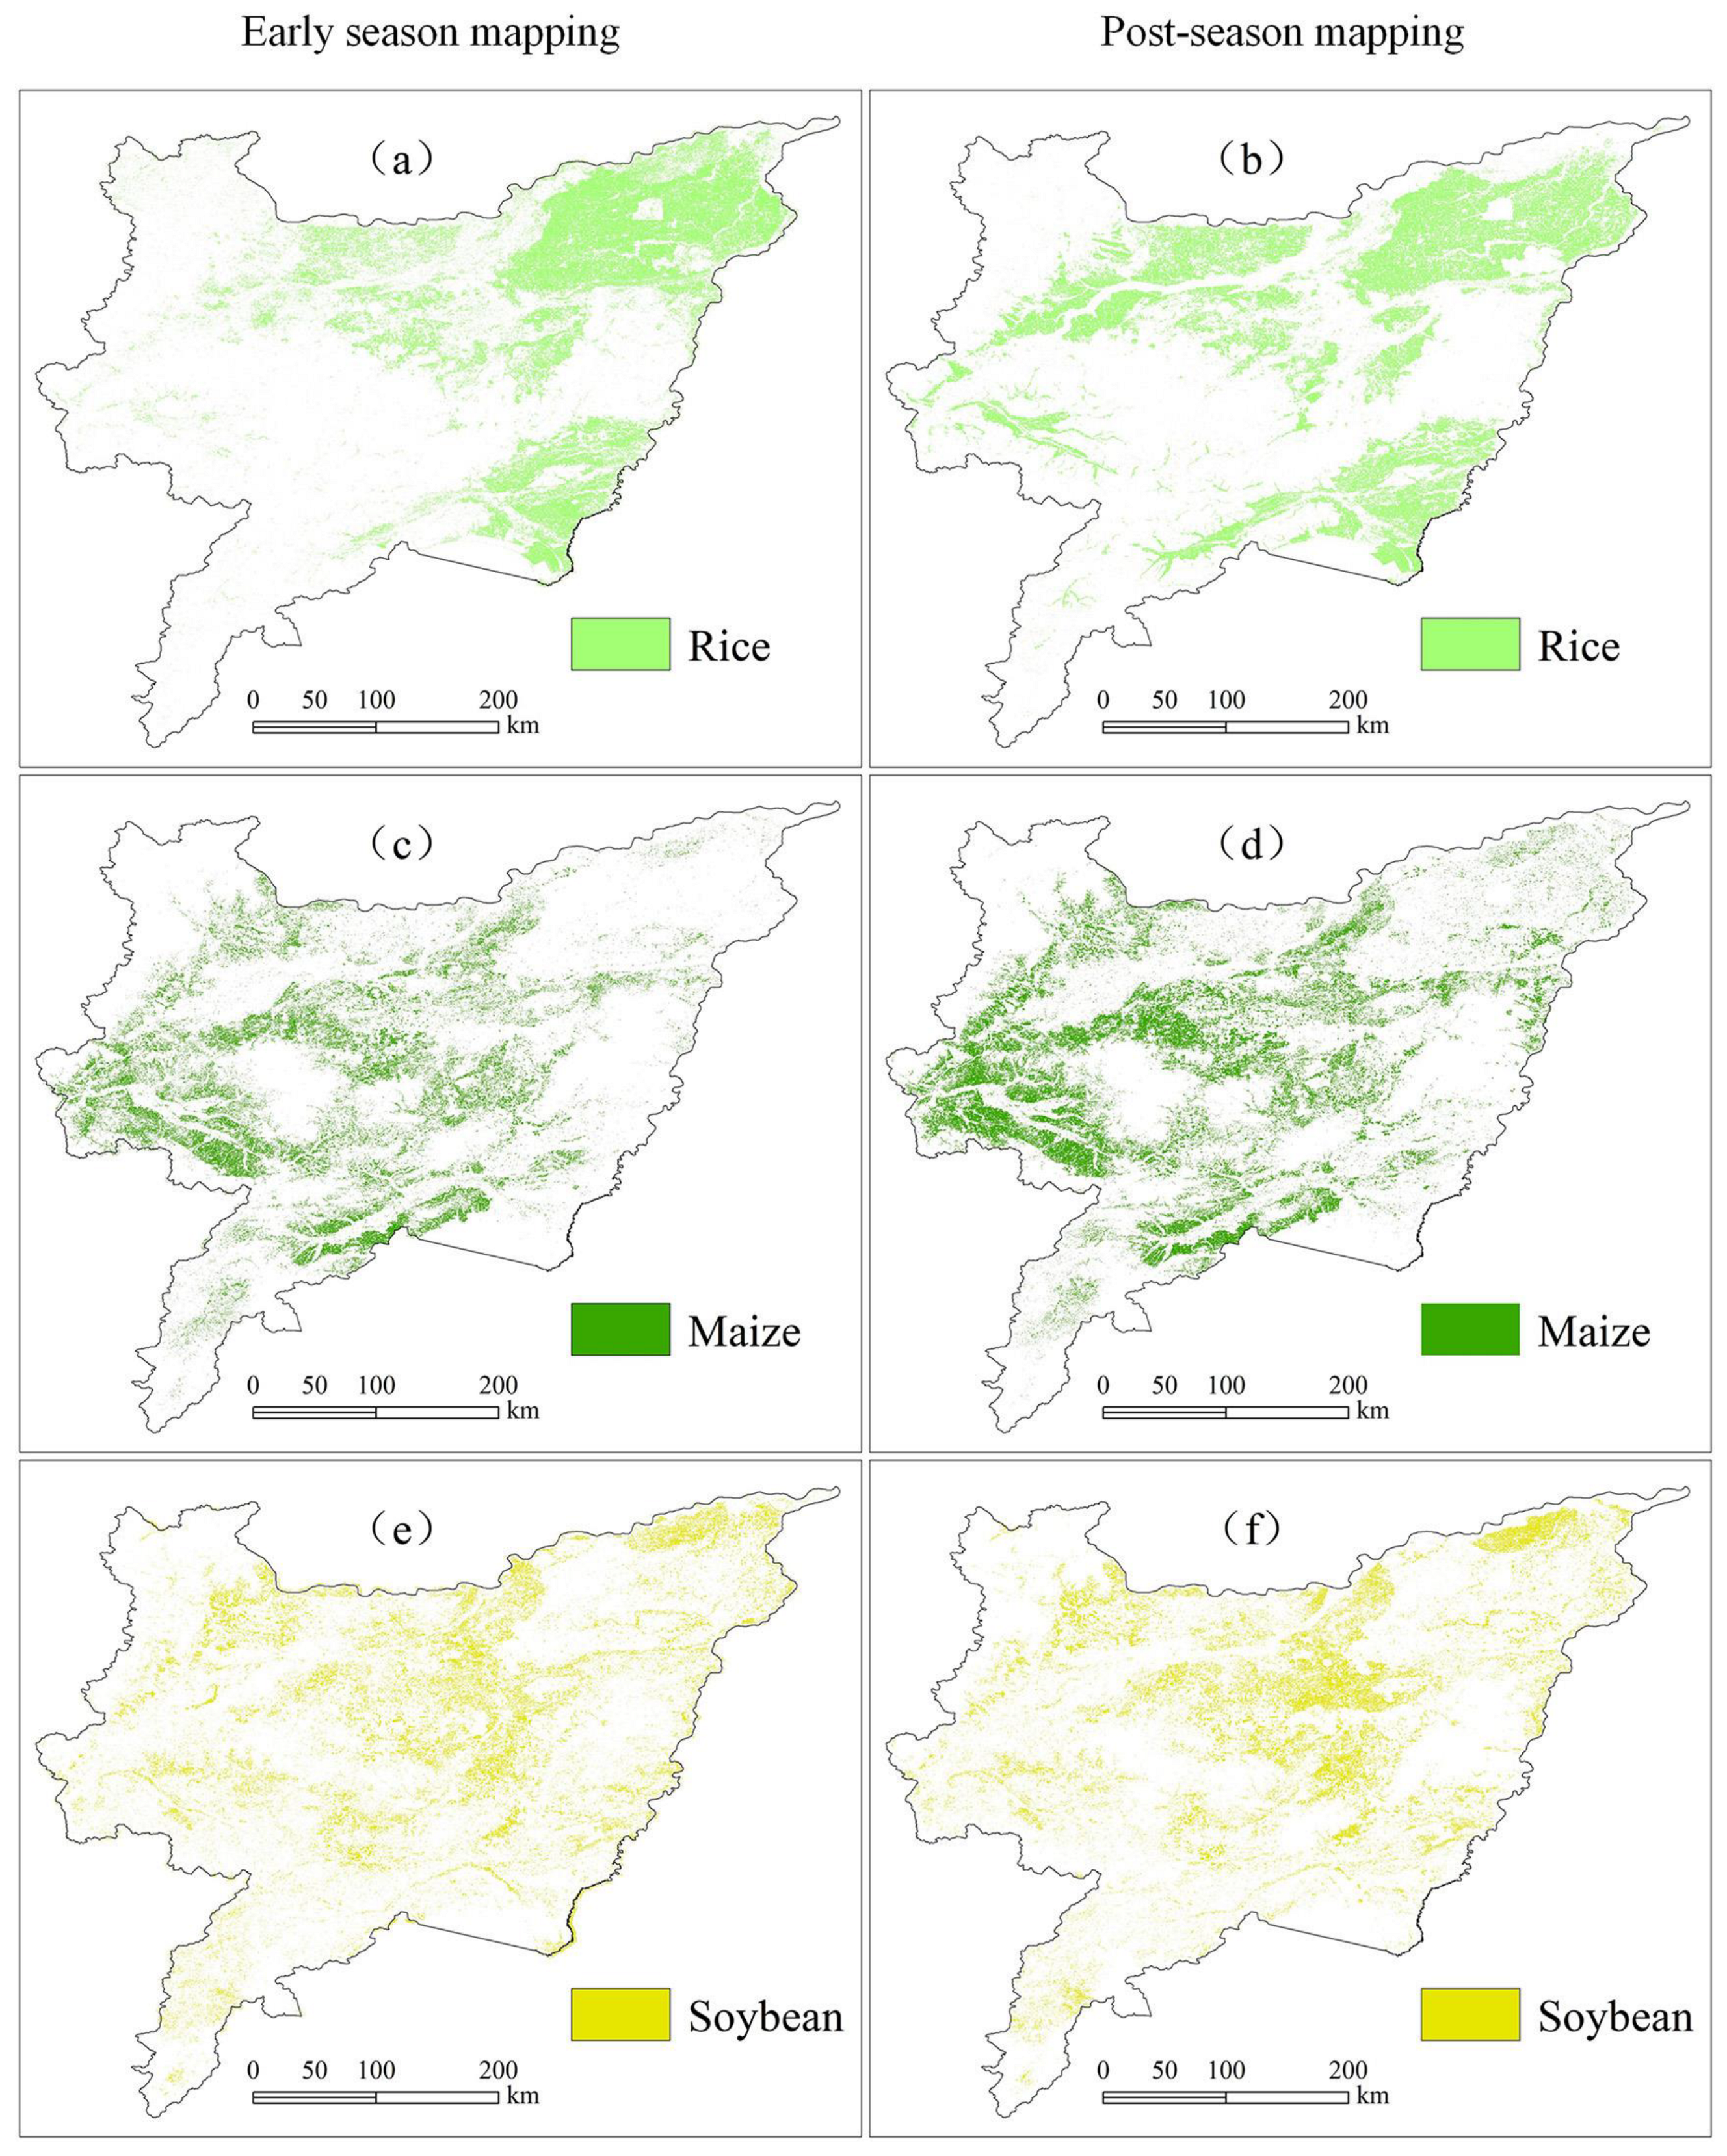
Early-season mapping uses imagery from just the early and middle stages of the crop-growing season, while post-season mapping is generated using all available images and samples for the year. As the length of the time series increases, the overall accuracy of the early-season mapping increases simultaneously. Therefore, there is a trade-off between timeliness and accuracy for early-season mapping. In order to further assess the accuracy of early-season crop mapping, we compared the results of early crop mapping with those of post-season mapping. The spatial distribution of crops was observed to be almost identical, with the early-season mapping exhibiting higher instability (Figure 8). Due to the limited number of original remote sensing images available for early-season mapping, there are more time periods with missing images in some areas. This consequently lowers the accuracy of the time series determined from the early remote sensing images and a high instability of the classification results. Furthermore, the uneven distribution of samples also enhances the classification instability.
The overall accuracy of the early-season mapping is lower than that of the post-season mapping, and the differences vary among the classification schemes (Table 4). F1 exhibits the greatest variations and only contains a few important remotely sensed classification features. The differences between F2 and F3 are smaller, and they possess more critical and non-critical remote sensing classification features, which lowers the classification accuracy caused by over-prediction. The F4 scheme is observed to have the lowest variation, and the random forest importance analysis filters out the most suitable remote sensing classification features for classification, avoiding classifier prediction errors. The overall accuracy differences between early and post-season mapping differs among crops, with rice showing the greatest differences, which is followed by maize and soybean. The rice classification employs the least amount of remote sensing images and thus has the highest instability compared to soybean and maize.
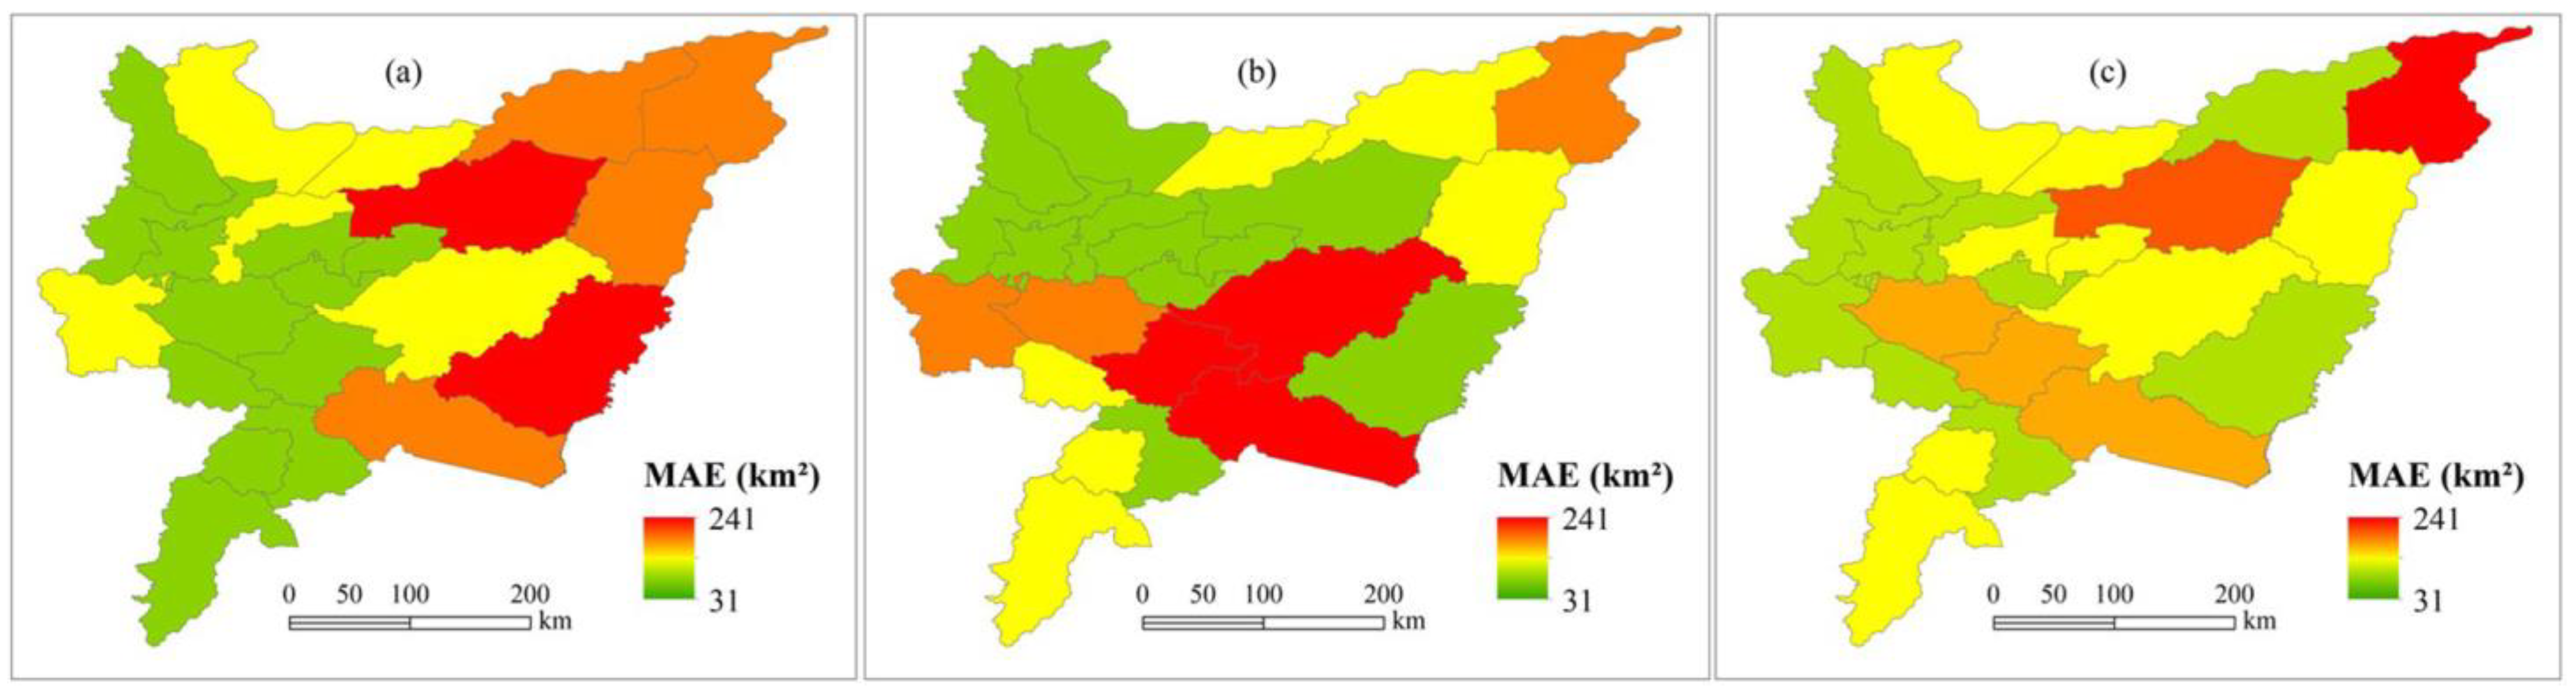
The distribution of early mapping and post-season mapping inconsistency varied among the three crops, with rice inconsistency mainly distributed in the eastern part of the Sanjiang Plain, maize in the southwestern part of the Sanjiang Plain, and soybean in the northern part of the Sanjiang Plain (Figure 9). The spatial heterogeneity of this bias in early mapping was mainly due to the different distribution of rice, maize and soybean cultivation areas in the Sanjiang Plain, which is followed by the uneven distribution of selected sample points. In addition, since early-season mapping uses imagery from just the early and middle stages of the crop-growing season, it is more susceptible to environmental factors. Subsequent studies may consider adding crop texture features or terrain factors to improve the stability of early-season mapping.
4.3. Application of Early Classification
The early classification method developed in this study can be applied to rice, maize, and soybean in other regions. However, the remote sensing variation varies with the different crop growth environments and agricultural management practices, and thus, the direct migration of classifiers is prone to errors. The addition of other classification features to the classifier, such as climatic variables and crop texture information, can reduce the impact of differences in the growing environment and agricultural management practices on the classifier accuracy. The early classification framework proposed in this study can be useful for early-season mapping of other crop types. It is important to note that the phenological period, sample information, and taxonomic features vary widely among crops.
Food scarcity remains a major problem for many countries. Based on early crop mapping information, areas at risk of severe food crises can be identified in a timely manner, allowing for advanced responses. The early warning of food crises has important implications for agricultural market monitoring and early warning systems. As major commodity crops, obtaining crop acreage prior to harvest for rice, maize and soybeans is of profound importance in predicting food prices. This timely information also helps to manage food price fluctuations in domestic and international markets [27].
4.4. Limitations and Expansions of Early-Season Mapping Methods
Although our proposed early-season mapping method has achieved satisfactory results, it has limitations. We only selected remote sensing time-series classification features, ignoring geographic classification features and meteorological classification features. Only one year of the early maps for 2022 was produced, ignoring the influence of factors such as climate and cropping patterns in different years on early mapping. Therefore, our next effort will be to make full use of the classification features of different types and pay more attention to the differences of early mapping in different years. We also used only one S2 satellite data, so we could only construct time-series images with 10-day intervals. The S2A and S2B satellite data can be used to construct 5-day time-series images, which can provide better and richer remote sensing time-series classification features. This improves the accuracy of early mapping.
The random forest classifier is overly dependent on samples, and the quality and spatial distribution of the samples directly determine the accuracy of the classification accuracy. It also has problems such as a high memory consumption of computational resources, not being easy to interpret, easy to overfit and weak to handle discrete features. Therefore, in practice, improvements and optimizations need to be made on a case-by-case basis. In this study, for feature selection, importance analysis is used to select the optimal features to reduce the number of features in order to improve the training efficiency and accuracy of the random forest. The number of features can also be reduced by other more efficient feature selection algorithms. For example, Nanshan You [24] et al. designed a sophisticated feature selection procedure to obtain the optimal cropland/crop features from the large size of feature candidates, which was based on the two criteria: (1) the important features with high separability among different classes should be retained; and (2) the collinearity of each pair of selected features should be relatively low to avoid redundancy [44].
5. Conclusions
We obtained the most suitable early classification features for the Sanjiang Plain through the analysis of several classification schemes of remote sensing classification features. A random forest classifier was trained based on 10-day time series of S2 remote sensing images and ground sample data to investigate the earliest identifiable time (EIT) of three major crops in the Sanjiang Plain. Remote sensing classification features were analyzed using random forest importance and normalized to select those greater than or equal to 0.50, revealing a strong performance for early crop mapping. Rice was first identified at the 130th DOY (irrigated transplanting stage), and maize and soybean were identified at the 180th (nodulation stage) and 200th DOY (flowering stage), respectively. The optimal features scheme, which aggregates all the dominant remote sensing classification features and excludes the inferior remote sensing classification features, exhibited the highest overall classification accuracy, with a delay of approximately 10–20 days per 5% improvement. This scheme also demonstrated the ability to improve the classifier computational efficiency and avoid the redundancy of the computational results. Compared with the post-season mapping, the overall accuracy difference of the early-season mapping in this study is not significant and can reach more than 90%. This study can therefore provide important information for crop yield prediction and growth monitoring and for ensuring food security. The early-season mapping method we developed can also provide ideas for other regions.
Author Contributions
Data curation, S.Q. and C.N.; Formal analysis, P.W., H.Y. and L.S.; Investigation, P.W., S.Q., C.N. and B.Z.; Methodology, P.W. and S.Q.; Supervision, R.L. and S.H.; Validation, P.W.; Writing—original draft, P.W.; Writing—review and editing, P.W. and H.Y. All authors have read and agreed to the published version of the manuscript.
Funding
This project was financially supported by the National Natural Science Foundation of China (42001384), the Strategic Priority Research Program of the Chinese Academy of Sciences (XDA28100500), the Provincial Scientific Research Service Expense Project (CZKYF2021-2-B010), the Youth Innovation Promotion Association CAS (2021119) and the Future Star Talent Program of Aerospace Information Research Institute, Chinese Academy of Sciences (2020KTYWLZX08), the Basic Research Programs of Shanxi Province (202203021211139, 202103021224118), the Research Project Supported by Shanxi Scholarship Council of China (2021-062).
Data Availability Statement
Data will be made available on reasonable request.
Conflicts of Interest
The authors declare no conflict of interest.
References
- Lu, Q.; Liang, F.; Bi, X.; Duffy, R.; Zhao, Z. Effects of urbanization and industrialization on agricultural land use in Shandong Peninsula of China. Ecol. Indic. 2011, 11, 1710–1714. [Google Scholar] [CrossRef]
- Tan, S.; Liu, J.; Lu, H.; Lan, M.; Yu, J.; Liao, G.; Wang, Y.; Li, Z.; Qi, L.; Ma, X. Machine Learning Approaches for Rice Seedling Growth Stages Detection. Front. Plant Sci. 2022, 13, 914771. [Google Scholar] [CrossRef]
- Song, X.-P.; Potapov, P.V.; Krylov, A.; King, L.; Di Bella, C.M.; Hudson, A.; Khan, A.; Adusei, B.; Stehman, S.V.; Hansen, M.C. National-scale soybean mapping and area estimation in the United States using medium resolution satellite imagery and field survey. Remote Sens. Environ. 2017, 190, 383–395. [Google Scholar] [CrossRef]
- Teluguntla, P.; Thenkabail, P.S.; Oliphant, A.; Xiong, J.; Gumma, M.K.; Congalton, R.G.; Yadav, K.; Huete, A. A 30-m landsat-derived cropland extent product of Australia and China using random forest machine learning algorithm on Google Earth Engine cloud computing platform. ISPRS J. Photogramm. 2018, 144, 325–340. [Google Scholar] [CrossRef]
- Franch, B.; Vermote, E.F.; Becker-Reshef, I.; Claverie, M.; Huang, J.; Zhang, J.; Justice, C.; Sobrino, J.A. Improving the timeliness of winter wheat production forecast in the United States of America, Ukraine and China using MODIS data and NCAR Growing Degree Day information. Remote Sens. Environ. 2015, 161, 131–148. [Google Scholar] [CrossRef]
- Wang, X.; Huang, J.; Feng, Q.; Yin, D. Winter Wheat Yield Prediction at County Level and Uncertainty Analysis in Main Wheat-Producing Regions of China with Deep Learning Approaches. Remote Sens. 2020, 12, 1744. [Google Scholar] [CrossRef]
- Ozdogan, M.; Yang, Y.; Allez, G.; Cervantes, C. Remote Sensing of Irrigated Agriculture: Opportunities and Challenges. Remote Sens. 2010, 2, 2274–2304. [Google Scholar] [CrossRef] [Green Version]
- Skakun, S.; Kussul, N.; Shelestov, A.; Kussul, O. The use of satellite data for agriculture drought risk quantification in Ukraine. Geomat. Nat. Hazards Risk 2015, 7, 901–917. [Google Scholar] [CrossRef]
- Zhang, D.; Fang, S.; She, B.; Zhang, H.; Jin, N.; Xia, H.; Yang, Y.; Ding, Y. Winter Wheat Mapping Based on Sentinel-2 Data in Heterogeneous Planting Conditions. Remote Sens. 2019, 11, 2647. [Google Scholar] [CrossRef] [Green Version]
- Lu, X.; Chen, Y.; Sun, Y.; Xu, Y.; Xin, Y.; Mo, Y. Spatial and temporal variations of net ecosystem productivity in Xinjiang Autonomous Region, China based on remote sensing. Front. Plant Sci. 2023, 14, 1146388. [Google Scholar] [CrossRef]
- Blickensdörfer, L.; Schwieder, M.; Pflugmacher, D.; Nendel, C.; Erasmi, S.; Hostert, P. Mapping of crop types and crop sequences with combined time series of Sentinel-1, Sentinel-2 and Landsat 8 data for Germany. Remote Sens. Environ. 2022, 269, 112831. [Google Scholar] [CrossRef]
- Boryan, C.G.; Yang, Z. Implementation of a new automatic stratification method using geospatial cropland data layers in NASS area frame construction. In Proceedings of the Geoscience & Remote Sensing Symposium, Quebec City, QC, Canada, 13–18 July 2014. [Google Scholar]
- Qiu, B.; Hu, X.; Chen, C.; Tang, Z.; Yang, P.; Zhu, X.; Yan, C.; Jian, Z. Maps of cropping patterns in China during 2015–2021. Sci. Data 2022, 9, 479. [Google Scholar] [CrossRef] [PubMed]
- Ibrahim, E.S.; Rufin, P.; Nill, L.; Kamali, B.; Nendel, C.; Hostert, P. Mapping Crop Types and Cropping Systems in Nigeria with Sentinel-2 Imagery. Remote Sens. 2021, 13, 3523. [Google Scholar] [CrossRef]
- Hao, P.; Zhan, Y.; Wang, L.; Niu, Z.; Shakir, M. Feature Selection of Time Series MODIS Data for Early Crop Classification Using Random Forest: A Case Study in Kansas, USA. Remote Sens. 2015, 7, 5347–5369. [Google Scholar] [CrossRef] [Green Version]
- Defourny, P.; Bontemps, S.; Bellemans, N.; Cara, C.; Dedieu, G.; Guzzonato, E.; Hagolle, O.; Inglada, J.; Nicola, L.; Rabaute, T.; et al. Near real-time agriculture monitoring at national scale at parcel resolution: Performance assessment of the Sen2-Agri automated system in various cropping systems around the world. Remote Sens. Environ. 2019, 221, 551–568. [Google Scholar] [CrossRef]
- Tengfei, S.; Quanming, L.; Xiuchuan, S. Remote sensing classification of crops based on multiple vegetation index time series and machine learning. Jiangsu Agric. Sci. 2017, 45, 219–224. [Google Scholar] [CrossRef]
- Pal, M.; Mather, P.M. An assessment of the effectiveness of decision tree methods for land cover classification. Remote Sens. Environ. 2003, 86, 554–565. [Google Scholar] [CrossRef]
- Yang, Z.; Shao, Y.; Li, K.; Liu, Q.; Liu, L.; Brisco, B. An improved scheme for rice phenology estimation based on time-series multispectral HJ-1A/B and polarimetric RADARSAT-2 data. Remote Sens. Environ. 2017, 195, 184–201. [Google Scholar] [CrossRef]
- Zhongjun, L. Analysis of spatial and temporal characteristics of land use status in the Sanjiang Plain. Heilongjiang Agric. Sci. 2011, 204, 131–134. [Google Scholar]
- Xiao, X.; Boles, S.; Frolking, S.; Salas, W.; Moore, B.; Li, C.; He, L.; Zhao, R. Observation of flooding and rice transplanting of paddy rice fields at the site to landscape scales in China using VEGETATION sensor data. Int. J. Remote Sens. 2010, 23, 3009–3022. [Google Scholar] [CrossRef]
- Yang, J.; Huang, X. The 30 m annual land cover dataset and its dynamics in China from 1990 to 2019. Earth Syst. Sci. Data 2021, 13, 3907–3925. [Google Scholar] [CrossRef]
- Son, N.-T.; Chen, C.-F.; Chen, C.-R.; Guo, H.-Y. Classification of multitemporal Sentinel-2 data for field-level monitoring of rice cropping practices in Taiwan. Adv. Space Res. 2020, 65, 1910–1921. [Google Scholar] [CrossRef]
- You, N.; Dong, J.; Huang, J.; Du, G.; Zhang, G.; He, Y.; Yang, T.; Di, Y.; Xiao, X. The 10-m crop type maps in Northeast China during 2017–2019. Sci. Data 2021, 8, 41. [Google Scholar] [CrossRef]
- Griffiths, P.; Nendel, C.; Hostert, P. Intra-annual reflectance composites from Sentinel-2 and Landsat for national-scale crop and land cover mapping. Remote Sens. Environ. 2019, 220, 135–151. [Google Scholar] [CrossRef]
- Liu, L.; Xiao, X.; Qin, Y.; Wang, J.; Xu, X.; Hu, Y.; Qiao, Z. Mapping cropping intensity in China using time series Landsat and Sentinel-2 images and Google Earth Engine. Remote Sens. Environ. 2020, 239, 111624. [Google Scholar] [CrossRef]
- Zhong, L.; Gong, P.; Biging, G.S. Efficient corn and soybean mapping with temporal extendability: A multi-year experiment using Landsat imagery. Remote Sens. Environ. 2014, 140, 1–13. [Google Scholar] [CrossRef]
- Zhong, L.; Hu, L.; Zhou, H. Deep learning based multi-temporal crop classification. Remote Sens. Environ. 2019, 221, 430–443. [Google Scholar] [CrossRef]
- Cai, Y.; Guan, K.; Peng, J.; Wang, S.; Seifert, C.; Wardlow, B.; Li, Z. A high-performance and in-season classification system of field-level crop types using time-series Landsat data and a machine learning approach. Remote Sens. Environ. 2018, 210, 35–47. [Google Scholar] [CrossRef]
- Clevers, J.G.P.W.; Gitelson, A.A. Remote estimation of crop and grass chlorophyll and nitrogen content using red-edge bands on Sentinel-2 and -3. Int. J. Appl. Earth Obs. Geoinf. 2013, 23, 344–351. [Google Scholar] [CrossRef]
- Huete, A. A comparison of vegetation indices over a global set of TM images for EOS-MODIS. Remote Sens. Environ. 1997, 59, 440–451. [Google Scholar] [CrossRef]
- Xiao, X.; Boles, S.; Liu, J.; Zhuang, D.; Frolking, S.; Li, C.; Salas, W.; Moore, B. Mapping paddy rice agriculture in southern China using multi-temporal MODIS images. Remote Sens. Environ. 2005, 95, 480–492. [Google Scholar] [CrossRef]
- Zheng, B.; Campbell, J.B.; de Beurs, K.M. Remote sensing of crop residue cover using multi-temporal Landsat imagery. Remote Sens. Environ. 2012, 117, 177–183. [Google Scholar] [CrossRef]
- Belgiu, M.; Drăguţ, L. Random forest in remote sensing: A review of applications and future directions. ISPRS J. Photogramm. 2016, 114, 24–31. [Google Scholar] [CrossRef]
- Pelletier, C.; Valero, S.; Inglada, J.; Champion, N.; Dedieu, G. Assessing the robustness of Random Forests to map land cover with high resolution satellite image time series over large areas. Remote Sens. Environ. 2016, 187, 156–168. [Google Scholar] [CrossRef]
- Dong, J.; Lu, H.; Wang, Y.; Ye, T.; Yuan, W. Estimating winter wheat yield based on a light use efficiency model and wheat variety data. ISPRS J. Photogramm. 2020, 160, 18–32. [Google Scholar] [CrossRef]
- Guo, Y.; Xia, H.; Pan, L.; Zhao, X.; Li, R.; Bian, X.; Wang, R.; Yu, C. Development of a New Phenology Algorithm for Fine Mapping of Cropping Intensity in Complex Planting Areas Using Sentinel-2 and Google Earth Engine. ISPRS Int. J. Geo-Inf. 2021, 10, 587. [Google Scholar] [CrossRef]
- You, N.; Dong, J. Examining earliest identifiable timing of crops using all available Sentinel 1/2 imagery and Google Earth Engine. ISPRS J. Photogramm. 2020, 161, 109–123. [Google Scholar] [CrossRef]
- Somers, B.; Asner, G.P. Multi-temporal hyperspectral mixture analysis and feature selection for invasive species mapping in rainforests. Remote Sens. Environ. 2013, 136, 14–27. [Google Scholar] [CrossRef]
- Hu, Q.; Sulla-Menashe, D.; Xu, B.; Yin, H.; Tang, H.; Yang, P.; Wu, W. A phenology-based spectral and temporal feature selection method for crop mapping from satellite time series. Int. J. Appl. Earth Obs. Geoinf. 2019, 80, 218–229. [Google Scholar] [CrossRef]
- Yin, L.; You, N.; Zhang, G.; Huang, J.; Dong, J. Optimizing Feature Selection of Individual Crop Types for Improved Crop Mapping. Remote Sens. 2020, 12, 162. [Google Scholar] [CrossRef] [Green Version]
- Chen, D.; Huang, J.; Jackson, T.J. Vegetation water content estimation for corn and soybeans using spectral indices derived from MODIS near- and short-wave infrared bands. Remote Sens. Environ. 2005, 98, 225–236. [Google Scholar] [CrossRef]
- Johnson, D.M. Using the Landsat archive to map crop cover history across the United States. Remote Sens. Environ. 2019, 232, 111286. [Google Scholar] [CrossRef]
- Azzari, G.; Grassini, P.; Edreira, J.I.R.; Conley, S.; Mourtzinis, S.; Lobell, D.B. Satellite mapping of tillage practices in the North Central US region from 2005 to 2016. Remote Sens. Environ. 2019, 221, 417–429. [Google Scholar] [CrossRef]
Figure 1.
Geographical location of the study area and distribution of sample sites in the Sanjiang Plain, with land use data in the background [22]. Note: The coordinate system is WGS-84.
Figure 1.
Geographical location of the study area and distribution of sample sites in the Sanjiang Plain, with land use data in the background [22]. Note: The coordinate system is WGS-84.

Figure 2.
Flow chart for early crop mapping in the Sanjiang Plain.

Figure 3.
Random forest importance analysis normalized scores of different remote sensing classification features before the earliest identifiable time for rice, maize and soybean. NDSVI_12 denotes 120th day of year (DOY) NDSVI, and so on.
Figure 3.
Random forest importance analysis normalized scores of different remote sensing classification features before the earliest identifiable time for rice, maize and soybean. NDSVI_12 denotes 120th day of year (DOY) NDSVI, and so on.

Figure 4.
(a–k) Time-series curves of selected remote sensing classification features.

Figure 5.
Curves of the overall accuracy of early-season mapping with time for different crops. The blue, red, and black vertical dashed lines represent the DOY when the overall accuracy of rice, corn, and soybeans first reached 90% or higher, respectively.
Figure 5.
Curves of the overall accuracy of early-season mapping with time for different crops. The blue, red, and black vertical dashed lines represent the DOY when the overall accuracy of rice, corn, and soybeans first reached 90% or higher, respectively.

Figure 6.
Classification results of different schemes for the earliest identifiable time of different crops in the Sanjiang Plain.
Figure 6.
Classification results of different schemes for the earliest identifiable time of different crops in the Sanjiang Plain.

Figure 7.
Summary of the growth period of major crops in the Sanjiang Plain.

Figure 8.
(a–f) Early- and post-season mapping of different crops.

Figure 9.
Average absolute error (MAE) of crop area between early-season crop mapping of optimal features and post-season crop mapping for each city and county in the Sanjiang Plain. ((a) rice, (b) maize, (c) soybean).
Figure 9.
Average absolute error (MAE) of crop area between early-season crop mapping of optimal features and post-season crop mapping for each city and county in the Sanjiang Plain. ((a) rice, (b) maize, (c) soybean).


Table 1.
Summary of selected remote sensing classification features.
| Remote Sensing Classification Features | Formula | Reference |
|---|---|---|
| Original band | Blue, green, red, red1, red2, red3, nir, swir1, swir2 | |
| NDVI | [31] | |
| EVI | [32] | |
| LSWI | [27] | |
| NDSVI | [33] | |
| NDTI | [28] | |
| RENDVI | [16] | |
| REP | [16] |
Table 2.
Earliest crop identification time for different overall accuracies in Sanjiang Plain.
| Overall Accuracy | ≥80% | ≥85% | ≥90% | ≥95% |
|---|---|---|---|---|
| Rice | 110th DOY | 120th DOY | 130th DOY | 150th DOY |
| (20 April) | (30 April) | (10 May) | (30 May) | |
| Maize | 150th DOY | 170th DOY | 180th DOY | 200th DOY |
| (30 May) | (19 June) | (29 June) | (19 July) | |
| Soybean | 170th DOY | 180th DOY | 200th DOY | 240th DOY |
| (19 June) | (29 June) | (19 July) | (28 August) |
Table 3.
Overall accuracy of the earliest identification time of different crops in the Sanjiang Plain.
Table 3.
Overall accuracy of the earliest identification time of different crops in the Sanjiang Plain.
| Programs | Strip Study Area | Sanjiang Plain | ||||
|---|---|---|---|---|---|---|
| Rice | Maize | Soybean | Rice | Maize | Soybean | |
| F1 | 88.8% | 85.0% | 90.5% | 87.2% | 84.2% | 88.9% |
| F2 | 91.3% | 90.0% | 90.5% | 90.2% | 89.0% | 89.2% |
| F3 | 90.0% | 89.4% | 91.3% | 88.3% | 88.7% | 90.5% |
| F4 | 91.9% | 90.5% | 91.3% | 90.4% | 90.0% | 90.9% |
Table 4.
Comparison of the overall accuracy of early- and post-season mapping of different schemes for three crops in the Sanjiang Plain.
Table 4.
Comparison of the overall accuracy of early- and post-season mapping of different schemes for three crops in the Sanjiang Plain.
| Overall Accuracy of Rice (%) | Overall Accuracy of Maize (%) | Overall Accuracy of Soybean (%) | ||||||||||
|---|---|---|---|---|---|---|---|---|---|---|---|---|
| F1 | F2 | F3 | F4 | F1 | F2 | F3 | F4 | F1 | F2 | F3 | F4 | |
| Early-season mapping | 87.2 | 90.2 | 88.3 | 90.4 | 84.2 | 89.0 | 88.7 | 90.0 | 88.9 | 89.2 | 90.5 | 90.9 |
| Post-season mapping | 95.5 | 93.3 | 94.6 | |||||||||
| Difference | 8.3 | 5.3 | 7.2 | 5.1 | 9.1 | 4.3 | 4.6 | 3.3 | 5.7 | 5.4 | 4.1 | 3.7 |
Disclaimer/Publisher’s Note: The statements, opinions and data contained in all publications are solely those of the individual author(s) and contributor(s) and not of MDPI and/or the editor(s). MDPI and/or the editor(s) disclaim responsibility for any injury to people or property resulting from any ideas, methods, instructions or products referred to in the content. |
© 2023 by the authors. Licensee MDPI, Basel, Switzerland. This article is an open access article distributed under the terms and conditions of the Creative Commons Attribution (CC BY) license (https://creativecommons.org/licenses/by/4.0/).
Share and Cite
MDPI and ACS Style
Wei, P.; Ye, H.; Qiao, S.; Liu, R.; Nie, C.; Zhang, B.; Song, L.; Huang, S. Early Crop Mapping Based on Sentinel-2 Time-Series Data and the Random Forest Algorithm. Remote Sens. 2023, 15, 3212. https://doi.org/10.3390/rs15133212
AMA Style
Wei P, Ye H, Qiao S, Liu R, Nie C, Zhang B, Song L, Huang S. Early Crop Mapping Based on Sentinel-2 Time-Series Data and the Random Forest Algorithm. Remote Sensing. 2023; 15(13):3212. https://doi.org/10.3390/rs15133212
Chicago/Turabian StyleWei, Peng, Huichun Ye, Shuting Qiao, Ronghao Liu, Chaojia Nie, Bingrui Zhang, Lijuan Song, and Shanyu Huang. 2023. "Early Crop Mapping Based on Sentinel-2 Time-Series Data and the Random Forest Algorithm" Remote Sensing 15, no. 13: 3212. https://doi.org/10.3390/rs15133212
Note that from the first issue of 2016, this journal uses article numbers instead of page numbers. See further details here.