Article

A Framework for Retrieving Soil Organic Matter by Coupling Multi-Temporal Remote Sensing Images and Variable Selection in the Sanjiang Plain, China

1
State Key Laboratory of Soil and Sustainable Agriculture, Institute of Soil Science, Chinese Academy of Sciences, Nanjing 210008, China
2
College of Advanced Agricultural Sciences, University of Chinese Academy of Sciences, Beijing 100049, China
*
Author to whom correspondence should be addressed.
Remote Sens. 2023, 15(12), 3191; https://doi.org/10.3390/rs15123191
Submission received: 24 April 2023 / Revised: 27 May 2023 / Accepted: 15 June 2023 / Published: 20 June 2023
(This article belongs to the Special Issue Remote Sensing for Soil Mapping and Monitoring)

Abstract

:
Soil organic matter (SOM) is an important soil property for agricultural production. Rising grain demand has increased the intensity of cultivated land development in the Sanjiang Plain of China, and there is a strong demand for SOM monitoring in this region. Therefore, Baoqing County of the Sanjiang Plain, an important grain production area, was considered the study area. In the study, we proposed a framework for high-accuracy SOM retrieval by coupling multi-temporal remote sensing (RS) images and variable selection algorithms. A total of 73 surface soil samples (0–20 cm) were collected in 2010, and Landsat 5 images acquired during the bare soil period (April, May, and June) were selected from 2008 to 2011. Three variable selection algorithms, namely, Genetic Algorithm, Random Frog and Competitive Adaptive Reweighted Sampling (CARS), were combined with Partial Least Squares Regression (PLSR) to build SOM retrieval models on the spectral bands and indices of the images. The results using a single-date image showed that the combination of variable selection algorithms and PLSR outperformed using PLSR alone, and CARS showed the best performance (R2 = 0.34, RMSE = 15.66 g/kg) among all the algorithms. Therefore, only CARS was applied to SOM retrieval in the different year interval groups. To investigate the effect of the image acquisition time, all images were divided into various year interval groups, and the resulting images were then stacked. The results using multi-temporal images showed that the SOM retrieval accuracy improved as the year interval lengthened. The optimal result (R2 = 0.59, RMSE = 11.81 g/kg) was obtained from the 2008–2011 group, wherein the difference indices derived from the images of 2009, 2010, and 2011 dominated the selected spectral variables. Moreover, the spatial prediction of SOM based on the optimal model was consistent with the distribution of SOM. Our study suggested that the proposed framework that couples stacked multi-temporal RS images with variable selection algorithms has potential for SOM retrieval.

1. Introduction

Soil organic matter (SOM) is an essential component of soil that supports multiple ecosystem functions, including carbon storage and plant nutrient retention and supply [1,2,3,4]. For soils, natural factors and human activities together result in strong spatial heterogeneity of SOM at different scales [5,6,7]. Many studies have attempted to develop a reliable scheme to achieve a quantitative estimation and mapping of SOM [8,9,10].
Geostatistical methods have been broadly used to create SOM maps at various scales. However, they often require a relatively high density of sampling and generally come with a high cost and low efficiency, especially for a large area [11,12]. Soil reflectance spectra demonstrated a negative correlation with SOM in the visible, near-infrared (400–1400 nm), and shortwave infrared (SWIR; 1400–2500 nm) regions of the electromagnetic spectrum [13,14], which provided a theoretical basis for SOM retrieval based on remote sensing (RS). High prediction accuracy of SOM or soil organic carbon (SOC) has been shown when using soil spectra measured in the laboratory, with R2 values close to or above 0.8 depending on the soil type [15,16].
In recent years, RS data has been used to retrieve SOM/SOC. Peón et al. [17] used airborne and satellite hyperspectral imagery to retrieve SOC in the burned mountain areas of northwestern Spain, with values of the coefficient of determination (R2) ranging from 0.60 to 0.62 and 0.49 to 0.61 for the airborne scanner and Hyperion sensors, respectively. However, the scarcity of hyperspectral imagery limits its application to relatively large areas. Increasing multi-spectral RS data has provided more soil observations for evaluating soil properties of interest, though the low spectral resolution may result in the loss of some soil spectral characteristics [18]. For example, Winowiecki et al. [19] used Moderate Resolution Imaging Spectroradiometer (MODIS) imagery to estimate SOC stocks across Tanzania. Sentinel2 imagery could provide RS data with a higher spatial resolution, which has been successfully used for the fine mapping of SOM in the Versailles Plain with an R2; value of 0.56 [20]. Currently, many multi-spectral images are free and easily available to users, but not all high-quality images free of atmospheric interferences meet the requirements of soil property retrieval.
Crops, crop residues, snow, and other matter covering the surface of the soil hinder the acquisition of soil spectra through RS. Hence, only images acquired during the bare soil period can directly capture soil spectral information to retrieve the soil properties of interest and are appropriate for building retrieval models. In the Sanjiang Plain, due to the higher latitude and long periods of snowfall during winter, the bare soil period is short. Therefore, in this type of region, only limited bare soil spectral information on the ground could be obtained in a single observation of RS, and thus a low retrieval accuracy of SOM was expected for a single-date image. Moreover, soil moisture could significantly decrease soil reflectance and affect the accuracy of remote sensing of soils. In the literature, to improve the retrieval accuracy of SOM, several researchers have considered the use of multi-temporal RS data. For example, a bare pixel composite method has been provided by calculating different composite variables, such as the mean or median, from multi-temporal RS data. Using this composite method for multi-temporal Sentinel2 images, Luo et al. [21] achieved a high SOM retrieval accuracy (R2 = 0.58). However, Diek et al. [22] obtained a low prediction accuracy for SOM (R2 = 0.26) when using all the available Landsat images acquired from 1985 to 2017 to create the barest pixel composite in the Swiss Plateau. The obvious differences in SOM retrieval accuracy in different studies might be caused by the fact that the composite spectral variables were not free from the effects of soil moisture or other external factors. Therefore, it is necessary to investigate other approaches that use multi-temporal images.
An alternative approach to using multi-temporal images is called stacking. This method has commonly been used in the detection of land cover changes [23,24], but it has rarely been applied to SOM retrieval. It directly stacks the bands of different temporal images, resulting in an image cube with different temporal information. Compared with the abovementioned bare pixel composite method, the stacking approach has the advantage of preserving raw spectral information in the image cube stacked by multi-temporal images. Hence, there is a high possibility of capturing soil spectra free of external interference factors such as crop residues in the cube when long-series RS images are available. These soil spectra could be selected by a variable selection algorithm in modeling. Therefore, selecting pertinent bands for soil properties of interest is necessary. Additionally, when the image cube is relatively large, variable selection is also necessary to reduce the effects of multicollinearity. Gasmi et al. [25] used a feature selection algorithm of mean decrease accuracy (MDA) to select image bands of different sensors for improving the retrieval performance of soil clay content (0.6 ≤ R2 ≤ 0.71). However, few studies have coupled stacked multi-temporal images and variable selection algorithms for SOM retrieval.
Therefore, to achieve high-accuracy SOM retrieval in the cultivated lands of the Sanjiang Plain of Northeast China, we proposed a framework that couples stacked multi-temporal images and variable selection in this study. By stacking multi-temporal images, the proposed framework could provide more temporal information about soil spectra, which were identified by variable selection algorithms and subsequently used for modeling. Therefore, compared with the abovementioned bare pixel composite method, the framework has the potential for remote sensing of SOM in the Sanjiang Plain of Northeast China, where the bare soil period is short. To choose the appropriate algorithm in the study, three variable selection algorithms were compared: Genetic Algorithm (GA), Random Frog (RF), and Competitive Adaptive Reweighted Sampling (CARS). GA is a metaheuristic optimization algorithm inspired by the biological evolution process. It exhibits a high degree of robustness in variable selection and multivariate analysis [26]. RF is developed based on the reversible jump Markov Chain Monte Carlo (MCMC) method. As it does not require any demanding mathematical formulation, RF is easy to implement [27]. CARS is an effective spectral variable selection algorithm that selects key variables using an exponentially decreasing function and adaptive reweighted sampling [28]. These were combined with Partial Least Squares Regression (PLSR) to build SOM retrieval models, and the optimal model was used for SOM mapping in the study area. We investigated the performance of the proposed framework for SOM retrieval in an area with a relatively short bare soil period, which could provide a new idea about how to employ multi-temporal images to retrieve SOM.

2. Materials and Methods

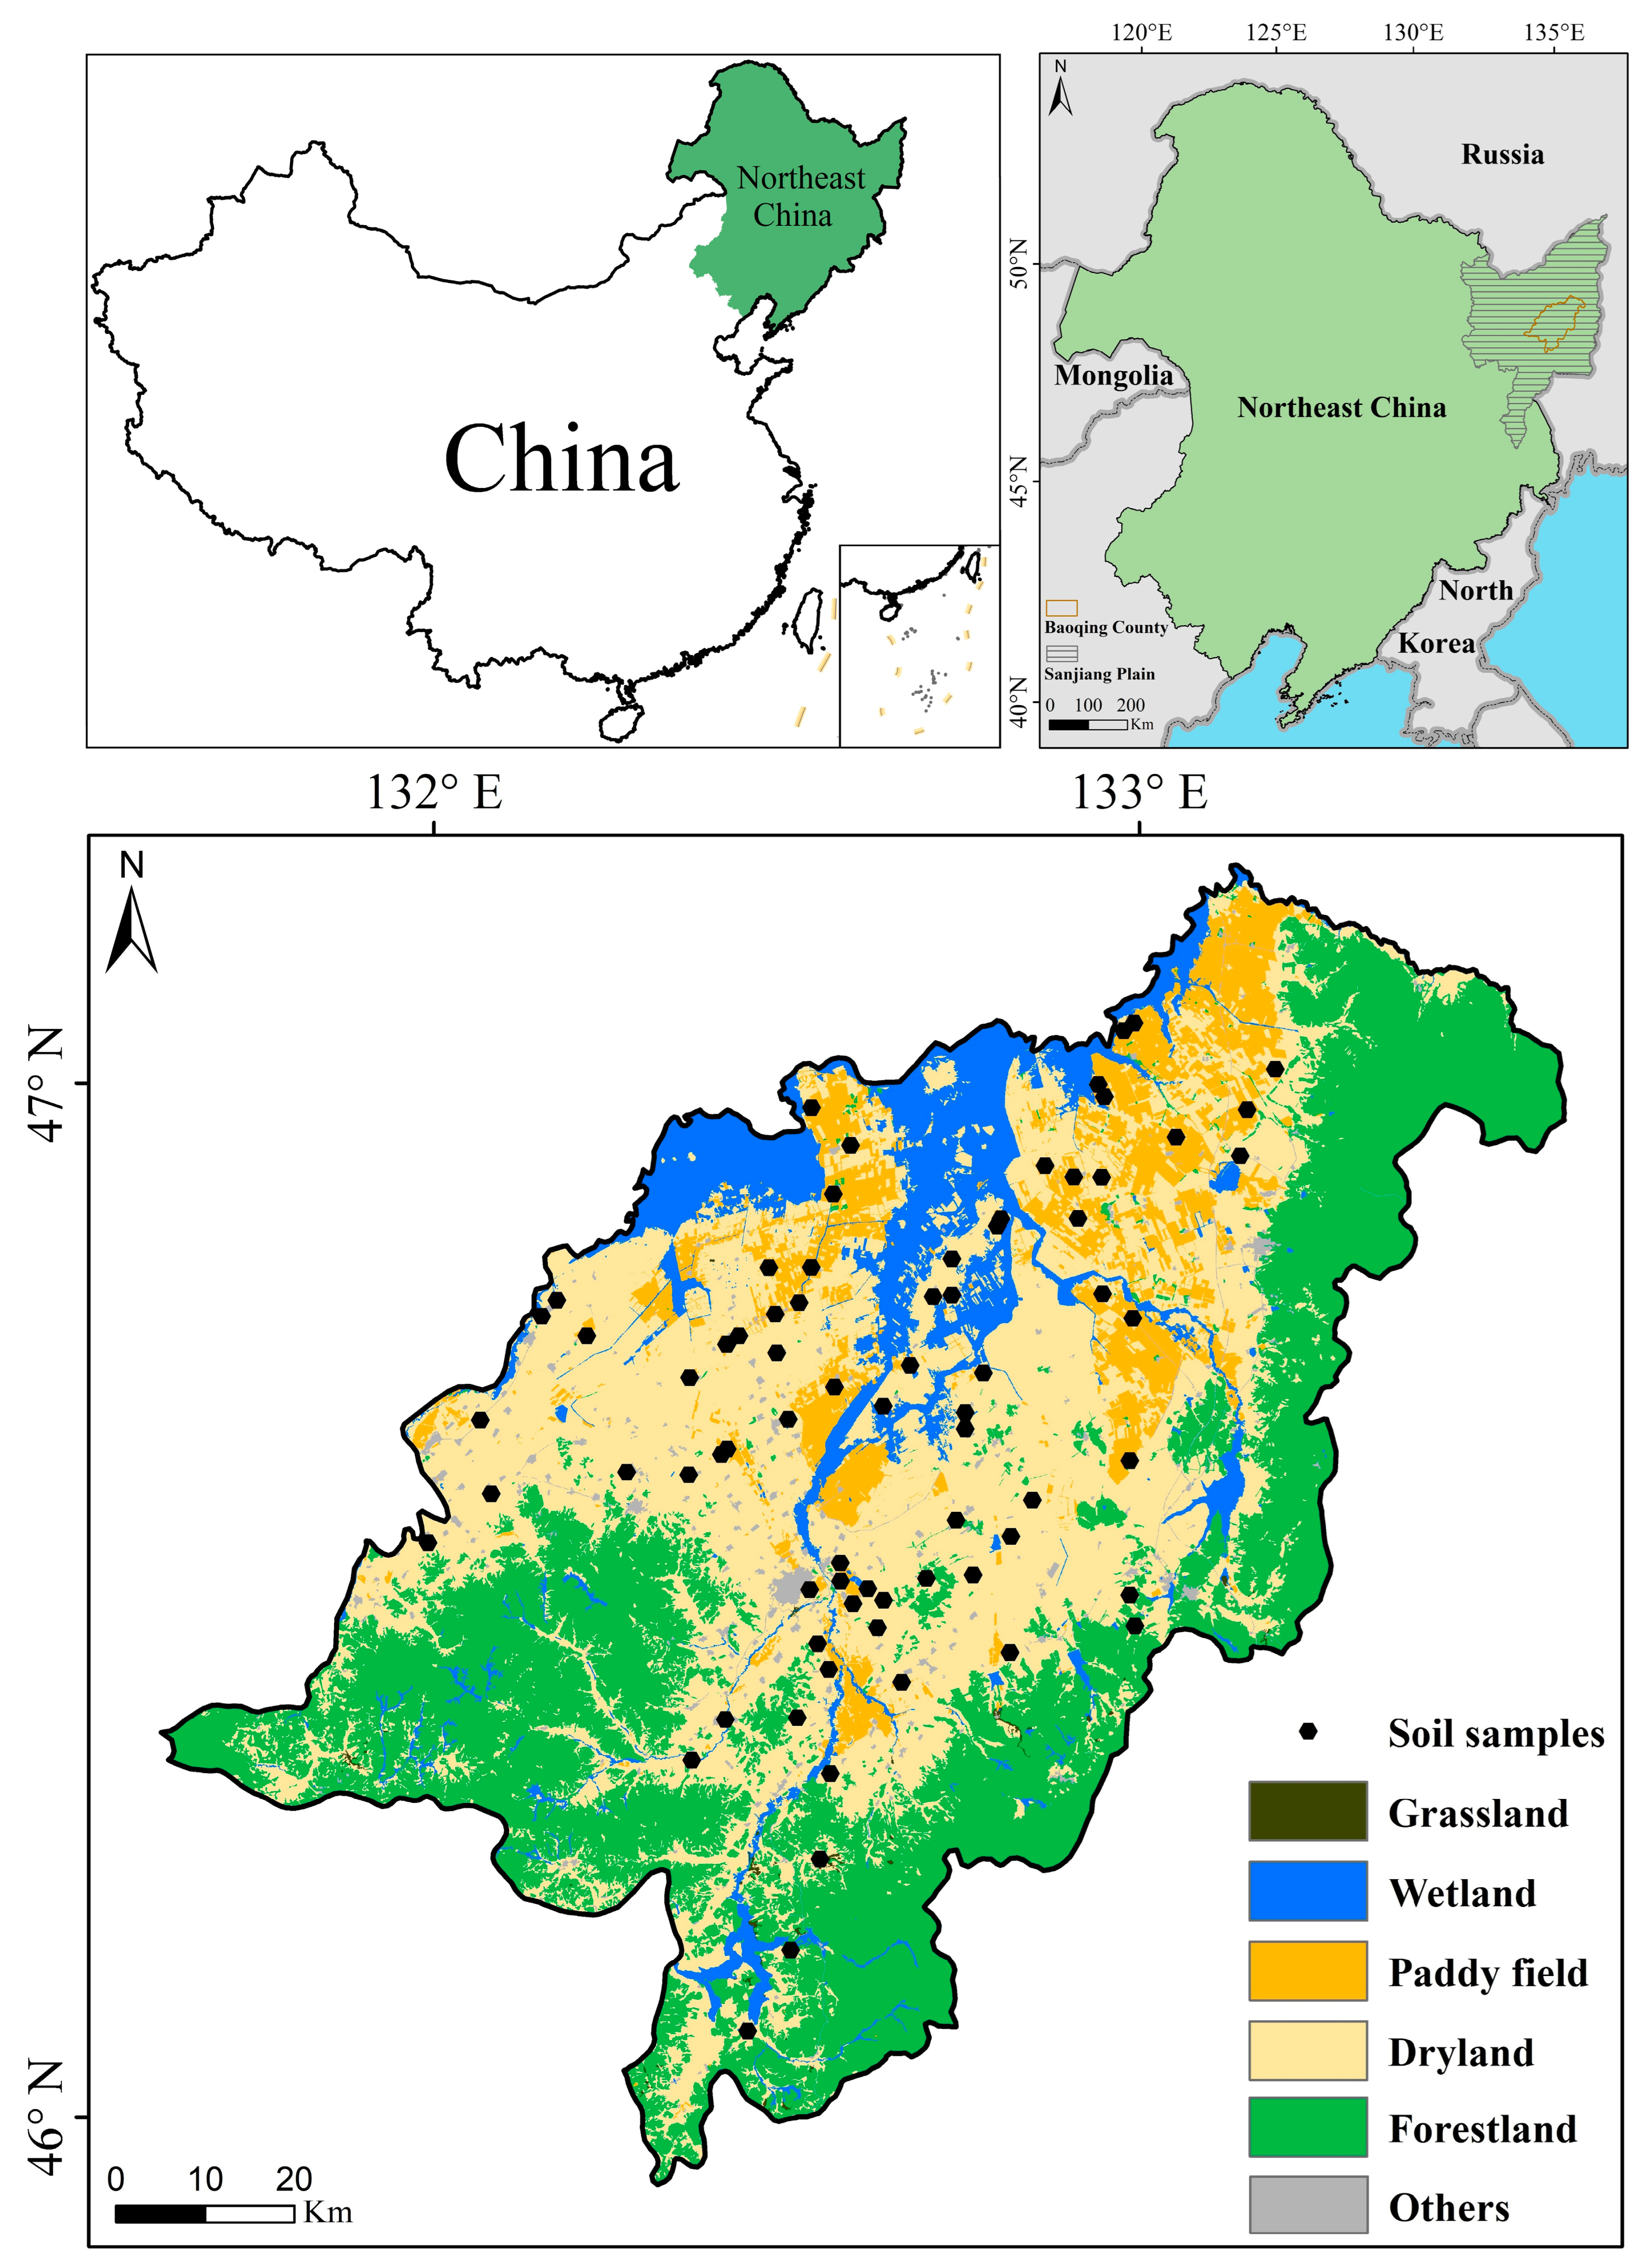
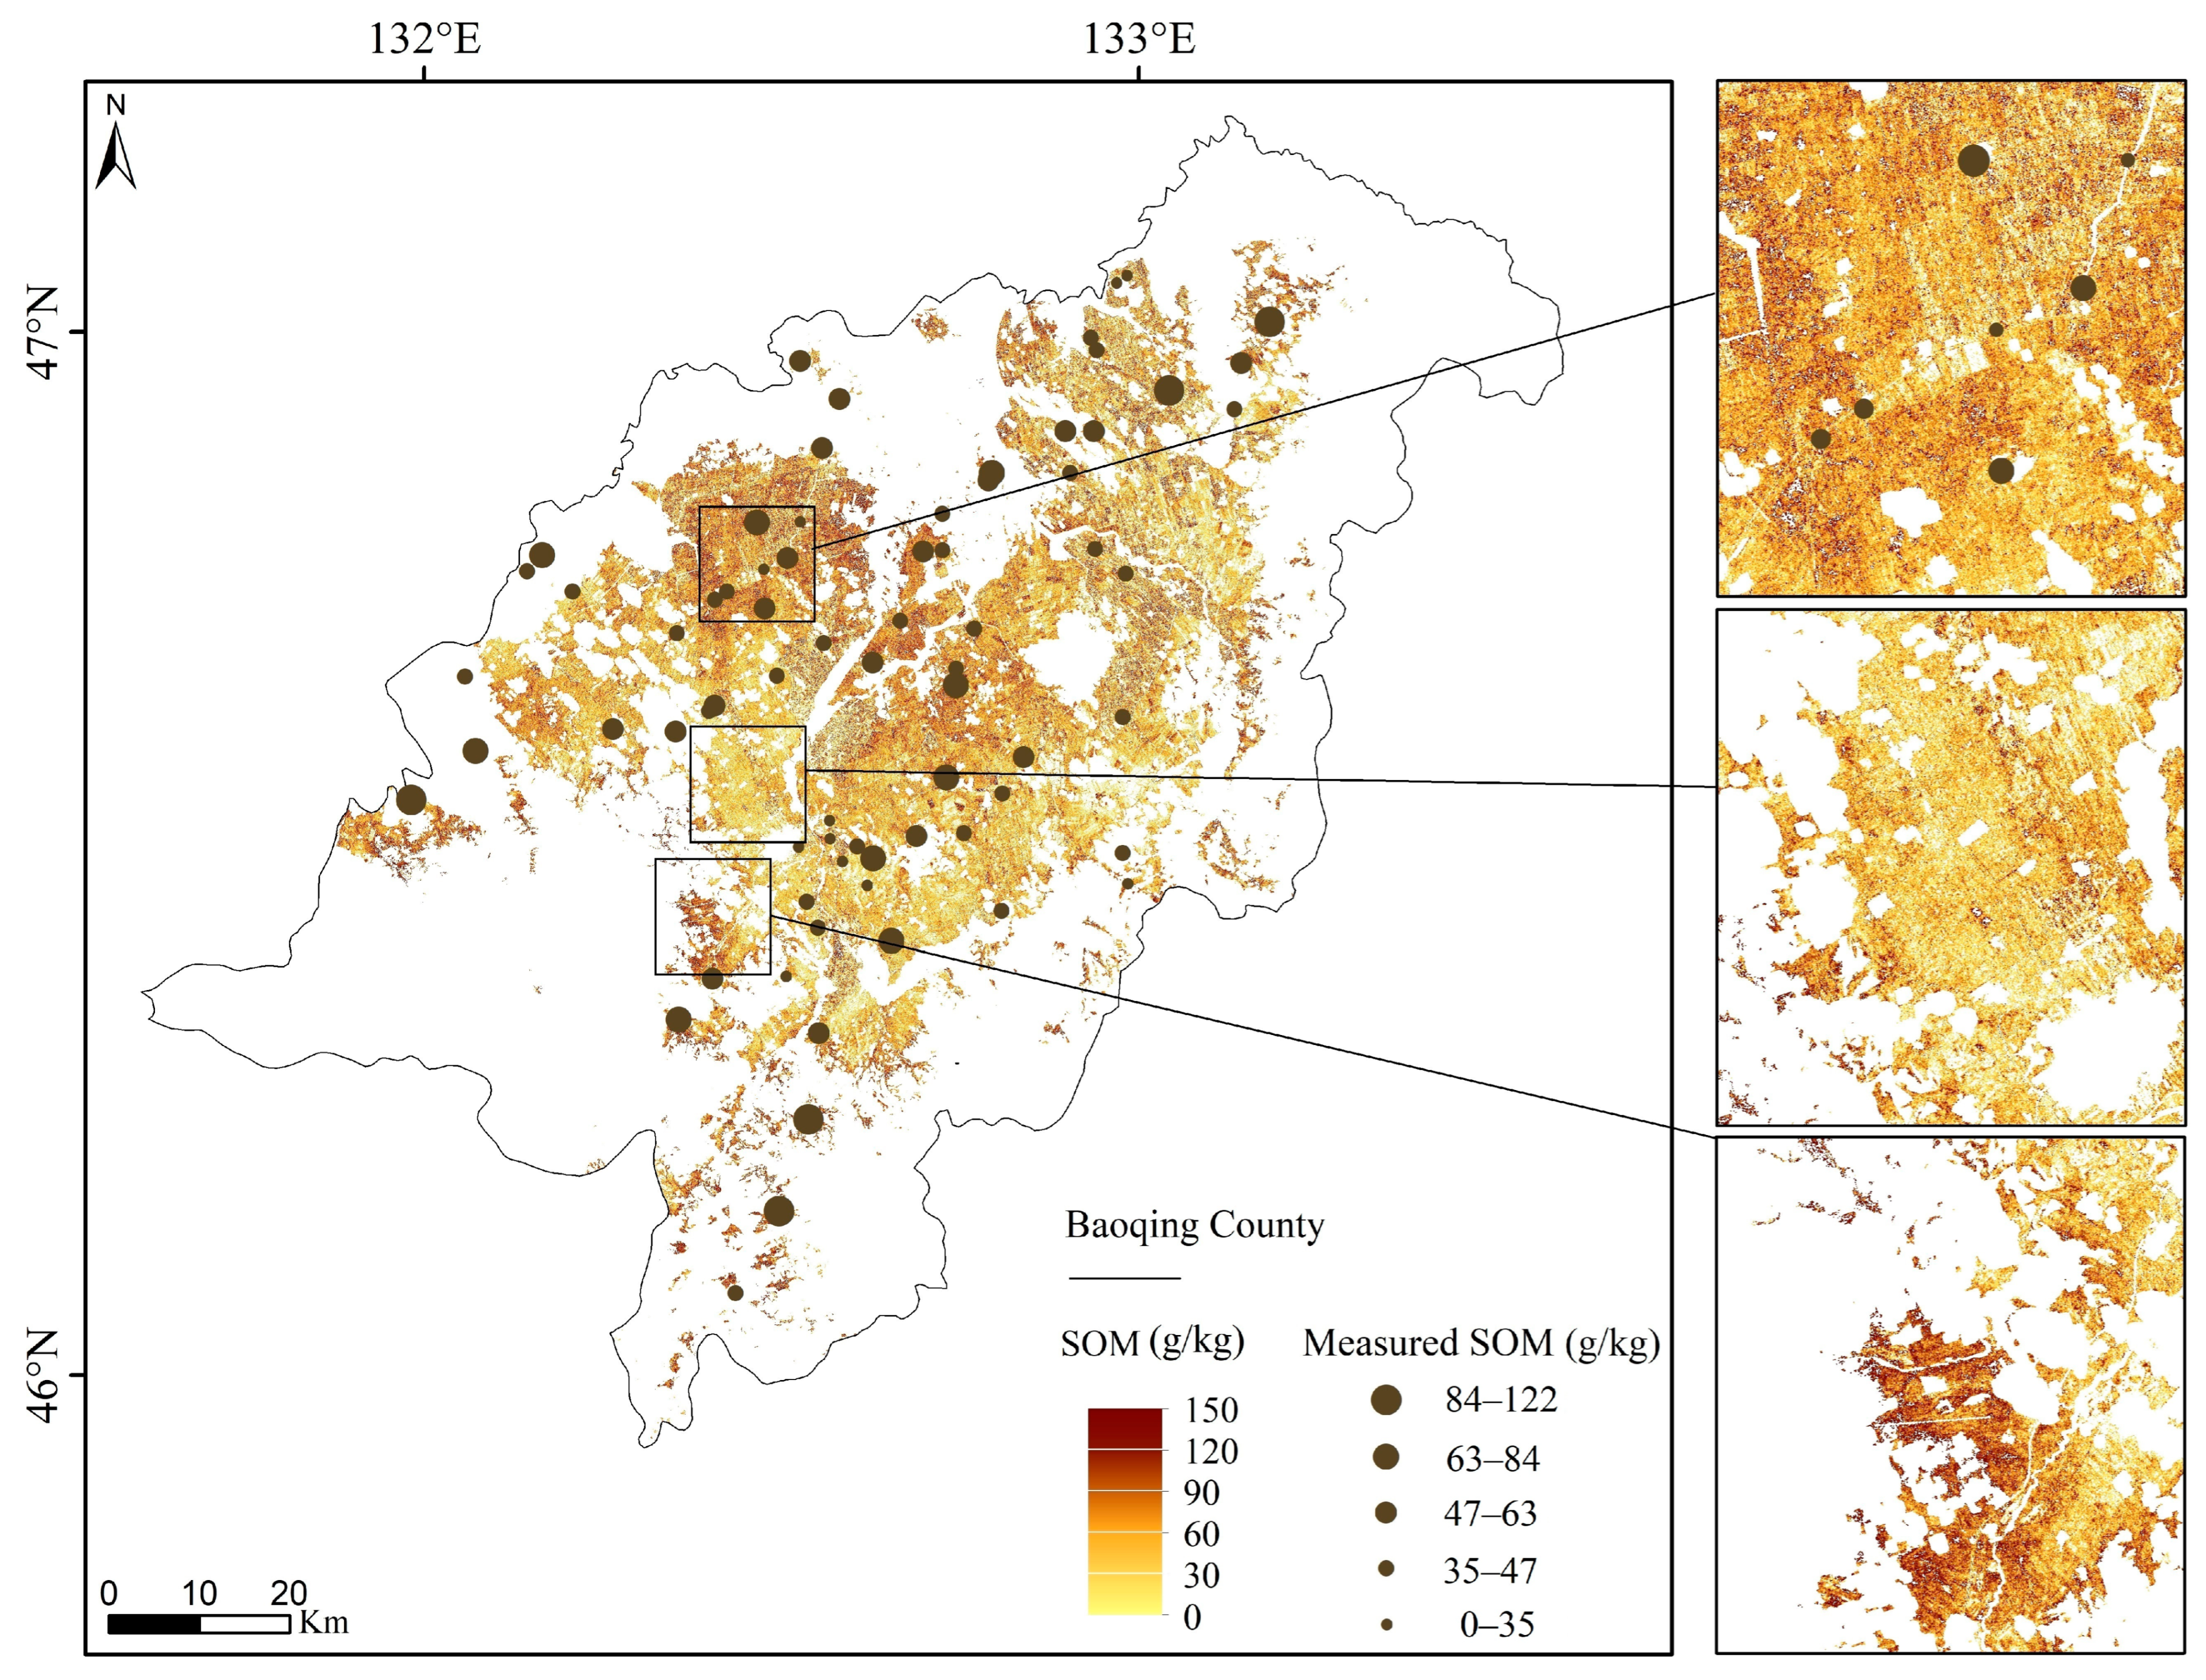
2.1. Study Area and Soil Sample Collection

The study area was located in Baoqing County (131°12′E–133°30′E, 45°45′N–46°55′N; Figure 1), in the center of the Sanjiang Plain, Northeast China. The study area covers an approximate area of 10,000 km2, almost half of which is arable land. The ratio of dryland to paddy fields is approximately 4:1, and forestland is present in the southern and eastern regions. The area is within the temperate monsoon climate zone, with an annual mean precipitation of 574 mm and an annual average air temperature of 3.2 °C [29]. Its hydrothermal conditions enable local corn or rice to be harvested annually. The primary soil types are Phaeozems, Cambisols, and Gleysols according to the classification of the World Reference Base for Soil Resources (WRB) and the cross-reference between the Genetic Soil Classification of China and the WRB [30,31].
In the study area, corn and rice were often harvested between mid-October and early November. Few growing crops and crop residues emerged on the soil surface in drylands from early April to late June, while some paddy fields may be covered by water or rice seedlings in June due to the different cultivation practices in the dryland. The period from April to June could be regarded as the bare soil period [32,33], during which the RS sensors have a high probability of acquiring soil spectra free of external factors.
In 2010, 76 surface soil samples (0–20 cm) were collected from croplands (Figure 1), where 44 and 32 sampling points were in the drylands and paddy fields, respectively. At each sampling site, we collected five soil subsamples in a circular area within a radius of 5 m. The samples were then mixed into one composite sample for laboratory analysis. In the field, the center point coordinate among the five subsamples was recorded using a handheld GPS device. The collected samples were first air-dried indoors, and then ground and passed through a 2-mm sieve. The SOM contents were measured using potassium dichromate oxidation with an external heating method [34]. For more details on the methods of soil sampling and SOM measurement, see Zhao et al. [35].

2.2. Selection and Preprocessing of Remote Sensing Data

SOM gradually changes over time, and its content is generally stable over short periods. Therefore, we used Landsat 5 Thematic Mapper (TM) imagery within four years from 2008 to 2011. To alleviate the impact of surface coverage, such as crops, crop residues, and snow, only images captured during the bare soil period in April, May, and June were selected, with a total of 15 images available (Table 1). The optical bands of the TM imagery, namely, Band 1 (blue band, 450–520 nm), Band 2 (green band, 520–600 nm), Band 3 (red band, 630–690 nm), Band 4 (near-infrared band, 760–900 nm), Band 5 (SWIR1 band, 1550–1750 nm) and Band 7 (SWIR2 band, 2080–2350 nm), were extracted to retrieve the SOM. For each image, the pixels affected by clouds and cloud shadows were masked using the Pixel Quality Assessment Band (QA_Pixel). After removing these pixels, most images did not cover all the sampling points (Table 1). Only images covering more than 60 samples were retained to ensure sufficient calibration samples for a reliable SOM retrieval model. Consequently, eight single-date images (presented in bold in Table 1) qualified for modeling.
All the processes were implemented through the Google Earth Engine (GEE), a free cloud-based computational platform that enables users to access and process remotely sensed data. In recent years, GEE has been widely applied to remote soil sensing [36,37]. In this study, we used GEE to conduct cloud and cloud shadow masking on Landsat 5 Level 2 surface reflectance data products stored in it.

2.3. Combination of Multi-Temporal Images

To investigate the performance of multi-temporal images, the images were divided into various year interval groups, namely, one, two, three, and four years, where at least two images were stacked into an image cube. A total of nine multi-temporal image datasets were established (Table 2). For instance, the 2008 group included three images acquired in 2008, and the 2009–2011 group included five images acquired from 2009 to 2011.

2.4. Construction of the Spectral Index

Compared with band reflectance, spectral indices could be immune to some external effects and are thus helpful for SOM retrieval [38]. In the literature [38,39,40], difference index (DI), ratio index (RI), and normalized difference index (NDI) have successfully been used to retrieve SOM. Hence, these indices were selected for modeling, and were calculated as follows:
D I n m = B m - B n
R I n m = B m B n
N D I n m = B m - B n B m + B n
where B m and B n represent Band m and Band n, respectively (m > n); D I n m , R I n m , and N D I n m represent the difference (e.g., D I 12 = B 2 - B 1 ), ratio (e.g., R I 12 = B 2 B 1 ), and normalized difference (e.g., N D I n m = B 2 - B 1 B 2 + B 1 ) between B m and B n , respectively (m > n). The number of pairwise combinations of six bands is 15, and thus there are 15 indices for DI, RI, and NDI, respectively, and a total of 45 spectral indices were generated.

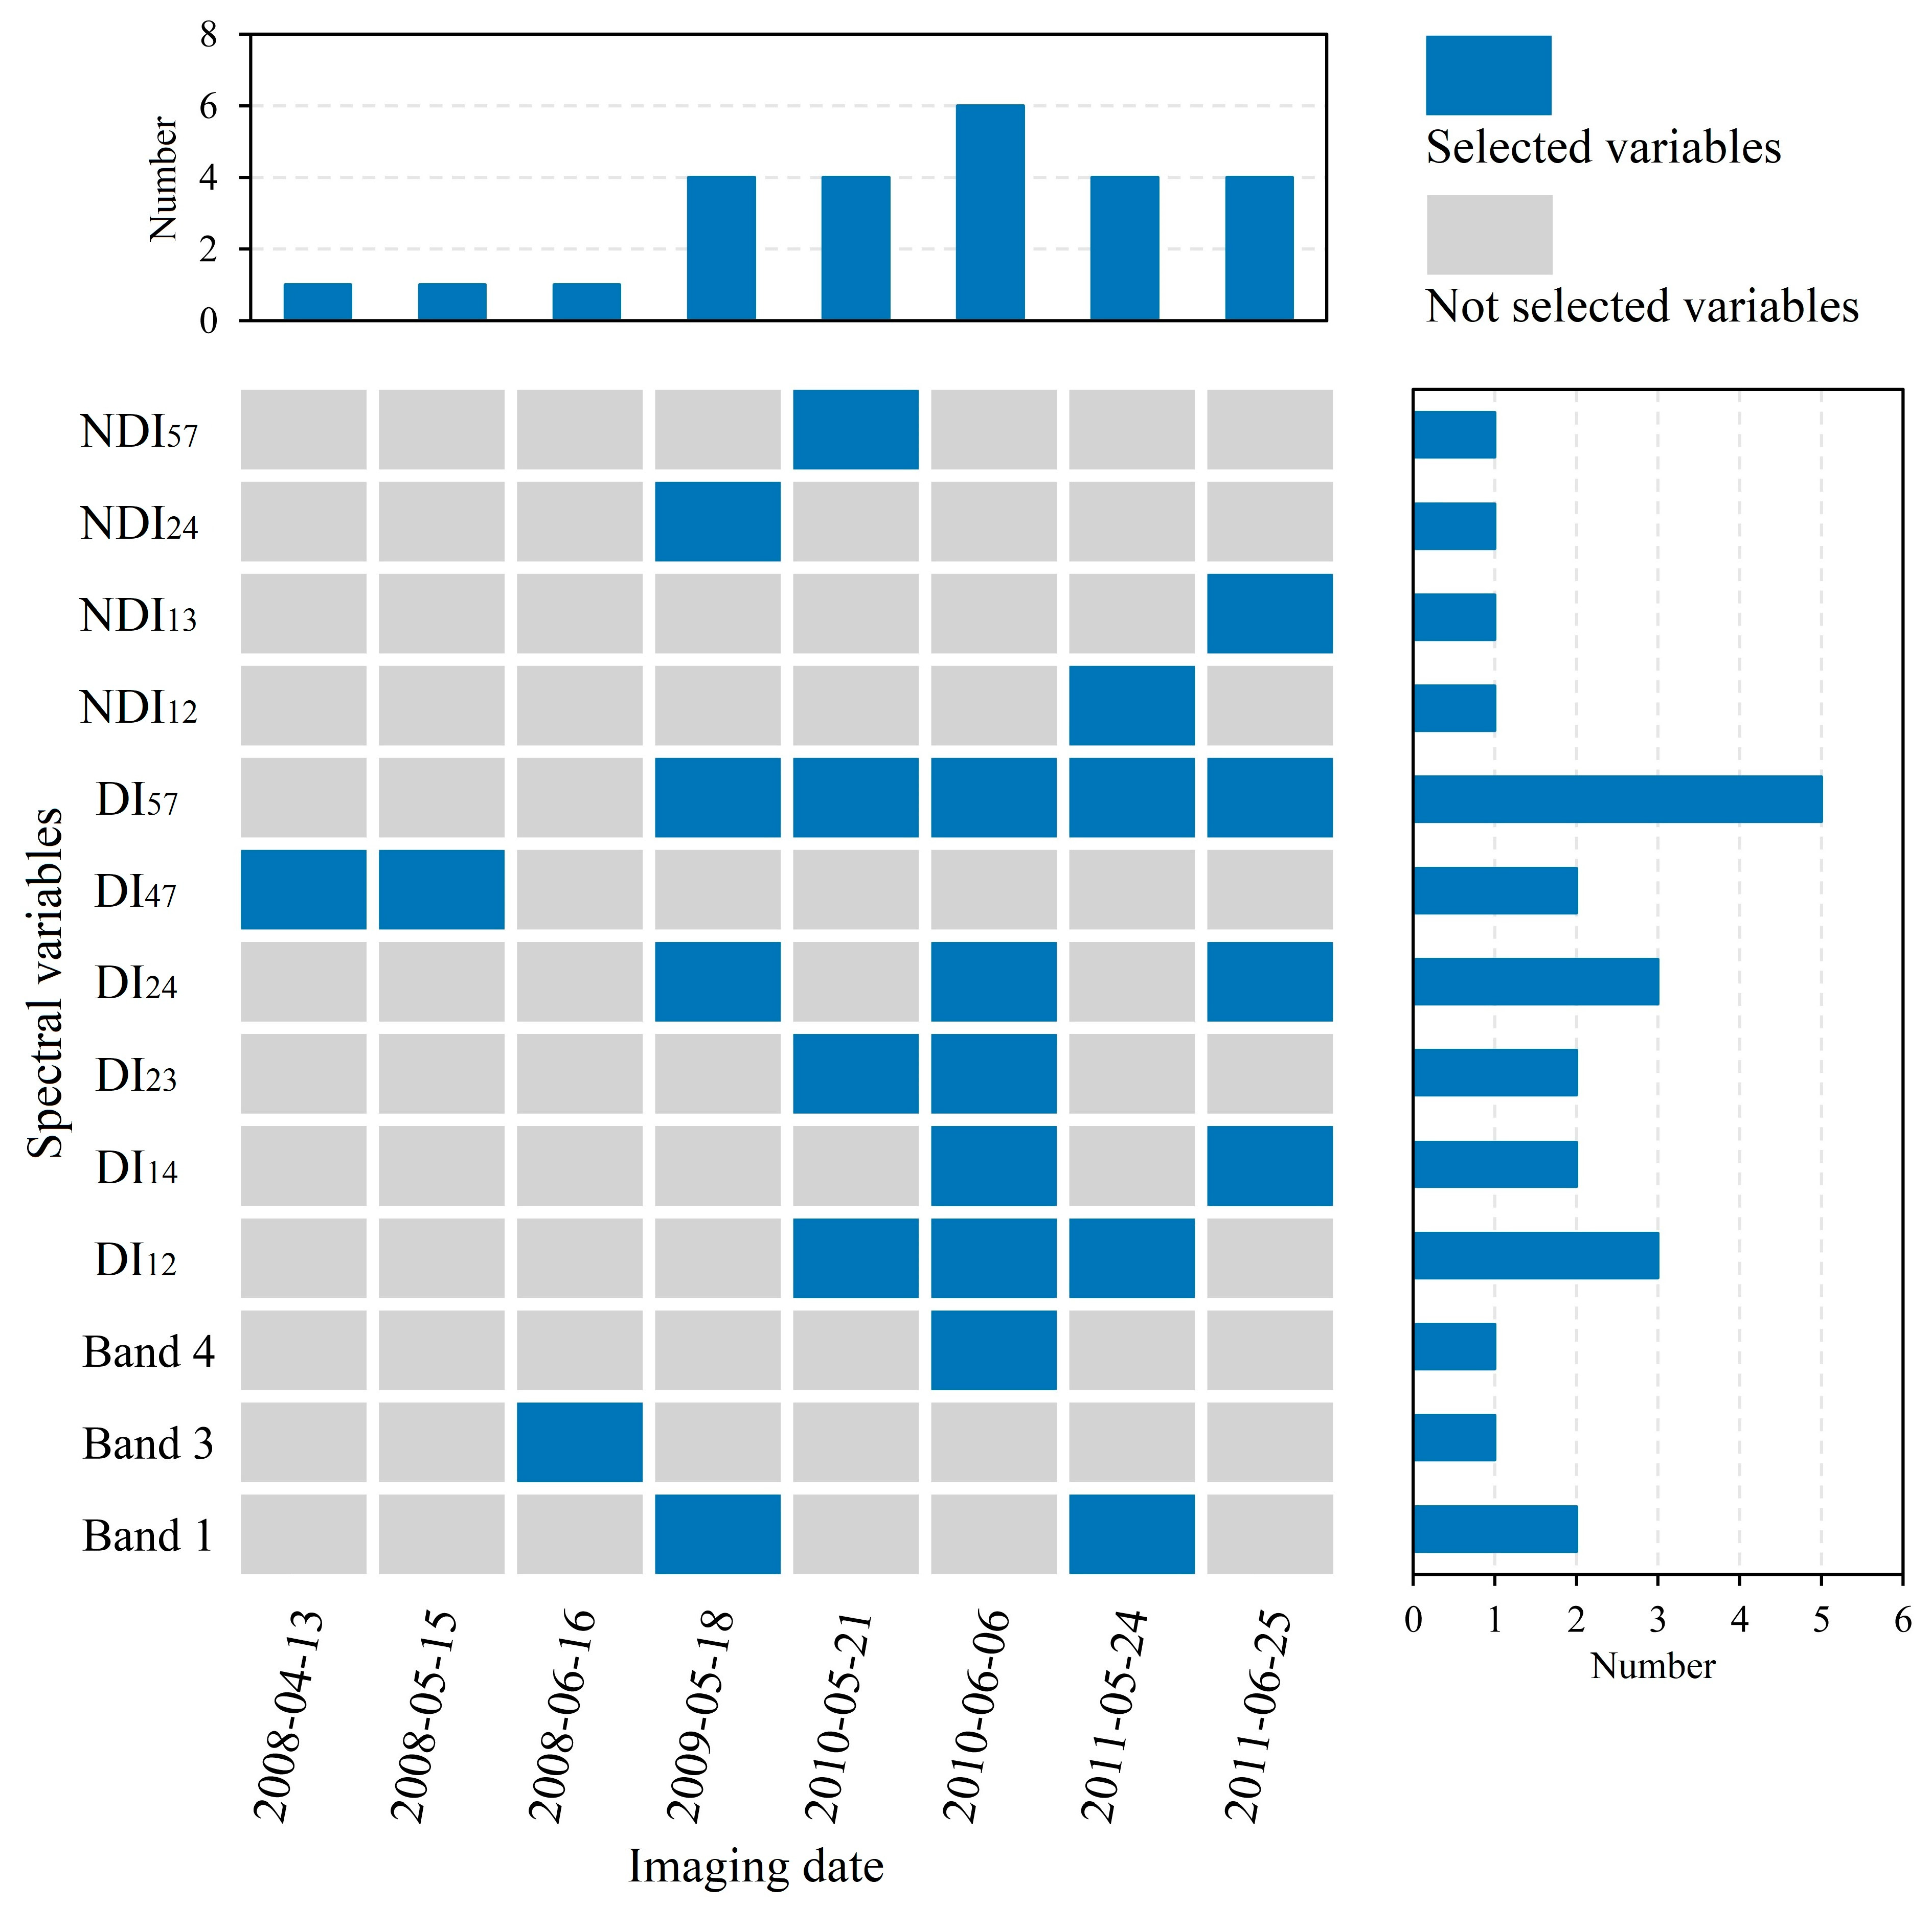
2.5. Variable Selection Algorithms

For each single-date image, six bands and 45 spectral indices could be used as independent variables. For the multi-temporal images, more independent variables were available. For example, the 2009–2011 group contained five images with 255 variables. It was necessary to select variables during model optimization. Therefore, in this study, three variable selection algorithms (GA, RF, and CARS) were used to select variables beneficial for SOM retrieval.
The GA is a type of adaptive heuristic search algorithm based on evolutionary biology. By iteratively applying an operation analogous to a biologically inspired natural selection process (e.g., selection, crossover, and mutation), the variable subsets that yield lower model errors are selected [41].
The RF algorithm is a mathematically simple and computationally efficient technique for variable selection that borrows from the reversible jump MCMC framework. It executes a search in the model space through both fixed- and trans-dimensional moves between different models, and a pseudo-MCMC chain is then computed and used to calculate the selection probability for each variable. Important variables can be selected in terms of their ranking based on the selection probability [42].
CARS algorithm selects an optimal combination of key variables from multiple input variables based on the principle of “survival of the fittest”. Variables with relatively small absolute coefficients were removed using an exponentially decreasing function and adaptive reweighted sampling [43].
All three algorithms were executed in MATLAB R2020a. The code for GA [44] was acquired from https://ucphchemometrics.com/186-2/algorithms/ (accessed on 10 January 2023). The codes for RF and CARS [45] were acquired from http://www.libpls.net/download.php (accessed on 10 January 2023).

2.6. Calibration and Evaluation of the SOM Retrieval Model

To build an accurate SOM retrieval model, each single-date image (Table 1) and multi-temporal image dataset (i.e., various year interval groups; Table 2) were respectively calibrated with SOM by coupling PLSR and variable selection algorithms on all band reflectance and spectral indices.
The PLSR is a multivariate regression approach based on the orthogonal characteristic vectors of predicted values and observable variables [46]. It integrates the advantages of multiple linear regression, principal components, and typical correlation analyses and ensures the stability and excellent performance of models [47]. In this study, PLSR was executed in MATLAB with the libPLS toolbox (version 1.95) [45].
A leave-one-out cross-validation procedure was applied to evaluate the SOM retrieval models due to the limited number of samples in our study. This was based on two indicators, namely, the coefficient of determination (R2) and root mean squared error (RMSE). R2 assesses the model stability, wherein a higher value indicates a higher stability. The RMSE was used to evaluate the consistency between the prediction values of the models and the observed values. A smaller RMSE indicates higher accuracy. These values were calculated as follows:
R 2 = 1 - i = 1 n y i - y ^ i 2 i = 1 n y i - y ¯ 2
R M S E = 1 n i = 1 n y i - y ^ i 2
where n is the number of samples, and y i and y ^ i represent the measured and predicted values of SOM at site i, respectively.
The performance of the three variable selection algorithms was first compared according to their cross-validation results for single-date images, and only the optimal variable selection algorithm was kept for multi-temporal images. The model with the highest retrieval accuracy was used for SOM mapping on the ArcGIS 10.5 platform.

3. Results

3.1. Descriptive Statistics of SOM Contents

Among the 76 soil samples, three were excluded as outliers based on the Pauta criterion and Monte Carlo cross-validation results [48]. The SOM content of the remaining 73 samples ranged from 14.05 to 122.15 g/kg, with a mean and standard deviation of 50.93 and 19.25 g/kg, respectively. The coefficient of variation of SOM was 38%, indicating strong variability according to the categorized standard proposed by Wilding [49]. The average SOM was higher in the study area than in croplands across Northeast China [50]. A wide range of SOM values might be beneficial for accurate SOM retrieval [51].

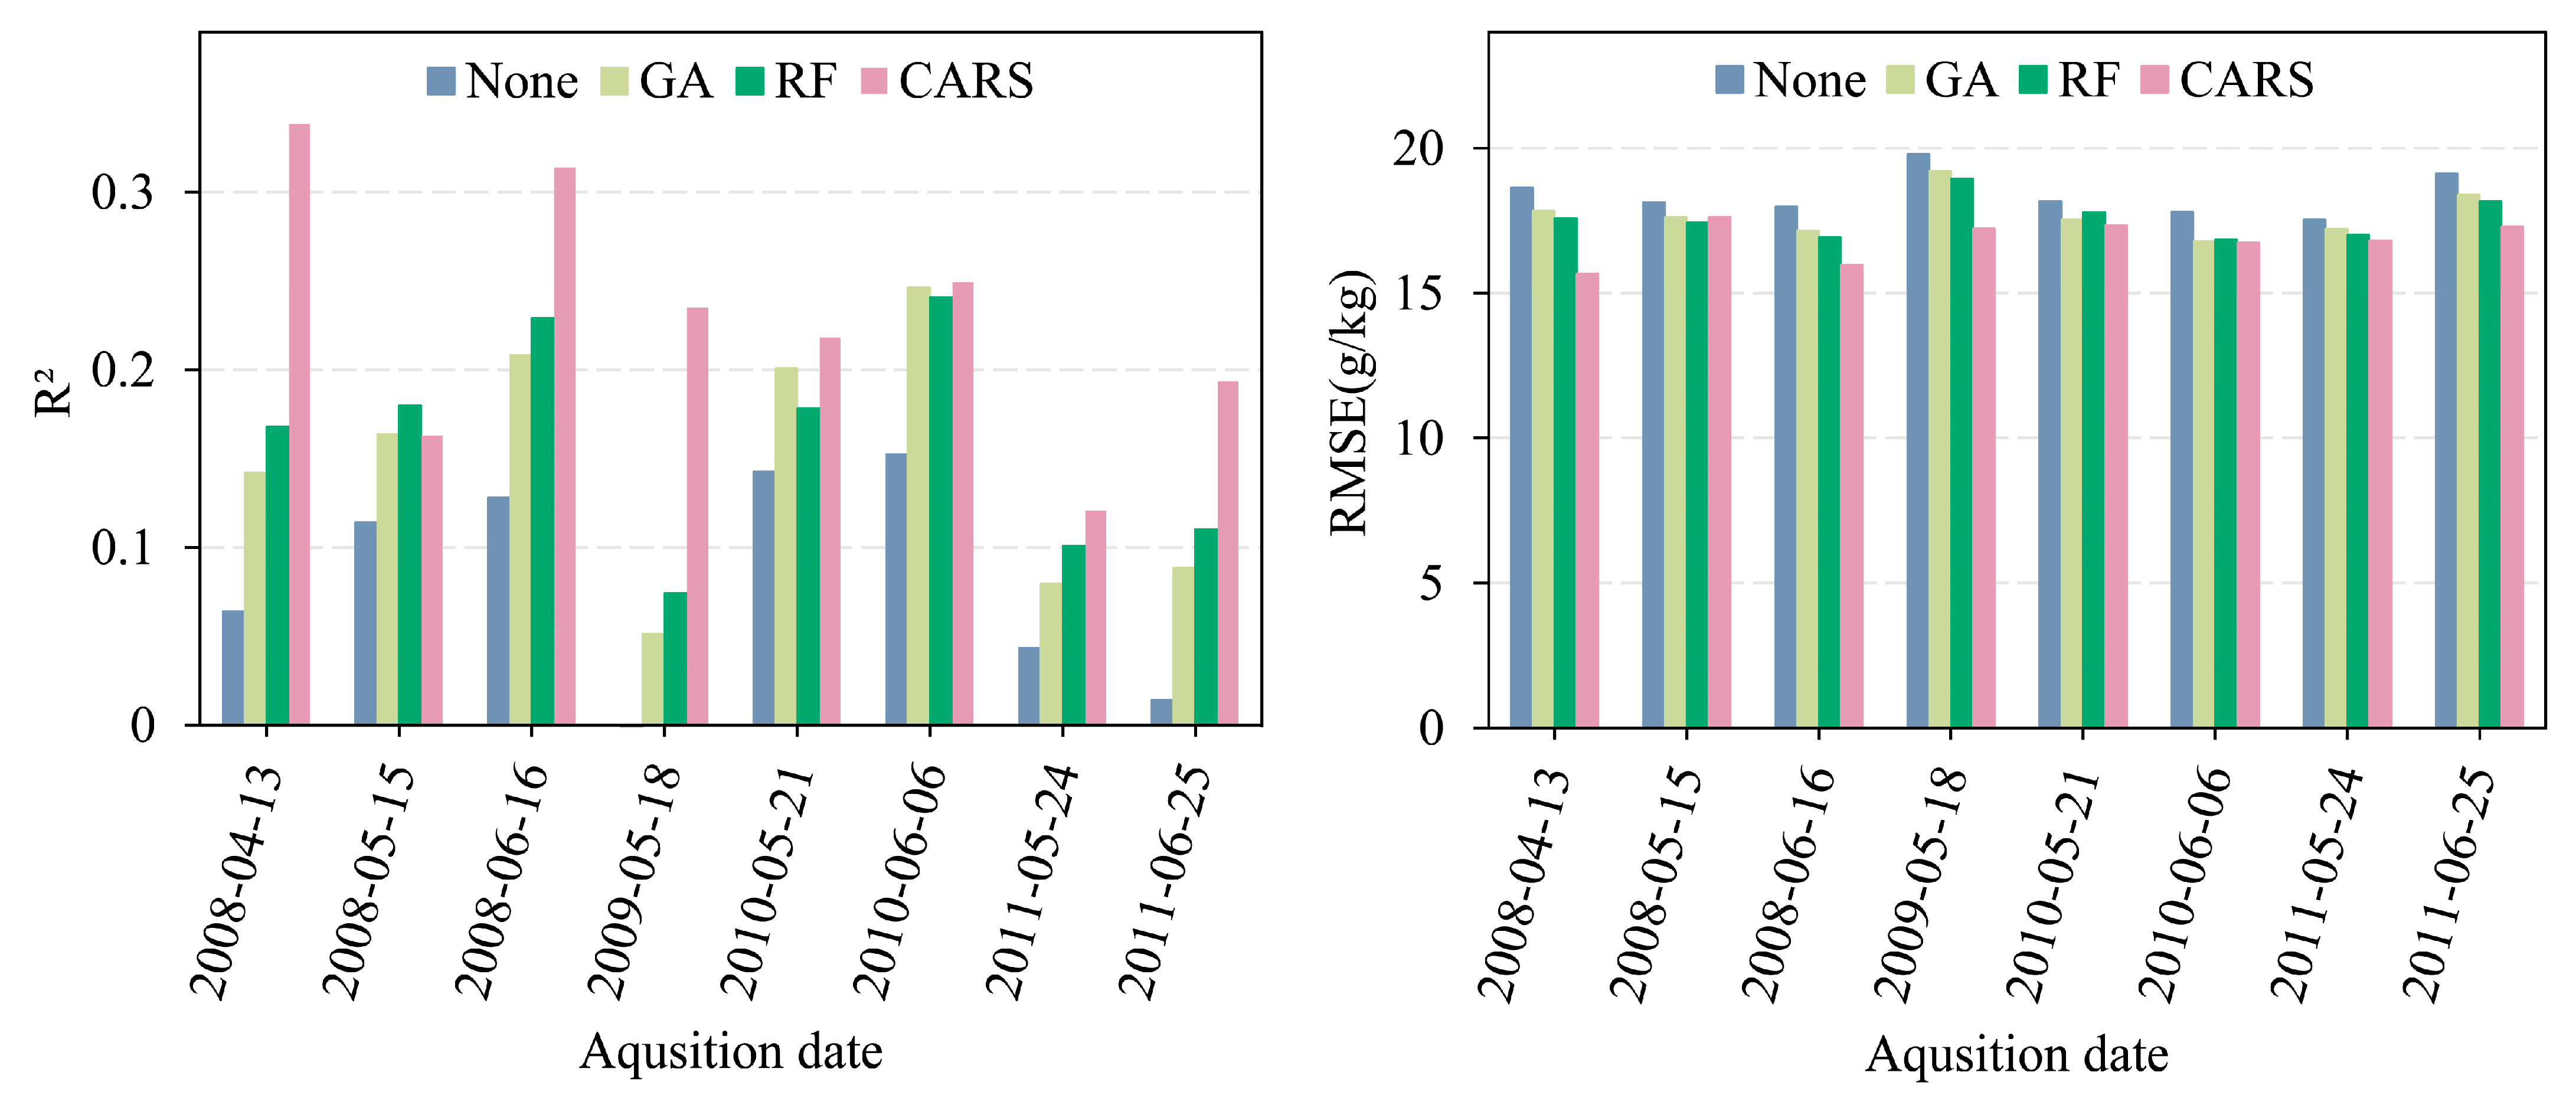
3.2. Retrieval Performance of Single-Date Images

The SOM retrieval results obtained using a single-date image are shown in Figure 2. When all the bands and spectral indices were used without variable selection, the retrieval accuracy of SOM was low for nearly all single-date images. For each image, the retrieval accuracy of SOM improved after variable selection, irrespective of the algorithm. Taking the image acquired on 16 June 2008 as an example, the R2 was below 0.13 and RMSE was as high as 17.98 g/kg when not selecting variables in advance, while the R2 increased to 0.31 and RMSE decreased to 15.95 g/kg when using the CARS algorithm. Among the three algorithms, CARS performed better than GA and RF, except for the image acquired on 15 May 2008, where the SOM retrieval accuracies were slightly higher for GA and RF. The optimal result of the single-date images was obtained from the image acquired on 13 April 2008 after variable selection using CARS, with an R2 of 0.34 and an RMSE of 15.66 g/kg. GA and RF presented similar SOM retrieval results. The best results of GA and RF were obtained from the image acquired on 6 June 2010, wherein the R2 and RMSE values were 0.25 and 16.77 g/kg, and 0.24 and 16.83 g/kg, respectively.
Although the variable selection algorithms improved the retrieval accuracy of SOM, the retrieval accuracies (Figure 2) of different images showed substantial differences. For example, when using CARS, the retrieval accuracy of the image acquired on 24 May 2011 was not as high as that of the image acquired on 13 April 2008, with R2 and RMSE values of 0.12 and 16.80 g/kg, respectively. This indicates that using a single-date image may result in an inaccurate SOM retrieval model, potentially due to the effects of soil moisture or surface cover.

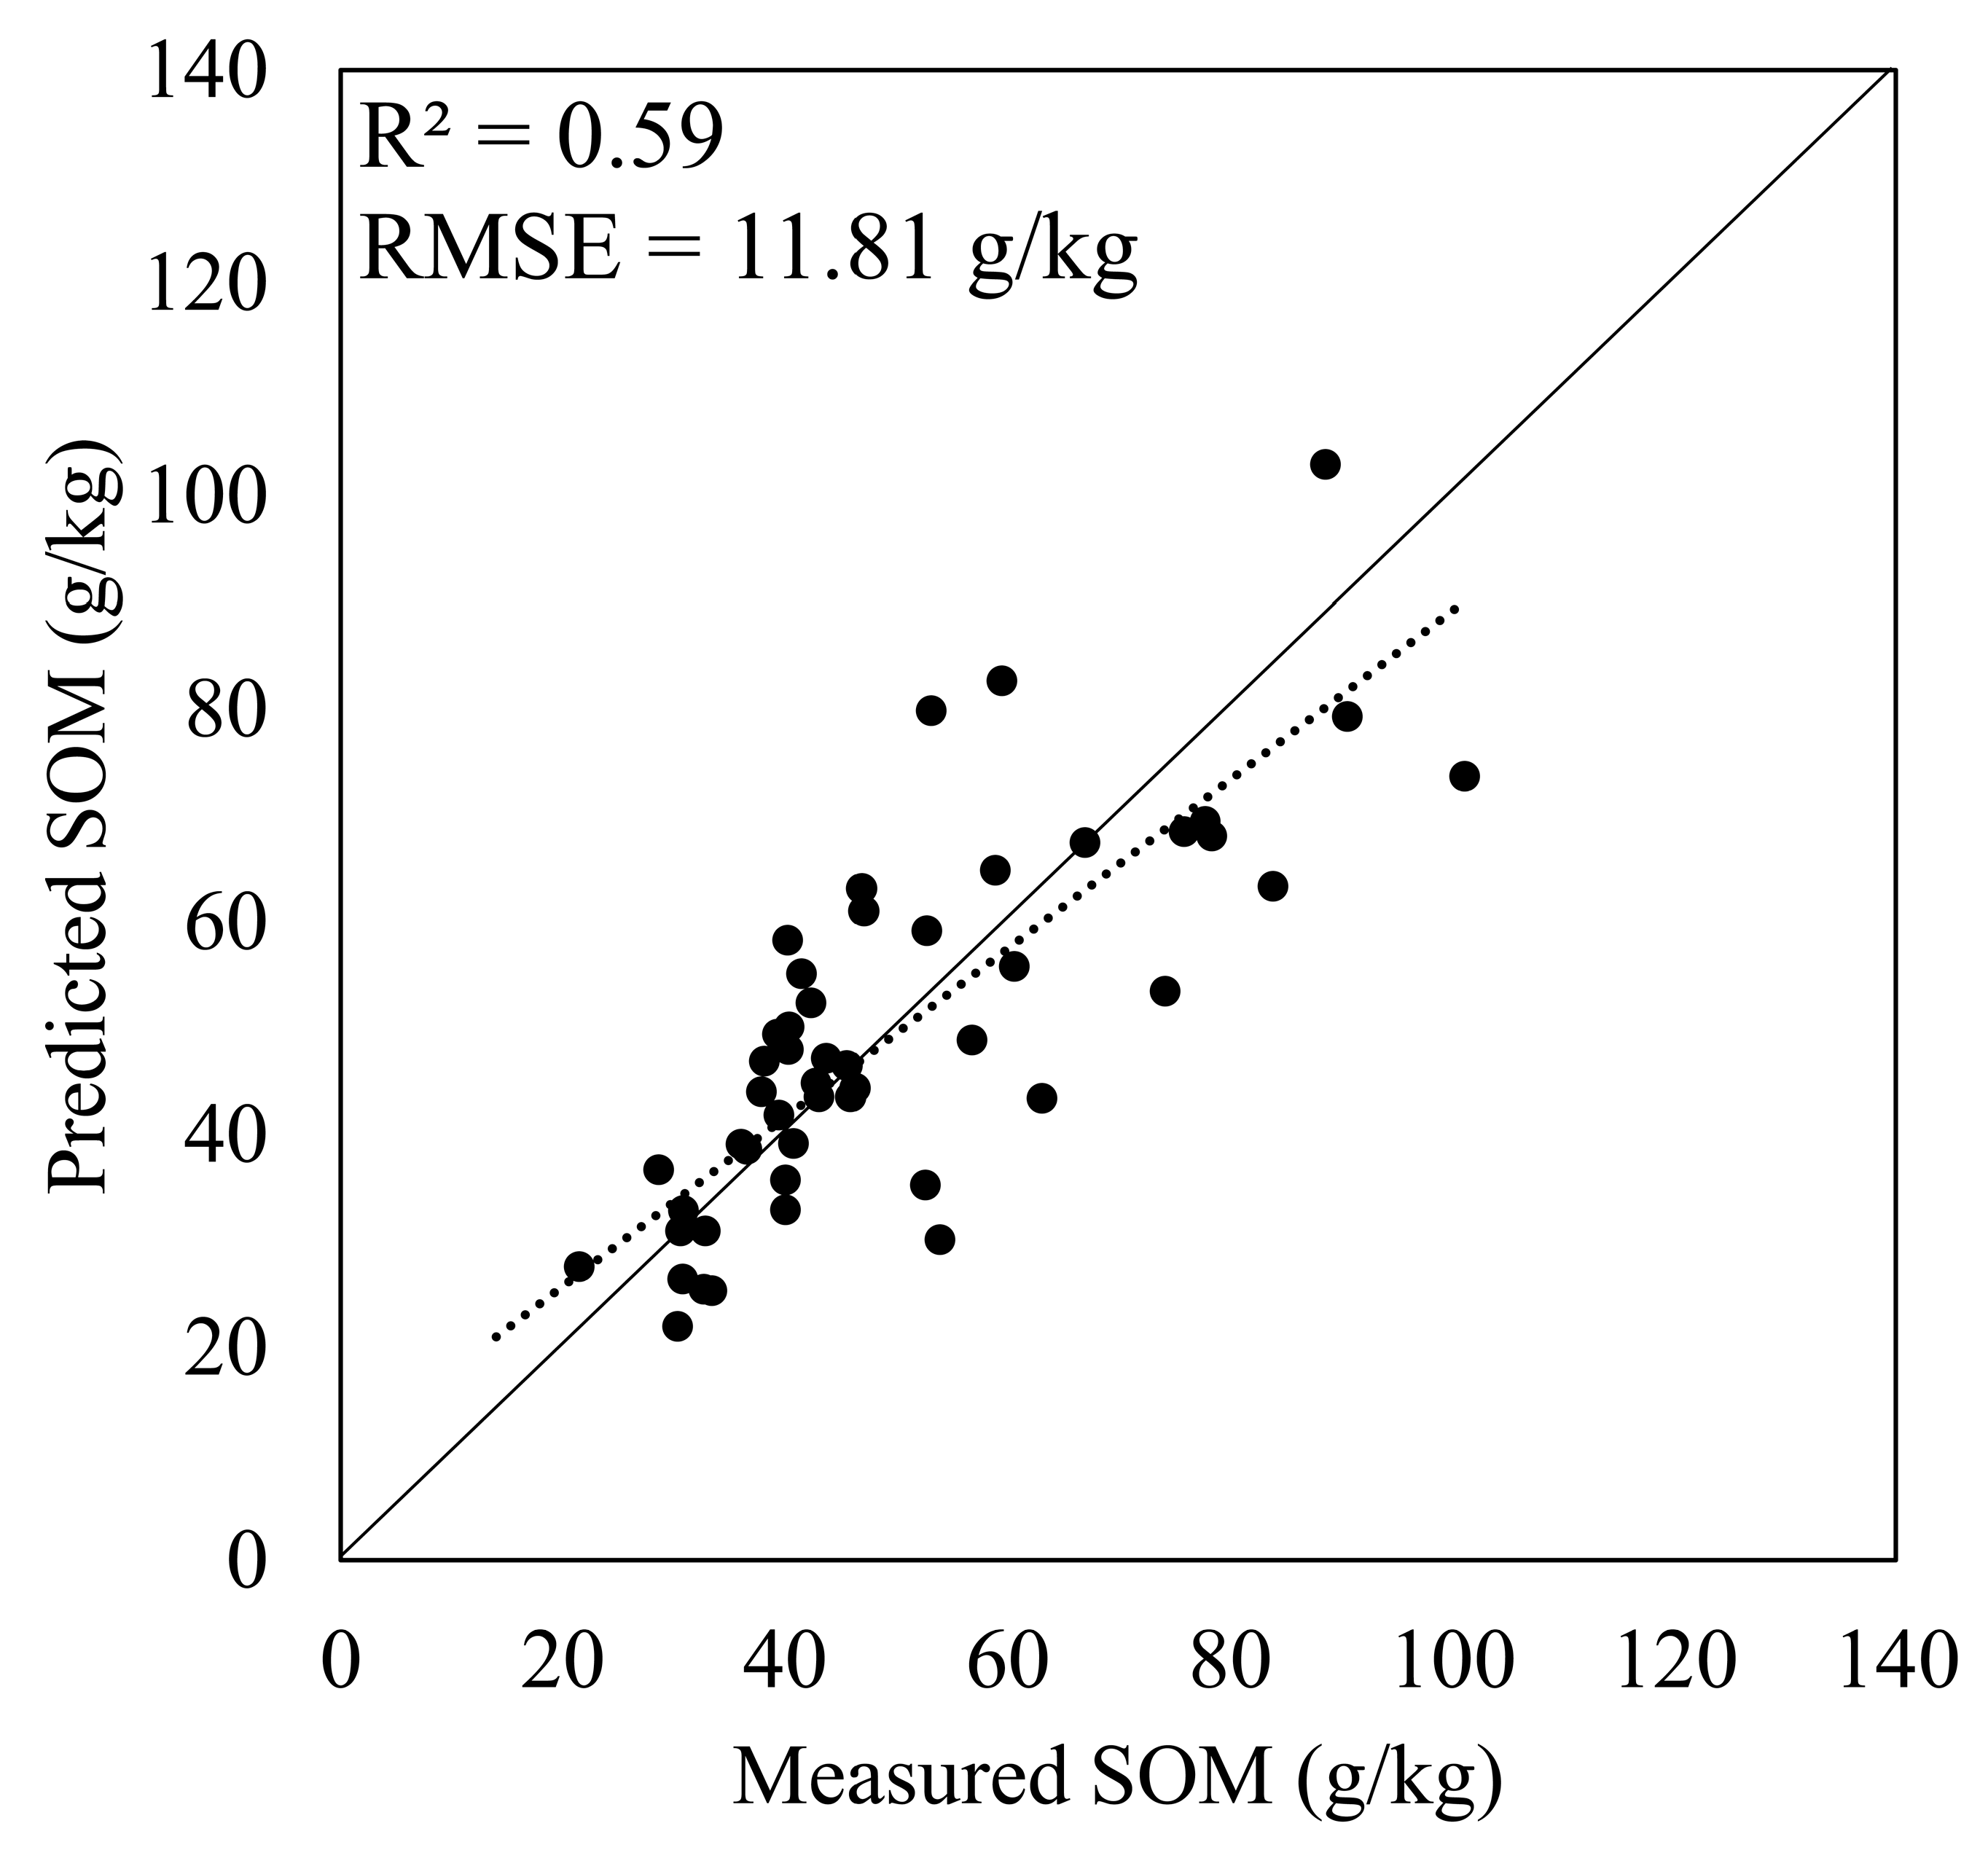
3.3. Retrieval Performance of Multi-Temporal Images

Given that CARS performed better than GA and RF in improving SOM retrieval on single-date images (Figure 2), and a similar result was found when they were used in multi-temporal images, only the SOM retrieval results related to CARS were described here for clarity. In general, the retrieval accuracy of SOM using multi-temporal images was higher than that using single-date images (Table 3 vs. Figure 2). The SOM retrieval accuracy of the images in one year was better than that of the single-date images (the optimal result: R2 = 0.43 and RMSE = 14.60 g/kg vs. R2 = 0.34 and RMSE = 15.66 g/kg). When using the images in two years, the accuracy further improved, and the R2 value was as high as 0.50. When more images were included in the SOM retrieval models, the accuracy improved further. The 2008–2011 group comprised the images in four years and presented the optimal accuracy with R2 and RMSE values of 0.59 and 11.81 g/kg, respectively (Figure 3). The reason for this might be that multi-temporal images provided more temporal information that was helpful for acquiring soil spectra free from the effects of external factors.
The 2008–2011 group contained all the single-date images used in the study; therefore, we used the variables selected by CARS to illustrate the important variable types and image acquisition dates that greatly influenced the SOM retrieval. As shown in Figure 4, a total of four bands (including three types of spectral bands: blue, red, and near-infrared bands) and 21 spectral indices (including 10 types of spectral indices) were selected in the SOM retrieval model from 408 variables derived from images in the 2008–2011 group. This indicated that spectral indices may play a more important role than band reflectance in SOM retrieval. However, not all the indices were retained in the model. A total of 17 DI and four NDI (Figure 4) were included in the 21 spectral indices selected, whereas none of the RI were kept in the model. Among all the selected DI, DI 57 was chosen most, with five out of eight images, probably due to fundamental vibrational bonds related to SOM emerging in the spectral regions of Band 5 and Band 7. Both Band 5 and Band 7 were not chosen, which could be due to the fact that they were prone to external effects such as soil moisture [15]; combining them into DI could alleviate these effects. In comparison, visible and near-infrared bands (Band 1, Band 3 and Band 4) were less sensitive to soil moisture [52]; thus, they were selected by CARS.
Among the eight images in the 2008–2011 group, there were three, one, two, and two images for 2008, 2009, 2010, and 2011, respectively. However, three, four, ten, and eight variables were selected in 2008, 2009, 2010, and 2011, respectively. Six variables were derived from the image acquired on 6 June 2010 and four were from the image acquired on 21 May 2010, whereas only one variable was kept for each image acquired in 2008. Considering that the soil samples were collected in 2010, this finding might suggest that the images closer to the soil sampling date were more important for SOM retrieval.

3.4. Mapping of SOM in the Study Area

In the above analysis, the optimal result of SOM retrieval was achieved by the multi-temporal images in the 2008–2011 group, in which the variables useful for SOM retrieval were identified by CARS as input in a PLSR model related to SOM. This model was used for SOM mapping. As all the soil samples were collected in croplands in our study, the non-cultivated land was masked. As shown in Figure 5, the SOM pattern was consistent between the predicted and measured values due to the relatively high retrieval accuracy of SOM (Table 3 and Figure 3). The results indicated that SOM exhibited apparent spatial heterogeneity. The low values were primarily distributed in the central flat area. The high values were mainly concentrated in the fields at the foot of the southwest hills and around wetlands where the croplands were reclaimed in a short period because less SOM had been decomposed after a short reclamation period [53]. Fine spatial SOM differences were observed on a small scale because of differences in field management practices, such as fertilizers [54]. Therefore, the SOM map based on multi-temporal images could be used to support efficient field management.

4. Discussion

4.1. Importance of Variable Selection in SOM Retrieval

In the study, to subdue the adverse effects of possible external factors such as soil moisture, three types of spectral indices (i.e., RI, DI, and NDI) were employed and combined with spectral bands into PLSR models. This resulted in 45 indices and six bands as input variables for each single-date image model. Nevertheless, the performance of full-variable models without variable selection was unsatisfactory for SOM retrieval based on single-date images (R2 < 0.15, as shown in Figure 2). Sun et al. [55] used a single-date hyperspectral image in the region of 390–1029 nm acquired by the Gaofen-5 satellite for SOM retrieval and achieved slightly better accuracy than ours when the bands were not selected (R2 = 0.35). The poor performance of the full-variable models could be caused by a multicollinearity issue associated with spectral information redundancy. Indeed, some input variables may be irrelevant to SOM, and may even be unfavorable for getting accurate results [56]. For example, Ma et al. [57] found that the SOM retrieval accuracy was lower for all 152 spectral variables that originated from Sentinel2 imagery, including 11 spectral bands and 141 spectral indices, than for a selected subset of 55 spectral variables extracted by a multi-layer perceptron algorithm.
To improve SOM retrieval, we adopted GA, RF, and CARS to select the spectral variables. In the literature, these algorithms were usually used to select spectral bands from hyperspectral data for retrieving soil properties of interest. For example, Kawamura et al. [58] applied GA to select variables for retrieving soil phosphorus and found that important bands were located in regions related to Fe oxide. For retrieving soil total nitrogen, Yao et al. [59] found that the bands in 1108, 1248, 1336, 1537, 1754, and 2314 nm selected by the RF algorithm performed well with R2 > 0.9. Our research also demonstrated that these algorithms were beneficial in SOM retrieval based on multispectral images. In the study, the PLSR model achieved higher accuracy after selecting efficient variables for SOM through variable selection. When using CARS to select spectral variables from the multi-temporal images in the 2008–2011 group, the retrieval accuracy of SOM was high, with R2 = 0.59 and RMSE = 11.81 g/kg. This result was similar to that of the SOC prediction based on Sentinel2 multi-temporal images (R2 = 0.62) [60], and even better than that of a Hyperion image (R2 = 0.51) [61]. In addition, a limited number of variables could decrease the complexity of the model and thus improve computational efficiency. Therefore, variable selection was necessary for high retrieval accuracy of soil properties, especially when using multi-temporal images where many variables were available.
Among the three variable selection algorithms used in this study, CARS performed best for both the single-date images (Figure 2) and the multi-temporal images (not shown). This might be caused by the differences in their search mechanisms, leading to different types and numbers of selected variables. In the study, the results showed that CARS was more efficient in selecting variables related to SOM retrieval when using multispectral satellite RS data. The algorithm also performed well in the airborne hyperspectral image for SOC retrieval, as the R2 value increased to 0.76 [62]. However, the selected variables related to SOM retrieval might be dependent on the area because differences in soil types and field management practices have an impact on the resulting variables [63]. Therefore, it is necessary to test various variable selection algorithms for optimal SOM retrieval.

4.2. Advantages of Multi-Temporal Images

Cultivated soils are easily influenced by surface cover, such as crops and crop residues and soil conditions such as soil moisture. These factors could limit the availability of high-quality RS data. Therefore, using a single-date image to retrieve soil properties might result in inconsistent results. For example, when using a single-date Sentinel2 image to retrieve SOC, Vaudour et al. [20] achieved a relatively high accuracy in the Versailles Plain (marked by intensive crop cultivation) with an R2 value of 0.56, while a relatively low accuracy was achieved in the Peyne catchment (marked by vineyard cultivation) with an R2 value of 0.02. Inconsistent results were also observed in our study, wherein the R2 values ranged from 0.12 to 0.34 and the RMSE values ranged from 15.66 to 17.62 g/kg among single-date images, indicating low accuracy and high variability for SOM retrieval. These might be caused by the influence of some external factors on the images.
Selecting images acquired during the bare soil period could alleviate these effects. However, it is often difficult for a single-date image to capture this short time window because of the intensive field practices (e.g., irrigation) occurring within this period for cultivated soils and the relatively low temporal resolution of RS satellites. In the study, we proposed a framework for using multi-temporal images. First, we stacked the multi-temporal images into various year interval groups and then employed variable selection to identify beneficial variables for SOM retrieval. This strategy provided a relatively high accuracy (R2 = 0.59 and RMSE = 11.81 g/kg) when using the images of four years from 2008 to 2011; this result was similar to that obtained using multi-temporal mosaicking Sentinel2 imagery for SOC retrieval by Vaudour (R2 = 0.54) [64]. We found that more years of images could provide higher accuracy. Luo et al. [65] also showed a similar trend when using Landsat8 images on the Songnen Plain of Northeast China. In addition, the variation of accuracy was small in the same-year intervals. For example, when using the images of three years, the R2 values were 0.52 and 0.50 for the 2008–2010 and 2009–2011 groups, respectively. This suggested that multi-temporal images could ensure the stability and robustness of SOM retrieval.
In the literature, a bare pixel composite method was proposed to use multi-temporal images by calculating pixel composite values (e.g., mean) of the images during the bare soil period. For example, Diek et al. [22] used the composite data from long time-series Landsat images to retrieve the SOM in the Swiss Plateau. Compared to directly using a single-date image, the main advantage of this method is that it could extend the available area for remote sensing of soils by filling the gaps between different images. However, some temporal information might be lost after transforming multiple images into a single composite image. In our study, we directly stacked multi-temporal images without changing band reflectance, followed by variable selection to improve retrieval accuracy. Therefore, valuable temporal information (i.e., various soil spectra) could be kept for modeling. The SOM retrieval accuracy was similar to that obtained using Landsat8 multi-temporal composite images (average R2 of 0.608) in a region adjacent to the study area [65]. Therefore, the proposed framework is competitive.

4.3. Influence of Time Intervals in Multi-Temporal Images on SOM Retrieval

The SOM retrieval accuracy was higher when more years of images were included (Table 3). However, using more images could limit the spatial coverage because the images were often affected by clouds and cloud shadows, and the resulting coverage was determined by the intersection of pixels free of clouds and cloud shadows for each image. In the study, we selected all images acquired during the bare soil period (April, May, and June), from 2008 to 2011. The average cloud cover of the 15 images was 30.93% (Table 1), resulting in not all collected samples being covered. To ensure a certain number of samples for modeling, we removed images that covered fewer than 60 samples. After stacking all the remaining images for modeling, the number of remaining samples was further decreased to 51. However, when using two or three years of images, the spatial coverage was relatively large, and more samples were kept for modeling, with, for example, 66 and 55 samples remaining for the 2008–2009 and the 2008–2010 groups, respectively. The SOM retrieval accuracies for the 2008–2009 and 2008–2010 groups were acceptable, with R2 values of 0.50 and 0.52, respectively (Table 3). Therefore, although more years of imaging could provide higher accuracy, it is important to balance the retrieval accuracy and the spatial coverage based on real requirements. Various year intervals are suggested to be experimented with for decision making.
It should be noted that the images acquired on different dates played different roles in SOM retrieval when using multi-temporal data, as shown by the selected variables in Figure 4. In the study, the images closer to the soil sampling date were more important. Among the 25 variables selected in the four years from 2008 to 2011, 10 of them (40%) were derived from the images acquired in the year of soil sampling in 2010. Four and eight variables were derived from the images acquired in 2009 and 2011, respectively, while only three variables were derived from the images acquired in 2008. Therefore, designing the year intervals centered on the sample date and then extending them forward and backward according to the availability of images would be helpful for highly accurate SOM retrieval.

4.4. Implications, Limitations and Future Research

The proposed framework using multi-temporal images provides a good approach for remote sensing of SOM. The resulting SOM map could be used to guide the utilization and management of soil resources. For example, it could aid to divide different fertility areas based on different SOM levels. The proposed framework might be applicable for retrieving other soil properties (e.g., soil total nitrogen). Additionally, it might have better performance in the regions with a longer bare soil period and less influence of clouds and cloud shadows than the Sanjiang Plain. In these types of regions, higher accuracy of SOM retrieval could be expected.
Although the proposed framework improved SOM retrieval accuracy, we only selected four years of images centered on the sampling year to ensure high spatial coverage of the image cube stacked with multi-temporal images. For soil properties that change slowly, such as SOM, images with longer time spans could be used. For example, Dou et al. [63] used RS images captured 12 years before the sampling time for SOM retrieval. In the future, multi-source RS data including Landsat 8 and 9, and Sentinel2 should be combined into multi-source and multi-temporal image datasets to improve SOM retrieval due to their high signal-to-noise ratio and spatial resolution compared with the Landsat 5 imagery used in the study. The proposed framework could also be compared with the bare soil composite method in areas where many high-quality multi-temporal images are available. Moreover, in the study area, drylands and paddy fields were mixed. Different spectral characteristics among them might influence the SOM retrieval accuracy due to their different field management practices. Whether retrieving SOM separately in drylands and paddy fields is helpful for improving retrieval accuracy remains to be verified. In addition, a limited number of soil samples were used in the study. Although a leave-one-out cross-validation method was employed to evaluate the performance of SOM retrieval, the findings might be affected by the number of soil samples. Therefore, in the future, more samples should be collected, and an independent validation sample set should be used to further investigate the proposed framework.

5. Conclusions

The study proposed a framework for using multi-temporal images to improve SOM retrieval accuracy. In this framework, the spectral bands and indices derived from the multi-temporal images were directly stacked, followed by variable selection algorithms in modeling for the SOM retrieval. Based on this framework, PLSR models that coupled the various year intervals of multi-temporal images and three algorithms were built for SOM retrieval in a typical county of the Sanjing Plain in Northeast China. The results indicated that the proposed framework could improve the accuracy of SOM retrieval, compared with that of single-date images, with the highest R2 value of 0.59 and the lowest RMSE value of 11.81 g/kg. By comparing the performance of multi-temporal images among various year intervals, we found that more years of images could provide higher retrieval accuracy. The 2008–2011 year interval group showed the best performance, and the images closer to the soil sampling date were more important for SOM retrieval. In addition, the combination of variable selection algorithms and PLSR outperformed using PLSR alone, and CARS performed better than GA and RF, indicating the necessity of variable selection when using multi-temporal images for SOM retrieval in the framework. Therefore, we suggest that multi-temporal images centered on the sampling date and various variable selection algorithms should be coupled for SOM retrieval when using the framework for remote sensing of soils in practice. In the future, multi-temporal and multi-source RS data, such as Landsat8 and Sentinel2, could be combined to further improve SOM retrieval.

Author Contributions

Conceptualization, X.P., C.W. and H.M.; methodology, H.M. and X.W.; software, H.M.; validation, F.Z., Z.Y. and C.Y.; writing—original draft preparation, H.M. and C.W.; writing—review and editing, H.M., J.L. and C.W.; funding acquisition, C.W. and X.P. All authors have read and agreed to the published version of the manuscript.

Funding

This research was funded by National Key R&D Program of China (Grant No. 2021YFD1500102) and Strategic Priority Research Program of the Chinese Academy of Sciences (Grant No. XDA28010102, XDA28050101).

Data Availability Statement

Data available on request due to privacy or ethical restrictions.

Conflicts of Interest

The authors declare no conflict of interest.

References

  1. Tiessen, H.; Cuevas, E.; Chacon, P. The role of soil organic matter in sustaining soil fertility. Nature 1994, 371, 783–785. [Google Scholar] [CrossRef]
  2. Sparling, G.P.; Wheeler, D.; Vesely, E.T.; Schipper, L.A. What Is Soil Organic Matter Worth? J. Environ. Qual. 2006, 35, 548–557. [Google Scholar] [CrossRef] [PubMed]
  3. Palm, C.; Sanchez, P.; Ahamed, S.; Awiti, A. Soils: A Contemporary Perspective. Annu. Rev. Environ. Resour. 2007, 32, 99–129. [Google Scholar] [CrossRef] [Green Version]
  4. Hoffland, E.; Kuyper, T.W.; Comans, R.N.J.; Creamer, R.E. Eco-functionality of organic matter in soils. Plant Soil 2020, 455, 1–22. [Google Scholar] [CrossRef]
  5. Martin, M.P.; Orton, T.G.; Lacarce, E.; Meersmans, J.; Saby, N.P.A.; Paroissien, J.B.; Jolivet, C.; Boulonne, L.; Arrouays, D. Evaluation of modelling approaches for predicting the spatial distribution of soil organic carbon stocks at the national scale. Geoderma 2014, 223, 97–107. [Google Scholar] [CrossRef] [Green Version]
  6. Guo, X.; Meng, M.; Zhang, J.; Chen, H.Y.H. Vegetation change impacts on soil organic carbon chemical composition in subtropical forests. Sci. Rep. 2016, 6, 29607. [Google Scholar] [CrossRef] [Green Version]
  7. Guo, L.; Fu, P.; Shi, T.; Chen, Y.; Zhang, H.; Meng, R.; Wang, S. Mapping field-scale soil organic carbon with unmanned aircraft system-acquired time series multispectral images. Soil Tillage Res. 2020, 196, 104477. [Google Scholar] [CrossRef]
  8. Goidts, E.; van Wesemael, B. Regional assessment of soil organic carbon changes under agriculture in Southern Belgium (1955–2005). Geoderma 2007, 141, 341–354. [Google Scholar] [CrossRef]
  9. Venter, Z.S.; Hawkins, H.-J.; Cramer, M.D.; Mills, A.J. Mapping soil organic carbon stocks and trends with satellite-driven high resolution maps over South Africa. Sci. Total Environ. 2021, 771, 145384. [Google Scholar] [CrossRef]
  10. Heil, J.; Jörges, C.; Stumpe, B. Fine-Scale Mapping of Soil Organic Matter in Agricultural Soils Using UAVs and Machine Learning. Remote Sens. 2022, 14, 3349. [Google Scholar] [CrossRef]
  11. Marchetti, A.; Piccini, C.; Francaviglia, R.; Mabit, L. Spatial Distribution of Soil Organic Matter Using Geostatistics: A Key Indicator to Assess Soil Degradation Status in Central Italy. Pedosphere 2012, 22, 230–242. [Google Scholar] [CrossRef]
  12. Sahu, B.; Ghosh, A.K.; Seema. Deterministic and geostatistical models for predicting soil organic carbon in a 60 ha farm on Inceptisol in Varanasi, India. Geoderma Reg. 2021, 26, e00413. [Google Scholar] [CrossRef]
  13. Bartholomeus, H.M.; Schaepman, M.E.; Kooistra, L.; Stevens, A.; Hoogmoed, W.B.; Spaargaren, O.S.P. Spectral reflectance based indices for soil organic carbon quantification. Geoderma 2008, 145, 28–36. [Google Scholar] [CrossRef]
  14. Conforti, M.; Castrignanò, A.; Robustelli, G.; Scarciglia, F.; Stelluti, M.; Buttafuoco, G. Laboratory-based Vis–NIR spectroscopy and partial least square regression with spatially correlated errors for predicting spatial variation of soil organic matter content. CATENA 2015, 124, 60–67. [Google Scholar] [CrossRef]
  15. Viscarra Rossel, R.; Behrens, T. Using data mining to model and interpret soil diffuse reflectance spectra. Geoderma 2010, 158, 46–54. [Google Scholar] [CrossRef]
  16. Shi, Z.; Wang, Q.; Peng, J.; Ji, W.; Liu, H.; Li, X.; Viscarra Rossel, R.A. Development of a national VNIR soil-spectral library for soil classification and prediction of organic matter concentrations. Sci. China Earth Sci. 2014, 57, 1671–1680. [Google Scholar] [CrossRef]
  17. Peón, J.; Recondo, C.; Fernández, S.; Calleja, J.F.; De Miguel, E.; Carretero, L. Prediction of Topsoil Organic Carbon Using Airborne and Satellite Hyperspectral Imagery. Remote Sens. 2017, 9, 1211. [Google Scholar] [CrossRef] [Green Version]
  18. Castaldi, F.; Palombo, A.; Santini, F.; Pascucci, S.; Pignatti, S.; Casa, R. Evaluation of the potential of the current and forthcoming multispectral and hyperspectral imagers to estimate soil texture and organic carbon. Remote Sens. Environ. 2016, 179, 54–65. [Google Scholar] [CrossRef]
  19. Winowiecki, L.; Vågen, T.-G.; Huising, J. Effects of land cover on ecosystem services in Tanzania: A spatial assessment of soil organic carbon. Geoderma 2016, 263, 274–283. [Google Scholar] [CrossRef] [Green Version]
  20. Vaudour, E.; Gomez, C.; Fouad, Y.; Lagacherie, P. Sentinel-2 image capacities to predict common topsoil properties of temperate and Mediterranean agroecosystems. Remote Sens. Environ. 2019, 223, 21–33. [Google Scholar] [CrossRef]
  21. Luo, C.; Wang, Y.; Zhang, X.; Zhang, W.; Liu, H. Spatial prediction of soil organic matter content using multiyear synthetic images and partitioning algorithms. CATENA 2022, 211, 106023. [Google Scholar] [CrossRef]
  22. Diek, S.; Fornallaz, F.; Schaepman, M.E.; De Jong, R. Barest Pixel Composite for Agricultural Areas Using Landsat Time Series. Remote Sens. 2017, 9, 1245. [Google Scholar] [CrossRef] [Green Version]
  23. Wu, C.; Zhang, L.; Du, B. Targeted change detection for stacked multi-temporal hyperspectral image. In Proceedings of the 2012 4th Workshop on Hyperspectral Image and Signal Processing: Evolution in Remote Sensing (WHISPERS), Shanghai, China, 4–7 June 2012; pp. 1–4. [Google Scholar]
  24. Wu, K.; Chen, T.; Xu, Y.; Song, D.; Li, H. A Novel Change Detection Approach Based on Spectral Unmixing from Stacked Multitemporal Remote Sensing Images with a Variability of Endmembers. Remote Sens. 2021, 13, 2550. [Google Scholar] [CrossRef]
  25. Gasmi, A.; Gomez, C.; Chehbouni, A.; Dhiba, D.; Elfil, H. Satellite Multi-Sensor Data Fusion for Soil Clay Mapping Based on the Spectral Index and Spectral Bands Approaches. Remote Sens. 2022, 14, 1103. [Google Scholar] [CrossRef]
  26. Gayou, O.; Das, S.K.; Zhou, S.-M.; Marks, L.B.; Parda, D.S.; Miften, M. A genetic algorithm for variable selection in logistic regression analysis of radiotherapy treatment outcomes. Med. Phys. 2008, 35, 5426–5433. [Google Scholar] [CrossRef] [PubMed] [Green Version]
  27. Sun, J.; Yang, W.; Feng, M.; Liu, Q.; Kubar, M.S. An efficient variable selection method based on random frog for the multivariate calibration of NIR spectra. RSC Adv. 2020, 10, 16245–16253. [Google Scholar] [CrossRef] [Green Version]
  28. Ji, H.; Wang, W.; Chong, D.; Zhang, B. CARS Algorithm-Based Detection of Wheat Moisture Content before Harvest. Symmetry 2020, 12, 115. [Google Scholar] [CrossRef] [Green Version]
  29. Fang, C.; Wen, Z.; Li, L.; Du, J.; Liu, G.; Wang, X.; Song, K. Agricultural Development and Implication for Wetlands Sustainability: A Case from Baoqing County, Northeast China. Chin. Geogr. Sci. 2019, 29, 231–244. [Google Scholar] [CrossRef] [Green Version]
  30. Micheli, E.; Schád, P.; Spaargaren, O.; Dent, D.; Nachtergaele, F. World Reference Base for Soil Resources: 2006: A Framework for International Classification, Correlation and Communication. World Soil Resources Reports No. 103; FAO: Rome, Italy, 2006; pp. 1–145. ISBN 92-5-105511-4. [Google Scholar]
  31. Shi, X.Z.; Yu, D.S.; Xu, S.X.; Warner, E.D.; Wang, H.J.; Sun, W.X.; Zhao, Y.C.; Gong, Z.T. Cross-reference for relating Genetic Soil Classification of China with WRB at different scales. Geoderma 2010, 155, 344–350. [Google Scholar] [CrossRef]
  32. Pan, T.; Bao, Z.; Ning, L.; Tong, S. Change of Rice Paddy and Its Impact on Human Well-Being from the Perspective of Land Surface Temperature in the Northeastern Sanjiang Plain of China. Int. J. Environ. Res. Public Health 2022, 19, 9690. [Google Scholar] [CrossRef]
  33. Yang, H.; Zhang, X.; Xu, M.; Shao, S.; Wang, X.; Liu, W.; Wu, D.; Ma, Y.; Bao, Y.; Zhang, X.; et al. Hyper-temporal remote sensing data in bare soil period and terrain attributes for digital soil mapping in the Black soil regions of China. CATENA 2020, 184, 104259. [Google Scholar] [CrossRef]
  34. Chen, H.; Pan, T.; Chen, J.; Lu, Q. Waveband selection for NIR spectroscopy analysis of soil organic matter based on SG smoothing and MWPLS methods. Chemom. Intell. Lab. Syst. 2011, 107, 139–146. [Google Scholar] [CrossRef]
  35. Zhao, Y.; Wang, M.; Hu, S.; Zhang, X.; Ouyang, Z.; Zhang, G.; Huang, B.; Zhao, S.; Wu, J.; Xie, D.; et al. Economics- and policy-driven organic carbon input enhancement dominates soil organic carbon accumulation in Chinese croplands. Proc. Natl. Acad. Sci. USA 2018, 115, 4045–4050. [Google Scholar] [CrossRef] [PubMed] [Green Version]
  36. Xiao, W.; Chen, W.; He, T.; Ruan, L.; Guo, J. Multi-Temporal Mapping of Soil Total Nitrogen Using Google Earth Engine across the Shandong Province of China. Sustainability 2020, 12, 10274. [Google Scholar] [CrossRef]
  37. Aksoy, S.; Yildirim, A.; Gorji, T.; Hamzehpour, N.; Tanik, A.; Sertel, E. Assessing the performance of machine learning algorithms for soil salinity mapping in Google Earth Engine platform using Sentinel-2A and Landsat-8 OLI data. Adv. Space Res. 2022, 69, 1072–1086. [Google Scholar] [CrossRef]
  38. Zhang, M.; Liu, H.; Zhang, M.; Yang, H.; Jin, Y.; Han, Y.; Tang, H.; Zhang, X.; Zhang, X. Mapping Soil Organic Matter and Analyzing the Prediction Accuracy of Typical Cropland Soil Types on the Northern Songnen Plain. Remote Sens. 2021, 13, 5162. [Google Scholar] [CrossRef]
  39. Wang, X.; Wang, L.; Li, S.; Wang, Z.; Zheng, M.; Song, K. Remote estimates of soil organic carbon using multi-temporal synthetic images and the probability hybrid model. Geoderma 2022, 425, 116066. [Google Scholar] [CrossRef]
  40. Wang, Y.; Luo, C.; Zhang, W.; Meng, X.; Liu, Q.; Zhang, X.; Liu, H. Remote Sensing Prediction Model of Cultivated Land Soil Organic Matter Considering the Best Time Window. Sustainability 2023, 15, 469. [Google Scholar] [CrossRef]
  41. Leardi, R.; Lupiáñez González, A. Genetic algorithms applied to feature selection in PLS regression: How and when to use them. Chemom. Intell. Lab. Syst. 1998, 41, 195–207. [Google Scholar] [CrossRef]
  42. Li, H.-D.; Xu, Q.; Liang, Y.-Z. Random frog: An efficient reversible jump Markov Chain Monte Carlo-like approach for variable selection with applications to gene selection and disease classification. Anal. Chim. Acta 2012, 740, 20–26. [Google Scholar] [CrossRef]
  43. Li, H.; Liang, Y.; Xu, Q.; Cao, D. Key wavelengths screening using competitive adaptive reweighted sampling method for multivariate calibration. Anal. Chim. Acta 2009, 648, 77–84. [Google Scholar] [CrossRef]
  44. Leardi, R. Application of genetic algorithm–PLS for feature selection in spectral data sets. J. Chemom. 2000, 14, 643–655. [Google Scholar] [CrossRef]
  45. Li, H.-D.; Xu, Q.-S.; Liang, Y.-Z. libPLS: An integrated library for partial least squares regression and linear discriminant analysis. Chemom. Intell. Lab. Syst. 2018, 176, 34–43. [Google Scholar] [CrossRef]
  46. Dong, Z.; Ma, N. A Novel Nonlinear Partial Least Square Integrated with Error-Based Extreme Learning Machine. IEEE Access 2019, 7, 59903–59912. [Google Scholar] [CrossRef]
  47. Wang, C.; Pan, X.; Zhou, R.; Liu, Y.; Li, Y.; Xie, X. Prediction of soil properties using PLSR-based soil-environment models. Acta Pedol. Sin. 2012, 49, 237–245. [Google Scholar]
  48. Liu, Z.; Cai, W.; Shao, X. Outlier detection in near-infrared spectroscopic analysis by using Monte Carlo cross-validation. Sci. China Ser. B Chem. 2008, 51, 751–759. [Google Scholar] [CrossRef]
  49. Wilding, L.P. Spatial variability: Its documentation, accommodation and implication to soil surveys. In Soil Spatial Variability; Nielsen, D.R., Bouma, J., Eds.; Pudoc: Wageningen, The Netherlands, 1985; pp. 166–194. [Google Scholar]
  50. Yao, Y.; Ye, L.; Tang, H.; Tang, P.; Wang, D.; Si, H.; Hu, W.; Ranst, E.V. Cropland soil organic matter content change in Northeast China, 1985–2005. Open Geosci. 2015, 7, 20150034. [Google Scholar] [CrossRef]
  51. Dardenne, P.; Sinnaeve, G.; Baeten, V. Multivariate Calibration and Chemometrics for near Infrared Spectroscopy: Which Method? J. Near Infrared Spectrosc. 2000, 8, 229–237. [Google Scholar] [CrossRef]
  52. Yuan, J.; Wang, X.; Yan, C.-X.; Wang, S.-R.; Ju, X.-P.; Li, Y. Soil Moisture Retrieval Model for Remote Sensing Using Reflected Hyperspectral Information. Remote Sens. 2019, 11, 366. [Google Scholar] [CrossRef] [Green Version]
  53. Fujisaki, K.; Perrin, A.-S.; Desjardins, T.; Bernoux, M.; Balbino, L.; Brossard, M. From forest to cropland and pasture systems: A critical review of soil organic carbon stocks changes in Amazonia. Glob. Chang. Biol. 2015, 21, 2773–2786. [Google Scholar] [CrossRef] [PubMed] [Green Version]
  54. Zhou, Y.; Chartin, C.; Van Oost, K.; van Wesemael, B. High-resolution soil organic carbon mapping at the field scale in Southern Belgium (Wallonia). Geoderma 2022, 422, 115929. [Google Scholar] [CrossRef]
  55. Sun, W.; Liu, S.; Zhang, X.; Li, Y. Estimation of soil organic matter content using selected spectral subset of hyperspectral data. Geoderma 2022, 409, 115653. [Google Scholar] [CrossRef]
  56. Xiaobo, Z.; Jiewen, Z.; Povey, M.J.W.; Holmes, M.; Hanpin, M. Variables selection methods in near-infrared spectroscopy. Anal. Chim. Acta 2010, 667, 14–32. [Google Scholar] [CrossRef] [PubMed]
  57. Ma, L.; Zhao, L.; Cao, L.; Li, D.; Chen, G.; Han, Y. Inversion of Soil Organic Matter Content Based on Improved Convolutional Neural Network. Sensors 2022, 22, 7777. [Google Scholar] [CrossRef]
  58. Kawamura, K.; Tsujimoto, Y.; Nishigaki, T.; Andriamananjara, A.; Rabenarivo, M.; Asai, H.; Rakotoson, T.; Razafimbelo, T. Laboratory Visible and Near-Infrared Spectroscopy with Genetic Algorithm-Based Partial Least Squares Regression for Assessing the Soil Phosphorus Content of Upland and Lowland Rice Fields in Madagascar. Remote Sens. 2019, 11, 506. [Google Scholar] [CrossRef] [Green Version]
  59. Yao, X.; Yang, W.; Li, M.; Zhou, P.; Chen, Y.; Hao, Z.; Liu, Z. Prediction of Total Nitrogen in Soil Based on Random Frog Leaping Wavelet Neural Network. IFAC Pap. 2018, 51, 660–665. [Google Scholar] [CrossRef]
  60. Shi, P.; Six, J.; Sila, A.; Vanlauwe, B.; Van Oost, K. Towards spatially continuous mapping of soil organic carbon in croplands using multitemporal Sentinel-2 remote sensing. ISPRS J. Photogramm. Remote Sens. 2022, 193, 187–199. [Google Scholar] [CrossRef]
  61. Gomez, C.; Viscarra Rossel, R.A.; McBratney, A.B. Soil organic carbon prediction by hyperspectral remote sensing and field vis-NIR spectroscopy: An Australian case study. Geoderma 2008, 146, 403–411. [Google Scholar] [CrossRef]
  62. Hong, Y.; Chen, S.; Chen, Y.; Linderman, M.; Mouazen, A.M.; Liu, Y.; Guo, L.; Yu, L.; Liu, Y.; Cheng, H.; et al. Comparing laboratory and airborne hyperspectral data for the estimation and mapping of topsoil organic carbon: Feature selection coupled with random forest. Soil Tillage Res. 2020, 199, 104589. [Google Scholar] [CrossRef]
  63. Dou, X.; Wang, X.; Liu, H.; Zhang, X.; Meng, L.; Pan, Y.; Yu, Z.; Cui, Y. Prediction of soil organic matter using multi-temporal satellite images in the Songnen Plain, China. Geoderma 2019, 356, 113896. [Google Scholar] [CrossRef]
  64. Vaudour, E.; Gomez, C.; Lagacherie, P.; Loiseau, T.; Baghdadi, N.; Urbina-Salazar, D.; Loubet, B.; Arrouays, D. Temporal mosaicking approaches of Sentinel-2 images for extending topsoil organic carbon content mapping in croplands. Int. J. Appl. Earth Obs. Geoinf. 2021, 96, 102277. [Google Scholar] [CrossRef]
  65. Luo, C.; Zhang, X.; Meng, X.; Zhu, H.; Ni, C.; Chen, M.; Liu, H. Regional mapping of soil organic matter content using multitemporal synthetic Landsat 8 images in Google Earth Engine. CATENA 2022, 209, 105842. [Google Scholar] [CrossRef]
Figure 1. Overview of the study area and distribution of soil samples.
Remotesensing 15 03191 g001
Figure 2. Retrieval results of SOM for each single-date image. None: taking all variables as input variables without variable selection; GA: Genetic Algorithm; RF: Random Frog; CARS: Competitive Adaptive Reweighted Sampling.
Remotesensing 15 03191 g002
Figure 3. Scatter plots between measured vs. predicted SOM by the optimal model based on the multi-temporal images. Note: the dotted line is trend line and the solid line is 1:1 reference line.
Remotesensing 15 03191 g003
Figure 4. The variables selected by CARS on multi-temporal images in the 2008–2011 group.
Remotesensing 15 03191 g004
Figure 5. The SOM distribution in cultivated soils predicted by the model using the images in the 2008–2011 group.
Remotesensing 15 03191 g005
Table 1. The number of samples covered in different Landsat 5 TM images. The images selected to model are indicated in bold.
Image Acquisition DateCloud Cover (%)Number of Samples
13 April 20081073
29 April 20082056
15 May 2008173
16 June 2008073
16 April 20093144
18 May 20092666
3 June 20098613
19 April 20106719
21 May 20102763
6 June 2010671
22 June 20104532
6 April 2011691
8 May 20113133
24 May 20114468
25 June 2011173
Table 2. Multi-temporal image dataset.
Year IntervalsYear Interval GroupsNumber of Images
One year20083
20102
20112
Two years2008–20094
2009–20103
2010–20114
Three years2008–20106
2009–20115
Four years2008–20118
Table 3. SOM retrieval results of multi-temporal images.
Year Interval GroupsR2RMSE (g/kg)
2008 (3)0.4314.60
2010 (2)0.4214.97
2011 (2)0.2515.57
2008–2009 (4)0.5013.91
2009–2010 (3)0.5014.29
2010–2011 (4)0.4313.66
2008–2010 (6)0.5214.08
2009–2011 (5)0.5012.99
2008–2011 (8)0.5911.81
Note: the number in the brackets represents the image number.
Disclaimer/Publisher’s Note: The statements, opinions and data contained in all publications are solely those of the individual author(s) and contributor(s) and not of MDPI and/or the editor(s). MDPI and/or the editor(s) disclaim responsibility for any injury to people or property resulting from any ideas, methods, instructions or products referred to in the content.

