Article

The Transport Path and Vertical Structure of Dust Storms in East Asia and the Impacts on Cities in Northern China

1
School of Ecology and Environment, Inner Mongolia University, Huhhot 010022, China
2
College of Geographical Science, Inner Mongolia University, Huhhot 010022, China
3
College of Earth and Environmental Sciences, Lanzhou University, Lanzhou 730000, China
4
Inner Mongolia Key Laboratory of River and Lake Ecology, School of Ecology and Environment, Inner Mongolia University, Huhhot 010022, China
5
Center for Applied Mathematics Inner Mongolia, Huhhot 010021, China
6
College of Environmental Science and Engineering, Nankai University, Tianjin 300350, China
7
School of International Economics and Management, Beijing Technology and Business University, Beijing 100048, China
8
lnner Mongplia Eoological Envitorment Science Research Institute Company Limited, Huhhot 010022, China
*
Author to whom correspondence should be addressed.
These authors contributed equally to this work.
Remote Sens. 2023, 15(12), 3183; https://doi.org/10.3390/rs15123183
Submission received: 2 May 2023 / Revised: 26 May 2023 / Accepted: 14 June 2023 / Published: 19 June 2023

Abstract

:
Dust storm disasters have emerged as a significant environmental challenge in East Asia. However, relying on a single monitoring method to track dust storms presents limitations and can be variable. Therefore, it is necessary to use a combination of ground and remote sensing monitoring methods to explore the source and impact range of dust storms in order to fully characterize them. To achieve this, we examined the sources and impact ranges of dust storms in East Asia from 1980 to 2020 using both ground station data and remote sensing data. In addition, we focused on three specific dust storm events in the region. Our results indicate that the central source areas of dust storms are located in southern Mongolia and the Taklamakan Desert in China. Dust storms are mainly transported and spread in the northwestern region, while they are relatively rare in the southeastern region. The HYSPLIT model simulations reveal that the primary source directions of dust storms in East Asia are northwest, west, and north, the region involved includes Kazakhstan, southern Mongolia, and the Taklimakan Desert in China. The vertical structure of the dust storm layer depends on the source of the dust storm and the intensity of the dust storm event. Dust grain stratification probably occurs due to differences in dust storm sources, grain size, and regularity. These findings demonstrate that a combination of ground-based and remote sensing monitoring methods is an effective approach to fully characterize dust storms and can provide more comprehensive information for dust storm studies.

Graphical Abstract

1. Introduction

Dust storms are a weather phenomenon that predominantly occurs during spring (March, April, and May) in arid regions [1,2]. Dust storms in East Asia primarily originate from the Gobi desert and arid regions located in southern Mongolia and northern China [3,4]. These regions are characterized by dry and strong wind conditions, which allow the surface dust particles to be easily picked up by the wind and transported eastward to East Asia with the airflow [5]. Research has demonstrated that the occurrence of dust storms usually arises from strong winds, extreme weather, and appropriate dust source conditions. Several studies have confirmed the harmful effects of this weather phenomenon, dust aerosols not only negatively impact local environmental quality and visibility, but also cause significant damage to socioeconomic factors and human health [6,7]. Dust storms play a crucial role in geochemical cycles. Dust aerosols can rise to the upper troposphere and be transported to the Pacific Ocean and beyond via the westerly wind belt [8]. These dust aerosols play a critical role in biogeochemical cycling among terrestrial, atmospheric, and oceanic systems, with significant effects on the regional long-term radiation balance, long-term impacts on global climate and ecosystems, and possibly even the global carbon cycle [9,10,11]. In today’s world of urban expansion and human activities, we are confronted with a plethora of environmental problems and challenges [12,13,14]. Therefore, an in-depth investigation of dust storms in East Asia is vital for comprehending global ecological changes, understanding carbon cycle mechanisms, and formulating related policies.
Dust storm monitoring is a crucial task in the current meteorological field, since the formation, location, emission activities, and physicochemical properties of dust are closely related to meteorological conditions and source area characteristics [15,16,17]. Knowledge of this information can help in developing more effective dust control strategies to reduce the impact on the environment and human health. Thus, various operational methods are required to determine the dust source and its trajectory. Commonly used monitoring methods include surface meteorological station analysis and sample-based surveys of physical and chemical properties. Surface weather station analysis can collect data on meteorology, air pollution, and visibility, which help researchers analyze the location, generation period, transmission direction, and size of the dust source [18]. Ground monitoring stations can also help validate and calibrate satellite remote sensing data [19,20]. Another approach is sampling-based surveys of physical and chemical properties, which involve performing chemical composition and speciation analysis of dust samples to determine the type and composition of dust sources [21]. Although this method requires a lengthy sampling and analysis process and is costly, it can provide detailed information about the dust source. However, due to the limitations of manpower, material, and financial resources, real-time monitoring, and statistics of dust storms, especially those originating in remote desert areas, are difficult to achieve using these monitoring methods. Building large-scale, high-density ground stations for dust storm monitoring is also challenging. Consequently, weather station monitoring has limitations that hinder the monitoring, analysis, and forecasting of the formation, movement, and deposition of large-scale dust storms [22]. In contrast, satellite remote sensing can monitor regional dust transmission in real time, providing abundant data for the study of dust sources and transmission processes. Satellite remote sensing techniques can also provide global-scale observations that allow the study of regional differences and global contributions of dust sources. Combining satellite remote sensing data with ground observations can improve the reliability and accuracy of dust source analysis [23,24]. The Lagrange inverse trajectory is a prevalent method for analyzing dust transport trajectory in the atmosphere. This technique allows us to track the trajectory of dust particles and obtain valuable information regarding the location of dust sources, their transport paths, and transport times [25]. By combining ground and satellite data with simulation models, this method offers a more comprehensive understanding of dust sources, transport pathways, and magnitudes than relying on one method alone.
The development and improvement of satellite remote sensing technology has become a critical tool in current climate research. Among these tools, methods for monitoring dust weather have undergone significant improvements [26,27]. These advancements have enabled researchers to identify and study the optical parameters of dust storms more accurately. However, its techniques still have limitations when monitoring the vertical distribution characteristics of dust storms. In recent years, the Cloud Aerosol LiDAR and Infrared Probe Satellite (CALIPSO) have been successfully launched, providing an opportunity to identify dust aerosols and obtain their vertical distribution characteristics due to their advantages of active detection and recession monitoring [28,29]. The LiDAR on the Cloud-Aerosol LiDAR and Infrared Pathfinder Satellite Observations (CALIPSO) mission, makes robust measurements of dust and has generated a record that is significant both seasonally and inter-annually [30]. By exploiting this record, the properties of dust emanating from different dust storm hotspots were determined in the Middle East [31]. Therefore, CALIPSO boasts promising application prospects and will play an increasingly critical role in the future in dust storm monitoring and early warning. Meanwhile, due to the diverse and complex nature of dust storms, an exclusive monitoring tool provides limited capabilities, leading to a partial depiction of dust targets. This paper explores the source and impact range of dust storms in East Asia and focuses on determining the geographical sources, transport trajectories, and vertical dust distribution. This is achieved through a combination of ground and satellite observations and HYSPLIT model simulations, enabling the complementary advantages among different observation methods to be realized. This information provides an opportunity to achieve improved comprehension of the distribution of dust in East Asia, as well as the long-range transport of dust storms throughout the region. Findings to help prevent dust disasters and mitigate their negative effects will be presented, providing a reliable scientific foundation for practical guidelines that aim to safeguard and reinforce human settlements.

2. Materials and Methodology
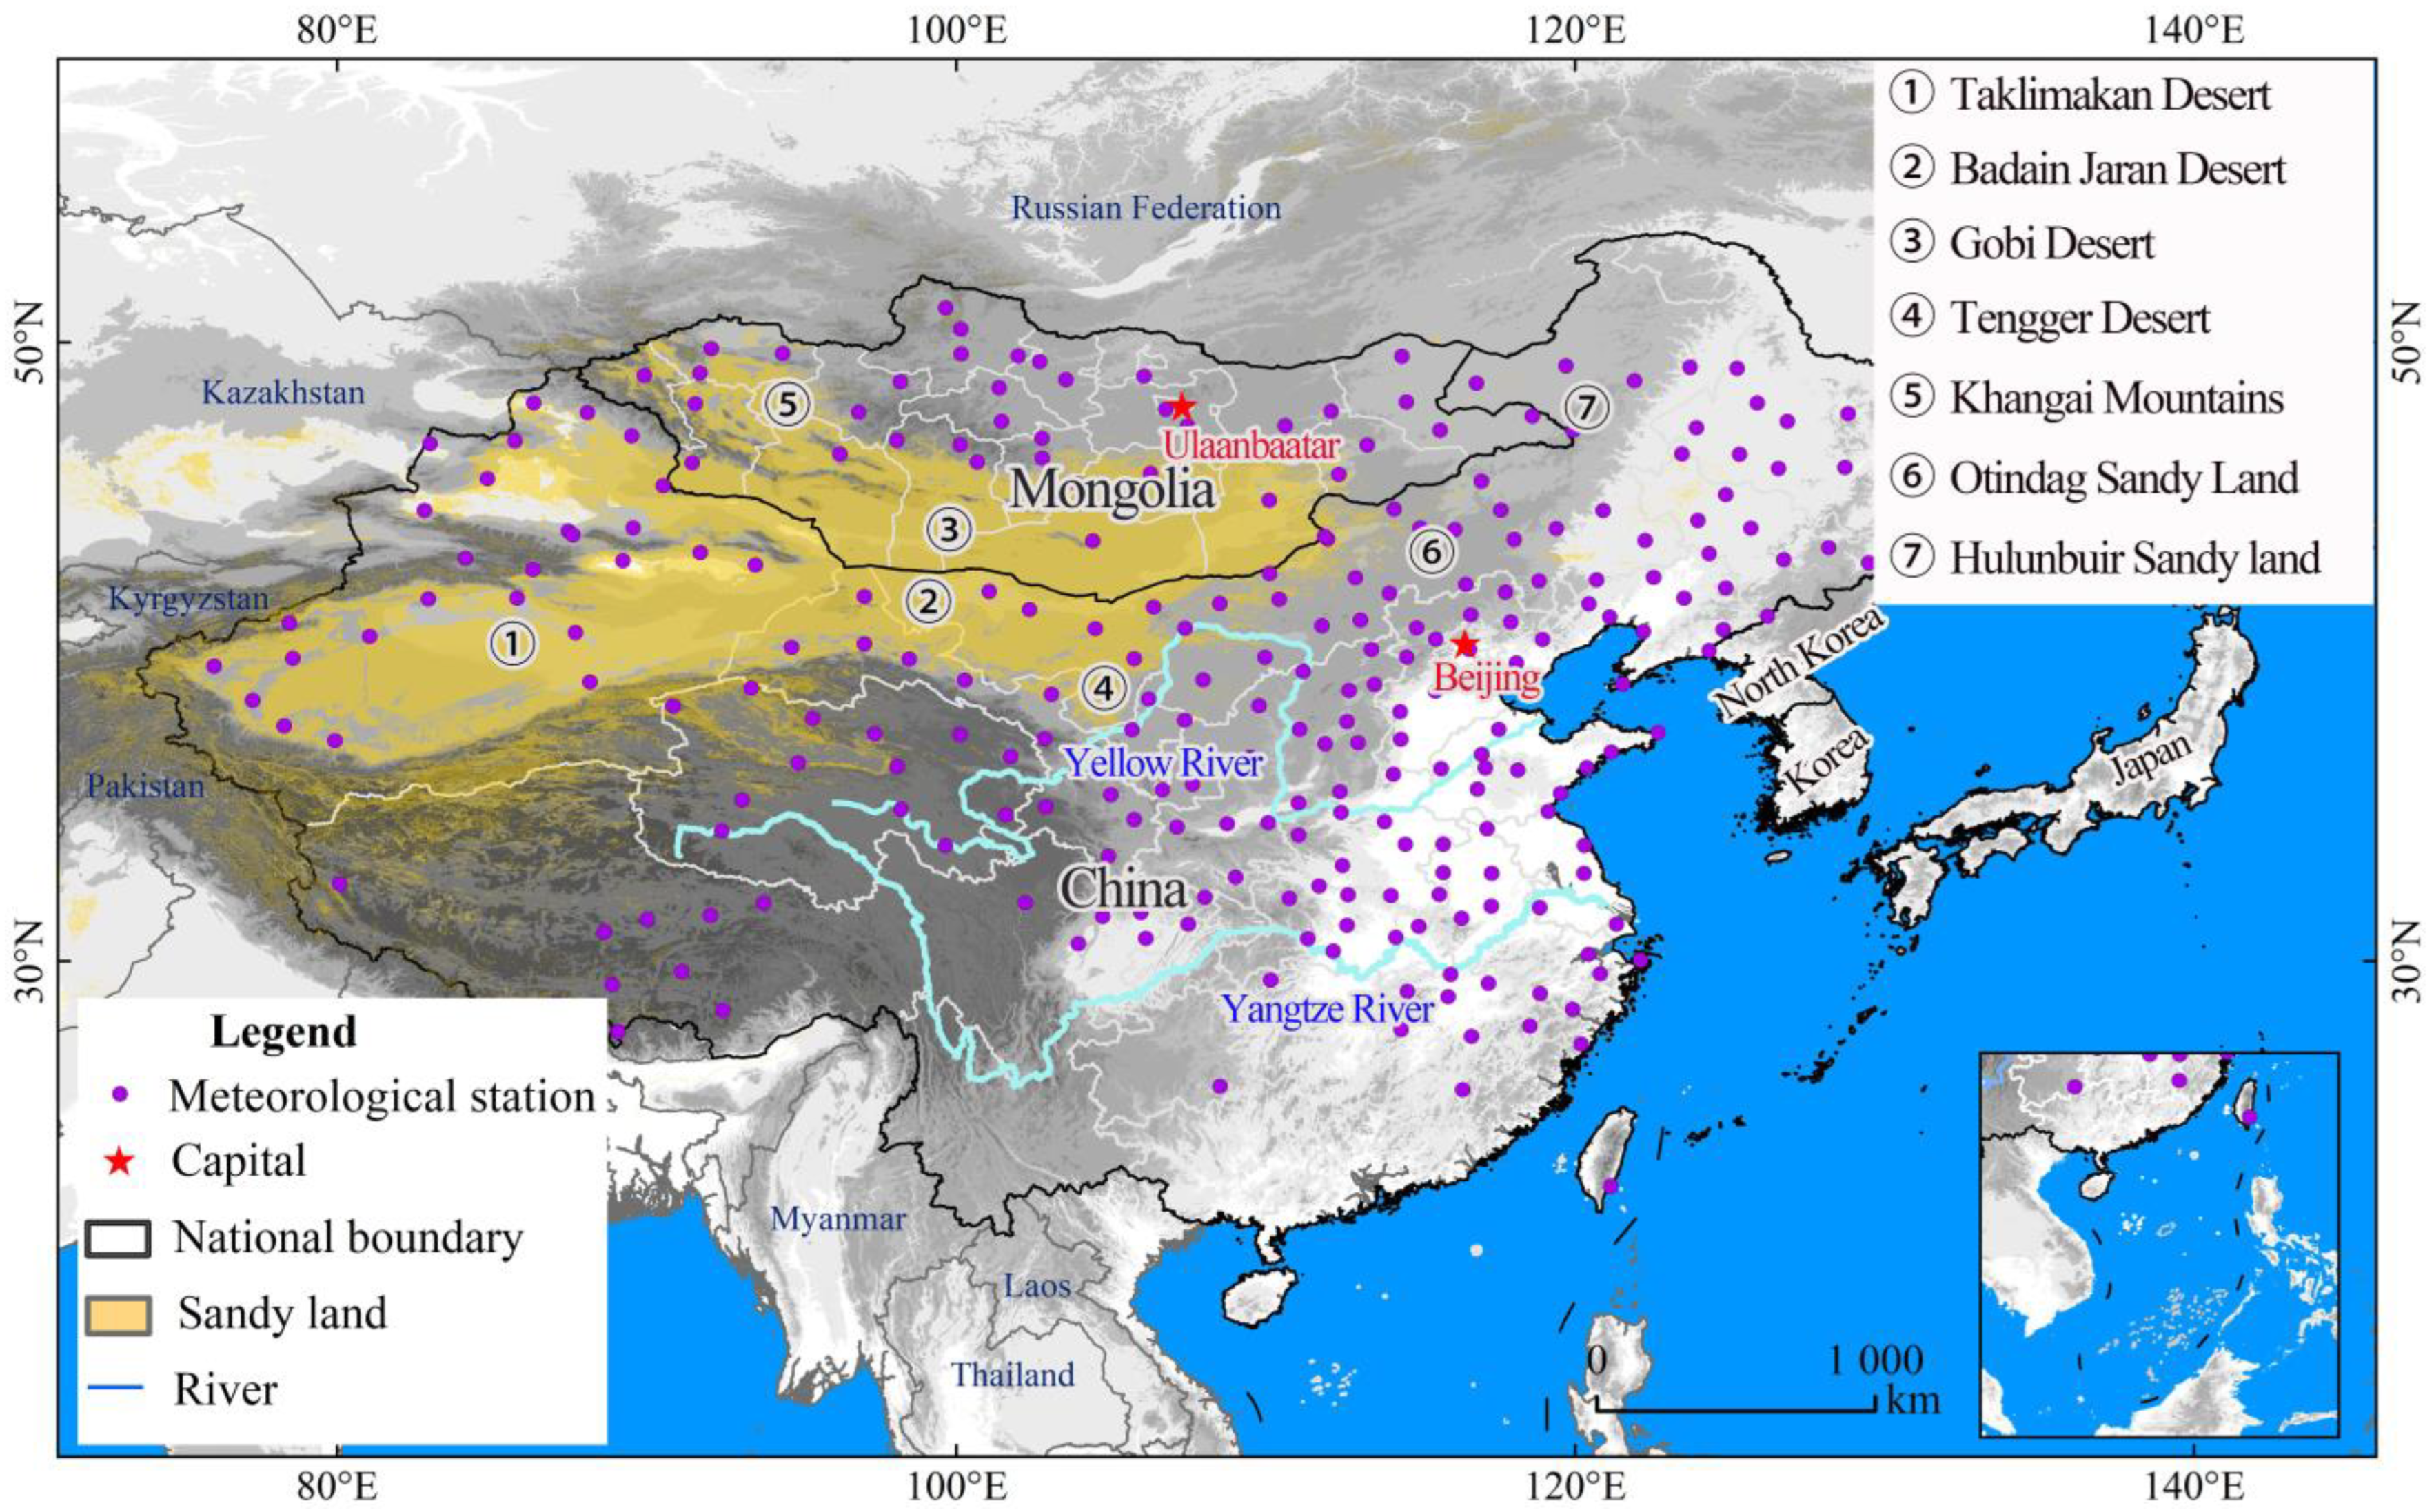
2.1. Study Area

East Asia is a geographical region in eastern Asia and the west coast of the Pacific Ocean, and consists of five countries: China, Mongolia, North Korea, South Korea and Japan. The region covers a total area of about 12 million square kilometers, with a gradual decline in terrain from west to east, making it the most typical monsoon climate region in the world. In the East Asian continent, desert areas are mainly located in the arid and semi-arid regions of northern China bordering Mongolia (Figure 1). The common characteristics of these regions are dry climate, strong wind, low precipitation, sparse surface vegetation cover, and strong physical weathering of the land surface [32,33]. Specifically, the deserts in northern China include the Taklimakan Desert, Badain Jaran Desert, Tengger Desert, and Otindag Sandy Land, etc. These desert regions are huge in size and have a significant impact on the climate and ecological environment of the surrounding areas [34,35].

2.2. Surface Synoptic Observation (SYNOP) Data

In this study, data were extracted on dust events from the dust reports of 259 Surface Synoptic Observation (SYNOP) ground stations covering the period 1980 to 2020. Of these stations, 219 are located in China, while the remaining 40 are in Mongolia. The definition of present weather, with codes ranging from 00 to 99, is based on the WMO code Table 4677 in the SYNOP report [36,37]. This table describes dust storms as dust outbreaks, DO (ww = 07; 08; 09; 30 ... 35; 98, dust in the production phase). Dust outbreaks include blowing dust, BD (ww = 07 and 08, moderate dust storm), which is defined as weak dust outbreaks, and dust storms, DS (ww = 09, 30–35, and 98, severe dust storm), which are defined as severe dust outbreaks.

2.3. CALIPSO Data

The data on atmospheric aerosols was obtained from the Atmospheric Science Data Center (ASDC) at the NASA Langley Research Center [1], using the Cloud-Aerosol LiDAR and Infrared Pathfinder Satellite Observations (CALIPSO). This vertical information became available at the turn of the 21st century, owing to the Cloud-Aerosol LiDAR with Orthogonal Polarization (CA-LIOP) instrument installed on board the CALIPSO LiDAR. Since June 2006 [38], this instrument has provided high-quality measurements of vertical aerosol profiles at 532 and 1064 nm near nadir in both daylight and at nighttime, globally [37]. The CALIPSO satellite is equipped with a LiDAR altimeter and a multi-channel optical imager, enabling it to detect and measure atmospheric aerosols, clouds, and the ground with high resolution.
The main variables of interest for the CALIPSO level 1 product are the total attenuated backscatter coefficients at 532 and 1064 nm, and the vertical polarization component of the 532 nm attenuated backscatter coefficient containing half an orbit (day/night) [39]. The CALIPSO level 2 aerosol products consist of Layer (ALay), Profile (APro), and Vertical Feature (VFM) [40]. ALay products enable the investigation of the distribution characteristics of atmospheric aerosols. APro products provide the vertical distribution of aerosol extinction coefficients in satellite orbit, a critical parameter for calculating aerosol radiation effects. VFM products offer vertical and horizontal cloud and aerosol distribution information, including cloud and aerosol types and locations, this analysis also enables the categorization of aerosols at each height level in the atmosphere, which can be classified into six distinctive types: clean marine, dust, continental polluted, continental clean, polluted dust, and smoke [3]. The CALIPSO data’s vertical and horizontal resolution vary with altitude. For altitudes ranging from −0.5 to 8.2 km, the downlinked-sampling resolution for 532 nm data is 30 m vertically and 1/3 km horizontally, while for 1064 nm data, it is 60 m vertically and 1/3 km horizontally. For altitudes of 8.2–20.2 km, the vertical and horizontal resolutions for 532 nm and 1064 nm data are 60 m and 1 km, respectively. The vertical spatial resolution of Level-2-layer products is 60 m below 20.2 km and 180 m above 20.2 km, and the horizontal spatial resolution is 5 km.

2.4. NCEP Global Dataset

The National Centers of Environmental Prediction (NCEP) reanalysis dataset is a global atmospheric reanalysis dataset that is based on a large number of observational data and model simulation results [41]. Utilizing data assimilation technology, it obtains global atmospheric field data with high spatial and temporal resolution. This dataset can be utilized as driving data for the HYSPLIT model, which can calculate the backward trajectory of aerosols and determine the location and time of atmospheric pollutant sources with a horizontal resolution of 2.5° [42].

2.5. Methods

2.5.1. Spatial and Temporal Distribution

DO, which encompasses BD and DS, is defined as the occurrence of blowing dust and/or a dust storm being observed at a single station within a 24-h period, as reported in the SYNOP reports with a count of either “0” or “1”. The DO/BD/DS data spanning from 1978 to 2018 were obtained from the SYNOP reports of all 270 stations, comprising a total of 14,975 observations (days).
The frequency of dust outbreaks (DOF, including BDF and DSF) refers to the percentage of total dust outbreaks in relation to the total number of observations in a given region and period [36,43,44]. The trends of DO/BD/DS are investigated by ordinary least squares (OLS) regression and examined by Student’s t-test for statistical significance [35].

2.5.2. Clustering Analysis in Moving Path

The HYSPLIT model is a widely used simulation tool for calculating and analyzing the transport and dispersion trajectories of atmospheric pollutants. HYSPLIT (Hybrid Single-Particle Lagrange Integrated Trajectory Model) is a commonly used backward trajectory model that simulates the trajectory of aerosols, gases, and other substances in the atmosphere, facilitating the study of air pollution, radiation transfer, and related issues [45]. To calculate backward trajectory using the HYSPLIT model, atmospheric field data must be input as the driving force of the model. This process helps trace the source and transmission path of dust sources and gaseous pollutants, which is valuable for environmental monitoring and emergency response efforts. The HYSPLIT model has been widely employed in studying the transport and dispersion of various pollutants in different regions [46,47]. It combines Lagrange and Eulerian methods to handle multiple meteorological input fields, physical processes, and emission sources [48].
To identify the movement paths of dust storms in the study area from 1980 to 2020, we selected four representative locations known for the occurrence of dust storms—Guaizihu in Inner Mongolia (NO. 52378), Tikanlik in Xinjiang (NO. 51765), Erlianhot in Inner Mongolia (NO. 53068), and Beijing (NO. 54511), with meteorological stations located on major dust storm transmission paths—as starting points. The HYSPLIT model was used to simulate the trajectory of the inverse airflow at 3000 m height for 72 h for each dust storm event occurrence from March to May of each year from 1980 to 2020, drawing from previous research [42,49,50]. We used the TrajStat module in the MeteoInfo package (http://www.meteothinker.com/TrajStatProduct.aspx, accessed on 1 May 2023) to cluster the trajectories of all dust trajectories and calculated the overall clustering paths of the study area [51].

2.5.3. Vertical Distribution of Dust Aerosols

In this study, we utilized satellite measurements from CALIPSO to identify dust aerosols. The measurements include the attenuated backscatter coefficient, volume depolarization ratio, and color ratio. The total attenuation backscatter at a wavelength of 532 nm is a crucial parameter for determining aerosol properties and reflects the intensity of particle backscatter extinction. The backscattering coefficient is defined as the ratio of the backscattering cross-section to the incident extinction cross-section. Thus, higher values indicate greater scattering ability of the particle, whereas lower values indicate lower scattering ability [29,38]. The volume depolarization ratio, which is the ratio of the perpendicular to parallel components of the attenuated backscatter at 532 nm, provides insights into the irregularity of particles in the atmosphere. Larger depolarization ratios indicate greater irregularity in particle shape [28]. The depolarization ratio is calculated using the following formula:
δ μ z = β 532 ( z ) β 532 ( z )
where δ μ z is the depolarization ratio, β 532 ( z ) is the backscattering coefficient in the vertical direction of 532 nm, and β 532 ( z ) is the backscattering coefficient in the horizontal direction of 532 nm.
Additionally, the total attenuation backscattering coefficients ratio at wavelengths of 532 nm and 1064 nm can be used to calculate the color ratio, which reflects the aerosol particle size. A larger color ratio indicates a larger particle size [40]. The color ratio is calculated as follows:
x ( z ) = β 1064 ( z ) β 532 t o t a l ( z )
where x ( z ) is the color ratio, β 1064 ( z ) is the 1064 nm backscattering coefficient, and β 532 t o t a l ( z ) is the 532 nm total backscattering coefficient.

3. Results and Analysis

3.1. Distribution Characteristics of Dust Storms

According to the dust reports collected from 259 SYNOP meteorological stations between 1980 and 2020, a total of 70,453 DO were documented, comprising 45,324 instances of BD (accounting for 64.01% of all events) and 25,129 instances of DS (accounting for 35.99% of all events). The reports were based on 14,975 days of observation.
Stations with higher DOF tend to be concentrated in the arid and semiarid areas, such as the Gobi Desert, the Tengger Desert, the Taklimakan Desert, the Kumtag Desert, and the Badain Jaran Desert, as shown in Figure 2a, which is consistent with previous research [15,32]. Furthermore, the distribution of BDF displays a pattern like that of DOF, as shown in Figure 2b. Evidently, stations with higher DSF are also mainly located in Mongolia, as shown in Figure 2c.
The majority of stations display a declining trend in all regions for DO, with a few exceptions in Mongolia (Western and Eastern), as illustrated in Figure 3a. For BD, while there is a general decreasing trend, stations with an upward trend are distinguishable, such as a few scattered cases in northern regions in China and numerous cases spread widely in the northern and western regions in Mongolia, as depicted in Figure 3b. However, increasing trends of SD can also be pinpointed at some stations located in Mongolia, especially in western and eastern Mongolia, as shown in Figure 3c.
In summary, the stations with increasing trends are located throughout most of Mongolia, with a few scattered in the Taklamakan Desert, the Hexi Corridor, the northern part of the lower Yellow River, and northeastern China, which lie on the prevailing transport routes of the advance of East Asian dust storms from northwest to southeast.

3.2. Dust Storm Trajectory Analysis

To investigate the sources and transport paths of dust particles in different dust storm events, a cluster analysis of total dust airflow was conducted from March to May between 1980 and 2020 at four typical meteorological stations in northern and northwestern China: Guaizihu, Tikanlik, Erlianhot, and Beijing (Figure 4). Reverse airflow trajectories were used to identify significant differences in the sources and transmission paths of dust and dust storm airflow at different meteorological stations. At Guaizihu station (located in the southeast of Ejina County in Inner Mongolia), 155 dust storm air mass trajectories were clustered into four main paths. Of these, 25.82% of the dust originated mainly from the Moinkum Desert in southern Kazakhstan, 31.13% from eastern Kazakhstan, 16.56% from the northwestern Kazakhstan airflow, and 26.49% from the Taklamakan Desert region. At Tikanlik station (located in Ruoqiang County, Bayingoleng Mongolian Autonomous Prefecture, Xinjiang Uygur Autonomous Region), 119 dust storm air mass trajectories were clustered into three main paths, with 26.89% of the flow coming from the Kyzylkum Desert in southern Kazakhstan adjacent to Uzbekistan, 46.22% from southern Kazakhstan, 6.72% from northern Kazakhstan, and 20.17% from the western Taklamakan Desert region. At Erlianhot Station (located on the northwestern edge of Xilin Gol League in Inner Mongolia, bordering Mongolia to the north), a total of 78 dust storm air mass trajectories were clustered into three main paths, with the flow direction mainly originating from the northwest. Specifically, 39.74% of the airflow came from Kazakhstan, 29.49% from the upwind area of central and western Mongolia within Russia, and 30.77% originated from the border line between Mongolia and northern China. Conversely, at the Beijing station (the capital of China), the number of dust storms was low, and the airflow mainly originated from the territory of Kazakhstan, Mongolia, and the upwind of Mongolia in Russia to the north of China. Analysis of the air mass trajectories of 12 dust storms yielded three main paths, where 41.43% of the dust storm came mainly from the territory of Mongolia, while 38.49% and 20.08% of the dust storm originated from Russia. The HYSPLIT model simulations reveal that the primary source directions of dust storms in East Asia are northwest, west, and north, results are similar to those of previous studies [3,4,52]. The region involved includes Kazakhstan, southern Mongolia, and the Taklamakan Desert in China. These findings provide insights into the causes and development trends of dust storm events in northern and northwestern China, which could be helpful for relevant authorities to take measures to mitigate the impacts of dust storms on humans and the environment.

3.3. Microphysical Properties of Dust Aerosols

Understanding the vertical profiles of dust aerosols is crucial, as they impact radiative effects, heating rates, and atmospheric stability [3,38]. In this study, we chose the paths of three satellite orbits from three dust storm events that span dust sources. Through the observation and analysis of these dust storm events, we aim to gain a better understanding of the vertical and spatial distribution of dust aerosols, providing more accurate data and methods for studying climate change and environmental pollution. The satellite orbital paths of the three dust storm events are as follows: (1) On 5 May 2015, at 20:00 UTC, the orbit passed through Mongolia, northern Gansu Province, central and southern Qinghai Province located on the Tibetan Plateau, crossing large dust sources such as the Gobi Desert and the Qaidam Basin Desert, as illustrated in Figure 5 and Figure 6; (2) On 12 April 2018, at 05:00 UTC, the satellite orbit passed through Mongolia East and Inner Mongolia, and continued southward, as depicted in Figure 7 and Figure 8; (3) On 15 March 2021, at 19:00 UTC, the trajectory passed through dust source regions such as the Gobi Desert, Tengger Desert, and then through Ningxia Province, Sichuan Province, and Yunnan Province, as presented in Figure 9 and Figure 10.

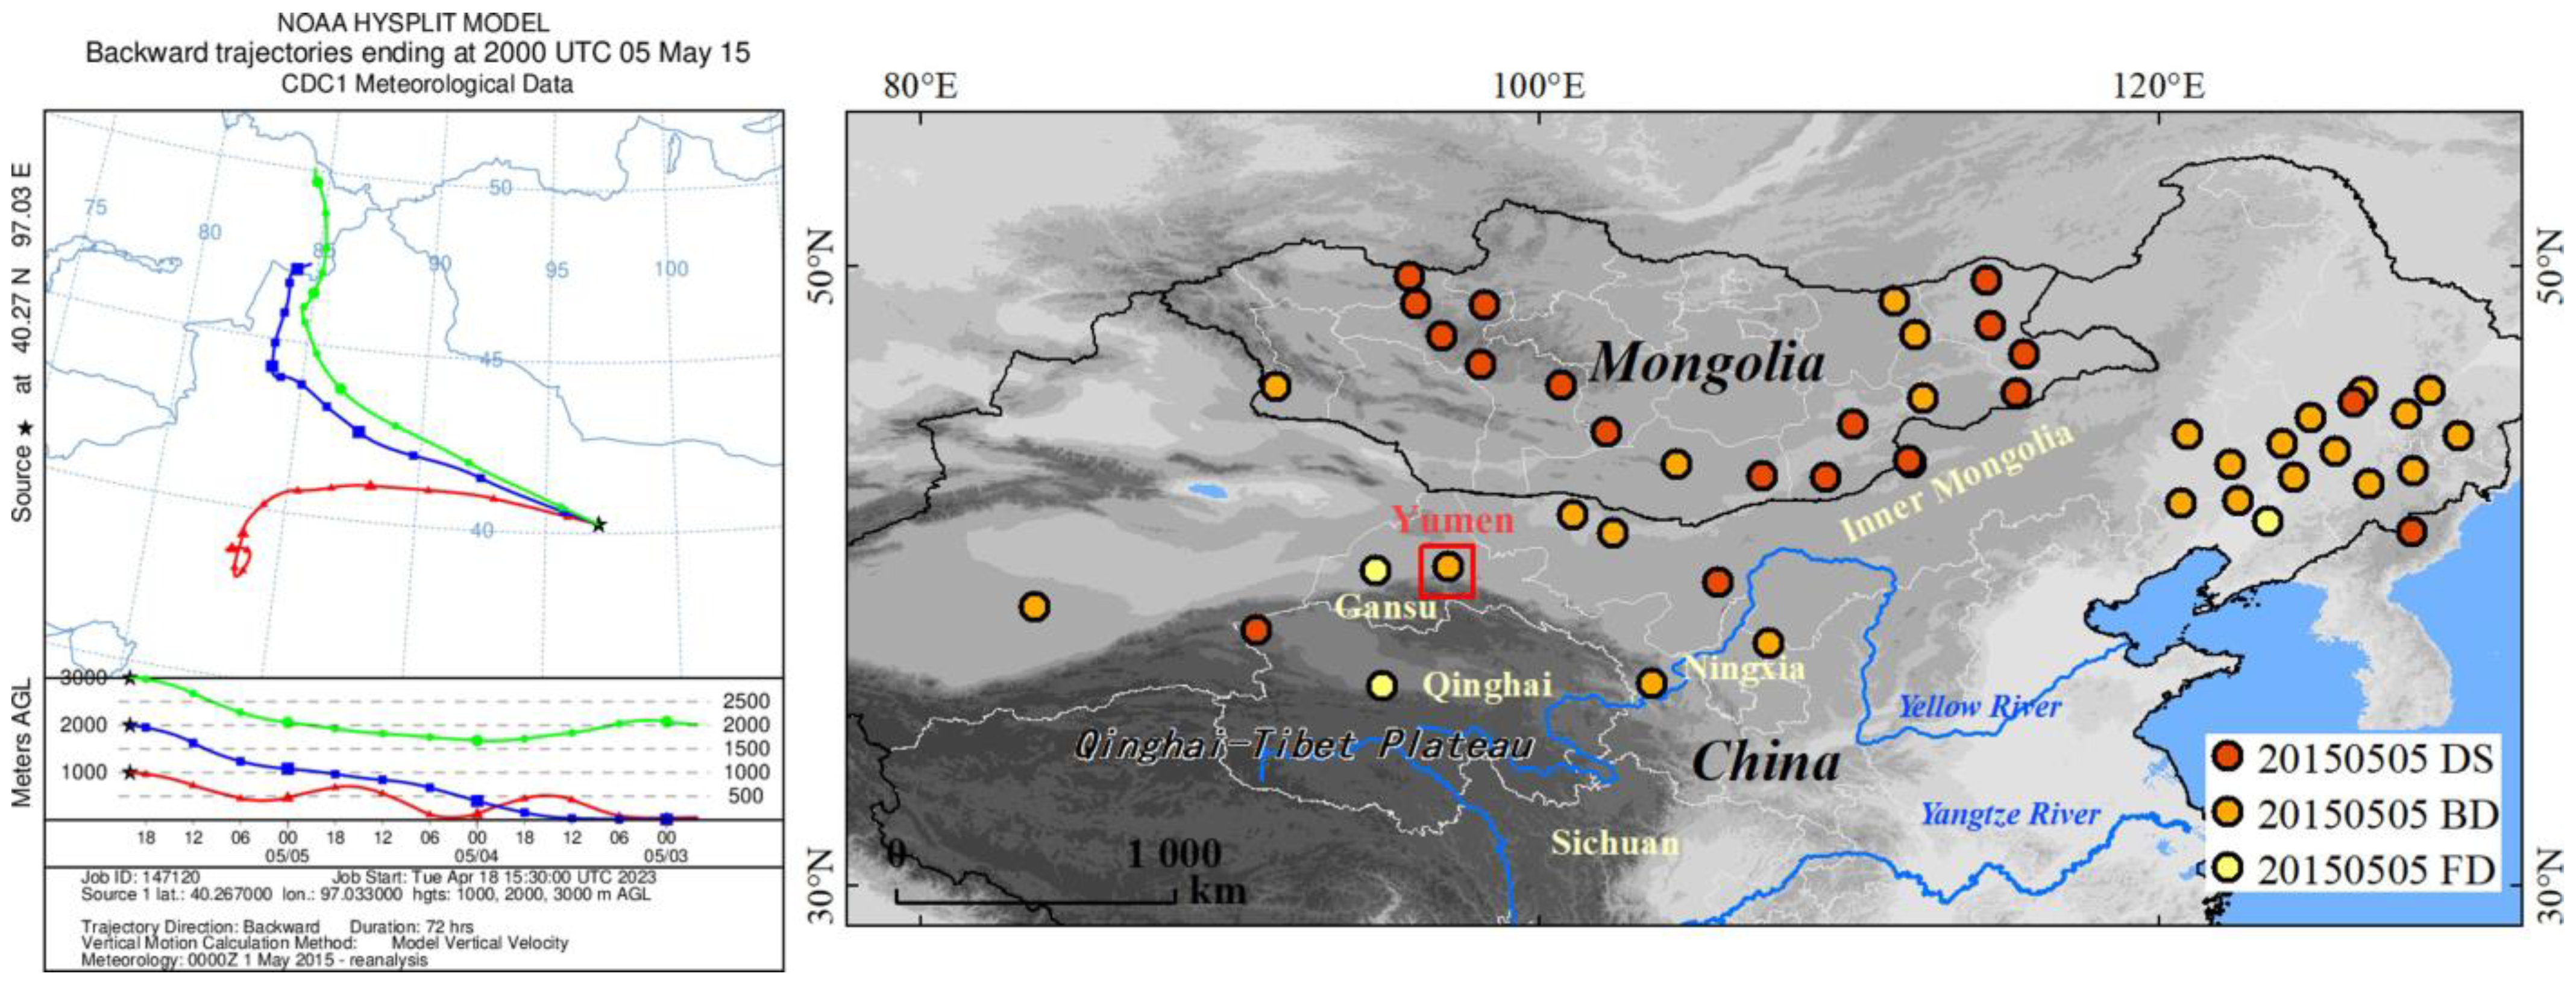
3.3.1. Dust Storm on 5 May 2015

On 5 May 2015, a dust storm incident took place in Yumen town, Gansu Province. By simulating the dust storm’s trajectory for 72 h backwards from Yumen, located at 40.26°N and 97.03°E, at altitudes of 1000, 2000, and 3000 m, it was discovered that the dust storm’s path had a western bias. This dust storm had a significant impact on northwestern and northern China, and at times, it also affected the western and southern regions of the northeastern part of the country (Figure 5).
Figure 5. HYSPLIT simulation of dust transport path on May 5, 2015, and dust events station monitored, including flowing dust (FD), blowing dust (BD), and dust storm (DS). The red square is Yumen station.
Remotesensing 15 03183 g005
The dust storm was mainly distributed within a range of 1–10 km, with some polluting dust particles present between 3 and 7 km (Figure 6a). At mid latitudes, the color ratios were mainly within 4–8 km, while at low latitudes, the color ratios were primarily concentrated in the range of 10–12 km. Dust particles with larger particle size biases were present above elevations of 4 km (Figure 6b). The depolarization ratios were generally high within the 2–4 km range. It is worth noting that the highest depolarization ratios values with a high degree of particle irregularity were in the range of 8–12 km at low latitudes (Figure 6c). Within the border region between southwest Mongolia and western Inner Mongolia, the total attenuation backscattering coefficient of 532 nm was distributed between 0.001 and 0.0045 km−1·sr−1 within the height range of 4–8 km. In the Taklamakan Desert, high values of the total attenuation backscattering coefficient existed within the height range of 3–5 km. In conclusion, it was discovered that a significant number of dust-type aerosols were present in the 3–5 km altitude range within the border between western Mongolia and western Inner Mongolia, which is consistent with the results of previous studies [38]. These aerosols are irregular in shape and large in particle size, which is consistent with the actual situation.
Figure 6. On 5 May 2015, at 20:00 UTC, CALIPSO satellite 532 nm total attenuation backscatter coefficient, depolarization ratio, color ratio vertical profile and running trajectory. (a) Aerosol classification, the red line is satellite orbital paths of the dust storm events; (b) attenuated radar color ratio; (c) polarization ratio and (d) Total attenuated backscatter coefficient in 532 nm channel (Unit: km−1 ·sr−1).
Remotesensing 15 03183 g006

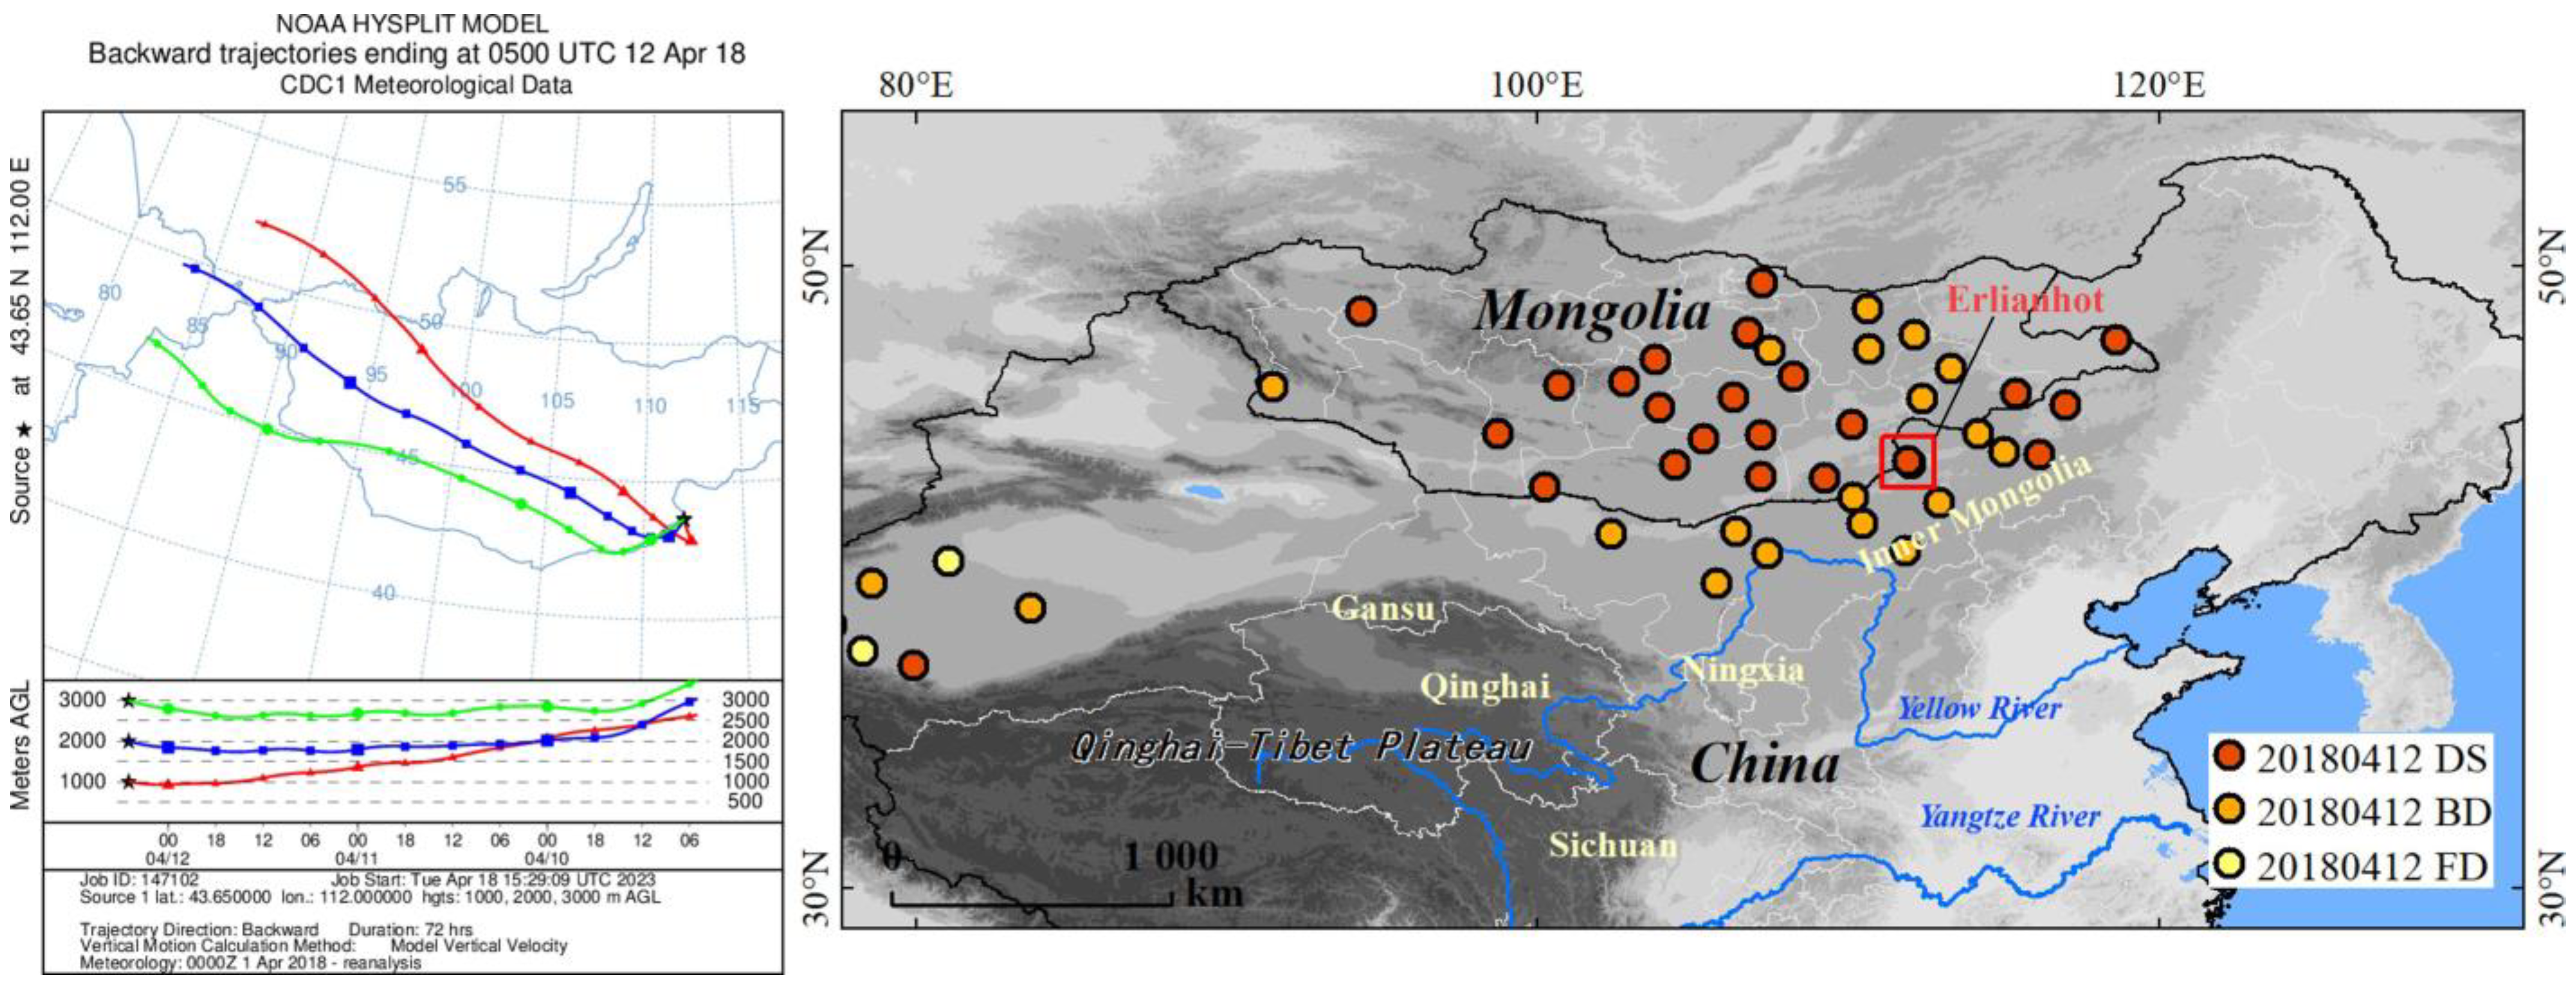
3.3.2. Dust Storm on 12 April 2018

On April 12, 2018, a dust storm hit Erlianhot, Inner Mongolia. The storm trajectory was simulated for 72 h, with Erlian (43.65°N, 112°E) as the reference point, and three different simulated heights (1000 m, 2000 m, and 3000 m) were used to create Figure 7. This dust storm movement was in a northwest direction, and it primarily impacted Inner Mongolia, North China, as well as the western and southern regions of Northeast China.
Figure 7. HYSPLIT simulation of dust transport path on 12 April 2018, and dust events monitored at the station, including flowing dust (FD), blowing dust (BD), and dust storm (DS). The red square is Erlianhot station.
Remotesensing 15 03183 g007
The dust storm was mainly concentrated within the 1–12 km range. A few polluted dust particles were detected at 3 km near the ground in the Beijing–Tianjin–Hebei region, as well as at an altitude of 10 km in the easternmost part of Mongolia (Figure 8a). The color ratios were more prominent at 4 km and 10 km at low and mid latitudes, while they were less significant at high latitudes (Figure 8b). The depolarization ratio values were generally high and ranged from 10–12 km at low and mid latitudes, with a high degree of particle irregularity (Figure 8c). The total attenuation backscattering coefficient of 532 nm near the ground and at a height of 10 km was distributed between 0.0015 and 0.0045 km−1·sr−1 in the range of Inner Mongolia and Beijing–Tianjin–Hebei. The total attenuation backscattering coefficient attained the highest value in the Inner Mongolia region (Figure 8d). In conclusion, it is evident that the eastern part of Mongolia, which borders Inner Mongolia, is home to a large number of sandy dust-type aerosols with irregular shapes and significant particle sizes. This observation aligns with the real situation.
Figure 8. On 12 April 2018, at 5:00 UTC, CALIPSO satellite 532 nm total attenuation backscatter coefficient, depolarization ratio, color ratio vertical profile and running trajectory. (a) Aerosol classification, the red line is satellite orbital paths of the dust storm events; (b) attenuated radar color ratio; (c) polarization ratio and (d) Total attenuated backscatter coefficient in 532 nm channel (Unit: km−1 … sr−1).
Remotesensing 15 03183 g008

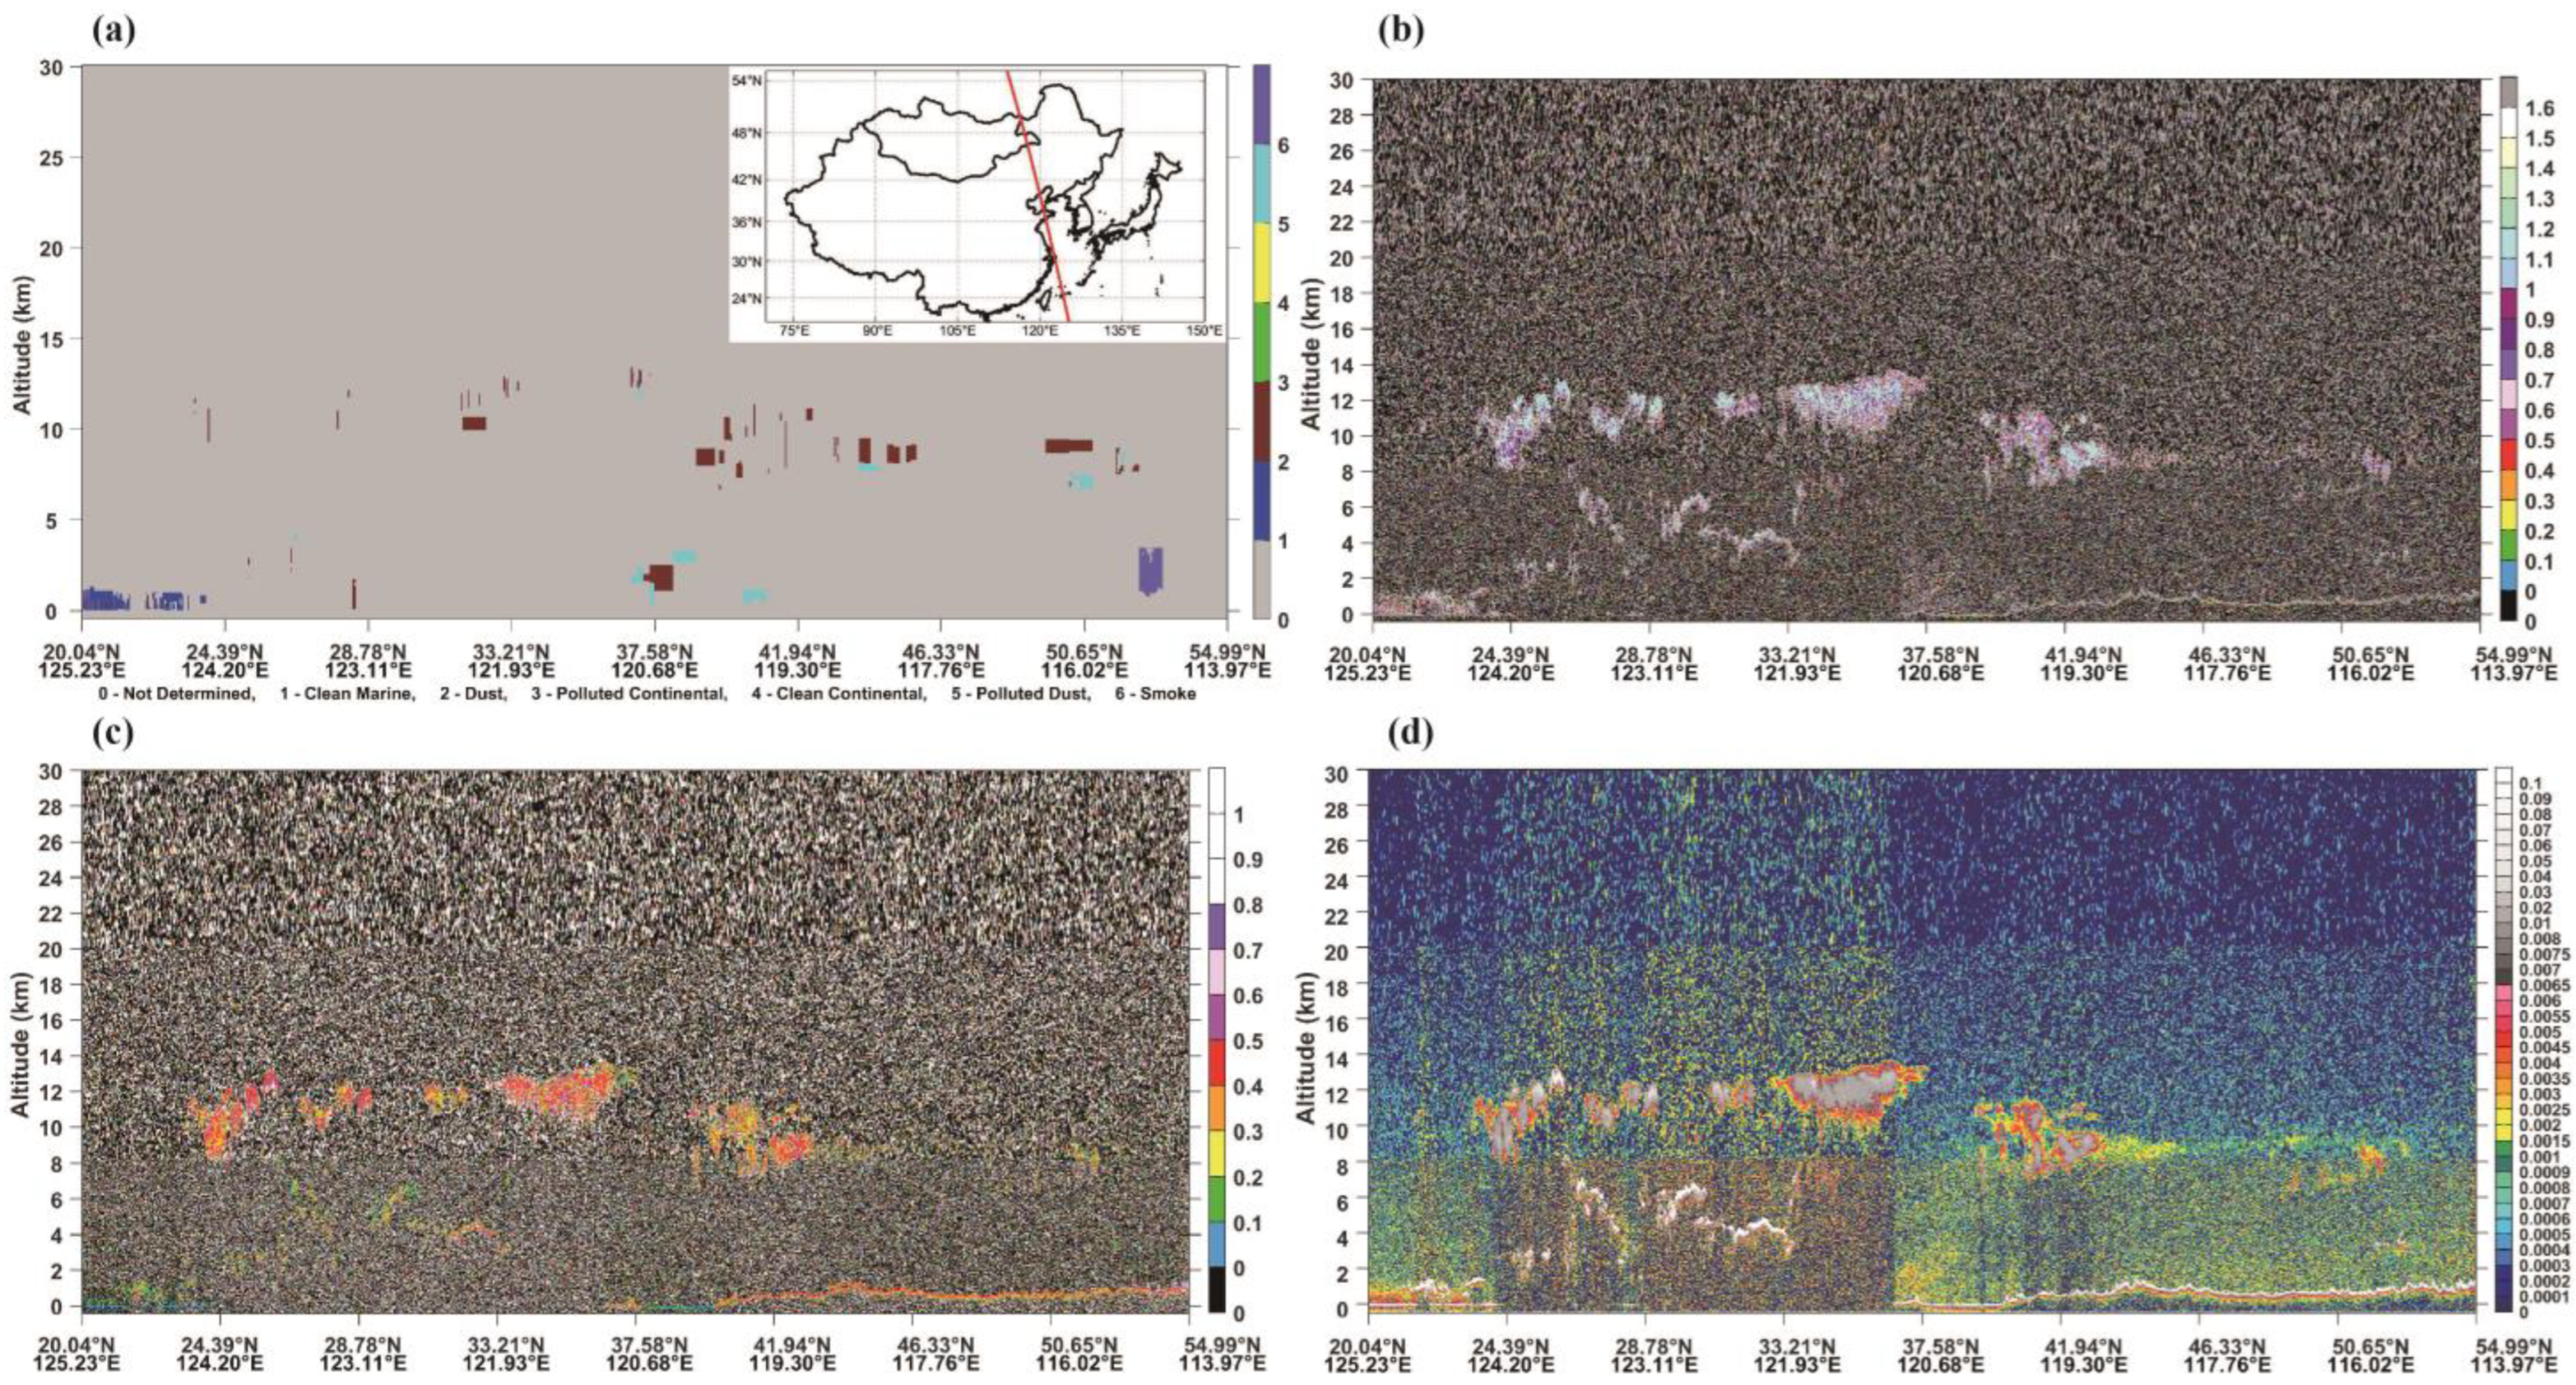
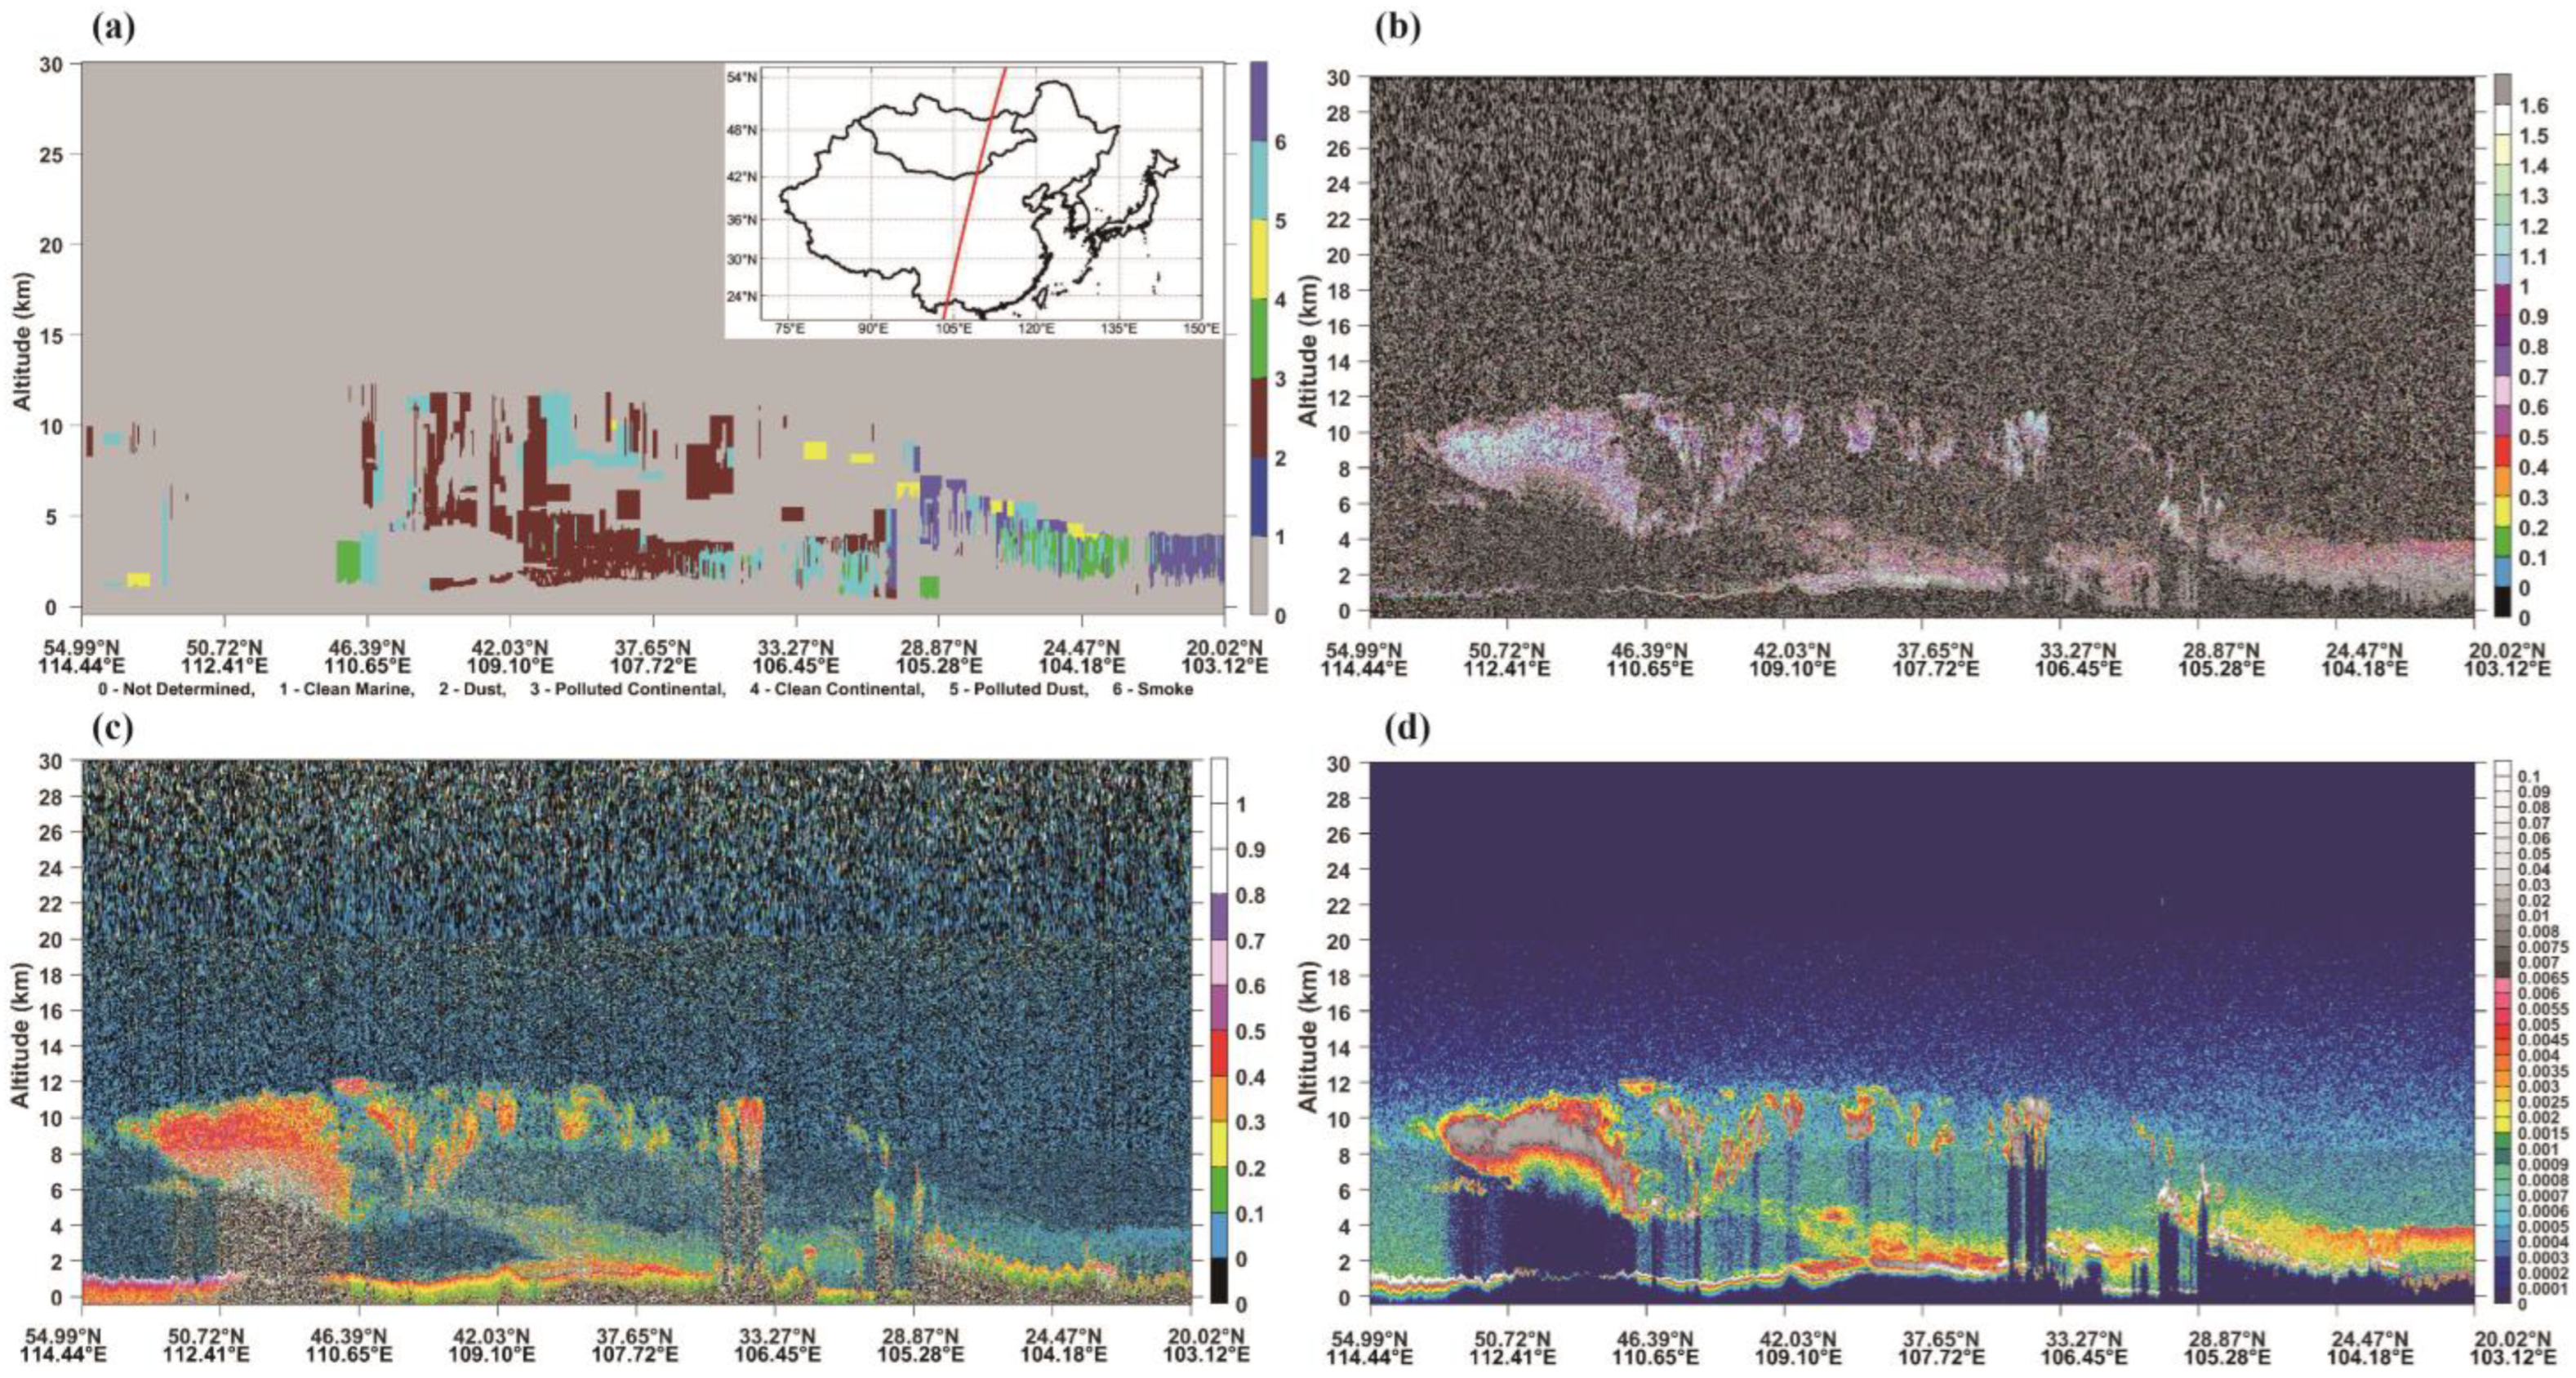
3.3.3. Dust Storm on 15 March 2021

On 15 March 2021, a dust storm took place in Guaizihu, Alxa league, Inner Mongolia. To trace its trajectory, we simulated the movement backward for 72 h using Guaizihu (41.37°N, 102.37°E) as the reference point. The simulation included three heights: 1000, 2000, and 3000 m (Figure 9). The dust movement followed two paths, northwest and westward, and impacted most regions of northwest, Inner Mongolia, and north China.
Figure 9. HYSPLIT simulation of dust transport path on 15 March 2021, and dust events monitored at the station, including flowing dust (FD), blowing dust (BD), and dust storm (DS). The red square is Guaizihu station.
Remotesensing 15 03183 g009
The resulting dust movement had two paths: a northwest path and a westward path. The areas affected were primarily located in northwest, Inner Mongolia, and northern China. The dust storm primarily affected the 1–10 km range, with clear dust particles observed at mid-latitudes. A few polluting dust particles were observed at heights below 5 km near the ground and at 10 km aloft at mid-latitudes (Figure 10a). At high and low latitudes, there were two distinct distributions of color ratios: high latitudes at 8–10 km aloft and more distinct color ratios at mid and low latitudes in the 2–5 km range (Figure 10b). The depolarization ratio had similarly high values in the 2 km range near the ground, as well as at heights of 10 km at low and mid latitudes (Figure 10c). The total attenuation backscattering coefficient of 532 nm was distributed between 0.0015 and 0.0045 km−1·sr−1 at a height of 2–4 km near the ground in southern Mongolia and Inner Mongolia at mid-latitudes. The highest value of the total attenuation backscattering coefficient was found in Inner Mongolia (Figure 10d). In summary, the southern part of Mongolia bordering Inner Mongolia was heavily impacted by a large number of dust-type aerosols with irregular shapes and large particle sizes, consistent with the actual situation.
Figure 10. On 15 March 2021, at 5:00 UTC, CALIPSO satellite 532 nm total attenuation backscatter coefficient, depolarization ratio, color ratio vertical profile and running trajectory. (a) Aerosol classification, the red line is satellite orbital paths of the dust storm events; (b) attenuated radar color ratio; (c) polarization ratio and (d) Total attenuated backscatter coefficient in 532 nm channel (Unit: km−1 … sr−1).
Remotesensing 15 03183 g010

4. Discussion

4.1. Impact Range and Trajectory of Dust Storms

Dust weather is a natural phenomenon that results from the interaction between specific desert ecosystems and meteorological conditions [53]. Studies have indicated that the potential dust source areas of dust storms are primarily concentrated in the arid regions of the study area, due to the extremely low precipitation and vegetation coverage, dry climate, and frequent strong winds, which provide an abundance of dust particles [54]. The two main factors affecting dust storms are dust sources and strong winds, with the former being the root cause of dust storms. Dust sources are usually characterized by processes like wind erosion and soil erosion in desert areas, and these may also be the result of human activities [21,55]. Earlier research has shown that the Siberian High plays a crucial role in the long-distance transport of dust particles in Asia. Changes in the Siberian high-pressure system and the strength of westerly winds can directly affect wind speed, which can then influence the outbreak of dust storms in northern China [18,56,57]. For instance, Roe [58] believed that the northward propagation of low-latitude heat in spring disrupted the Siberian high-pressure system and caused atmospheric disturbances that provided necessary dynamic conditions for the transmission of dust storms. The description of DOF (Figure 2) implies that dust storms can affect a large area of northern China. However, the eastern and southern regions of the study area have a more humid climate, and the soil moisture is higher due to spring snowmelt compared to in the northern desert regions [2,59]. The vegetation growing season is also longer in these areas compared to the northwest and northern inland arid regions [60]. Therefore, in these regions, the occurrence of dust storms can be effectively controlled by appropriate land management practices and scientific land use.
Previous research has indicated that the desertification trend in Mongolia is expanding northward [61,62]. Our analysis of DO/BD/DS data over the past 40 years reveals that the frequency of dust storms in northern Mongolia has been increasing (Figure 3). Desertification is closely associated with both climate change and human activities [32,59,63]. Numerous studies have reported that excessive grazing, oil extraction, and global warming-induced drought are causing vegetation decline and an expansion of the desertification zone in northern Mongolia [33]. These factors have significantly contributed to the observed increase in the frequency of dust storms. Therefore, implementing more stringent ecological protection measures and limiting human activities in northern Mongolia is crucial to mitigating the issue of dust storms in this area.
According to the results of the multi-year post-term trajectory model simulations conducted on the four selected locations, we found that there are three primary paths of dust movement in East Asia: the northwest, west, and north paths (Figure 4). The transport direction of these paths is mainly from northwest to southeast, and affects the surrounding areas, which is consistent with previous research findings [38,49]. However, over the past 40 years, the number of dust storms in the southeast of the study area, such as the Beijing area, has decreased due to the weakening of airflow intensity over time. This may be due to the decrease in the temperature difference and temperature gradient between land and sea in the winter half of the year because of global warming in the late 1980s, the weakening of the Siberian high-pressure system and the westerly wind, and a decrease in average wind speed [64]. Recent measures adopted by the Chinese government, such as implementing desertification control, controlling overgrazing, strengthening grassland construction, and carrying out artificial rainfall enhancement have effectively reduced the frequency and intensity of dust storms [35]. Additionally, people’s awareness of environmental protection is gradually increasing, and their behavior is becoming more focused on environmental protection, such as reducing the use of motor vehicles, promoting garbage sorting, and saving water, among other things, and this is also playing a role in improving the environment. Although these measures have achieved certain results, continuous efforts are still needed, particularly in the form of strengthening transnational cooperation to control the problem of dust storms.

4.2. Vertical Distribution of Dust Storm

This study documents the long-range transport and vertical structure of dust storms in East Asia on the basis of case studies and statistical analyses, with a specific focus on the typical season for active dust events, which is from March to May each year. The study combines CALIPSO LiDAR backscatter with polarimetry, color ratio, and air mass anti-trajectory analysis to identify dust sources and transport paths. The results show that dust aerosols mainly originate from the vicinity of the Taklamakan and Gobi deserts, and then propagate over eastern China and the Pacific Ocean. The aerosol structure often exhibits two layers over eastern China and the western Pacific Ocean, which may be related to the contributions of two major dust sources, which is consistent with previous results [38]. The findings of this study provide a theoretical foundation for monitoring, forecasting, and controlling dust weather.
The Taklamakan Desert (Tarim Basin) is surrounded by high mountains in the northern, western, and southern regions, with an average altitude of more than 4000 m, limiting the transport of dust at lower altitudes. However, if aerosols are lifted to higher altitudes, westerly winds can transport them over long distances, even reaching the Pacific Ocean and beyond. CALIPSO LiDAR backscatter/depolarization ratio vertical distribution maps indicate that non-spherical dust aerosols float from near the surface to a region with about 10 km from the perimeter of the Taklamakan Desert. This suggests that dust aerosols can be transported into the westerly currents for long-range transport in the upper troposphere above altitudes of 6 km.
Dust storms originating from the Gobi Desert are commonly triggered by Mongolian cyclones, which can lift dust particles to altitudes exceeding 5 km. CALIPSO has recorded backscatter/depolarization ratio data from the surface to altitudes of approximately 10 km. These observations indicate that Gobi dust can be transported to the Pacific Ocean through both the lower and upper troposphere.
In this study, a comprehensive analysis of East Asian dust storms is conducted by combining ground and remote sensing observations with the HYSPLIT model to achieve the complementary advantages of different observation methods. However, remote sensing monitoring is often hindered by clouds, especially optical remote sensing, which can be affected by cloud cover. Moreover, while the CALIPSO satellite has a longer observation period than geostationary satellites, it has a smaller scan width, as it is a polar orbiting satellite. Therefore, in future research, greater attention should be paid to the vertical information of dust aerosol for large area identification, which provides a theoretical basis for monitoring, forecasting and prevention of dusty weather. Dust storms include both distant and local sources of particulate matter, and the supply of near-source particulate matter is closely related to surface conditions such as soil water content and vegetation cover. Therefore, greater attention needs to be paid to the ecological protection of the subsurface of potential dust source areas in the future.

5. Conclusions

In this study, we utilized meteorological data on dust events from 259 SYNOP stations across China and Mongolia to analyze the temporal and spatial clustering characteristics of dust outbreaks (DO) from 1980 to 2020. Firstly, the temporal and spatial trends of DO/BD/DS were examined. Secondly, the HYSPLIT model was used to calculate the 72 h backward airflow trajectory of typical regional dust storms. Finally, we analyzed the vertical distribution of dust aerosols using CALIPSO data and selected three dust storm events for comparison with the vertical structural changes in dust storms. The key findings of this research are as follows:
(1)
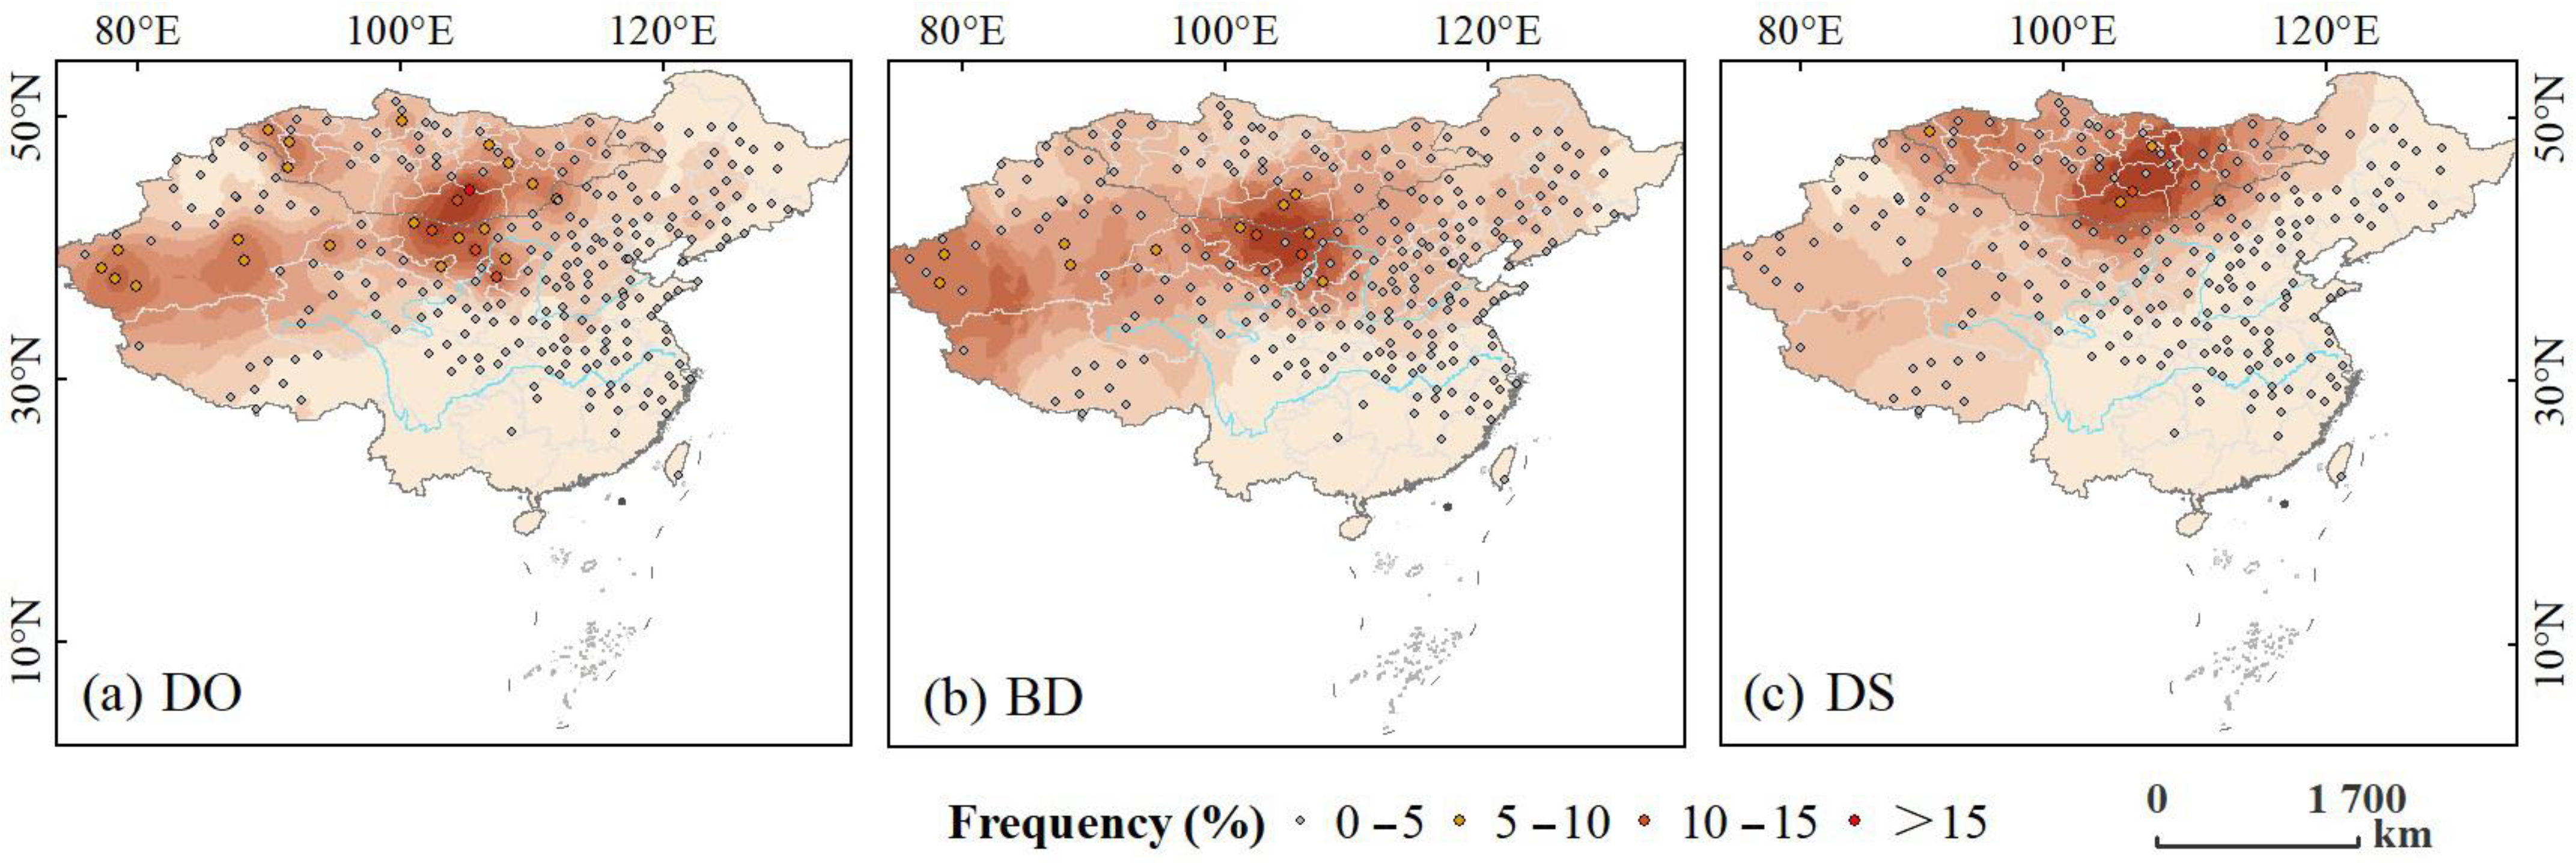
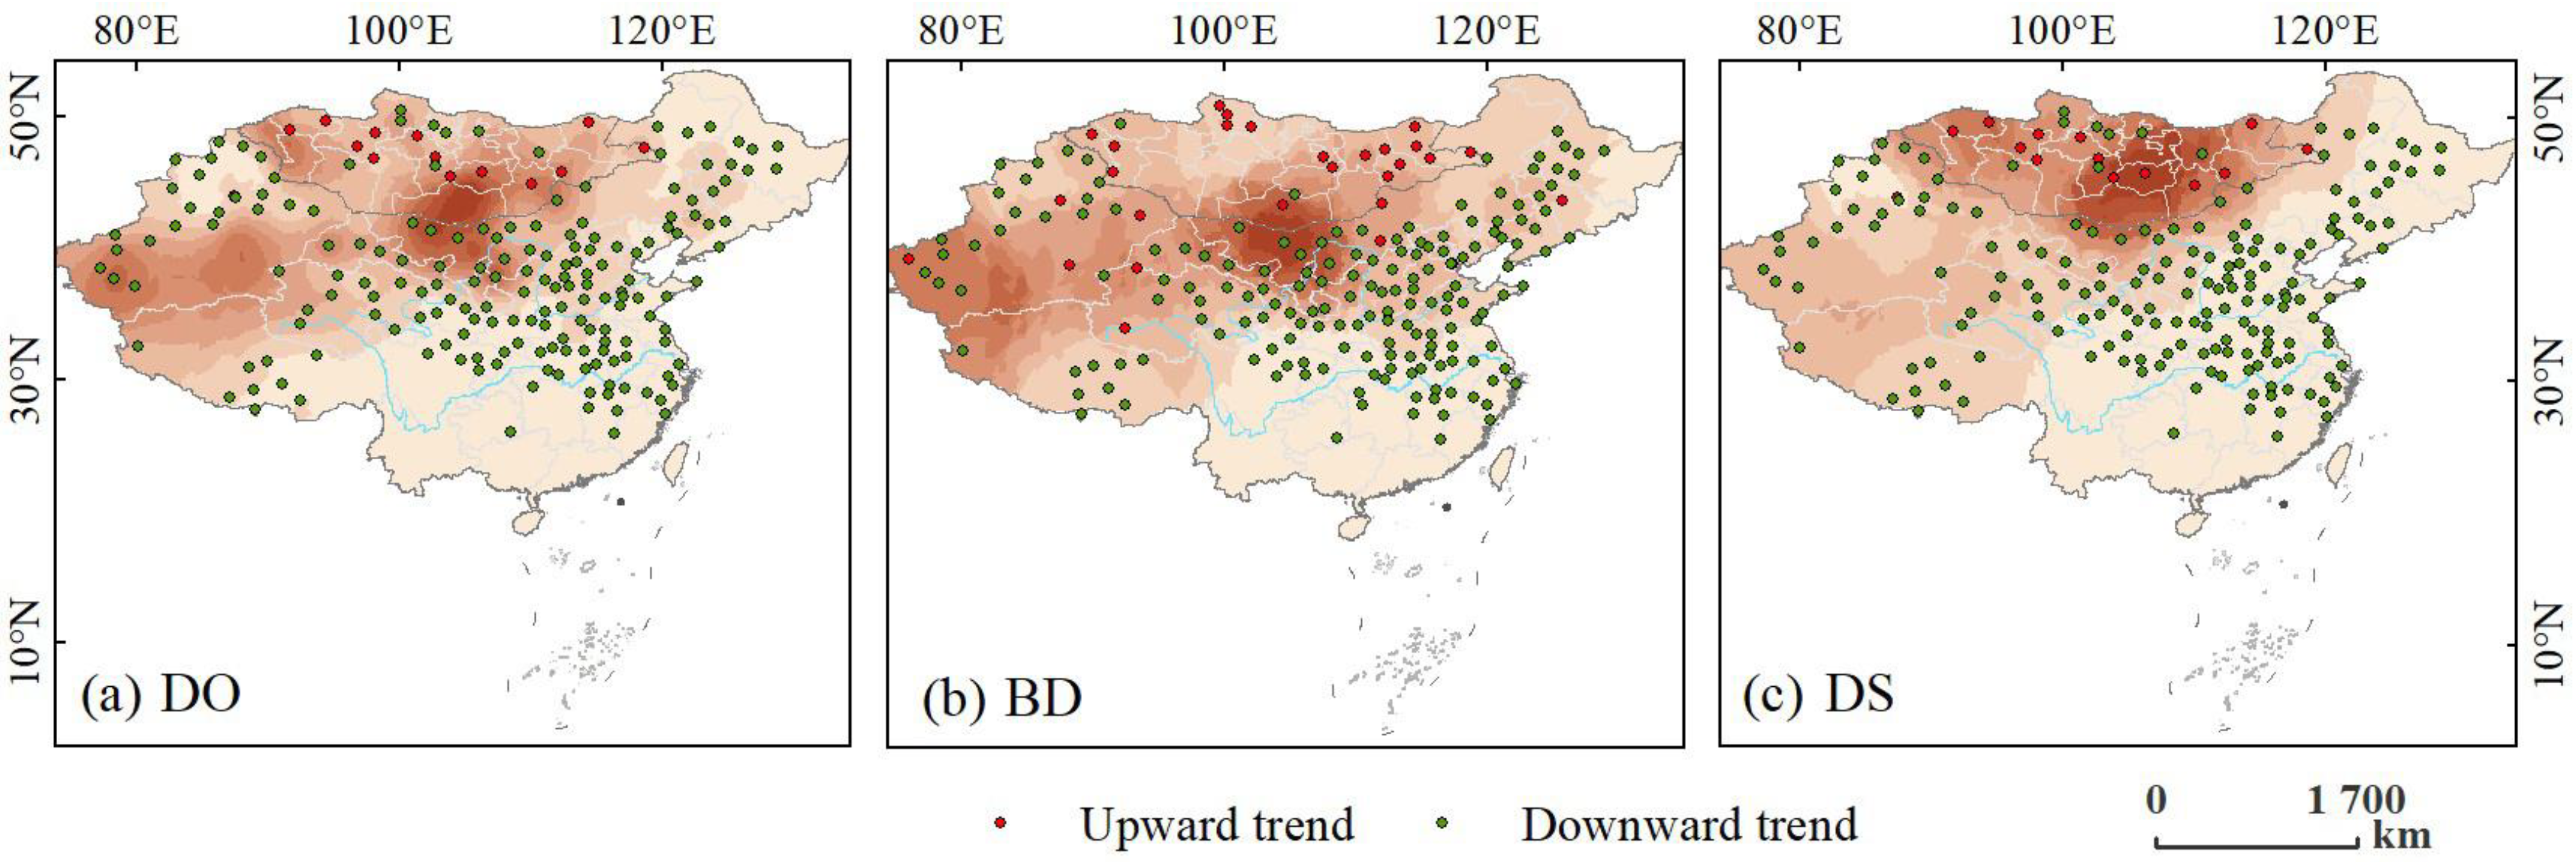
The DOF analysis reveals that the stations with higher frequency are situated in the southern part of Mongolia and the Taklamakan Desert in China (Figure 2). Since the 1980s, there has been a notable decrease in the magnitude of DO in East Asia. However, the situation in Mongolia is different, as DO have gradually increased in frequency over time. In China, an increasing trend of BD was observed in various stations located in the Taklimakan Desert and the lower reaches of the Yellow River. In Mongolia, the stations with increasing trends of DO are primarily those situated in the northern Gobi Desert region (Figure 3).
(2)
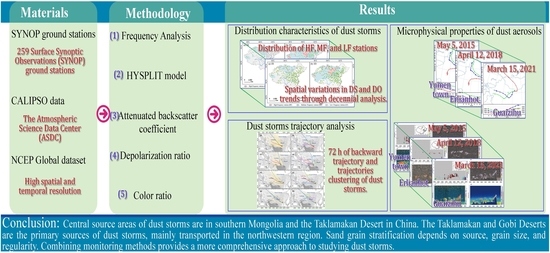
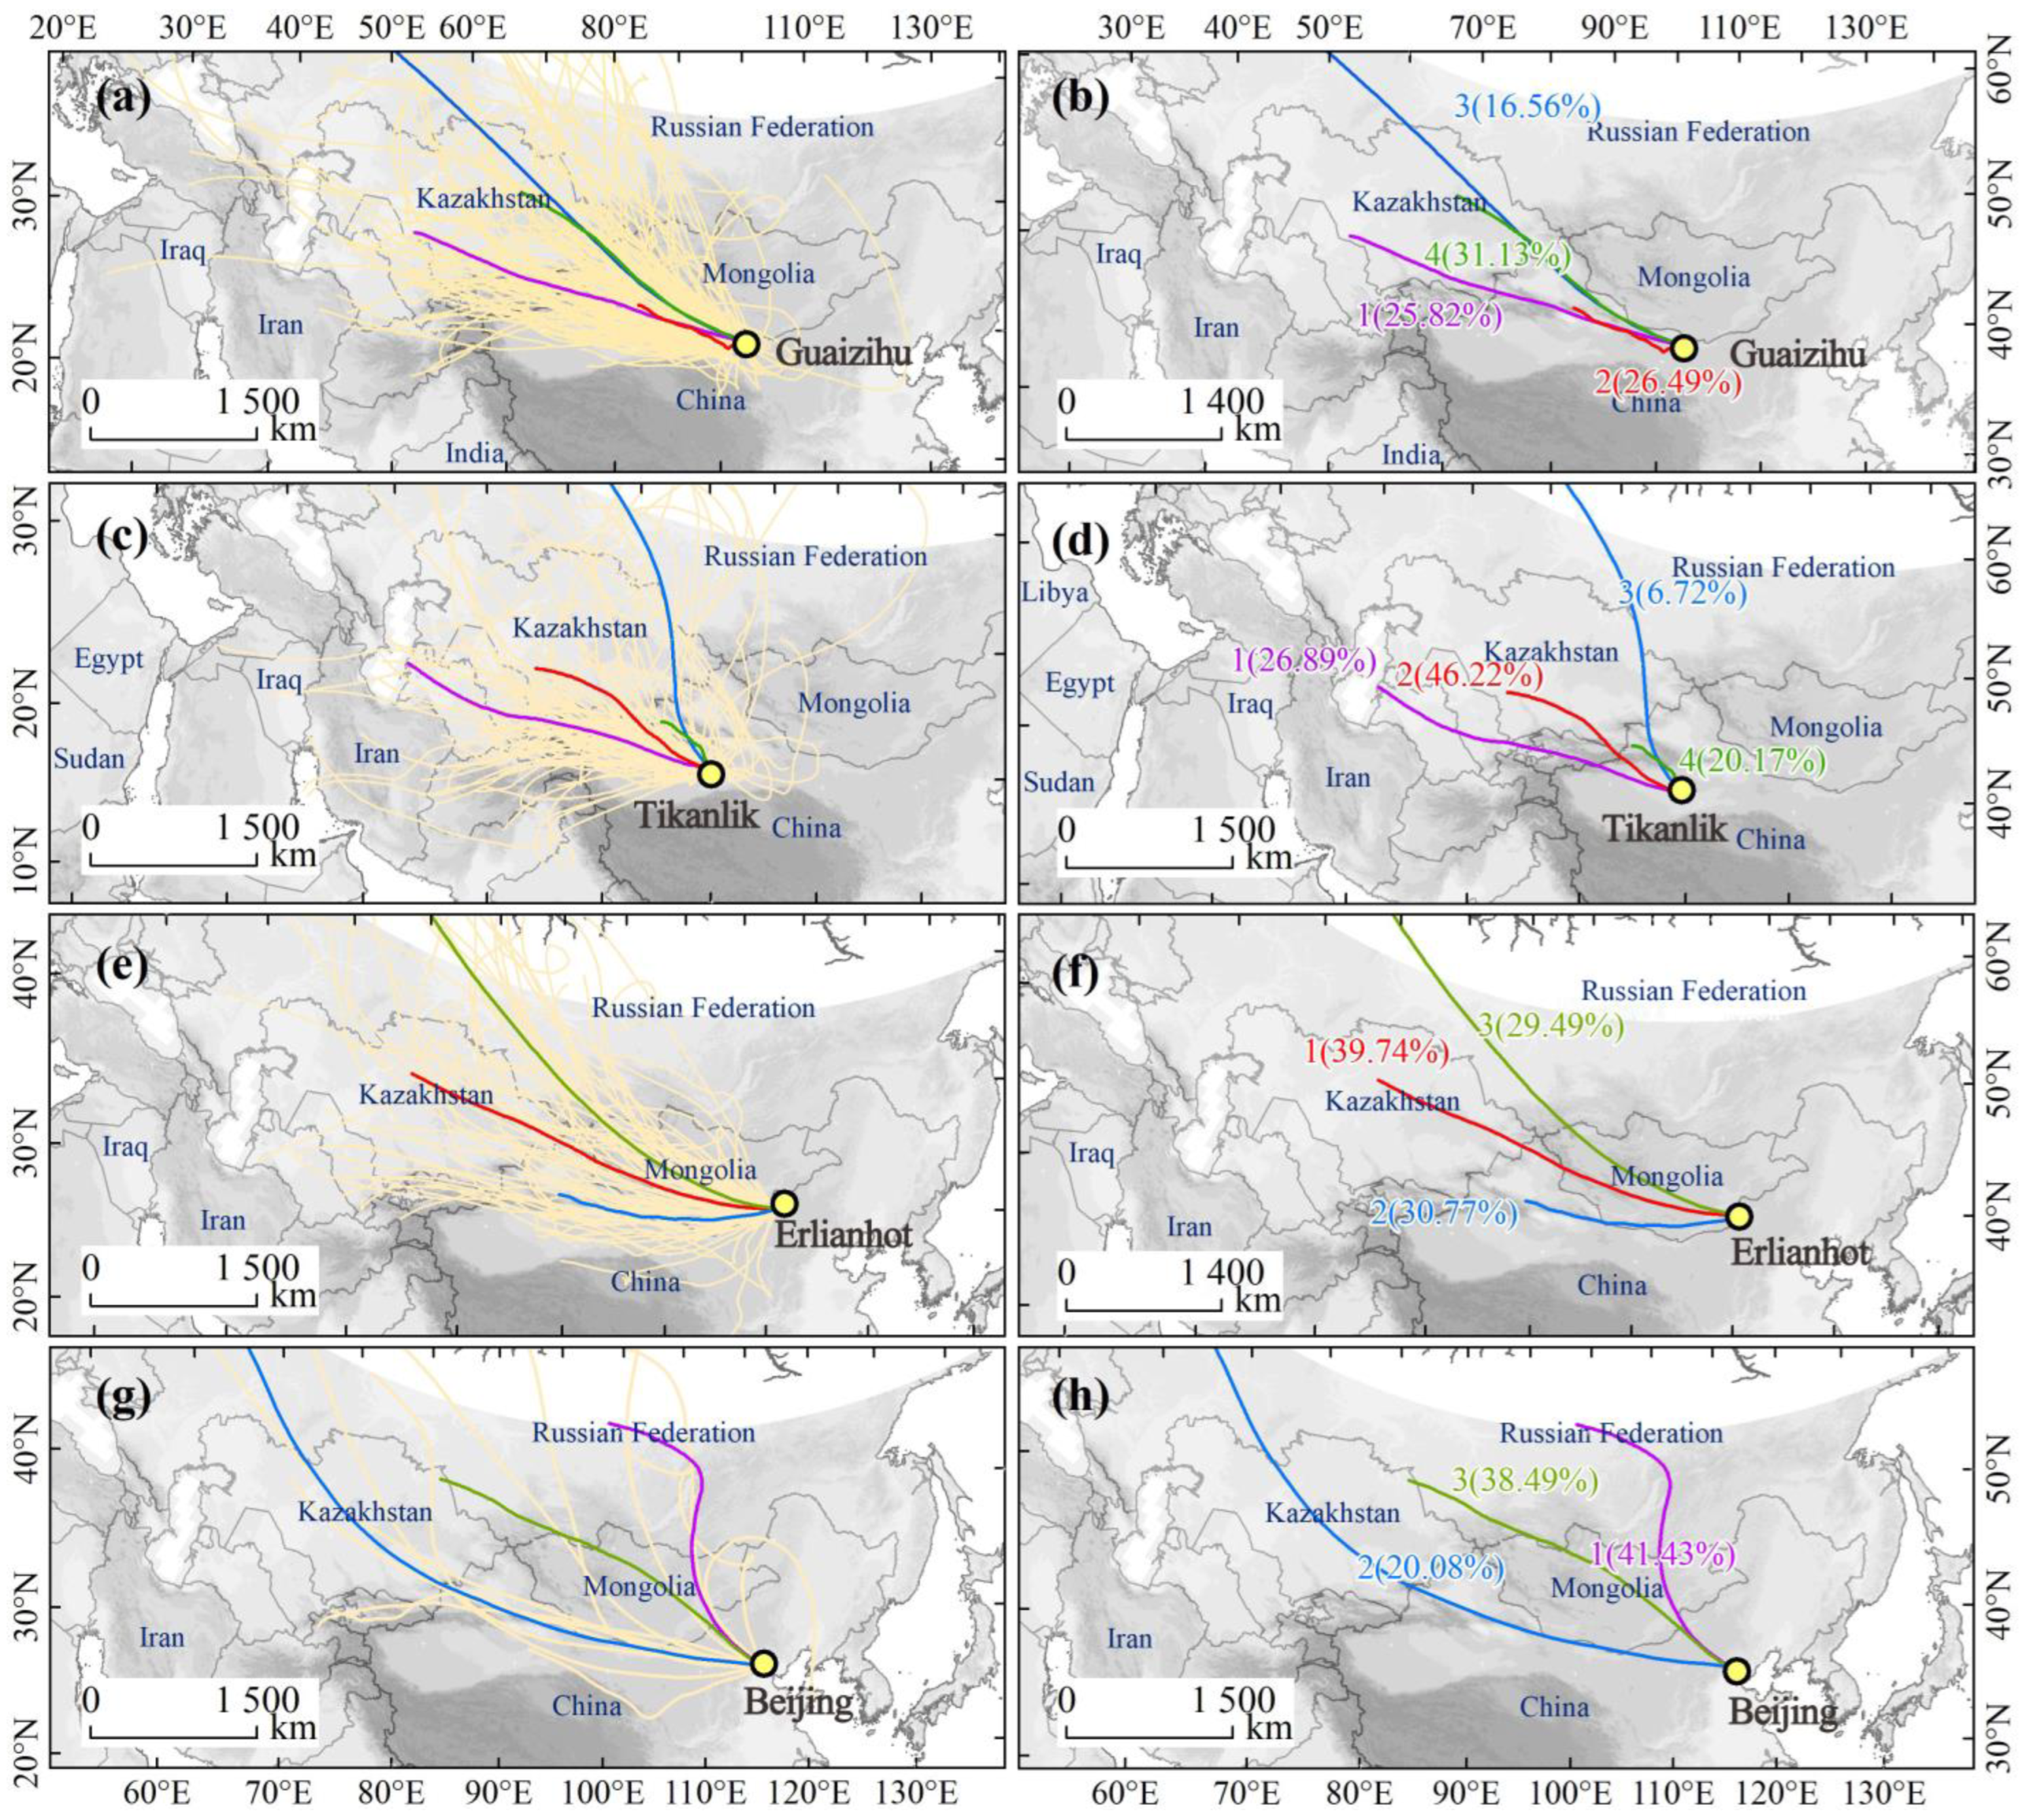
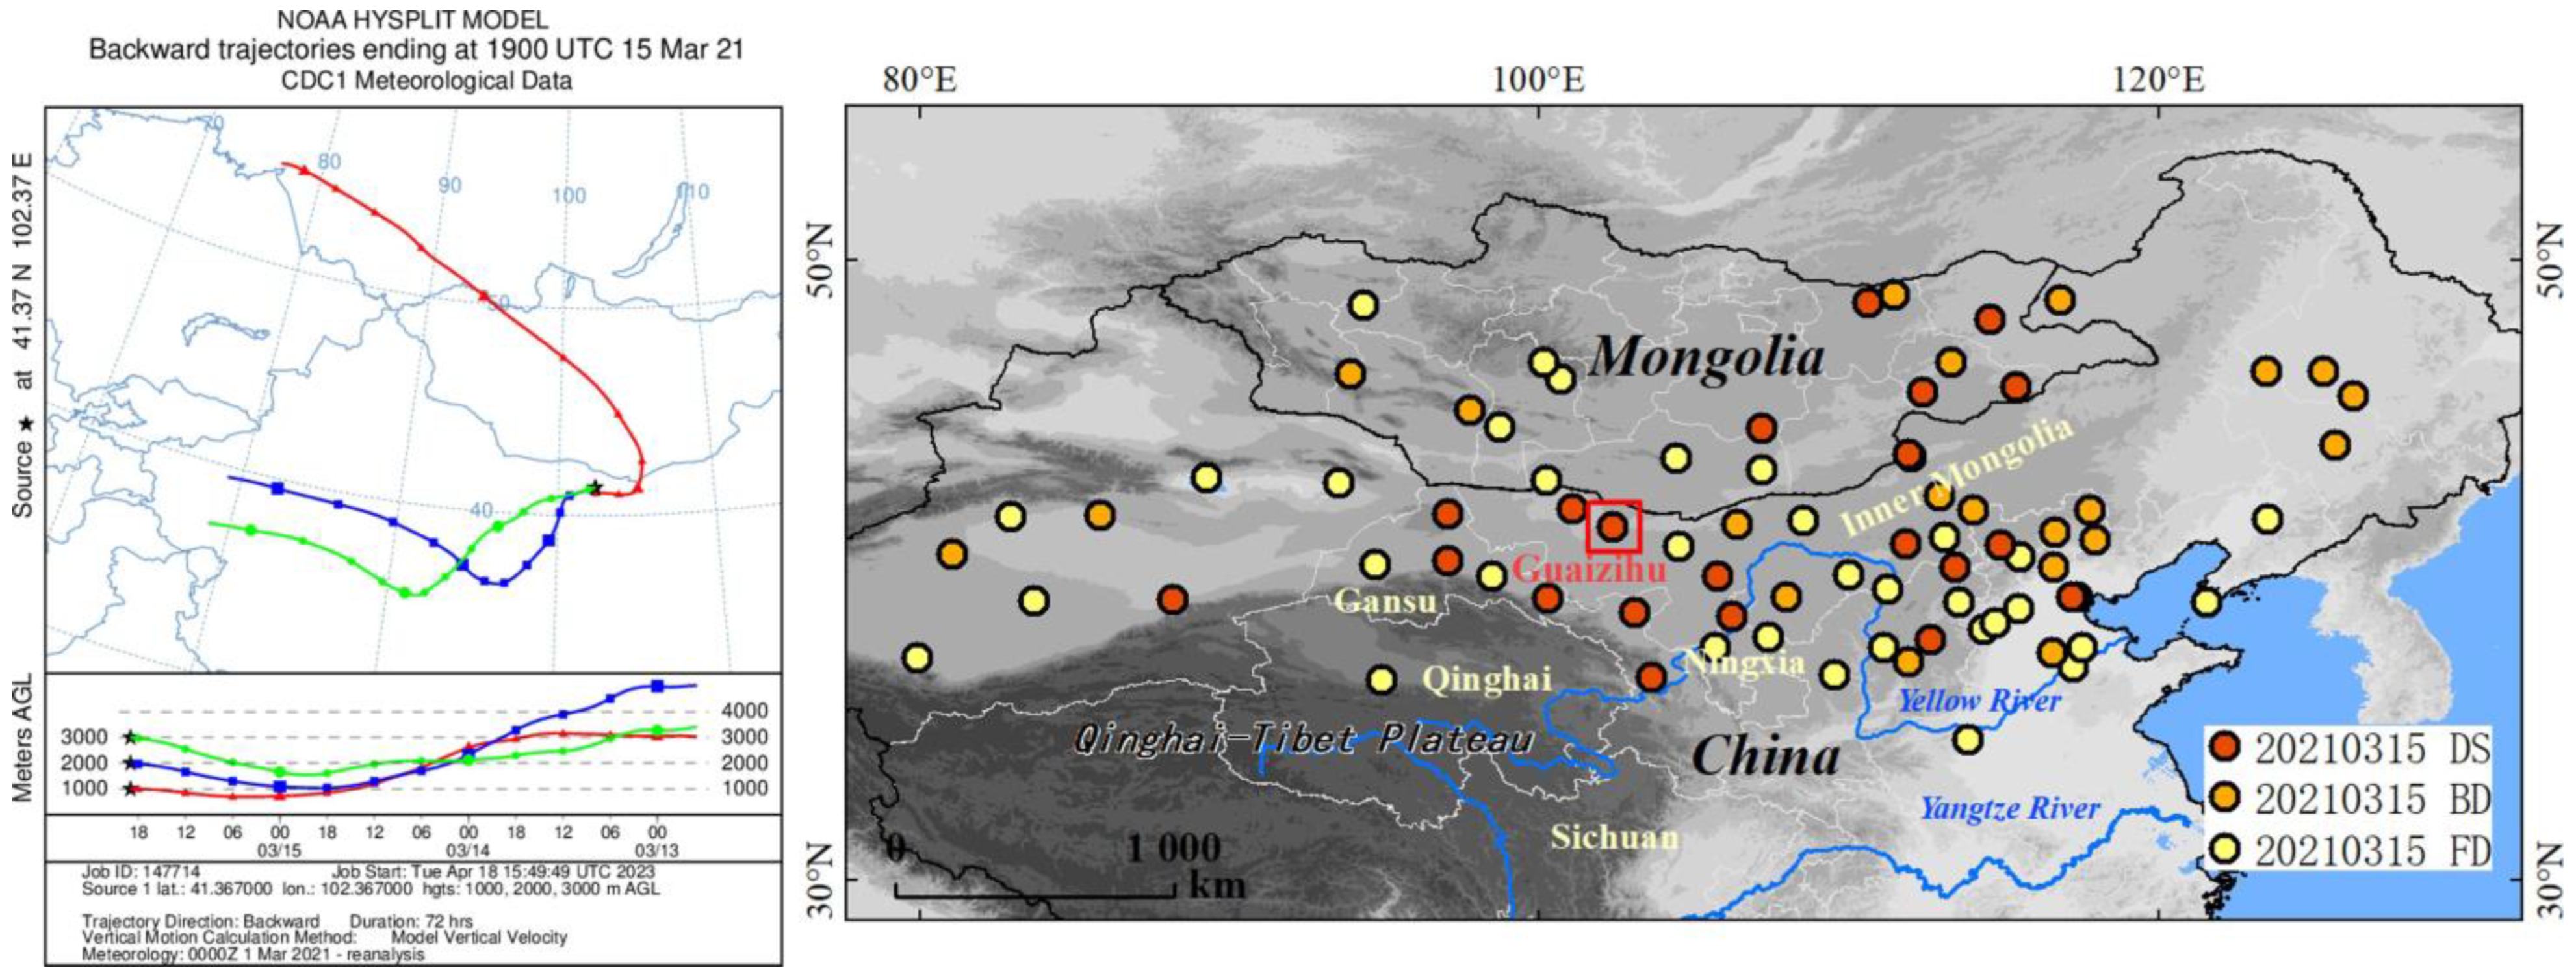
The dust storms at the four meteorological stations located on the main propagation paths in China (Guaizihu, Tikanlik, Erlian, and Beijing) originated from the northwest, westward and northward directions of the windward area. Therefore, there are three primary paths for the movement of dust storms in East Asia: the northwestern, westerly, and northerly paths (Figure 4). The dust storms in northern China originated from both distant and near sources, with those from near sources mainly originating in the Taklamakan Desert area. Those from distant source had two areas of origin: one originated from the direction of Kazakhstan, being enhanced through the Taklamakan Desert, while the second originated from the Gobi Desert in Mongolia, in the upwind area of China, with the main transfer path passing over northern China. Thus, the Taklamakan Desert and the Mongolian Gobi Desert can be identified as the primary sources of dust storms.
(3)
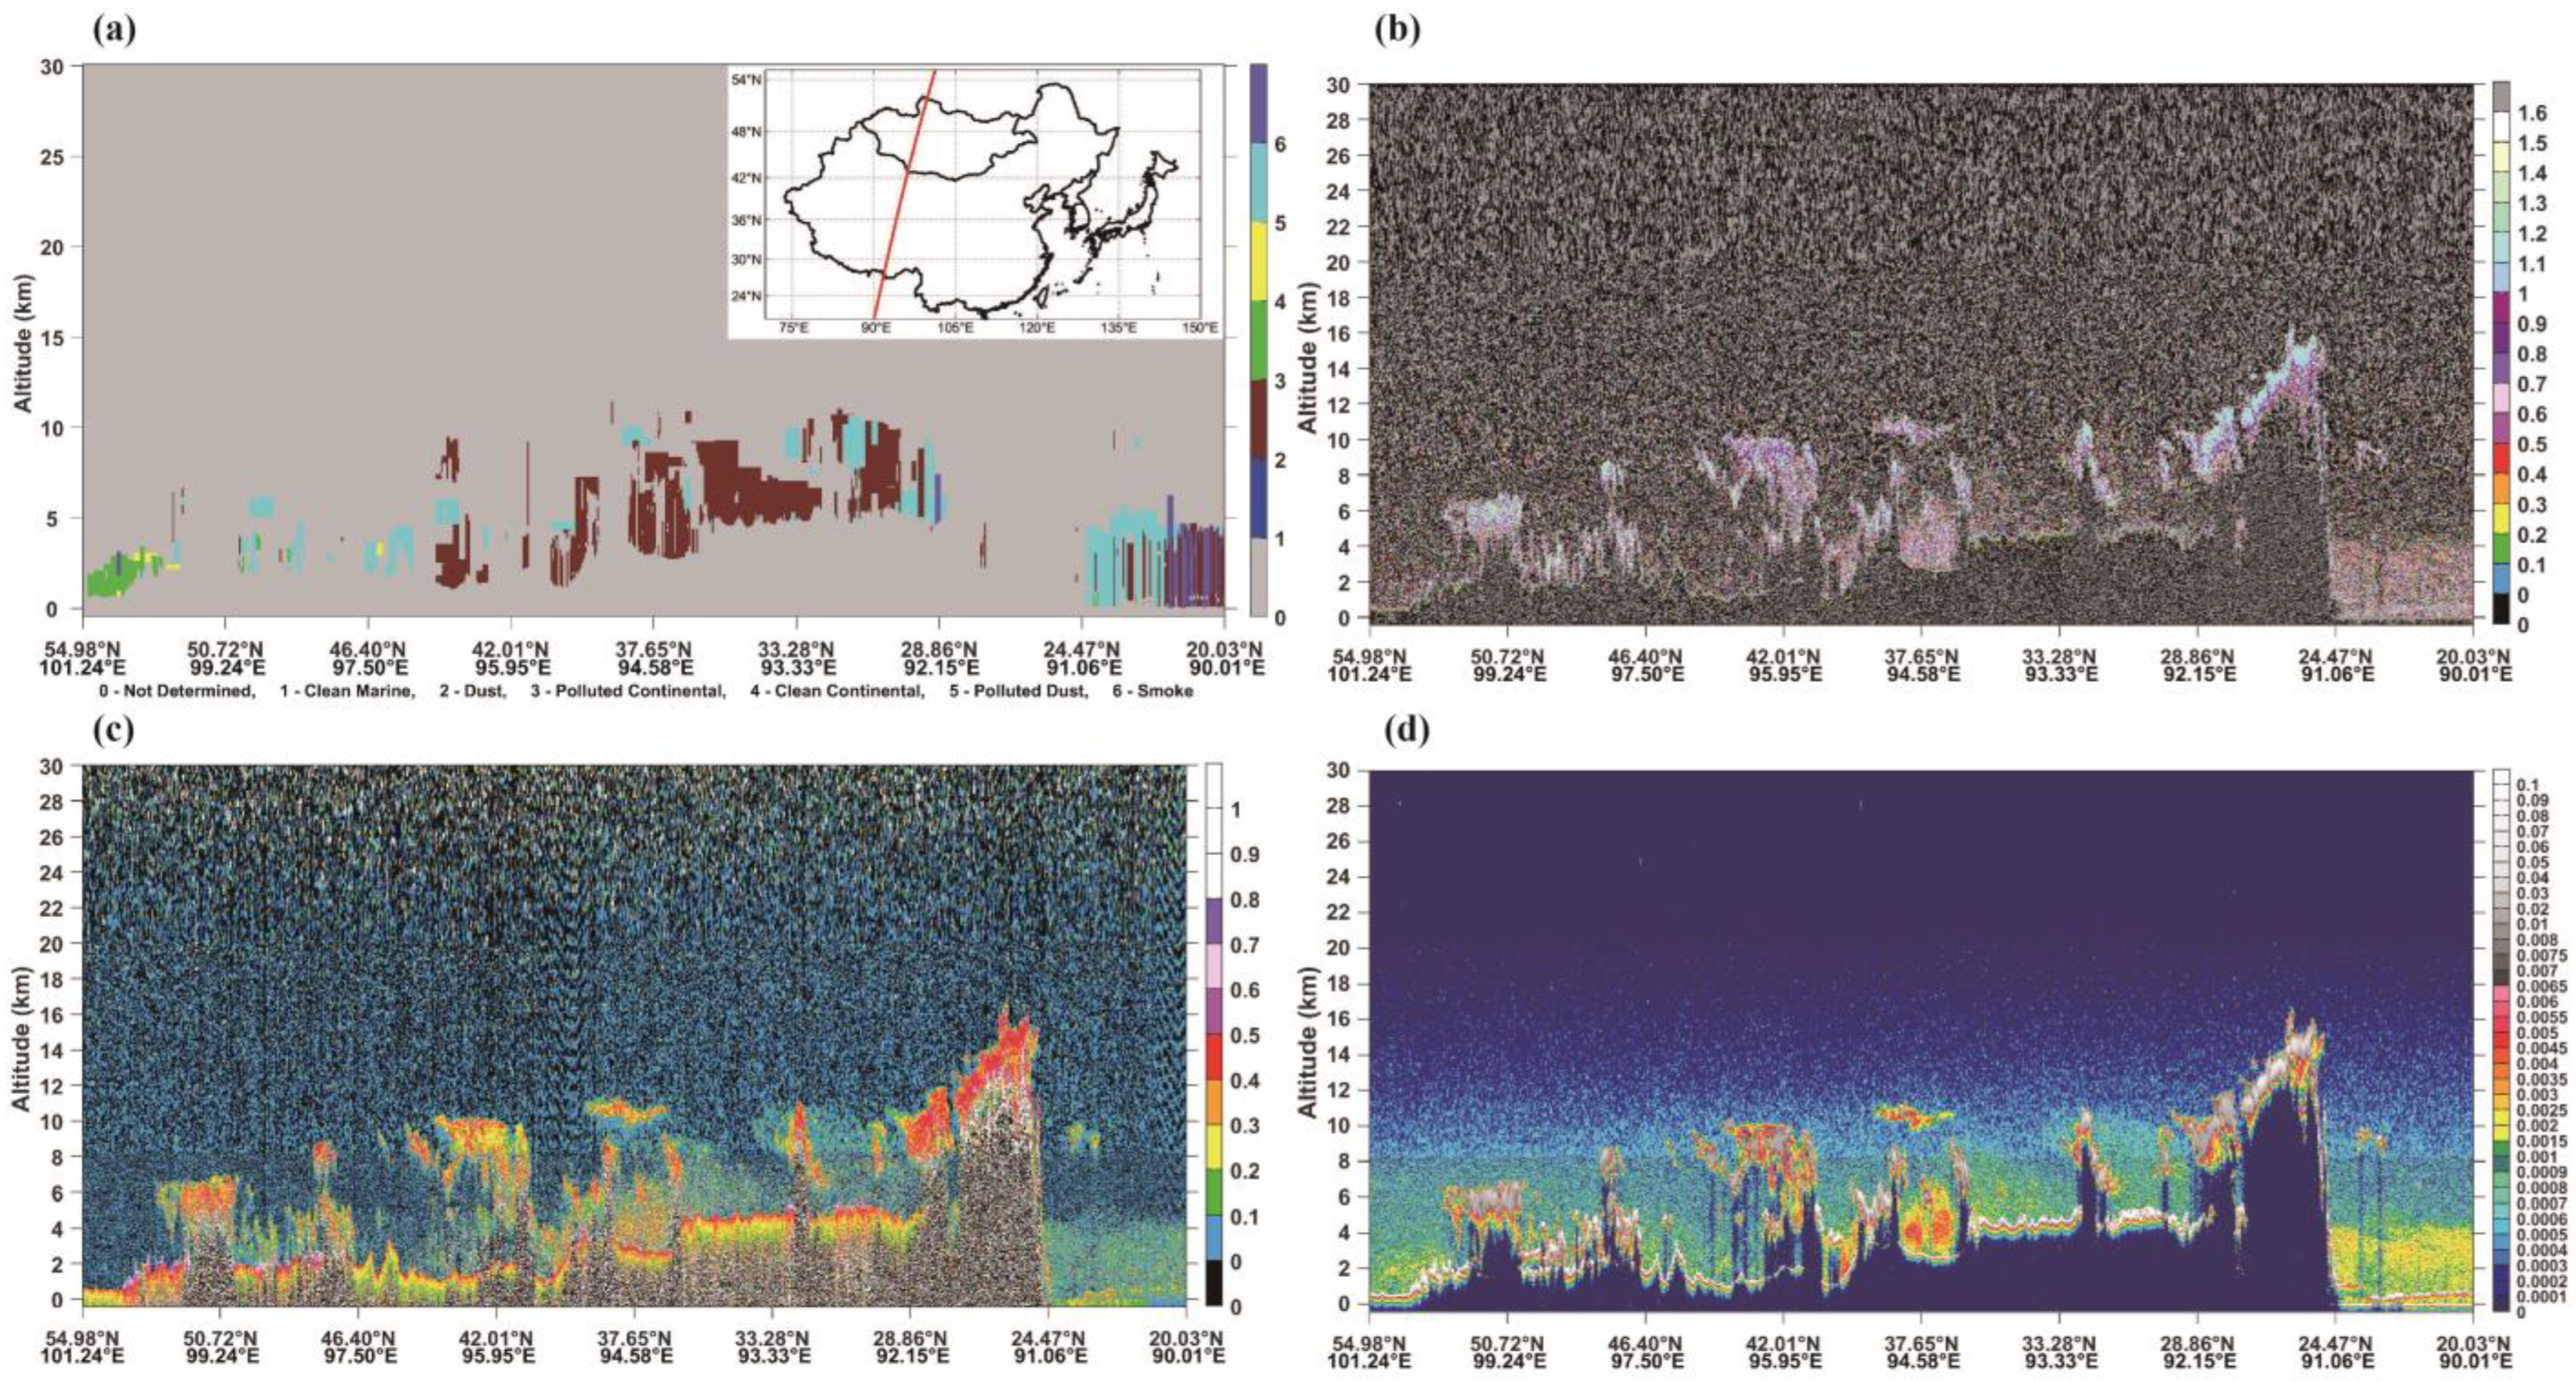
The vertical structures of dust layers are dependent on both the intensity of the dust event and its source, which can be determined by analyzing the total attenuation backscatter coefficient, depolarization ratio, and color ratio values. Dust storms typically reach their peak intensity when dust particles are distributed vertically at heights exceeding 3 km. In East Asia, the presence of various dust sources and particle sizes often leads to a stratified distribution of dust particles. Ground stations, remote sensing monitoring, and airflow model simulations have revealed that dust storms along the westerly path mainly affect local areas with blowing dust and floating dust. In contrast, dust storms along the northwestern and northerly paths have a wider impact.
Nevertheless, prioritizing the improvement of eco-environmental protection in the aforementioned deserts, particularly in the Taklimakan Desert and the Tengger Desert, could be crucial for achieving effective dust storm control in the future. As part of future research, we plan to conduct more thorough analysis by investigating the impact of different factors and examining the potential correlation between dust trajectory and severe dust storms.

Author Contributions

T.B., formal analysis, methodology, writing—original draft, writing—review & editing; G.X., software, writing—review and editing, visualization, validation; Y.H., funding acquisition, project administration, resources, writing—review & editing; I.-S.C., writing—review and editing, validation, supervision, funding acquisition; J.W., supervision, Resources; Z.X., validation, resources; E.J., data curation, resources; W.Z., project administration; Y.B., resources. All authors have read and agreed to the published version of the manuscript.

Funding

The authors would like to express their grateful appreciation to the funding support by the Center for Applied Mathematics Inner Mongolia (Project #: ZZYJZD2022001), the National Natural Science Foundations of China (Project #: 41861043), and the National Key Research and Development Program of China (Project #: 2018YFC1903604).

Data Availability Statement

Not applicable.

Conflicts of Interest

The authors declare no conflict of interest.

References

  1. Yumimoto, K.; Takemura, T. Long-term inverse modeling of Asian dust: Interannual variations of its emission, transport, deposition, and radiative forcing. J. Geophys. Res. Atmos. 2015, 120, 1582–1607. [Google Scholar] [CrossRef]
  2. Lee, J.-J.; Kim, C.-H. Roles of surface wind, NDVI and snow cover in the recent changes in Asian dust storm occurrence frequency. Atmos. Environ. 2012, 59, 366–375. [Google Scholar] [CrossRef]
  3. Tan, S.-C.; Li, J.; Che, H.; Chen, B.; Wang, H. Transport of East Asian dust storms to the marginal seas of China and the southern North Pacific in spring 2010. Atmos. Environ. 2017, 148, 316–328. [Google Scholar] [CrossRef]
  4. Laurent, B.; Marticorena, B.; Bergametti, G.; Mei, F. Modeling mineral dust emissions from Chinese and Mongolian deserts. Glob. Planet. Chang. 2006, 52, 121–141. [Google Scholar] [CrossRef]
  5. Zhang, Z.; Zhou, W.; Yang, L. Analysis of dust wet deposition in the mid-latitudes of the Northern Hemisphere. Air Qual. Atmos. Health 2019, 12, 217–227. [Google Scholar] [CrossRef]
  6. Middleton, N.J. Desert dust hazards: A global review. Aeolian Res. 2017, 24, 53–63. [Google Scholar] [CrossRef]
  7. Schweitzer, M.D.; Calzadilla, A.S.; Salamo, O.; Sharifi, A.; Kumar, N.; Holt, G.; Campos, M.; Mirsaeidi, M. Lung health in era of climate change and dust storms. Environ. Res. 2018, 163, 36–42. [Google Scholar] [CrossRef] [PubMed]
  8. Tanaka, T.Y.; Chiba, M. A numerical study of the contributions of dust source regions to the global dust budget. Glob. Planet. Chang. 2006, 52, 88–104. [Google Scholar] [CrossRef]
  9. Uno, I.; Eguchi, K.; Yumimoto, K.; Takemura, T.; Shimizu, A.; Uematsu, M.; Liu, Z.; Wang, Z.; Hara, Y.; Sugimoto, N. Asian dust transported one full circuit around the globe. Nat. Geosci. 2009, 2, 557–560. [Google Scholar] [CrossRef]
  10. Song, H.; Zhang, K.; Piao, S.; Liu, L.; Wang, Y.-P.; Chen, Y.; Yang, Z.; Zhu, L.; Wan, S. Soil organic carbon and nutrient losses resulted from spring dust emissions in Northern China. Atmos. Environ. 2019, 213, 585–596. [Google Scholar] [CrossRef]
  11. Shao, Y.; Wyrwoll, K.-H.; Chappell, A.; Huang, J.; Lin, Z.; McTainsh, G.H.; Mikami, M.; Tanaka, T.Y.; Wang, X.; Yoon, S. Dust cycle: An emerging core theme in Earth system science. Aeolian Res. 2011, 2, 181–204. [Google Scholar] [CrossRef]
  12. Kuang, W. 70 years of urban expansion across China: Trajectory, pattern, and national policies. Sci. Bull. 2020, 65, 1970–1974. [Google Scholar] [CrossRef] [PubMed]
  13. Kuang, W. National urban land-use/cover change since the beginning of the 21st century and its policy implications in China. Land Use Policy 2020, 97, 104747. [Google Scholar] [CrossRef]
  14. Kuang, W.; Du, G.; Lu, D.; Dou, Y.; Li, X.; Zhang, S.; Chi, W.; Dong, J.; Chen, G.; Yin, Z.; et al. Global observation of urban expansion and land-cover dynamics using satellite big-data. Sci. Bull. 2021, 66, 297–300. [Google Scholar] [CrossRef]
  15. Zhang, X.Y.; Gong, S.L.; Zhao, T.L.; Arimoto, R.; Wang, Y.Q.; Zhou, Z.J. Sources of Asian dust and role of climate change versus desertification in Asian dust emission. Geophys. Res. Lett. 2003, 30, 2272. [Google Scholar] [CrossRef] [Green Version]
  16. Kim, J. Transport routes and source regions of Asian dust observed in Korea during the past 40 years (1965–2004). Atmos. Environ. 2008, 42, 4778–4789. [Google Scholar] [CrossRef]
  17. Guo, L.; Fan, B.; Zhang, F.; Jin, Z.; Lin, H. The Clustering of Severe Dust Storm Occurrence in China From 1958 to 2007. J. Geophys. Res. Atmos. 2018, 123, 8035–8046. [Google Scholar] [CrossRef] [Green Version]
  18. Shao, Y.; Klose, M.; Wyrwoll, K.-H. Recent global dust trend and connections to climate forcing. J. Geophys. Res. Atmos. 2013, 118, 11107–11118. [Google Scholar] [CrossRef]
  19. Mo, J.; Gong, S.; Zhang, L.; He, J.; Lu, S.; Zhou, Y.; Ke, H.; Zhang, H. Impacts of long-range transports from Central and South Asia on winter surface PM2.5 concentrations in China. Sci. Total Environ. 2021, 777, 146243. [Google Scholar] [CrossRef]
  20. Wang, S.; Yu, Y.; Zhang, X.-X.; Lu, H.; Zhang, X.-Y.; Xu, Z. Weakened dust activity over China and Mongolia from 2001 to 2020 associated with climate change and land-use management. Environ. Res. Lett. 2021, 16, 124056. [Google Scholar] [CrossRef]
  21. Wang, H.; Jia, X.; Li, K.; Li, Y. Horizontal wind erosion flux and potential dust emission in arid and semiarid regions of China: A major source area for East Asia dust storms. CATENA 2015, 133, 373–384. [Google Scholar] [CrossRef]
  22. Lee, J.-H.; Lee, S.-H. Modeling a severe wintertime Asian dust event observed in the East Asia region: Sensitivity of the WRF-Chem dust emission schemes. Atmos. Pollut. Res. 2022, 13, 101599. [Google Scholar] [CrossRef]
  23. Guo, J.; Lou, M.; Miao, Y.; Wang, Y.; Zeng, Z.; Liu, H.; He, J.; Xu, H.; Wang, F.; Min, M.; et al. Trans-Pacific transport of dust aerosols from East Asia: Insights gained from multiple observations and modeling. Environ. Pollut. 2017, 230, 1030–1039. [Google Scholar] [CrossRef]
  24. Vijayakumar, K.; Devara, P.C.S.; Rao, S.V.B.; Jayasankar, C.K. Dust aerosol characterization and transport features based on combined ground-based, satellite and model-simulated data. Aeolian Res. 2016, 21, 75–85. [Google Scholar] [CrossRef]
  25. Stein, A.F.; Draxler, R.R.; Rolph, G.D.; Stunder, B.J.B.; Cohen, M.D.; Ngan, F. NOAA’s HYSPLIT Atmospheric Transport and Dispersion Modeling System. Bull. Am. Meteorol. Soc. 2015, 96, 2059–2077. [Google Scholar] [CrossRef]
  26. Shao, Y.; Dong, C.H. A review on East Asian dust storm climate, modelling and monitoring. Glob. Planet. Chang. 2006, 52, 1–22. [Google Scholar] [CrossRef]
  27. Chen, S.; Huang, J.; Qian, Y.; Zhao, C.; Kang, L.; Yang, B.; Wang, Y.; Liu, Y.; Yuan, T.; Wang, T.; et al. An overview of mineral dust modeling over East Asia. J. Meteorol. Res. 2017, 31, 633–653. [Google Scholar] [CrossRef]
  28. Huang, L.; Jiang, J.H.; Tackett, J.L.; Su, H.; Fu, R. Seasonal and diurnal variations of aerosol extinction profile and type distribution from CALIPSO 5-year observations. J. Geophys. Res. Atmos. 2013, 118, 4572–4596. [Google Scholar] [CrossRef]
  29. Proestakis, E.; Amiridis, V.; Marinou, E.; Georgoulias, A.K.; Solomos, S.; Kazadzis, S.; Chimot, J.; Che, H.; Alexandri, G.; Binietoglou, I.; et al. Nine-year spatial and temporal evolution of desert dust aerosols over South and East Asia as revealed by CALIOP. Atmos. Chem. Phys. 2018, 18, 1337–1362. [Google Scholar] [CrossRef] [Green Version]
  30. Omar, A.H.; Tackett, J.; Al-Dousari, A. CALIPSO Observations of Sand and Dust Storms and Comparisons of Source Types near Kuwait City. Atmosphere 2022, 13, 1946. [Google Scholar] [CrossRef]
  31. Al-Dousari, A.; Omar, A.; Al-Hemoud, A.; Aba, A.; Alrashedi, M.; Alrawi, M.; Rashki, A.; Petrov, P.; Ahmed, M.; Al-Dousari, N.; et al. A Success Story in Controlling Sand and Dust Storms Hotspots in the Middle East. Atmosphere 2022, 13, 1335. [Google Scholar] [CrossRef]
  32. Lee, E.-H.; Sohn, B.-J. Recent increasing trend in dust frequency over Mongolia and Inner Mongolia regions and its association with climate and surface condition change. Atmos. Environ. 2011, 45, 4611–4616. [Google Scholar] [CrossRef]
  33. Amgalan, G.; Liu, G.-R.; Kuo, T.-H.; Lin, T.-H. Correlation between dust events in Mongolia and surface wind and precipitation. Terr. Atmos. Ocean. Sci. 2017, 28, 23–32. [Google Scholar] [CrossRef] [Green Version]
  34. Kimura, R.; Bai, L.; Wang, J. Relationships among dust outbreaks, vegetation cover, and surface soil water content on the Loess Plateau of China, 1999–2000. CATENA 2009, 77, 292–296. [Google Scholar] [CrossRef]
  35. Bao, T.; Li, J.; Chang, I.-S.; Jin, E.; Wu, J.; Bao, Y. The influence of ecological engineering projects on dust events: A case study in the northern China. Environ. Impact Assess. Rev. 2022, 96, 106847. [Google Scholar] [CrossRef]
  36. Kurosaki, Y.; Mikami, M. Regional Difference in the Characteristic of Dust Event in East Asia: Relationship among Dust Outbreak, Surface Wind, and Land Surface Condition. J. Meteorol. Soc. Jpn. 2005, 83A, 1–18. [Google Scholar] [CrossRef] [Green Version]
  37. Lim, J.-Y.; Chun, Y. The characteristics of Asian dust events in Northeast Asia during the springtime from 1993 to 2004. Glob. Planet. Chang. 2006, 52, 231–247. [Google Scholar] [CrossRef]
  38. Huang, J.; Minnis, P.; Chen, B.; Huang, Z.; Liu, Z.; Zhao, Q.; Yi, Y.; Ayers, J.K. Long-range transport and vertical structure of Asian dust from CALIPSO and surface measurements during PACDEX. J. Geophys. Res. 2008, 113, D23212. [Google Scholar] [CrossRef]
  39. Huang, J.; Wang, T.; Wang, W.; Li, Z.; Yan, H. Climate effects of dust aerosols over East Asian arid and semiarid regions. J. Geophys. Res. Atmos. 2014, 119, 11–398. [Google Scholar] [CrossRef]
  40. Jia, R.; Liu, Y.; Chen, B.; Zhang, Z.; Huang, J. Source and transportation of summer dust over the Tibetan Plateau. Atmos. Environ. 2015, 123, 210–219. [Google Scholar] [CrossRef]
  41. Kalnay, E.; Kanamitsu, M.; Kistler, R.; Collins, W.; Deaven, D.; Gandin, L.; Iredell, M.; Saha, S.; White, G.; Woollen, J.; et al. The NCEP/NCAR 40-Year Reanalysis Project. Bull. Am. Meteor. Soc. 1996, 77, 437–471. [Google Scholar] [CrossRef]
  42. Zhao, S.; Yin, D.; Qu, J. Identifying sources of dust based on CALIPSO, MODIS satellite data and backward trajectory model. Atmos. Pollut. Res. 2015, 6, 36–44. [Google Scholar] [CrossRef] [Green Version]
  43. Kimura, R. Factors contributing to dust storms in source regions producing the yellow-sand phenomena observed in Japan from 1993 to 2002. J. Arid. Environ. 2012, 80, 40–44. [Google Scholar] [CrossRef]
  44. Kurosaki, Y.; Mikami, M. Threshold wind speed for dust emission in east Asia and its seasonal variations. J. Geophys. Res. 2007, 112, D17202. [Google Scholar] [CrossRef]
  45. Aswini, M.A.; Kumar, A.; Das, S.K. Quantification of long-range transported aeolian dust towards the Indian peninsular region using satellite and ground-based data—A case study during a dust storm over the Arabian Sea. Atmos. Res. 2020, 239, 104910. [Google Scholar] [CrossRef]
  46. Sekiyama, T.T.; Tanaka, T.Y.; Maki, T.; Mikami, M. The Effects of Snow Cover and Soil Moisture on Asian Dust: II. Emission Estimation by Lidar Data Assimilation. SOLA 2011, 7A, 40–43. [Google Scholar] [CrossRef] [Green Version]
  47. Xing, Z.; Li, S.; Xiong, Y.; Du, K. Estimation of cross-boundary aerosol flux over the Edmonton-Calgary Corridor in Canada based on CALIPSO and MERRA-2 data during 2011–2017. Atmos. Environ. 2021, 246, 118084. [Google Scholar] [CrossRef]
  48. Sharifikia, M.; Rabbani, F. Source routing and detection of dust storm in the Salt Lake basin of Qom in Iran. Arab. J. Geosci. 2020, 13, 678. [Google Scholar] [CrossRef]
  49. Filonchyk, M.; Yan, H.; Shareef, T.M.E.; Yang, S. Aerosol contamination survey during dust storm process in Northwestern China using ground, satellite observations and atmospheric modeling data. Theor. Appl. Climatol. 2019, 135, 119–133. [Google Scholar] [CrossRef]
  50. Zhao, W.; Sun, Y.; Balsam, W.; Zeng, L.; Lu, H.; Otgonbayar, K.; Ji, J. Clay-sized Hf-Nd-Sr isotopic composition of Mongolian dust as a fingerprint for regional to hemispherical transport. Geophys. Res. Lett. 2015, 42, 5661–5669. [Google Scholar] [CrossRef]
  51. Xu, C.; Guan, Q.; Lin, J.; Luo, H.; Yang, L.; Wang, Q. Identification and quantitative analysis of dust trajectories in the Hexi Corridor. Agric. For. Meteorol. 2020, 291, 107987. [Google Scholar] [CrossRef]
  52. Huang, X.-X.; Wang, T.-J.; Jiang, F.; Liao, J.-B.; Cai, Y.-F.; Yin, C.-Q.; Zhu, J.-L.; Han, Y. Studies on a Severe Dust Storm in East Asia and Its Impact on the Air Quality of Nanjing, China. Aerosol. Air Qual. Res. 2013, 13, 179–193. [Google Scholar] [CrossRef] [Green Version]
  53. Shao, Y.; Wang, J. A climatology of Northeast Asian dust events. Meteorol. Z. 2003, 12, 187–196. [Google Scholar] [CrossRef] [Green Version]
  54. Xi, X.; Sokolik, I.N. Dust interannual variability and trend in Central Asia from 2000 to 2014 and their climatic linkages. J. Geophys. Res. Atmos. 2015, 120, 12–175. [Google Scholar] [CrossRef] [Green Version]
  55. Chen, F.; Chen, S.; Zhang, X.; Chen, J.; Wang, X.; Gowan, E.J.; Qiang, M.; Dong, G.; Wang, Z.; Li, Y.; et al. Asian dust-storm activity dominated by Chinese dynasty changes since 2000 BP. Nat. Commun. 2020, 11, 992. [Google Scholar] [CrossRef] [PubMed] [Green Version]
  56. He, Y.; Zhao, C.; Song, M.; Liu, W.; Chen, F.; Zhang, D.; Liu, Z. Onset of frequent dust storms in northern China at ~AD 1100. Sci. Rep. 2015, 5, 17111. [Google Scholar] [CrossRef] [Green Version]
  57. Yang, B.; Bräuning, A.; Zhang, Z.; Dong, Z.; Esper, J. Dust storm frequency and its relation to climate changes in Northern China during the past 1000 years. Atmos. Environ. 2007, 41, 9288–9299. [Google Scholar] [CrossRef]
  58. Roe, G. On the interpretation of Chinese loess as a paleoclimate indicator. Quat. Res. 2009, 71, 150–161. [Google Scholar] [CrossRef]
  59. Liu, X. Analyses of the spring dust storm frequency of northern China in relation to antecedent and concurrent wind, precipitation, vegetation, and soil moisture conditions. J. Geophys. Res. 2004, 109, D16210. [Google Scholar] [CrossRef]
  60. Fan, B.; Guo, L.; Li, N.; Chen, J.; Lin, H.; Zhang, X.; Shen, M.; Rao, Y.; Wang, C.; Ma, L. Earlier vegetation green-up has reduced spring dust storms. Sci. Rep. 2014, 4, 6749. [Google Scholar] [CrossRef] [Green Version]
  61. Tian, S.-F.; Inoue, M.; Du, M. Influence of Dust Storm Frequency in Northern China on Fluctuations of Asian Dust Frequency Observed in Japan. SOLA 2007, 3, 121–124. [Google Scholar] [CrossRef] [Green Version]
  62. Wang, R.; Liu, B.; Li, H.; Zou, X.; Wang, J.; Liu, W.; Cheng, H.; Kang, L.; Zhang, C. Variation of strong dust storm events in Northern China during 1978–2007. Atmos. Res. 2017, 183, 166–172. [Google Scholar] [CrossRef]
  63. Guan, Q.; Sun, X.; Yang, J.; Pan, B.; Zhao, S.; Wang, L. Dust Storms in Northern China: Long-Term Spatiotemporal Characteristics and Climate Controls. J. Clim. 2017, 30, 6683–6700. [Google Scholar] [CrossRef]
  64. Grigholm, B.; Mayewski, P.A.; Kang, S.; Zhang, Y.; Morgenstern, U.; Schwikowski, M.; Kaspari, S.; Aizen, V.; Aizen, E.; Takeuchi, N.; et al. Twentieth century dust lows and the weakening of the westerly winds over the Tibetan Plateau. Geophys. Res. Lett. 2015, 42, 2434–2441. [Google Scholar] [CrossRef] [Green Version]
Figure 1. Location of the study area.
Remotesensing 15 03183 g001
Figure 2. Spatial and temporal distribution of dust outbreaks.
Remotesensing 15 03183 g002
Figure 3. The trends of DO variations in 1980–2020. Note: Green circles represent decreasing trends of DO and red triangles represent increasing trends of DO. Only trends with a statistical significance >95% are presented using colors.
Remotesensing 15 03183 g003
Figure 4. Seventy-two hours of backward trajectory (a,c,e,g) and trajectory clustering (b,d,f,h) of dust storms. The light yellow line indicates the airflow backward trajectory of each dust storms, purple, red, green, blue for clustering results.
Remotesensing 15 03183 g004
Disclaimer/Publisher’s Note: The statements, opinions and data contained in all publications are solely those of the individual author(s) and contributor(s) and not of MDPI and/or the editor(s). MDPI and/or the editor(s) disclaim responsibility for any injury to people or property resulting from any ideas, methods, instructions or products referred to in the content.

