
Flood Analysis Using Multi-Scale Remote Sensing Observations in Laos


1
College of Electrical and Information Engineering, Hunan University, Changsha 410082, China
2
School of Robotics, Hunan University, Changsha 410082, China
*
Author to whom correspondence should be addressed.
†
These authors contributed equally to this work.
Remote Sens. 2023, 15(12), 3166; https://doi.org/10.3390/rs15123166
Submission received: 26 April 2023
/
Revised: 2 June 2023
/
Accepted: 15 June 2023
/
Published: 18 June 2023
(This article belongs to the Special Issue Multi-Source Data with Remote Sensing Techniques)
Abstract
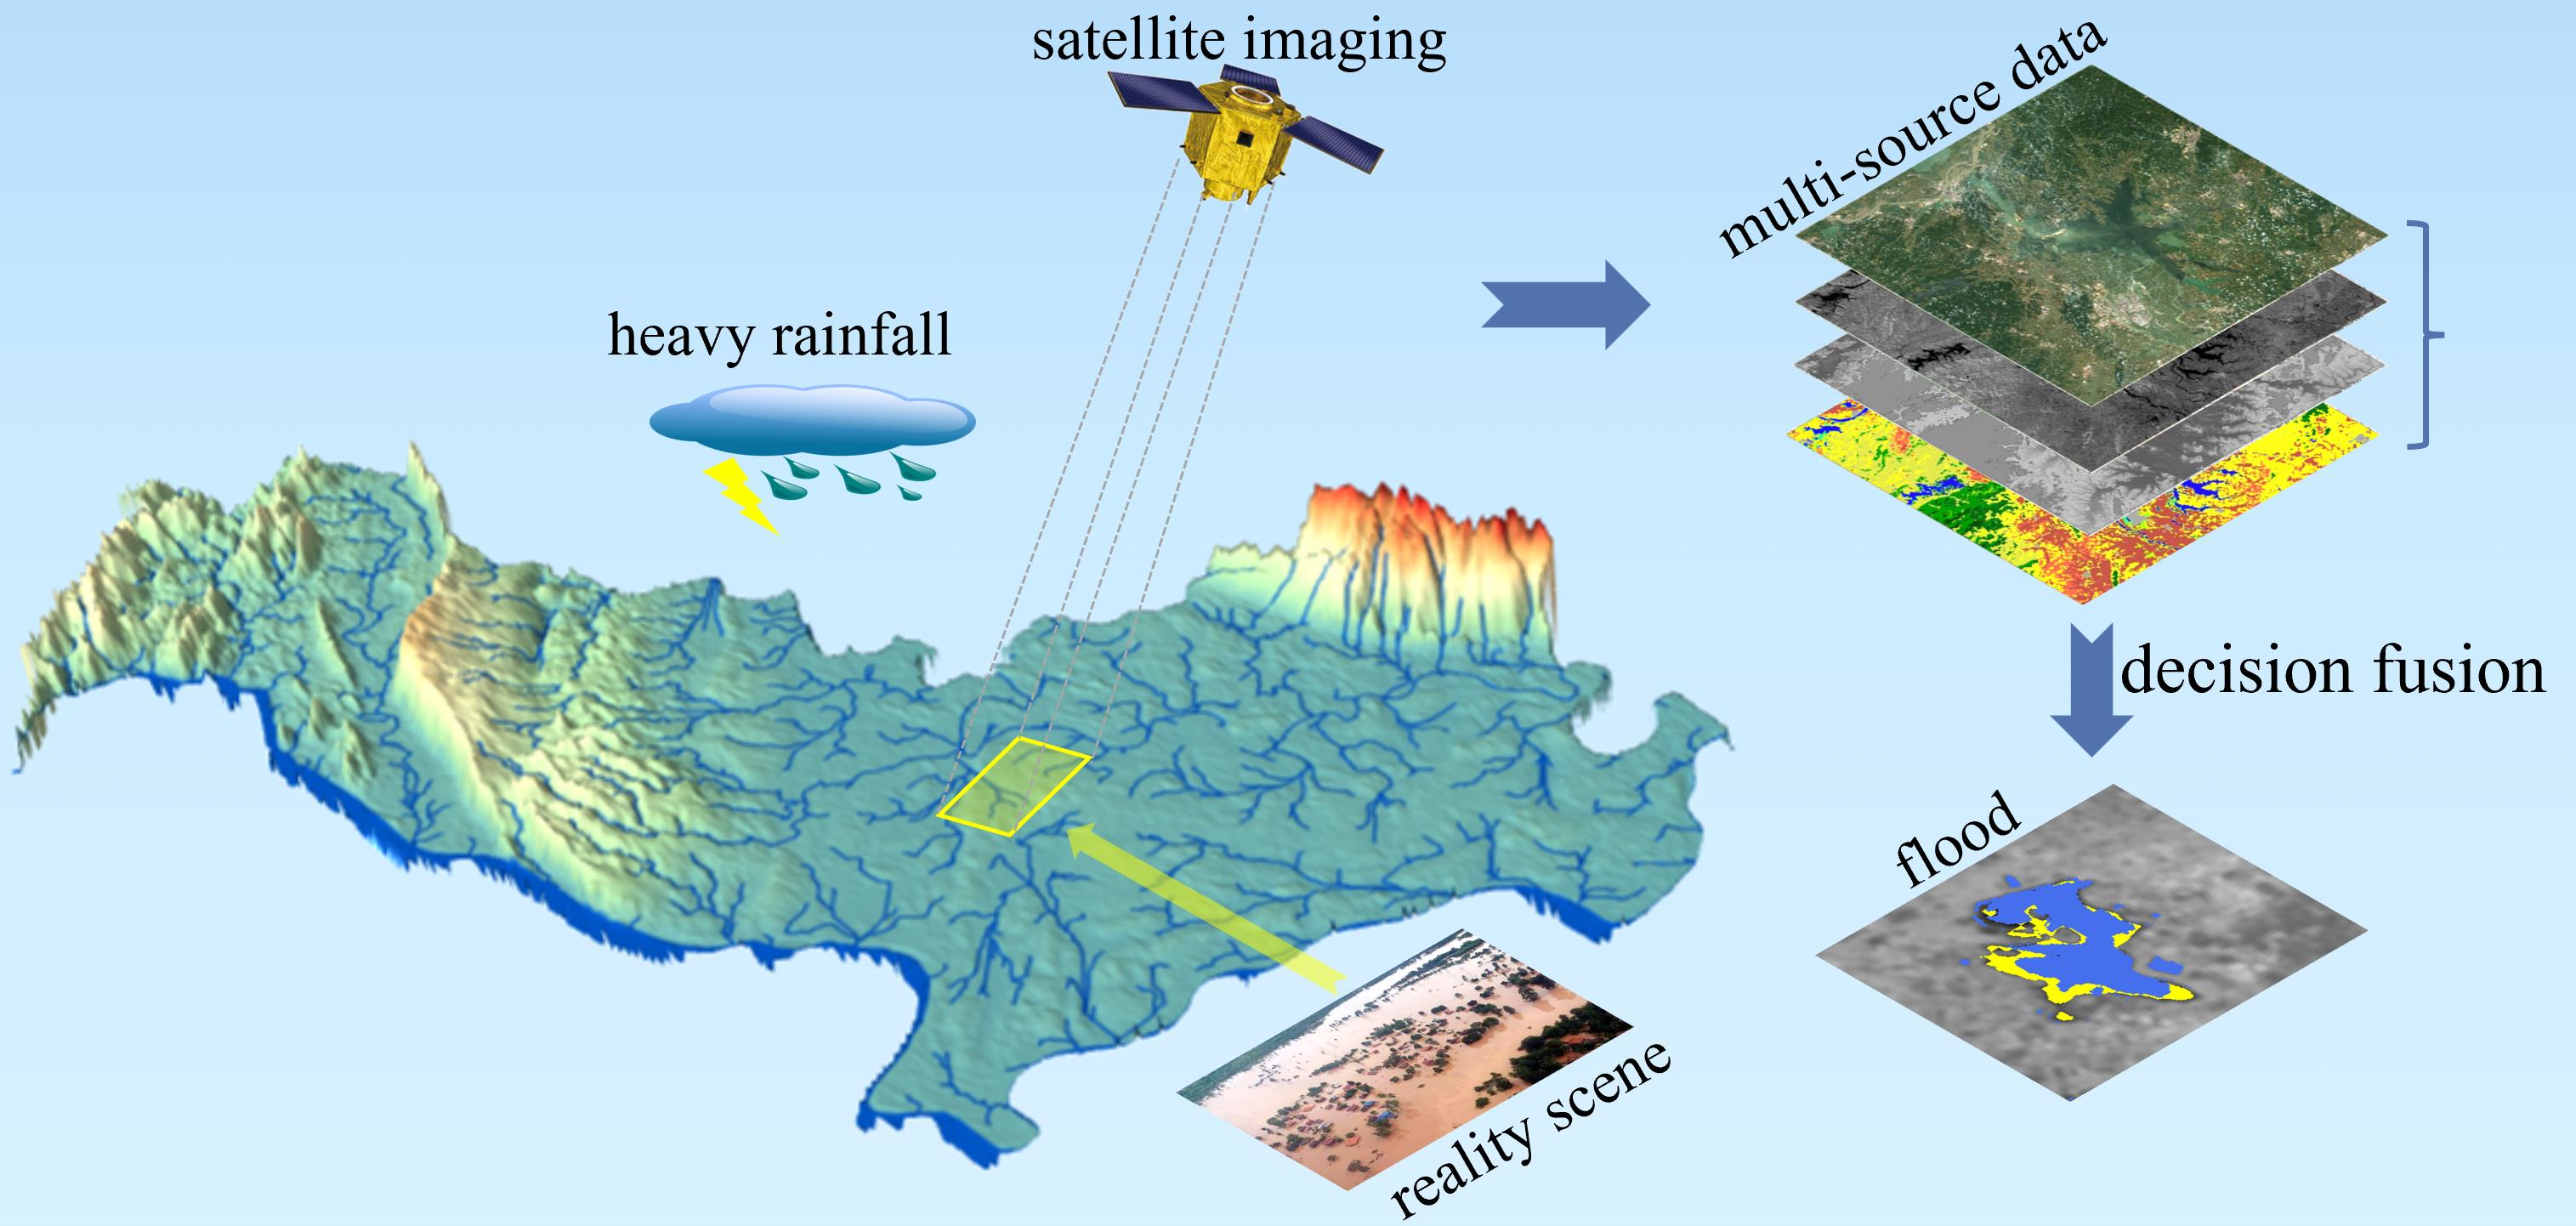
:Heavy rains usually hit Laos countrywide and cause serious floods, influencing local agriculture, households, and the economy. Therefore, it is crucial to monitor the flooding in Laos to better understand the flood patterns and characteristics. This paper aims to analyze the influence of the flooding in Laos with multi-source data, e.g., Synthetic Aperture Radar (SAR), optical multi-spectral images, and geographic information system data. First, the flood areas in Laos from 2018 to 2022 are detected using a decision fusion method. Based on the flood areas and the global Land Use/Land Cover (LULC) product, the macro scale global impact of the flood is analyzed. Second, taking the Vientiane Capital as a case study area, a flood forecasting method is applied to estimate the risk of flooding. Finally, optical images before and after the flood event are extracted for a close-up comparison at the micro scale. Based on the above multi-scale analysis, floods in Laos are found to be predominantly concentrated in the flat areas near the Mekong River, with a decreasing trend over time, which could be helpful for flood management and mitigation strategies in Laos. The validation results exhibited notable average indices across a five-year period, with mIoU (0.7782), F1 score (0.7255), and overall accuracy (0.9854), respectively.

1. Introduction
Natural disasters such as floods have devastating impacts on communities and infrastructure around the world, which could result in a loss of life, displacement of communities, and significant economic losses. Heavy rains and storms often occur in Laos, which makes the probability of flooding relatively high. In recent years, the country has experienced several major flood events that caused significant damage. For instance, tropical storm “LINFA”triggered floods in southern Laos, leading to the displacement of thousands of people and causing widespread damage to homes and infrastructure [1]. To alleviate the influence of floods, it is crucial to analyze the factors (e.g., land use, rainfall patterns, and so on) related to flooding. The analyzed result can provide a scientific basis for flood control and disaster alleviation.
Over the past decades, remote sensing has been applied in flood analyses and achieved great success. Relevant studies include flood detection, flood forecasting, and disaster assessment [2,3,4,5,6,7,8]. Taking flood detection as an example, various methods have been used to detect flood areas with multi-spectral images and Synthetic Aperture Radar (SAR) images. Among these methods, threshold-based methods extract water and floods in the simplest way. Specifically, spectral indexes such as the Normalized Difference Water Index (NDWI) [9] are calculated and binarized with a threshold to find water. Xu et al. [10] further improve NDWI by replacing the Near-infrared (NIR) band with a Mid-infrared (MIR) band. In [11], the Sentinel-1 Dual-Polarized Water Index (SDWI) is proposed to extract water precisely with VV and VH bands of SAR images. Moreover, machine learning also demonstrates excellent performances in flood detection. For example, Lin et al. [12] combine a normalization and Bayesian probability function to obtain the flood map. In [10], researchers employ K-Nearest Neighbor (KNN) and a weighted classifier to monitor floods. Moreover, deep learning methods are also utilized to detect floods. In [13], a multi-scale Deeplab model is proposed for flood detection with SAR images. In [14], a fully convolutional neural network is proposed to segment permanent water and floods with a novel dataset composed of Sentinel-1 and Sentinel-2 images.
Flood forecasting and damage assessment methods also have been well-researched in recent years [15,16]. Flood forecasting methods can be divided into machine learning-based [17,18,19,20], numerical model-based [21,22,23], and probabilistic model-based methods [24,25,26]. For the flood forecasting methods, multi-source information such as geographical conditions, remote sensing images, and so on, is essential. For example, 11 risk indices of floods and maximum one-day precipitation are obtained with Landsat 8 images and the SRTM Digital Elevation Model (DEM) data in [15]. In [16], an approach integrating a D-number-improved Analytic Hierarchy Process (D-AHP) and a self-organizing map clustering algorithm is proposed for flood risk assessment. This data-driven method can estimate flood risk without thresholds. The remote sensing and geographic information system (GIS) techniques are also integrated to estimate the flood extent, duration, and damage in [27]. Furthermore, flood disaster assessment can be realized by analyzing flood intensity and its impact on other objects, such as a flood intensity-based assessment [28,29,30] and flood-crop condition assessment [31,32,33]. In general, flood risk forecasting and damage assessment play an important role in analyzing the major factors and impacts of floods.
Although many flood-analyzing works have been proposed, most of them have numerous parameters and complicated data processing procedures, which result in lower efficiency. Moreover, related studies analyze the influence of floods from fixed perspectives. To analyze floods more comprehensively, multi-source remote sensing images and GIS data are combined in this work to study the spatiotemporal characteristics of floods in Laos. The whole flood analyzing process of this work mainly includes flood detection and multi-scale analysis. Concretely, the flood in Laos is detected and analyzed from a macro perspective. Then, an AHP-based method is utilized to calculate the flood risk map in the capital of Laos. A meso-scale analysis is also performed on the flood risk map. Finally, a close-up comparison of different land covers before and after floods is given to achieve micro-scale analysis. Moreover, the flood detection and analysis in this work are achieved by the Google Earth Engine (GEE) platform [34] in an effective way. With efficient data processing and computing capabilities, GEE enables users to effortlessly access and analyze the large-scale geospatial dataset. The code is available at https://github.com/flying318/flood_monitor.git, accesses on 26 March 2023.
2. Materials
2.1. Study Area
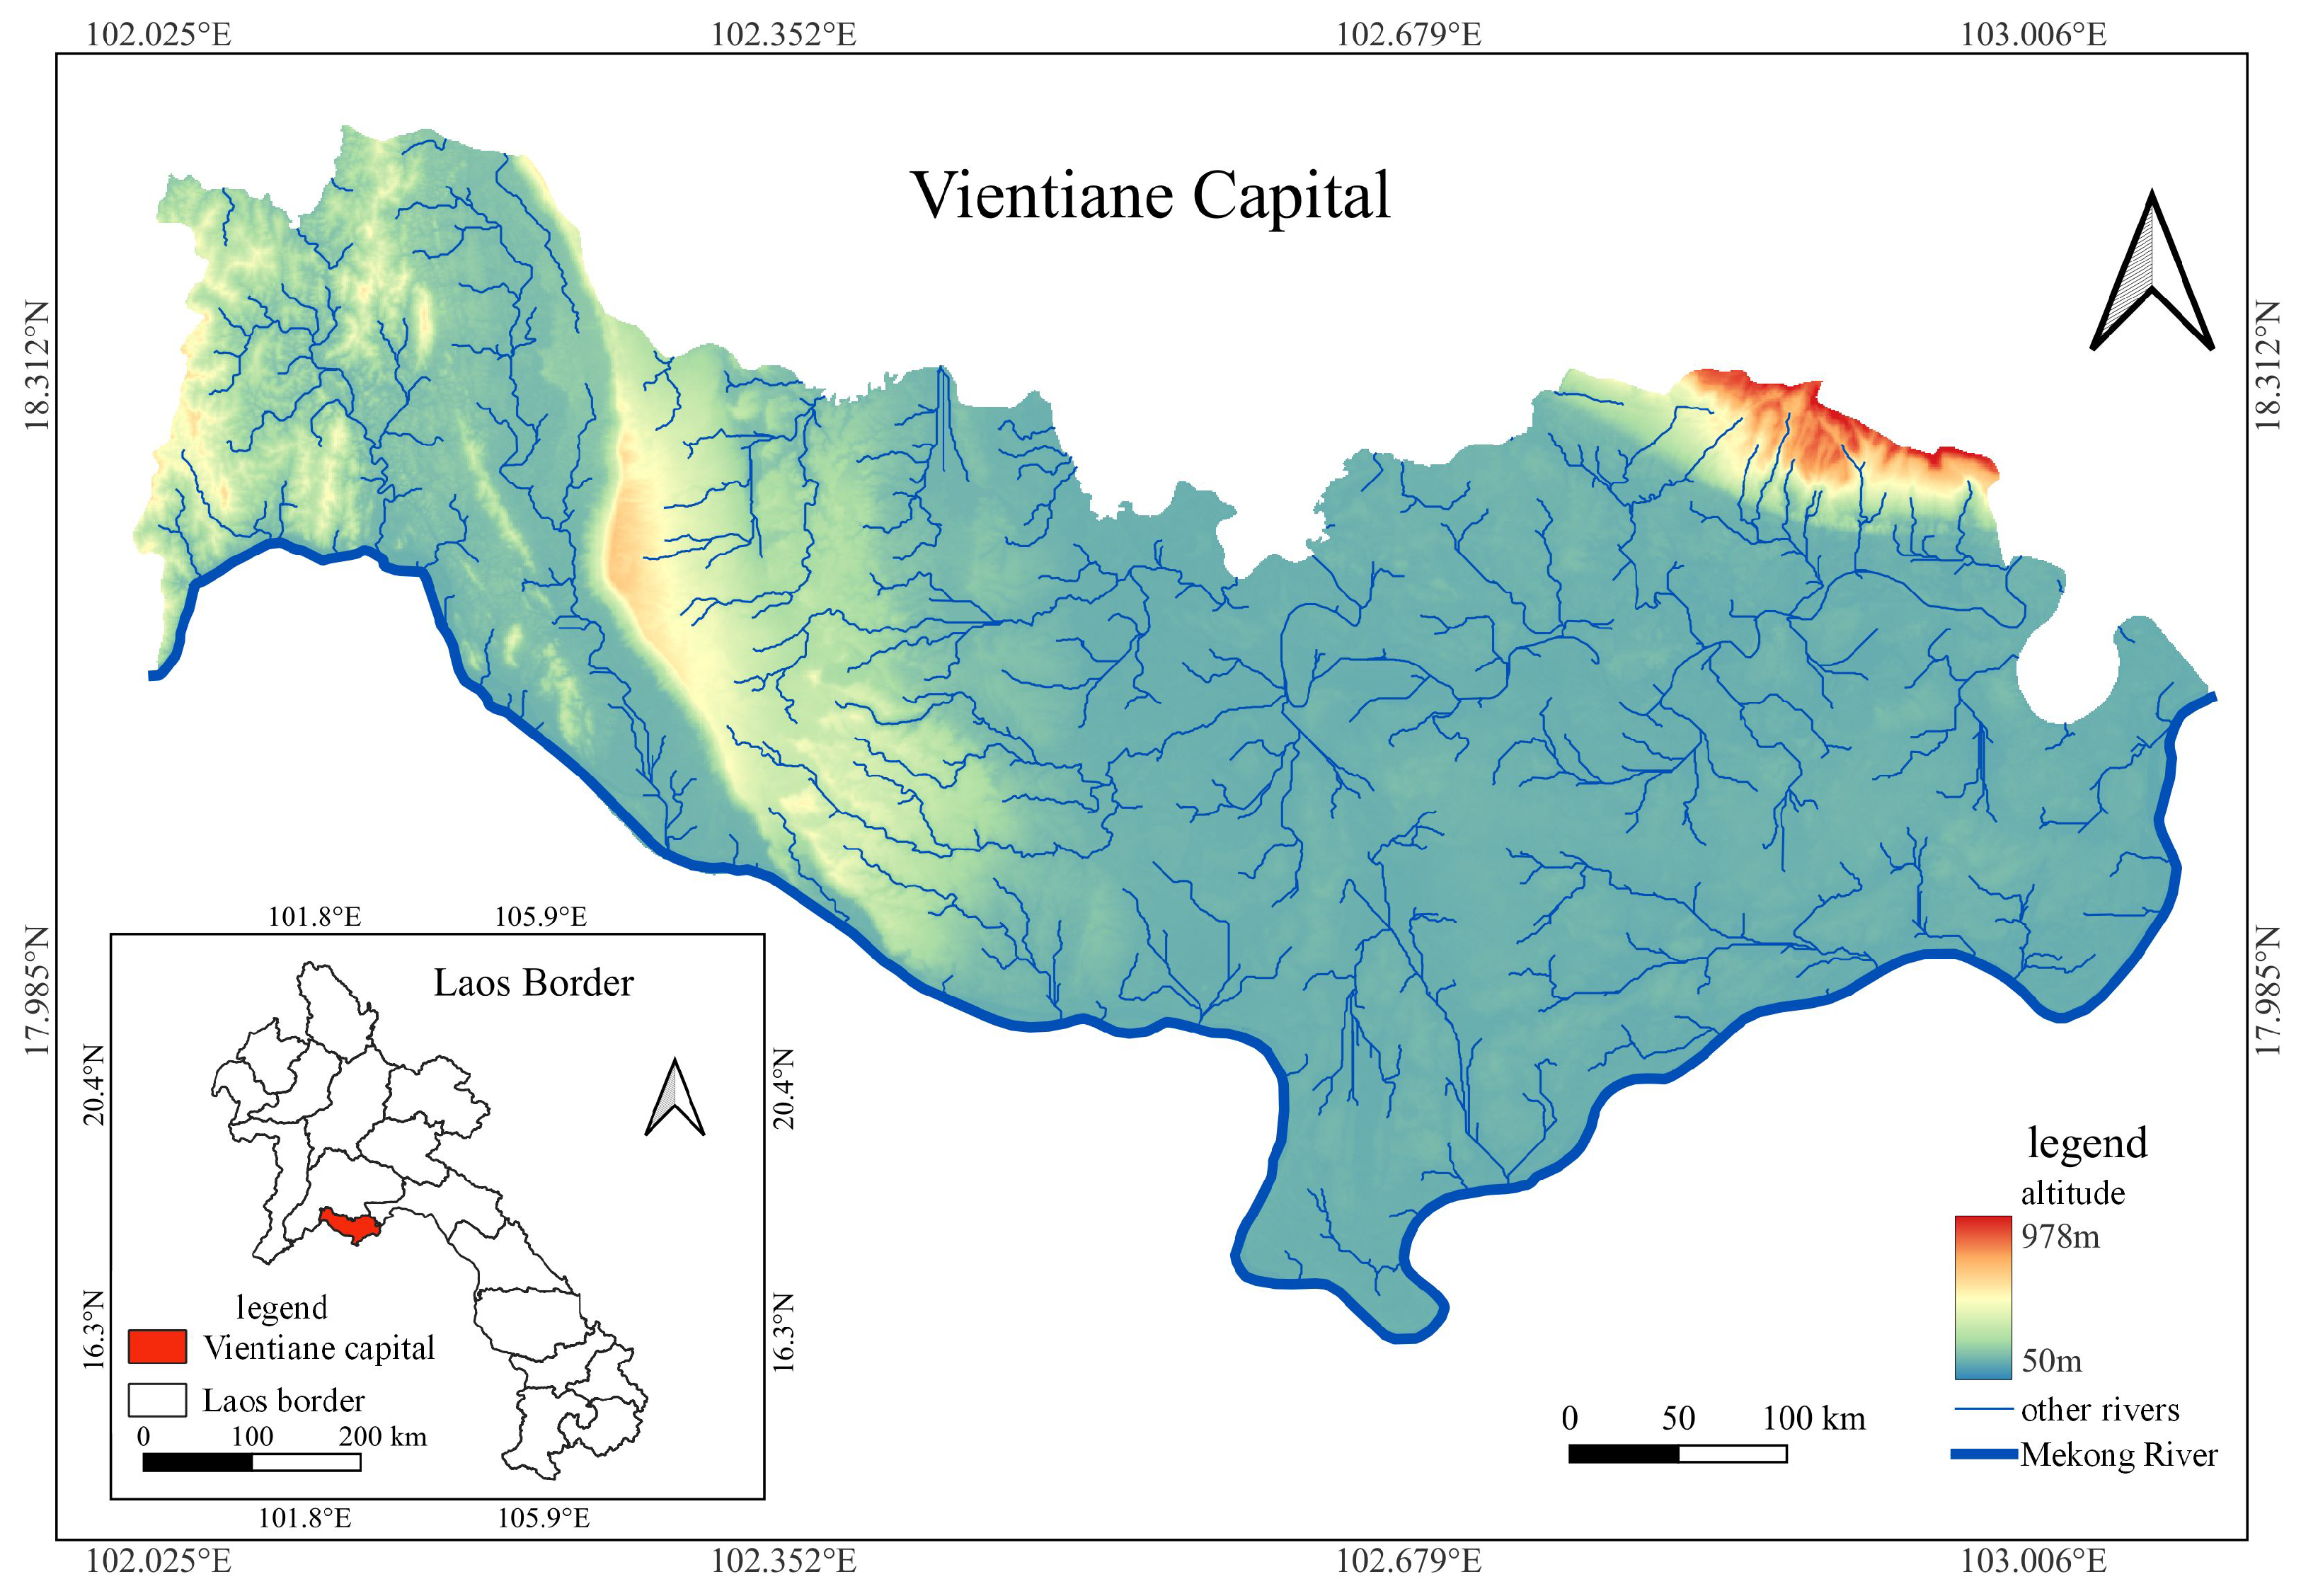
As shown in Figure 1, the study area includes the whole territory of Laos and its capital city of Vientiane, as well as a specific river map. Laos is a landlocked country located in the heart of Southeast Asia, sharing its borders with Vietnam to the east, Cambodia to the south, Thailand to the west, Myanmar to the northwest, and China to the north. Its central latitude and longitude are approximately 18°00’N and 105°00’E, respectively. With a total area of 236,800 square kilometers, Laos can be divided into three distinct geographical regions, comprising diverse mountains, plateaus, and plains along the Mekong River. The northern and southeastern parts of Laos are characterized by mountains and plateaus, while the plains region consists of areas along the Mekong River. The Mekong River is a vital waterway and essential for food and transportation in Laos.
Vientiane, the capital city of Laos, is situated in the north-central part of the country, near the border with Thailand. The city is located on the banks of the Mekong River, which is the lifeblood of the country, and is characterized by its flat terrain and tropical climate. It is an essential political, economic, and cultural center of Laos, with a population of approximately 820,000 people.
2.2. Data Source
In order to accurately analyze floods in Laos, it is necessary to consider multiple sources of data. While using a single type of data may provide some insights into the flood, it may not be sufficient to fully understand the extent and severity of the disaster. To analyze floods in Laos accurately, six kinds of data were considered in this work, including SAR, multi-spectral images, LULC, river network, rainfall, and DEM data. The detailed information is as follows.
- (1)
- SAR images were obtained from the Sentinel-1 satellite, which operates in C-band with four different polarization modes: vertical–vertical (VV), vertical–horizontal (VH), horizontal–horizontal (HH), and horizontal–vertical (HV). Sentinel-1 provides high-resolution Earth images with a resolution of 5–10 m and a 12-day revisit cycle at the equator. The SAR images were collected from 2018 to 2022 and composited into 31 large tiles each year, covering the study area of Laos and its capital city of Vientiane, as well as specific land covers such as built-up areas, farmlands, and water bodies. The SAR data are especially useful for flood analysis due to their ability to penetrate through clouds and heavy rain, allowing for the detection of changes in water levels and the identification of flood-prone areas. The data could be found in https://code.earthengine.google.com/ (accessed from 1 January 2018 to 31 December 2022).
- (2)
- Multi-spectral images adopted in this work were acquired by the Sentinel-2 satellite, a high-resolution Earth observation satellite that has the same revisit cycle as Sentinel-1. It captures images in 13 spectral bands covering visible, near-infrared, and short-wave infrared regions, with a spatial resolution ranging from 10 m to 60 m. Sentinel-2 images are suitable for the frequent monitoring of the land surface and environmental changes. They have been used in various applications such as crop monitoring, vegetation mapping, and land cover classifications. The combination of high spatial and spectral resolution provides a valuable source of information for analyzing floods in Laos. In this study, Sentinel-2 images were utilized to extract land use and land cover information, which is crucial for understanding the potential impacts of floods on the environment and local communities. The data could be found in https://code.earthengine.google.com/ (accessed from 1 January 2018 to 31 December 2022).
- (3)
- The LULC used in this work was the ESA WorldCover 10 m v100, which could provide global land cover and land use information with a 10 m spatial resolution. It covers 11 different land classes, including tree cover, cropland, built-up areas, permanent water bodies, and others. This dataset offers comprehensive and detailed information on the distribution and characteristics of land cover and land use across the globe, making it suitable for various applications, such as monitoring land use changes, assessing environmental impacts, and supporting land management decision-making. The data could be found in https://code.earthengine.google.com/ (accessed on 1 January 2021).
- (4)
- The river network data was obtained from HydroSHEDS, a hydrographic mapping product that offers consistent, global, and regional data. It includes various geo-referenced vector and raster datasets such as river networks and watershed boundaries at different scales. These data are obtained from NASA’s 2000 Shuttle Radar Topography Mission (SRTM). The data could be found in https://code.earthengine.google.com/ (accessed on 1 January 2023).
- (5)
- Rainfall data were acquired from the gridded time-series data of Climatic Research Unit (CRU Ts), which is a widely used climate dataset covering the world’s land areas except for Antarctica, on a 0.5° latitude by 0.5° longitude grid. The latest version, CRU Ts v4, covers 1901–2018 and is updated annually, incorporating additional weather station observations and using improved interpolation methods. The use of angular-distance weighting (ADW) provides better traceability and more informative diagnostics for users to assess the quality of the dataset. The data could be found in https://data.ceda.ac.uk/badc/cru/data/cru_ts/ (accessed on 1 January 2021).
- (6)
- The DEM data were acquired from NASA SRTM30, which covers the entire world with a spatial resolution of 1 arc-second(approximately 30 m). It provides a detailed and accurate elevation information for land surfaces worldwide and serves as a valuable resource for various applications, including the terrain analysis, landform classification, flood modeling, and slope stability analysis. The data could be found in https://code.earthengine.google.com/ (accessed on accessed on 1 January 2023).
By integrating various sources of data, a more thorough and exhaustive analysis of the flood event can be achieved. SAR and multi-spectral imagery offers an effective approach to distinguish water bodies and the areas of floods, while the LULC data provides valuable information which can be used to identify flooded and non-flooded regions. In addition, the river network offers insights into the direction and velocity of the floodwaters. The rainfall data offers details on the intensity and duration of the precipitation that resulted in the flood. To further enhance the understanding of the topographic conditions that contribute to the flood, the DEM data can be utilized to extract key terrain attributes such as slope, aspect, and elevation. These attributes can help to evaluate the influence of the topography on the floodwater movement and accumulation in different regions, which is crucial for comprehensive flood risk management and mitigation. Therefore, the integration of the above datasets provides the foundation for flood analysis.
3. Methods
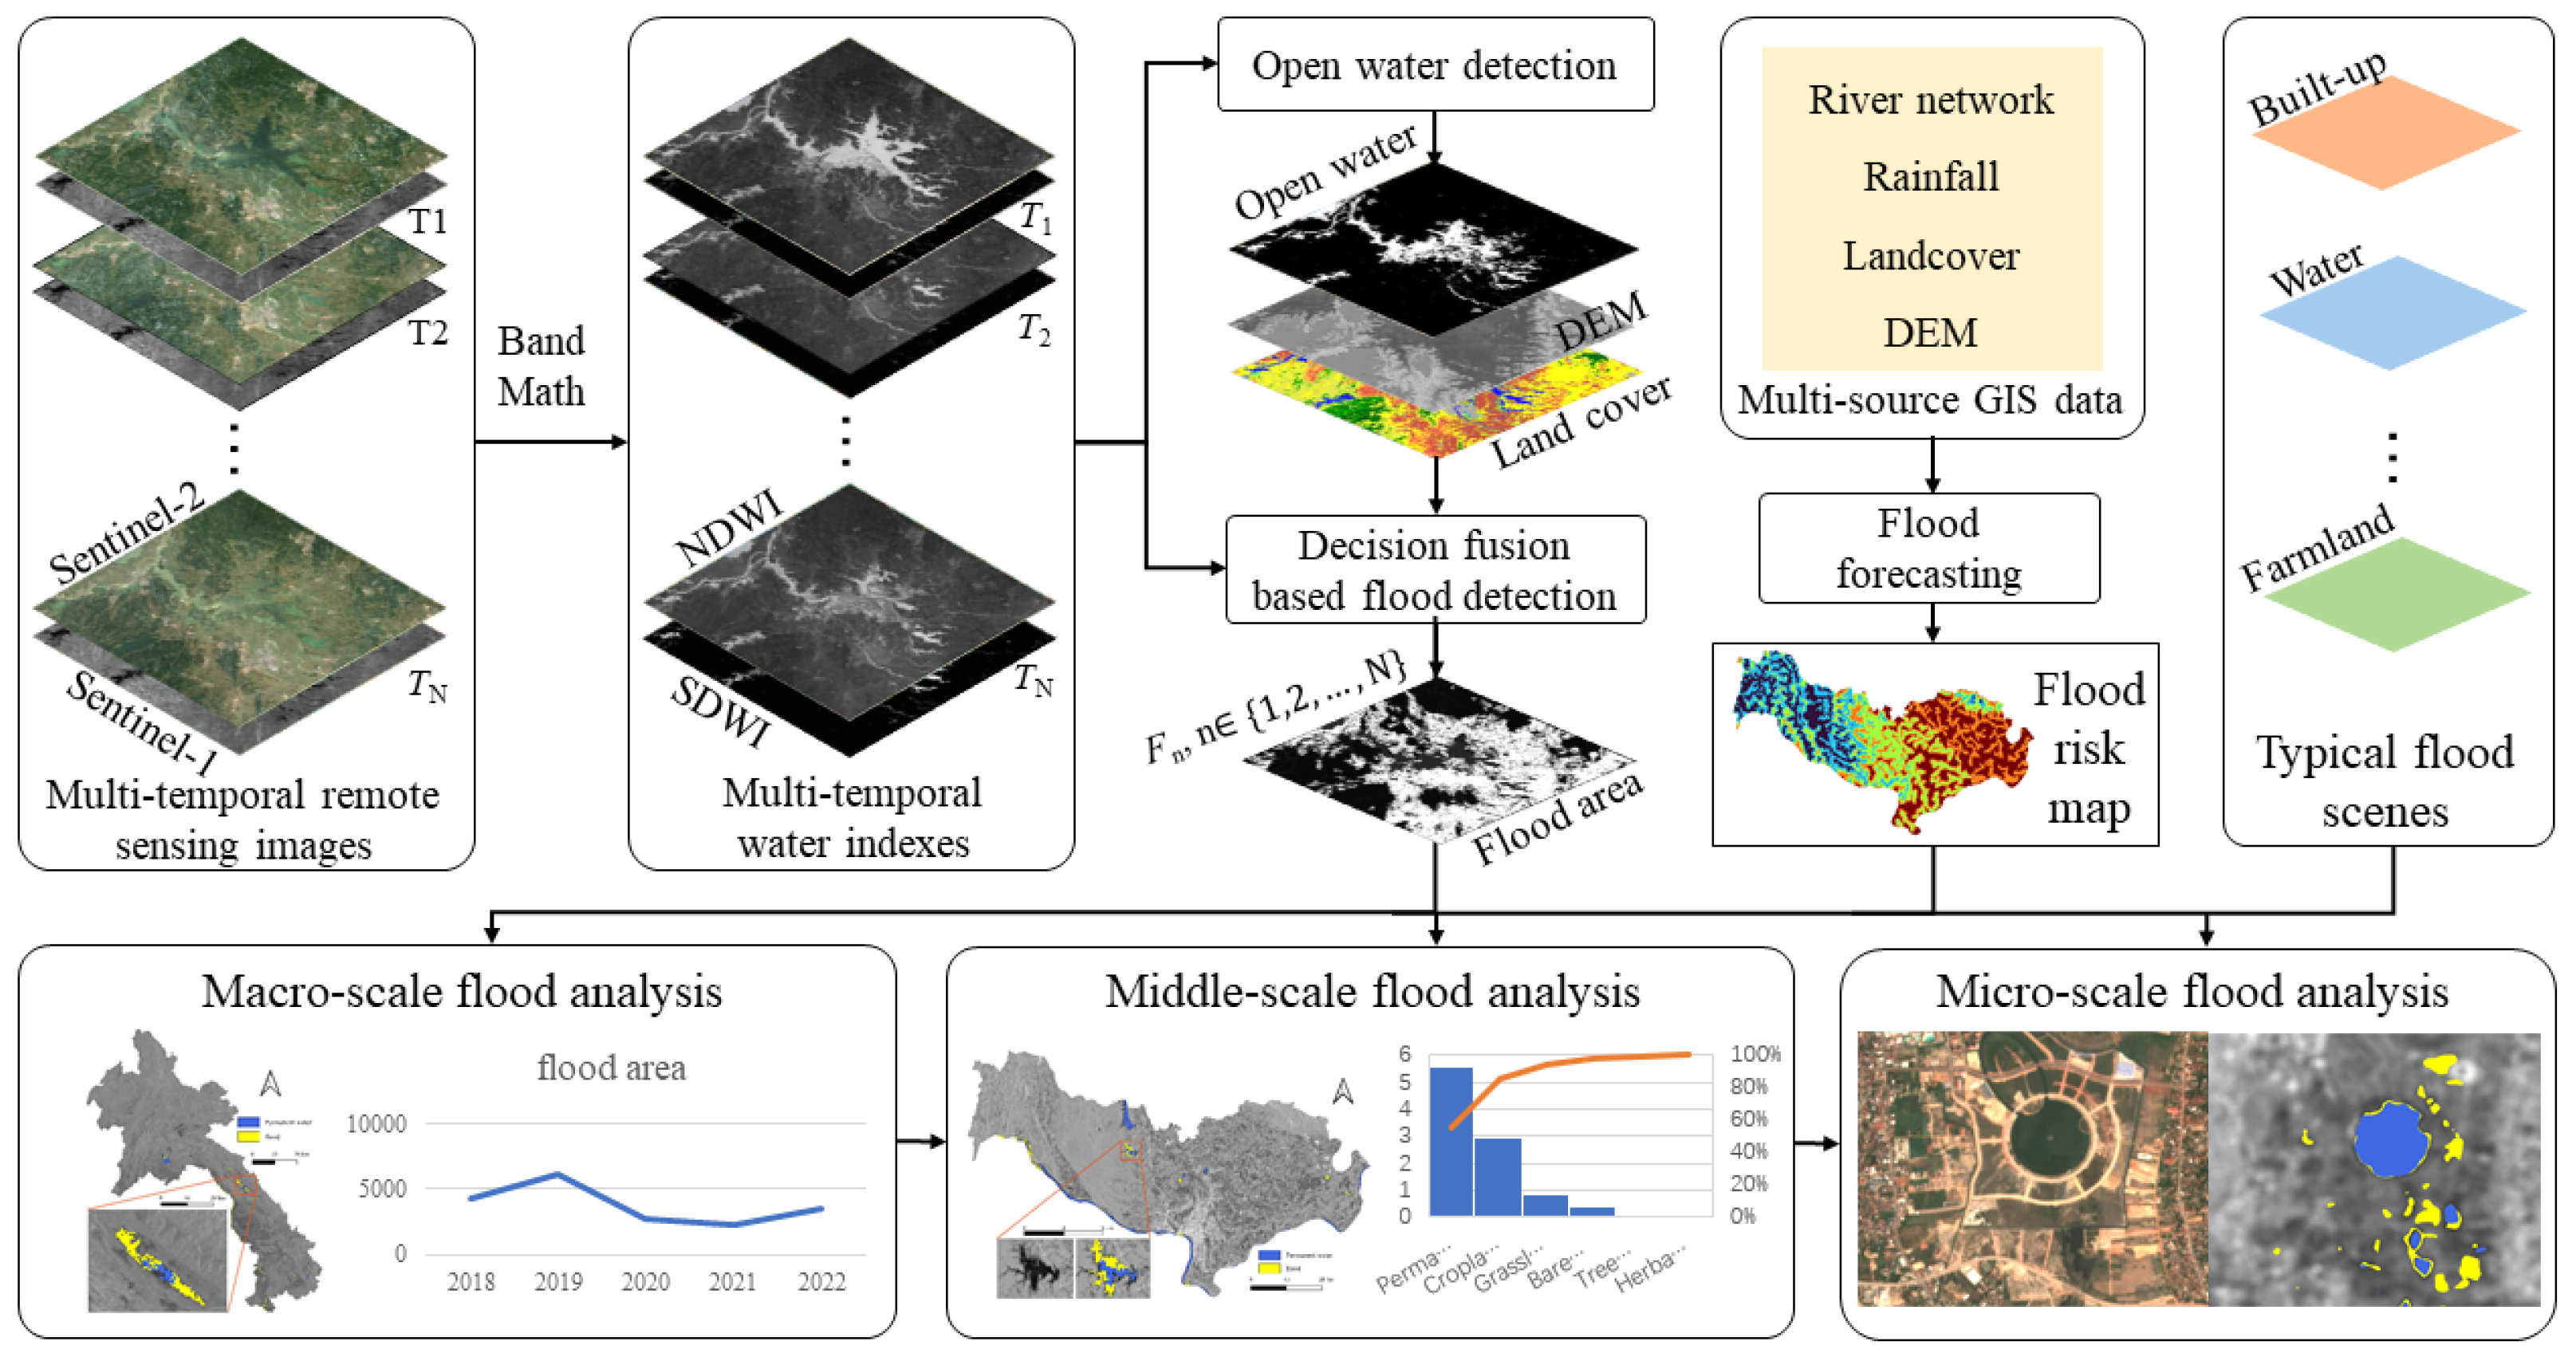
This study aims to comprehensively analyze the spatiotemporal distribution of floods in Laos at three scales (macro, meso, and micro). The corresponding flowchart is presented in Figure 2. In the first stage, a wide range of multi-source data was collected. The multi-source data includes Sentinel-1 and Sentinel-2 images, DEM, LULC, river networks, and rainfall data from 2018 to 2022. Then, spectral indices such as SDWI and NDWI were calculated to accurately detect water. Permanent water was then generated by incorporating LULC and DEM data, covering all the annual observation periods. In the second stage, based on the comprehensive analysis of the multi-source data, a flood risk map was produced using the Analytic Hierarchy Process (AHP) method [35]. Finally, the flood analysis was carried out at the macro-scale, meso-scale, and micro-scale, which provides an in-depth understanding of the patterns and impacts of floods.
3.1. Decision Fusion-Based Flood Detection
A key part of flood analysis is detecting floods effectively, which means a reliable method is necessary to accurately identify flood areas. However, relying on a single method or type of image may not always produce accurate results. To address this challenge, a decision fusion strategy was developed, which utilized multi-source remote sensing data to extract flood areas. Specifically, the annual permanent water was calculated by Sentinel-1 and Sentinel-2 images and used as a basis for the fusion strategy, which integrates complementary information from different sources to enhance the accuracy and reliability of the detection process. In the following sections, the specifics of water detection and flood detection were introduced, highlighting the effective methodologies to extract water and flood areas from multi-source remote sensing data.
3.1.1. Water Detection with Multi-Temporal Images
Flood detection is achieved by fusing the multi-temporal water extraction results. To obtain the water distribution information, Sentinel time-series images during the whole year were collected, composited, mosaiced, and clipped. Subsequently, NDWI [9] and SDWI [11] were then derived from the Sentinel-2 images and the Sentinel-1 images, respectively.
- (1)
- NDWI is a remote sensing index that calculates the difference between the near-infrared and green bands of a satellite image, and normalizes this difference by the sum of these two bands. It is commonly used to detect surface water bodies in multi-spectral images and can be expressed as:where G represents the green band while N represents the near infra-red band.
- (2)
- SDWI is a water index used in Dual-Polarization SAR images, which uses and bands to maximize differences between water and non-water. Concretely, the formula of SDWI is as follows:In Equation (2), represents the VV band while represents VH band.
NDWI and SDWI can generate maximal differences between water and other land covers. To obtain the binary water distribution map, thresholds are needed for the two indexes. A typical and useful convention is to select the threshold manually combined with the visual information of results, though it is inefficient. This paper adopts Otsu [36], a simple yet effective algorithm for image thresholding based on the image histogram, to calculate a reliable and optimal threshold automatically. Then, the threshold could be used to separate open water from non-water bodies in each tile, following the Equation (3) below:
In Equation (3), i,j represent the i row and j column, means the NDWI results from multi-spectral images and is the SDWI results from SAR images. Furthermore, and are thresholds generated by the Otsu method and are shown in Table 1, respectively. It is noteworthy that one image corresponds to one threshold. Table 1 exhibits the mean value of all thresholds in each year.
3.1.2. Flood Detection
Permanent water based on historical images in LULC is often coarse and not up-to-date, which could mislead to some errors in the flood area analysis. Thus, a decision-fusion-based approach was proposed to accurately identify permanent water employing the time-series water detection results mentioned above. First, DEM data and its slope aspect were fused to remove false permanent water pixels, such as pixels in a steep slope. Then, the annual permanent water was defined as the region where the frequency of the permanent water is greater than throughout the year. The frequency was shown as Equation (4) below. Finally, LULC data were fused to filter out incorrect pixels that could be other land covers such as paddies. Moreover, the detailed decision fusion rules were presented in Algorithm 1 below.
In Equation (4), t represents the current images, n is the number of images collected in each observation, w means binary water detection results, and are rows and column pixels of the image. It should be noticed that water and not-water are assigned to 1, 0 in this work, respectively.
After extracting annual permanent water, flood areas could be filtered out by the time-series water detection results and permanent water in each observed image. Due to the dynamic annual permanent water, flood areas could be recognized with higher performance and accuracy than using the LULC product as permanent water directly.
| Algorithm 1 Decision fusion strategy |
|
3.2. Flood Risk Map
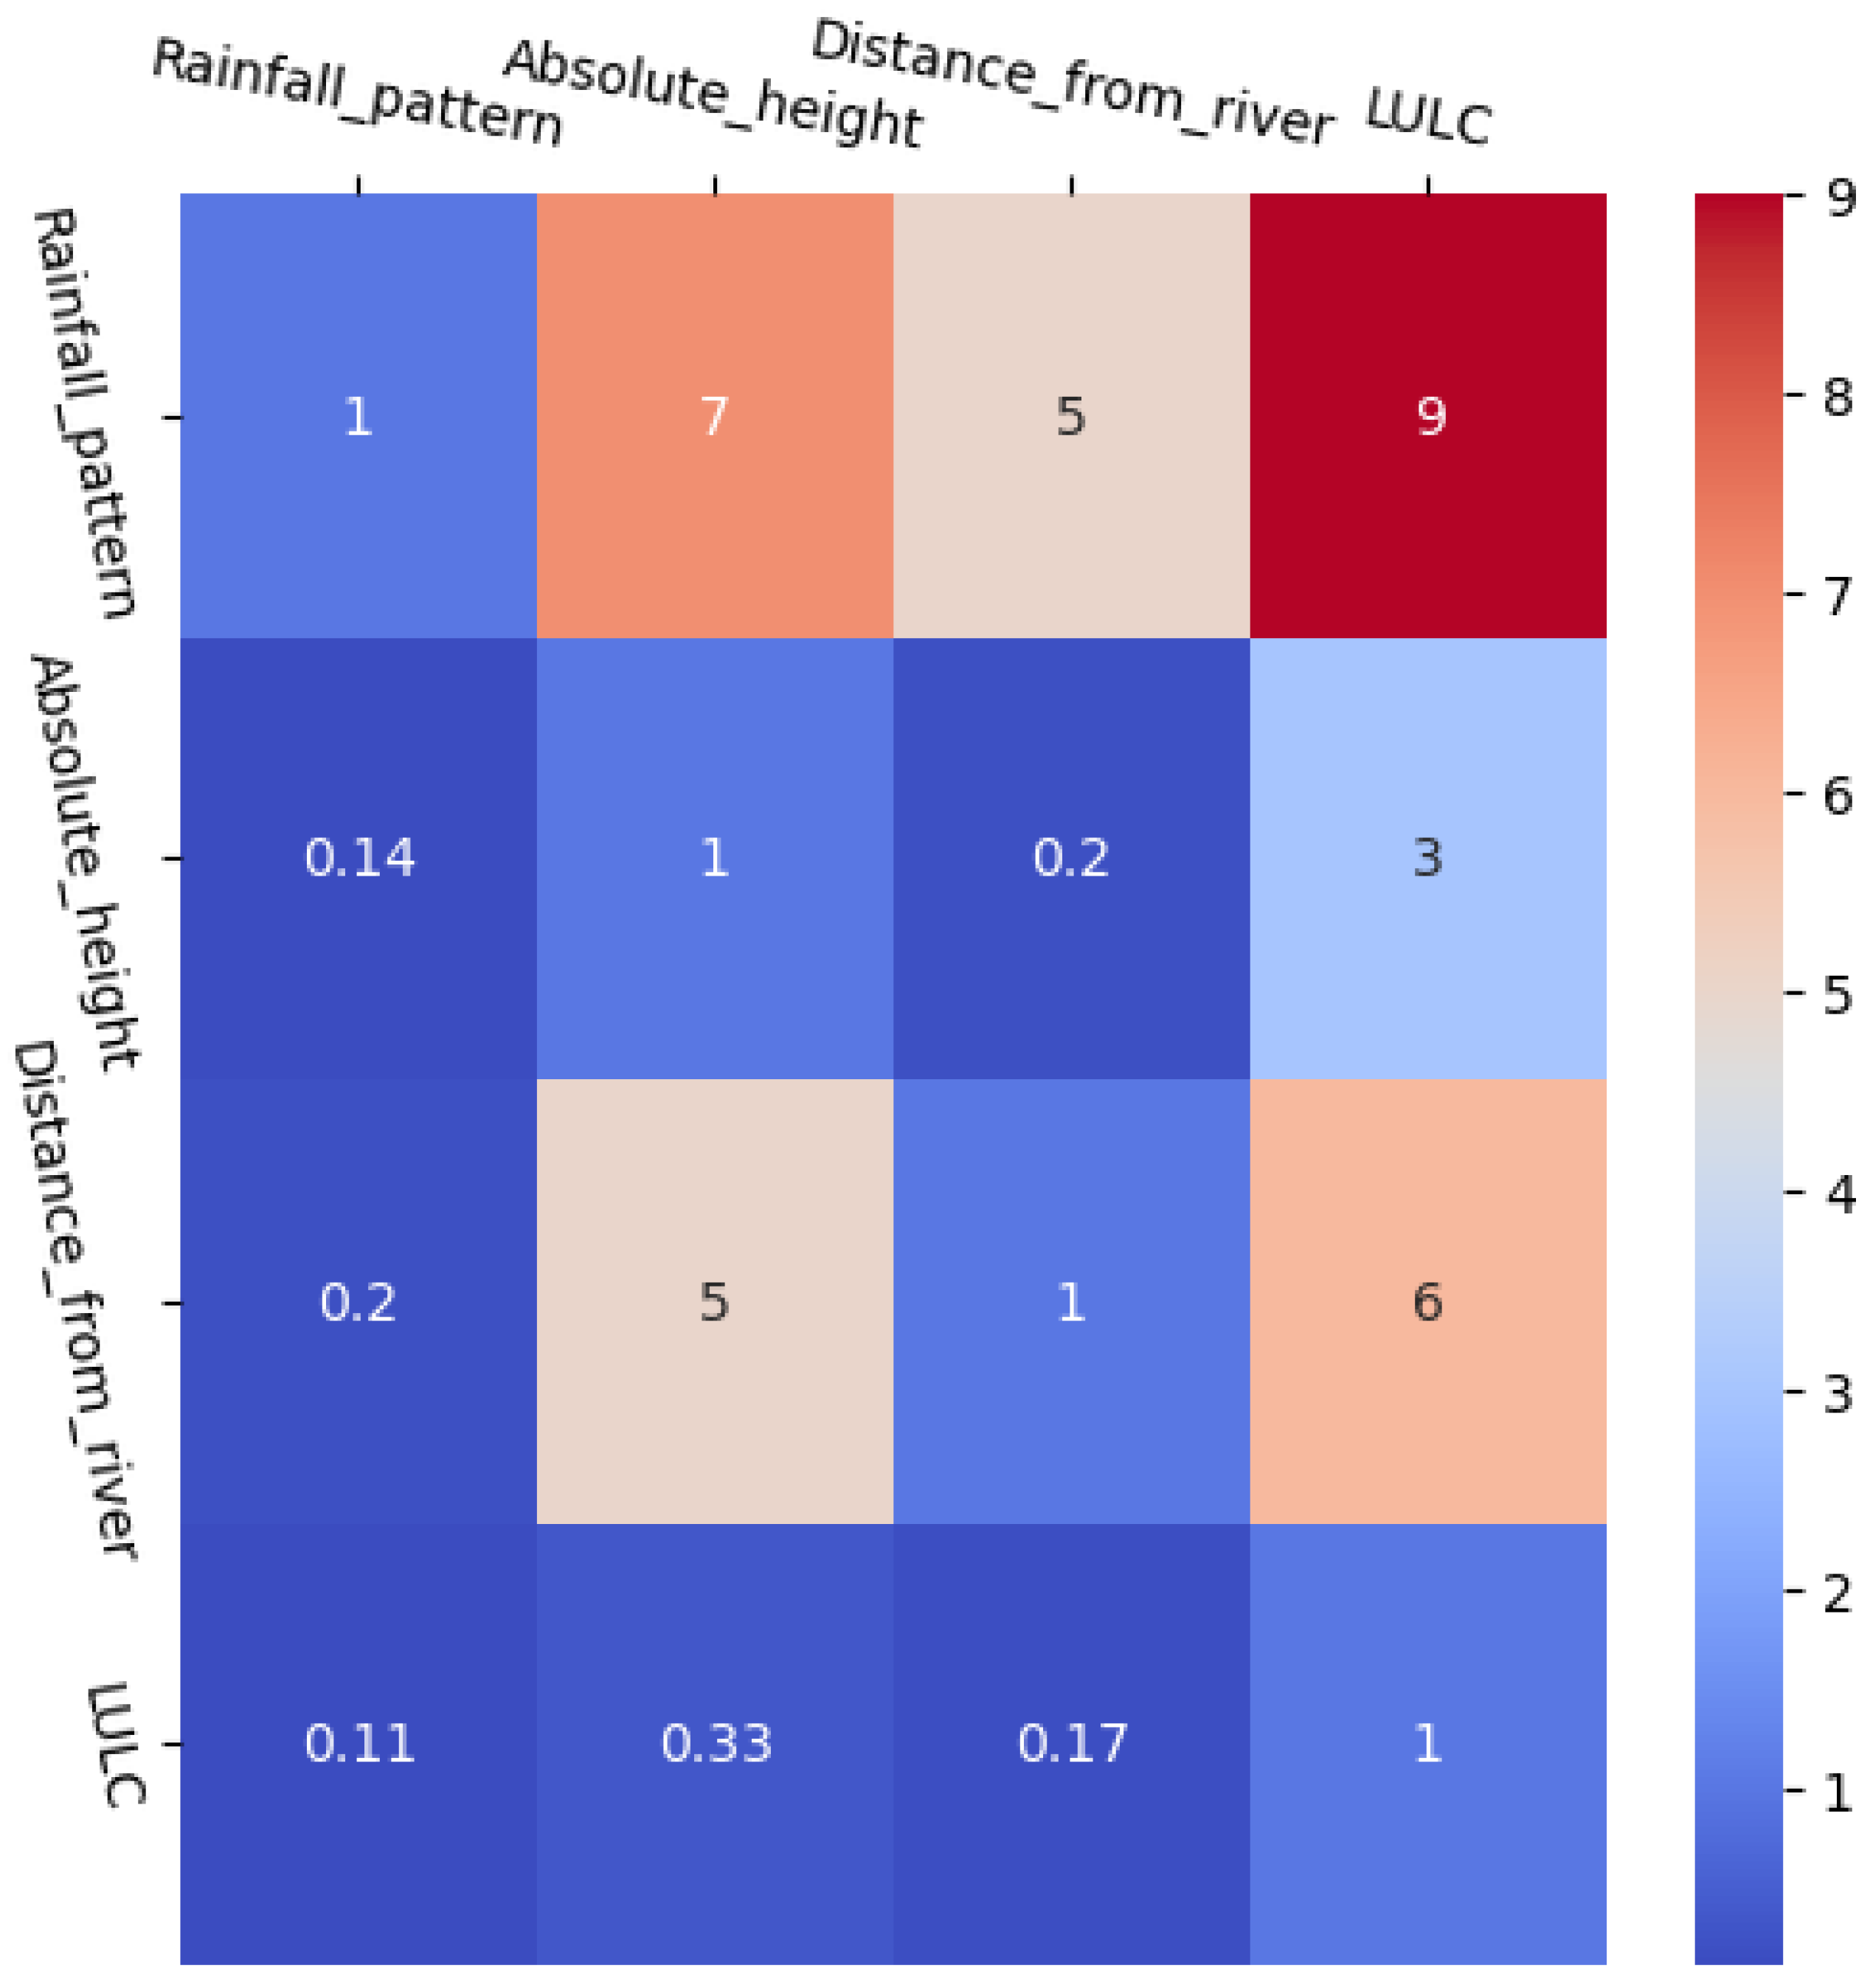
This section aims to create a flood risk map with the AHP [35] and GIS software. AHP is a simple but effective decision-making methodology that allows decision makers to prioritize and evaluate multiple criteria in a systematic and objective manner. It involves constructing a hierarchy of criteria and alternatives, assigning numerical values to each criterion, and using pairwise comparisons to determine the relative importance of each criterion. Four elements, namely rainfall pattern, absolute height, distance from river, and LULC, were considered in AHP and reclassified into 5 classes including minimal risk, low risk, moderate risk, high risk, and maximal risk.
- (1)
- Rainfall pattern is a key driver of flooding as it increases the amount of water flowing in rivers and streams, causing them to overflow their banks and inundate surrounding areas. The intensity, duration, and spatial distribution of rainfall events all play important roles in determining the severity and extent of flooding.
- (2)
- Absolute height also means elevation above sea level, is an important factor in determining flood risk. Low-lying areas are more prone to flooding, as water is more likely to accumulate in these areas.
- (3)
- Distance from river is an important factor that can influence the flood risk in a given area. Areas located closer to a river are at higher risk of experiencing floods, as water can overflow from the river channel during high-flow events. In contrast, areas situated farther away from a river may have a lower flood risk due to the reduced likelihood of being affected by river overflow.
- (4)
- LULC plays a significant role in determining the occurrence and magnitude of flood events. Areas with a high proportion of impervious surfaces, such as urban regions, have a greater risk of flooding due to increased surface runoff during high-intensity rainfall events. On the other hand, regions with natural vegetation or permeable surfaces, such as forests or grasslands, have a lower risk of flooding, as they can absorb and retain water. Changes in LULC, such as deforestation, urbanization, or agricultural expansion, can alter the hydrological processes in a region and exacerbate the risk of flooding.
The first step of AHP was to set the pairwise comparison matrix. According to the importance of each element to the induced flood in Table 2, the pairwise comparison matrix in this paper was shown in Figure 3. Each value represents the importance between the relative two factors.
Moreover, the consistency rate (CR) of weights, shown in Equation (6) below, could test and determine whether the comparison matrix is scientific.
In Equation (5), is the maximum eigenvalue of the comparison matrix, n is the order of the comparison matrix, and it is four in this work.
In Equation (6), represents the random consistent index and its value is determined based on the order of the comparison matrix. is 0.8931 in this work. The calculated CR of 0.1 from Equation (6) indicated that the pairwise comparison matrix used in this study was reasonable.
Then, weights of each factor in AHP could be calculated by the Equation (7) below:
In Equation (7), n is same as Equation (5), and w is the weight of each element. are ith, jth, kth values from 1 to n, respectively. As a result, the weights assigned to Rainfall pattern, Absolute height, Distance from river, and LULC were 0.62, 0.09, 0.25, and 0.05, respectively. Finally, AHP was used to generate the final flood risk map with the following formula and weights:
where represent the rainfall pattern, absolute height, distance from river and LULC, respectively. The resulting flood risk map of AHP was divided into five levels of risk, ranging from a minimal to maximal risk.
3.3. Correlation Analysis
To comprehend the relationship between the flood monitoring result and flood risk map, this study adopted the Pearson correlation coefficients and p-values to verify their relationship. Pearson correlation coefficients could be represented as follows:
In Equation (9), are the i-point observations corresponding to variables , and are the the average of samples, respectively. r is the correlation coefficient and n is the total number of samples.
Moreover, the p-values can be calculated following the Equation (10) above. represents the cumulative distribution function. t means the t-statistic, which could be defined as:
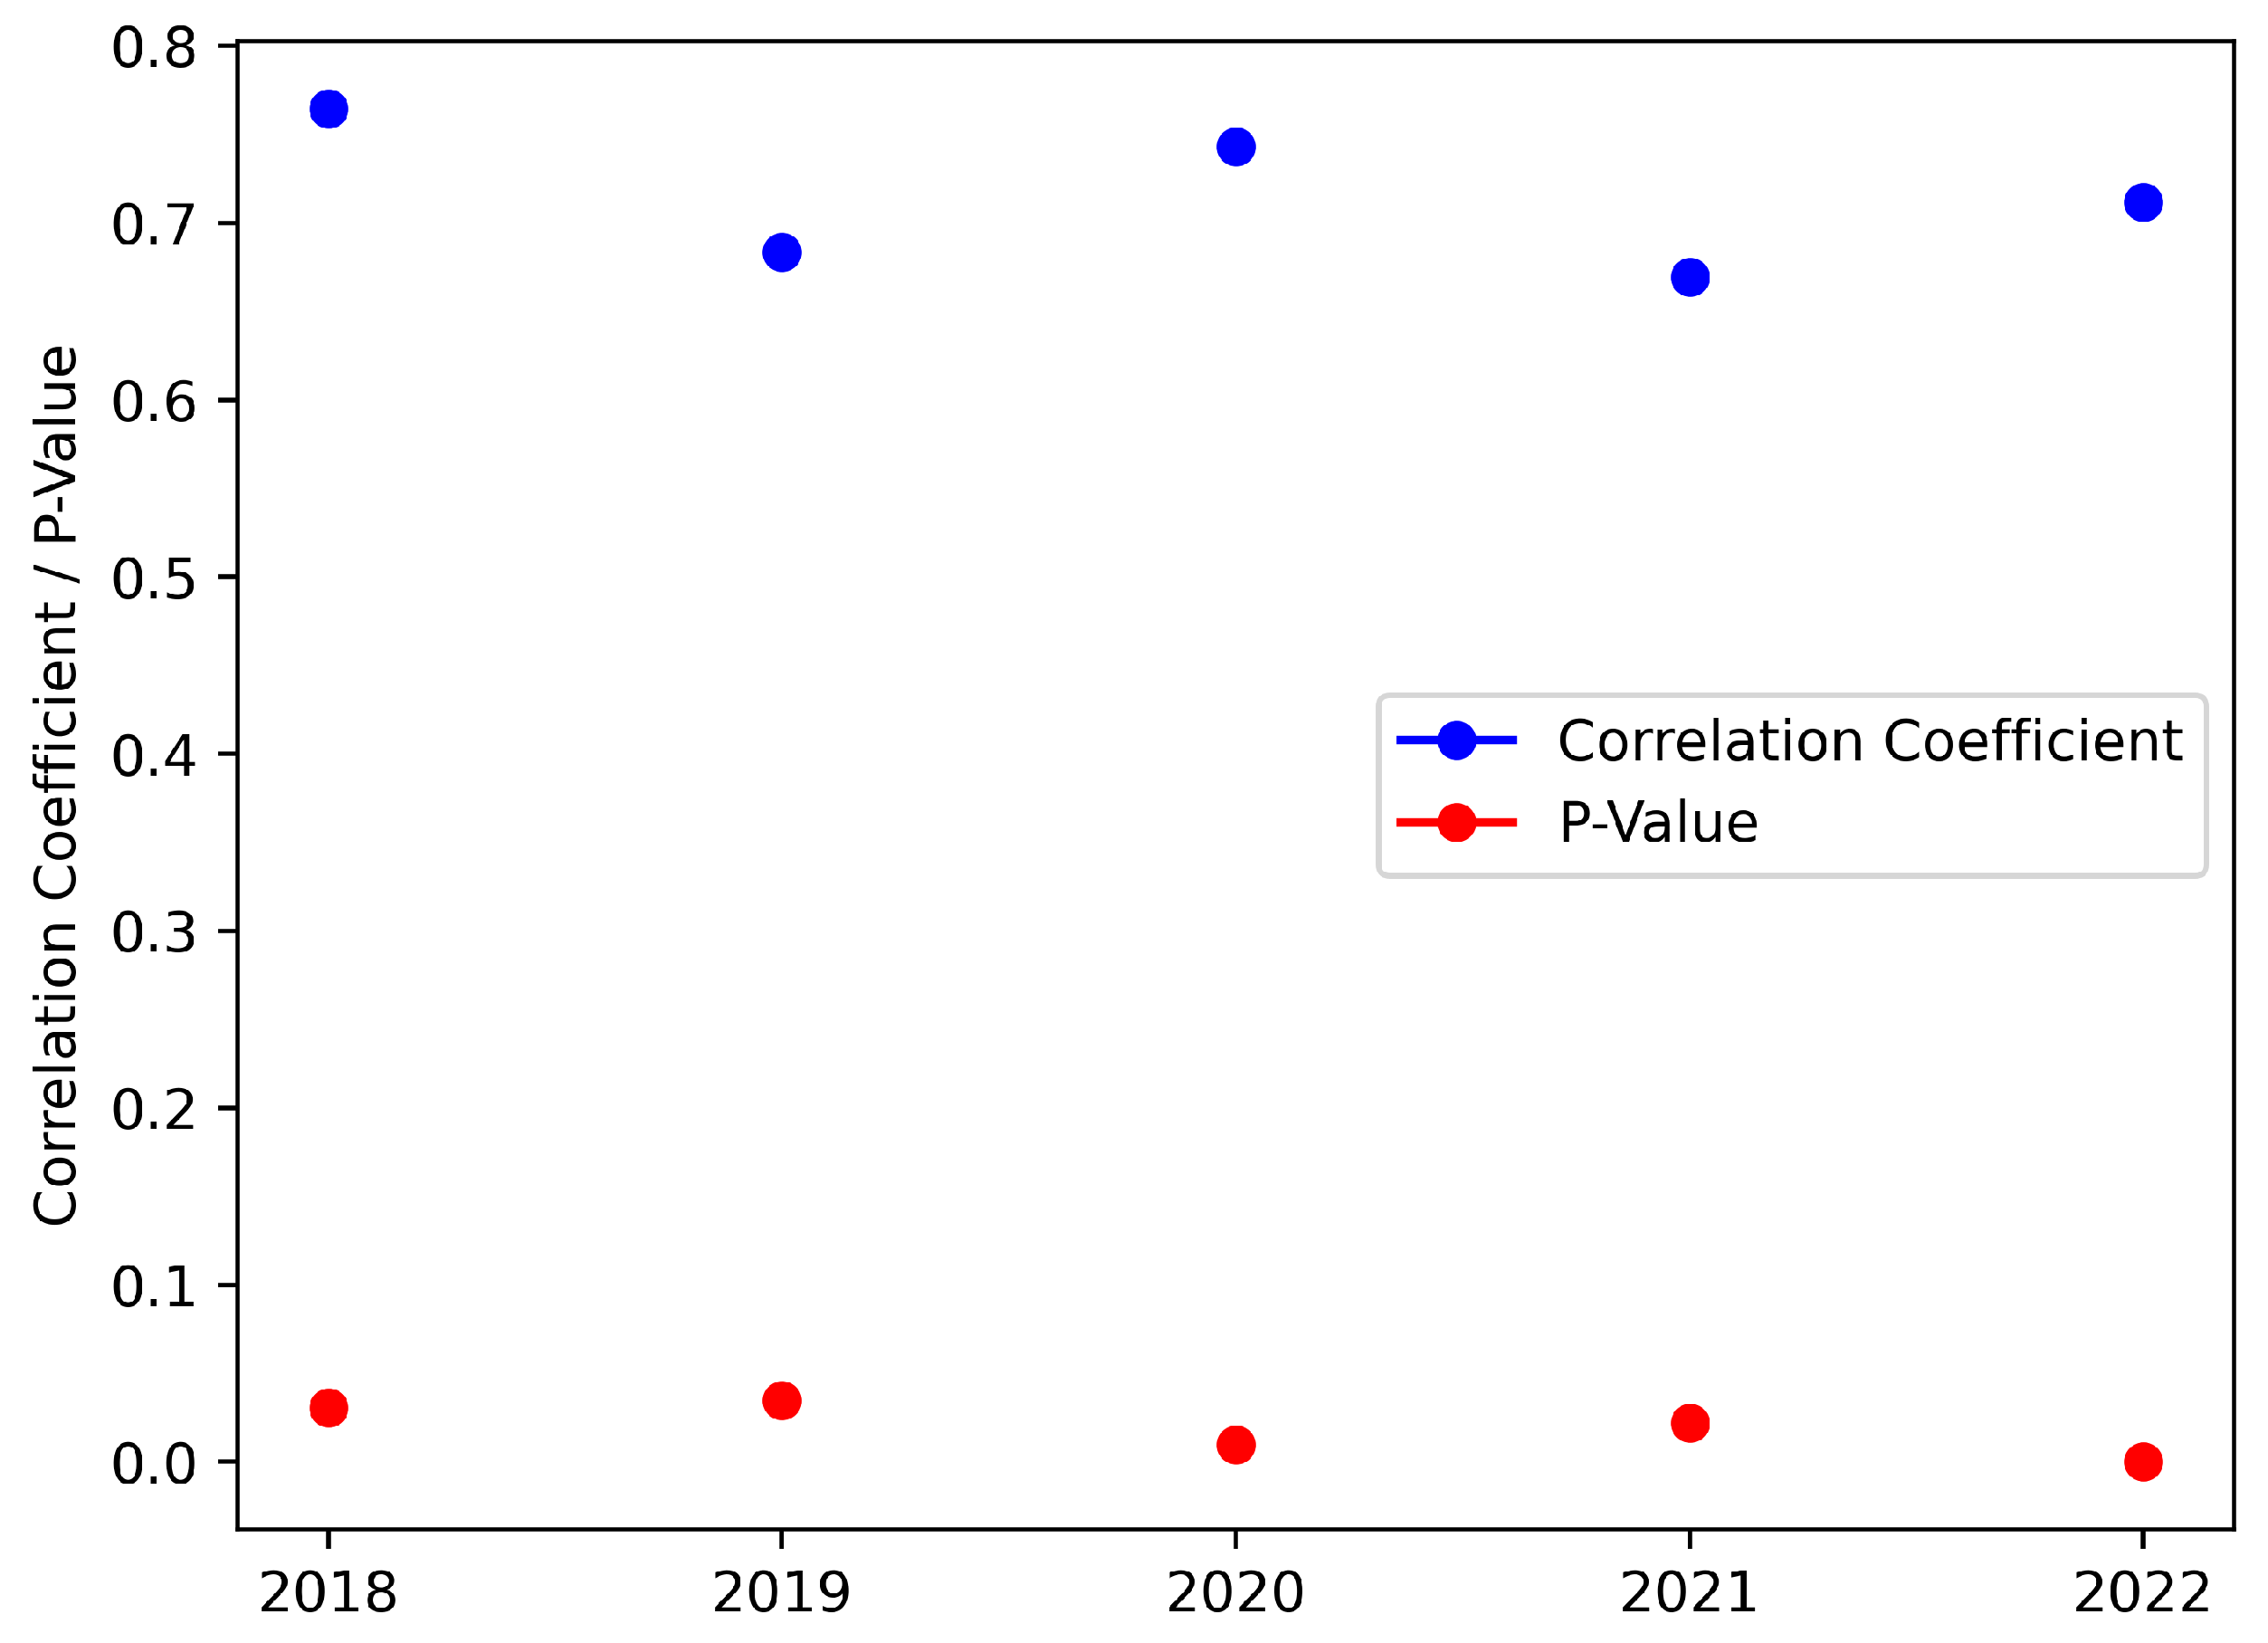
where are the correlation coefficient from Equation (9) and the number of total samples, respectively. Specifically, the correlation coefficient represents the degree of the linear relationship between the two variables, with values ranging from −1 to 1. A value of 1 indicates a perfect positive linear correlation, while a value of −1 indicates a perfect negative linear correlation. The p-value measures the probability of observing a correlation coefficient as extreme as the one obtained by chance, assuming that there is no true correlation between the two variables. The p-value below a certain threshold (e.g., 0.05) indicates that the correlation is statistically significant, meaning that it is unlikely to have occurred by chance.
4. Results
This section presented a comprehensive analysis of floods in Laos, from three scales (macro, meso, and micro) and two dimensions (spatial and temporal). At the macro-scale, flood trends were analyzed across the entire country. At the meso-scale, we focused on the Vientiane Capital region, providing a detailed account of flood patterns in this area. To further enhance an understanding of flood patterns at this scale, a Pearson correlation analysis was used to explore the relationship between flood occurrence and meteorological factors. Finally, the effectiveness of the scene-level flood interpretation was evaluated at the micro-scale. The analysis was based exclusively on quantitative data in the form of flood graphs covering the years 2018 to 2022. For each year, annual trends and monthly trends of floods were presented. Moreover, a thorough account of flood patterns at each scale was given. These findings shed light on the effectiveness of flood monitoring in Laos with the proposed method and provided a foundation for forward research in this area.
4.1. Macro-Scale: Annual Flood Areas in Laos
At the macro scale, analyzing flooding in a country entailed studying the patterns and trends of floods across different regions over an extended period. This type of analysis provided insights into the regions that were most vulnerable to such events, and it facilitated the development of appropriate strategies for mitigating their impacts. To comprehensively understand the spatiotemporal distribution of flooding in Laos by examining its characteristics and patterns in the whole country, we collected multiple temporal remote sensing images from 2018 to 2022, and analyzed their extent and frequency, as well as the agricultural impacts of these flooding events.
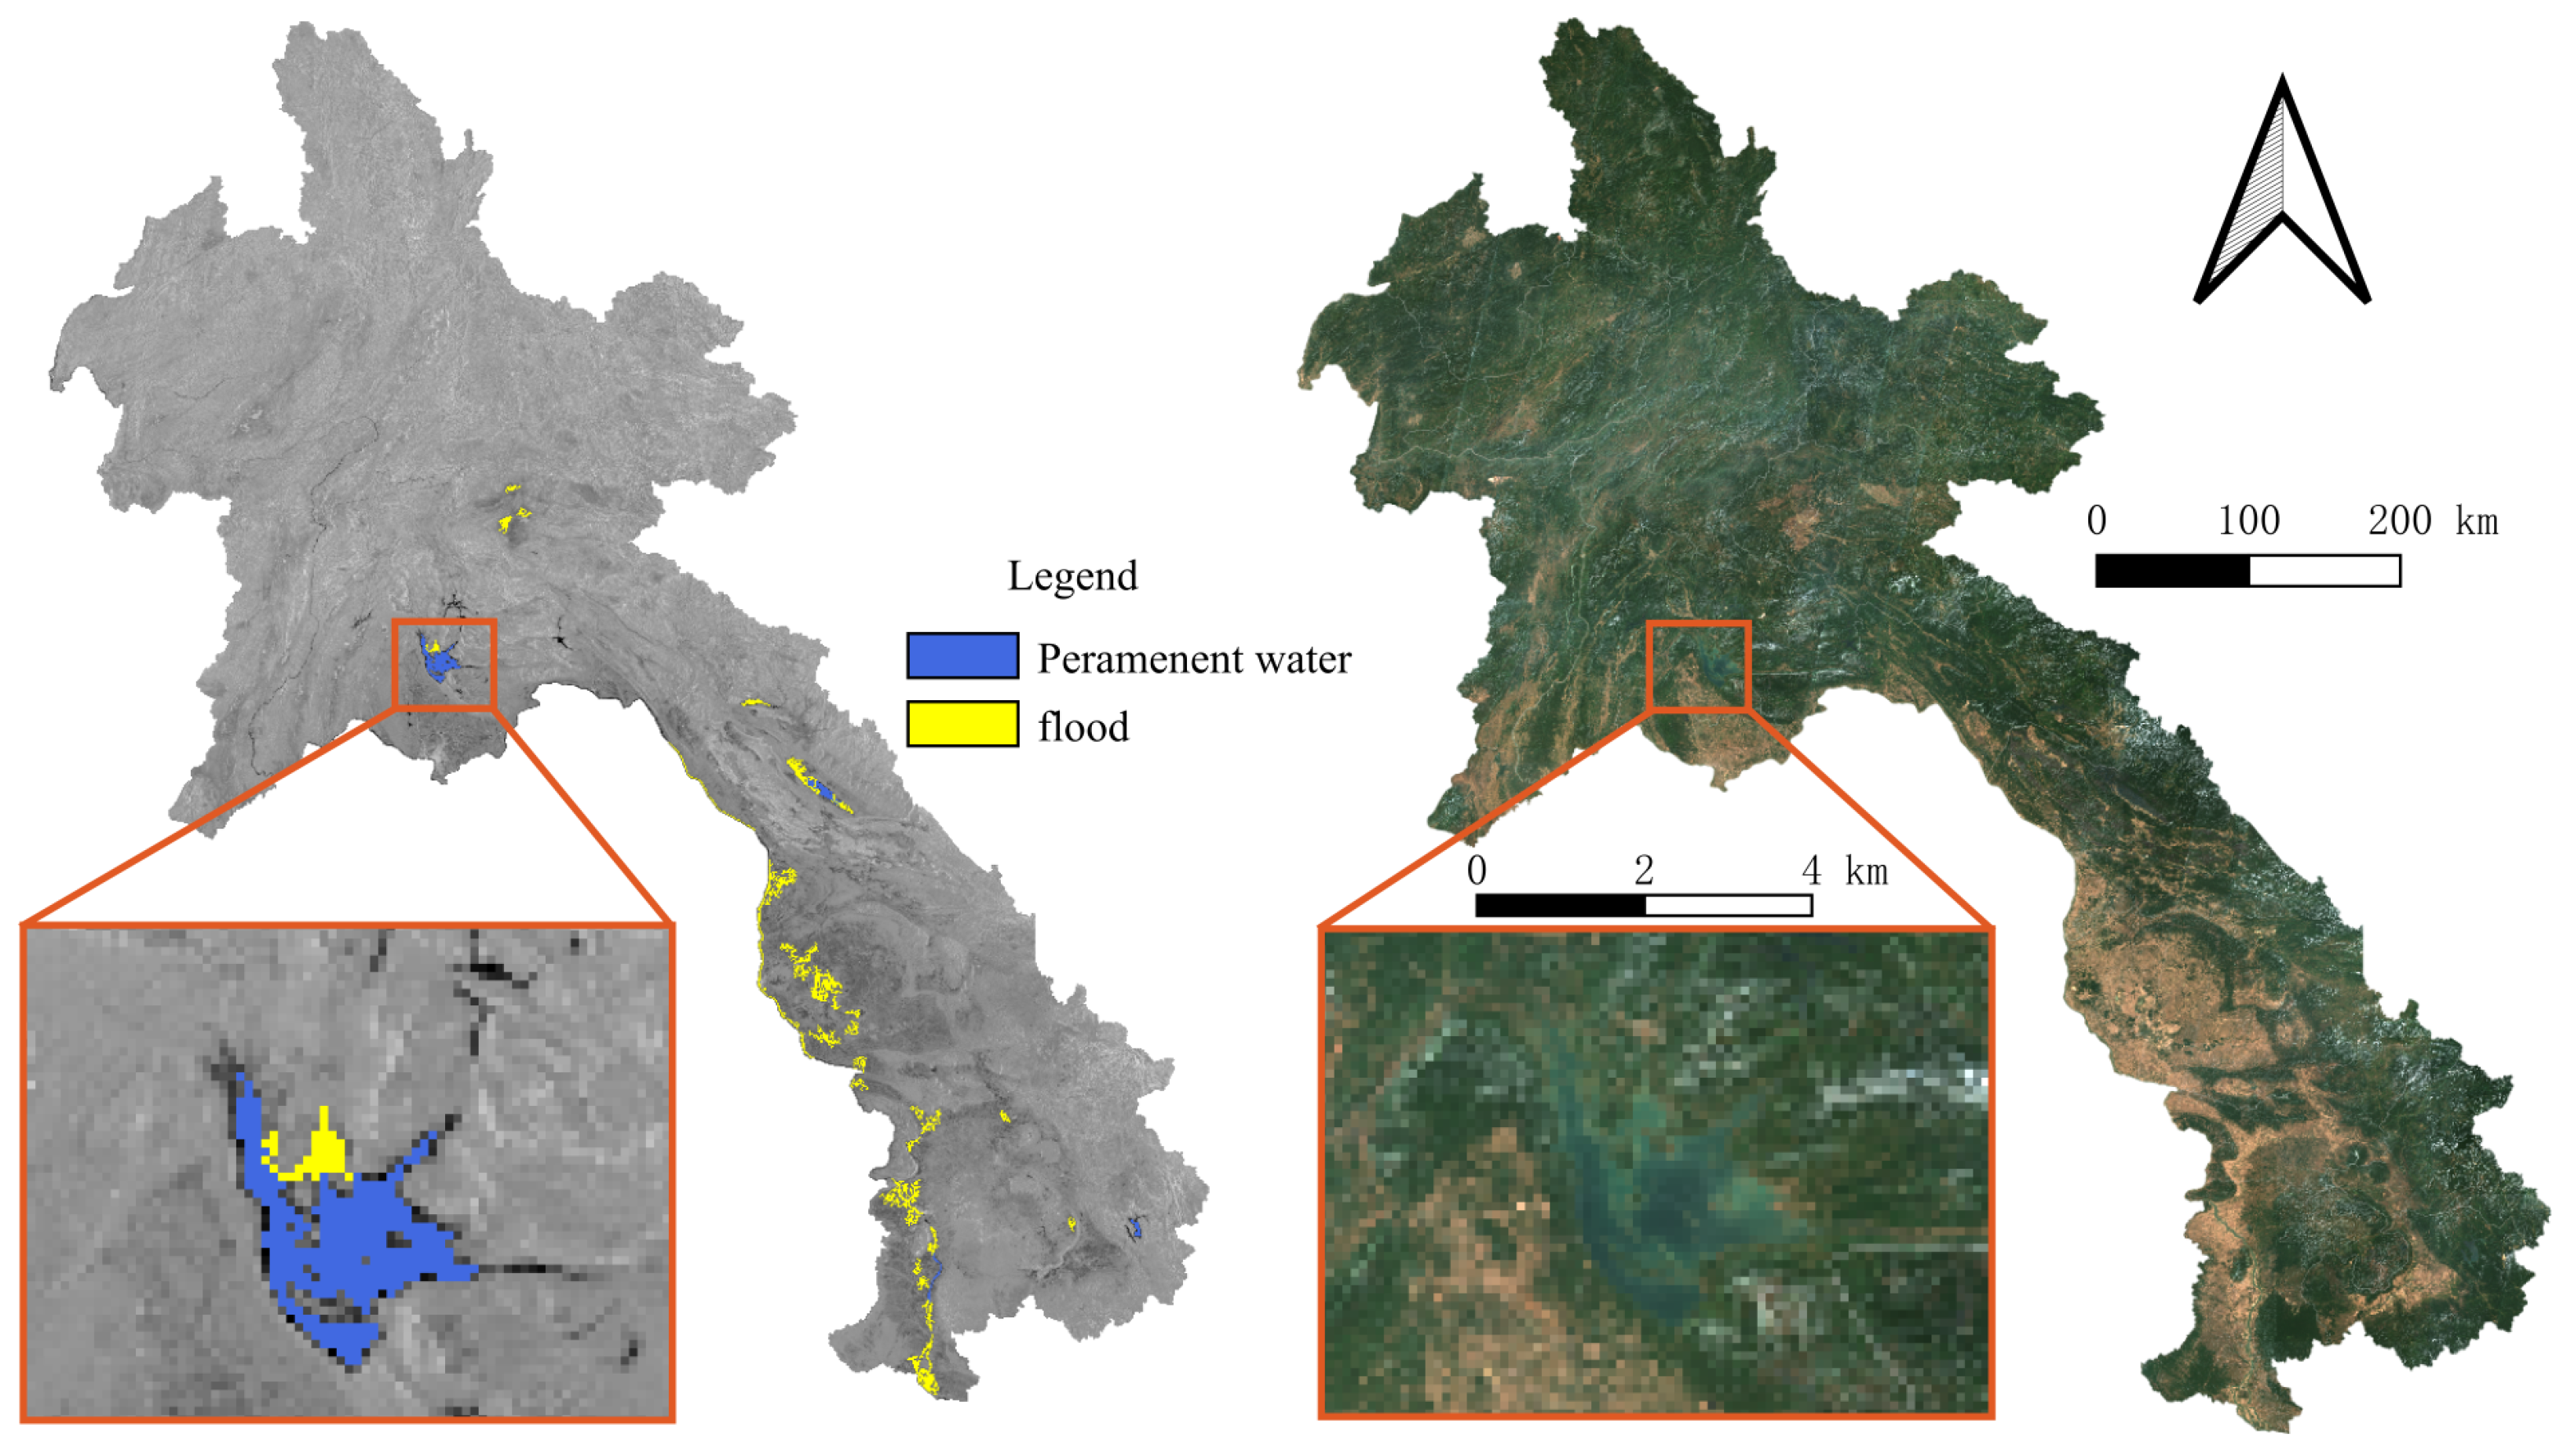
From a spatial perspective, as is shown in Figure 4, the central and southern regions of Laos are highly vulnerable to flooding due to their topography and geographical location, which are close to the Nam Ngum and Mekong Rivers. Floods in these areas can be devastating, often leading to significant damage to properties, infrastructures, and farmlands for the following reasons. (i) The Nam Ngum River, located in the central region of Laos, is a major source of hydroelectric power and serves as a hub for electricity production in the country. Areas surrounding the Nam Ngum River are often densely populated and have relatively strong economic development. Thus, if floods hit these areas, they would suffer significant losses. (ii) Regions near both major rivers, lakes, and reservoirs with flat and low-lying areas are particularly susceptible to flooding, with a larger area affected than other regions. (iii) The loss of crops and damage to farmland could result in severe consequences on the country’s agricultural sector, which is a significant contributor to its economy.
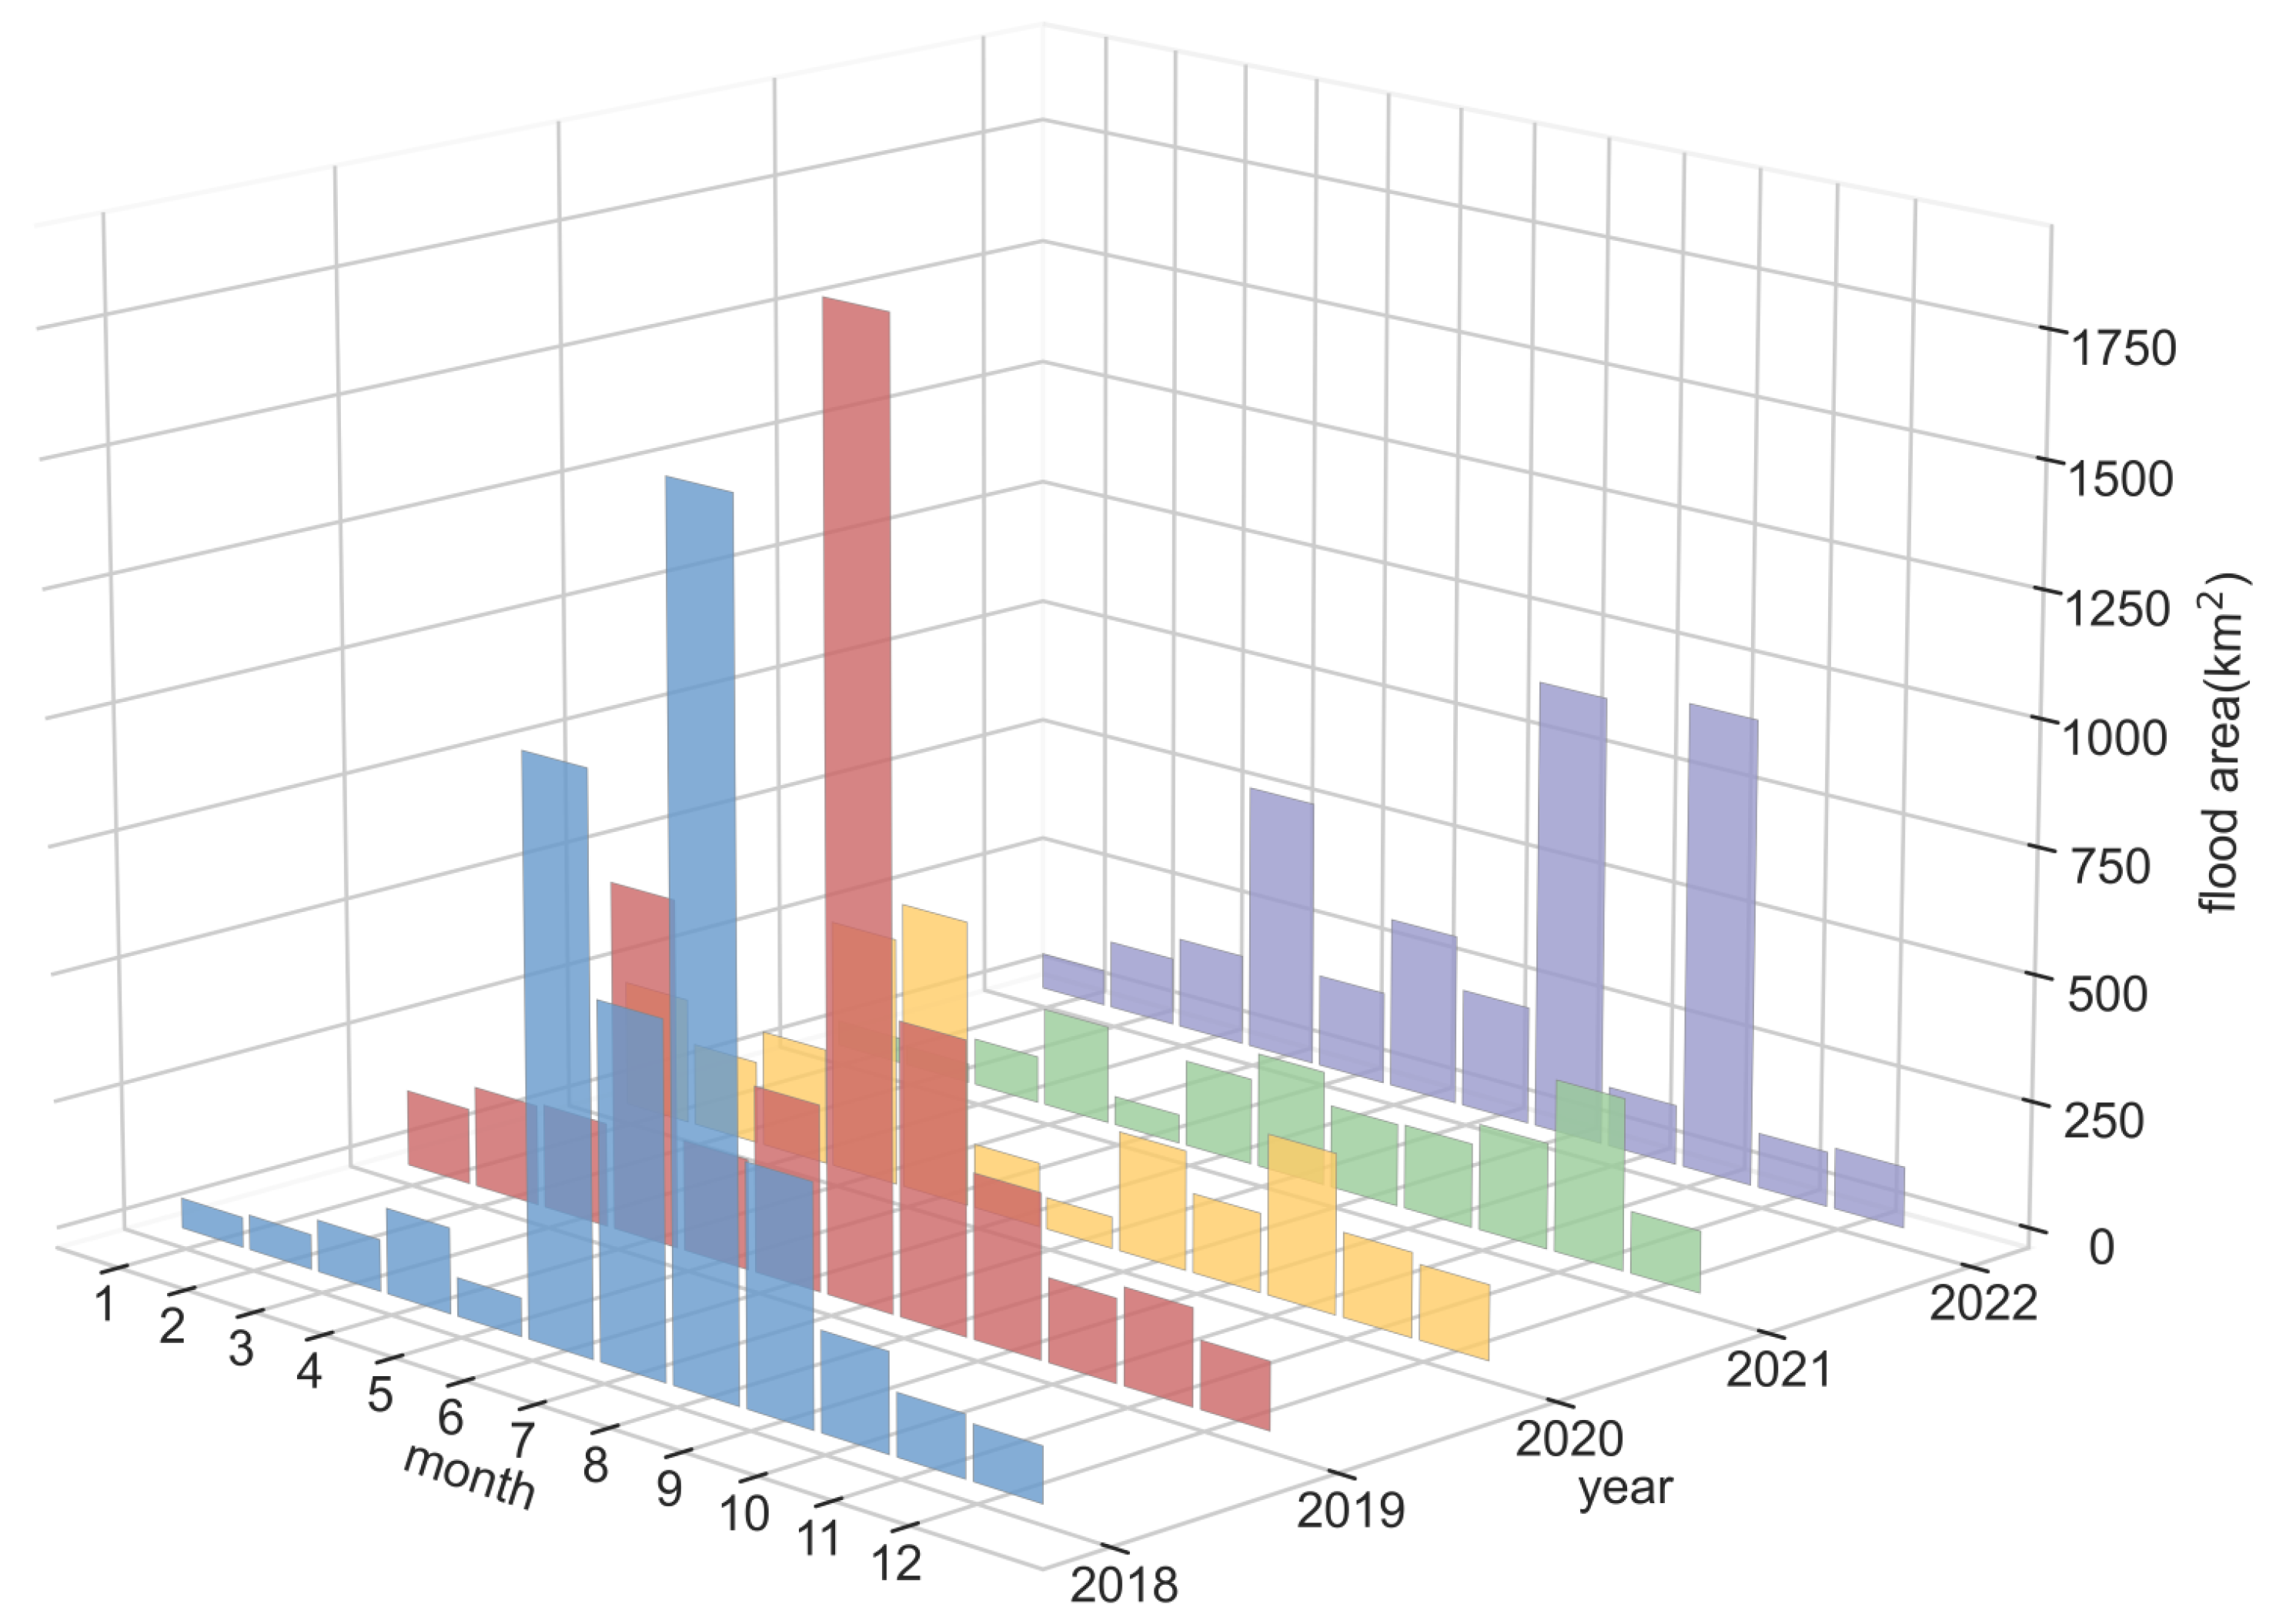
From a time perspective, recent years have observed significant flooding in Laos. Based on the data presented in Table 3, the flood area ranges from 1620 km in 2021 to 4693 km in 2019. However, the annual flood area has demonstrated a decreasing trend over the past five years, with the smallest area in 2021 and the largest area in 2019. This decrease may be attributed to the implementation of water management systems and flood prevention measures by the government in recent years, as well as other natural factors. For instance, the Nam Ao Hydropower Project completed in 2018 built a dam and reservoir system to manage water flow and prevent flooding effectively. Furthermore, the Ministry of Agriculture and Forestry launched the “Water Management for Sustainable Development” program in 2020, which aimed to improve irrigation and drainage systems to better manage water resources and mitigate flood risks. These initiatives may have contributed to the decreasing trend in flood areas observed in recent years.
The monthly flood patterns were also analyzed. As shown in Figure 5, it is obvious that the majority of flooding in Laos occurs during the rainy season from May to October. In all years, the highest flood areas were recorded from May to November, accounting for over 50% of the annual flood area. This result is in line with the weather pattern in Laos, where heavy rains and typhoons are more likely to occur during the summer months. However, in 2020, there was a deviation from this pattern, with the highest flood area occurring in April and May. This deviation may be attributed to the impact of tropical storm Vongfong, which caused heavy rains and flooding in Laos during this period. Overall, the analysis suggests that recent water management systems and flood prevention measures in Laos have been effective in reducing the extent of flooding, despite occasional deviations from typical weather patterns.
4.2. Meso-Scale: Flood Analysis in Vientiane
To obtain a more detailed comprehension of flood patterns, a typical region Vientiane, the capital of Laos, was chosen to conduct further analysis in this section. Firstly, the correlation between the flooding areas and the flood risk map was verified. Secondly, spatiotemporal characteristics derived from the flood event were utilized to assess the flood dynamics within the study area. Furthermore, LULC data were used to recognize land covers masked by floods and then estimate the impacts of floods.
4.2.1. Spatiotemporal Analysis
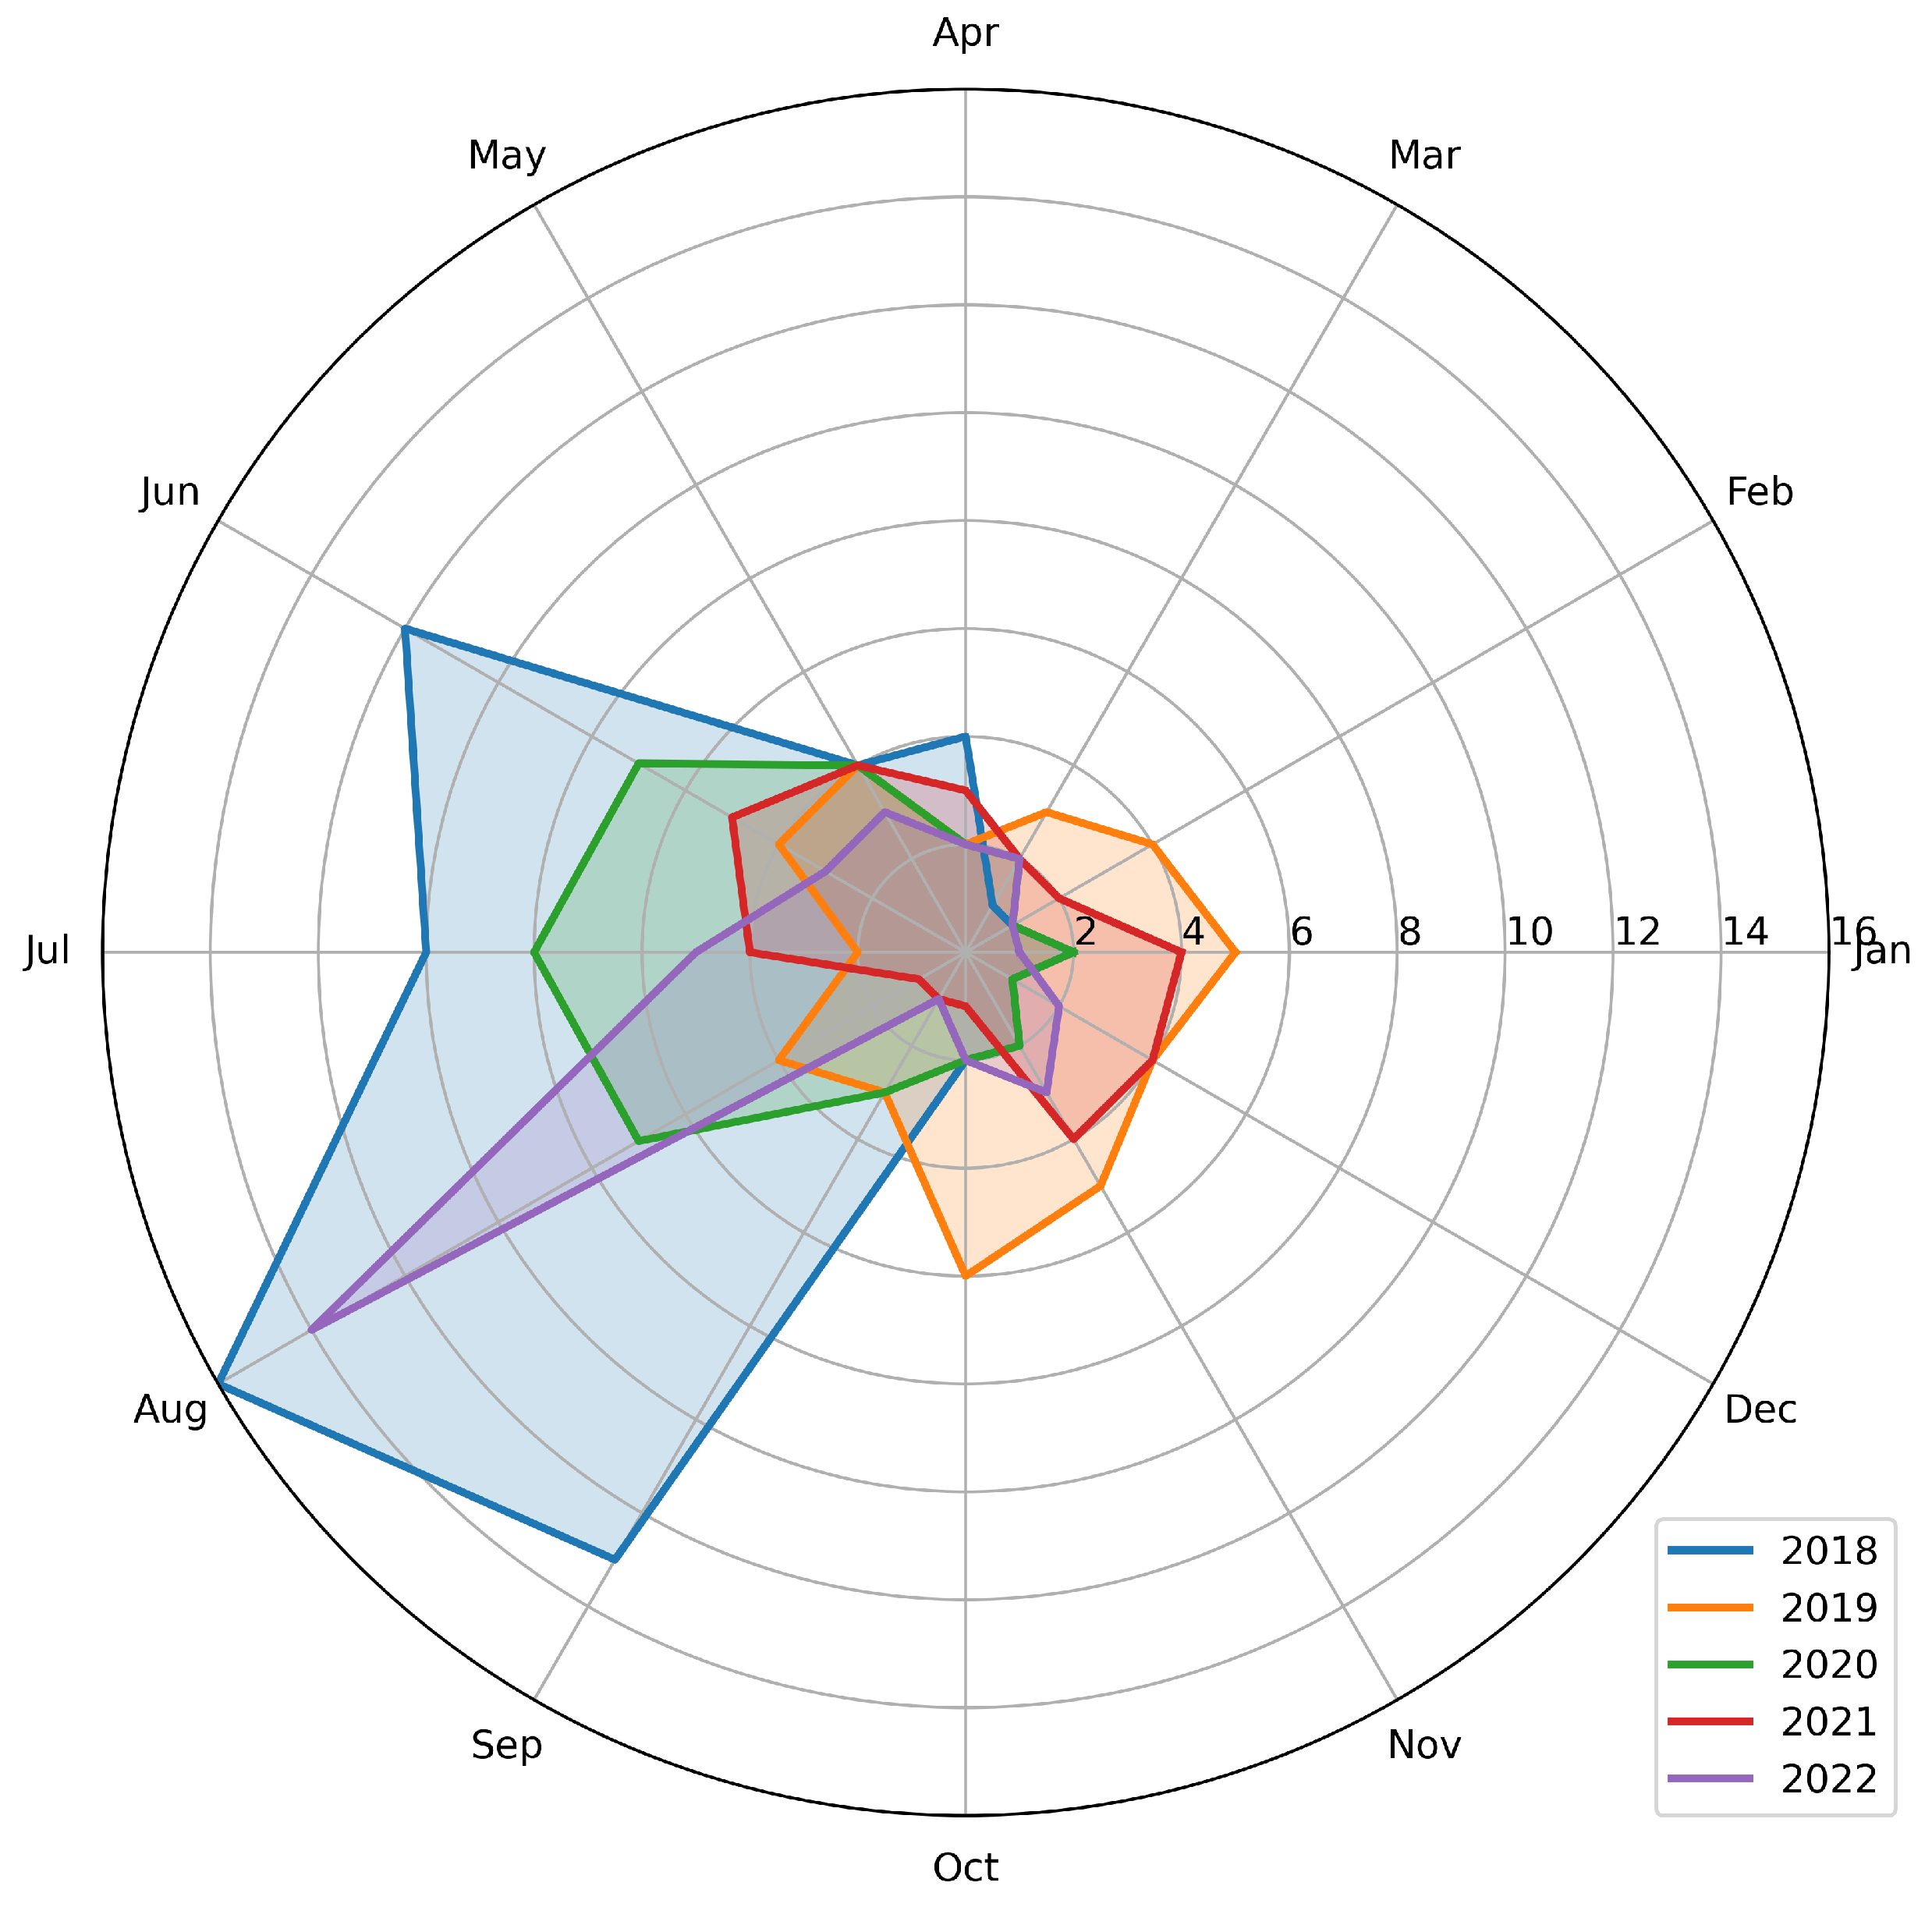
In terms of time, most of the flood occurs during the rainy season, from May to September according to the monitoring result shown in Figure 6. In the Vientiane region, the occurrence pattern of floods from 2018 to 2022 has exhibited significant variations, particularly between pre- and post-2020. Prior to 2020, the region experienced a higher frequency of floods, with the peak flood season occurring between May and September each year. However, from 2020 onwards, there has been a noticeable decrease in overall flood occurrences, especially during June and July. Nonetheless, the peak flood season still falls between May and September each year. It should be noted that in August 2022, the Vientiane region experienced severe floods due to continuous heavy rainfall, which disrupted normal life and caused significant damage to the region.
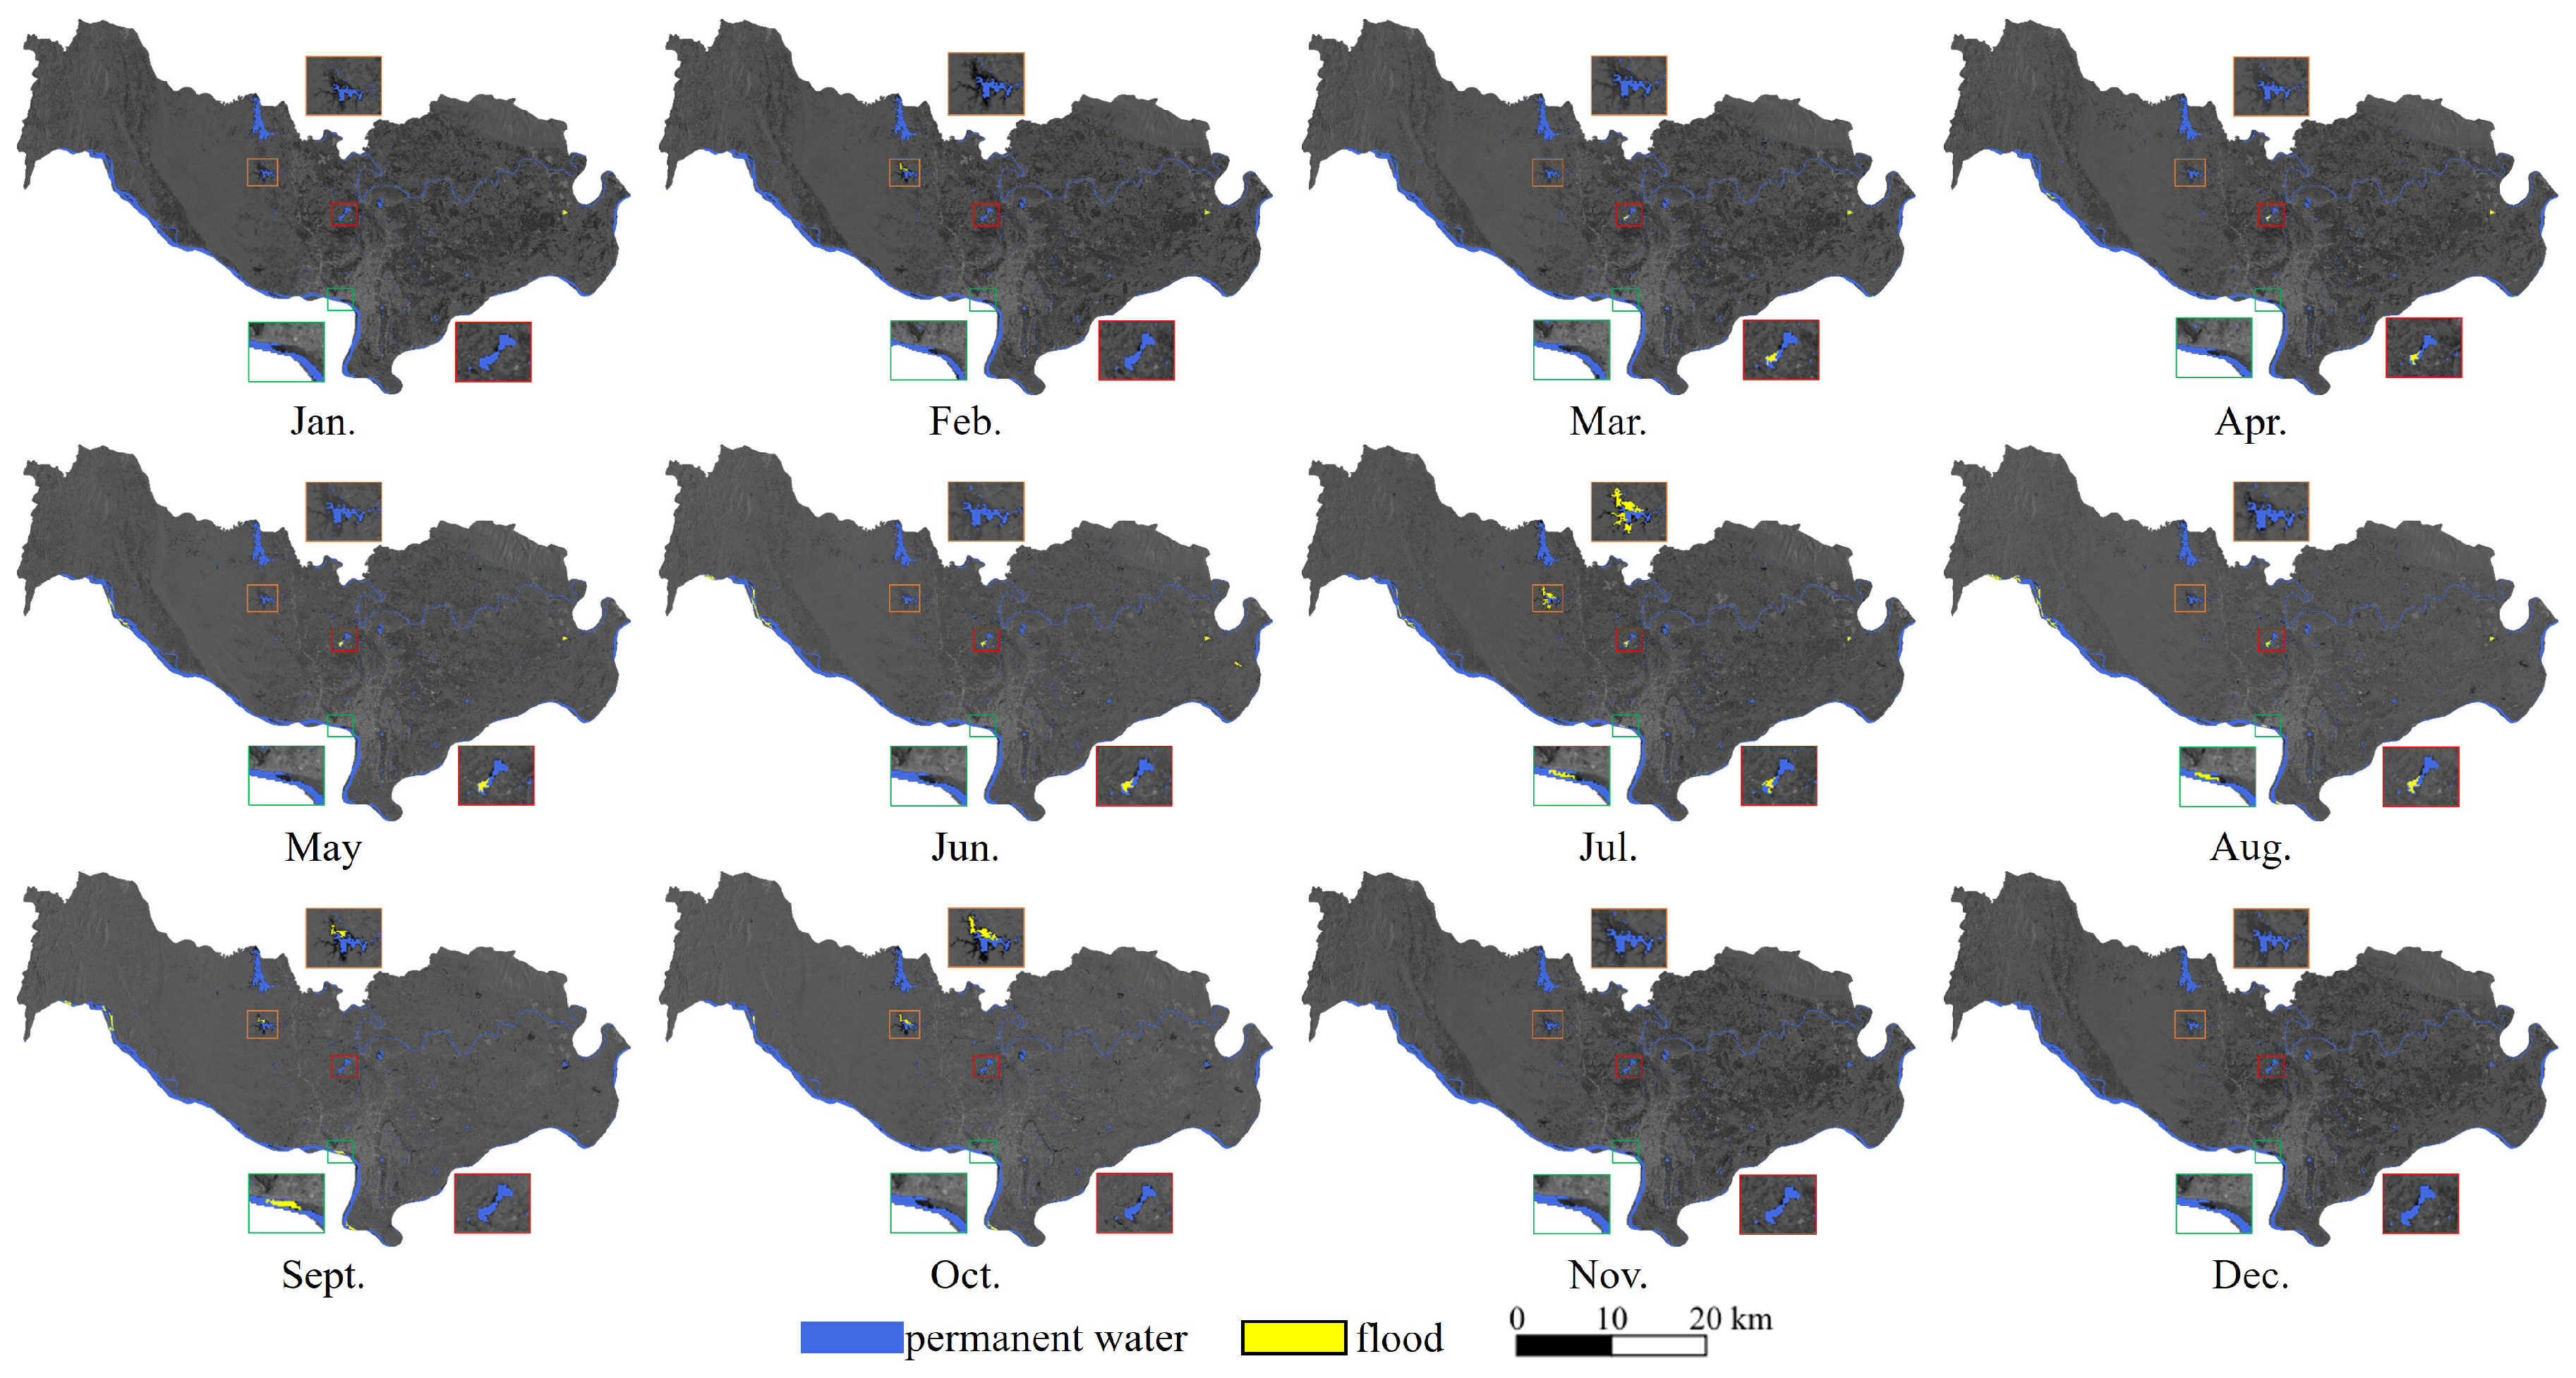
As for spatial characteristics, Vientiane has a flat terrain with the Mekong River running through it. It experiences a tropical savanna climate with high humidity, temperatures throughout the year, and distinct wet and dry seasons. The majority of floods occur near permanent water bodies, as shown in Figure 7. Three sub regions were chosen to explore how the flood was distributed in 2020. Obviously, the areas beside the Nam Houm Reservoir and Mekong River have a higher frequency to be inundated by floods than other regions.
4.2.2. Flooded Land Cover Types
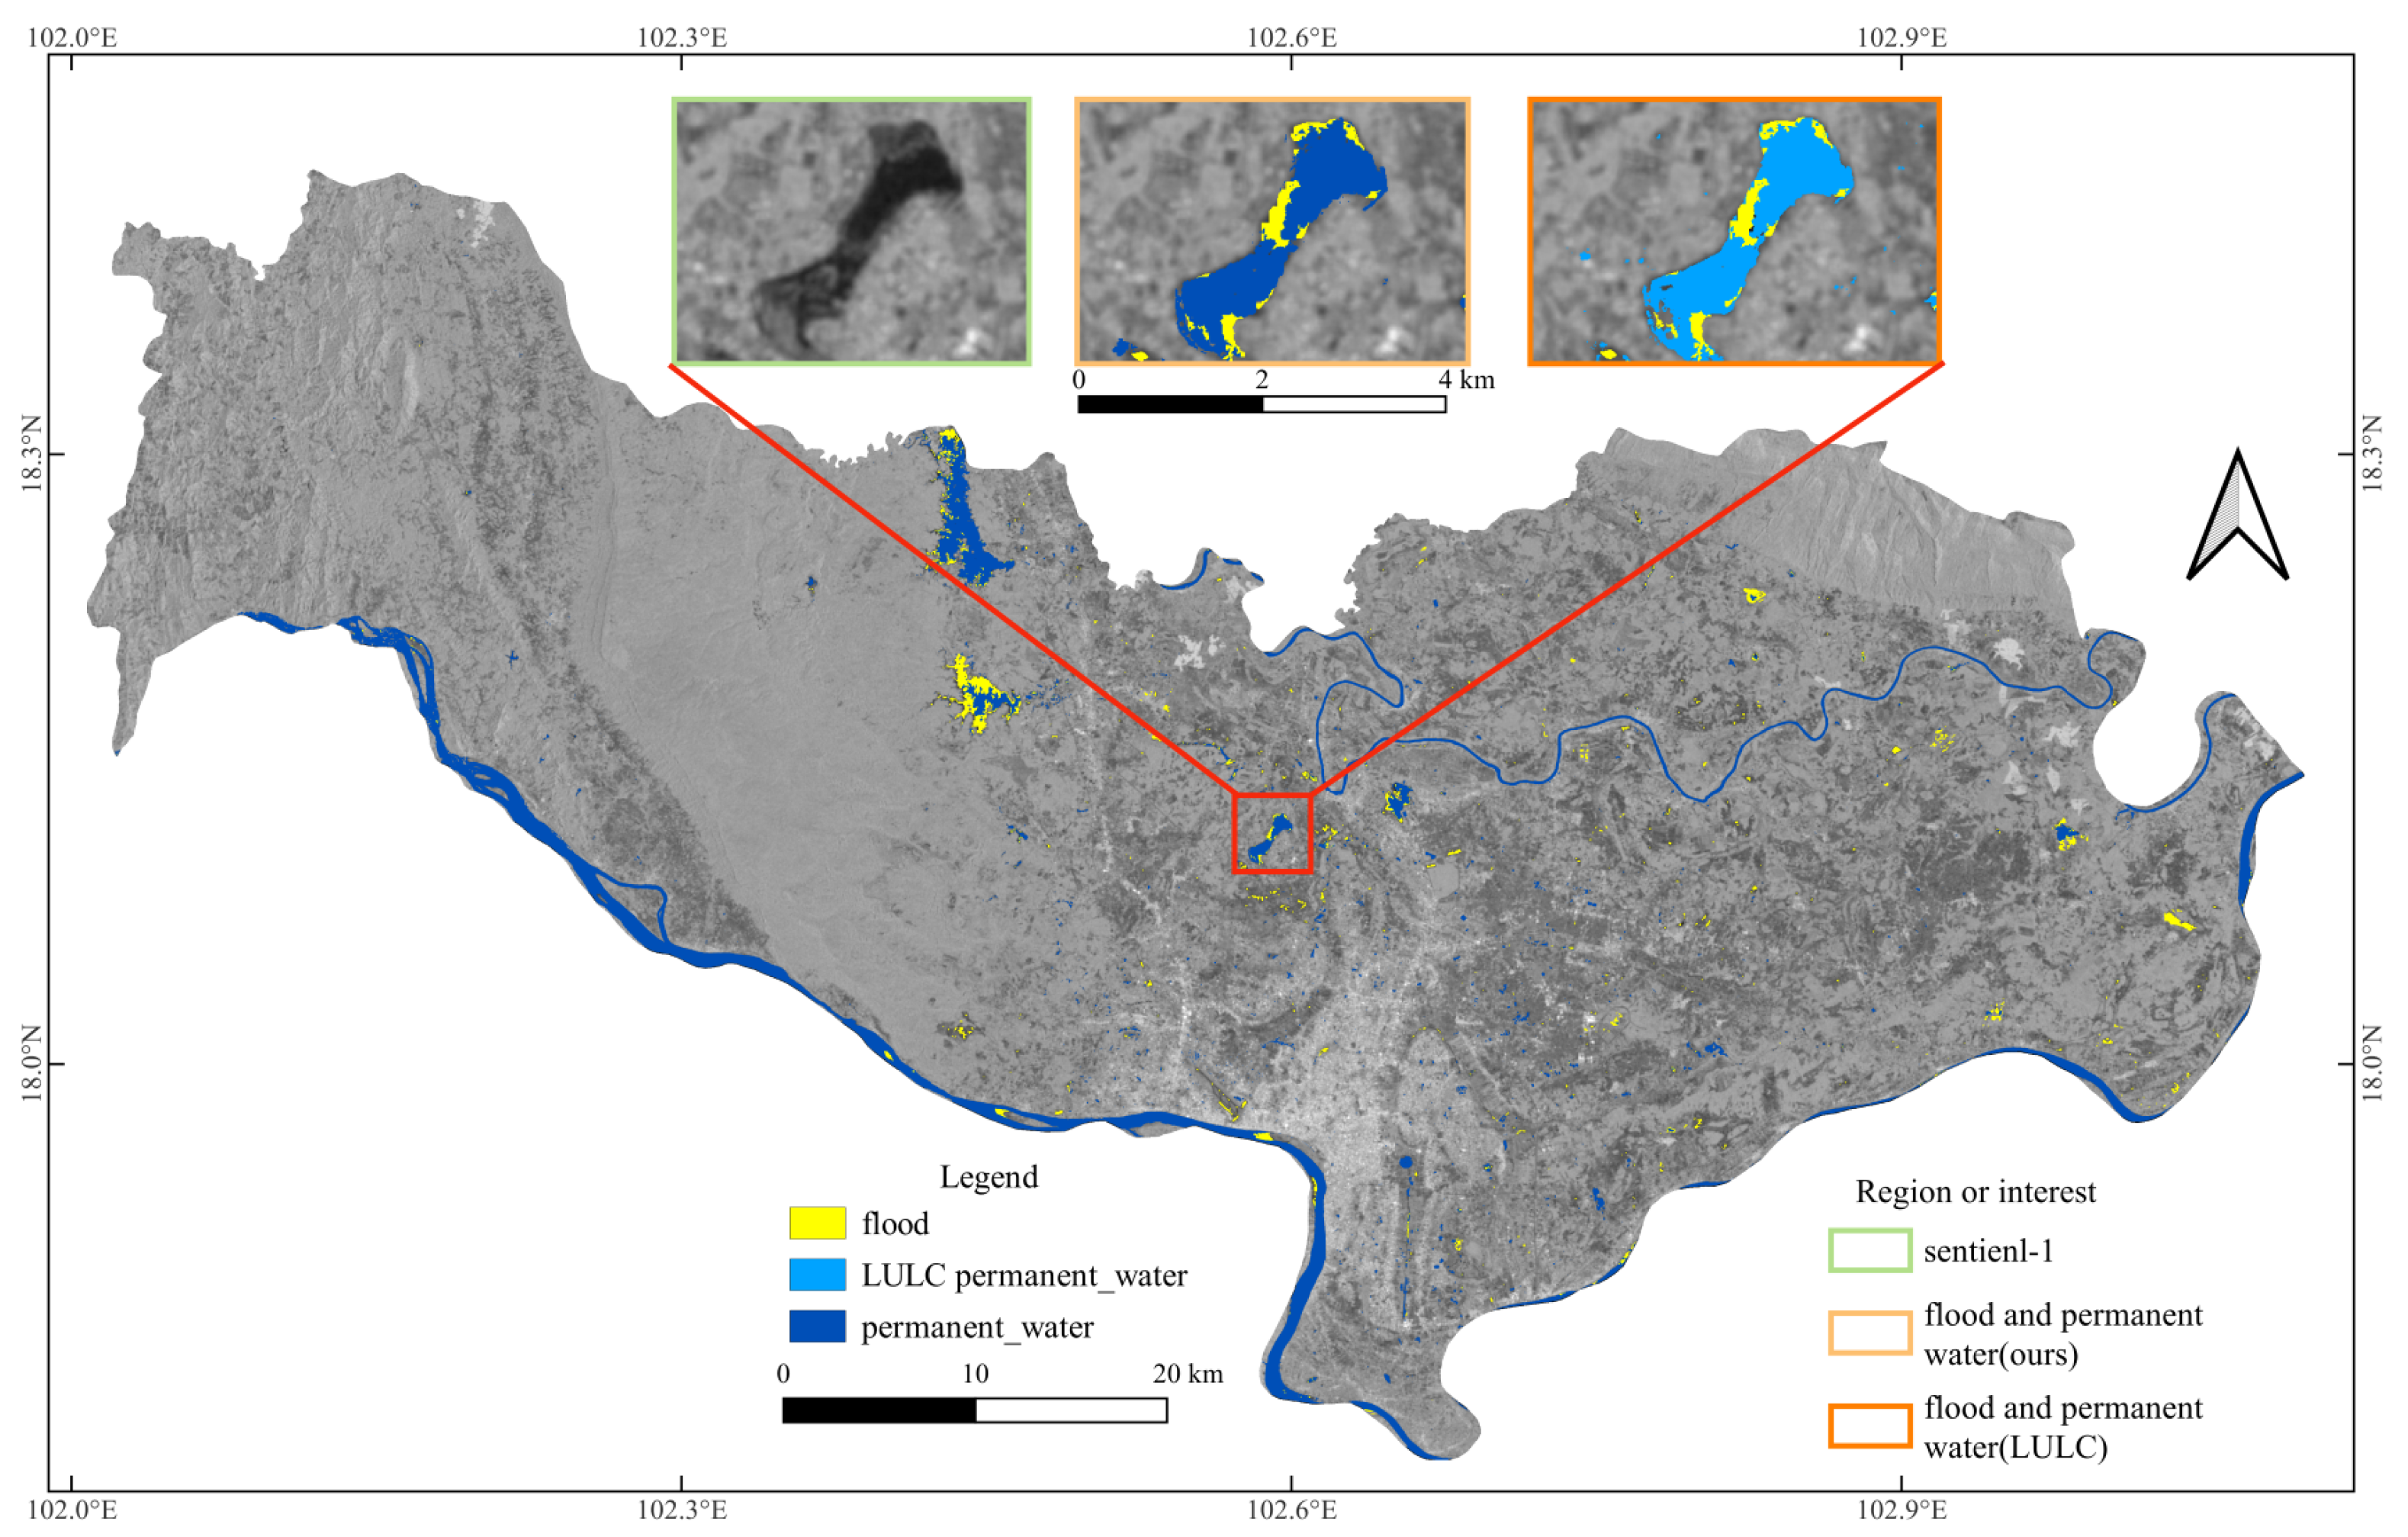
The remote sensing analysis of flooded land cover types could offer significant benefits in terms of understanding the extent and severity of flood disasters on infrastructure, emergency response, and urban planning, providing vital information for effective disaster management, post-disaster recovery, and flood prevention strategies. This work stacked the flood monitoring results and LULC product to explore the land cover, most of which was inundated by floods. As shown in Figure 8, LULC has an excellent performance in permanent water compared to google satellite images with very high-resolution. However, water bodies are dynamic objects which will change over time. Therefore, it should be noted that calculating the flood using LULC products, which are generated by static imageries and any other geo-informations, is unreliable except for in an analysis in terms of flooded land cover types.
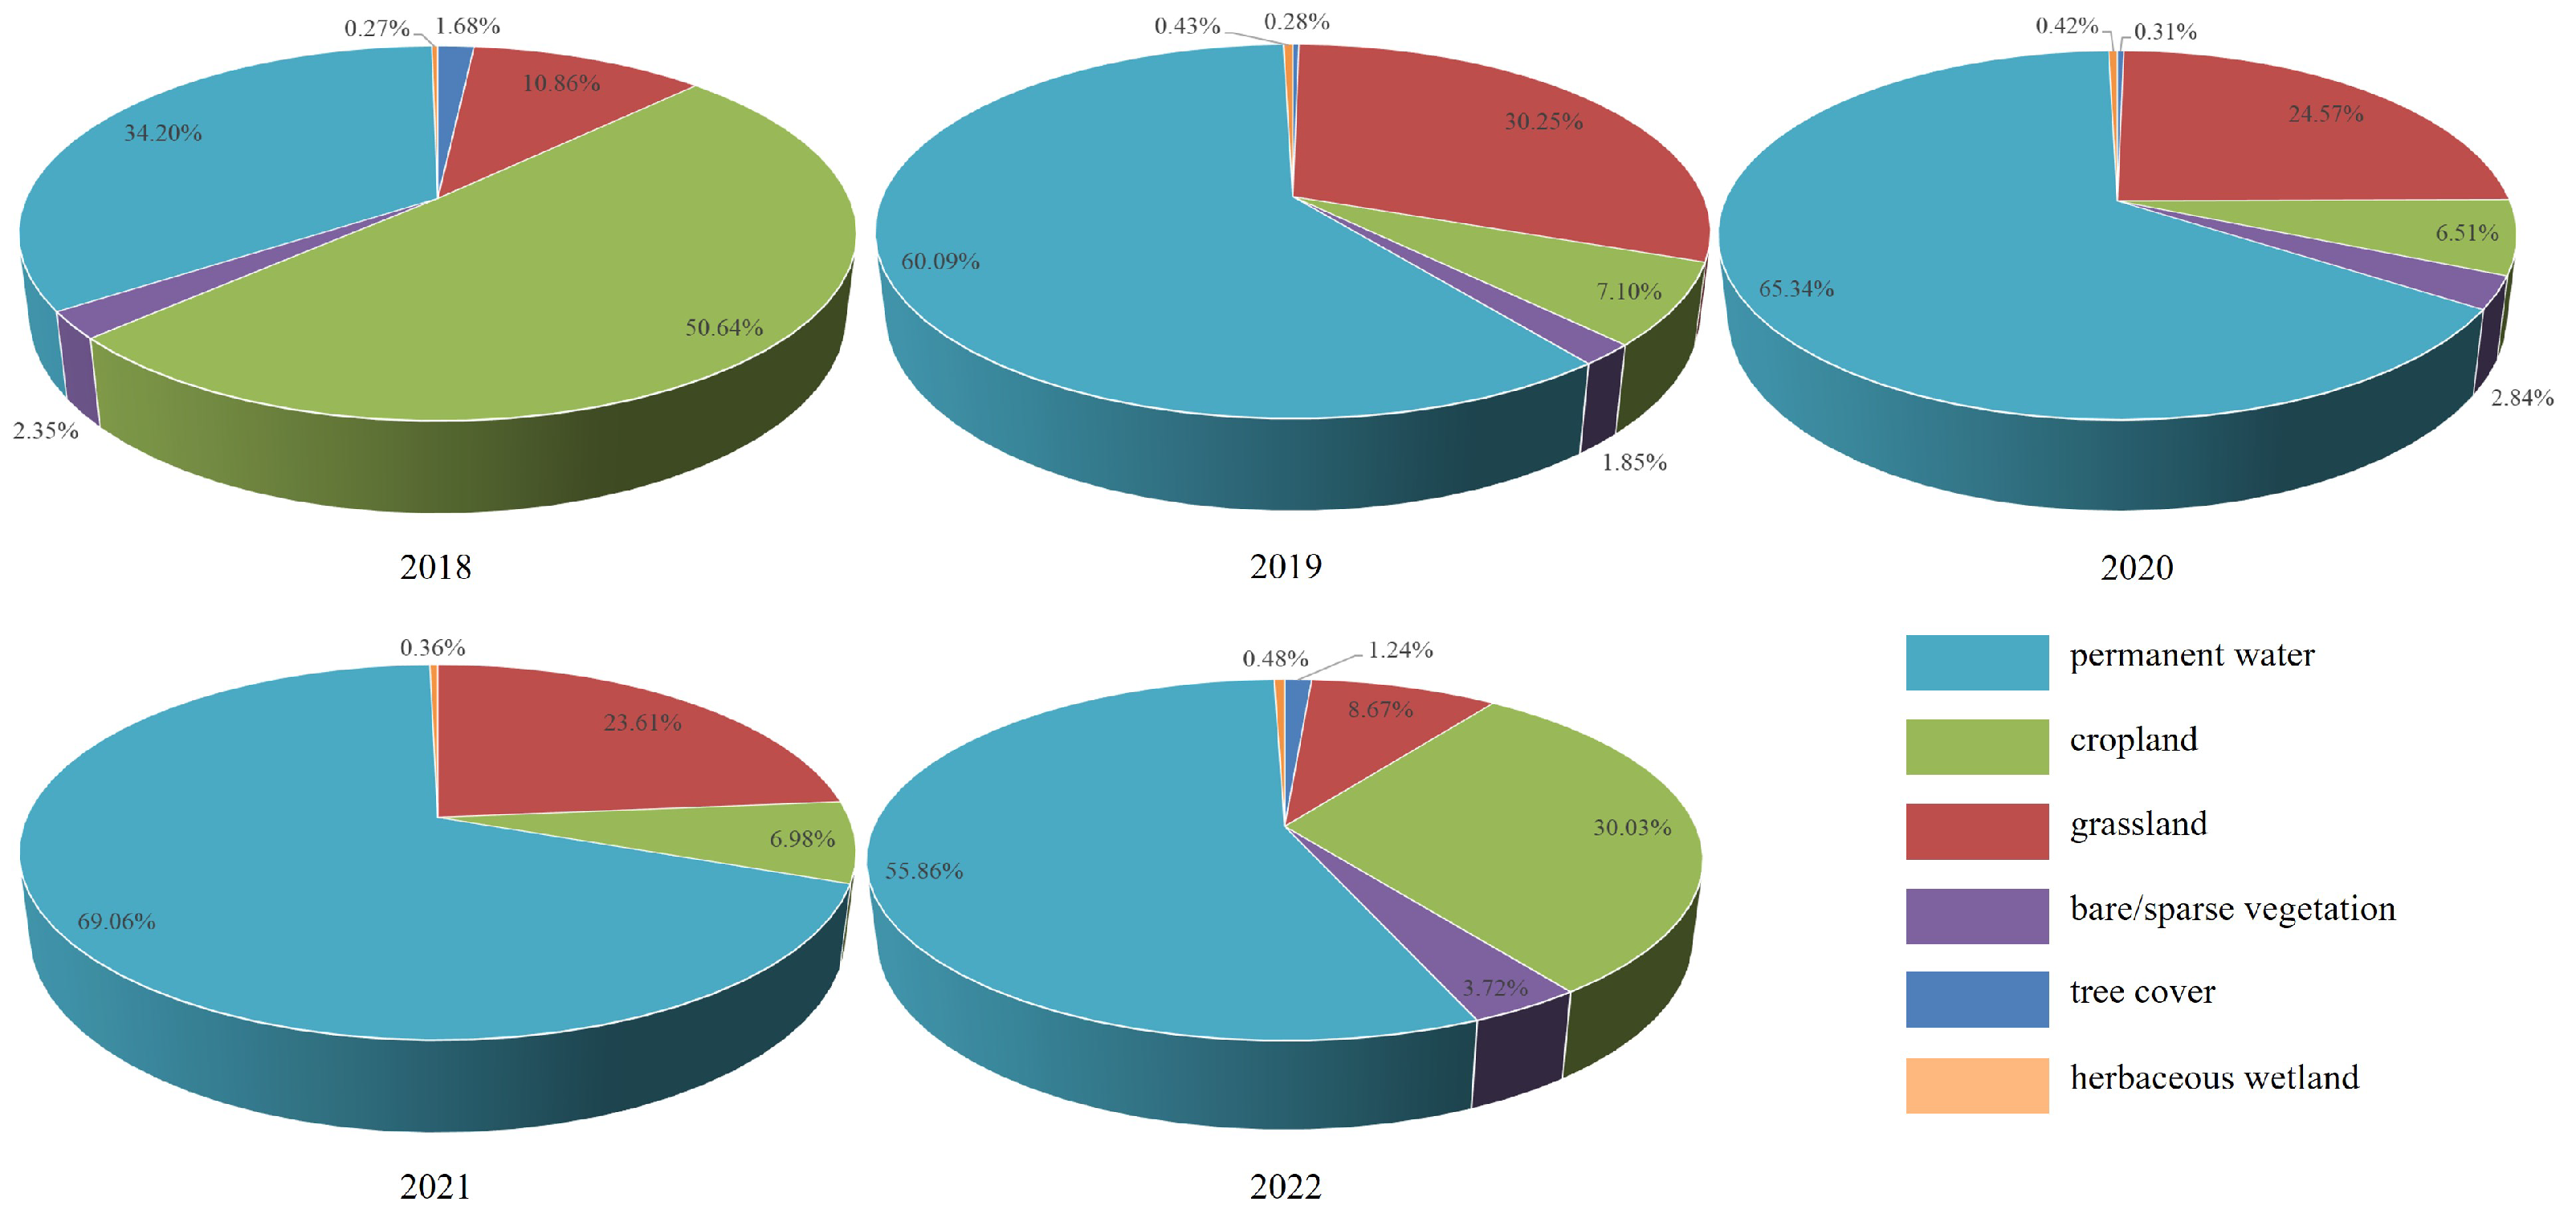
Detailed information on land covers can be observed in Figure 9. Permanent water was the most land cover inundated by floods, which proved that the significant difference of water bodies in temporality was due to the unbalanced rainfall pattern.
From 2018 to 2022, Vientiane experienced severe flooding which impacted various land-cover types in the area. Our analysis focused on the changes in the proportions of cropland, grassland, and permanent water bodies in the flooded areas. In 2018, the cropland was the most affected LULC type, with a proportion of 50.64% of the flooded area, followed by permanent water bodies at 34.2% and grassland at 10.86%. The following years saw significant shifts in the affected LULC types, with permanent water bodies becoming the most affected in 2019–2022, ranging from 55.86% to 69.09% of the flooded area, followed by grassland and cropland. This shift might be attributed to the uneven distribution of rainfall patterns in the area.
4.3. Micro-Scale: Scene Analysis
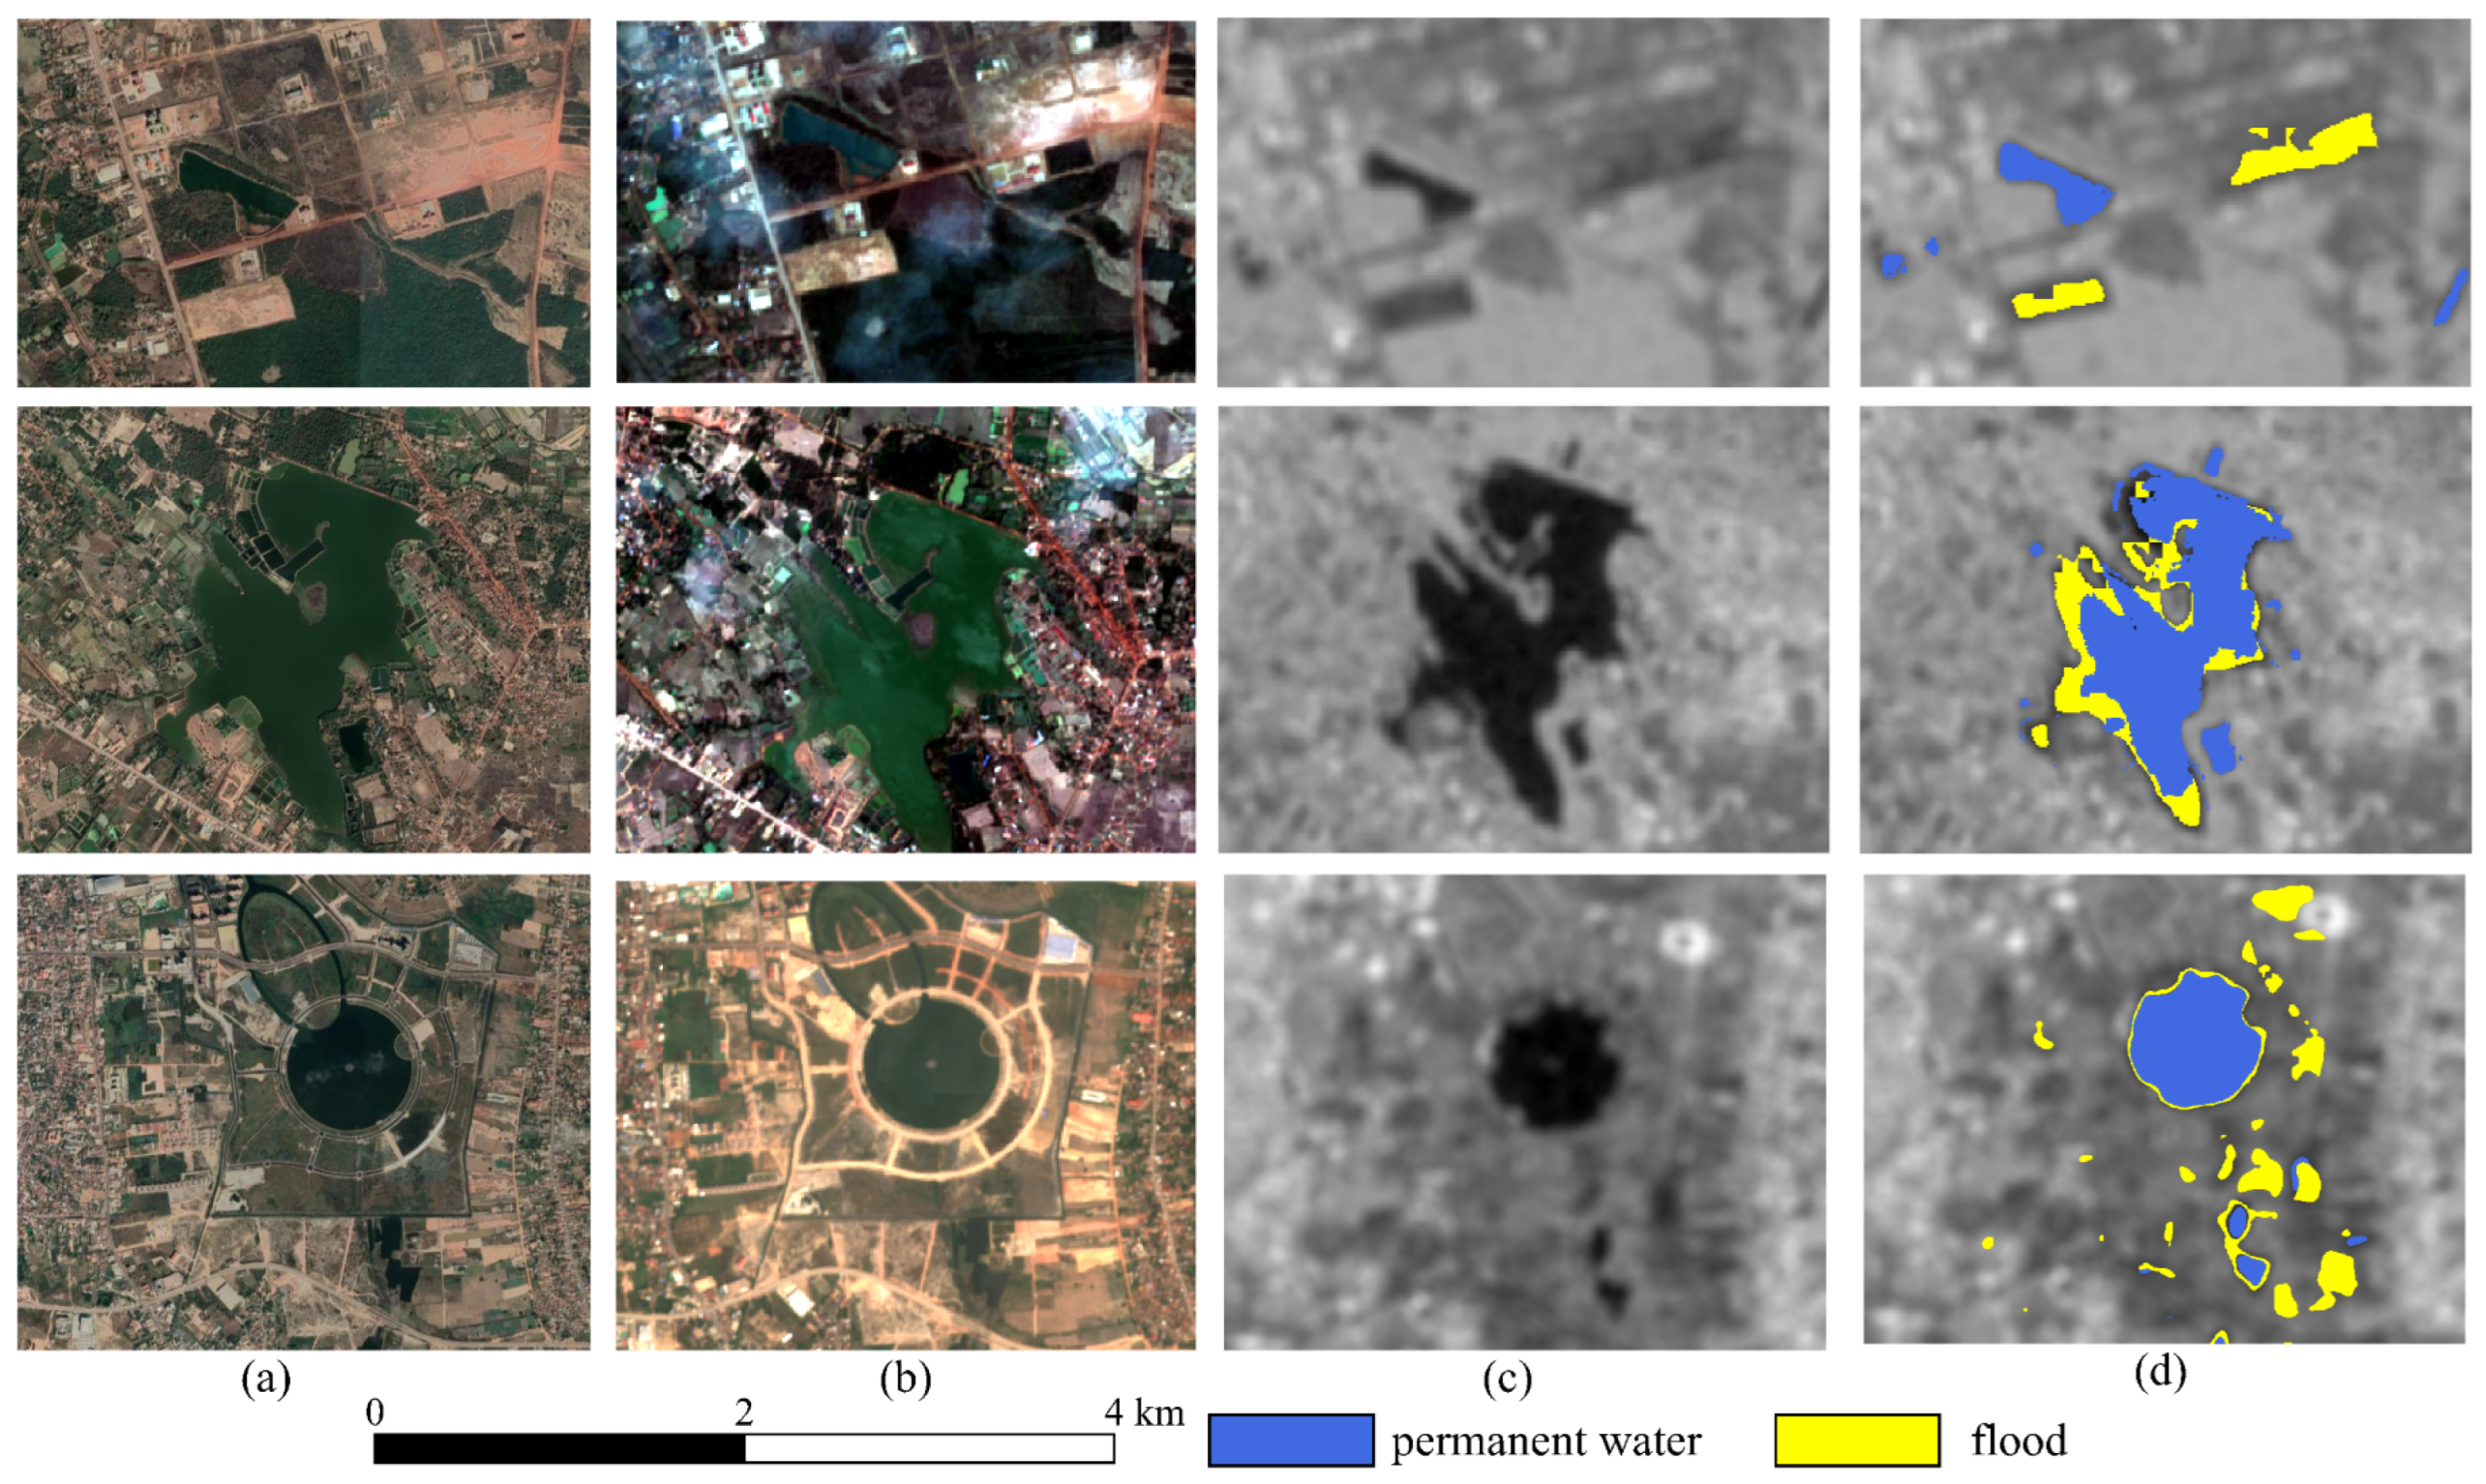
Three lakes situated in the Vientiane region were selected as representative scenarios for a more detailed analysis, as depicted in Figure 10. By comparing multiple remote sensing images from various sources, including Google satellite images, Sentinel-2 images, and near-real-time Sentinel-1 images with the experimental results, the efficacy of the proposed water extraction method in accurately identifying permanent water bodies can be demonstrated. Moreover, based on the extracted permanent water bodies, the proposed method was efficient in identifying flood-prone areas.
It is worth noting that the absence of flood occurrences in the Google satellite and Sentinel-2 images was due to their non-coincidental timing, as influenced by weather and other factors. Overall, the experimental results indicated the scientific and practical value of the proposed method, which holds potential for diverse applications in domains related to water resources management and environmental monitoring.
4.4. Validation
4.4.1. Correlation Analysis
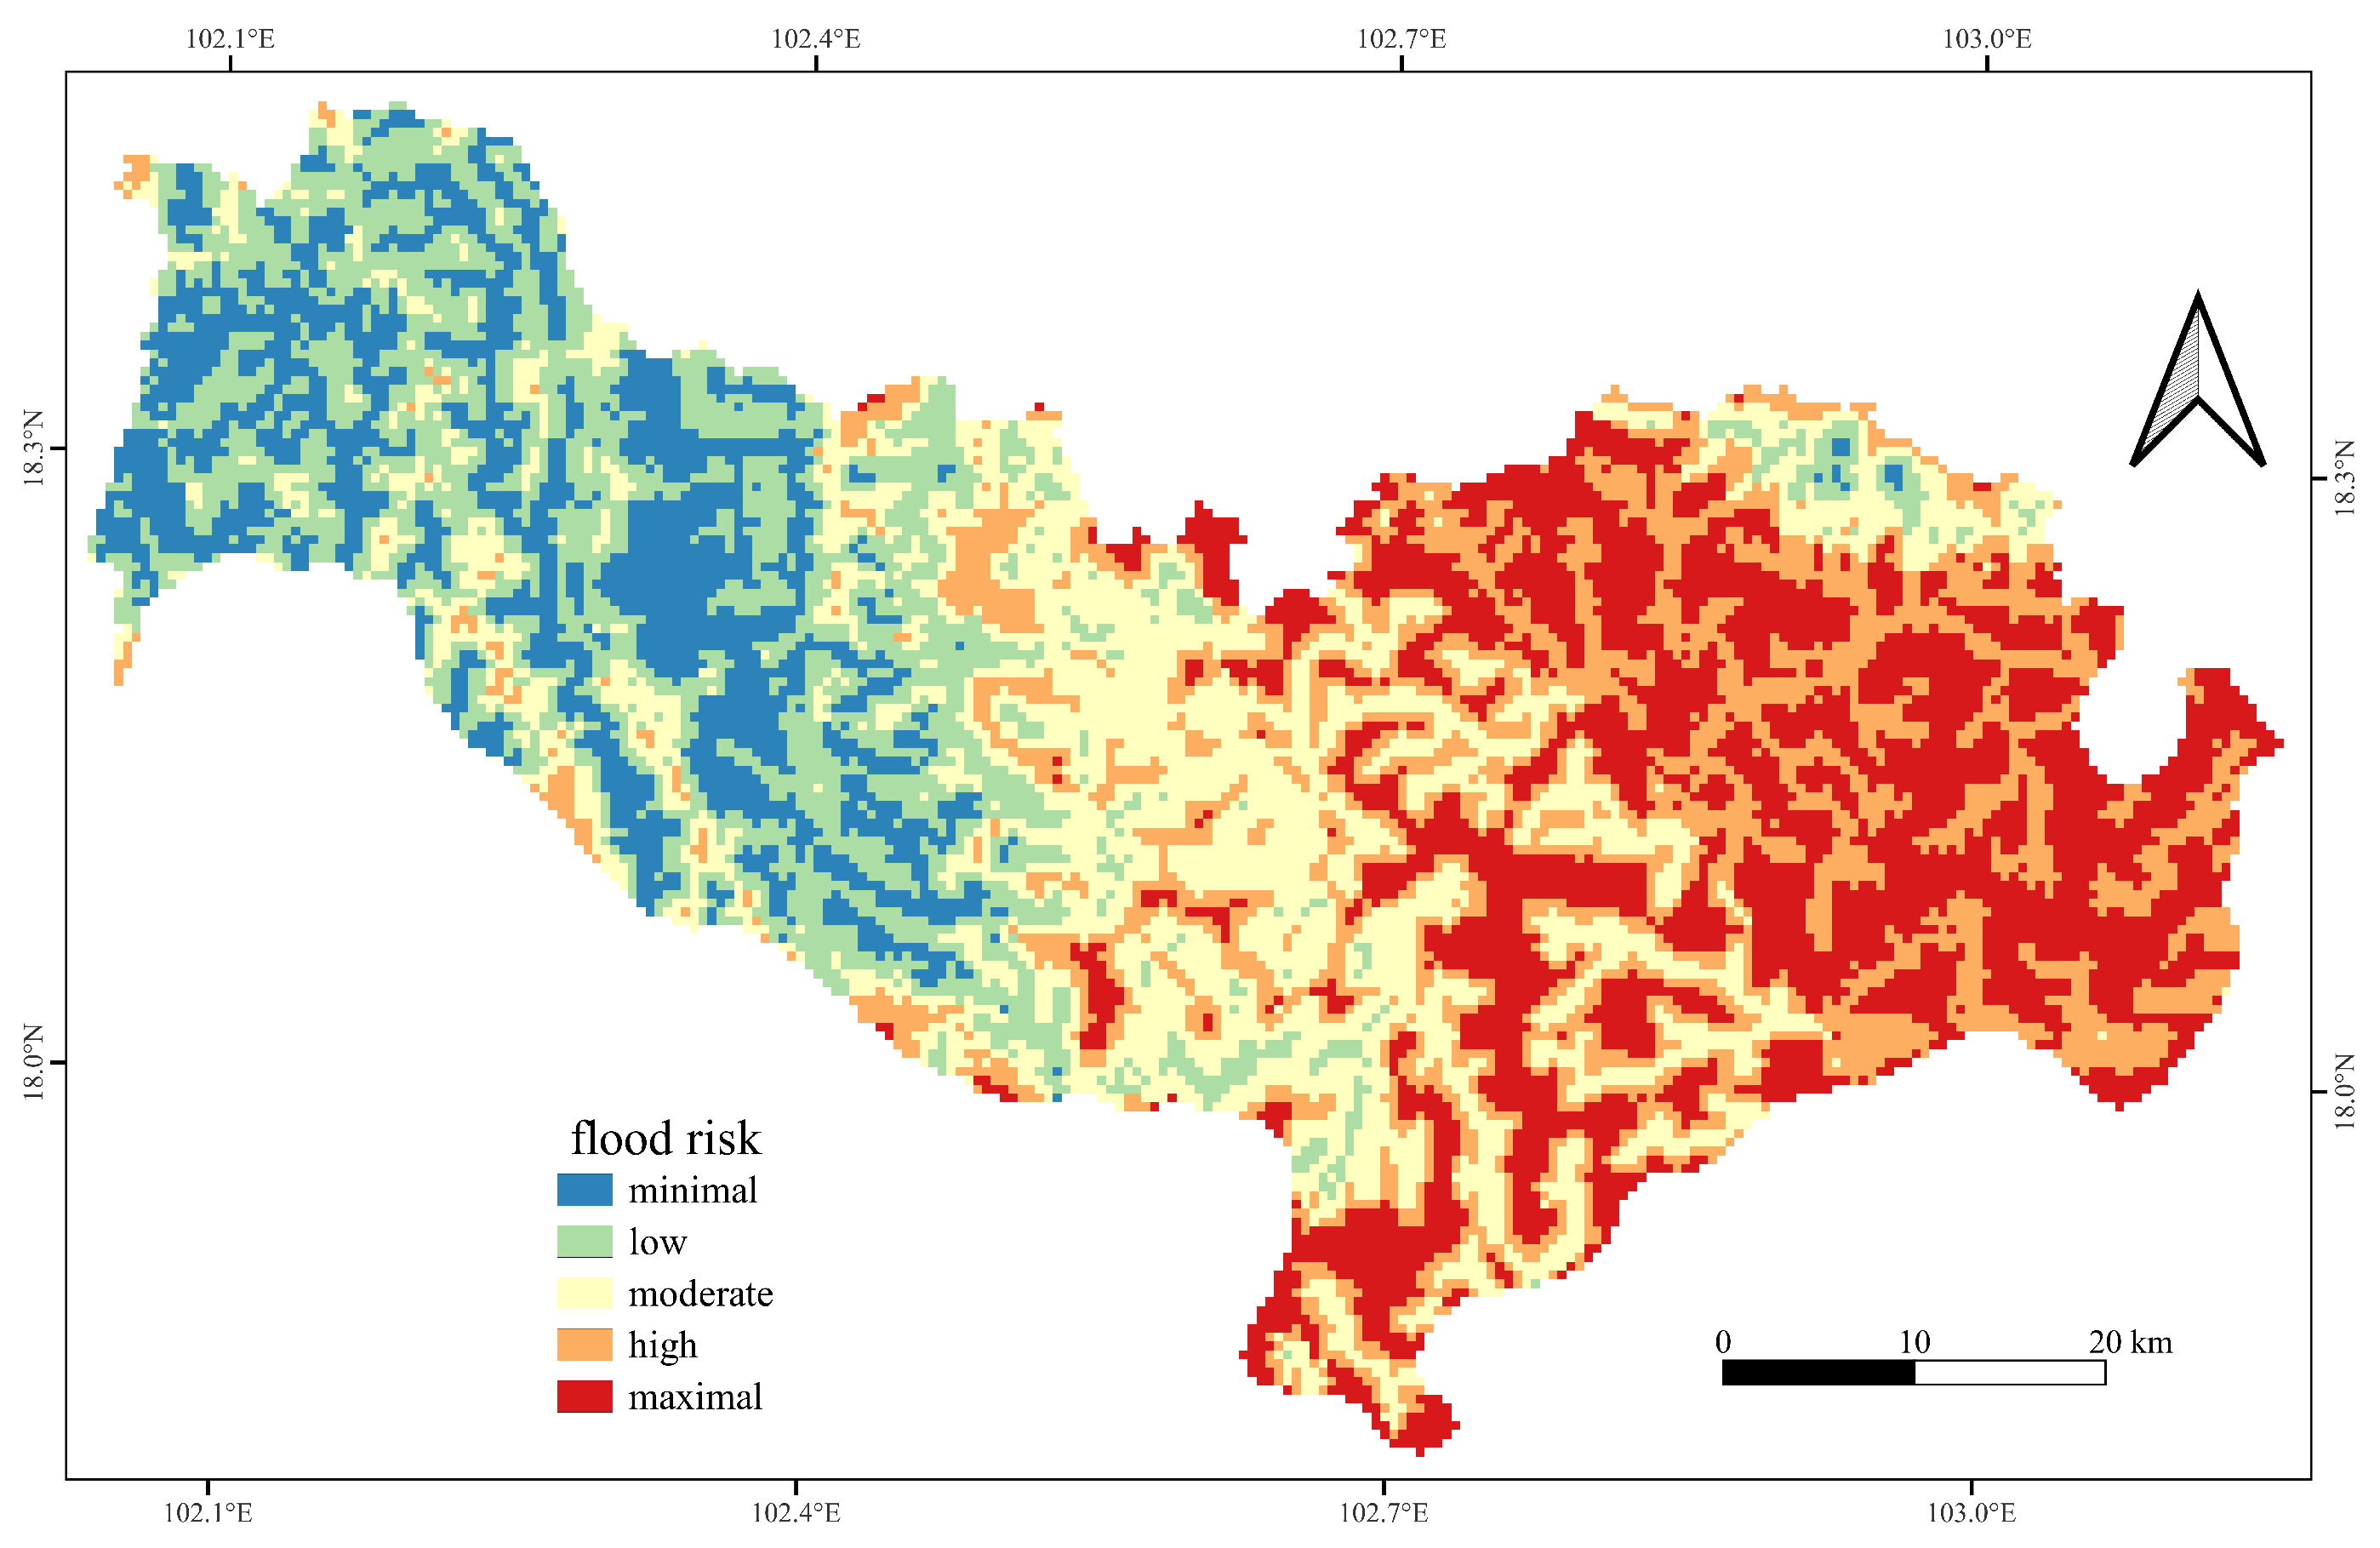
First of all, we generated the flood risk map, shown in Figure 11, and ranked risks into five classes (minimal risk, low risk, moderate risk, high risk, and maximal risk) employing the AHP methodology of Section 3.2. Then, we utilized the Pearson correlation analysis as the chosen statistical approach to quantify the relationship between the flood risk map and the flood monitoring result in the Vientiane subregion of Figure 4. As a result, the final correlation coefficients and p-values from 2018 to 2022 are presented in Figure 12. The mean values of correlation coefficients and p-values in five years were assigned to 0.7144 and 0.021, respectively.
4.4.2. Accuracy Assessment
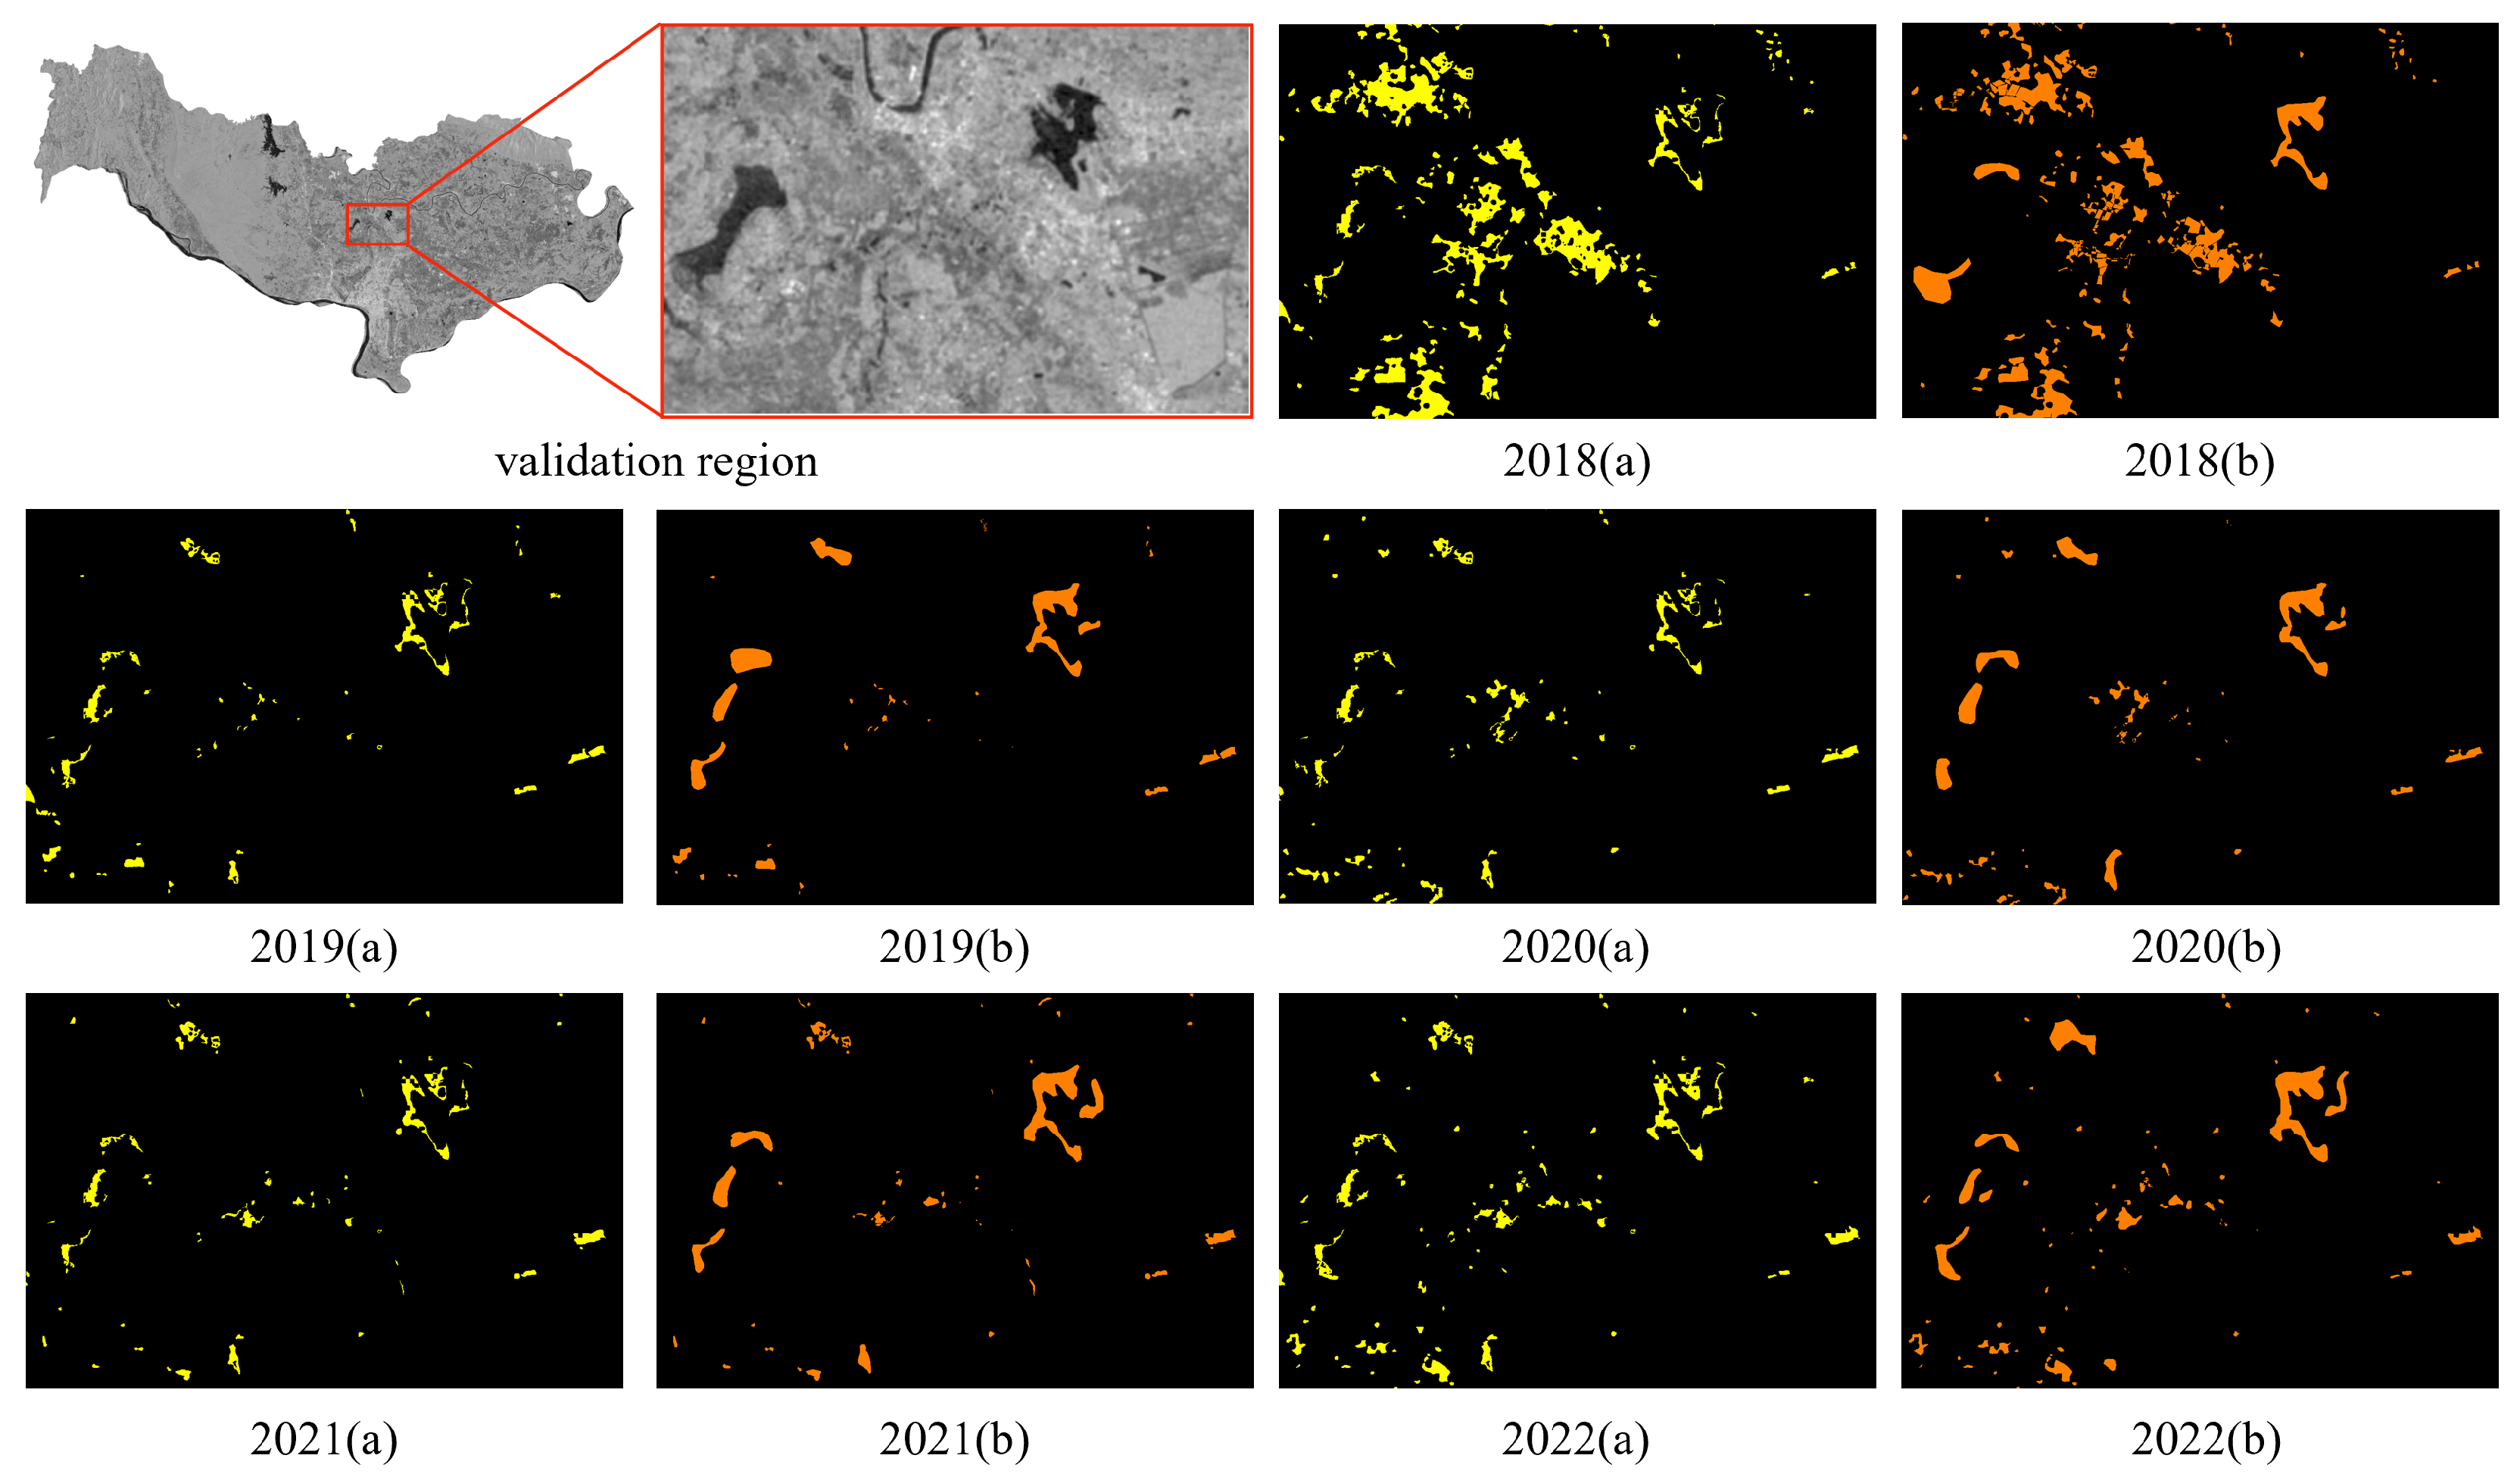
There is little ground truth of flood monitoring results. To validate the flood results extracted in this work, a tiny and typical subregion in Vientiane was selected to annotate flood regions manually in each year, utilizing raw Sentinel images and high resolution google satellite images. Then, three indices (containing overall accuracy (OA), F1 score (F1), and mean Intersection over Union (mIoU)) were adopted to quantify the precision of binary flood results. Specifically, OA could be defined as followed:
In Equation (12), are the number of true positive pixels, true negative pixels, false positive pixels and false negative pixels, respectively. The F1 score could be represented as:
In Equation (15), represents the number of predicted j with a true value of i, and represents the number of categories (including empty classes). is the true quantity. and represent and , respectively.
As shown in Figure 13, there is an excellent spatial consistency between flood results and annotations. The detailed accuracy indices in each year are in the following, below:
Table 4 exhibited the annual values of OA, demonstrating a consistent performance exceeding 0.97 throughout the study period. Furthermore, the efficacy of the proposed methodology in flood detection was further validated by the mIoU and F1 scores. These metrics reinforced the effectiveness of the approach in accurately identifying and assessing flood areas.
5. Discussion
This study provides an end-to-end workflow for flood analysis with the GEE platform, which covers the extraction, validation, and analysis of flood-prone areas in Laos. By integrating multi-source remote sensing data, automated threshold segmentation algorithms, and comprehensive validation techniques, this research provides a robust framework for monitoring and analyzing floods at multiple scales. Furthermore, the proposed method holds promise for the efficient deployment and application in various geographic regions, marking a significant advancement in flood assessment and management.
5.1. Advantage of Our Methodology
In this study, timely and accurate monitoring of flood distribution is achieved with multi-source remote sensing data. Firstly, the SDWI and NDWI indices were computed, and the Otsu algorithm was utilized to determine the threshold for water and non-water body segmentation. This process realizes the effective extraction of water body ranges for each observation period throughout the year. Subsequently, false water pixels were eliminated in all images using the DEM, and the frequency rates of water pixels were determined to generate the preliminary permanent water. Finally, LULC data are considered to correct false permanent water pixels, and the flood areas were accurately extracted. By utilizing multi-source remote sensing data, the flood distribution can be monitored in a timely and accurate manner. Water body ranges for every observation period throughout the year could be effectively extracted with the use of the Otsu algorithm. Moreover, false permanent water pixels were successfully corrected by fusing LULC data, leading to an accurate extraction of flood areas.
In addition, other auxiliary datas such as rainfall data, DEM, river network, and distance from rivers were integrated into the AHP methodology to provide a comprehensive understanding of the factors contributing to flooding and to generating a more accurate flood risk map. The Pearson correlation analysis method was used to validate the effectiveness and scientific rigor of the proposed method by analyzing the relationship between the flood risk and flood results. Additionally, the study conducted a comprehensive analysis of the flood distribution and its impact on the study area from macro, meso, and micro scales. The approach demonstrated its effectiveness and scientific rigor, and can be applied to other areas as a valuable tool for assessing and monitoring flood risk.
A meticulous manual annotation process was employed to generate validation data for a specific region in Vientiane. The rigorous accuracy assessment conducted on the extracted flood areas unequivocally demonstrated their exceptional reliability and precision.
5.2. Limitation of This Work
The proposed flood detection method utilized Sentinel series data, which has a revisit cycle of approximately 12 days, allowing for the frequent monitoring of flood events. However, the suddenness of flood events may limit the effectiveness of this method for real-time flood detection and analysis.
Moreover, the automated Otsu thresholding segmentation technique used in this study relied solely on image intensity values, without considering the temporal and spatial characteristics of the images. Therefore, it may not be optimal for identifying water bodies during flood events. To improve the accuracy and efficiency of the segmentation process, the incorporation of machine learning or deep learning techniques could be beneficial. Such techniques can account for temporal and spatial changes in the images, allowing for the more accurate identification of flooding.
Due to the unavailability of official ground truth data for flood-prone areas in Laos and the absence of relevant data from previous studies, this study focused on a small region within Vientiane for the data annotation and validation of the flood extraction results. This limited scope may introduce a certain degree of error in the accuracy assessment of the methodology.
6. Conclusions
In this study, a fully automated flood monitoring method based on the GEE platform was proposed. Sentinel-1,2 multi-temporal remote sensing images were used to calculate the SDWI and NDWI indices, respectively. The water body segmentation threshold was automatically calculated by the Otsu method. Then, the decision-level fusion was conducted using LULC products, DEM, and its derived data to extract flood areas precisely.
The flood risk level was assessed using the AHP method, which integrated crucial data such as rainfall, DEM, and river network. A correlation analysis was then conducted to compare the flood detection outcomes with the flood risk map. Notably, the proposed method demonstrated an exceptional performance, with an average correlation coefficient of 0.7144 over five years, indicating a high degree of accuracy in predicting flood risk levels. Importantly, the analysis was conducted using data collected from diverse geographical locations, highlighting the robustness and applicability of the proposed method. Additionally, the AHP method facilitated the accurate identification of factors contributing to flood risk, thereby enhancing the understanding of the underlying mechanisms driving the flood risk.
After extracting flood areas, the spatiotemporal distribution characteristics of floods in Laos were comprehensively analyzed at the macro, meso, and micro scales, as well as the monthly and annual scales. The analysis indicated that Laos experiences severe and frequent flood disasters every year, concentrated from May to November at the national level. However, due to the strong government support for infrastructure construction, flood disasters have been decreasing year by year. At the meso-scale, frequent flood disasters in the Vientiane area have seriously affected the local agricultural development.
Moreover, a specific subregion of Vientiane was selected and the flood areas were annotated precisely in this subregion. Subsequently, the flood detection results were evaluated with objective indicators. Over the period of 2018 to 2022, the mean annual values for mIoU, F1, and OA of the proposed method reached an impressive 0.7782, 0.7255, and 0.9854, respectively. The experiment results reveal that the proposed flood detection method can achieve a satisfactory result.
Despite the successful application of the proposed method, there were still some shortcomings. The water body extraction method proposed in this study did not consider spatial features, leading to a large number of fragmented spots, which affected the experimental results. In addition, the flood risk map was limited by the availability of multi-source remote sensing data, such as the lack of information on roads and water depths, resulting in certain errors. In the future, machine learning methods will be adopted to monitor the flood distributions by combining spatiotemporal features, with higher accuracies than before.
Author Contributions
Conceptualization, X.K. and X.G.; methodology, X.G., P.H., X.K. and S.L.; analysis, X.G. and P.H.; writing, X.G., S.Z. and P.H. All authors have read and agreed to the published version of the manuscript.
Funding
This study was supported by the National Key R & D Program of China (2021YFA0715203), the National Natural Science Foundation of China (62221002, 61890962, 61871179), the National Science Foundation of Hunan Province (2020GK2038), the Hunan Provincial Natural Science Foundation for Distinguished Young Scholars (2021JJ022), the Huxiang Young Talents Science and Technology Innovation Program (2020RC3013), and the Defense Industrial Technology Development Program (JCKYS2021604SSJS010, YG-YGBYY-9JY052).
Data Availability Statement
The Sentinel-1,2, DEM data, LULC data and River network data were freely utilized and downloaded from GEE platform. Rainfall data could be freely collected through https://data.ceda.ac.uk/badc/cru/data/cru_ts/ (accessed on 1 January 2021) in Climatic Research Unit (CRU Ts).
Acknowledgments
The authors would like thank Qiusheng Wu and GEE Team for providing convenient APIs and abundunt datasets. The figures in this study were prepared using QGIS 3.26.3.
Conflicts of Interest
The authors declare no conflict of interest.
References
- Floods and Landslides. Available online: worldsaid.com/node/376 (accessed on 27 October 2020).
- Refice, A.; Capolongo, D.; Chini, M.; D’Addabbo, A. Improving Flood Detection and Monitoring through Remote Sensing. Water 2022, 14, 364. [Google Scholar] [CrossRef]
- Brahm Parkash Yadav, A.; Asok Raja, B.; Rahul Saxena, C.; Hemlata Bharwani, D.; Ashok Kumar Das, E.; Ram Kumar Giri, F.; Manik, G.; Deepak Yadav, H. Recent Advances in Pluvial Flash Flood Forecasting of India. Innov. Trends Hydrol. Environ. Syst. 2022, 2022, 605–643. [Google Scholar]
- Theilen-Willige, B.; Mansouri, R. Flooding hazard assessment considering climate change in the coastal areas of Algeria base. In Applications of Space Techniques on the Natural Hazards in the MENA Region; Springer: Berlin/Heidelberg, Germany, 2022; pp. 225–253. [Google Scholar]
- De, A.; Upadhyaya, D.B.; Thiyaku, S.; Tomer, S.K. Use of Multi-sensor Satellite Remote Sensing Data for Flood and Drought Monitoring and Mapping in India. In Civil Engineering for Disaster Risk Reduction; Springer: Berlin/Heidelberg, Germany, 2022; pp. 27–41. [Google Scholar]
- Tavus, B.; Kocaman, S.; Gokceoglu, C. Flood damage assessment with Sentinel-1 and Sentinel-2 data after Sardoba dam break with GLCM features and Random Forest method. Sci. Total Environ. 2022, 816, 151585. [Google Scholar] [CrossRef] [PubMed]
- Ganaie, H.A.; Hashia, H.; Kalota, D. Delineation of Flood Prone Area using Normalized Difference Water Index (NDWI) and Transect Method: A Case Study of Kashmir Valley. Int. J. Remote Sens. Appl. 2013, 3, 53–58. [Google Scholar]
- Dash, P.; Sar, J. Identification and validation of potential flood hazard area using GIS-based multi-criteria analysis and satellite data-derived water index. J. Flood Risk Manag. 2020, 13, e12620. [Google Scholar]
- Gao, B. NDWI—A Normalized Difference Water Index for Remote Sensing of Vegetation Liquid Water from Space. Remote Sens. Environ. 1996, 58, 257–266. [Google Scholar] [CrossRef]
- Xu, H. Modification of normalised difference water index (NDWI) to enhance open water features in remotely sensed imagery. Int. J. Remote Sens. 2006, 27, 3025–3033. [Google Scholar] [CrossRef]
- Jia, S.; Xue, D.; Li, C.; Zheng, J.; Li, W. Study on new method for water area information extraction based on Sentinel-1 data. Yangtze River 2019, 50, 213–217. [Google Scholar]
- Lin, Y.N.; Yun, S.H.; Bhardwaj, A.; Hill, E.M. Urban flood detection with Sentinel-1 multi-temporal synthetic aperture radar (SAR) observations in a Bayesian framework: A case study for Hurricane Matthew. Remote Sens. 2019, 11, 1778. [Google Scholar] [CrossRef]
- Wu, H.; Song, H.; Huang, J.; Zhong, H.; Zhan, R.; Teng, X.; Qiu, Z.; He, M.; Cao, J. Flood Detection in Dual-Polarization SAR Images Based on Multi-Scale Deeplab Model. Remote Sens. 2022, 14, 5181. [Google Scholar] [CrossRef]
- Bonafilia, D.; Tellman, B.; Anderson, T.; Issenberg, E. Sen1Floods11: A georeferenced dataset to train and test deep learning flood algorithms for Sentinel-1. In Proceedings of the 2020 IEEE/CVF Conference on Computer Vision and Pattern Recognition Workshops (CVPRW), Seattle, WA, USA, 14–19 June 2020. [Google Scholar]
- Farhadi, H.; Najafzadeh, M. Flood Risk Mapping by Remote Sensing Data and Random Forest Technique. Water 2021, 13, 3115. [Google Scholar] [CrossRef]
- Wu, Z.; Xue, W.; Xu, H.; Yan, D.; Wang, H.; Qi, W. Urban Flood Risk Assessment in Zhengzhou, China, Based on a D-Number-Improved Analytic Hierarchy Process and a Self-Organizing Map Algorithm. Remote Sens. 2022, 14, 4777. [Google Scholar] [CrossRef]
- Farizawani, A.; Puteh, M.; Marina, Y.; Rivaie, A. A review of artificial neural network learning rule based on multiple variant of conjugate gradient approaches. J. Phys. Conf. Ser. 2020, 1529, 022040. [Google Scholar] [CrossRef]
- Vijay, S.; Kamaraj, K. Prediction of water quality index in drinking water distribution system using activation functions based Ann. Water Resour. Manag. 2021, 35, 535–553. [Google Scholar] [CrossRef]
- Khosravi, K.; Pham, B.T.; Chapi, K.; Shirzadi, A.; Shahabi, H.; Revhaug, I.; Prakash, I.; Bui, D.T. A comparative assessment of decision trees algorithms for flash flood susceptibility modeling at Haraz watershed, northern Iran. Sci. Total. Environ. 2018, 627, 744–755. [Google Scholar] [CrossRef]
- Sahana, M.; Rehman, S.; Sajjad, H.; Hong, H. Exploring effectiveness of frequency ratio and support vector machine models in storm surge flood susceptibility assessment: A study of Sundarban Biosphere Reserve, India. Catena 2020, 189, 104450. [Google Scholar] [CrossRef]
- Teng, J.; Vaze, J.; Dutta, D.; Marvanek, S. Rapid inundation modelling in large floodplains using LiDAR DEM. Water Resour. Manag. 2015, 29, 2619–2636. [Google Scholar] [CrossRef]
- de Almeida, G.A.; Bates, P.; Ozdemir, H. Modelling urban floods at submetre resolution: Challenges or opportunities for flood risk management? J. Flood Risk Manag. 2018, 11, S855–S865. [Google Scholar] [CrossRef] [Green Version]
- Munoz, D.H.; Constantinescu, G. A fully 3-D numerical model to predict flood wave propagation and assess efficiency of flood protection measures. Adv. Water Resour. 2018, 122, 148–165. [Google Scholar] [CrossRef]
- Thakkar, J.J.; Thakkar, J.J. Decision-making trial and evaluation laboratory (DEMATEL). Multi-Criteria Decis. Mak. 2021, 139–159. [Google Scholar]
- Babaei, S.; Ghazavi, R.; Erfanian, M. Urban flood simulation and prioritization of critical urban sub-catchments using SWMM model and PROMETHEE II approach. Phys. Chem. Earth Parts A/B/C 2018, 105, 3–11. [Google Scholar] [CrossRef]
- Yariyan, P.; Avand, M.; Abbaspour, R.A.; Torabi Haghighi, A.; Costache, R.; Ghorbanzadeh, O.; Janizadeh, S.; Blaschke, T. Flood susceptibility mapping using an improved analytic network process with statistical models. Geomat. Nat. Hazards Risk 2020, 11, 2282–2314. [Google Scholar] [CrossRef]
- Sajjad, A.; Lu, J.; Chen, X.; Chisenga, C.; Saleem, N.; Hassan, H. Operational Monitoring and Damage Assessment of Riverine Flood-2014 in the Lower Chenab Plain, Punjab, Pakistan, Using Remote Sensing and GIS Techniques. Remote Sens. 2020, 12, 714. [Google Scholar] [CrossRef] [Green Version]
- Li, K.; Wu, S.; Dai, E.; Xu, Z. Flood loss analysis and quantitative risk assessment in China. Nat. Hazards 2012, 63, 737–760. [Google Scholar] [CrossRef]
- Chau, V.N.; Cassells, S.; Holland, J. Economic impact upon agricultural production from extreme flood events in Quang Nam, central Vietnam. Nat. Hazards 2015, 75, 1747–1765. [Google Scholar] [CrossRef]
- Dutta, D.; Herath, S.; Musiake, K. A mathematical model for flood loss estimation. J. Hydrol. 2003, 277, 24–49. [Google Scholar] [CrossRef]
- Boschetti, M.; Nelson, A.; Nutini, F.; Manfron, G.; Busetto, L.; Barbieri, M.; Laborte, A.; Raviz, J.; Holecz, F.; Mabalay, M.R.O.; et al. Rapid assessment of crop status: An application of MODIS and SAR data to rice areas in Leyte, Philippines affected by Typhoon Haiyan. Remote Sens. 2015, 7, 6535–6557. [Google Scholar] [CrossRef] [Green Version]
- Shrestha, B.B.; Okazumi, T.; Miyamoto, M.; Sawano, H. Flood damage assessment in the Pampanga river basin of the Philippines. J. Flood Risk Manag. 2016, 9, 355–369. [Google Scholar] [CrossRef]
- Okamoto, K.; Yamakawa, S.; Kawashima, H. Estimation of flood damage to rice production in North Korea in 1995. Int. J. Remote Sens. 1998, 19, 365–371. [Google Scholar] [CrossRef]
- Gorelick, N.; Hancher, M.; Dixon, M.; Ilyushchenko, S.; Thau, D.; Moore, R. Google Earth Engine: Planetary-scale geospatial analysis for everyone. Remote Sens. Environ. 2017, 202, 18–27. [Google Scholar] [CrossRef]
- Saaty, R.W. The analytic hierarchy process—what it is and how it is used. Math. Model. 1987, 9, 161–176. [Google Scholar] [CrossRef] [Green Version]
- Otsu, N. A threshold selection method from gray-level histograms. IEEE Trans. Syst. Man Cybern. 1979, 9, 62–66. [Google Scholar] [CrossRef] [Green Version]
Figure 1.
Research area map (small box in bottom left corner), and river map in Vientiane.

Figure 2.
Flood detection and multi-scale analysis framework.

Figure 3.
Pairwise comparison matrix.

Figure 4.
Annual flood in 2019; flood result with SAR image (left); corresponding and cloudless multi-spectral image (right).
Figure 4.
Annual flood in 2019; flood result with SAR image (left); corresponding and cloudless multi-spectral image (right).

Figure 5.
Annual and monthly flood areas.

Figure 6.
Monthly flood areas in Vientiane.

Figure 7.
Flood monitoring maps of 2020 in Vientiane; 3 typical scenes (green, orange, red) are shown in each monthly image.
Figure 7.
Flood monitoring maps of 2020 in Vientiane; 3 typical scenes (green, orange, red) are shown in each monthly image.

Figure 8.
Flood monitoring result and LULC.

Figure 9.
Land cover masked by flooding from 2018 to 2022, in Vientiane.

Figure 10.
Flood areas in the representative scenarios: (a) is google satellite imagery, (b) is Sentinel-2 imagery, (c) is Sentinel-1 imagery, and (d) are flood detection results of the proposed method.
Figure 10.
Flood areas in the representative scenarios: (a) is google satellite imagery, (b) is Sentinel-2 imagery, (c) is Sentinel-1 imagery, and (d) are flood detection results of the proposed method.

Figure 11.
Flood risk map of Vientiane.

Figure 12.
Correlation between flood risk map and flood monitoring map, from 2018 to 2022.

Figure 13.
Flood results and ground truth (a) denotes the flood results; (b) denotes the ground truth annotated manually.
Figure 13.
Flood results and ground truth (a) denotes the flood results; (b) denotes the ground truth annotated manually.


Table 1.
Annual average Otsu threshold values of NDWI and SDWI results.
| Year | NDWI | SDWI |
|---|---|---|
| 2018 | −0.1289 | 0.5206 |
| 2019 | −0.0664 | 0.4897 |
| 2020 | −0.0508 | 0.5226 |
| 2021 | −0.0665 | 0.4842 |
| 2022 | −0.0528 | 0.4258 |
Table 2.
Pairwise importance.
| Value | Importance |
|---|---|
| 1 | Equally important |
| 3 | Slightly more important |
| 5 | Moderately more important |
| 7 | Significantly more important |
| 9 | Strongly more important |
| 2, 4, 6, 8 | Median value of the above |
| Reciprocal | If A/B is 3, then B/A is 1/3 |
Table 3.
Annual and monthly flood areas of different years (km).
| Year | Jan. | Feb. | Mar. | Apr. | May | Jun. | Jul. | Aug. | Sept. | Oct. | Nov. | Dec. | Annual Area |
|---|---|---|---|---|---|---|---|---|---|---|---|---|---|
| 2018 | 59 | 68 | 101 | 167 | 75 | 1123 | 691 | 1703 | 468 | 194 | 122 | 108 | 4258 |
| 2019 | 149 | 197 | 203 | 682 | 216 | 364 | 1906 | 571 | 321 | 163 | 189 | 132 | 4693 |
| 2020 | 248 | 162 | 228 | 488 | 562 | 126 | 62 | 234 | 155 | 313 | 165 | 146 | 2743 |
| 2021 | 50 | 38 | 93 | 194 | 57 | 170 | 225 | 162 | 165 | 208 | 337 | 121 | 1620 |
| 2022 | 72 | 136 | 181 | 533 | 184 | 339 | 234 | 894 | 118 | 924 | 108 | 120 | 3443 |
Table 4.
Accuracy assessment.
| Year | mIoU | F1 | OA |
|---|---|---|---|
| 2018 | 0.8163 | 0.7950 | 0.9743 |
| 2019 | 0.7403 | 0.6603 | 0.9878 |
| 2020 | 0.7702 | 0.7116 | 0.9882 |
| 2021 | 0.7652 | 0.7024 | 0.9891 |
| 2022 | 0.7989 | 0.7581 | 0.9876 |
Disclaimer/Publisher’s Note: The statements, opinions and data contained in all publications are solely those of the individual author(s) and contributor(s) and not of MDPI and/or the editor(s). MDPI and/or the editor(s) disclaim responsibility for any injury to people or property resulting from any ideas, methods, instructions or products referred to in the content. |
© 2023 by the authors. Licensee MDPI, Basel, Switzerland. This article is an open access article distributed under the terms and conditions of the Creative Commons Attribution (CC BY) license (https://creativecommons.org/licenses/by/4.0/).
Share and Cite
MDPI and ACS Style
Hansana, P.; Guo, X.; Zhang, S.; Kang, X.; Li, S. Flood Analysis Using Multi-Scale Remote Sensing Observations in Laos. Remote Sens. 2023, 15, 3166. https://doi.org/10.3390/rs15123166
AMA Style
Hansana P, Guo X, Zhang S, Kang X, Li S. Flood Analysis Using Multi-Scale Remote Sensing Observations in Laos. Remote Sensing. 2023; 15(12):3166. https://doi.org/10.3390/rs15123166
Chicago/Turabian StyleHansana, Phonekham, Xin Guo, Shuo Zhang, Xudong Kang, and Shutao Li. 2023. "Flood Analysis Using Multi-Scale Remote Sensing Observations in Laos" Remote Sensing 15, no. 12: 3166. https://doi.org/10.3390/rs15123166
Note that from the first issue of 2016, this journal uses article numbers instead of page numbers. See further details here.