
Worst-Case Integrity Risk Sensitivity for RAIM with Constellation Modernization
College of Intelligent System Science and Engineering, Harbin Engineering University, Harbin 150001, China
*
Author to whom correspondence should be addressed.
Remote Sens. 2023, 15(12), 2979; https://doi.org/10.3390/rs15122979
Submission received: 23 March 2023
/
Revised: 2 May 2023
/
Accepted: 2 June 2023
/
Published: 7 June 2023
(This article belongs to the Special Issue Advanced Technologies for Position and Navigation under GNSS Signal Challenging or Denied Environments II)
Abstract
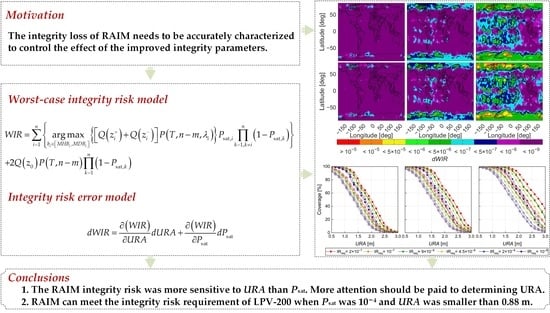
:The integrity improvement of receiver autonomous integrity monitoring (RAIM) can benefit from a combination of constellations. With the rapid development of constellation modernization, integrity parameters, including the probability of satellite fault (Psat) and user range accuracy (URA), have improved. The integrity loss of RAIM needs to be accurately characterized to control the effect of the improved integrity parameters. To reveal the sensitivity of integrity risk with respect to Psat and URA, a conservative integrity risk estimation method is proposed based on the worst-case protection concept. Acceptable Psat and URA were derived by comparing the estimated worst-case integrity risk with the required integrity risk. The simulation results showed that RAIM can meet the integrity risk requirement of LPV-200 when Psat was 10−4 and URA was smaller than 0.88 m.
1. Introduction
A combination of constellations significantly increases the number of satellites and enhances the integrity performance of global navigation satellite systems (GNSS) [1,2]. With the implementation of the global positioning system (GPS) modernization program and the advancement of Beidou navigation satellite system (BDS), the ground facilities of GNSS and satellite manufacturing have been upgraded [3]. The prospect of better satellite geometry, more satellites, higher signal-in-space (SIS) accuracy, and lower probability of satellite fault can be therefore anticipated [4,5]. Based on the GPS Standard Positioning Service Performance Standard released in 2008 and 2020, the 95% global user range error (URE) under a nominal state improved from 6.0 to 3.8 m [6,7]. The probability of a GPS single-satellite fault Psat and multiple-satellite faults Pconst are 10−5 and 10−8 [7], respectively. Since 2018, the characterization of GPS anomalies has revealed Psat to be 1.5 × 10⁻⁶ and Pconst to be less than or equal to 3.8 × 10⁻⁶ [8]. The user range accuracy (URA) of GPS satellites, except for SVN 39, is below 1.0 m based on data analysis from 2008 to 2022 [9]. Through the statistical analysis of six years of data [10], the satellite fault probability of BDS was conservatively computed to be on the order of 10−3 and 10−4, with URA ranging from about 0.6 to 2.2 m. The BDS SIS performance analysis revealed fault rates between 4 × 10⁻⁵ and 3.5 × 10⁻⁴ for BDS-3 satellites. Meanwhile, the majority of BDS-3 satellites have a URA of about 1.0 m [11]. It is clear that the modernization of the GPS and BDS constellations significantly enhanced user range accuracy and reduced the probability of satellite faults. The influence of these improvements on integrity cannot be disregarded.
Integrity is indispensable for safety-of-life (SoL) navigational applications, so receiver autonomous integrity monitoring (RAIM) was developed to resist threats and increase the level of integrity [12,13]. Integrity parameters determine RAIM performance, but if they are overly conservative they will reduce the availability of navigation applications. In contrast, overly optimistic integrity parameters could be misleading and even threaten user safety [14]. Confronted with an increasingly better Psat and URA, the integrity performance needs be characterized and the improved parameters need to be revisited to constrain any integrity loss.
Integrity risk (IR) is a critical metric for evaluating the integrity performance of RAIM [15], and the computation methods can be classified into two groups. The first group calculates the ratio of the number of integrity failure samples to the total number of samples. This method can obtain an accurate integrity risk because there is no limit to the distribution of samples; however, it requires long-term observation to obtain large samples, which may be impractical when implementing a very small probability such as 10−7. From the basic concept of integrity risk, the second group computes the probability of integrity failure by assuming a statistical distribution of samples such as Gaussian [16,17]. Since the first group of methods requires a sufficient number of samples and it would be unacceptable if the effect of different parameters on integrity risk needed to be accounted for. In contrast, the Gaussian distribution-based method requires fewer samples and can intuitively quantify the relationship between integrity risk and its parameters. Therefore, we computed RAIM integrity risk based on the Gaussian distribution. Using the worst-case protection concept, a conservative estimation method of worst-case integrity risk (WIR) was developed to obtain the maximum integrity loss caused by the improved integrity parameters.
Sensitivity analysis is an effective approach for studying the effect of the parameters on integrity risk. El-Mowafy et al. [18] conducted a sensitivity analysis on the availability of advanced RAIM (ARAIM) using real-world data from monitoring stations in Australia, and he demonstrated that a combination of GPS and BDS significantly improved availability. To clarify the impact of the integrity support message (ISM) on ARAIM performance, Lee et al. [19,20] used a sensitivity analysis to prove that GPS constellation integrity parameters had a significant impact on ARAIM performance. A corresponding analysis was carried out to assess the impact of different integrity parameters on ARAIM performance with BDS in the Asia-Pacific region [21]. A sensitivity analysis of RAIM is still absent according to our best knowledge. Although the baseline concept in this contribution was motivated by Lee et al. [19,20], the sensitivity analysis of RAIM is still necessary because of its stronger autonomy and greater number of applications in the GNSS community relative to ARAIM. Moreover, the effect of integrity parameters on RAIM is different from ARAIM because the protection levels are constructed to deal with different integrity risk resources. Specifically, besides the threat of satellite failure, which is the focus of RAIM, ARAIM also needs to account for atmospheric anomalies because ARAIM aims to satisfy higher grades of RNP in civil aviation than RAIM. To achieve the robust result of sensitivity analysis, we conducted a RAIM integrity risk sensitivity analysis based on the proposed WIR method to restrict the integrity loss caused by the improved Psat and URA.
A conservative integrity risk estimation method is proposed based on the worst-case protection concept. The sensitivity of worst-case integrity risk to Psat and URA is analyzed. Acceptable Psat and URA are provided for different integrity risk requirements. Finally, we analyze the simulation experiment results and summarize the research findings.
2. Integrity Risk Estimation for RAIM
Integrity risk, also called the probability of hazardous misleading information (PHMI), is defined as the probability that a position error exceeds the alarm limit (AL) or the protect levels and test statistic remain below the detection threshold [16]:
where δ represents the position error; l is the alarm limit; t and T are the test statistic and detection threshold of RAIM, respectively. The integrity risk of RAIM based on (1) can be estimated when given the statistical distribution of position error δ and test statistic t. Generally, the nominal observation error is assumed to have a zero mean Gaussian distribution with a STD observation error σ determined by URA, and the tropospheric-delay and the user-related errors. With the least-squares estimator, the position error and test statistic distributions can be characterized by
where the subscript i and q indicate the ith satellite and the qth state, respectively; n is the number of satellite signals tracked; m is the number of states to be estimated; bi is the fault-induced bias of the ith satellite and is absent under the nominal mode, where the position error and test statistic follow the zero mean Gaussian distribution and chi-square distribution, respectively. Under the fault mode, the position error follows the non-zero mean Gaussian distribution, and the test statistic follows the non-central chi-square distribution. is the transformation matrix from the observation domain to the position domain; G is the geometry matrix determined by satellite geometry and the user’s location; is the STD observation error for state q; is the non-centrality parameter; and is the transformation matrix from the observation domain to the RAIM detection domain.
The statistical distribution of position error and test statistic is independent of each other based on the least-squares estimator [17]. The integrity risk can be computed under the mutually exclusive and exhaustive fault mode
where P(Hi) is the probability of the fault mode Hi, which may be the nominal or fault mode. The integrity risk can be computed as the product of the probability of position error exceeding the alarm limit and the probability of the test statistic beyond the detection threshold. Provided the probability of the ith satellite fault is Psat,i, the integrity risk in (3) can be expressed as follows under the single-satellite fault mode:
where is the tail cumulative distribution function (CDF) at z of a standard Gaussian distribution; is the non-central chi-square CDF at T, with n-m degree of freedom and non-central parameter λi; is the chi-square CDF at T with an n-m degree of freedom; and , and are defined as
From (4), the RAIM integrity risk is jointly determined by the probability of the position error exceeding the alert limit in the position domain and detection fails in the detection domain, while the baseline ARAIM computes integrity risk through the bounding and manipulating of inequalities in the position domain. The effect of the integrity parameters on RAIM is therefore different from those for ARAIM. The integrity-related parameters involved in (4) can be divided into four groups as follows:
- The first group of parameters is the fault-induced bias bi, which is impractical to obtain accurately. However, based on the worst-case protection concept, the effect of the bias on the integrity risk can be strictly determined.
- The second group includes the parameters benefiting from the improvement in the aspects of SIS performance and probability of satellite fault, i.e., URA and Psat. This second group will improve with the constellation modernization. The integrity loss introduced by the improved second group of parameters needs to be strictly characterized, which is the focus of this contribution.
- The third group is determined by the positioning, integrity and continuity requirement, including the alert limit and the probabilities of false alarm (Pfa) and missed detection (Pmd). The third group of parameters is generally constant for the specific required navigation performance (RNP): e.g., the different flight phases in civil aviation defined by the international civil aviation organization (ICAO).
- The fourth group of parameters is the satellite geometry, which has a great impact on integrity performance. The influence of satellite geometry on the integrity performance cannot be neglected.
To investigate the integrity loss resulting from improved parameters in the second group, we needed to consider the impact of the first, third, and fourth group of parameters on the integrity risk. In the following section, we introduce the concept of worst-case integrity risk by varying the magnitude of the first group of parameters to acquire the maximum risk. Based on it, the integrity risk error with respect to Psat and URA was deduced. The integrity loss introduced by the improved second group of integrity parameters can be therefore strictly characterized. The effect of the third and fourth group of parameters on integrity performance will be analyzed through a global simulation experiment.
3. Worst-Case Integrity Risk and Sensitivity Determination
To investigate the effect of the improved Psat and URA on the integrity risk, the first group of parameters, i.e., the fault-induced bias bi, should be strictly determined. The concept of worst-case bias (WCB) was used to acquire the worst-case integrity risk. The minimum hazardous bias (MHB) and the minimum detectable bias (MDB) can be calculated according to the requirements of Pfa and Pmd. MHB and MDB can be defined as [22]
where kmd is the quantile of Gaussian distribution that meets the requirement of Pmd; λ is the non-central parameter determined by Pfa and Pmd; MHBi is the minimum bias leading to integrity risk; and MDBi is the minimum detectable bias of RAIM. When bias bi is within [MHBi, MDBi], the fault-induced bias cannot be detected by RAIM and yields the integrity risk.
Under the different fault modes, WCB is defined as the bias with maximum integrity risk. Based on the worst-case protection concept, the worst-case integrity risk can be computed as the maximum integrity risk under different fault modes,
WIR is a conservative metric to estimate the integrity risk given the three groups of parameters, and acceptable integrity parameters can be obtained by comparing WIR with the required integrity risk. The integrity loss introduced by inaccurate integrity parameters can be strictly characterized. By assuming the probability of different satellite faults is identical, the worst-case integrity risk error with respect to the second group of parameters can be analytically derived as
where dWIR represents the error of WIR, i.e., the integrity loss, and dURA and dPsat represent the error of URA and Psat, which are the difference results of the selected parameters minus the true parameters. If the results are greater than zero, the selected parameters are conservative. In contrast, the selected parameters are optimistic if the results are smaller than zero. and represent the partial derivatives of WIR with respect to URA and Psat:
where c1, c2 and c3 are defined as
is defined as
where and are the modified Bessel function of the first kind of and order, respectively. The detailed derivation is shown in Appendix A. It can be found that the worst-case integrity risk error can be expressed as a linear combination of the URA and Psat errors. Based on (8), the sensitivity of URA and Psat on the worst-case integrity risk error can be determined.
To characterize the RAIM integrity loss resulting from the improved integrity parameters, a conservative integrity risk estimation method was proposed based on worst-case protection. The integrity-related parameters were categorized into three groups. The worst-case integrity risk was calculated by constraining the first group of parameters. By deriving the worst-case integrity risk error introduced by the improved Psat and URA, the sensitivity of Psat and URA on the worst-case integrity risk was determined. The acceptable Psat and URA were obtained by comparing the worst-case integrity risk and the required integrity risk.
4. Simulation and Analysis
To investigate the impact of the improved second group of parameters (Psat and URA on the RAIM integrity risk) the global integrity risk simulation experiment was conducted based on the proposed worst-case integrity risk method. The impact of satellite geometry and the third group of parameters on the integrity loss caused by the improved second group of parameters was discussed. By comparing the global worst-case integrity risk simulation result and integrity risk requirement, the acceptable second group of parameters was provided.
We mainly focused on the vertical direction because that is where the geometric diversity of the satellite constellation was the poorest [23], causing a vertical integrity risk larger than for the horizontal. The following error model was used to describe the STD of the ith satellite observation error [24]:
where, σtrop,i and σuser,i are the STD tropospheric delay and user related errors, which are defined in [25]. URA is currently recommended to range from 0.5 to 2.5 m for GPS and BDS, respectively [9,10,11,24,25,26]. Considering practical application, we mainly discussed the influence of URA from 0.5 to 3.5 m on integrity risk performance. Moreover, the URA of 1.0, 1.5 and 2.0 m were specially chosen for discussing the integrity loss caused by improved URA. The Psat for GPS satellites ranged from 10−5 to 10−4 according to [7,8,24,26,27] and for BDS it was usually from 10−3 to 10−4 [10,11,26,28]. Three different orders of Psat (10−5, 10−4 and 10−3) were selected to indicate the GPS and BDS constellation performance.
We mainly focused on the integrity risk requirement of 10−7 for LPV-200. According to the minimum operational performance standards (MOPS) promulgated by RTCA [29], the third group of parameters—Pfa, Pmd and VAL—were chosen as 10−5, 10−3 and 35 m, respectively. The vertical integrity risk requirement of LPV-200 was allocated as 9 × 10⁻⁸ [30]. A stricter requirement of vertical integrity risk should have been considered in this contribution because we only accounted for the single-satellite fault mode. We assume that the single-satellite fault mode is allocated half of the vertical integrity risk requirement of LPV-200: 4.5 × 10⁻⁸.
Based on the open-source software MAAST of Stanford University (https://gps.stanford.edu/resources/software-tools/maast, accessed on 4 June 2023), the GPS and BDS dual constellations were used for the global simulation experiment. The GPS almanac contained in MAAST was used, including 24 MEO satellites. The BDS almanac was provided by the Test and Assessment Research Center of China Satellite Navigation Office (http://www.csno-tarc.cn/system/almanac, accessed on 4 June 2023), including 24 MEO and 3 IGSO satellites. The global simulation experiment parameters are shown in Table 1. The global simulation experiment was based on a 5 × 5° user grid, for 10 days with a sampling interval of 10 min, which generated 1440 worst-case integrity samples per user grid. The cut-off elevation angle was set to 10° to balance observation accuracy and the visible satellite. At each user grid, the 99.5 percentile of the worst-case integrity risk over the simulation duration was selected to show the worst-case integrity risk performance. The availability of a grid point was obtained by calculating the ratio of epochs where the WIR was smaller than the required IRreq to the total number of epochs during the simulation. The global availability coverage was used as the metric to reflect the global integrity performance, which was calculated as the ratio between the number of user grids with the worst-case integrity risk being smaller than the required integrity risk and total number of grids.
4.1. Impact of URA and Psat
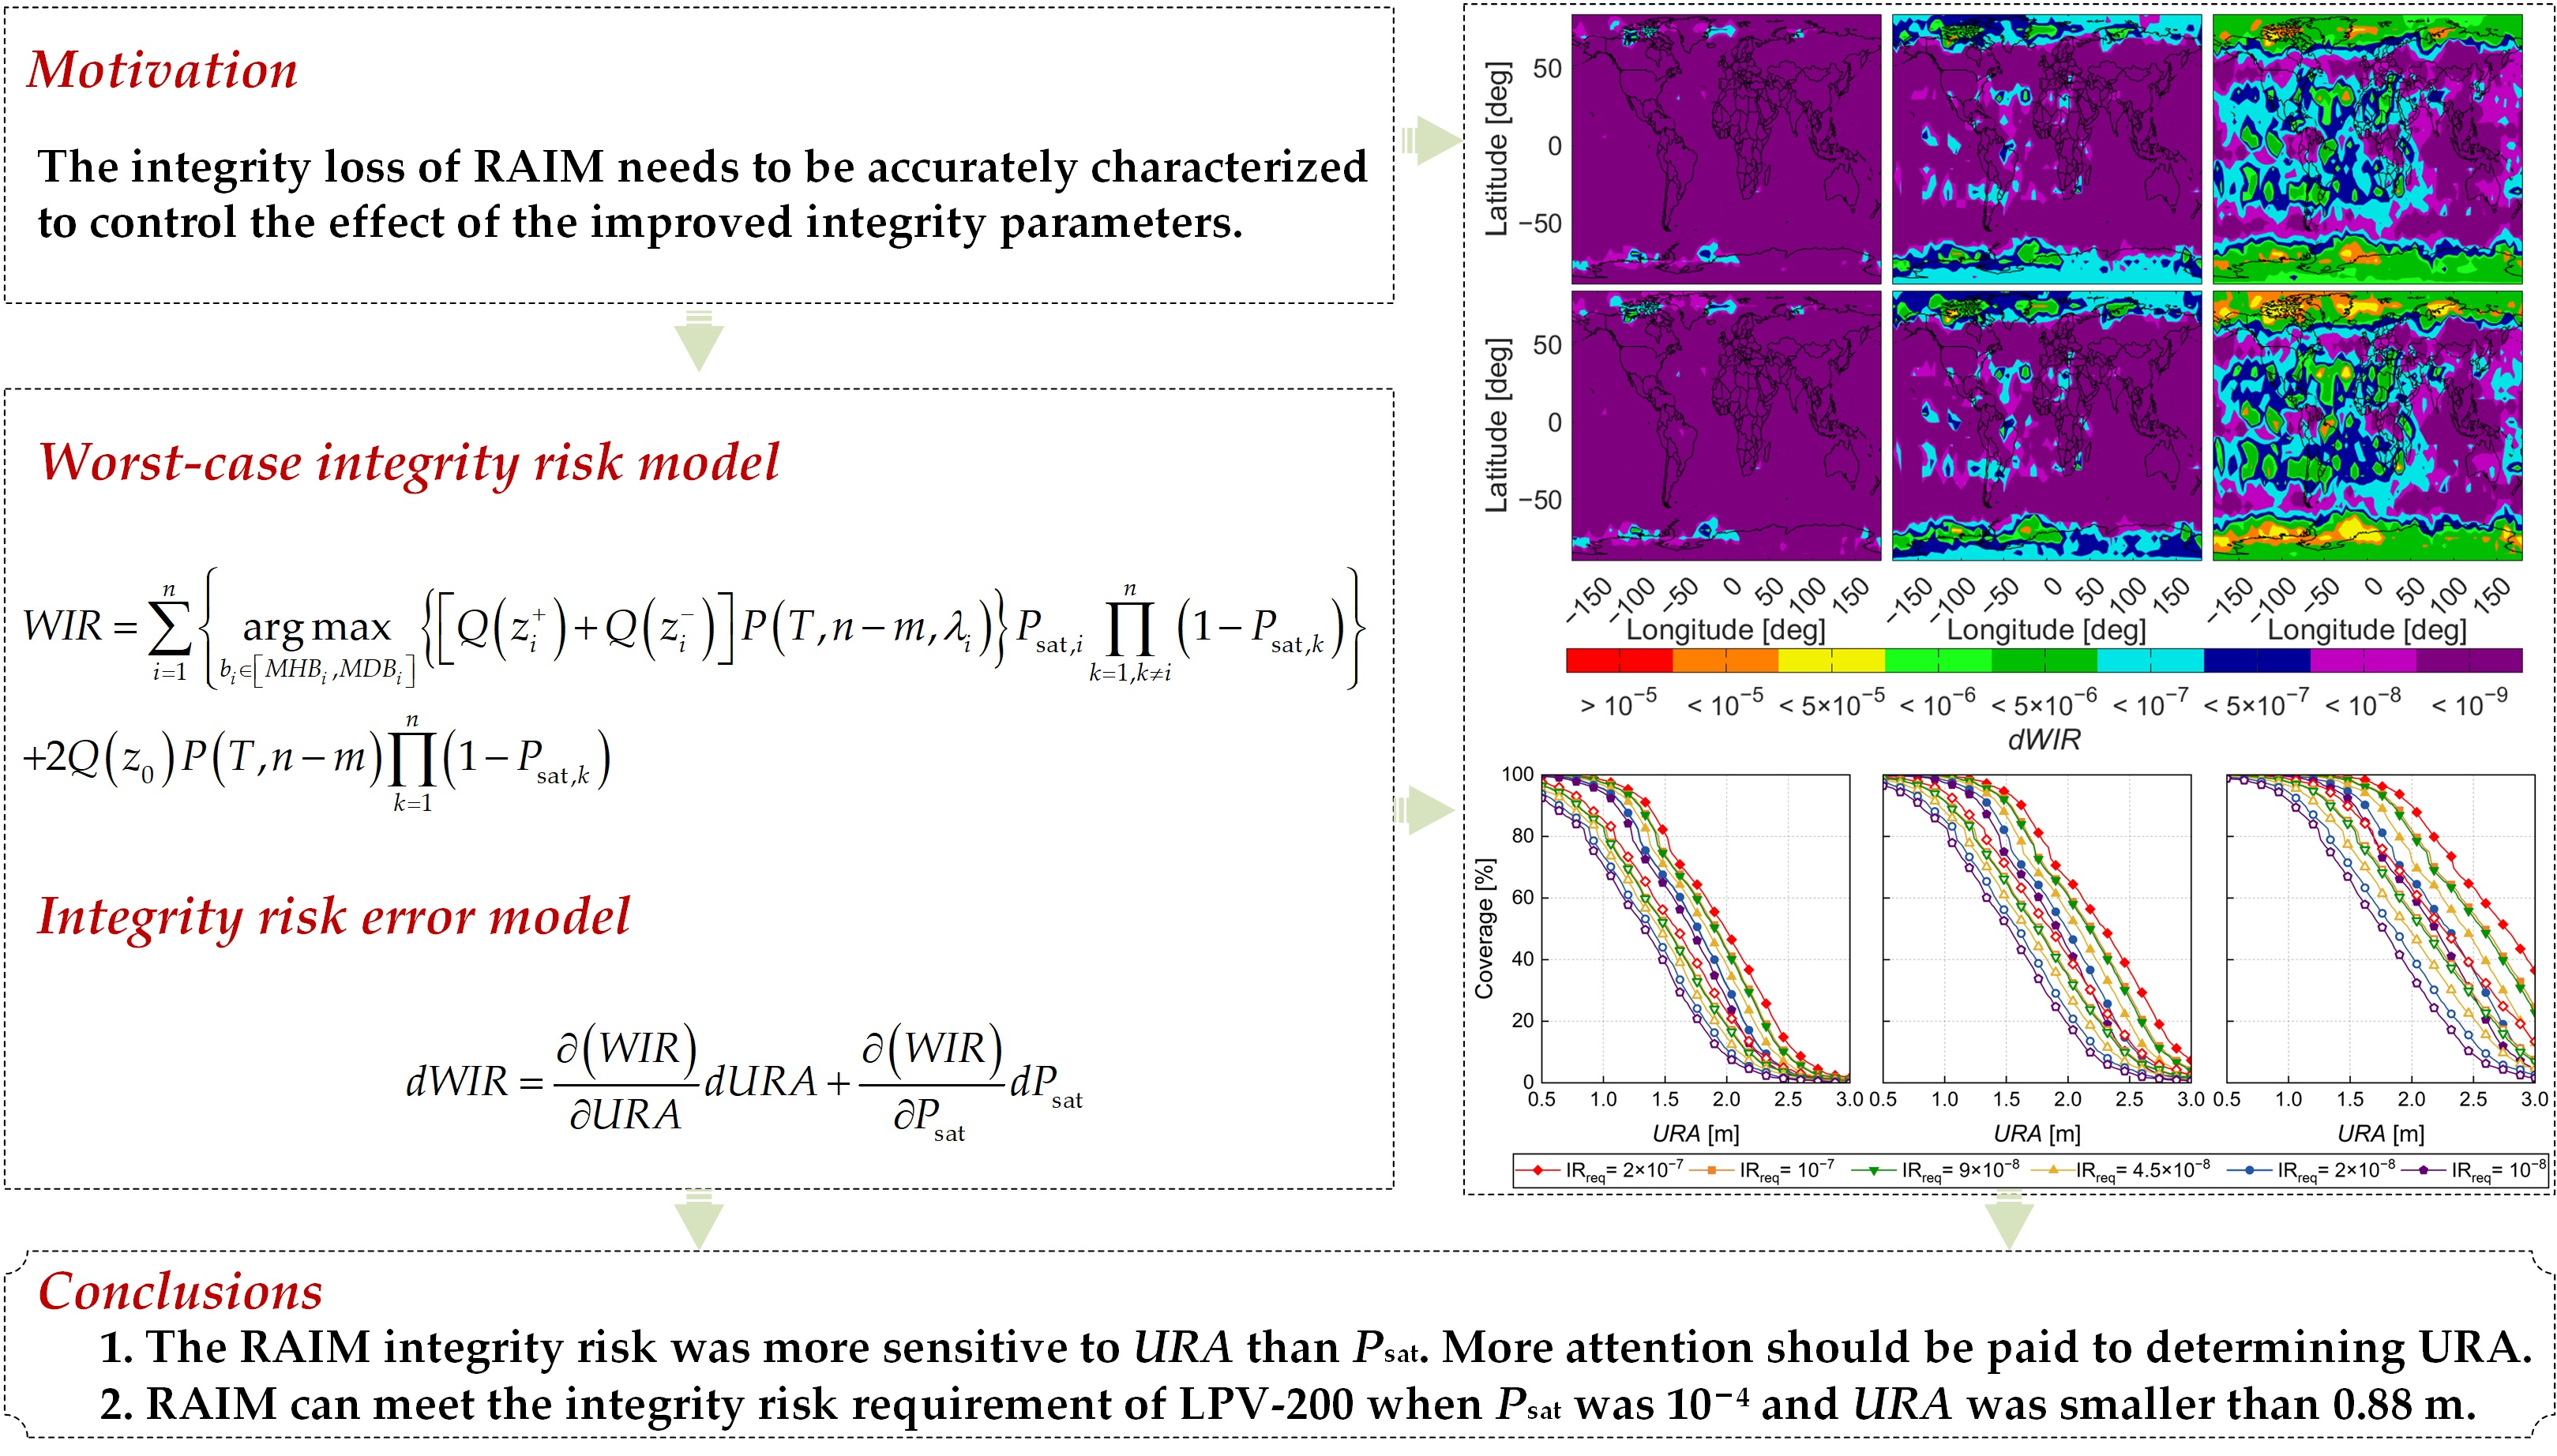
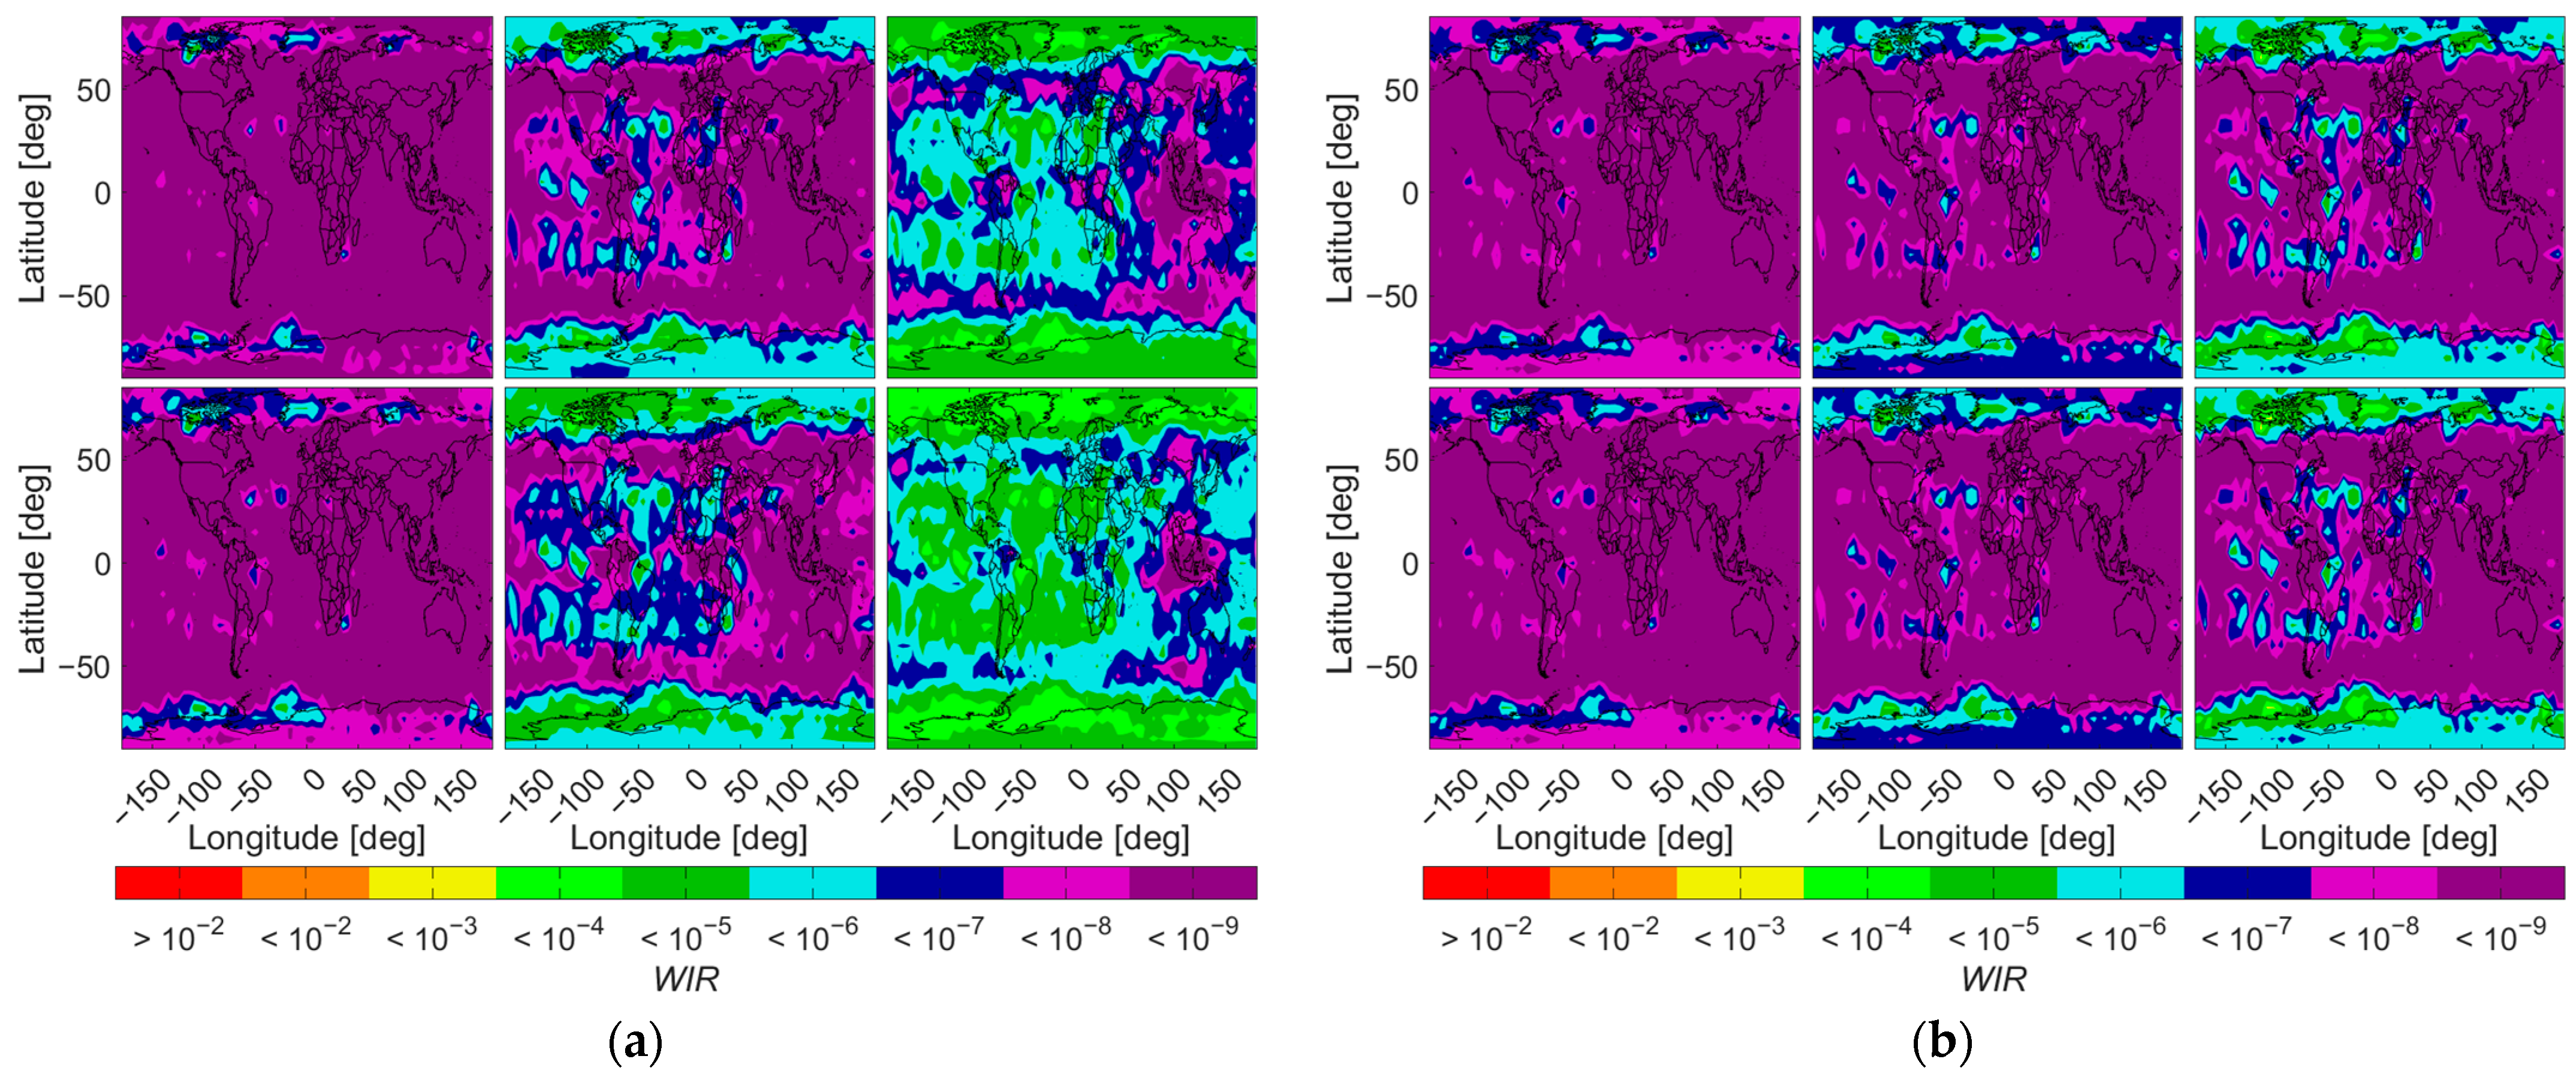
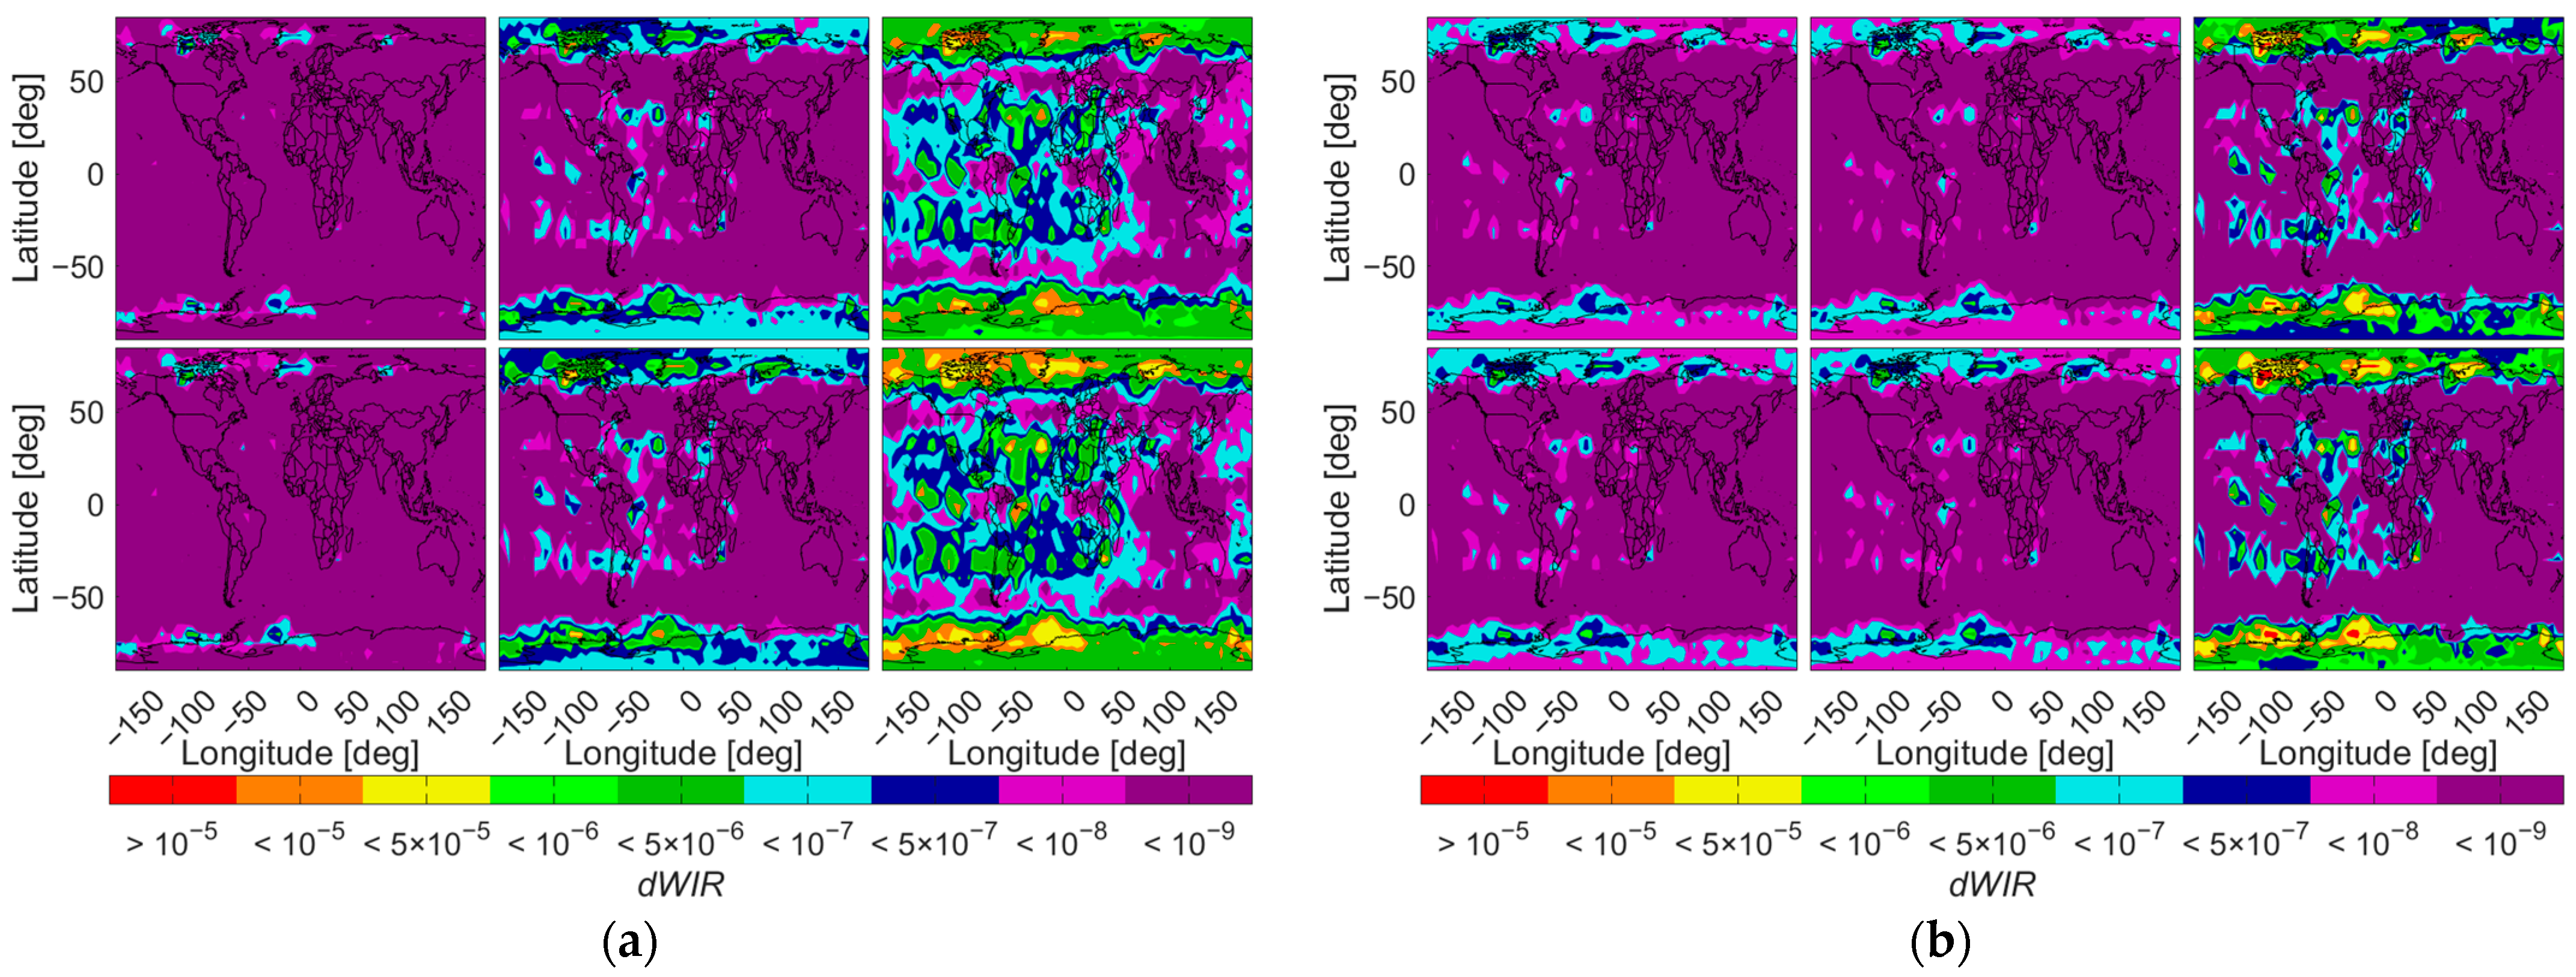
To explore the impact of the improved URA and Psat on the integrity risk, a global simulation was carried out based on Equations (7) and (8). We discussed the influence of the improved integrity parameters on integrity risk from three aspects: global worst-case integrity risk, global availability and variation of the global worst-case integrity risk error. The corresponding results are shown in Figure 1, Figure 2 and Figure 3. When we analyzed the influence of the changes to URA or Psat on integrity performance, the other parameters remained unchanged. The top and bottom panels of (a) and (b) in Figure 1, Figure 2 and Figure 3, respectively, represent selected parameters that increased by 15 and 30% from the true parameters. In panel (a), Psat was set to 10−4 and URA varied in columns from left to right as 1.0, 1.5 and 2.0 m, respectively. In panel (b) of Figure 1, Figure 2 and Figure 3, URA was set to 1.5 m, and Psat varied by column from left to right as 10−5, 10−4 and 10−3, respectively.
As shown in Figure 1, the global integrity risk increased with URA and Psat growth. At equivalent deviation levels, URA had a significantly greater impact on global integrity risk than did Psat. Figure 2 demonstrates that lower URA and Psat values led to higher global availability. A 30% increase in Psat had a negligible effect on global availability, but an increase in URA led to a substantial decrease in global availability. Figure 3 shows that an increase in URA resulted in a more substantial impact on the global worst-case integrity risk error than that of Psat. However, in specific areas with poor geometry, such as North America, a Psat increase resulted in a higher global worst-case integrity risk error compared to increased URA. Furthermore, in comparison to North and South America, the Asia-Pacific region demonstrated superior performance integrity due to a greater number of available IGSO satellites from BDS. Consequently, the regions featuring poorer geometry had higher vulnerabilities to URA and Psat changes. Better satellite geometry can be advantageous for reducing integrity losses resulting from improved URA and Psat. Table 2 presents the global worst-case integrity risk performance and availability coverage for different URA and Psat. Table 2 shows that the global average WIR, dWIR and availability are significantly more affected by an increase in URA than Psat. When IRreq = 4.5 × 10⁻⁸ and URA increased by 15 to 30% from 1.5 m, the average WIR and dWIR increased by 4.31 × 10⁻⁷ and 1.01 × 10⁻⁷, respectively. As a consequence, global availability coverage decreased by 22.14%. When Psat was 10−4, an increase of 15 to 30% resulted in an increase of only 1.4 × 10⁻⁸ and 1.21 × 10⁻⁸ in average WIR and dWIR, respectively, and global availability dropped by 0.98%. Under the same conditions, when Psat was 10−3, the impact of increased Psat on average WIR and availability was also not significant. However, the maximum WIR and dWIR increased by 2.3 × 10⁻⁵ and 8.74 × 10⁻⁵, respectively, which was higher than the maximum WIR and dWIR caused by an increase of 30% in URA from 2.0 m. This indicated that changes in URA had a significant impact on the integrity risk and availability of all regions worldwide. On the other hand, Psat changes had a relatively smaller impact on the global average integrity risk and availability but posed a more significant threat to areas with poor satellite geometry. The RAIM integrity risk was more sensitive to URA than Psat. Therefore, more attention should be paid to determining URA.
4.2. Acceptable URA and Psat
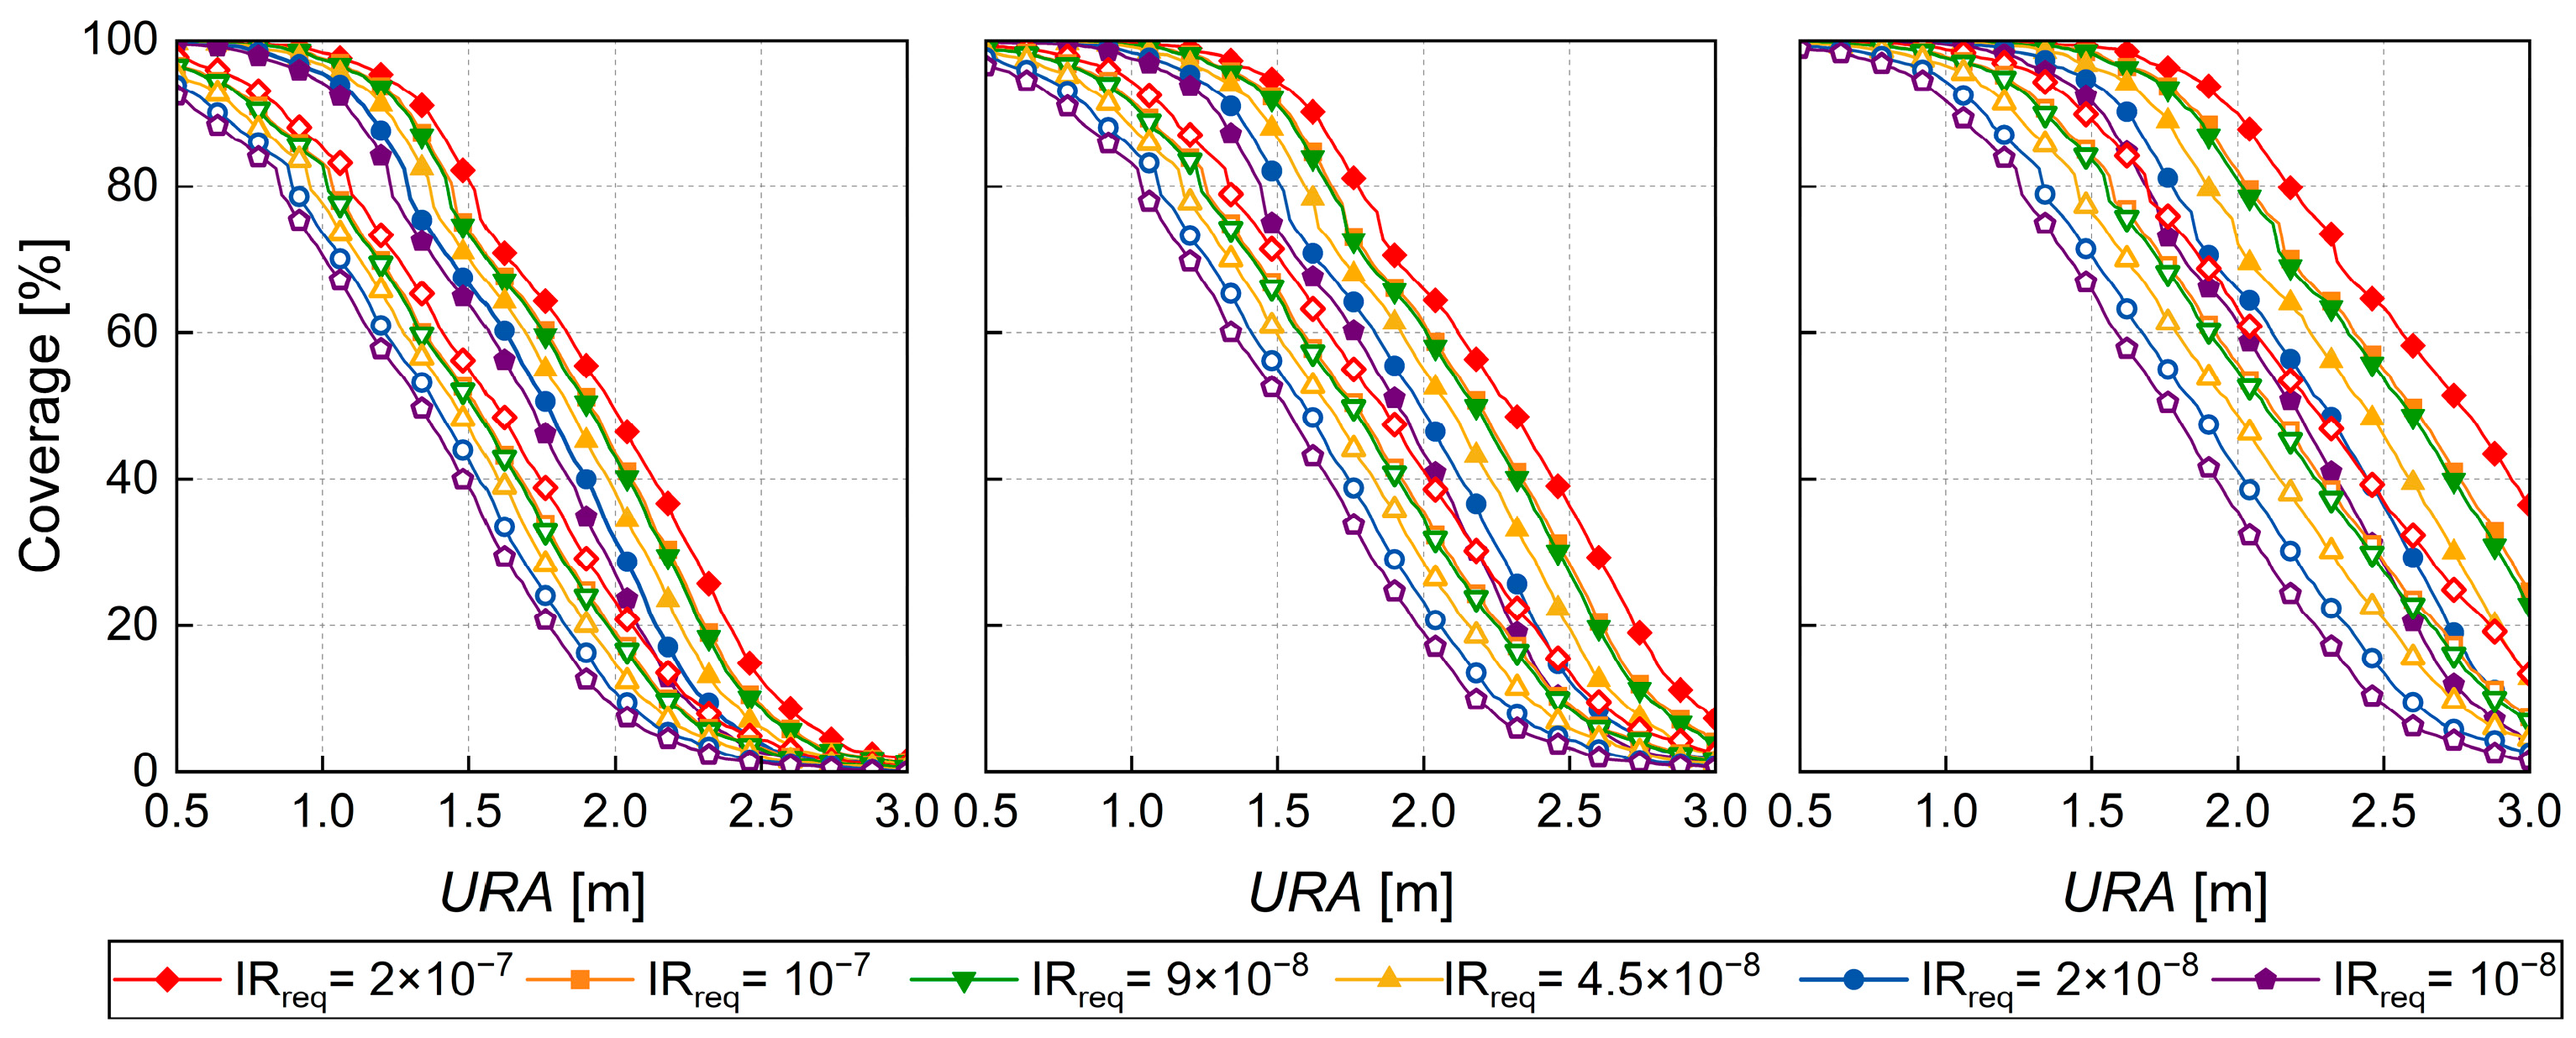
To obtain an acceptable second group of parameters, the effect of a different second group of parameters on the integrity risk was further discussed. Based on the analysis, the change in Psat had a negligible effect on global integrity performance. Therefore, we mainly focused on analyzing acceptable URA under a different Psat. The 24 GPS + 27 BDS and 23 GPS + 26 BDS satellites (by removing one MEO satellite from GPS and BDS) were chosen as the baseline and depleted constellation configurations, respectively. The global coverage results are shown in Figure 4. The Psat in the left, middle and right panels are set to 10−3, 10−4 and 10−5, respectively.
It can be observed from Figure 4 that the global coverage decreased with increasing URA. Due to the poorer satellite geometry, the coverage of the depleted constellation was always smaller than that of the baseline constellation. Table 3 shows acceptable URA with different Psat and integrity risk requirement. From Table 3, under the baseline constellation, URA should be better than 0.88 and 1.14 m when Psat is 10−4 and 10−5, respectively, such that more than 99.5% of global regions can satisfy the allocated integrity risk requirement of a single-satellite fault mode: 4.5 × 10⁻⁸. More than 95% of global regions can meet the integrity risk requirement of 10−7 when Psat is 10−3 and URA is smaller than 0.72 m. Under the depleted constellation, URA should better than 0.6 m with Psat at 10−3 and the required integrity risk at 10−7. As revealed by the literature [7,8,9,10,11], Psat for GPS and BDS ranged from 10−5 to 3.5 × 10⁻⁴, which indicated that the combination of GPS and BDS had the potential to satisfy the integrity risk requirement of LPV-200 concerning Psat. For the Galileo, greater attention should be paid to constellation faults because their probability, Pconst, is equal to or greater than that of single-satellite faults [8]. The representative SISRE values of 0.2–0.58 m and 2 m were demonstrated for Galileo and GLONASS [31,32]. URA can be empirically expressed as 1.5× SISRE [24]. Consequently, the SIS performance of Galileo had the potential to support the integrity risk requirement of LPV-200. It was expected that the comparable integrity level could not be achieved by GLONASS unless URA improved by 2.34 m and Psat was constrained within 10−3.
Since the selection of the third group of parameters affected the integrity performance, acceptable URA under a different third group of parameters needs to be considered. The effect of the third group on global integrity performance was analyzed. The selection of the third group of parameters was referenced from the requirement of LPV-200 and APV-II [33]. Acceptable URA with a different third group of parameters has been shown in Table 4.
From Table 4, the URA requirement is tighter with smaller Pfa and VAL because the probability of detection failure and position error exceeds the alarm limits, which become greater with either stricter Pfa or smaller VAL. The selection of Pmd had little effect on acceptable URA because the estimate of integrity risk could not be directly affected by Pmd. If the global coverage is 99.5%, acceptable URA should be better than 0.88 m when Pfa is set as the continuity risk requirement of LPV-200, i.e., 8 × 10⁻⁶. When VAL was set to 20 m, which is required for APV-II, it was impractical for RAIM to meet the integrity risk requirement of 10−7 by improving URA because the observation error introduced by the other threat sources, such as tropospheric delay error, had not been mitigated. Monitoring threat sources with an auxiliary ground facility, such as a ground-based augmentation system (GBAS), can satisfy the higher integrity requirement.
5. Conclusions
To investigate the effect of improved integrity parameters on RAIM integrity risk, a conservative integrity risk estimation method based on the worst-case protection concept was developed. The integrity-related parameters were divided into four groups. The worst-case integrity risk was estimated by varying the magnitude of the first group of parameters to acquire the maximum integrity risk. A sensitivity analysis was conducted for the second group of parameters, Psat and URA, while considering the influence of the third and fourth groups of parameters on integrity risk. The acceptable second group of parameters was provided based on the global simulation experiment.
The simulation results demonstrated that changes in URA significantly affected integrity risk and availability. Conversely, alterations in Psat had a relatively minor impact on integrity risk and availability, except in areas with disadvantaged satellite geometry. The determination of URA requires closer attention. When IRreq = 4.5 × 10⁻⁸, Psat was 10−4 and URA was 1.5 m, URA and Psat both increased by 30%, whereas the global availability coverage decreased by 22.14 and 0.98%, respectively. With the higher requirement of Pfa and VAL, the restriction on URA became more stringent. Moreover, when the single-satellite fault mode was allocated half of the vertical integrity risk requirement of LPV-200, URA values had to be better than 0.88 and 1.14 m, respectively, when Psat was 10−4 and 10−5 so that more than 99.5% of global regions could meet the allocated integrity risk requirement. Currently, GPS, BDS and Galileo have the potential to support RAIM to satisfy the requirement for LPV-200.
Author Contributions
Conceptualization, L.W., L.L. and R.L.; methodology, L.W. and L.L.; validation, R.L., M.L. and L.C.; formal analysis, M.L. and L.C.; investigation, L.L. and R.L.; resources, L.W. and L.L.; writing—original draft preparation, L.W.; writing—review and editing, L.W. and L.L.; visualization, L.W., R.L. and M.L.; supervision, M.L. and L.C.; project administration, L.L.; funding acquisition, L.L. All authors have read and agreed to the published version of the manuscript.
Funding
This research was jointly funded by the National Key Research and Development Program (No. 2021YFB3901300), the National Natural Science Foundation of China (Nos. 61773132, 61633008, 61803115, 62003109), the 145 High-tech Ship Innovation Project sponsored by the Chinese Ministry of Industry and Information Technology, the Heilongjiang Province Research Science Fund for Excellent Young Scholars (No. YQ2020F009), and the Fundamental Research Funds for Central Universities (Nos. 3072019CF0401, 3072020CFT0403).
Data Availability Statement
The simulation software supporting this research can be found at the hyperlinks as: https://gps.stanford.edu/resources/software-tools/maast, accessed on 4 June 2023.
Conflicts of Interest
The authors declare no conflict of interest.
Appendix A
Appendix A shows the derivation of the partial derivative of the worst-case integrity risk to URA. The derivative of worst-case integrity risk with respect to URA can be analytically derived as
where
The probability density function (PDF) of the standard normal distribution can be expressed as
then
According to the law of derivation,
The z0, and are given in (5) by
Therefore,
The is determined by
Combining (A5), (A7) and (A8),
According to the derivative rule of compound function,
where λi is given by . Therefore,
The PDF of the non-central Chi-square distribution can be expressed as
where is the modified Bessel function of the first kind of order. The CDF of the non-central Chi-square distribution can be expressed as
Therefore,
We assume
then
where
For the modified Bessel function of the first kind,
Combining (A17) and (A18),
Inserting (A17) and (A19) into (A16),
where is assumed by
In summary, inserting (A20) into (A14), and combining (A11) and (A8) gives
References
- Paziewski, J.; Crespi, M. High-precision multi-constellation GNSS: Methods, selected applications and challenges. Meas. Sci. Technol. 2020, 31, 010101. [Google Scholar] [CrossRef]
- Li, L.; Zhao, L.; Yang, F.; Li, N. A novel ARAIM approach in probability domain for combined GPS and Galileo. In Proceedings of the 28th International Technical Meeting of the Satellite Division of The Institute of Navigation (ION GNSS+ 2015), Tampa, FL, USA, 14–18 September 2015. [Google Scholar]
- Zhu, Y.; Zhang, Q.; Mao, Y.; Cui, X.; Cai, C.; Zhang, R. Comprehensive performance review of BDS-3 after one-year official operation. Adv. Space Res. 2022, 71, 883–899. [Google Scholar] [CrossRef]
- Haddad, R.; Kovach, K.; Slattery, R.; Gillis, J. GPS modernization and beyond. In Proceedings of the 2020 IEEE/ION Position, Location and Navigation Symposium (PLANS), Portland, OR, USA, 20–23 April 2020. [Google Scholar]
- Yang, Y.; Gao, W.; Guo, S.; Mao, Y.; Yang, Y. Introduction to BeiDou-3 navigation satellite system. Navigation 2019, 66, 7–18. [Google Scholar] [CrossRef] [Green Version]
- DoD U.S. Global Positioning System Standard Positioning Service Performance Standard, 4th ed.; 2008; Chapter 3; pp. 21–22. Available online: https://www.gps.gov/technical/ps/2008-SPS-performance-standard.pdf (accessed on 4 June 2023).
- DoD U.S. Global Positioning System Standard Positioning Service Performance Standard, 5th ed.; 2020; Chapter 3; pp. 43–50. Available online: https://www.gps.gov/technical/ps/2020-SPS-performance-standard.pdf (accessed on 4 June 2023).
- Wang, R.; Walter, T. Characterization and Comparison of Galileo and GPS Anomalies. In Proceedings of the 2023 International Technical Meeting of The Institute of Navigation, Long Beach, CA, USA, 25–27 January 2023. [Google Scholar]
- Liu, X.; Wang, R.; Blanch, J.; Walter, T. Evaluation of Satellite Clock and Ephemeris Error Bounding Predictability for Integrity Applications. In Proceedings of the 35th International Technical Meeting of the Satellite Division of The Institute of Navigation (ION GNSS+ 2022), Denver, CO, USA, 19–23 September 2022. [Google Scholar]
- Zhao, Y.; Cheng, C.; Li, L.; Wang, R.; Liu, Y.; Li, Z.; Zhao, L. BDS signal-in-space anomaly probability analysis over the last 6 years. GPS Solut. 2021, 25, 49. [Google Scholar] [CrossRef]
- Wang, S.; Zhai, Y.; Zhan, X. Characterizing BDS signal-in-space performance from integrity perspective. Navigation 2021, 68, 157–183. [Google Scholar] [CrossRef]
- Walter, T.; Enge, P. Weighted RAIM for precision approach. In Proceedings of the 8th International Technical Meeting of the Satellite Division of The Institute of Navigation (ION ITM 1995), Palm Springs, CA, USA, 12–15 September 1995. [Google Scholar]
- Li, L.; Wang, H.; Jia, C.; Zhao, L.; Zhao, Y. Integrity and continuity allocation for the RAIM with multiple constellations. GPS Solut. 2017, 21, 1503–1513. [Google Scholar] [CrossRef]
- Chan, F.; Joerger, M.; Khanafseh, S.; Pervan, B. Bayesian fault-tolerant position estimator and integrity risk bound for GNSS navigation. J. Navig. 2014, 67, 753–775. [Google Scholar] [CrossRef] [Green Version]
- Li, L.; Shi, H.; Jia, C.; Cheng, J.; Li, H.; Zhao, L. Position-domain integrity risk-based ambiguity validation for the integer bootstrap estimator. GPS Solut. 2018, 22, 39. [Google Scholar] [CrossRef]
- Joerger, M.; Stevanovic, S.; Langel, S.; Pervan, B. Integrity risk minimisation in RAIM part 1: Optimal detector design. J. Navig. 2016, 69, 449–467. [Google Scholar] [CrossRef] [Green Version]
- Blanch, J.; Walter, T. Stress testing advanced RAIM airborne algorithms. In Proceedings of the 2020 International Technical Meeting of The Institute of Navigation (ION ITM 2020), San Diego, CA, USA, 21–24 January 2020. [Google Scholar]
- El-Mowafy, A.; Yang, C. Limited sensitivity analysis of ARAIM availability for LPV-200 over Australia using real data. Adv. Space Res. 2016, 57, 659–670. [Google Scholar] [CrossRef] [Green Version]
- Lee, Y.; She, J.; Odeh, A.; Bian, B. Horizontal advanced RAIM performance sensitivity to mischaracterizations in integrity support message values. In Proceedings of the 32nd International Technical Meeting of the Satellite Division of The Institute of Navigation (ION GNSS+ 2019), Miami, FL, USA, 16–20 September 2019. [Google Scholar]
- Lee, Y.; Bian, B.; Odeh, A.; She, J. Sensitivity of advanced RAIM performance to mischaracterizations in integrity support message values. Navigation 2021, 68, 541–558. [Google Scholar] [CrossRef]
- Wang, L.; Luo, S.; Tu, R.; Fan, L.; Zhang, Y. ARAIM with BDS in the Asia-Pacific region. Adv. Space Res. 2018, 62, 707–720. [Google Scholar] [CrossRef]
- Milner, C.; Ochieng, W. Weighted RAIM for APV: The ideal protection level. J. Navig. 2011, 64, 61–73. [Google Scholar] [CrossRef]
- Rife, J.; Phelts, R. Formulation of a time-varying maximum allowable error for ground-based augmentation systems. IEEE Trans. Aerospace Electron. Syst. 2008, 44, 548–560. [Google Scholar] [CrossRef]
- EU-U.S. Cooperation on Satellite Navigation Working Group C. ARAIM Technical Subgroup Milestone 3 Report. February 2016. Available online: https://ec.europa.eu/docsroom/documents/15641/attachments/1/translations/en/renditions/pdf (accessed on 4 June 2023).
- Blanch, J.; Walter, T.; Milner, C.; Joergeret, M.; Pervan, B.; Bouvet, D. Baseline advanced RAIM user algorithm: Proposed updates. In Proceedings of the 2022 International Technical Meeting of The Institute of Navigation (ION ITM 2022), Long Beach, CA, USA, 25–27 January 2022. [Google Scholar]
- Working Group C, ARAIM Technical Subgroup. WG-C Advanced RAIM Technical Subgroup Reference Airborne Algorithm Description Document. 20 June 2019. Available online: https://web.stanford.edu/group/scpnt/gpslab/website_files/maast/ARAIM_TSG_Reference_ADD_v3.1.pdf (accessed on 4 June 2023).
- Ma, X.; He, X.; Yu, K.; Montillet, J.; Lu, T.; Yan, L.; Zhao, L. Progress of global ARAIM availability of BDS-2/BDS-3 with TGD and ISB. Adv. Space Res. 2022, 70, 935–946. [Google Scholar] [CrossRef]
- Luo, S.; Wang, L.; Tu, R.; Zhang, W.; Chen, C. Satellite selection methods for multi-constellation advanced RAIM. Adv. Space Res. 2019, 65, 1503–1517. [Google Scholar] [CrossRef]
- RTCA DO-253C. Minimum Operational Performance Standards (MOPS) for GPS Local Area Augmentation System (LAAS) Airborne Equipment; RTCA, Inc.: Washington, DC, USA, 2008; Chapter 2; pp. 58–59. [Google Scholar]
- Blanch, J.; Walter, T.; Enge, P.; Lee, Y.; Pervan, B.; Rippl, M.; Spletter, A.; Kropp, V. Baseline advanced RAIM user algorithm and possible improvements. IEEE Trans. Aerosp. Electron. Syst. 2015, 51, 713–732. [Google Scholar] [CrossRef]
- Montenbruck, O.; Steigenberger, P.; Hauschild, A. Multi-GNSS signal-in-space range error assessment-methodology and results. Adv. Space Res. 2018, 61, 3020–3038. [Google Scholar] [CrossRef]
- Wu, W.; Guo, F.; Zheng, J. Analysis of Galileo signal-in-space range error and positioning performance during 2015–2018. Satell. Navig. 2020, 1, 6. [Google Scholar] [CrossRef] [Green Version]
- ICAO, Annex 10. GNSS Standards and Recommended Practices (SARPs), 7th ed.; ICAO: Montreal, QC, Canada, 2018; Chapter 3; pp. 71–72. ISBN 978-92-9258-504-4. [Google Scholar]
Figure 1.
Global worst-case integrity risk with different URA and Psat. (a) Global worst-case integrity risk with different URA; (b) Global worst-case integrity risk with different Psat.
Figure 1.
Global worst-case integrity risk with different URA and Psat. (a) Global worst-case integrity risk with different URA; (b) Global worst-case integrity risk with different Psat.

Figure 2.
Global availability with different URA and Psat. (a) Global availability with different URA; (b) Global availability with different Psat.
Figure 2.
Global availability with different URA and Psat. (a) Global availability with different URA; (b) Global availability with different Psat.

Figure 3.
Global worst-case integrity risk error with different URA and Psat. (a) Global worst-case integrity risk error with different URA; (b) Global worst-case integrity risk error with different Psat.
Figure 3.
Global worst-case integrity risk error with different URA and Psat. (a) Global worst-case integrity risk error with different URA; (b) Global worst-case integrity risk error with different Psat.

Figure 4.
The global availability coverage with different URA and Psat. The solid markers indicate the baseline constellation of 24 GPS + 27 BDS. The hollow markers indicate the depleted constellation of 23 GPS + 26 BDS.
Figure 4.
The global availability coverage with different URA and Psat. The solid markers indicate the baseline constellation of 24 GPS + 27 BDS. The hollow markers indicate the depleted constellation of 23 GPS + 26 BDS.


Table 1.
Simulation experiment parameters.
| Parameters | Value |
|---|---|
| URA | 1.0/1.5/2.0 m |
| Psat | 10−5/10−4/10−3 |
| Pfa requirement | 10−5 |
| Pmd requirement | 10−3 |
| VAL | 35 m |
| Constellation | GPS + BDS |
| Simulation duration | 10 days |
| Time step | 10 min |
| Cut-off elevation angle | 10 deg |
Table 2.
Global worst-case integrity risk performance and availability coverage with different URA and Psat. # represents the different degrees of increase.
Table 2.
Global worst-case integrity risk performance and availability coverage with different URA and Psat. # represents the different degrees of increase.
| Value | Increased by # | Worst-Case Integrity Risk | Coverage (99.5%) | |||||
|---|---|---|---|---|---|---|---|---|
| Average WIR | Maximum WIR | Average dWIR | Maximum dWIR | IRreq = 9 × 10⁻⁸ | IRreq = 4.5 × 10⁻⁸ | |||
| URA (m) | 1.0 | 15% | 1.37 × 10⁻⁸ | 4.65 × 10⁻⁶ | 4.20 × 10⁻⁹ | 1.43 × 10⁻⁶ | 98.17% | 97.41% |
| 30% | 3.14 × 10⁻⁸ | 8.14 × 10⁻⁶ | 8.70 × 10⁻⁹ | 2.96 × 10⁻⁶ | 96.23% | 94.82% | ||
| 1.5 | 15% | 2.92 × 10⁻⁷ | 2.57 × 10⁻⁵ | 9.62 × 10⁻⁸ | 8.11 × 10⁻⁶ | 73.55% | 69.22% | |
| 30% | 7.23 × 10⁻⁷ | 3.57 × 10⁻⁵ | 1.97 × 10⁻⁷ | 1.67 × 10⁻⁵ | 63.01% | 57.61% | ||
| 2.0 | 15% | 2.24 × 10⁻⁶ | 5.07 × 10⁻⁵ | 8.54 × 10⁻⁷ | 1.53 × 10⁻⁵ | 41.51% | 34.74% | |
| 30% | 4.84 × 10⁻⁶ | 7.57 × 10⁻⁵ | 1.73 × 10⁻⁶ | 3.12 × 10⁻⁵ | 19.71% | 12.60% | ||
| Psat | 10−5 | 15% | 1.07 × 10⁻⁸ | 1.82 × 10⁻⁶ | 9.60 × 10⁻⁹ | 8.12 × 10⁻⁷ | 97.79% | 96.00% |
| 30% | 1.21 × 10⁻⁸ | 2.05 × 10⁻⁶ | 1.97 × 10⁻⁸ | 1.67 × 10⁻⁶ | 97.34% | 95.78% | ||
| 10−4 | 15% | 1.07 × 10⁻⁷ | 1.82 × 10⁻⁵ | 1.22 × 10⁻⁸ | 2.25 × 10⁻⁶ | 90.45% | 85.65% | |
| 30% | 1.21 × 10⁻⁷ | 2.05 × 10⁻⁵ | 2.43 × 10⁻⁸ | 4.50 × 10⁻⁶ | 89.80% | 84.67% | ||
| 10−3 | 15% | 1.05 × 10⁻⁶ | 1.79 × 10⁻⁴ | 9.51 × 10⁻⁷ | 8.03 × 10⁻⁵ | 72.91% | 69.56% | |
| 30% | 1.19 × 10⁻⁶ | 2.02 × 10⁻⁴ | 1.95 × 10⁻⁶ | 1.65 × 10⁻⁴ | 72.26% | 68.91% | ||
Table 3.
Acceptable URA with different Psat and integrity risk requirement.
| Psat | Constellation | Coverage | Integrity Risk Requirement | ||||||
|---|---|---|---|---|---|---|---|---|---|
| 2 × 10⁻⁷ | 10−7 | 9 × 10⁻⁸ | 4.5 × 10⁻⁸ | 2 × 10⁻⁸ | 10−8 | ||||
| URA (m) | 10−5 | 24 GPS + 27 BDS | 99.5% | 1.36 | 1.26 | 1.24 | 1.14 | 1.04 | 0.98 |
| 95.0% | 1.84 | 1.70 | 1.68 | 1.58 | 1.46 | 1.38 | |||
| 23 GPS + 26 BDS | 99.5% | 0.84 | 0.70 | 0.68 | 0.56 | / | / | ||
| 95.0% | 1.32 | 1.20 | 1.18 | 1.08 | 0.96 | 0.88 | |||
| 10−4 | 24 GPS + 27 BDS | 99.5% | 1.04 | 0.98 | 0.96 | 0.88 | 0.80 | 0.72 | |
| 95.0% | 1.46 | 1.38 | 1.36 | 1.28 | 1.20 | 1.14 | |||
| 23 GPS + 26 BDS | 99.5% | / | / | / | / | / | / | ||
| 95.0% | 0.96 | 0.88 | 0.86 | 0.78 | 0.68 | 0.60 | |||
| 10−3 | 24 GPS + 27 BDS | 99.5% | 0.80 | 0.72 | 0.72 | 0.66 | 0.56 | / | |
| 95.0% | 1.20 | 1.14 | 1.14 | 1.08 | 1.00 | 0.96 | |||
| 23 GPS + 26 BDS | 99.5% | / | / | / | / | / | / | ||
| 95.0% | 0.68 | 0.60 | 0.58 | 0.52 | / | / | |||
Table 4.
Acceptable URA with different third group of parameters.
| Third Group of Parameters | Coverage | Integrity Risk Requirement | |||||||
|---|---|---|---|---|---|---|---|---|---|
| 2 × 10⁻⁷ | 10−7 | 9 × 10⁻⁸ | 4.5 × 10⁻⁸ | 2 × 10⁻⁸ | 10−8 | ||||
| URA (m) | Pfa | 8 × 10⁻⁶ | 99.5% | 1.04 | 0.96 | 0.94 | 0.88 | 0.78 | 0.70 |
| 95.0% | 1.44 | 1.36 | 1.34 | 1.26 | 1.20 | 1.14 | |||
| 4 × 10⁻⁶ | 99.5% | 1.00 | 0.92 | 0.92 | 0.82 | 0.74 | 0.68 | ||
| 95.0% | 1.40 | 1.32 | 1.30 | 1.24 | 1.16 | 1.10 | |||
| Pmd | 10−4 | 99.5% | 1.04 | 0.98 | 0.96 | 0.90 | 0.80 | 0.72 | |
| 95.0% | 1.46 | 1.38 | 1.36 | 1.28 | 1.20 | 1.14 | |||
| 10−5 | 99.5% | 1.04 | 0.98 | 0.96 | 0.90 | 0.80 | 0.72 | ||
| 95.0% | 1.46 | 1.38 | 1.36 | 1.28 | 1.20 | 1.14 | |||
| VAL (m) | 20 | 99.5% | / | / | / | / | / | / | |
| 95.0% | / | / | / | / | / | / | |||
| 30 | 99.5% | 0.64 | 0.50 | / | / | / | / | ||
| 95.0% | 1.08 | 0.98 | 0.98 | 0.90 | 0.80 | 0.74 | |||
Disclaimer/Publisher’s Note: The statements, opinions and data contained in all publications are solely those of the individual author(s) and contributor(s) and not of MDPI and/or the editor(s). MDPI and/or the editor(s) disclaim responsibility for any injury to people or property resulting from any ideas, methods, instructions or products referred to in the content. |
© 2023 by the authors. Licensee MDPI, Basel, Switzerland. This article is an open access article distributed under the terms and conditions of the Creative Commons Attribution (CC BY) license (https://creativecommons.org/licenses/by/4.0/).
Share and Cite
MDPI and ACS Style
Wang, L.; Li, L.; Li, R.; Li, M.; Cheng, L. Worst-Case Integrity Risk Sensitivity for RAIM with Constellation Modernization. Remote Sens. 2023, 15, 2979. https://doi.org/10.3390/rs15122979
AMA Style
Wang L, Li L, Li R, Li M, Cheng L. Worst-Case Integrity Risk Sensitivity for RAIM with Constellation Modernization. Remote Sensing. 2023; 15(12):2979. https://doi.org/10.3390/rs15122979
Chicago/Turabian StyleWang, Liuqi, Liang Li, Ruijie Li, Min Li, and Li Cheng. 2023. "Worst-Case Integrity Risk Sensitivity for RAIM with Constellation Modernization" Remote Sensing 15, no. 12: 2979. https://doi.org/10.3390/rs15122979
Note that from the first issue of 2016, this journal uses article numbers instead of page numbers. See further details here.