1. Introduction
Since the 1990s, the Arctic summer sea ice extent has declined by about 50% and the sea ice thickness by about 40% (e.g., [
1,
2,
3]). A new vulnerable sea ice state has emerged in the Arctic Ocean with significant reductions of the thicker multi-year sea ice, predominant presence of the thinner first-year ice, longer periods of open water, enhanced surface melt rates and presence of melt ponds and increased frequency of lead fractions within the sea ice cover. Minimum sea ice extent is typically observed in mid-September and absolute minimum extent records, during the more than 40-year era of satellite observations, were reported in 2007, 2012 and 2020, with all the lowest minimum extents observed in the last 15 years (e.g., [
4,
5,
6]). The extents in 2021 and 2022 were the 12th and 13th lowest extents observed during the satellite observational era, reflecting also the natural interannual variability of the sea ice. The fact that the Arctic warming has been reported to be 2–3 times (most recent studies even indicating 4–5 times) as large as the temperature increase in any other area of the globe is known as the Arctic Amplification (e.g., [
7,
8,
9]). In addition to Arctic Amplification, complex interactive processes and mutual feedback are contributing to this dramatic change in the sea ice extent, thickness and hence the ice volume [
10], altering the human accessibility and activities in the Arctic with societal and economic implications (e.g., [
11]). However, we lack a quantitative understanding of the interactive processes and feedback across a wide range of spatial and temporal scales. Hence, we are confronted with challenges in using computer models to quantify, characterize, and simulate the leading drivers of the regional Arctic climate change, and to predict their local and global impacts.
Satellite observations are and will be key elements to understanding such a remote and harsh environment where in-situ observations are limited in space and frequency. In fact, most of our knowledge today about the surface properties, both for the Arctic and Antarctic, is derived from satellite data over the last 40 years, supplemented by sparse in-situ measurements derived largely from scientific expeditions. The continuity of satellite observations over several decades, with no or limited gaps between the satellite missions, is consequently key for the study of long-term changes. However, although the Earth Observation polar-orbiting satellite constellation is particularly dense today, gaps remain in the satellite observations, in terms of observed physical variables, spatial and temporal coverage, and resolution. In turn, the ability to understand the processes and characterize the changes in the Arctic Ocean is deficient. This is recognized in the approved future satellite missions that will carry new instruments dedicated to Polar regions, bringing a new observation capacity and new scientific insight into the processes in the Arctic Ocean.
In this paper, we present an overview of the past and present satellite observation capabilities to address major scientific challenges in the Arctic Ocean, highlighting the observational gaps that must be filled by future approved satellite missions. However, the paper is primarily addressing the ESA and Eumetsat (European) satellite missions complemented with selected satellite missions from other space agencies including NASA (USA), CSA (Canada), NSOAS (China), JAXA (Japan) and ISRO (India). This choice is made to reduce the complexity and improve the readability of the figure presentations of the results, without excluding the major application areas. The availability of relevant and similar type sensor data from missions planned by the other countries will complement and expand the availability of satellite missions to be available for future studies of the Arctic Ocean. The study is undertaken within the framework of the Arktalas Hoavva (Arctic Ocean in the Sami language) project funded by the European Space Agency (ESA) with the aim to advance the use of satellite measurements in synergy with in-situ data and computer models to characterize and quantify the processes driving changes in the Arctic sea ice cover and in the Arctic Ocean. In so doing, knowledge gaps must be removed to advance our quantitative understanding of sea ice, ocean and atmosphere interactive processes and mutual feedback at various temporal and spatial scales. In the Arktalas Hoavva project, four major interlinked Arctic Scientific Challenges (ASC) have been investigated, addressing the need to:
Characterize the Arctic Amplification and its impact (ASC-1)
Characterize the impact of more persistent and larger areas of open water on sea ice dynamics (ASC-2)
Characterize and predict the impact of extreme event storms on sea ice formation patterns and structures (ASC-3)
Characterize and predict the Arctic Ocean spin-up (ASC-4)
These ASCs are particularly presented and discussed in seven scientific publications emerging from the Arktalas Hoavva project [
12,
13,
14,
15,
16,
17,
18], to be further outlined in
Section 2. In this paper, we address the state-of-art satellite observations of the Arctic Ocean in the context of the Arktalas major scientific challenges in
Section 2. In
Section 3, we focus on the assessment of the limitations and gaps of the current and past satellite measurements in view of the four challenges. The capabilities of future missions are then addressed in
Section 4, followed by a summary and conclusion in
Section 5.
2. Use of Satellite Observations to Address the Arktalas Hoavva Scientific Challenges in the Arctic Ocean
Satellite measurements in the Arctic are of fundamental importance, although they are influenced by a number of technical, observational, and environmental challenges. Limited coverage from polar-orbiting satellites across the true North Pole of the central Arctic Ocean invokes the Polar gaps without specific satellite payload design considerations (e.g., very wide swath and specific choice of orbit inclination). On the other hand, the Earth’s curvature in the polar regions and the convergence of the ground tracks of polar-orbiting satellites contribute to improved coverage and repeat cycles. Moreover, as the polar night and harsh meteorological conditions, including clouds and haze, limit the use of optical satellite instruments, the main demand relies on all-weather day and night microwave radiometry, laser altimetry and active microwave (Synthetic Aperture Radar (SAR), altimeter, scatterometer) observations. However, radiative transfer models are incomplete, radar backscatter from mixed pixels is often difficult to quantify and partition into individual geophysical signal sources, spatial resolution of measurements is largely insufficient, frequency selections have been limited, and empirical-based relationships are predominantly driving the retrieval algorithms. In addition, proper satellite-based identification and resolution of dominant spatial and temporal scales in the polar regions are sometimes deficient.
Several decades of satellite observations from space agencies worldwide have revealed dramatic changes in the Arctic, although they are inadequate for systematic multi-disciplinary monitoring and process-based studies that integrate components of the regional environment and climate [
19,
20]. Further efforts to improve synergies within a comprehensive Arctic Observing Network are, therefore, recommended [
21].
Based on this the Arktalas Hoavva study project has adopted a stepwise multi-modal analyses framework approach to address the four major Arctic Scientific Challenges listed above, benefitting from multiscale resolution satellite observations together with complementary in-situ data, computer model simulations, data assimilation, analyses, and integrated visualization tools.
In the high-latitude seas and the Arctic Ocean, global warming and Arctic Amplification are considered to occur across a range of environmental state variables with complex interactions and feedback mechanisms at regional to global scales. Central among these are changes in the radiation balance, changes in ocean-sea ice-atmosphere momentum, heat and gas exchanges, reduction in the sea ice extent and thickness, and changes in the bio-optical properties in the upper ocean. In turn, the Arctic Polar Regions experience increased air temperature, delayed onset of sea ice freezing, early onset of sea ice melting, increasing area of melt ponds, polynyas and surface meltwater, increased lead fraction and sea ice drift, reduction in near-shore fast ice area, changes in snow cover, snow water equivalent (SWE), changes in albedo, a much larger wind fetch and enhanced wave-sea ice interaction leading to sea ice break-up and delays in freeze-up, as well as shifts in and expansions of the Marginal Ice Zone (MIZ). Moreover, the atmospheric boundary layer adjustment to these changes is anticipated to alter the weather patterns and influence the Arctic vortex, with atmospheric teleconnection to lower latitudes.
Esau et al. [
17] have reviewed and assessed how the remote sensing data, and particularly climate products, have captured signals of the Arctic Amplification such as the rapid and massive transition from multiyear to seasonal sea ice, and from tundra to tall shrubs and forest.
Cancet et al. [
18] have investigated the impact of sea ice change on ocean tides in the Arctic Ocean, considering model simulations and observations from satellite altimetry and tide gauges. Although ocean tides are one of the major contributors to the energy dissipation in the Arctic Ocean, their characteristics are poorly known [
22]. In particular, the interactions between tides, the sea ice, grounded-ice and fast-ice cover are often simply ignored in tidal modeling simulations or considered through relatively simple combinations with the bottom friction.
Characterizing the impact of more persistent and larger areas of open water on the sea ice dynamics is also coupled with Arctic Amplification issues. However, the direct observation of mesoscale eddies has been impeded by the presence of compact sea ice concentration in the past. Cassianides et al. [
13] have developed a new method to detect ocean eddies based on the response in the sea ice drift and vorticity fields retrieved from SAR images, which is particularly promising.
Thanks to the innovative use of data from ICESat-2, Sentinel-2, Sentinel-1, and Sentinel-3 Fully-Focused SAR altimetry and the Chinese-French Oceanographic Satellite Surface Waves Investigation and Monitoring instrument (CFOSAT-SWIM), wave patterns have been clearly detected in the sea ice and ocean of the MIZ by Collard et al. [
14]. This clearly advocates for a synergetic approach, building co-located datasets to achieve a better quantitative understanding of the propagation and interactions of waves and sea ice.
As thinning sea ice and growing areas of open water within the Arctic Ocean will also be more effectively exposed to extreme events, it is important to better understand, characterize and predict the impact of extreme storms on sea ice formation and break-up. A central question is also whether the changes in the sea ice extent and thickness will favor increasing frequency and strengthening of extreme events. Rheinlaender et al. [
15] investigated the driving mechanisms behind a large sea ice breakup event in the Beaufort Sea in response to a series of storms in February–March 2013. Lead detection products based on Moderate Resolution Imaging Spectroradiometer (MODIS) thermal infrared imagery [
23] were used to evaluate the simulations results and demonstrated that the model could successfully reproduce the timing, location, and propagation of sea ice leads associated with the storm-induced breakup. The choice of horizontal resolution for the atmospheric forcing and the sea ice rheology scheme in the model was also of prime importance to be able to reproduce the sea ice dynamics in the model in the case of such extreme events.
Finally, the impact of increased temperatures in the Arctic—manifested through the Arctic Amplification—on the basin scale atmospheric and ocean circulation was explored by Regan et al. [
12] with a focus on the Beaufort gyre and its evolution over the period 1990–2014. Using altimetry-based Dynamic Ocean Topography datasets [
24,
25] together with a high-resolution eddy-resolving model, they concluded that the accumulation of freshwater due to changes in the wind forcing and sea ice conditions led to the spin-up of the Beaufort Gyre. Clearly, the changes taking place in the Arctic today may have profound impacts on the general circulation of the Arctic and its interaction with other ocean basins and the global thermohaline circulation [
26].
3. Today’s Challenges, Limitations and Key Issues with Satellite Observations
The studies of the different Arctic Scientific Challenges reported in the previous section strongly advocate the importance of the multi-sensor and -disciplinary satellite-based observing capabilities.
Table 1 and
Table 2 synthesize the types of satellite sensors that can be used to retrieve the ocean and sea ice geophysical variables, respectively.
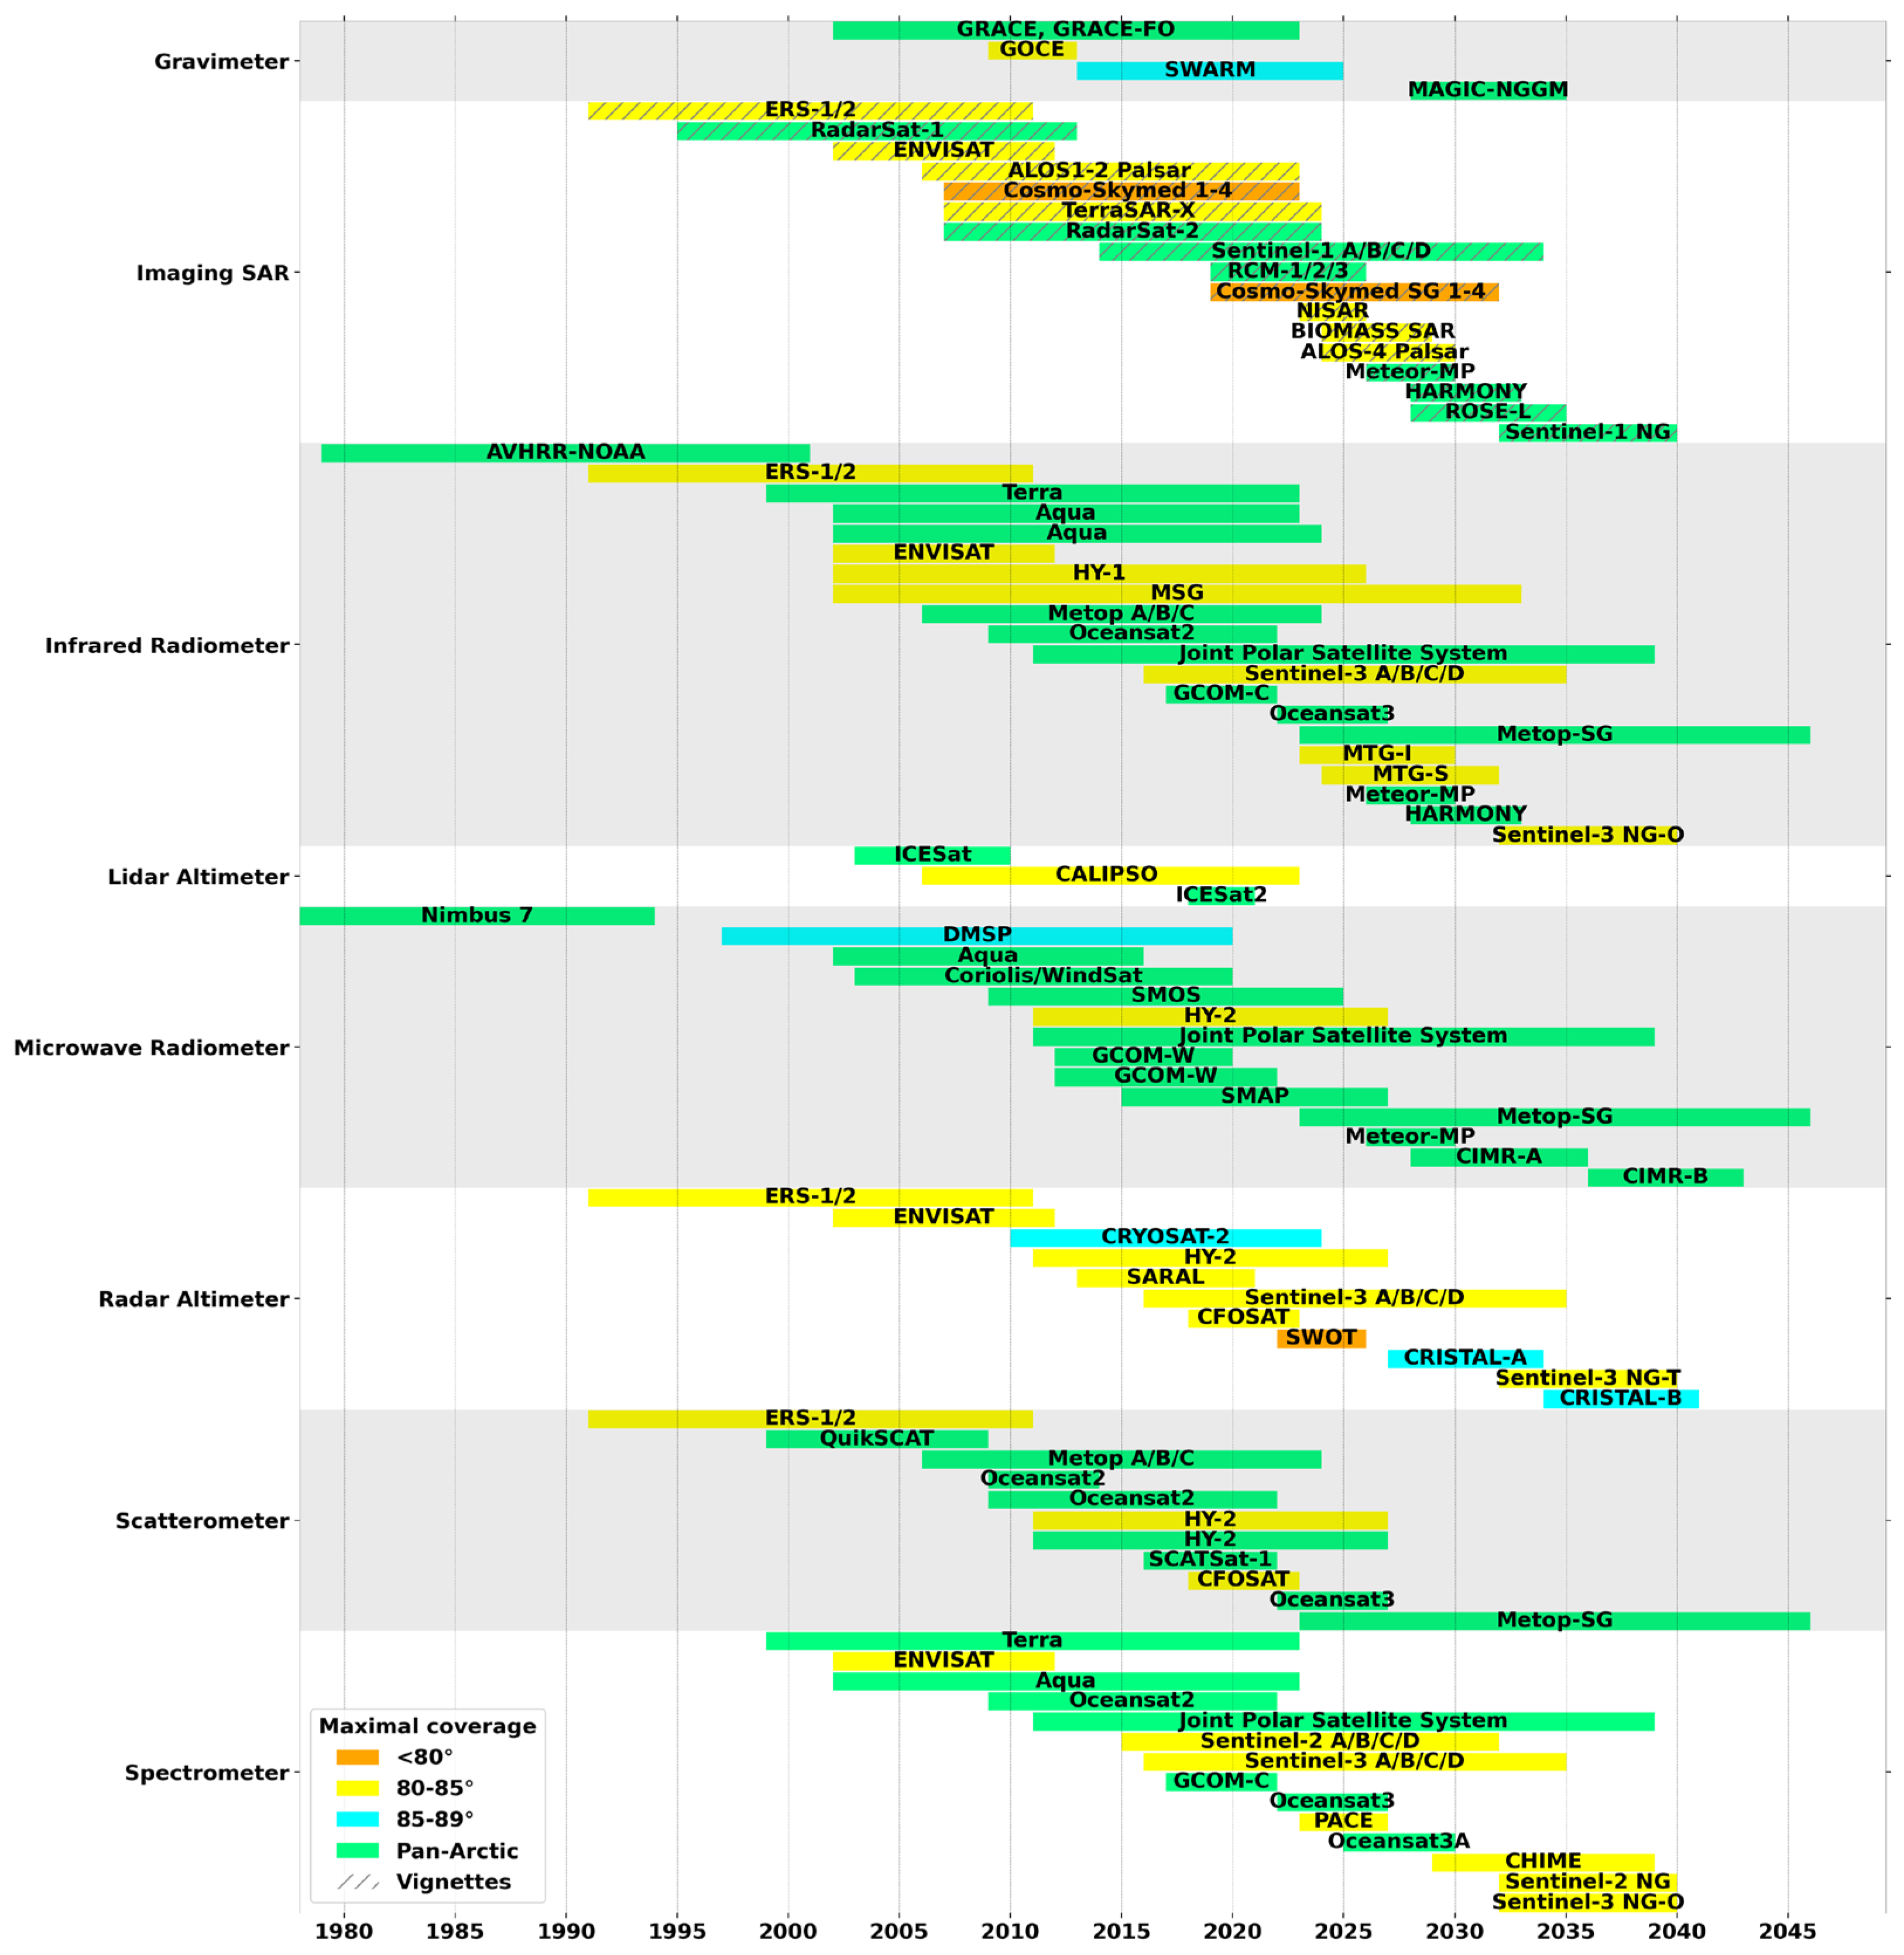
Figure 1 displays the past, present and approved future satellite missions equipped with suitable payload sensors allowing the retrieval of these ocean and sea ice variables, considering the satellite mission timeline, spatial coverage and instrument measuring modes. We focus on European satellite missions, although some major international missions are also included. All in all, a large number of relevant satellite missions from all major international space agencies will be and will become available to monitor environmental and climate change in the Arctic Ocean. Efficient and timely exploitation of the growing and vast amounts of data is, therefore, urgently needed.
The environmental variables are predominantly retrieved from imaging sensors with varying swath widths, except for the altimetry nadir profiling sensing method. The largest observation gaps in the Polar regions are related to radar and laser altimetry. However, thanks to the launch of CryoSat-2 in its near Polar orbit in 2010, the altimeter-based observation gap has been significantly reduced from south of 82°N to 89°N. Moreover, observations of waves and sea ice drift from SAR imagers are often subject to acquisition priorities whereby a larger swath is favored for sea ice mapping and drift while imagette/vignette modes are usually favored for retrievals of ocean waves. Nevertheless, a large “Hole over the geographical Poles” remains for the majority of satellite sensors, due to the orbit inclination.
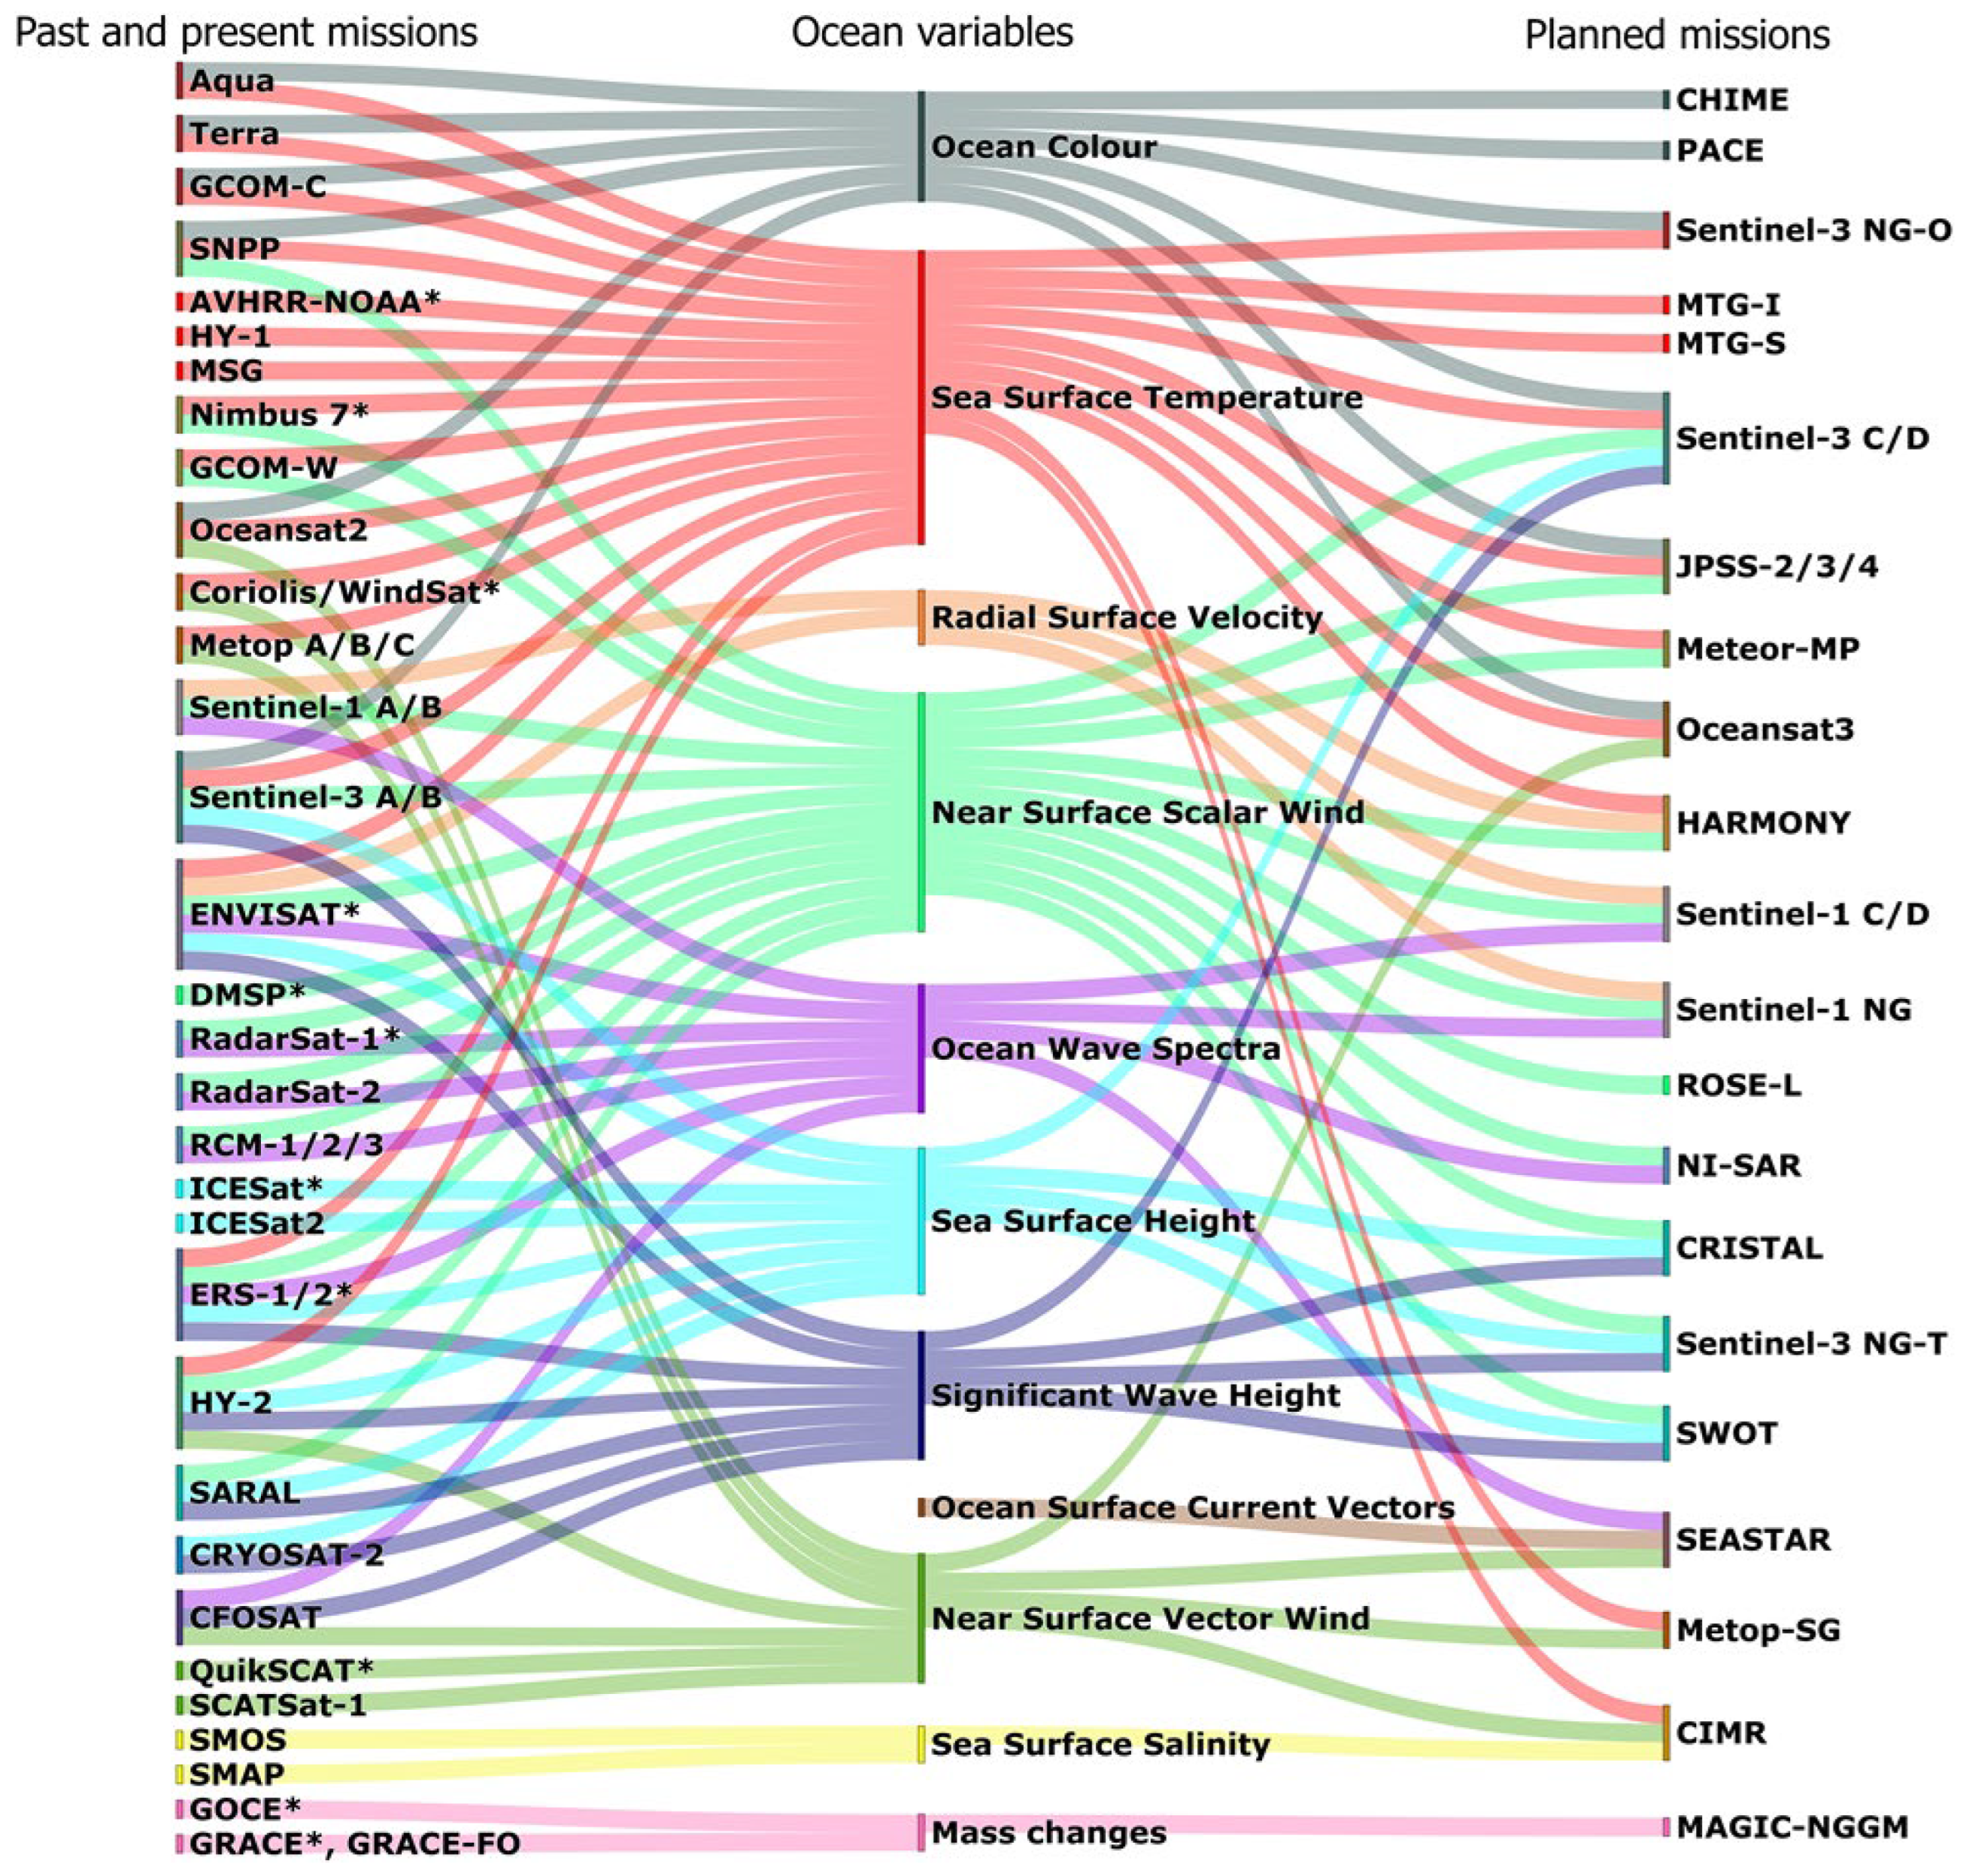
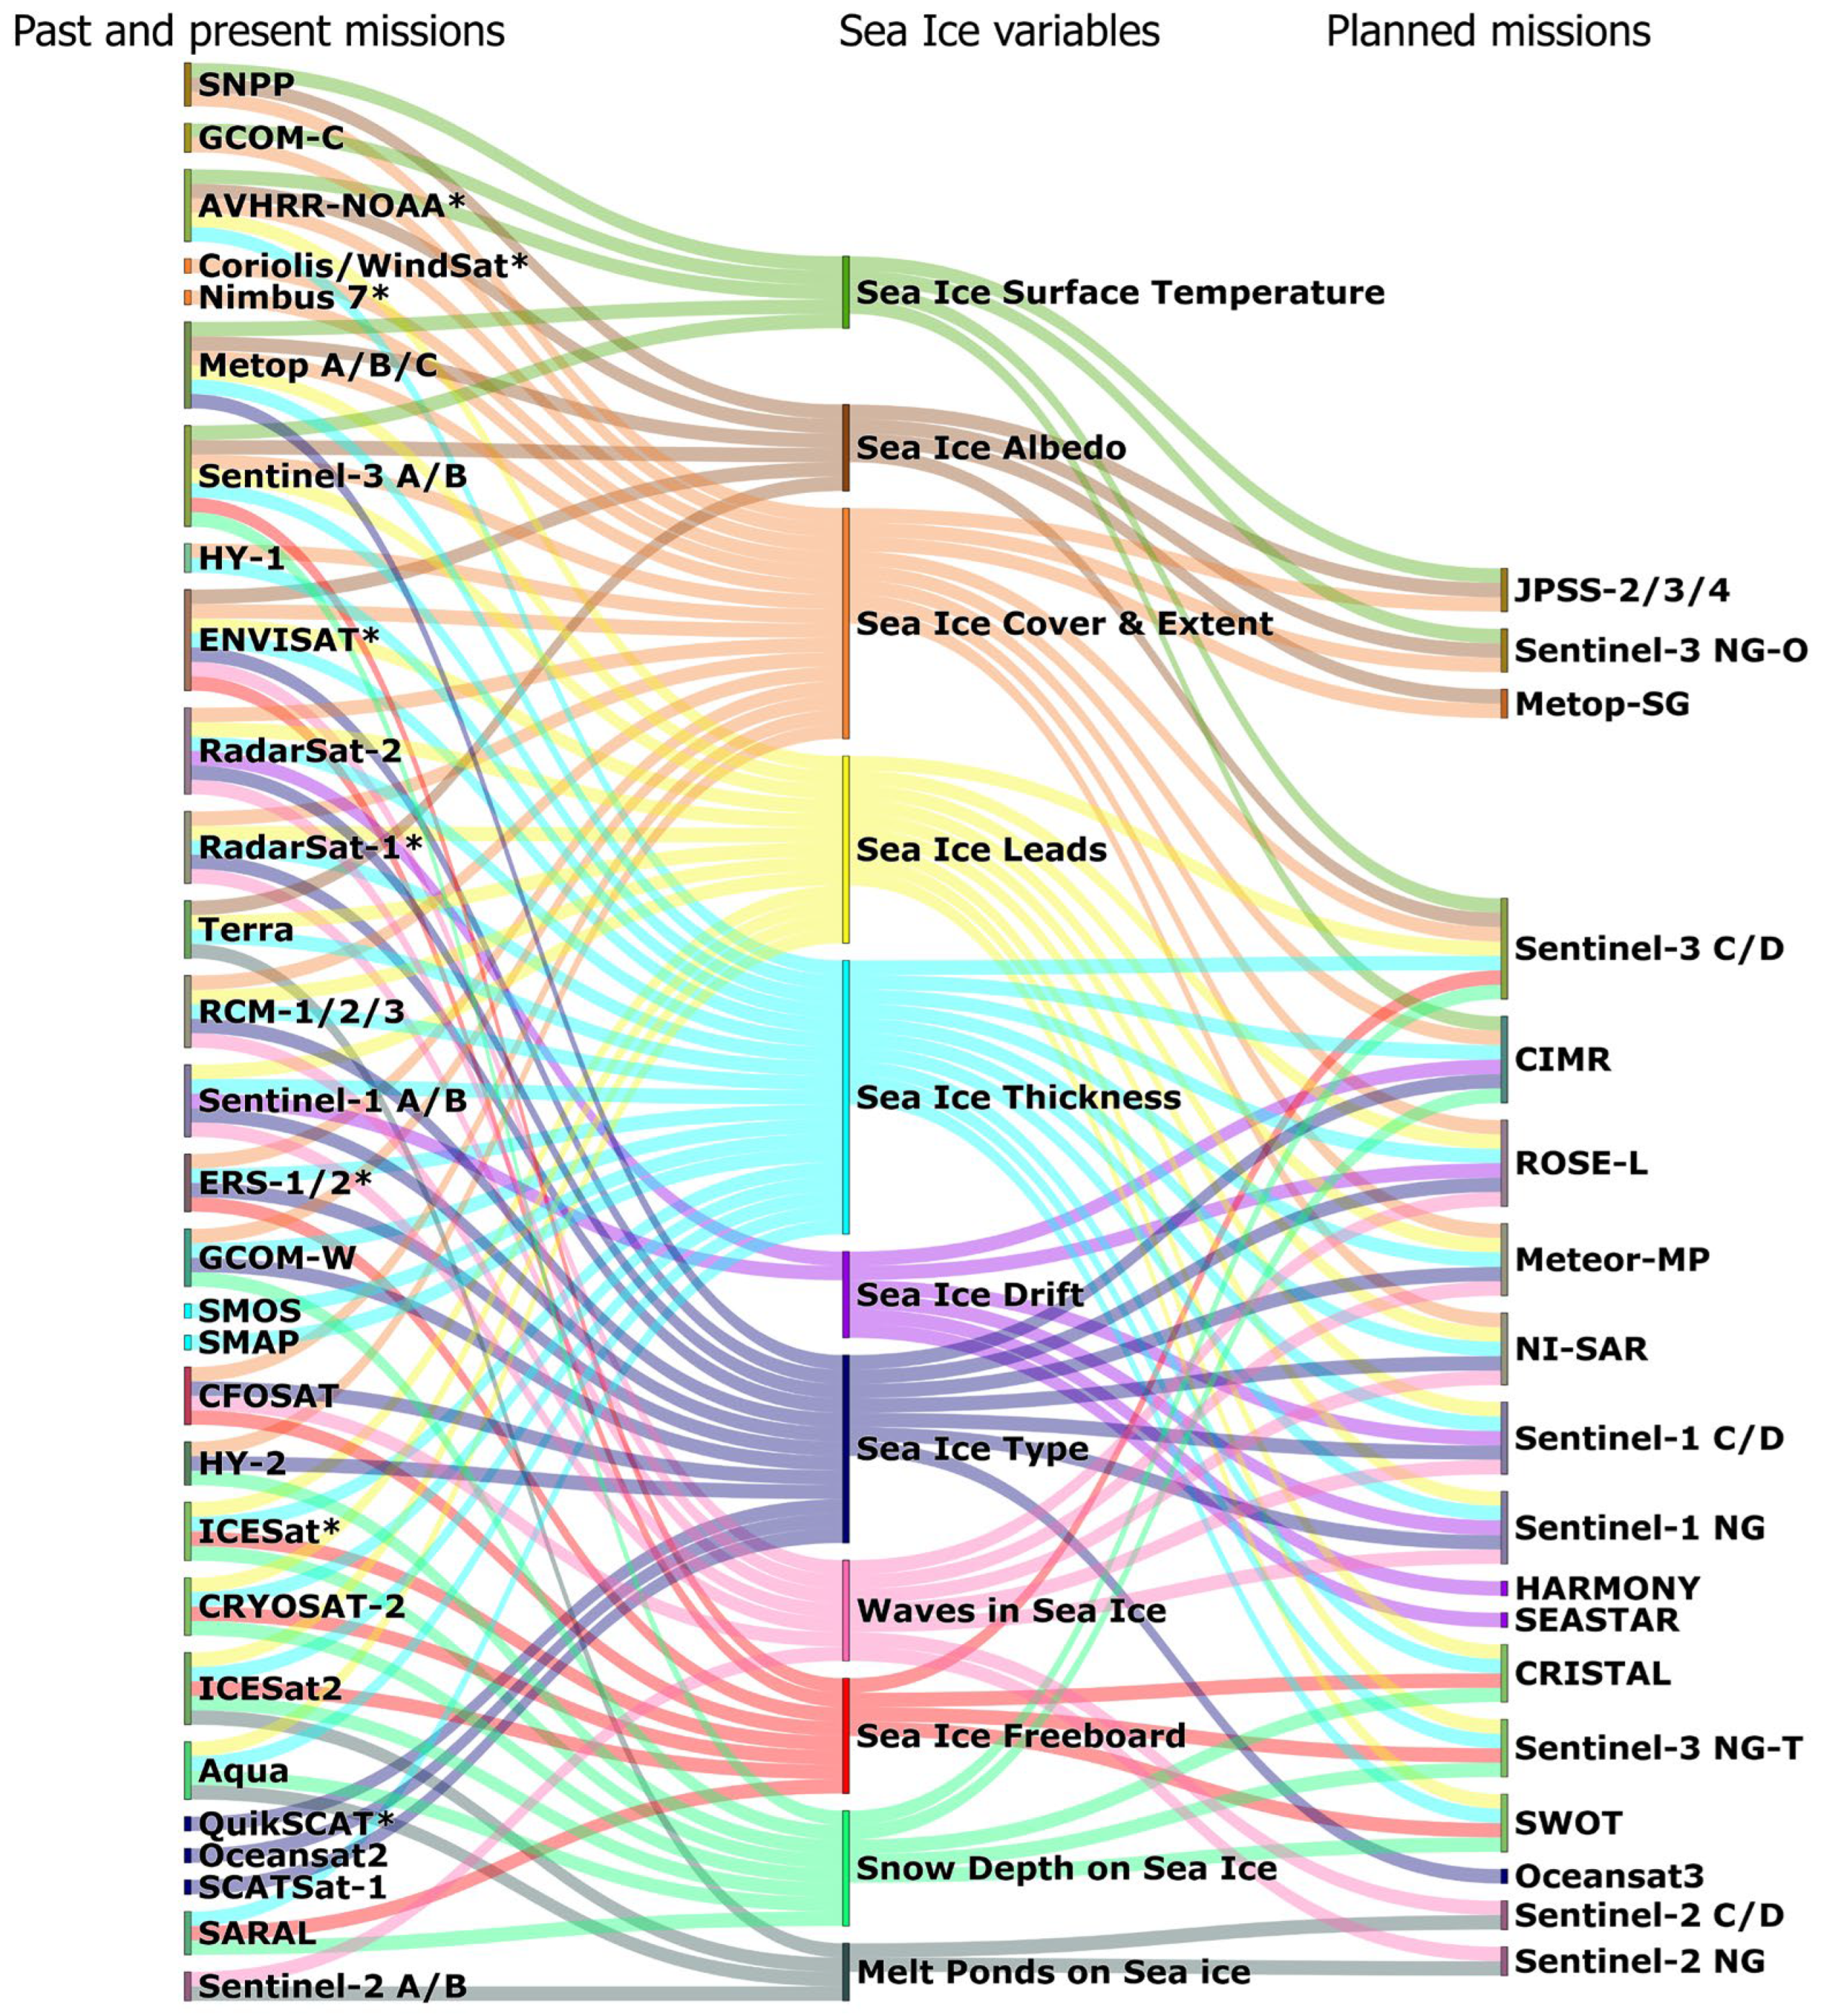
The Sankey diagrams displayed in
Figure 2 and
Figure 3, for a selected number of missions, link the past, present and future approved satellite missions with the observed ocean and sea-ice-related parameters and quantities, respectively. The figures provide another synthetic view of the remote sensing observational continuity and complementarity, although not all relevant missions are included in order to maintain the readability of the diagrams.
Despite their fundamental importance to examine the main Arctic Ocean scientific challenges, satellite observations still have limitations, justifying the need for complementary information sources. These limitations are further addressed below.
First, the compilation of satellite observations to build homogenous, cross-calibrated and cross-validated, long and continuous data records of climate quality, across multiple satellite missions, is difficult. Sensors and platforms degrade with time, sometimes stop functioning, and need to be substituted with new ones, some with different technical specifications. The reconciliation of data sets is very challenging, as Esau et al. [
17] show in an extensive literature discussion. As environmental changes in the Arctic are known to be relatively fast (e.g., [
8]), and the observational records are rather short (in the climatic sense), even a single year with lower-quality data can cause significant deviations and uncertainty for long-term climate records. Literature is, therefore, very inconclusive as to what degree satellite sensor calibration and inter-calibration properly apply to climate-quality long-term data records in the Polar regions.
The lack of Fiducial Reference Measurement (FRM) [
27] in-situ data to accurately calibrate and validate the satellite observations in the Arctic Ocean is also a major limitation in the generation and validation of homogeneous datasets and for the evaluation of new processing strategies. Several initiatives have been launched by ESA to define FRM strategies for satellite observations, but these are currently limited to a few types of observations (FRM4SOC for Ocean Colour, FRM4STS for Surface Temperature, FRM4Alt and St3TART for radar altimetry topography of the ocean, inland waters, sea ice and land ice). Each study is designed to develop and apply rigorous metrology approaches to ensure that satellite data are traceable to S.I units with a full uncertainty budget. More generally, comparing satellite observations with in-situ data in the Arctic Ocean, for instance, to better understand local dynamical processes and interactions, is highly challenging as the limited amount of in-situ data is usually available in given locations for practical logistic reasons. As such, the dynamical marginal ice zones are not properly sampled with in-situ data. In other cases, in-situ observations may exist but are not publicly available, or only distributed at low temporal resolutions (typically monthly) that are not suited to study high-frequency processes and interactions. The heterogeneity, in time and space, of ocean and ice processes also imposes challenges in terms of sampling strategies for satellite data validation and the use of multiple data sets in synergy, since the acquisition times and locations introduce uncertainties due to natural geophysical variability.
Second, many long-term optical (visible to thermal infrared) satellite data products are fragmented due to cloud cover, haze, and daylight variability. Therefore, a strong bias towards observations in clear sky conditions is observed, with both seasonal and geographical variations, as winter darkness is an additional challenge in the Polar regions. Interpolation and gap closure methods are thus questionable as they rely on an unjustified assumption that the statistics under a clear sky and overcast are the same. This is not the case in the Arctic boundary layer, but detailed studies of this problem from a climate perspective are lacking. In turn, climate datasets such as the ESA Climate Change Initiative (CCI) [
28] may still encounter limitations such as scarcity and low resolutions, in addition to a lack of sufficiently long time series of consistent and high-quality measurements.
In addition, other types of limitations are more specific to individual missions, instrument type, cross-calibration between similar sensors at different missions, and retrieved variables. The following paragraphs summarize some of these issues.
The potential of using satellite sun glitter imagery such as the Sentinel-2 Multi-Spectral Instrument (MSI) for ocean wave detection has been successfully demonstrated [
29], and even in the presence of sea ice [
14]. Such an approach could be used to complement the Sentinel-1 measurements, with the advantage of giving access to 2-D wave spectra. However, strong temperature and humidity gradients in the atmospheric boundary layer make the Arctic a very cloudy and hazy place, which severely limits the availability of exploitable Sentinel-2 optical images. Moreover, wave pattern detection from imaging spectrometers such as Sentinel-2 requires favorable Sun illumination angle, and alignment between the instrument and the surface wave field. The seasonal sun cycle at polar latitudes, with winter darkness and 24-h summer sunlight, limits the data availability during most of the year.
Regarding satellite radar altimetry, the current processing of conventional Low-Resolution Mode (LRM) altimeters such as ERS-1/2, ENVISAT Ku-band and SARAL Ka-band radars was developed for open water surfaces. In the presence of sea ice, these algorithms break down, meaning that the accuracy of the sea surface height (SSH) observations and the sea ice freeboard estimation can be strongly impacted in large areas of the Arctic Ocean and adjacent seas [
24,
25]. The Ku-band SAR altimeters onboard the CryoSat-2 and Sentinel-3 missions have proven to be extremely valuable in sea ice-covered regions, thanks to higher along-track resolution (typical processing delivering an along-track resolution of about 300 m), which enables to better detect sea ice leads from specular reflection signals in the radar echo return. However, for open ocean applications, the across-track resolution of the SAR altimeter is variable from ~2 to 16 km depending on the sea state. Additional complications emerge when using SAR altimetry at high along-track resolution due to the Doppler signals induced by moving ocean swell waves, which impact altimeter geophysical retrievals if not handled properly. Moreover, most combined products are still experimental and incomplete, which makes them difficult to use for climate change studies [
30]. Still, one can expect some progress thanks to the Sentinel-6-MF altimetry mission, launched in 2020 [
31] and simultaneously operated in SAR and LRM modes. Despite its orbit inclination being limited to 66°N, it reaches seasonally sea ice-covered regions such as the Hudson Bay. Further analyses and comparisons between the simultaneous measurements in both modes may help improve the LRM processing method in the presence of sea ice, opening the possibility to reprocess 30 years of LRM altimetry data measured by ERS-1/2, ENVISAT, SARAL/AltiKa, and CryoSat-2 in the Arctic region.
In addition to the sea ice contamination in conventional radar altimetry SSH measurements, Cancet et al. [
18] highlight the fact that most of the past and present altimetry missions that reach high latitudes are sun-synchronous. This strongly limits their capability to observe part of the ocean tidal cycles. However, thanks to the higher density of ground tracks in high latitude regions, it is possible to bin the altimetry measurements to reconstruct time series with higher time sampling and consequently reduce the tidal aliasing effects. A mission such as CryoSat-2 brings remarkable measurements to improve the tidal estimates in the Arctic Ocean, thanks both to its SAR and SAR-interferometric modes that enable to obtain more accurate SSH observations in sea ice covered coastal regions, and to the fact that it is non-sun-synchronous, which gives access to major tidal components that are aliased to infinite periods in sun-synchronous observations. As such, a long observational gap between the CryoSat-2 and CRISTAL missions would have a serious impact on the quality of the tidal retrievals. This would limit the uncertainty estimates of the tidal models in the Arctic Ocean, which are, among other applications, used to remove the ocean tide signals from the altimeter SSH measurements to build the climate products.
The penetration depth of the altimeter pulse transmitted from a radar (e.g., ENVISAT, CryoSat-2, Sentinel-3 and Sentinel-6 in Ku-band, SARAL/AltiKa in Ka-band) or a laser (ICESat-2) signal in the snow layer that covers the sea ice is also a source of uncertainty when estimating the sea ice freeboard and hence the sea ice thickness. Meanwhile, this effect can be exploited as an indirect means to estimate the snow-cover depth on sea ice, as the Ku band penetrates into the snow and thus measures the range to the bottom of the snow layer, while laser observations measure the range to the top of the snow layer ([
32,
33]). Ka-band radar pulses are considered to reflect at a different scattering horizon in the snow ice layers although this appears to be somewhat dependent on specific snow properties and ice layering. Such combination requires that missions with the necessary instrumental characteristics fly simultaneously and that collocated measurements can be used (lidar altimetry being impacted by cloud cover, unlike radar altimetry), for instance taking advantage of experiments such as Cryo2Ice, which started in 2020 and aimed at maximizing the number of coinciding orbits for the CryoSat-2 and ICESat-2 missions thanks to satellite maneuvers. In practice, such an approach is currently limited to the concurrent measurements of SARAL/AltiKa (only radar altimeter in Ka band, launched in 2013), or ICESat-2 (launched in 2018), with Ku-band altimeters, i.e., mainly CryoSat-2 and Sentinel-3 in the area.
The uncertainty of the sea ice thickness estimated from radar altimeter sea ice freeboard observations strongly increases in the case of thin ice (less than 0.5 m). This is mainly due to the remaining errors and associated uncertainty in the retracking algorithms in sea ice-covered regions and to the uncertainties linked with the penetration into the snow layer on top of the sea ice. Radar altimeter estimates of sea ice thickness are also strongly impacted by the presence of meltwater ponds on the ice in summer, which makes it challenging to differentiate from leads, and high-quality products are generally only available in winter. Laser altimetry can also be used but is, as already emphasized, affected by the presence of clouds. Thin sea ice thickness can be retrieved more accurately thanks to microwave radiometers such as MIRAS onboard SMOS, or the conically scanning SMAP mission, both operating at L-band. However, brightness temperatures must provide data at high radiometric fidelity. Additional observations from spectroradiometers such as Sentinel-3 OLCI (visible spectrum) and SLSTR (shortwave and thermal infrared) or MODIS onboard the NASA Aqua mission and AVHRR onboard past NOAA satellite missions, are also very useful. Merged sea ice thickness products can then be generated, such as the weekly CS2SMOS products [
34] that are delivered at 25 km resolution. SAR imagery from ENVISAT, RadarSat-2 or Sentinel-1 can also be used to infer sea ice thickness, considering the ratio of backscattering at different polarizations (e.g., [
35,
36]); however, this approach still has strong limitations as it is based on strong empirical assumptions on the relationship between sea ice thickness and the polarimetric response, and only works for some sea ice types. New approaches based on machine learning trained with in-situ sea ice thickness data and applied to Sentinel-1 SAR data show promising results [
37]. Optical and SAR images have also been recently used to train a neural network algorithm and produce an unprecedented and promising record of 10 years of Summer sea ice thickness based on CryoSat-2 altimetry, but still with some underestimates in regions of thick multi-year ice [
38].
Vertical in-water profiles of temperature, salinity, oxygen, etc., obtained from gliders, ARGO floats, fixed moorings and research shipborne expeditions provide a vital set of measurements that are necessary to complement satellite measurements in the open ocean. In ice-covered waters, icebreakers of polar-class vessels are required. With the notable exception of ocean color radiometry, satellite observations measure signals expressed at the very surface of the water column. Such signals are surface expressions of all the processes occurring at the same time in the water column and are typically related intimately to the processes occurring beneath the surface within the upper ocean. While satellite data sets are the backbone of our observing system in many areas (and particularly in the polar regions), only with a sufficient density of surface and subsurface oceanographic and sea ice measurements can we target to gain a full picture of their dynamics.
4. Future Missions, and Their Expected Capability to Answer Today’s Challenges
As emphasized in
Section 3, the following list of environmental variables is still not retrieved with sufficient temporal and spatial coverage, spatial and temporal resolution, and accuracy to further understand the changes in the Arctic Ocean:
In addition, there is a number of interactive processes and mutual feedbacks that challenge studies of the high latitude seas and the Arctic Ocean, including:
Boundary layer atmosphere/sea ice/upper ocean interactions
Momentum, gas and heat exchange between the atmosphere, sea ice and ocean
Mesoscale ocean dynamics
Marginal ice zone processes
Freshwater and biogeochemical inputs from rivers and land (e.g., permafrost melt)
The approved future satellite missions, both European and other third-party missions, will provide extended observational capacity to address these challenges and advance the understanding of the complexity of the Arctic Ocean changes and multi-disciplinary interactions. This is further detailed hereinafter with references to the selected missions presented in
Figure 2 and
Figure 3.
The continuity of currently operational radar and infrared radiometer missions is already ensured, allowing the creation of long-term overlapping of high qualitative datasets. Sentinel-1 C and D will sustain C-band SAR measurements up to 2034, while Sentinel-3 C and D SRAL, SLSTR and OLCI instruments are planned to fly up to 2035, providing valuable ice and ocean measurements up to 82°N and thus covering the regions with most of the human activities in the Arctic Ocean. Concept studies are also ongoing to prepare the future Sentinel Next Generation missions (beyond 2032), in particular, the Sentinel-3 NG Topography mission. Several approaches (i/a constellation of a dozen of nadir radar altimeters, ii/a constellation of two swath radar altimeters, or iii/a constellation of one swath altimeter and several nadir altimeters) have been evaluated, that should, whatever the selected configuration, provide unprecedented coverage of the global ocean for a topography mission. The selected configuration is currently (in December 2022) the constellation of two swath radar altimeters, but this will strongly depend on the outcomes of the SWOT mission and further studies are ongoing.
The Surface Water and Ocean Topography (SWOT) mission developed by NASA and CNES [
39] was launched in December 2022, with a lifetime until at least 2026. It has two main instruments. The conventional low-resolution mode (LRM) POSEIDON-3 nadir pointing radar altimeter operating in the Ku band will measure the ocean topography, significant wave height, and wind speed at 25 km resolution, with a repeat orbit of 22 days. While offering no SAR capability, the heritage of this class of instruments is very long and stable. The completely new Ka-band radar interferometer instrument (KARIN) will be the first swath instrument to provide measurements of inland water river and lake elevations and sea surface height over the ocean supporting applications such as ocean circulation and internal tides. KARIN operates as two off-nadir swaths of 50 km width on either side of the nadir altimeter. Additional information may also be accessible from SWOT such as sea ice elevation, sea ice thickness and ice sheet topography following further research and development using in-orbit SWOT data. However, the mission will have limited Arctic coverage due to its 78° orbit inclination, excluding most of the central Arctic Ocean.
EUMETSAT Metop—Second Generation (Metop-SG) polar-orbiting satellites [
40] will ensure continued meteorological observations from 2023 to 2043. The multi-spectral imager METImage will measure sea surface temperature and sea ice cover and temperature with a ground sampling of 500 m. The SCAT scatterometer will derive sea ice coverage and drift at a resolution of 12–24 km while the Microwave Sounder MWS will deliver horizontal wind speed over sea ice products with a footprint up to 40 km. The Microwave Imager (MWI) provides 18 channels from 18–183 GHz and Ice Cloud Imager (ICI) offers 11 channels at frequencies from 183 to 664 GHz. Both instruments use a conical scanning approach (offering a wide swath) and will provide information on some relevant surface parameters (snow, sea ice) at a relatively coarse resolution of ~50 km together with a host of products related to precipitation and atmospheric state. The observation will be pan-Arctic with an exact repeat cycle of 29 days, but with partly swath overlap at high latitudes, ensuring higher repeatability.
The Copernicus Imaging Microwave Radiometer (CIMR) expansion mission [
41] is one of the six Copernicus Expansion Missions currently being implemented by the European Space Agency and the European Commission. CIMR is designed to provide measurement evidence in support of developing, implementing, and monitoring the impact of the European Integrated Policy for the Arctic. Since the impact of changes in the Polar regions has profound impacts globally, CIMR will provide measurements over the global domain serving users in the Copernicus Ocean, Land, Climate and other Service application domains. Two satellites are being implemented (to be launched sequentially), each with a design lifetime of 7.5 years and sufficient fuel to last for up to 12 years (thus providing up to ~20 years of continuous data). CIMR will provide high-spatial resolution microwave imaging radiometry measurements and derived products with global coverage and sub-daily revisit in the polar regions and adjacent seas. The primary instrument is a conically scanning low-frequency, high spatial resolution multi-channel microwave radiometer. A dawn-dusk orbit has been selected to fly in coordination with MetOp-SG-B1 allowing collocated data from both missions to be obtained in the Polar regions within +/−10 min. A conical scanning approach utilizing a large 8m diameter deployable mesh reflector with an incidence angle of 55 degrees results in a large swath width of ~2000 km. This approach ensures 95% global coverage each day with a single satellite and no hole at the pole in terms of coverage. Channels centered at L-, C-, X-, Ku- and Ka-band are dual polarised with an effective spatial resolution of <60 km, ≤15 km, ≤15 km and <5 km (both Ka- and Ku-band with a goal of 4 km), respectively. Measurements are obtained using both a forward scan and a backward scan arc. In-flight calibration is implemented using active cold loads and a hot load complemented by periodic pitch maneuvers for both deep space and the Earth’s surface. On-board processing is implemented to provide robustness against radio frequency interference and enables the computation of modified third and fourth Stokes parameters for all channels. This solution allows many Level-2 geophysical products to be derived over all earth surfaces including sea ice (concentration, thickness, drift, ice type, ice surface temperature) sea surface temperature, sea surface salinity, wind vector over the ocean surface, snow parameters, soil moisture, land surface temperature, vegetation indices, and atmospheric water parameters serving all of the Copernicus Services. The CIMR mission will be a game-changer for satellite measurements in the polar regions with a first launch expected in 2029.
The Copernicus polaR Ice and Snow Topography ALtimeter (CRISTAL) expansion mission [
42] is dedicated to the measurement and monitoring of sea ice thickness and overlying snow depth. Building on the ESA CryoSat Earth Explorer and Sentinel-3 and Sentinel-6 SAR nadir pointing altimeters, it is designed to fly in an optimized orbit covering polar regions with each satellite (two are in preparation) having a design lifetime of 7.5 years. The polar omission will be lower than 2 degrees (88° inclination) and the mission will have a repeat sub-cycle shorter than 10 days. IRIS, the dual frequency Ku and Ka nadir pointing Interferometric Radar altimeter for Ice and Snow, will measure and monitor the variability of ice elevation and thickness in polar regions, as well as sea surface height, significant wave height, and ocean surface wind, with an optimized ~80m resolution along the track. The first launch of CRISTAL is currently expected in 2027.
Copernicus Hyperspectral Imaging Mission for the Environment (CHIME) [
43,
44] is also part of the Copernicus Expansion Missions. From 2029 to 2039, it will support agricultural services and sustainable agricultural management, meanwhile providing valuable measurements of ocean color in the coastal and ocean regions. With its 84° orbit inclination, the hyperspectral imager is expected to provide information on phytoplankton abundance, colored dissolved organic matter and total suspended matter in the open waters and the MIZ, complementing other multispectral sensors such as Sentinel-3 OLCI, during the polar daylight season.
The Radar Observing System for Europe L-band (ROSE-L) mission is also one of the six Copernicus Expansion Missions [
45] and will provide day-and-night all-weather monitoring of Earth’s land, oceans and ice from 2028 to 2035. It will significantly contribute to the monitoring of polar ice sheets and ice caps, sea ice extent and seasonal snow thanks to its pan-Arctic coverage. The L-band SAR will provide complementary measurements to the C-band SAR of Sentinel-1. Sea ice-related (type, concentration, drift) measurements will have a daily revisit and a resolution better than 200 m for Level-2 processed data.
The ESA Earth Explorer 9 Far-infrared-Outgoing-Radiation Understanding and Monitoring (FORUM) mission [
46], planned to fly from 2027 to 2031, will provide new insight into the Earth’s radiation budget. Its sounding instrument will deliver, among many other geophysical variables, pan-Arctic cloud-sensitive sea-surface temperature measurements.
The ESA Earth Explorer 10 bi-static HARMONY mission [
47] will fly in formation with the Sentinel-1D satellite, from 2028 to 2033. It will be dedicated to the observation and quantification of small-scale motion and deformation fields at (i) the air-sea interface induced by winds, waves and surface currents; (ii) solid Earth and (iii) in the cryosphere (sea ice and glacier flows). Two HARMONY satellites will be equipped with receive-only SAR antennas and will fly close to Sentinel-1D, acquiring the reflected signals from Sentinel-1D and thus providing valuable angular diversity to retrieve the respective deformation fields. An Infrared Radiometer instrument will provide complementary cloud-sensitive sea surface temperature measurements. The Arctic will be sampled every 1 to 4 days, in a 98° inclination similar to Sentinel-1.
If selected, the ESA Earth Explorer 11 candidate mission SEASTAR, a mission to study ocean sub-mesoscale dynamics and small-scale atmosphere-ocean processes [
48], is expected to provide Arctic-wide ocean surface current, sea ice drift and surface wind vectors at 1 km resolution across a 100 km swath. Its Along-Track Interferometric (ATI) SAR would be the first instrument to provide observing capability for total surface current and sea ice drift vectors in a single-pass with the creation of synoptic 2D maps of the current field. Those current vectors shall be collocated with wind vectors and wave spectra. Great benefits are expected from HARMONY and SEASTAR as combining ATI Doppler estimates of current and ice drift with waves at high resolution across the ice edge would advance the understanding of wave–ice–ocean interaction in the marginal ice zone.
Finally, the Sea surface KInematics Multiscale monitoring (SKIM) mission [
49] was a candidate satellite for the ESA Earth Explorer 9. It is aimed at mapping ocean surface currents, waves and ice drift up to 82° of latitude. It would have implemented a Doppler radar inherited from Chinese-French CFOSAT SWIM, allowing surface current observations with a resolution better than 40 km and a repeat cycle shorter than 10 days. It would have allowed the characterization and quantification of ocean surface kinematics and their impact on multi-scale ocean-atmosphere exchanges. Further development of the SKIM concept in preparation for future Earth Explorer opportunities is anticipated.
These future European satellite missions, either already approved or still under preparatory studies, will ensure continuity of observation with the current missions, with an improvement of the time and space sampling, as well as expanding the ocean and ice variables monitored from satellite sensors. In general, they will considerably improve the Arctic Ocean coverage. Future satellite missions are also planned by other space agencies, notably Canada, China, India, Japan, Russia and the USA with, e.g., the Joint Polar Satellite System (JPSS), MAGIC-NGGM, OceanSat-3, the NASA/ISRO NI-SAR mission and the Meteor-MP constellation, that will further improve the observational capacity in the Arctic, in combination with the European missions.
The expected benefits of these future satellite missions, and possible remaining gaps, in the observation of the sea ice and ocean geophysical parameters, are discussed in more detail in the following sub-sections.
4.1. Sea Ice-Related Parameters
From 2028, sea ice drift and deformation observations will be well covered by the approved CIMR, ROSE-L and HARMONY missions, complementing Sentinel-1 capacities. Until then, studies will, however, be limited by the spatiotemporal restricted coverage of SAR acquisitions in HH and HV modes.
Regarding sea ice freeboard height and sea ice thickness, an observational gap is expected in the near future. The CryoSat-2 and SMOS (for thin ice) missions (end-of-life (EOL) currently planned in 2024 and 2025, respectively) are far beyond their design lifetimes of 3 years, and while functioning well today, are coming toward the end of their operational lives due to depletion of consumables (fuel used to maintain the orbit and battery life). This means that there is a significant risk that these variables will not be measured beyond the Sentinel-3 orbit limit (81.5°N) until the launch of the CIMR and CRISTAL missions in 2028–2029. The NASA SMAP mission may provide continuity to L-band measurements of this sea ice. NASA/CNES SWOT (planned to be operated between 2022 and 2026) will complement the Sentinel-3 measurements only up to 78°N. Hence, there may be a major step-back for Arctic sea ice thickness monitoring and studies due to orbit limitations of the available satellites during the period 2026–2027.
Sea ice concentration/extent observations are presently obtained by AMSR-2 on Aqua, MetOp and Sentinel-3. CIMR will provide a step change in functionality offering C-band at a gridded spatial resolution of 5–10 km in addition to K- and Ka-band measurements at <5 km spatial resolution. MetOp-SG, ROSE-L and S3-NG-T will secure extensive observational capability, sufficient for continuous regular assimilation and updates of Arctic Ocean forecasting systems such as, e.g., the Copernicus Arctic Monitoring and Forecasting Service. The Sentinel-3 Next Generation Topography mission (S3-NG-T) will include an imaging interferometer and a nadir altimeter that will guarantee the future of Sentinel-3 SRAL measurements while enhancing performance in the 2032+ timeframe.
4.2. Ocean-Related Parameters
Ocean color analysis is currently performed with Sentinel-3 and Aqua MODIS data. CHIME will ensure an observational continuity in the coastal zones starting in 2029, but the coverage will remain limited to 84°N, covering most of the ice-free waters during the daylight season, including the productive MIZ. The Sentinel-3 Next Generation Optical mission (S3NG-O) will include an advanced OLCI instrument (AOLCI) that will guarantee the future of OLCI measurements while enhancing performance in the 2032+ timeframe.
Sea Surface Temperature is currently provided by the Sentinel-3 Sea and Land Surface Temperature Radiometer (SLSTR). This multi-frequency thermal infrared radiometer is the reference SST mission providing accurate SST based on the use of cooled detectors, the use of two onboard calibration blackbodies with performance traceable to ST and an innovative dual view conical scanning technique. These design elements have a long unbroken heritage from ATSR-1 first flown on ERS-1 in the 1990s out to 2032 in the form of Sentinel-3C and Sentinel-3D. After this, the Sentinel-3 Next Generation Optical mission (S3NG-O) will include an advanced SLSTR instrument (ASLSTR) that will guarantee the future of SLSTR measurements while enhancing performance in the 2032+ timeframe.
As for the sea ice freeboard parameter, sea surface height observation in the Arctic Ocean highly relies on CryoSat-2 and Sentinel-3. A CryoSat-2 EOL in 2024 as it is planned today, before the CRISTAL launch expected end of 2027, will strongly limit the Arctic coverage with high-quality radar altimeter data (SAR and SARin modes), as the orbits of the Sentinel-3 and SWOT missions, which should be still operated during the CryoSat-2/CRISTAL gap, are limited to 81.5°N and 78°N, respectively. The Sentinel-3 Next Generation Topography mission (S3-NG-T) will include an imaging interferometer and a nadir altimeter that will guarantee the future of Sentinel-3 SRAL measurements while enhancing performance in the 2032+ timeframe.
The same applies to significant wave height measurements, which rely on Cryosat-2 for higher latitudes and to a more limited extent, Sentinel-3 SRAL. Despite the currently flying CFOSAT and planned SWOT missions, observations will be limited to the Sentinel-3 orbit coverage until 2027 and CRISTAL launch. ROSE-L will provide additional capacity with pan-Arctic coverage from 2028.
Ocean surface currents are currently only partially observed, either in terms of radial velocity derived from the Doppler shift from SAR observations (Sentinel-1) or as cross-track geostrophic currents derived from the radar altimeter sea surface height measurements. Reprocessing existing SAR data for retrieval of the Doppler shift is, therefore, highly recommended. Moreover, HARMONY will bring new bistatic observations in this field in 2028. A few years later, the proposed Earth Explorer mission SEASTAR could allow pan-Arctic surface current and sea ice drift measurement at 1 km resolution. Additionally, a future decision for the SKIM-like mission could complement those observations up to 82°N at a mean repeat cycle of 4 days.
Despite the various missions measuring ocean surface wind, the observations will be limited to 82°N after CFOSAT EOL and before HARMONY, CRISTAL, CIMR and ROSE-L provide a complementary and multi-sensor complete coverage of the Arctic Ocean. In addition, it should be noted that none of these missions will retrieve near-surface wind speed and direction in the presence of sea ice, which will remain as an observational gap when addressing the challenge of better understanding the air/sea ice/ocean interactions, Arctic weather and ocean predictability in the high latitude and Arctic Ocean.
Finally, sea surface salinity was not measured before the SMOS mission in 2009. Today both the SMOS and SMAP missions provide measurements of salinity derived from L-band microwave radiometers. It is, therefore, highly desirable to sustain salinity measurement from SMOS and SMAP until CIMR-A is launched in 2029, to ensure continuity and overlap of measurements and stability of the climate data record of sea surface salinity.
5. Conclusions
Comprehensive and quantitative understanding of the Arctic Amplification, sea ice break-up event, gyre spin-up, eddy generation and decay and dynamics in the MIZ are all limited due to observational gaps and limited process understanding. Exploitation and full use of the multi-sensor satellite measurements are, therefore, urgently needed although still challenging due to the lack of high-quality validation. In the future, new products and estimates of variables are expected to gradually emerge from the existing observations due to novel strategies and approaches including data-driven co-variability analyses, machine learning and Artificial Intelligence. Blended with data from new satellite missions this is, therefore, anticipated to accelerate our quantitative understanding and knowledge, allowing for significant advances in re-analyses and provision of long time series resolving sea ice and ocean parameters as well as major interactive processes and mutual feedbacks in the Arctic Ocean.
Satellite observations are fundamental in the monitoring of the Arctic due to the harsh climate, accessibility, and the difficulty to gather relevant and quantitative in-situ measurements above, at, and below the ocean surface. Therefore, the quality, continuity and novelty of satellite acquisitions are of prime importance. As such it is also highly urgent to secure proper validation and uncertainty assessments, requiring also continued dedicated ground truth measurements of essential ocean and ice variables, process studies and under-ice observations within the Arctic Ocean, and particularly in the marginal ice zone. This will require regular access to icebreaker facilities and the utilization of new technological instrumentation built for long-term in-water and surface observations, with efficient energy demands and capabilities for data retrieval also in year-round and seasonally ice-covered waters. The sustainability of field investigations will also require sharing of opportunities and data through international cooperation and coordination building on the FAIR principles.
In this review, we have evaluated the ability of future approved European missions, notably CRISTAL, CIMR, CHIME, ROSE-L, and HARMONY, blended with the continuity of existing operational missions such as Sentinel-1 C/D, Sentinel-3 C/D and MetOp-SG to fill observation gaps and advance the understanding and prediction of environmental and climate changes in the Arctic Ocean. In this context, complementarity and overlap of missions committed and planned by other space agencies will be important to overcome observational gaps. related to spatial-temporal coverage, sensor and product resolution, measurement capacity, and orbit inclinations. Some proposed but not yet selected missions such as SEASTAR will significantly contribute to filling some of these gaps for the ocean and sea ice aspects, as will mission concepts such as SKIM, building on the success of CFOSAT.
Because of the difficulty to observe the Arctic Ocean with the spatial-temporal resolution that would be needed, either from satellites or in-situ instruments, most studies rely today on the synergy between different types of satellite observations, in-situ measurements and numerical modeling, including re-analyses. Advances expected to emerge from the development of a Digital Arctic Twin, collocated and combined multi-modal data (in-situ and satellite) and model-driven physical constrained analyses, as well as the use of artificial intelligence, will strengthen the ability to deliver more reliable estimates, and hence predictions, of sea ice deformation, break-up, leads formation, new ice formation, sea ice freeboard height, sea ice volume and mean sea level. Such information about the Arctic environment and its changes will be increasingly important when human presence is expected to grow through increased shipping, fisheries and other activities in the Arctic Ocean. By bringing new observations, often at a higher spatial resolution, the approved future satellite missions will also contribute to improving the ability for validation of and assimilation in higher-resolution numerical models. They will thus contribute to a better understanding of the complex processes in the Arctic Ocean and allow the revision and upgrading of the sea ice thermodynamics and rheology modeling approaches to better reproduce the complexity of the ocean-air-sea ice interactions, including feedback processes. In turn, more accurate simulations, re-analyses and reliable reconstruction of long time series can be expected, which are of prime importance to characterize an Arctic Ocean in constant transformation.

 ,
, 


