Article

Preliminary Results of the Three-Dimensional Plasma Drift Velocity at East Asian Low-Latitudes Observed by the Sanya Incoherent Scattering Radar (SYISR)

1
Key Laboratory of Earth and Planetary Physics, Institute of Geology and Geophysics, Chinese Academy of Sciences, Beijing 100029, China
2
Institutions of Earth Science, Chinese Academy of Sciences, Beijing 100029, China
3
Beijing National Observatory of Space Environment, Institute of Geology and Geophysics, Chinese Academy of Sciences, Beijing 100029, China
4
College of Earth and Planetary Sciences, University of Chinese Academy of Sciences, Beijing 100029, China
5
Aerospace Information Research Institute, Chinese Academy of Sciences, Beijing 100094, China
*
Author to whom correspondence should be addressed.
Remote Sens. 2023, 15(11), 2842; https://doi.org/10.3390/rs15112842
Submission received: 20 April 2023 / Revised: 22 May 2023 / Accepted: 26 May 2023 / Published: 30 May 2023

Abstract

:
As the first advanced modular phase array incoherent scatter radar (ISR) established in the Eastern Hemisphere at low latitudes, Sanya ISR (SYISR) can measure the line-of-sight (LOS) velocity of ion drift in multiple directions, potentially yielding the spatial distribution of ionospheric plasma drift. Three beam-scanning modes are designed for plasma drift detection: meridian, zonal and cross-shaped (both meridian and zonal) plane, which will provide the distribution of plasma drift in latitude/longitude as well as altitude. The altitude profile of plasma drift and the first presented distribution of low latitude plasma drift in the meridian plane for March to May 2021 are inversed through LOS velocity using cross-shaped and meridian beam-scanning modes, respectively. A statistical correlation coefficient between the v p n and crest-to-trough ratio (CTR) of equatorial ionization anomaly (EIA) TEC and a case study of magnetic storm response in plasma drift show that the inversed plasma drift can be a good indicator in response to the changes in atmospheric tide and solar wind at different time scales and explain the corresponding ionospheric electron density variations at low and equatorial latitudes. This study proves that the SYISR-measured plasma drift is reliable and will play an important role in the atmosphere-ionosphere-magnetospheric coupling study in the East Asian region.

1. Introduction

Plasma velocity is a key parameter in the Earth’s ionospheric study, especially in the equatorial and low-latitude regions. Plasma velocity makes contributions to form equatorial ionization anomaly (EIA) [1,2], plasma irregularities [3,4], and equatorial electrojet (EEJ) [5]. Many scientists have made great efforts on measuring plasma velocity accurately and precisely, through either space-borne in-situ measurements or ground-based remote detection [6,7,8]. Each instrument has its advantages and disadvantages. The ion velocity meter (IVM), as a space-borne instrument, is widely used to measure the ion drift velocity and other physical parameters in the spacecraft reference frame in Defense Meteorological Satellite Program (DMSP), ROCSAT-1, Ionospheric Connection Explorer (ICON), etc. [9,10,11]. It can provide plasma velocity in its orbit which has wide coverage of latitude and longitude. Ionosonde, as a low-cost and running ground-based instrument, could provide long-time plasma velocity observations during the daytime [12]. Incoherent scatter radar (ISR), known as a very powerful instrument of ionosphere detection, can offer multi-parameters including the profile of electron density, electron temperature, ion temperature and line-of-sight (LOS) velocity through fitting the theoretical autocorrelation function with measured autocorrelation function derived from the backscatter signal [13].
At equatorial and low latitudes, the Jicamarca ISR in South America has contributed significantly to the detection of equatorial plasma drift over the last five decades [14]. The Jicamarca ISR can measure the vertical and zonal components of plasma drift velocities in the F-region at the altitude range of 250–700 km with an altitude resolution of 25 km and a time resolution of 5 min [15]. Based on the Jicamarca ISR and Atmosphere Explorer E (AE-E) drifts, Scherliess and Fejer [16] developed the first empirical model of the global equatorial vertical drift, which gives the local time dependence of the vertical drift during the geomagnetic quiet period under different seasons and solar flux. The vertical drift is upward during the daytime, with typical values of about 20–30 m/s during the June solstice and equinox, and slightly smaller values during the December solstice. They do not change much with the solar flux except in the afternoon sector during the solstice, when they increase from the solar minimum to the solar maximum. During the equinox and December solstices, the pre-reversal enhancement (PRE) in vertical drift increases substantially from the solar minimum to the solar maximum. The nighttime vertical drifts have typical values of about 20–30 m/s, and are largest in the late-night sector during December solstices under high solar flux conditions. Fejer et al. [17] showed a pattern of zonal drifts: the daytime zonal drifts are westward with a typical value of 40 m/s and do not vary with season and solar flux, while the nighttime zonal drifts are eastward and increase with solar flux. During the equinox and December solstices, the early night eastward drifts can reach about 200 m/s under solar maximum conditions. The post-midnight drifts decrease with local time and reverses near dawn.
A new ISR, named Sanya ISR (SYISR), was established for the first time at low latitudes in East Asia. It was specifically located at Sanya (geographic: 18.3°N, 109.6°E), south of Hainan Island in China. In addition, it differs from the conventional regime of ISR by the advanced modular phase array, which is capable of continuous long-duration observation and changing the beam direction with typical inter-pulse periods of several microseconds [18]. Thus, it can provide all three components of plasma drift velocity with high temporal and fine spatial resolution. Since the first operation in February 2021, SYISR has accumulated months of data after various experimental validations, such as regular ionospheric observations, plasma line measurements, plasma bubble experiments, moon imaging and meteoroid fragmentation observation experiments [19]. The initial evaluation of ionosphere parameters from ion line observations is shown in Hao et al. [20], which presents comparable results with other observations and models. In this paper, we present the 3D spatial distribution of drift velocities in East Asia for the first time. Three different beam scanning modes and the corresponding line-of-sight (LOS) velocity are presented in Section 2. Section 3 describes the drift inversion method and procedure in detail. The inversion results are discussed in Section 4. The final summary is in Section 5.

2. Experiment Setting and Line-of-Sight Velocity

We designed different kinds of experiments to adapt the observation of ionosphere plasma drift and listed them in Table 1 in detail from March to May 2021. There are three scanning modes in meridian (NS), zonal (EW) and cross-shaped (NS + EW); both meridian and zonal planes have been set in the observations [20]. For ionospheric F region detection, long pulses with 480 μs pulse length and 16 ms inter-pulse periods (IPPs) were utilized, so the range resolution will be 75 km. The time resolution depends on both the number of beams and the integration time of data processing. For these data, the integration time of data processing is 15 s, so the time resolution of ionosphere parameters will be 10.25 min for 41 beams. We arrange the elevation angle to increase from the minimum value to 90° and then decrease to the minimum value at an equal interval angle in the meridian or zonal plane. When the minimum angle of elevation becomes lower, the horizontal range of coverage will be wider but the echoes signal-to-noise ratio (SNR) of beams with low elevation angle will be lower. The accuracy of LOS velocity is almost the most important factor in plasma drift inversion with high quality. Figure 1 shows the geometry of the beams and corresponding LOS velocity for these three scanning modes. Figure 1a–e are for NS mode, Figure 1f–j are for EW mode and Figure 1k–s are for meridian and zonal planes of NS + EW mode. For NS mode, Figure 1a shows the geometry of the beams with 41 beams from north to south by red and green (elevation angle lower than 50°) dots and the location of the zenith beam. Figure 1b–e only show these beams with elevation angles larger than 50°. Figure 1b,c show the LOS velocity (Vi) and its error (dVi) during the daytime (12:30:57 LT) and Figure 1d,e show the Vi and dVi during the nighttime (21:24:34 LT). The positive value of Vi means the ions are away from the beam. During the daytime, Vi shows a positive value in all latitudes below 300 km, and a positive value at a higher latitude range of 18.4°–21.4°N and negative value at a lower latitude range of 15.2°–18.4°N. dVi is mostly less than 5 m/s below the altitude of 450 km and beams with elevation angles larger than 55°. During the nighttime, Vi shows a positive value on the northern side and a negative value on the southern side at an altitude of 200–400 km. At an altitude below 200 km and above 400 km, the plot of Vi shows noise and dVi is much larger of more than 5 m/s. Similarly, Figure 1f–j show the observation by 41 beams EW mode. Figure 1f shows the geometry of the beams with 41 beams from west to east. During the daytime, Vi shows a positive value on the western side and a negative on the eastern side in Figure 1g. dVi shows small values of less than 5 m/s below 400 km in Figure 1h. During the nighttime shown in Figure 1i,j, Vi shows mostly negative value, implying the ion motion of eastward or downward, at the altitude range of 200–400 km where dVi is less than 5 m/s. At an altitude below 200 km and above 400 km, the plot of Vi shows noise and dVi is much larger of more than 5 m/s. Observations by NS + EW mode in Figure 1k–s also show these different features during daytime and nighttime. There are both 21 beams arranged at meridian and zonal planes in Figure 1k. At 11:35:22 LT shown in Figure 1l,m,p,q, Vi shows a negative value on the southern and eastern sides and a positive value on the northern and western sides, and corresponding dVi is less than 5 m/s below 450 km. At 22:30:19 LT shown in Figure 1n,o,r,s, Vi shows the opposite pattern and the corresponding dVi is larger than that during the daytime. It seems that dVi is sensitive to the beam’s direction and local time. Thus, we make statistics of dVi under different azimuth and elevation angles for all experiments in Table 1. The results are shown in Figure 2. In Figure 2a–l, there are some variations of dVi at 300 km altitude with local time under four different azimuth angle bins from left to right and three different elevation angle bins from top to bottom. In every panel, dVi shows a larger value during the nighttime than the daytime. At 09:00–19:00 LT of daytime, dVi shows a small value of less than 6 m/s. Before sunrise and after sunset, dVi increased rapidly and reached the maximum value of 8–13 m/s around 04:00 LT. Comparing the dVi from beams with different directions, there seems no obvious difference under different azimuth angle bins, but there is a clear fact that dVi increases with the increase in elevation angle. In Figure 2m, dVi from 12:00 LT to 15:00 LT are selected and gridded by a 5° elevation angle and a 50 km range. dVi shows an increasing value with the decrease in elevation angle and an increase in range. When the elevation angle is lower than 50°, dVi rapidly increases and is larger than 8 m/s at most ranges of altitudes. dVi is smaller, mostly less than 4 m/s, in the ranges of 100–150 km and 250–400 km, which correspond to the E and F regions. In summary, the error of the LOS ion velocity mainly depends on the echo signal-to-noise ratio, which is affected by the elevation angle of the beams, the range between the observation point and radar and the electron density at the observation point.

3. Inversion Method and Process

Any LOS velocity measurement i can be written as
v l o s i = k x i v x + k y i v y + k z i v z = k v
where unit vector k = [ k x   k y   k z ] and vector velocity v = [ v x   v y   v z ] T . In a radar-centered geographic coordinate system, unit vector k can be expressed as
k = k e   k n   k z = x   y   z R 1
where subscripts e , n and z refer to east, north and up, respectively; x , y and z refer to zonal, meridional and vertical distance to the observation point; R = x 2 + y 2 + z 2 means the range. Strictly, unit vector k is indicated as
k = k e   k n   k z = S R sin φ S R cos φ H R
where S is the arc distance of the observation point projected on the ground; H is the same as z ; φ is the azimuth angle. H can be solved by
H + R E 2 = R E 2 + R 2 2 R E R cos 90 + θ
where R E is the earth radius and θ is the elevation angle. S can be calculated by
S = 2 R E sin 1 R 2 + H 2 1 + H R E 2 R E .
When we calculate vector velocity v in the geomagnetic coordinate system, the unit vector k will be converted into
k = k p e   k p n   k a p = k e   k n   k z × R g e o 2 g m a g
where subscripts p e , p n and a p refer to perpendicular east, perpendicular north and antiparallel, respectively. The coordinate transformation matrix
R g e o 2 g m a g = cos D sin I sin D cos I sin D sin D cos D sin I cos I cos D 0 cos I sin I
when D is the declination angle and I is the inclination angle.
In theory, vector velocity can be estimated at one specific point if there are three or more LOS velocity measurements. In this case, when we put n measurements together, Equation (1) will be written as
v l o s 1 v l o s 2 v l o s n = k p e 1 k p n 1 k a p 1 k p e 2 k p n 2 k a p 2 k p e n k p n n k a p n v p e v p n v a p + e l o s 1 e l o s 2 e l o s n
or
v l o s = A v + e l o s
in the geomagnetic coordinate system, where e l o s is the error of the LOS velocity and A = k p e 1 k p n 1 k a p 1 k p e 2 k p n 2 k a p 2 k p e n k p n n k a p n presents the geometry of the measurement beams. To solve Equation (9), Heinselman et al. [21] proposed an estimation as follows
v ^ = Σ v A T ( A Σ v A T + Σ e ) 1 v l o s
and
Σ v ^ = Σ v Σ v A T ( A Σ v A T + Σ e ) 1 A Σ v = ( A T Σ e 1 A + Σ v 1 ) 1
where v ^ is the vector velocity estimation and Σ v ^ is the covariance estimation; Σ v is the prior covariance matrix of the vector velocity; and Σ e is the error covariance matrix.
Assuming the plasma velocity is constant in a certain volume, the vector velocity could be inversed by all the observation points in this volume. We designed two inversion window settings as follows: one will achieve the altitude–time distribution of vector velocity (settings A) and another will achieve the latitude/longitude–altitude–time distribution of vector velocity (settings B). The former requires less computation and gives fewer errors of the vector velocity, while the latter gives a special spatial distribution, which serves different needs and interests of the research.
Taking the experiment on 27 March 2021 in the last two lines of Figure 1 for example, the process is described in detail here. To achieve the altitude-time distribution of vector velocity, we set the sliding window in altitude with a size of 50 km and slide of 25 km and set one window in all latitudes and longitudes (settings A). In every window, if there are data points from at least three different beams, vector velocity and its error will be inversed by Formulas (10) and (11). Figure 3 shows the inversion result of v p e , v p n and v a p from top to bottom with velocity on the left and its error on the right. The inversion errors are less than 2 m/s in v p e and v a p , and less than 1 m/s in v p n most of the time. Plasma presents a pattern perpendicular to westward, northward and along the magnetic field during the daytime and the opposite pattern during the nighttime. At 11:00–13:00 LT, plasma vector velocity shows the maximum value of ~−60 m/s in v p e , ~35 m/s in v p n and ~−70 m/s in v a p . During the nighttime after 19:00 LT, v p e shows a large value close to 100 m/s while v p n and v a p show a value close to 0 m/s. During 22:00–23:00 LT, v a p shows positive value reaching to 60 m/s. During 07:00–11:00 LT, three components of ion drift show large gradients in altitude manifesting 0 m/s at high altitude as well as large error, which is related to the low echo SNR because of the low electron density at high altitude in the morning. With the window setting B, we inverse the vector velocity for the meridional and zonal plane, respectively. For every plane, we set the sliding window in range with a size of 100 km and slide of 25 km and elevation angle with a size of 40° and slide of 5 degrees to make sure the same number of data points in each window, thus the vector velocity in meridional and zonal planes will be derived. When we inverse the vector velocity in each meridional or zonal plane, there will be lack of the information from east–west ( k e ) or north–south ( k n ) direction. For the ionosphere over Sanya, the declination angle D is about −1.9° and inclination angle I is about 26°. In this case, k p n and k a p in the meridional plane will be k p n N S and k a p N S as follows:
k p n N S = k p n k e sin I sin D k p n + 0.015 k e
and
k a p N S = k a p + k e cos I sin D k a p 0.030 k e .
Equation (8) will be written as
v l o s 1 v l o s 2 v l o s n = k p n N S 1 k p n N S 2 k p n N S n k a p N S 1 k a p N S 2 k a p N S n v p n N S v a p N S + e l o s 1 e l o s 2 e l o s n .
In zonal plane, k p e and k p n will be written as k p e E W and k p n E W :
k p e E W = k p e + k n sin D k p e 0.033 k n
and
k p n E W = k p n + k n cos I sin D k p n 0.438 k n .
Equation (8) will be written as
v l o s 1 v l o s 2 v l o s n = k p e E W 1 k p e E W 2 k p e E W n k p n E W 1 k p n E W 2 k p n E W n v p e E W v p n E W + e l o s 1 e l o s 2 e l o s n .
It follows, then, that v p n N S , v a p N S and v p e E W are very close to v p n , v a p and v p e while v p n E W has a nonnegligible difference with v p n . This is because of a very small magnetic declination angle (~−1.9°) but a nonnegligible magnetic inclination angle (~26°). The result of applying this method to the experiment on 27 March 2021 is shown in Figure 4. Figure 4a,b show the v p n N S and v a p N S in meridional plane at daytime 11:35 LT and nighttime 22:30 LT. The gray dashed line shows the magnetic field lines. Plasma velocity shows the perpendicular magnetic field northward and parallel magnetic field poleward at 11:35 LT at the altitude of 200–500 km, and almost along the magnetic field towards the equator at 22:30 LT at 250–450 km. These results are consistent with the result of v p n and v a p in Figure 3c,e. Figure 4c,d show the v p e E W and v p n E W in the zonal plane during daytime and nighttime. At 11:35 LT, plasma velocity shows strong perpendicular magnetic field westward at the altitude of 100 to 500 km which is consistent with the result of v p e shown in Figure 3a. Plasma shows the obvious perpendicular magnetic field northward at the altitude of 200 to 300 km but the perpendicular magnetic field southward above 300 km which is different from the result of v p n shown in Figure 3b. At 22:30 LT, v p e E W shows a strong perpendicular magnetic field eastward component which is consistent with the result of v p e shown in Figure 3a, but v p n E W shows perpendicular magnetic field northward which is inconsistent with the v p n of almost 0 m/s at that time in Figure 3b. That is what Equations (12)–(16) tells. In meridional plane, the difference between v p n N S and v p n is about + 0.015 k e v e , which might be 1.5 m/s or −1.5 m/s assuming that v e is 100 m/s at daytime or −100 m/s at nighttime. Similarly, the difference between v a p N S and v a p will be about −3 m/s or 3 m/s at daytime or nighttime. This is a tiny difference compared to its own value of v p n or v a p . In the zonal plane, the difference between v p e E W and v p e is also small. However, the difference between v p n E W and v p n is about 43.8 m/s or −43.8 m/s with the assumption of 100 m/s or −100 m/s of v e . This caused an obviously decreased and increased difference between v p n E W and v p n at daytime and nighttime, respectively, which could not be ignored.

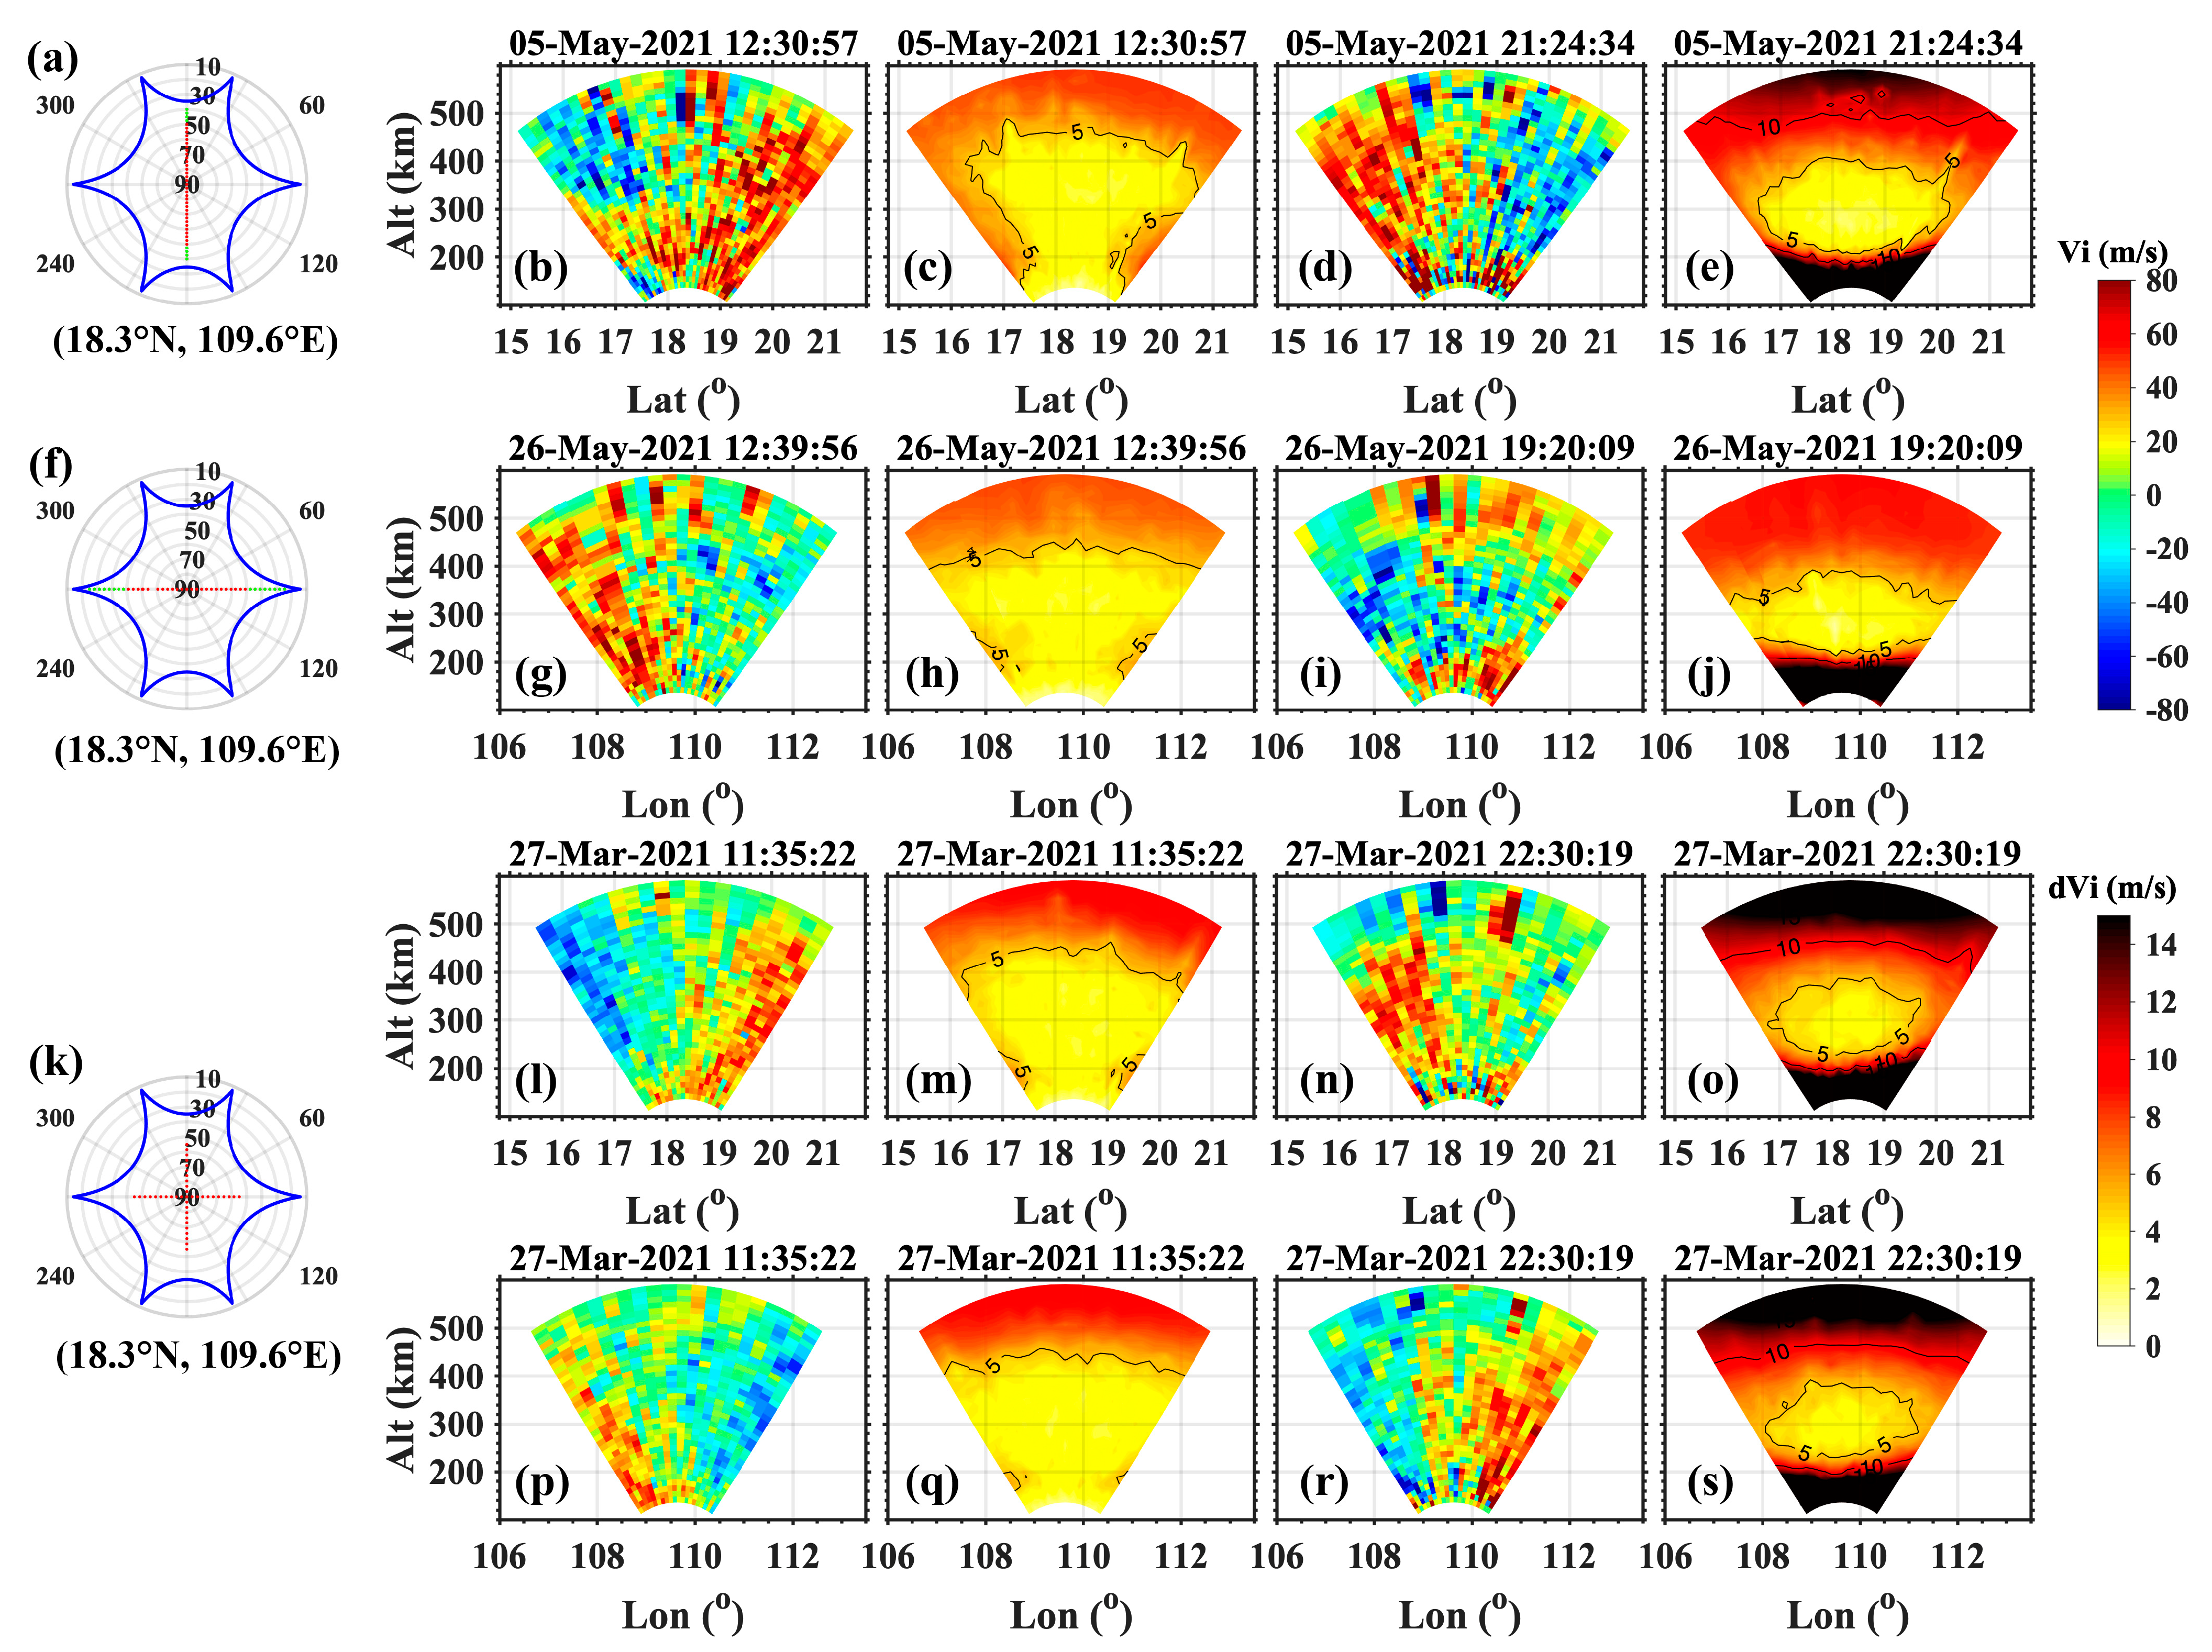
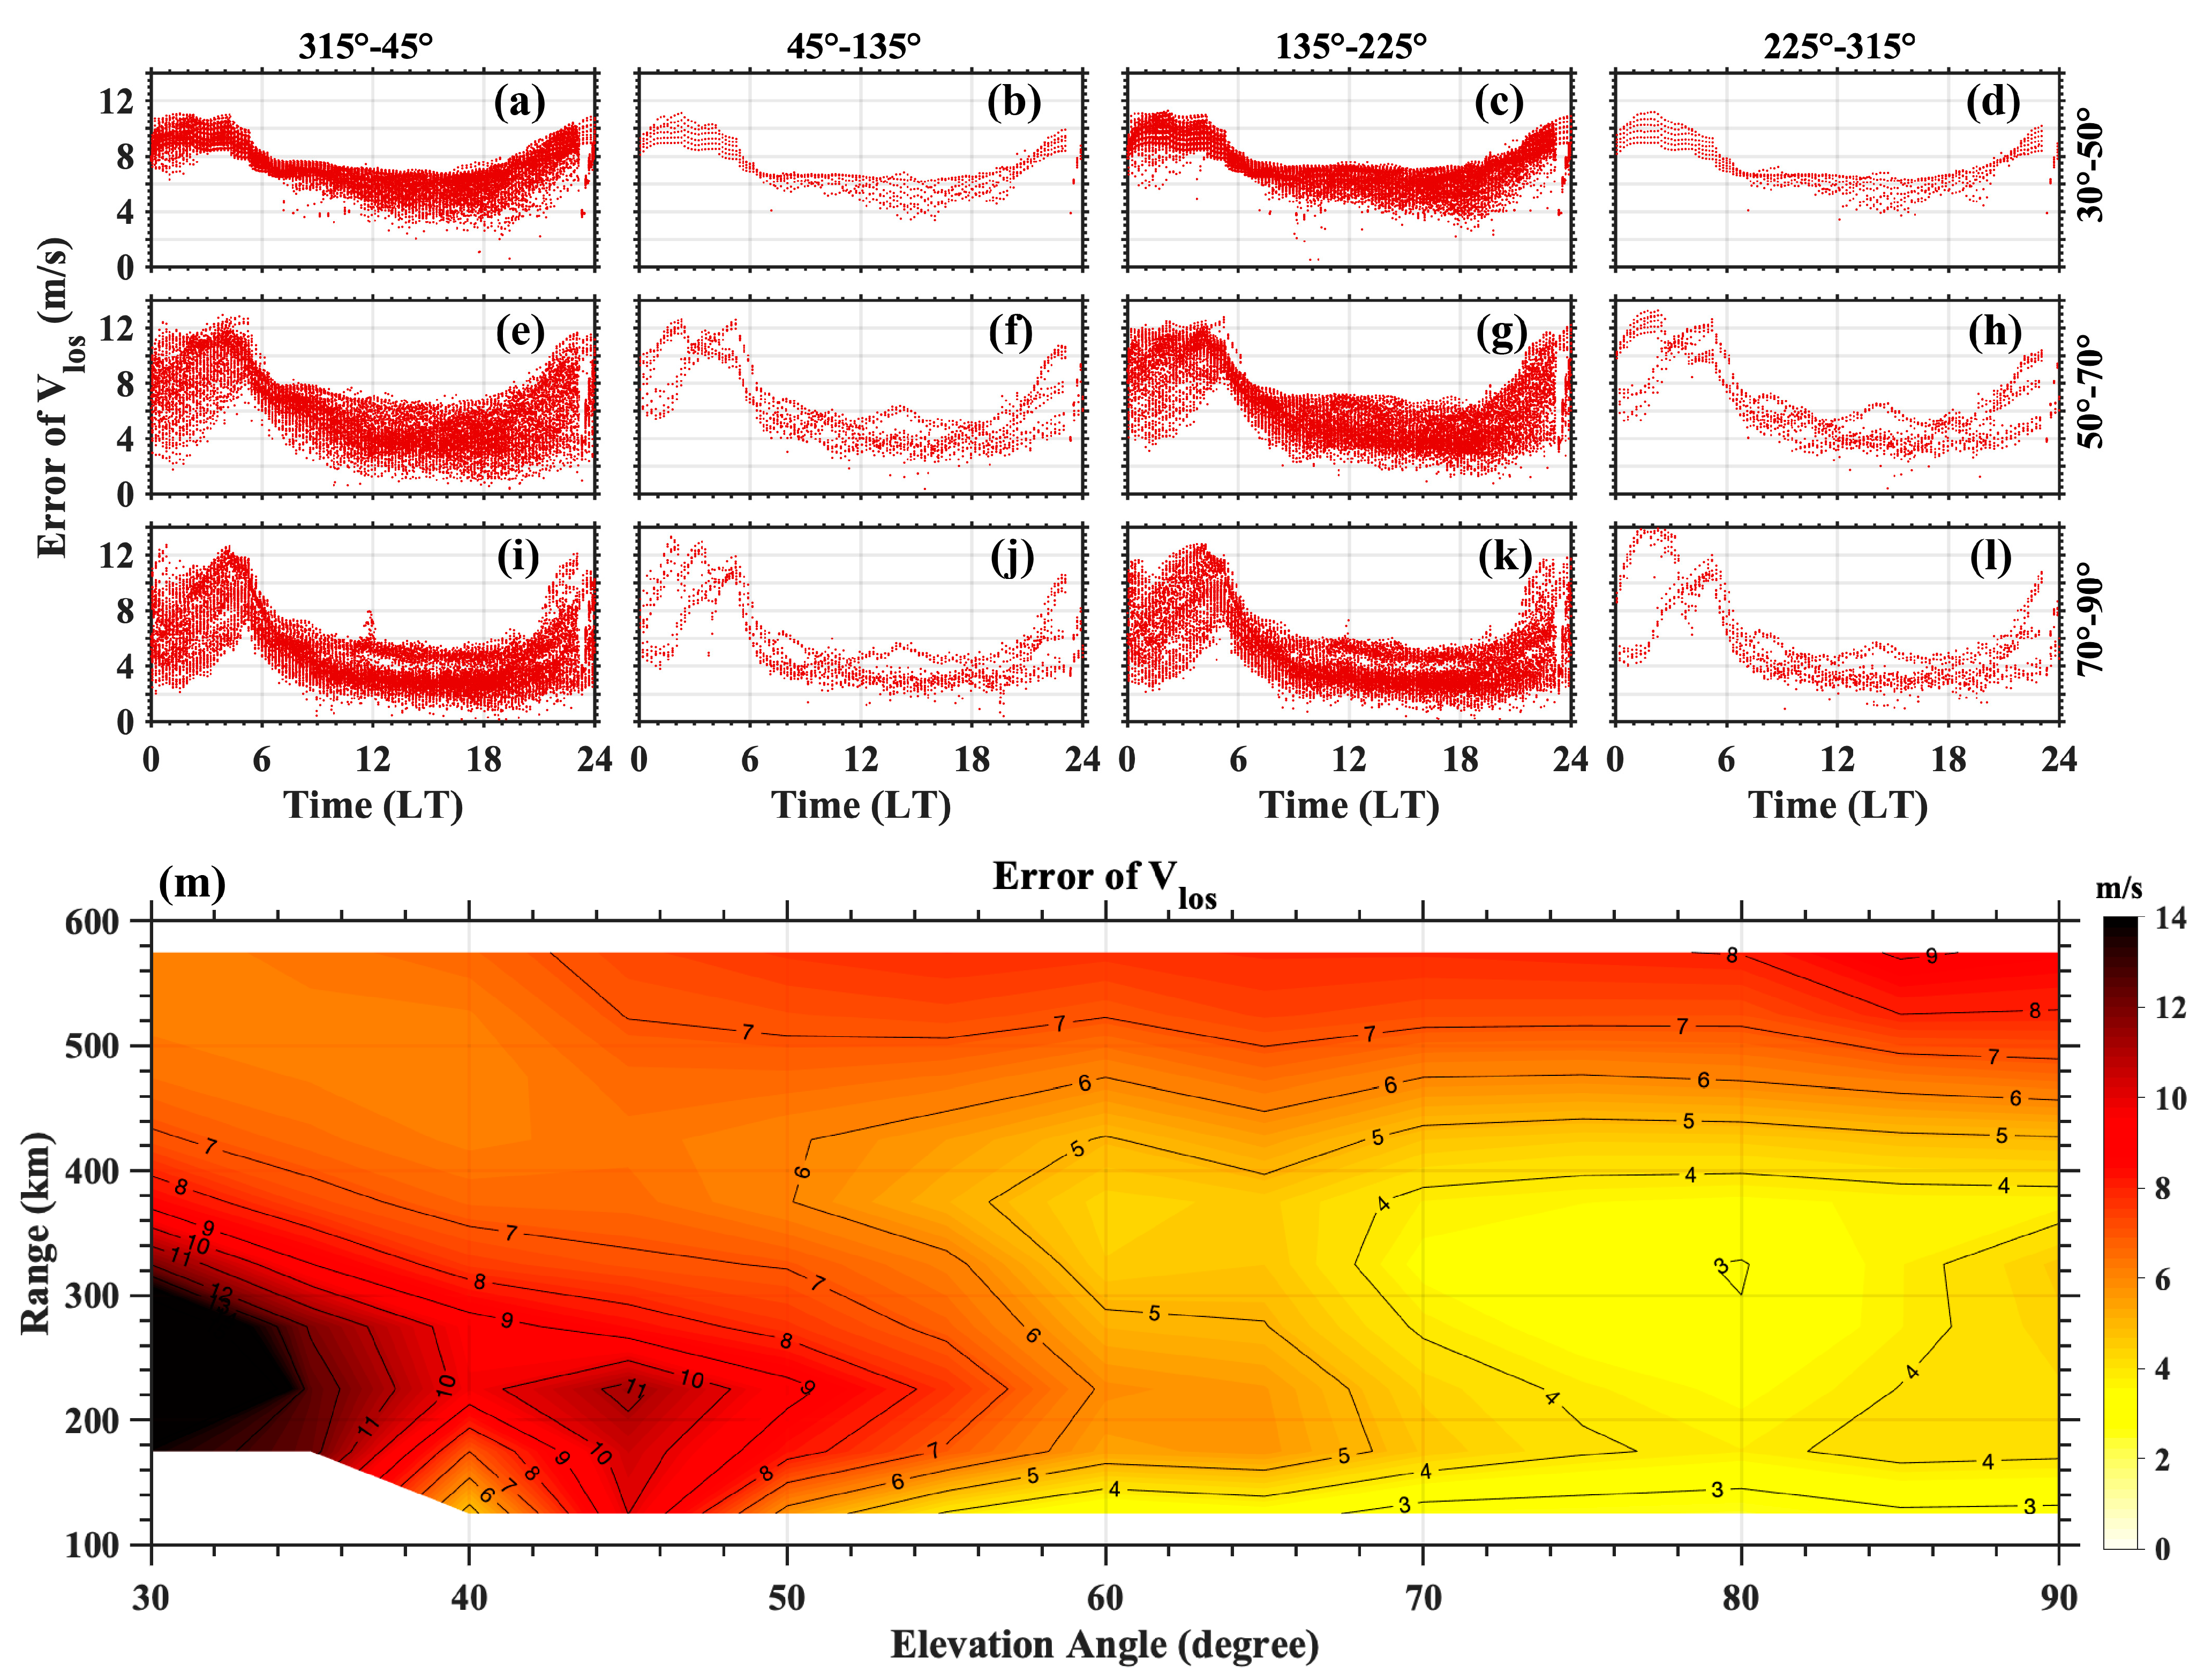
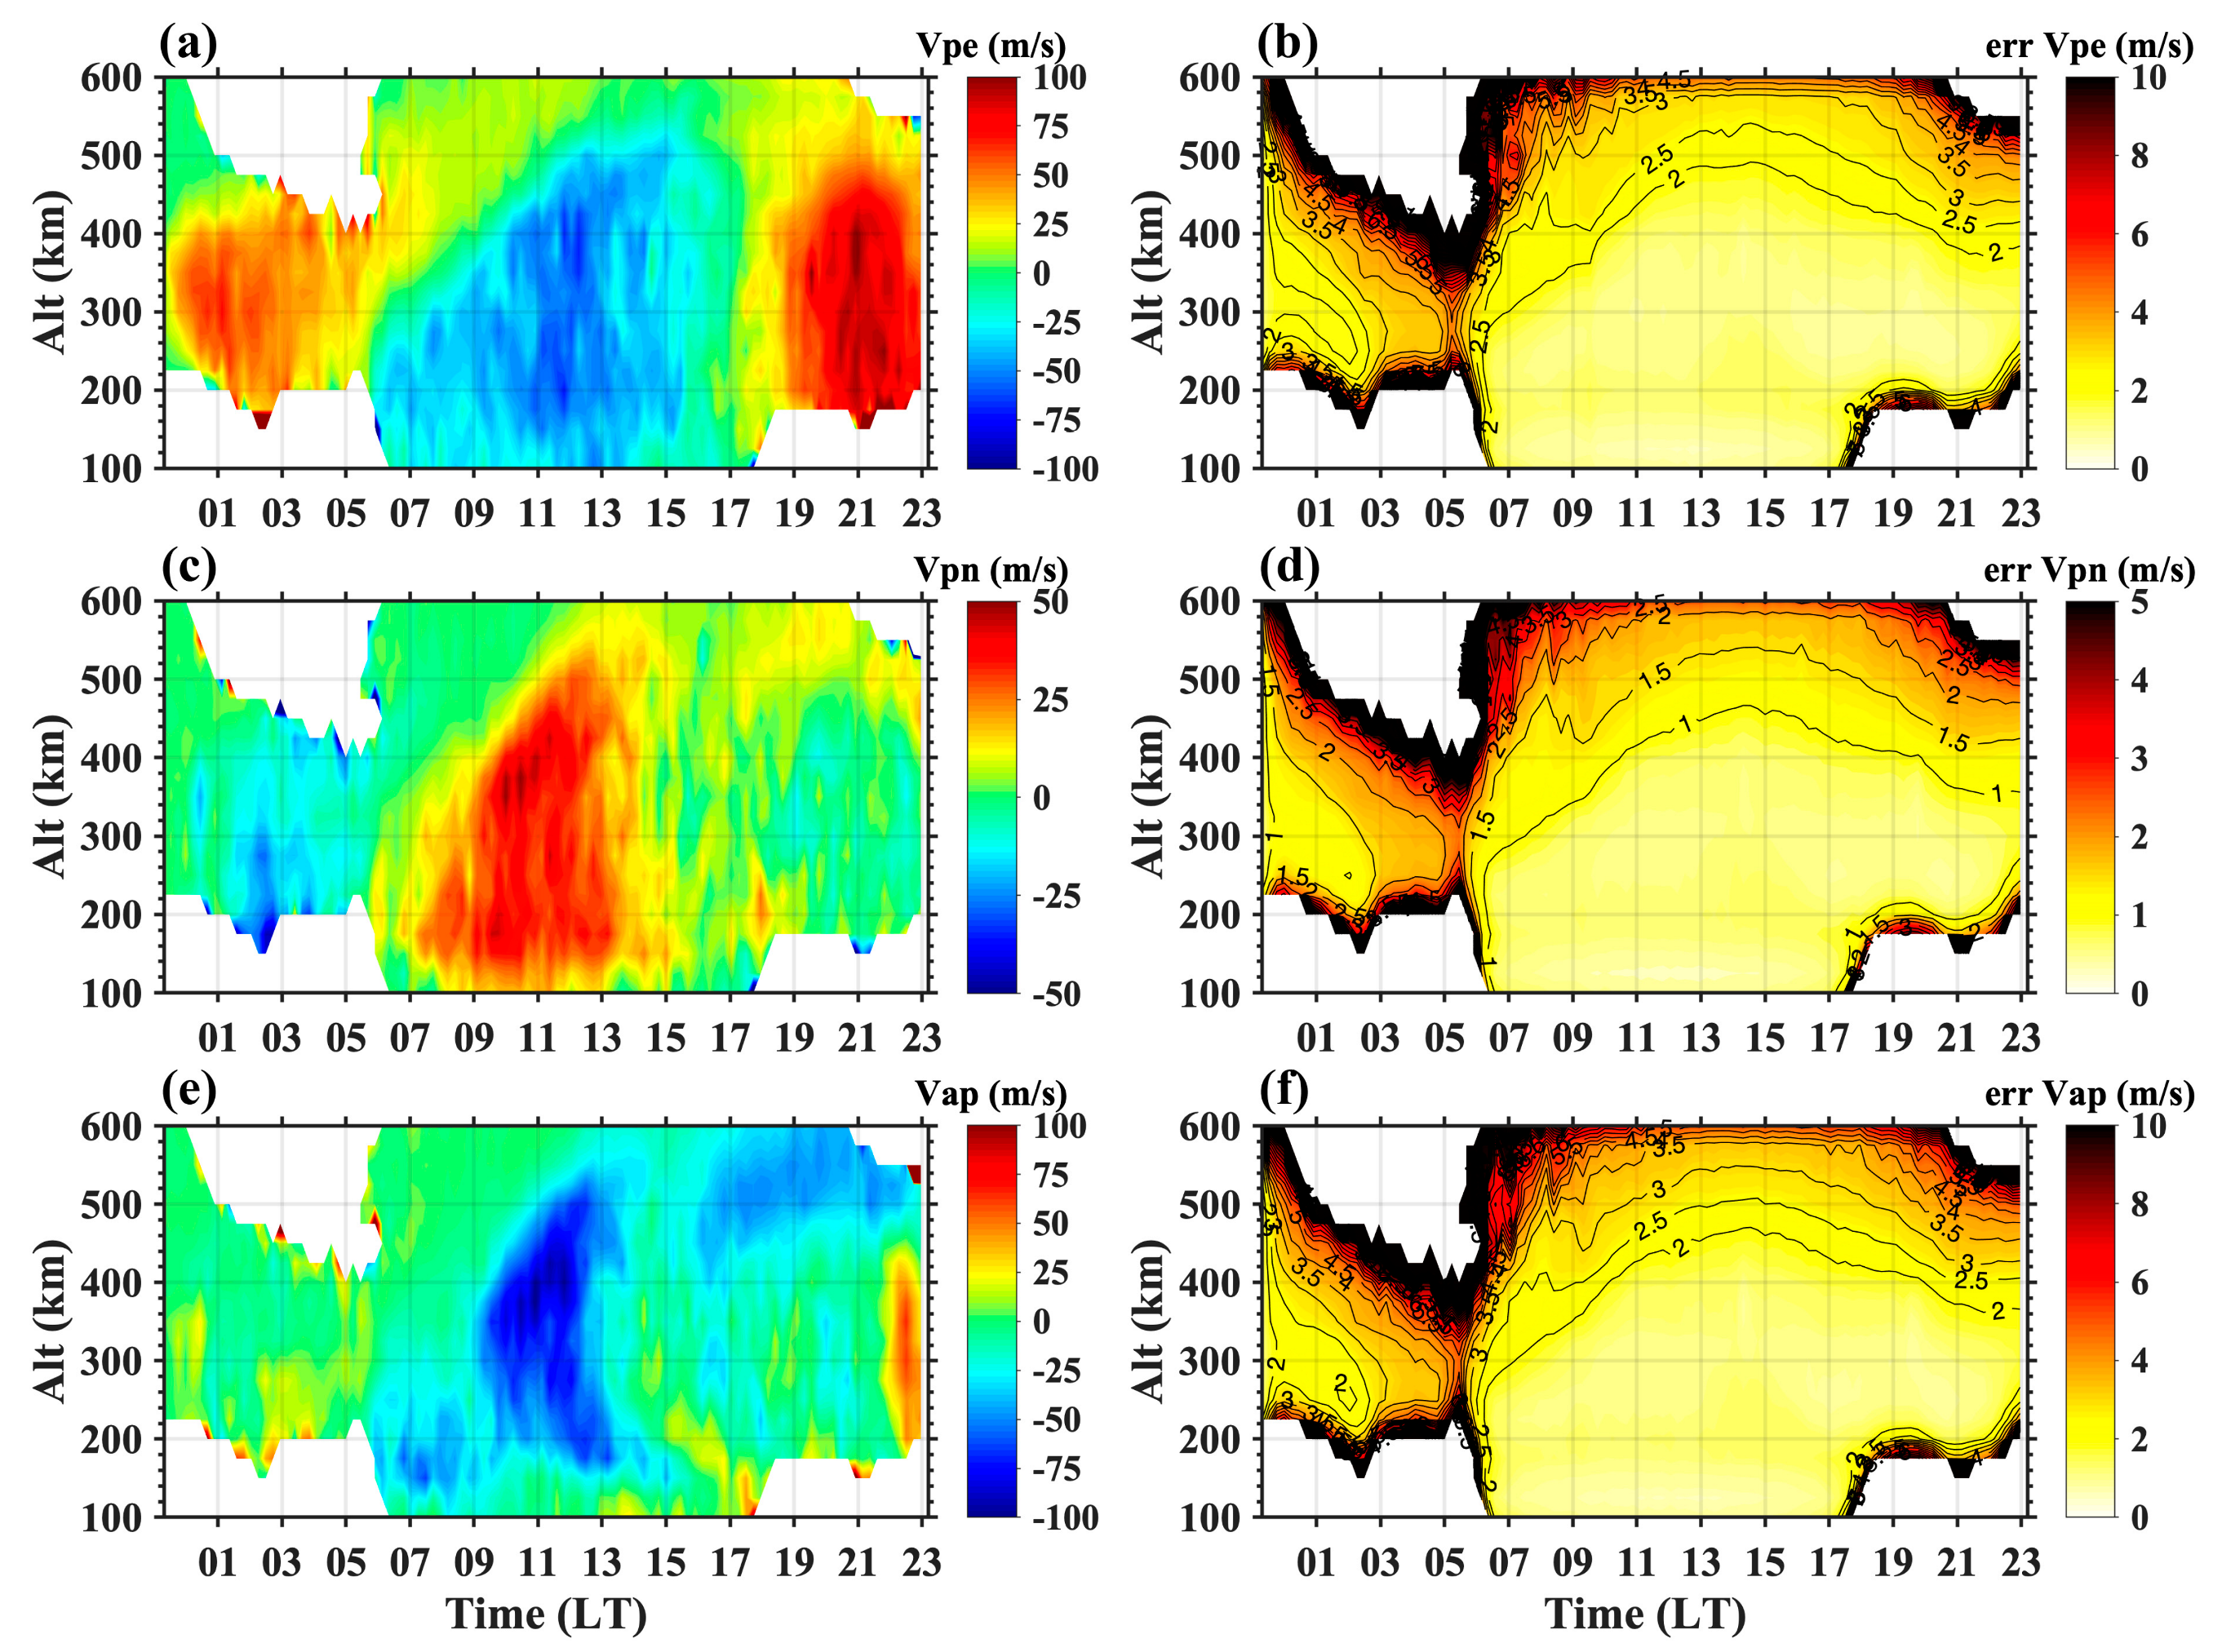
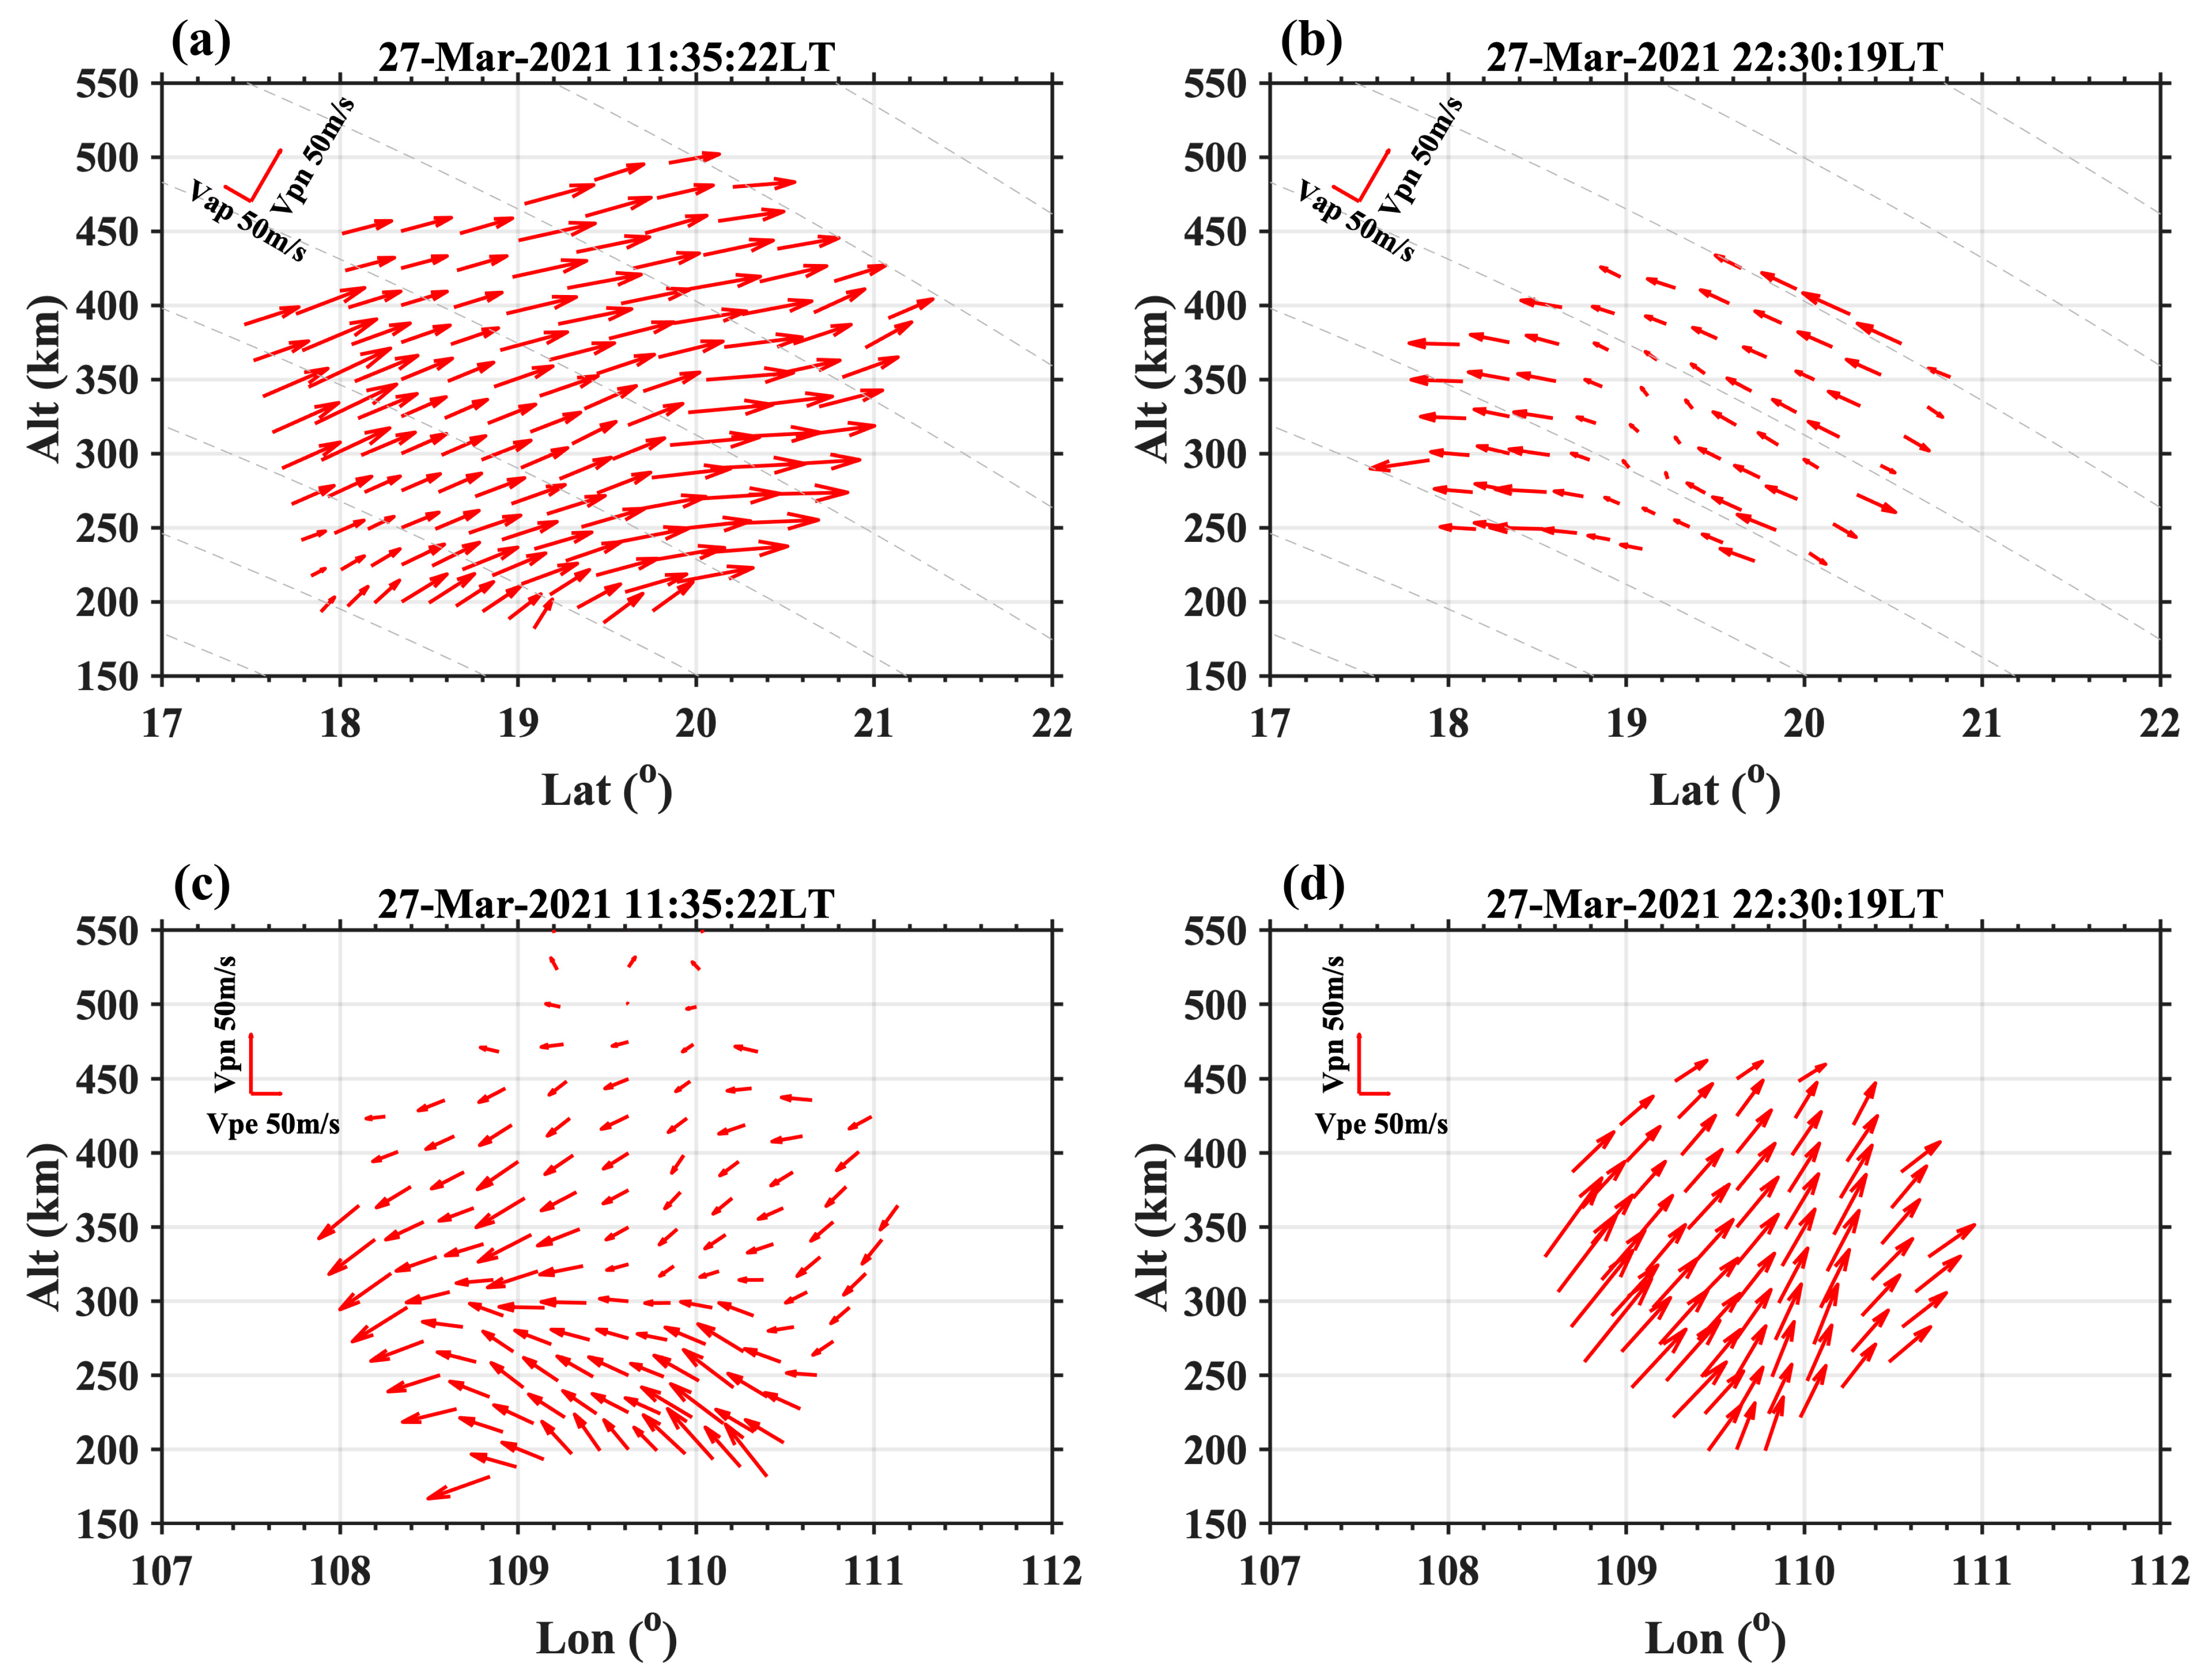
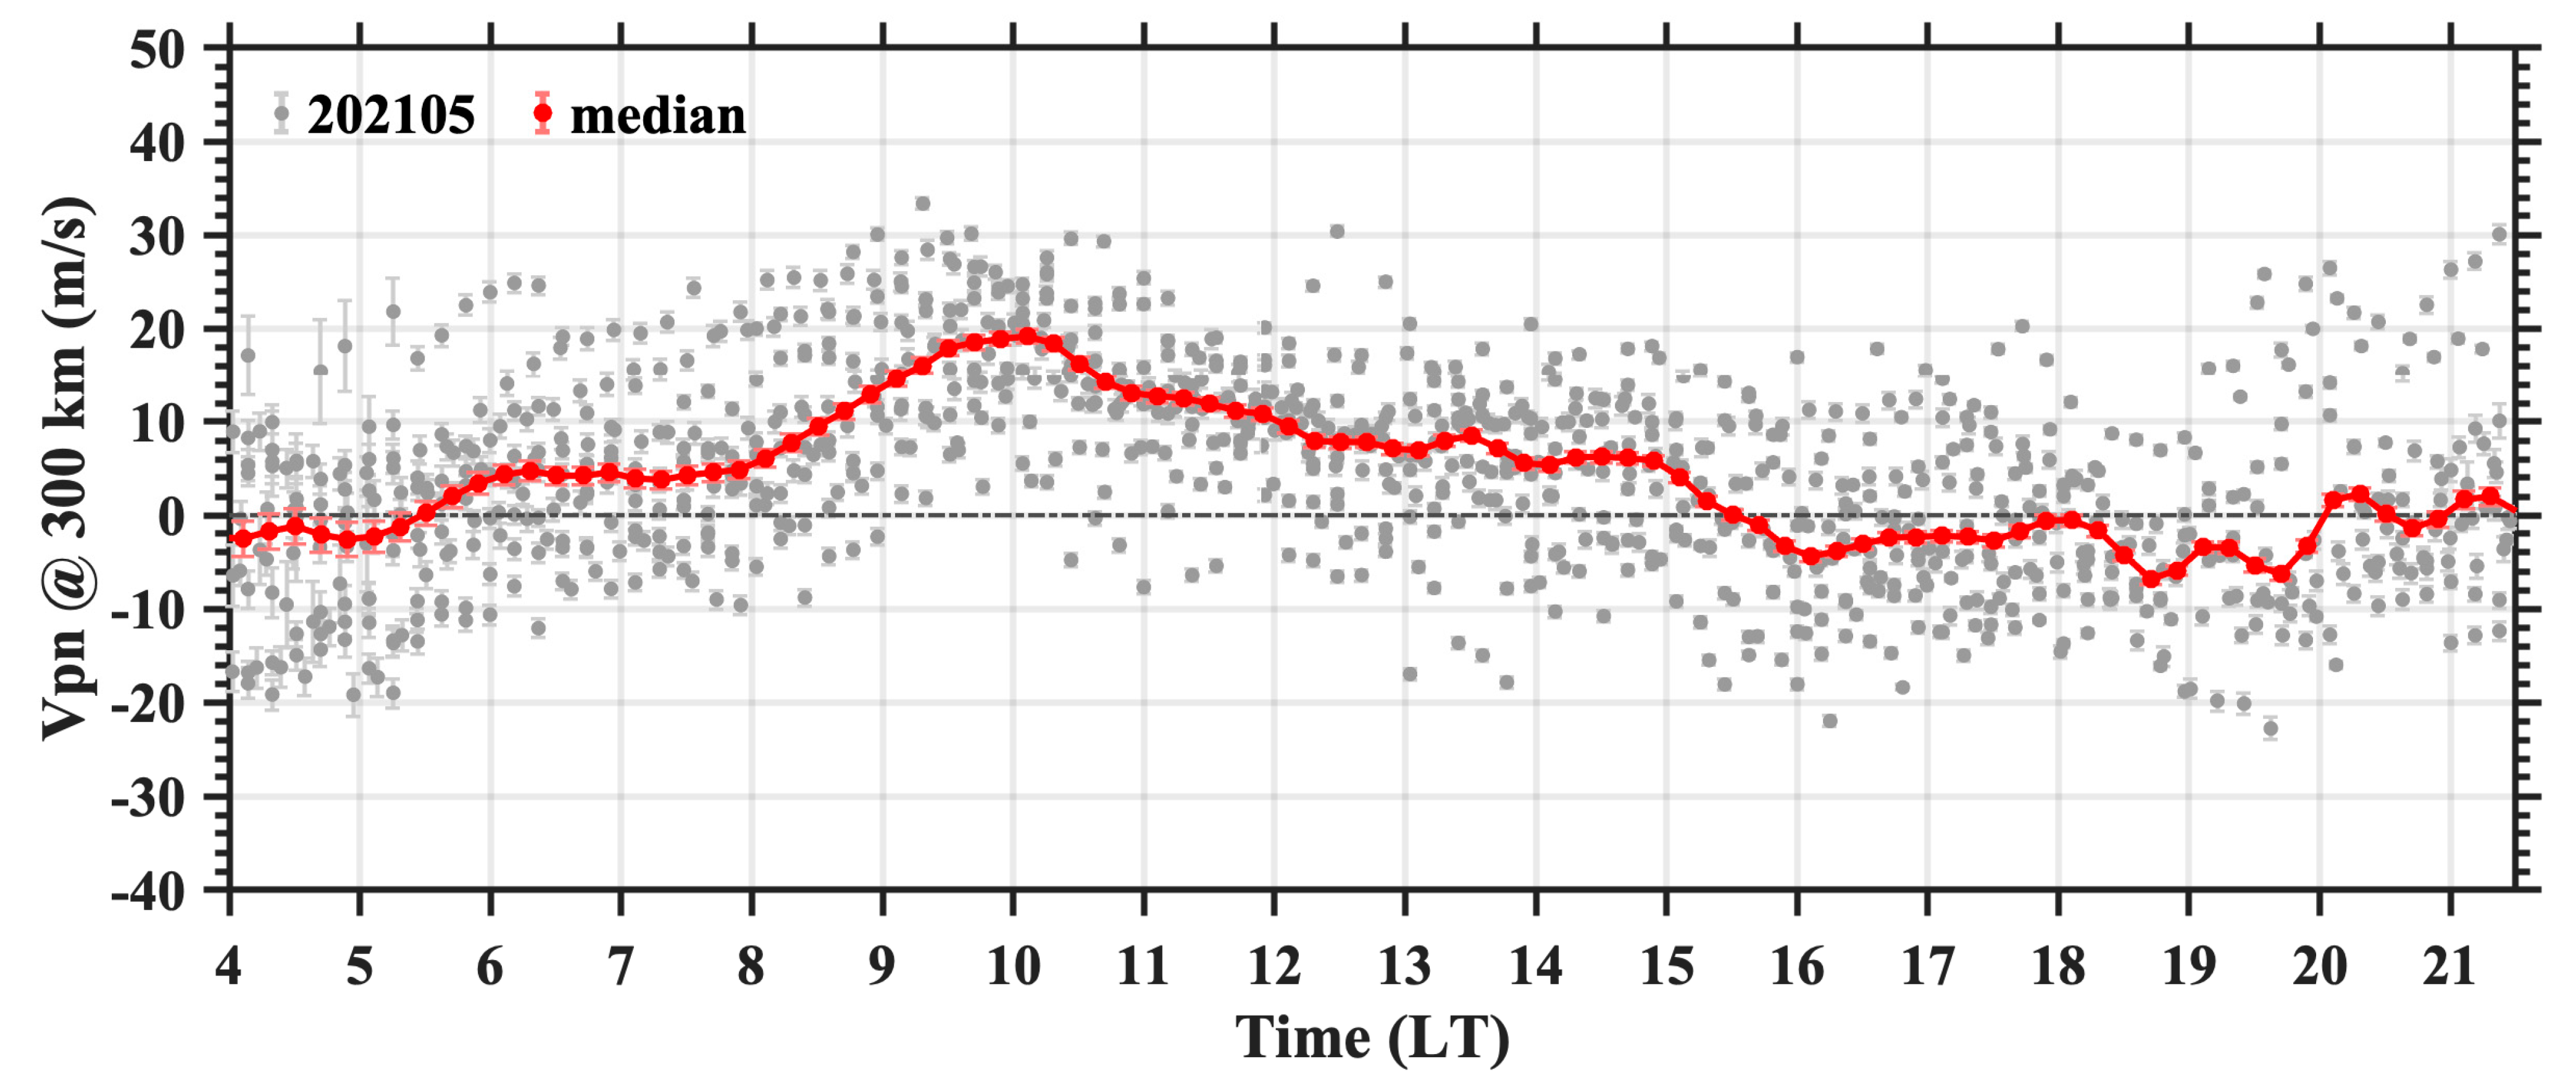
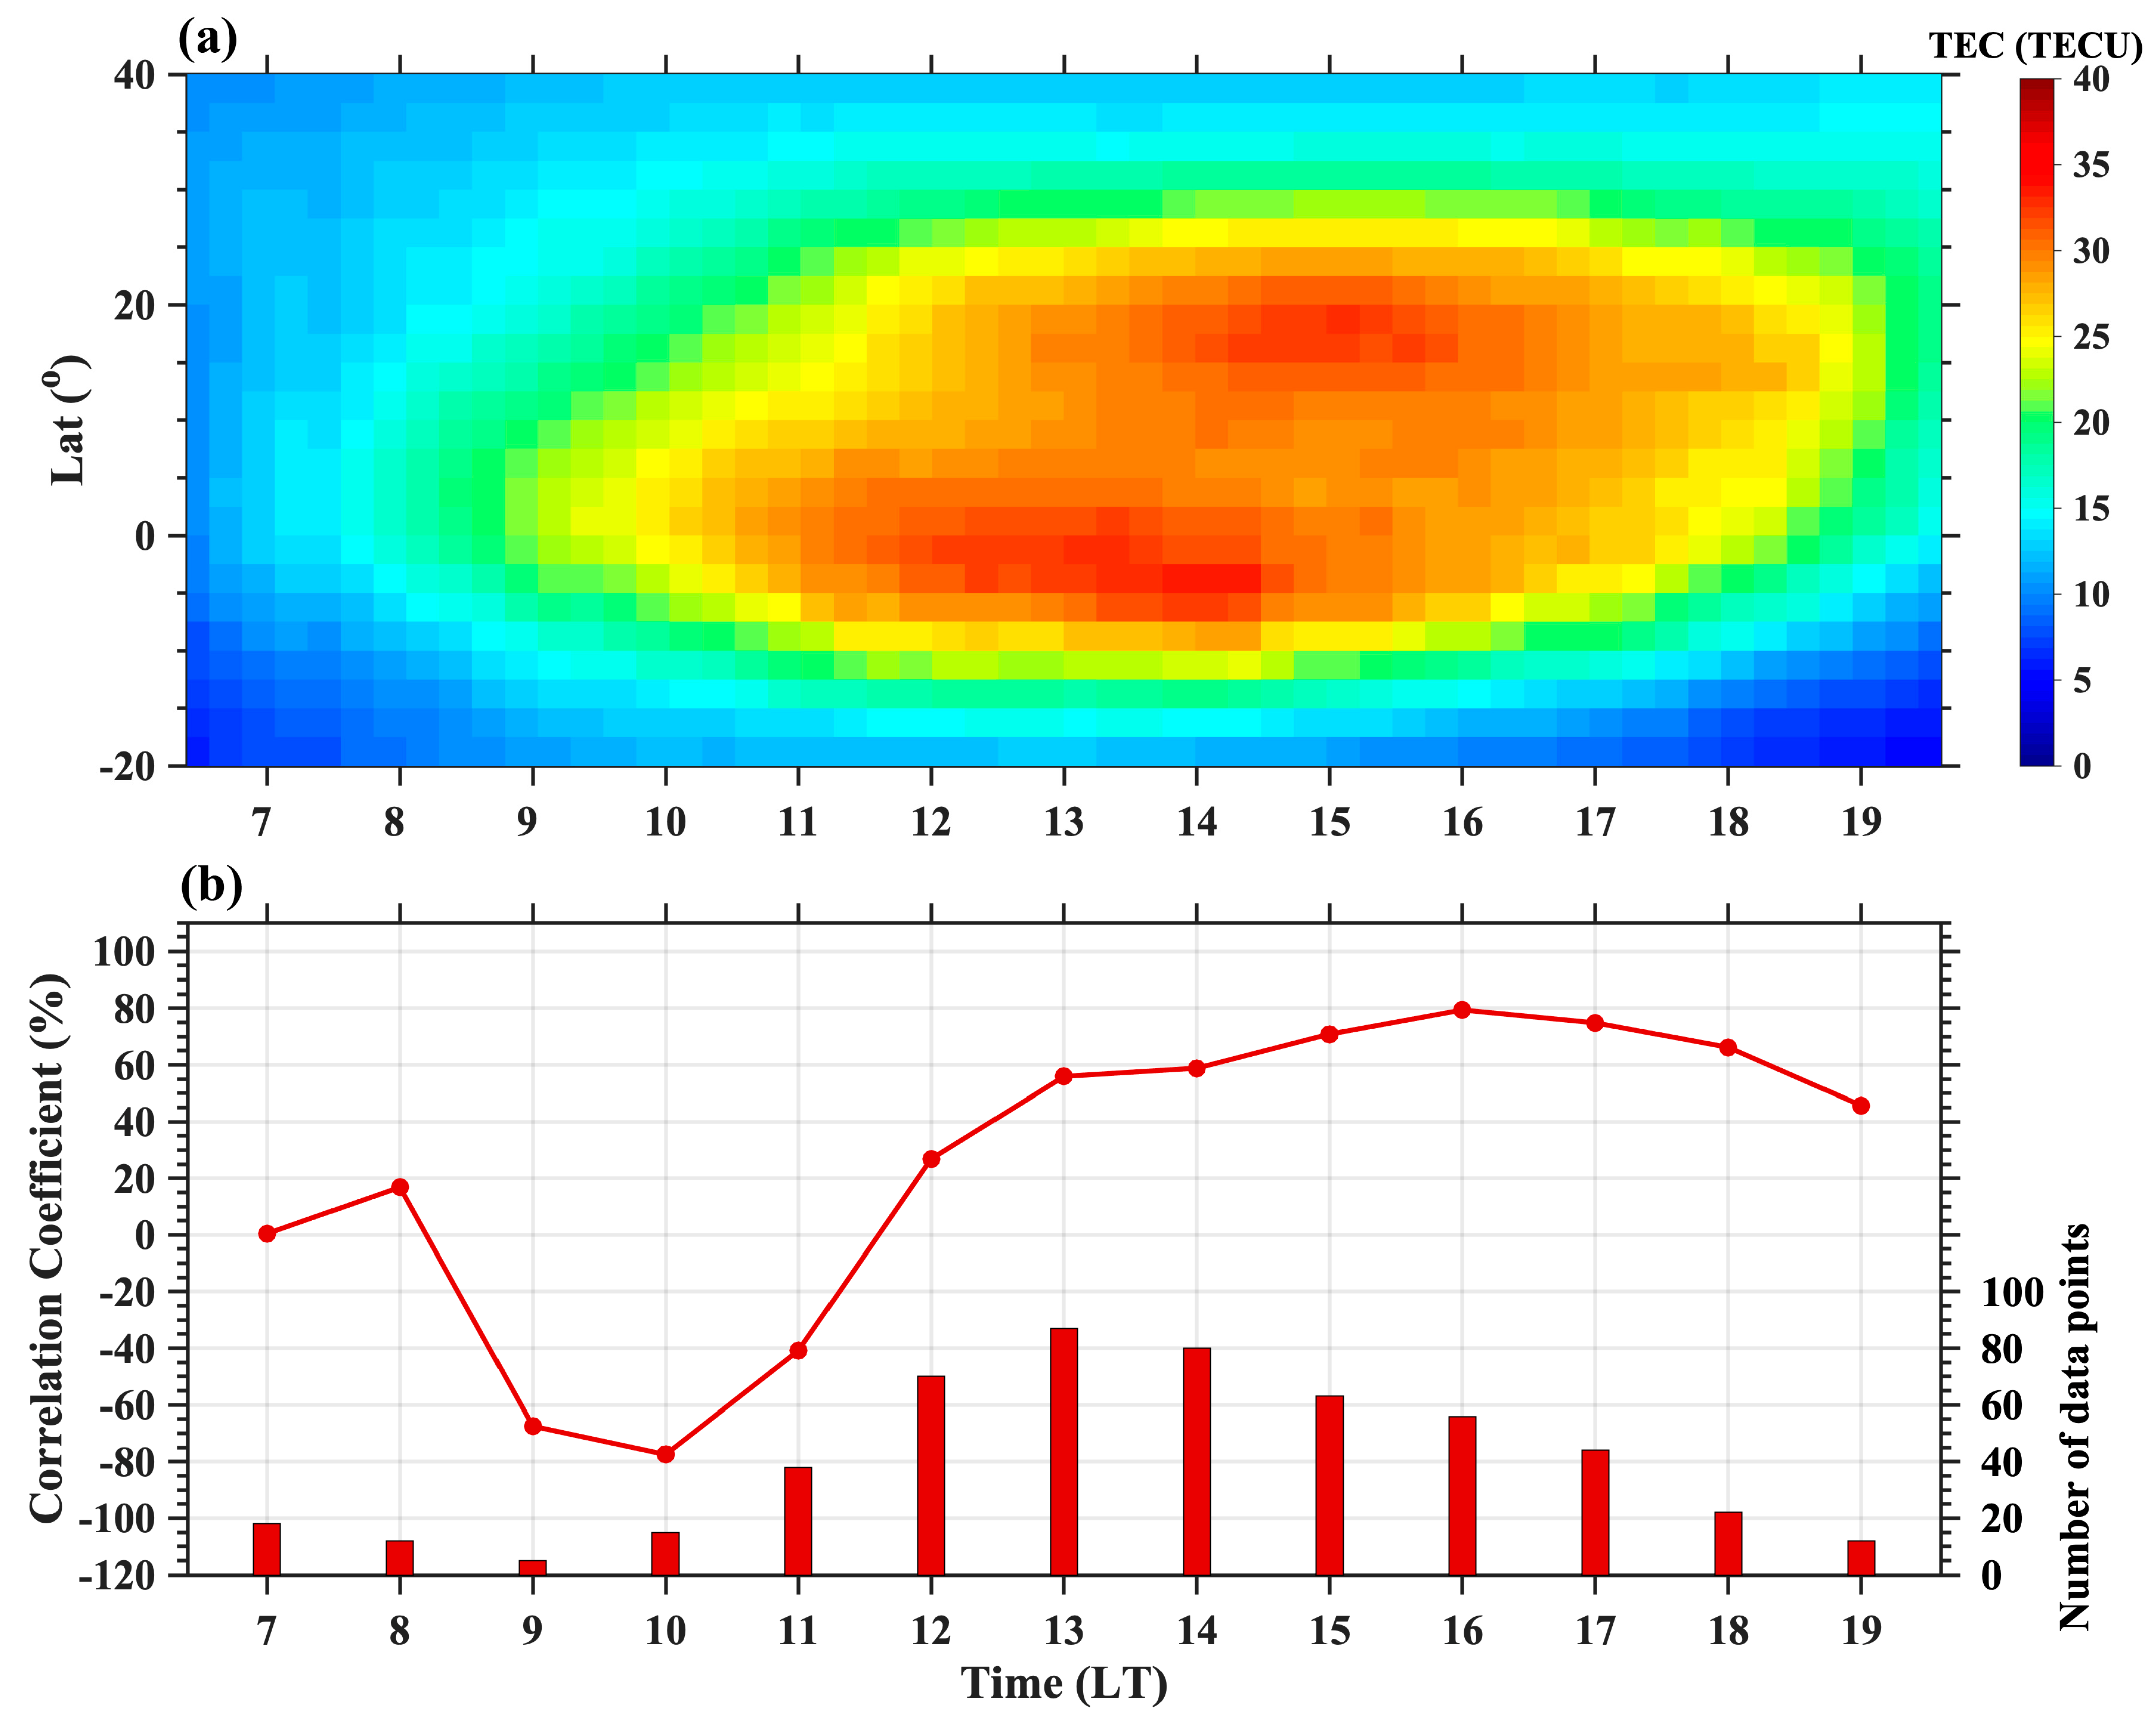
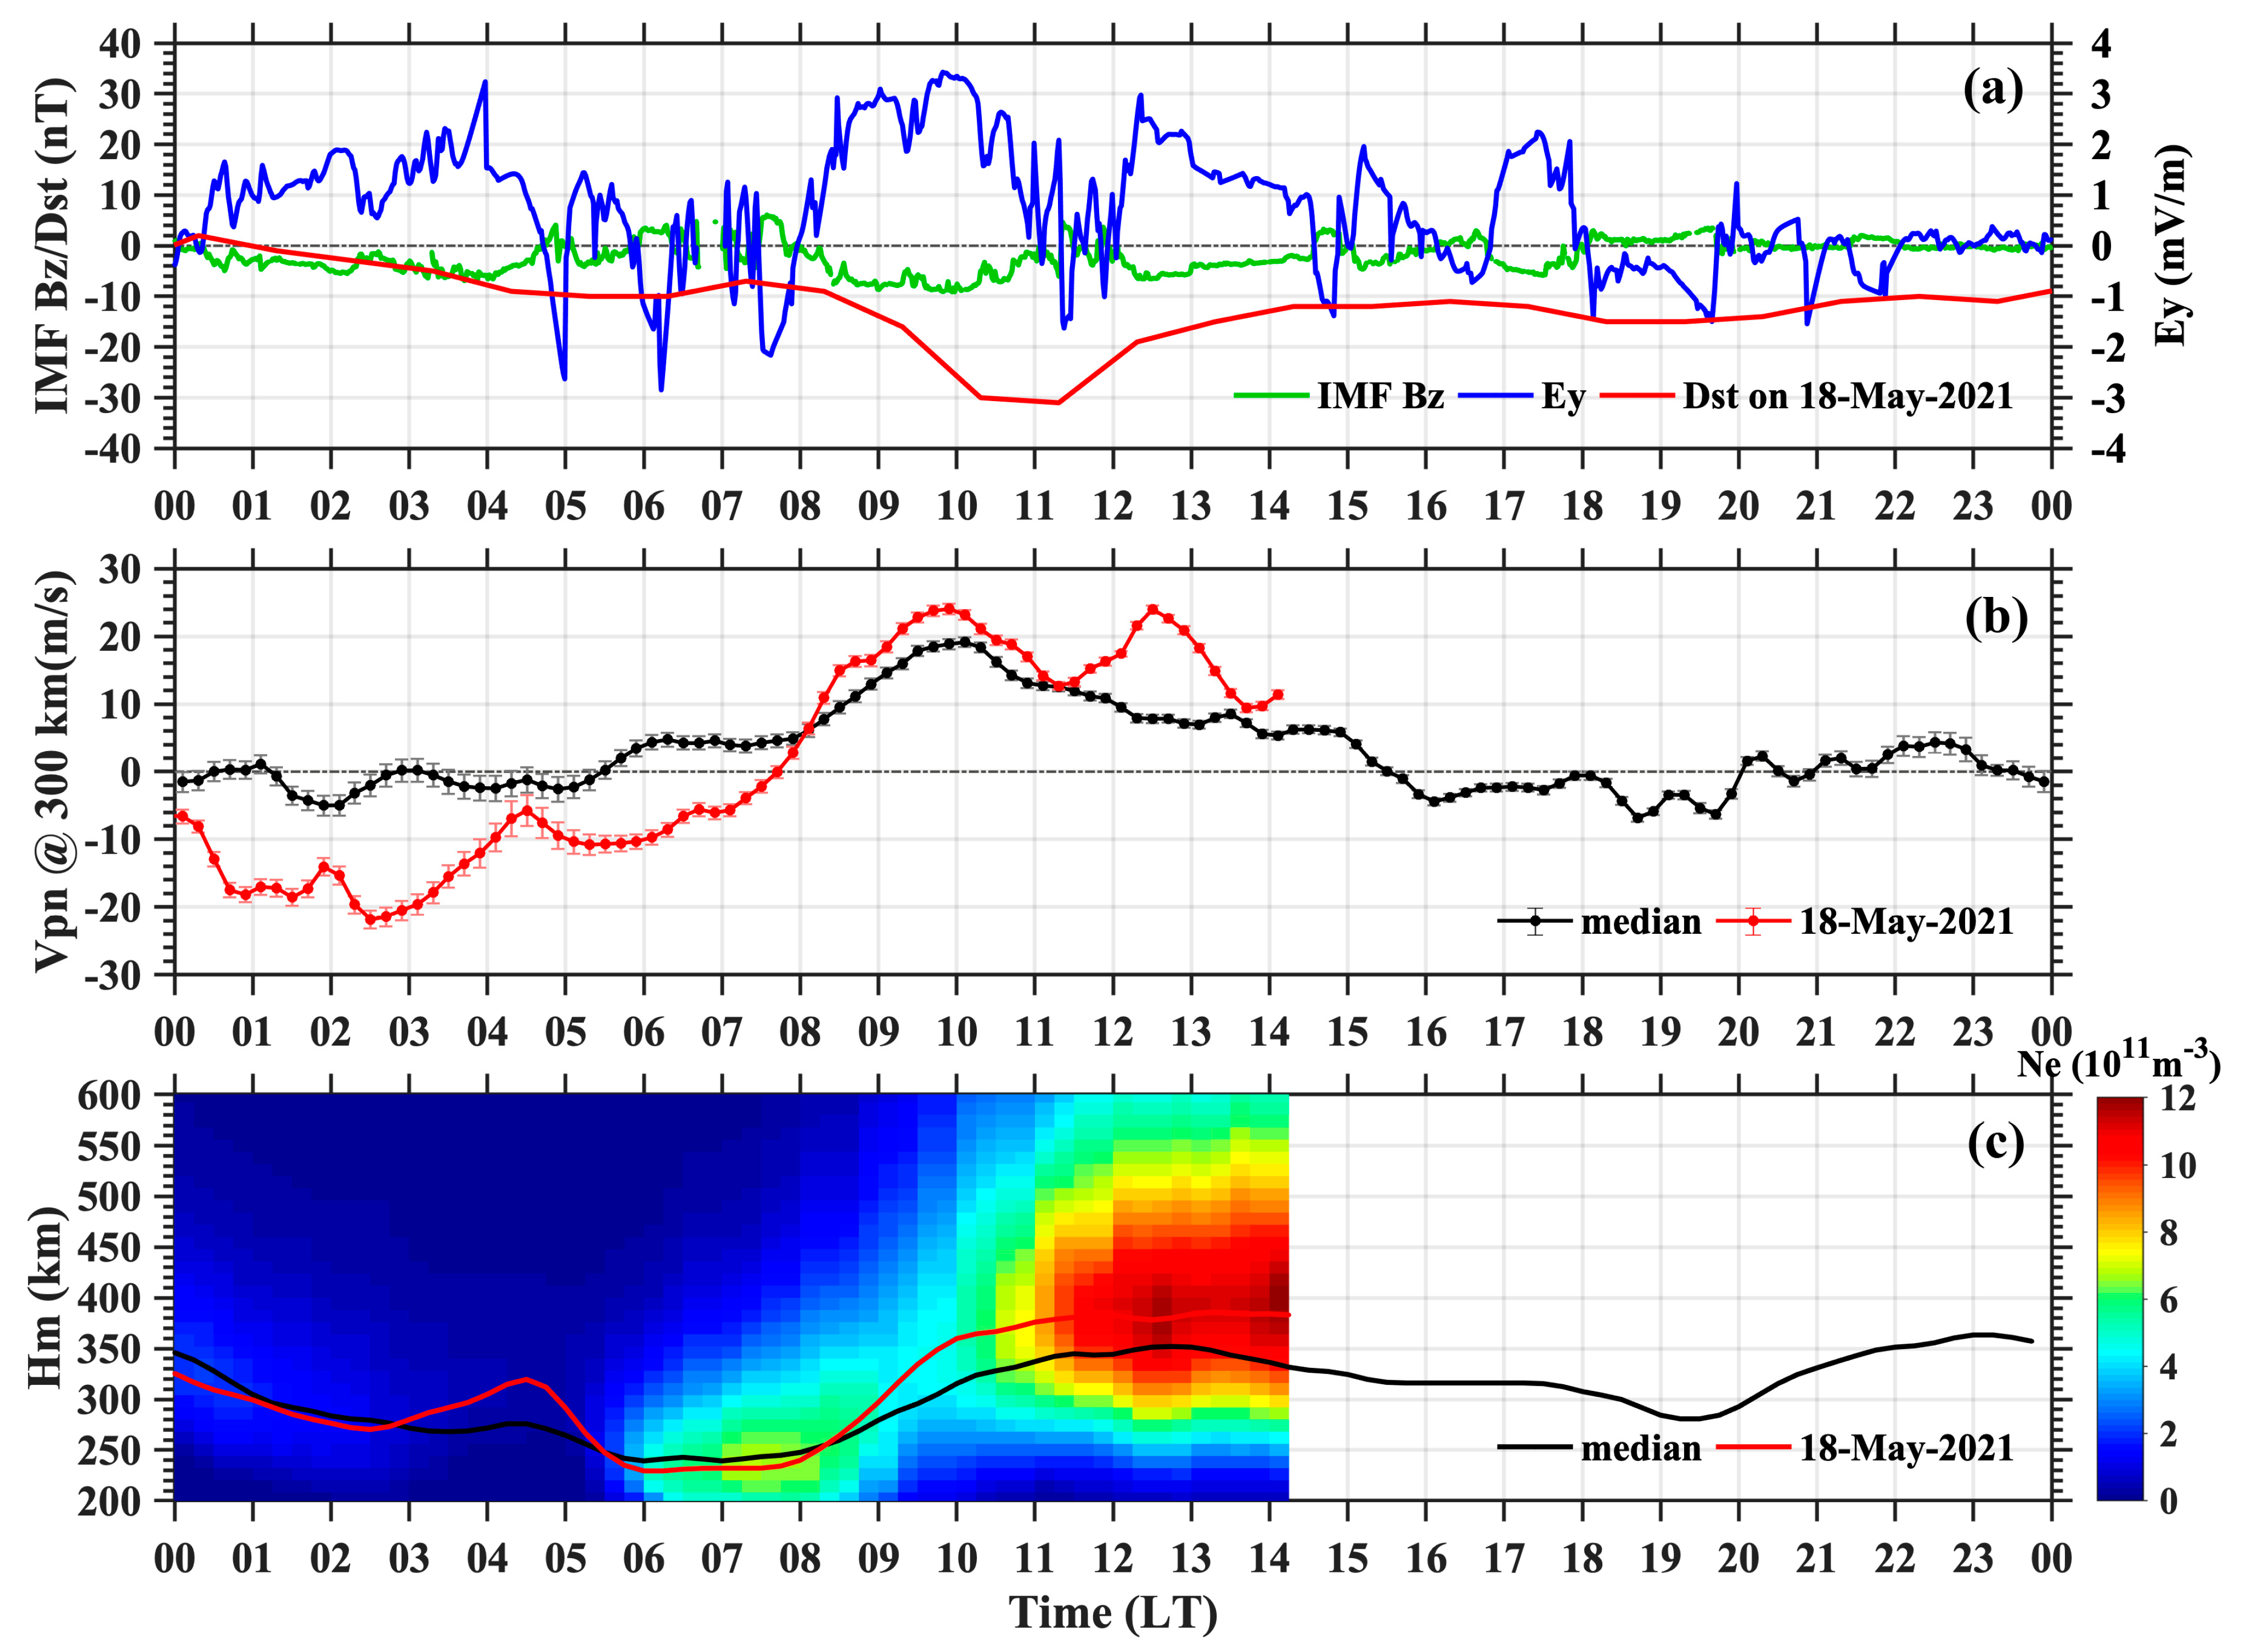
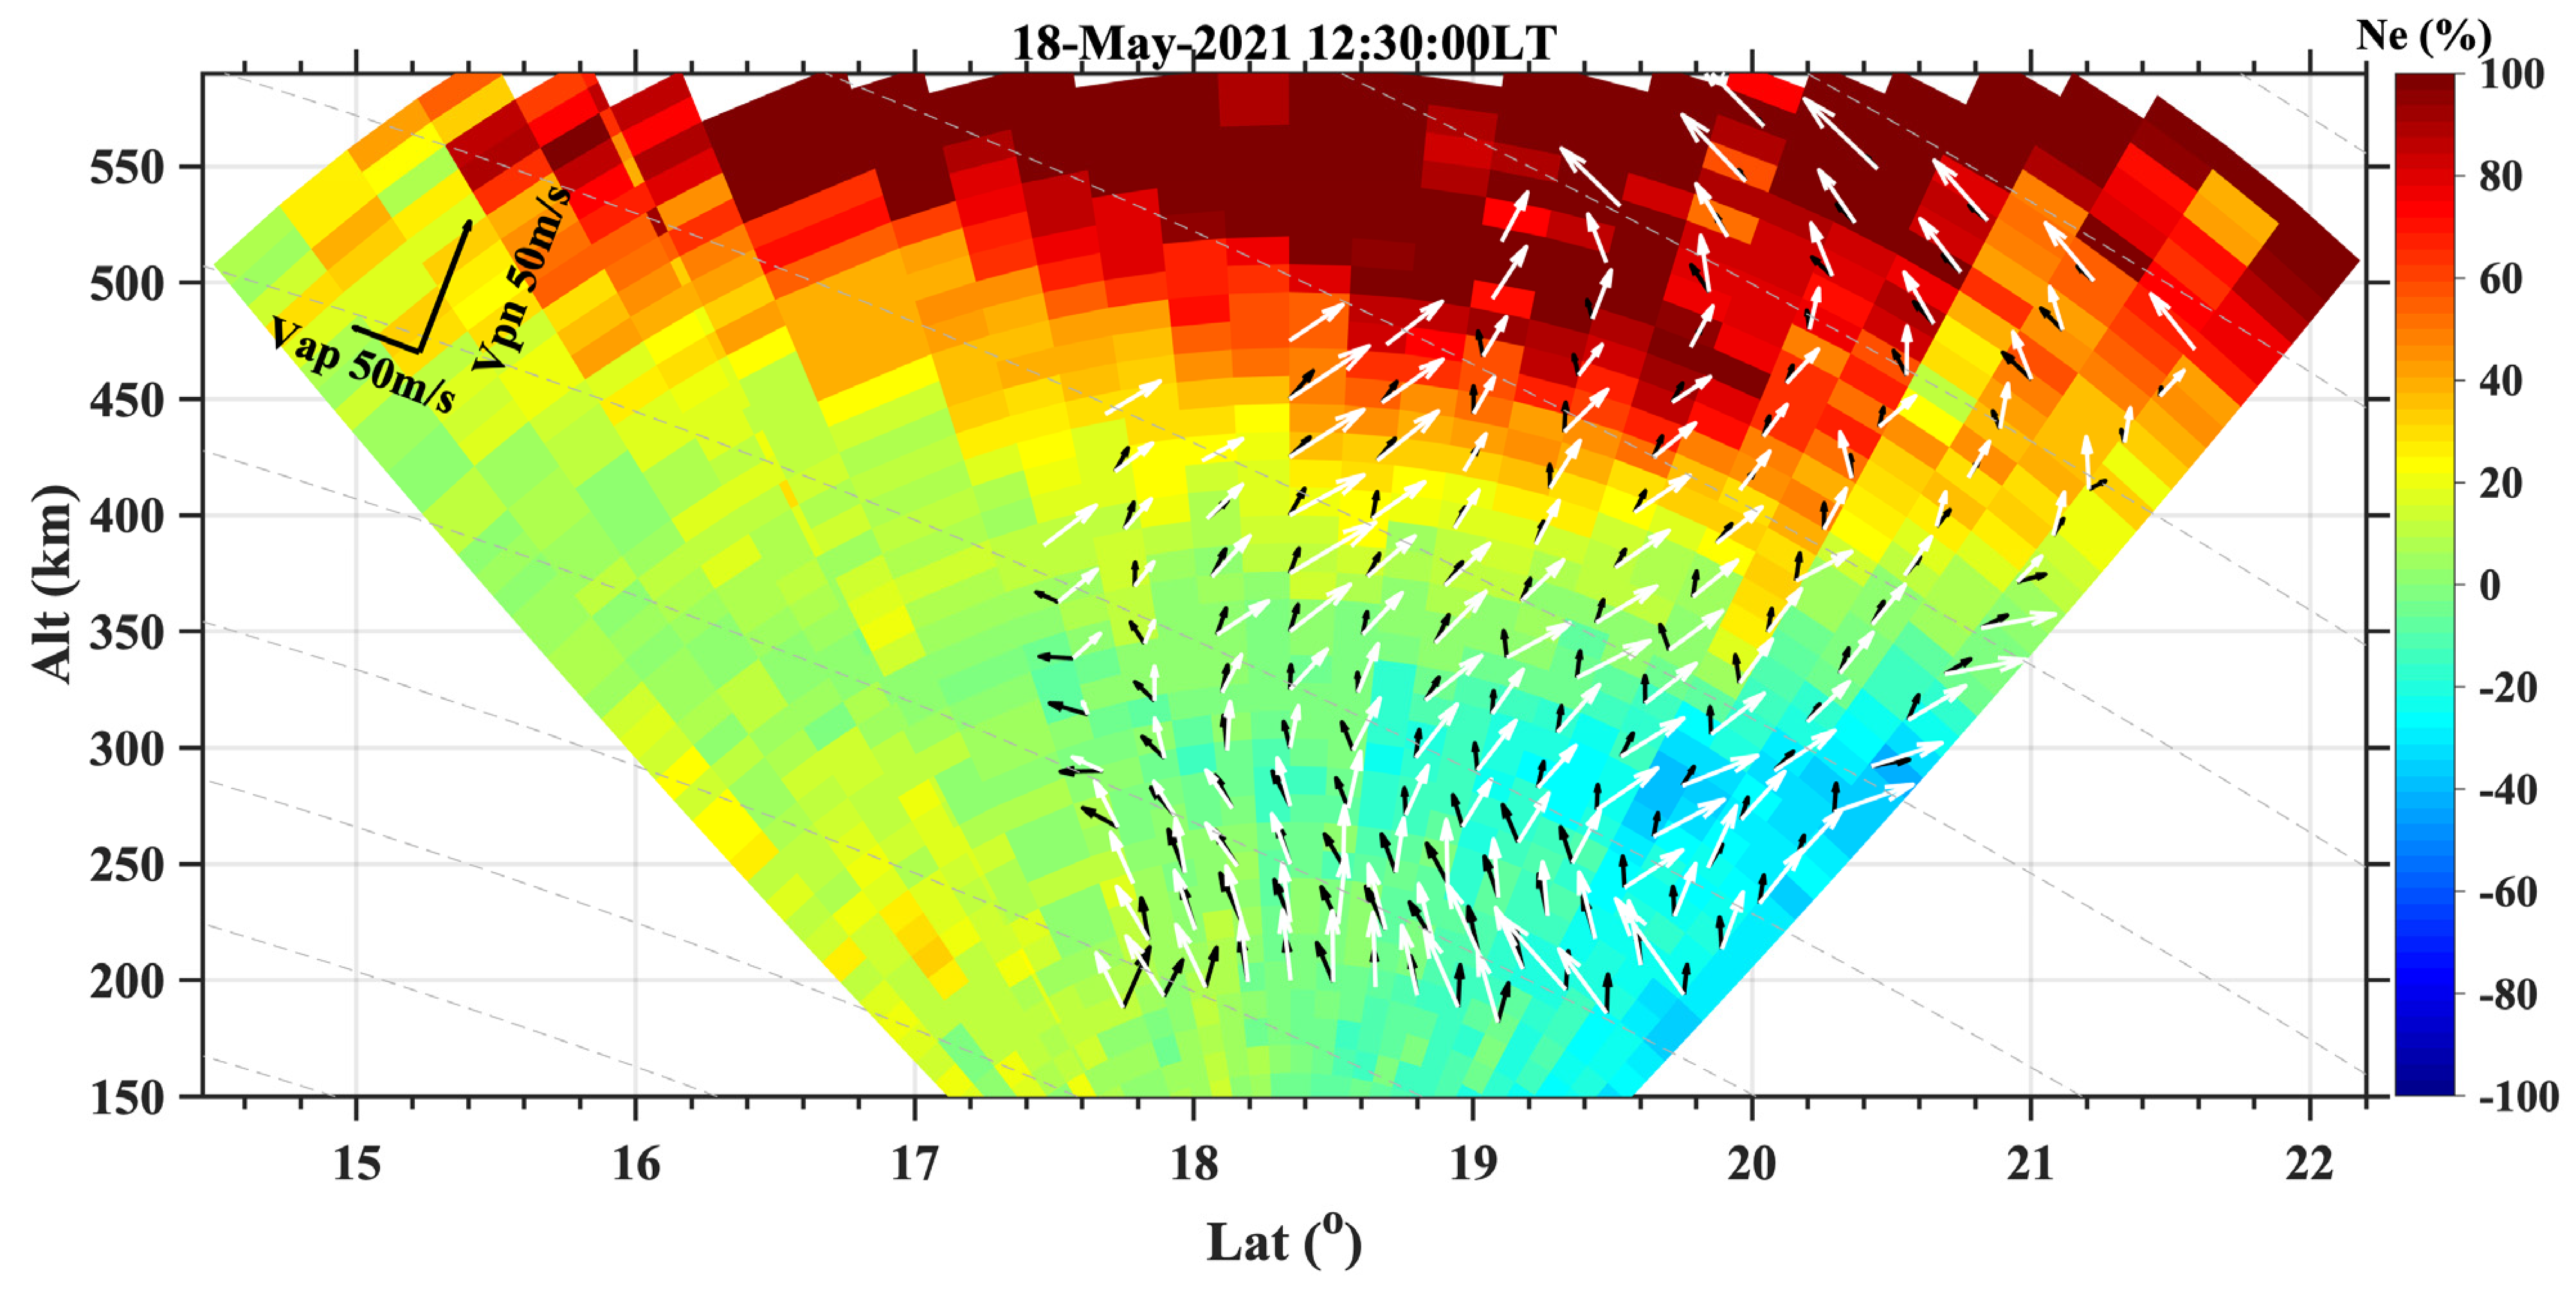
4. Result and Discussion

With the above example, we find that the accurate three components of plasma drift velocities can be obtained with NS + EW scanning beams, or relatively reliable two components of v p n and v a p can be obtained with NS scanning beams, but with only EW scanning beams, the estimated v p n are very different from the actual v p n . Therefore, it is not recommended to use only EW scanning beams for plasma drift detection; instead, the beams can be performed scanning in the meridian (NS) and cross-shaped (NS + EW) planes to obtain the spatial distribution of the plasma drift. The detection modes used during 11–28 May were all the same as NS scanning beams. In Figure 5, the variation of v p n with local time (04:00 LT–21:30 LT) of 300 km altitude is shown as gray dots, while the median value of v p n is calculated and plotted together in this figure as red dots. v p n shows a clear day-to-day variation and will be distributed in a speed range with a difference of about 40 m/s at the same local time. However, v p n shows a similar trend during these days, as presented by the median values: the velocity approaches 0 m/s or shows negative values during the night, turns positive at sunrise (around 05:30 LT), and continues to increase, reaching a maximum value of about 20 m/s before noon (around 10:00 LT), then decreases slightly in the afternoon but remains positive, and gradually decreases to <0 m/s around evening with no significant PRE at sunset, showing a negative value for most of the nighttime. The solar flux in May 2021 was at a low level (averaged value of f107:79) and geomagnetic conditions were quiet (Kp ≤ 3 for 93% period time). These results are consistent with Jicamarca’s previous observations [16,22].
To discuss the reliability of the plasma drift inversed by SYISR’s observations in scientific studies, we give two examples as follows. The first one is the statistical correlation of the v p n with the crest-to-trough ratio (CTR) of EIA for total electron content (TEC) in May. The EIA is formed mainly from the removal of plasma around the geomagnetic equator, creating the trough above the equator, and consequently, the two crests off the equator at an altitude in both northern and southern hemispheres, which is influenced by chemistry, neutral wind, E × B drift and ambipolar diffusion. The EIA varies with time of day, season and level of solar activity, and has large day-to-day variability mainly due to the variability of E × B drift [23]. With the evolution and enhancement of EIA, density above the trough would decrease and densities at crests would increase. When the E × B drift is stronger, the density above the trough is smaller. To characterize the EIA variations, CTR is usually used to represent EIA strength, which is mainly linked with the zonal electric field and used to study the occurrence of irregularities and scintillation [24]. The product of a 15 min global ionospheric TEC map (GIM) has been used [25]. Figure 6a shows an overview of the local time variation of EIA in the longitude of 110°E, Figure 6b shows the TEC differences with its median value, and Figure 6c shows the v p n at the altitude of 300 km. In detail, the monthly median pattern of EIA is shown in Figure 7a. The variation of the correlation coefficient of crest-to-trough ratio (CTR) and v p n from 07:00 LT–19:00 LT is shown in Figure 7b. CTR is calculated by employing the same equation of Xiong et al. [26] represented by (N+S)/2T, where N(S) represents the TEC above the northern (southern) crest and T represents the TEC at the trough. The red rectangle indicates the number of data pairs for which this correlation coefficient is calculated. The correlation coefficient is close to 0 at 07:00 LT, basically negative in the morning hours, gradually reversing to positive at noon, and maintaining a relatively high positive correlation after 14:00 LT. The observed data pairs are less than 20 at 07:00 LT–10:00 LT and 19:00 LT, which may have the effect of small samples with unstable statistical results. The negative correlation coefficient before noon could most probably be caused by the asymmetry of the EIA modulated by the meridional wind in May in the morning-noon sector. Due to the summer-to-winter trans-equatorial wind, the northern crest of EIA is much less developed and the southern crest is enhanced. There is no obvious double-crest of EIA in May before 12:00 LT, although there is large v p n in the morning–noon sector shown in Figure 5. The high correlation coefficient between v p n and CTR after 14:00 LT indicates that v p n is a key parameter that affects the evolution of EIA and can be used in the study of middle-low latitude ionospheric parameters of short-term forecasting and day-to-day variability.
The second is the application of the inverse drift with a latitude–altitude spatial distribution in the study of the ionospheric storm. Figure 8a shows the variation of interplanetary magnetic field (IMF) Bz component in GSM coordinates obtained from OMNI database, the dawn–dusk component of interplanetary electric field Ey, Dst index. Figure 8b shows the local time variation of v p n at 300 km altitude on 18 May as well as its monthly median value. Figure 8c shows the distribution of the peak electron density height (Hm) derived from the SYISR electron density profile on 18 May as well as its monthly median value. As shown in Figure 8a, a minor geomagnetic storm occurred on 18 May with Dst minimum of −31 nT. IMF Bz experienced two southward excursions at 08:00 LT and 11:30 LT as well as the enhancements of Ey at the same time, corresponding to two enhancements of v p n at 300 km altitude with magnitudes of 5–15 m/s in Figure 8b. After 08:30 LT, Hm lifts rapidly from 264 km to 383 km, then drops slightly to 378 km, but lifts again to 386 km after 12:30 LT in Figure 8c. Because of the experiment interruption, v p n and electron density after ~14:10 LT on 18 May are absent. Both the interplanetary parameters and v p n as well as Hm indicate that there were eastward penetrating electric fields taking effect during this period in the East Asia region. Figure 9 shows the distribution of relative electron density and plasma drift (white arrows) in the meridional plane at 12:30 LT on 18 May, with black arrows marking the monthly averaged plasma drift pattern and gray dashed lines showing the magnetic lines. For the average pattern of drift at 12:30 LT, the velocities in the meridional plane show basically northward perpendicular to the magnetic field lines, with no apparent velocities along the equatorward or poleward along the magnetic field lines. In comparison, drifts on 18 May show a significant increase in the velocities northward perpendicular to the magnetic field lines and poleward along the magnetic field lines below 500 km where the errors are within the acceptable range, which contributes to the significant increase (80–100%) in electron density at high altitudes over the latitudes 15–22°. The TEC over the whole EIA region was greatly intensified during this period as illustrated in Figure 6a, which is associated with an electrodynamic process due to the penetration electric field. More physical mechanisms will be discussed in subsequent scientific study, but this unique spatial distribution of plasma drift velocities at low latitude provides rich and fine information on the geomagnetic storm effect, which facilitates the study of the ionospheric response at smaller scales and helps to understand the magnetosphere–ionospheric coupling processes.

5. Conclusions

Based on the newly established advanced modular phase array ISR in the eastern hemisphere at low latitudes, SYISR, we designed three beam-scanning modes in meridian, zonal and cross-shaped (both meridian and zonal) planes for plasma drift detection of SYISR. The inversion method based on Bayesian estimation was applied in drift inversion. By two methods of inversion window setting, the altitude profile and distribution in longitude/latitude and altitude of plasma drift were presented. The altitude profile of all three components of plasma drift ( v p e , v p n and v a p ) could be inversed by LOS velocity from cross-shaped beam scanning mode, with the error of 1 m/s for v p n and 2 m/s for v p e and v a p . The distribution of the low-latitude plasma drift in the meridian plane was first presented with meridian beam scanning mode on March/May 2021. It shows a clear perpendicular magnetic field northward and parallel magnetic field poleward during daytime and a completely parallel magnetic field equatorward at nighttime. A statistical correlation coefficient between the v p n and CTR of TEC shows that for the May condition v p n is an important parameter to control the daily evolution of EIA in the afternoon sector. A case study of minor magnetic storm response in plasma drift shows that the inversed plasma drift can be a good indicator in response to the solar wind changes and explain the ionospheric electron density changes at low latitudes. This study proves that the SYISR-measured plasma drift is reliable and will play an important role in the atmosphere–ionosphere–magnetospheric coupling study in the East Asian region.

Author Contributions

Conceptualization, Y.J. and B.Z.; methodology, Y.J.; formal analysis, Y.J.; investigation, Y.J.; writing—original draft preparation, Y.J.; writing—review and editing, Y.J., B.Z., H.H., X.Y., F.D., B.N., L.Z. and Z.L. All authors have read and agreed to the published version of the manuscript.

Funding

This work was supported by the National Natural Science Foundation of China (42174206). This research was also funded by the Young Talent Program of Chinese Academy of Science (CAS) and Youth Innovation Promotion Association CAS. This work was also supported by Stable-Support Scientific Project of China Research Institute of Radiowave Propagation (Grant No. A13XXXXWXX). The authors acknowledge the use of data from the Chinese Meridian Project.

Data Availability Statement

The experimental results in the figures could be obtained upon re-quest. The GIM TEC data are downloaded from ftp://ftp.gipp.org.cn/product/ionex/, accessed on 3 March, 2023. The interplanetary data of Bz and Ey are download from OMNI database (https://omniweb.gsfc.nasa.gov/, accessed on 2 December 2022). The geomagnetic data of Dst and Kp are download from World Data Center for Geomagnetism, Kyoto (https://wdc.kugi.kyoto-u.ac.jp/, accessed on 2 December 2022). The solar radio flux data of F107 are down from the official website of the government of Canada (https://www.spaceweather.gc.ca/, accessed on 2 December 2022).

Conflicts of Interest

The authors declare no conflict of interest.

References

  1. Cai, X.; Qian, L.; Wang, W.; McInerney, J.M.; Liu, H.-L.; Eastes, R.W. Hemispherically asymmetric evolution of nighttime ionospheric equatorial ionization anomaly in the American longitude sector. J. Geophys. Res. Space Phys. 2022, 127, e2022JA030706. [Google Scholar] [CrossRef]
  2. Tulasi Ram, S.; Su, S.Y.; Liu, C.H. FORMOSAT-3/COSMIC observations of seasonal and longitudinal variations of equatorial ionization anomaly and its interhemispheric asymmetry during the solar minimum period. J. Geophys. Res. 2009, 114, A06311. [Google Scholar] [CrossRef]
  3. Sripathi, S.; Sreekumar, S.; Banola, S. Characteristics of equatorial and low-latitude plasma irregularities as investigated using a meridional chain of radio experiments over India. J. Geophys. Res. Space Phys. 2018, 123, 4364–4380. [Google Scholar] [CrossRef]
  4. Karan, D.K.; Daniell, R.E.; England, S.L.; Martinis, C.R.; Eastes, R.W.; Burns, A.G.; McClintock, W.E. First zonal drift velocity measurement of equatorial plasma bubbles (EPBs) from a geostationary orbit using GOLD data. J. Geophys. Res. Space Phys. 2020, 125, e2020JA028173. [Google Scholar] [CrossRef]
  5. Li, Q.; Zhang, R.; Liu, L.; Kuai, J.; Yang, N.; Zhong, J.; Wan, X.; Liu, J. Persistent eastward EEJ enhancement during the geomagnetic storm recovery phases. J. Geophys. Res. Space Phys. 2022, 127, e2022JA030258. [Google Scholar] [CrossRef]
  6. Reinisch, B.W.; Scali, J.L.; Haines, D.M. Ionospheric drift measurements with ionosondes. Ann. Geophys. 1998, 41, 695–702. [Google Scholar] [CrossRef]
  7. Coley, W.R.; Heelis, R.A. Low-latitude zonal and vertical ion drifts seen by DE 2. J. Geophys. Res. 1989, 94, 6751–6761. [Google Scholar] [CrossRef]
  8. Hysell, D.L.; Michhue, G.; Nicolls, M.J.; Heinselman, C.J.; Larsen, M.F. Assessing auroral electric field variance with coherent and incoherent scatter radar. J. Atmos. Sol. Terr. Phys. 2009, 71, 697–707. [Google Scholar] [CrossRef]
  9. Heelis, R.A.; Hanson, W.B. Measurements of Thermal Ion Drift Velocity and Temperature Using Planar Sensors. In Measurement Techniques in Space Plasmas: Particles; Pfaff, R.F., Borovsky, J., Young, D.T., Eds.; Wiley: Hoboken, NJ, USA, 1998. [Google Scholar] [CrossRef]
  10. Yeh, H.-C.; Su, S.Y.; Yeh, Y.C.; Wu, J.M.; Heelis, R.A.; Holt, B.J. Scientific Mission of the IPEI payload onboard ROCSAT-1. Terr. Atmos. Ocean. Sci. 1999, 19–42. [Google Scholar] [CrossRef]
  11. Immel, T.J.; England, S.L.; Mende, S.B.; Heelis, R.A.; Englert, C.R.; Edelstein, J.; Frey, H.U.; Korpela, E.J.; Taylor, E.R.; Craig, W.W.; et al. The ionospheric connection explorer mission: Mission goals and design. Space Sci. Rev. 2018, 214, 13. [Google Scholar] [CrossRef]
  12. Woodman, R.F.; Chau, J.L.; Ilma, R.R. Comparison of ionosonde and incoherent scatter. drift measurements at the magnetic equator. Geophys. Res. Lett. 2006, 33, L01103. [Google Scholar] [CrossRef]
  13. Evans, J.V. Theory and practice of ionosphere study by Thomson scatter radar. Proc. IEEE 1969, 57, 496–530. [Google Scholar] [CrossRef]
  14. Fejer, B.G.; Maute, A. Equatorial Ionospheric Electrodynamics. In Ionosphere Dynamics and Applications; Wiley: Hoboken, NJ, USA, 2021. [Google Scholar] [CrossRef]
  15. Fejer, B.G. Low latitude electrodynamic plasma drifts: A review. J. Atmos. Terr. Phys. 1991, 53, 677–693. [Google Scholar] [CrossRef]
  16. Scherliess, L.; Fejer, B.G. Radar and satellite global equatorial F region vertical drift model. J. Geophys. Res. 1999, 104, 6829–6842. [Google Scholar] [CrossRef]
  17. Fejer, B.G.; Souza, J.R.; Santos, A.S.; Perreira, A.E.C. Climatology of F region zonal drifts over Jicamarca. J. Geophys. Res. 2005, 110, A12310. [Google Scholar] [CrossRef]
  18. Nicolls, M.J.; Cosgrove, R.; Bahcivan, H. Estimating the vector electric field using monostatic, multibeam incoherent scatter radar measurements. Radio Sci. 2014, 49, 1124–1139. [Google Scholar] [CrossRef]
  19. Yue, X.; Wan, W.; Ning, B.; Jin, L.; Ding, F.; Zhao, B.; Zeng, L.; Ke, C.; Deng, X.; Wang, J.; et al. Development of the Sanya incoherent scatter radar and preliminary results. J. Geophys. Res. Space Phys. 2022, 127, e2022JA030451. [Google Scholar] [CrossRef]
  20. Hao, H.; Zhao, B.; Wan, W.; Yue, X.; Ding, F.; Ning, B.; Zeng, L.; Jin, Y.; Wang, J.; Zhang, N. Initial Ionospheric Ion Line Results and Evaluation by Sanya Incoherent Scatter Radar (SYISR). J. Geophys. Res. Space Phys. 2022, 127, e2022JA030563. [Google Scholar] [CrossRef]
  21. Heinselman, C.J.; Nicolls, M.J. A Bayesian approach to electric field and E-region neutral wind estimation with the Poker Flat Advanced Modular Incoherent Scatter Radar. Radio Sci. 2008, 43, RS5013. [Google Scholar] [CrossRef]
  22. Fejer, B.G.; de Paula, E.R.; González, S.A.; Woodman, R.F. Average vertical and zonal F region plasma drifts over Jicamarca. J. Geophys. Res. 1991, 96, 13901–13906. [Google Scholar] [CrossRef]
  23. Balan, N.; Liu, L.B.; Le, H.J. A brief review of equatorial ionization anomaly and ionospheric irregularities. Earth Planet. Phys. 2018, 2, 257–275. [Google Scholar] [CrossRef]
  24. Luo, W.; Li, H.; Xiong, C.; Zhu, Z.; Yu, X.; Chang, S. Linkage of equatorial ionization anomaly with the day-to-day occurrence of postsunset irregularities and scintillation in low-latitude region around 110° E. Space Weather 2022, 20, e2022SW003192. [Google Scholar] [CrossRef]
  25. Li, Z.; Yuan, Y.; Wang, N.; Hernandez-Pajares, M.; Huo, X. SHPTS: Towards a new method for generating precise global ionospheric TEC map based on spherical harmonic and generalized trigonometric series functions. J. Geod. 2014, 89, 331–345. [Google Scholar] [CrossRef]
  26. Xiong, C.; Lühr, H.; Ma, S.Y. The magnitude and inter-hemispheric asymmetry of equatorial ionization anomaly-based on CHAMP and GRACE observations. J. Atmos. Sol. Terr. Phys. 2013, 105–106, 160–169. [Google Scholar] [CrossRef]
Figure 1. Three kinds of beam configurations and the corresponding LOS velocity and its error: (a) beams scanning in zonal plane marked in red (elevation angle larger than 50°) and green (elevation angle smaller than 50°) dots, blue hexagon marked the scanning range with non-grate lobe; (b) the zonal distribution of line-of-sight velocity at 12:30 LT (daytime) and (c) its error; (d) the zonal distribution of line-of-sight velocity at 21:24 LT (nighttime) and (e) its error; (fj) showing the same as (ae) but for meridional plane; (k) beams scanning in both zonal and meridional planes; (lo) the zonal distribution of line-of-sight velocity and its error by beams scanning in zonal plane part; (ps) showing the same as (lo) but by beams scanning in meridional plane part. Location of the zenith beam marked in the bottom of (a,f,k).
Remotesensing 15 02842 g001
Figure 2. (al) the local time distribution of error of LOS velocity at 300 km altitude four under different azimuth angle bins from left to right panels and three different elevation angle bins from top to bottom panels; (m) the distribution of errors of LOS velocity with elevation angle and range during 12:00 LT to 15:00 LT.
Remotesensing 15 02842 g002
Figure 3. The distribution of vector plasma drift: (a) the component of perpendicular magnetic field to eastward, (c) the component of perpendicular magnetic field to northward, (e) the component of antiparallel magnetic field and its error (b,d,f) with altitude and local time on 27 March 2021.
Remotesensing 15 02842 g003
Figure 4. The distribution of vector plasma drift in meridian (a,b) and zonal (c,d) planes at daytime and nighttime on 27 March 2021. Gray dotted lines marked the magnetic lines in (a,b).
Remotesensing 15 02842 g004
Figure 5. The local time variation of v p n at 300 km altitude during 11–28 May (gray dots) as well as its median value (red dots).
Remotesensing 15 02842 g005
Figure 6. (a) The local time variation of EIA TEC from GIM TEC in the longitude of 110°E, (b) its differences with median value and (c) v p n at altitude of 300 km (blank areas meaning missing data).
Remotesensing 15 02842 g006
Figure 7. (a) The local time variation of monthly median pattern of EIA calculated from GIM TEC in the longitude of 110°E, (b) the local time variation of correlation coefficient between v p n and CTR, the number of data points to calculate the correlation coefficient marked in red bars.
Remotesensing 15 02842 g007
Figure 8. (a) The local time variation of Ey (blue), IMF Bz (green) and Dst (red) index on 18 May, (b) the local time variation of v p n at 300 km altitude on 18 May (red) as well as its median value (black), (c) the distribution of the peak electron density height derived from SYISR electron density profile on 18 May (red) as well as its median value (black). The absence of v p n and electron density after ~14:10 LT on 18 May because of the experiment interruption.
Remotesensing 15 02842 g008
Figure 9. The distribution of relative electron density and plasma drift (white arrows) at 12:30 LT on 18 May in meridian plane, median pattern of plasma drift showed with black arrows. Gray dotted lines marked the magnetic lines.
Remotesensing 15 02842 g009
Table 1. Drift detection experiments in March to May 2021 by SYSIR.
Scanning ModeTime (Days)Number of BeamsMinimum Angle of Elevation (°)Interval Angle of Elevation (°)
NS541402.50
1641253.25
EW141253.25
NS + EW141454.50
141553.50
Disclaimer/Publisher’s Note: The statements, opinions and data contained in all publications are solely those of the individual author(s) and contributor(s) and not of MDPI and/or the editor(s). MDPI and/or the editor(s) disclaim responsibility for any injury to people or property resulting from any ideas, methods, instructions or products referred to in the content.

