Article

Absorbing Aerosol Optical Properties and Radiative Effects on Near-Surface Photochemistry in East Asia

1
Suzhou Meteorological Bureau, Suzhou 215100, China
2
School of Atmospheric Sciences, CMA-NJU Joint Laboratory for Climate Prediction Studies, Jiangsu Collaborative Innovation Center for Climate Change, Nanjing University, Nanjing 210023, China
3
Department of Geography and Planning, University of Toronto, Toronto, ON M5S 3G3, Canada
4
Key Laboratory for Humid Subtropical Eco-Geographical Processes of the Ministry of Education, College of Geographical Sciences, Fujian Normal University, Fuzhou 350117, China
5
Huaneng Huaiyin Power Plant, Huai’an 223001, China
6
Anhui Meteorological Observatory, Hefei 230031, China
7
Water Resources & Hydropower Invest Design &Res, Lanzhou 730000, China
*
Author to whom correspondence should be addressed.
Remote Sens. 2023, 15(11), 2779; https://doi.org/10.3390/rs15112779
Submission received: 9 April 2023 / Revised: 19 May 2023 / Accepted: 22 May 2023 / Published: 26 May 2023

Abstract

:
Absorbing aerosols have significant influences on tropospheric photochemistry and regional climate change. Here, the direct radiative effects of absorbing aerosols at the major AERONET sites in East Asia and corresponding impacts on near-surface photochemical processes were quantified by employing a radiation transfer model. The average annual aerosol optical depth (AOD) of sites in China, Korea, and Japan was 1.15, 1.02 and 0.94, respectively, and the corresponding proportion of absorbing aerosol optical depth (AAOD) was 8.61%, 6.69%, and 6.49%, respectively. The influence of absorbing aerosol on ultraviolet (UV) radiation mainly focused on UV-A band (315–400 nm). Under the influence of such radiative effect, the annual mean near-surface J[NO2] (J[O1D]) of sites in China, Korea, and Japan decreased by 16.95% (22.42%), 9.61% (13.55%), and 9.63% (13.79%), respectively. In Beijing–Tianjin–Hebei (BTH) and Yangtze River Delta (YRD) region, the annual average AOD was 1.48 and 1.29, and the AAOD was 0.14 and 0.13, respectively. The UV radiative forcing caused by aerosols dominated by black carbon (BC-dominated aerosols) on the surface was −3.19 and −2.98 W m−2, respectively, accounting for about 40% of the total aerosol radiative forcing, indicating that the reduction efficiency of BC-dominated aerosols on solar radiation was higher than that of other types of aerosols. The annual mean J[NO2] (J[O1D]) decreased by 14.90% (20.53%) and 13.71% (18.20%) due to the BC-dominated aerosols. The daily maximum photolysis rate usually occurred near noon due to the diurnal variation of solar zenith angle and, thus, the daily average photolysis rate decreased by 2–3% higher than that average during 10:00–14:00.

Graphical Abstract

1. Introduction

East Asia suffered from severe atmospheric pollution for decades as a result of the rapid industrialization and urbanization, especially in the megacities [1,2,3,4,5,6,7,8,9,10,11,12,13,14]. Studies highlighted links between heavy aerosol loading and health problems and agriculture troubles [15,16,17,18,19,20,21,22,23]. Absorbing aerosols are major pollutants that can absorb downward solar radiation in the atmosphere, radiative forcing of which is believed to play a profound role in Earth’s radiative balance and climate change [24,25,26,27,28,29,30,31], namely aerosol direct effects (ADE) [32,33]. The ADE of absorbing aerosols generally heats the atmosphere but cools the surface via the absorption of the downward solar radiation, thus changing the thermal-dynamic field and the hydrological cycle in different ways.
In addition to its influences on the temperature and precipitation, ADE is also closely related to ozone pollution. Troposphric ozone is an effective greenhouse gas and an important atmospheric oxide by affecting actinic radiation flux, which drives tropospheric photochemistry, including the photodissociation process of photochemical precursors [34,35]. The actinic radiation flux, defined as the integration of the radiation over all sphere angles, mainly consists of UV and certain visible radiation, which can be altered by aerosols absorbing radiation. Tropospheric ozone is produced through numerous complicated photochemical reactions in the presence of precursors and solar radiation, such as NOx, CO, and VOCs. Generally, tropospheric ozone is largely determined by two key photochemical reactions including the photolysis of NO2 (NO2 + hν→NO + O3P, followed by O3P + O2→O3) and the photolysis of O3 (O3 + hν→O2 + O1D), and the latter reaction promotes the conversion of NO to NO2, thus leading to the formation of ozone. The photolysis reaction rate for NO2 and O3 is greatly related to UV actinic flux, which can be influenced by ADE [35]. Therefore, the strong ADE due to heavy absorbing aerosol loading can have an appreciable effect on these photolysis rate coefficients for NO2 (J(NO2)) and O3 (J(O3)).
Many studies based on model simulations and observations were carried out on absorbing aerosol radiative forcing and its climate effects over the last two decades at both global and regional scales [36,37,38,39,40]; nevertheless, large uncertainties remain. It was noted that the global mean direct radiative forcing (DRF) for black carbon (BC), a typical absorbing aerosol, varied from +0.1 to +0.3 W m−2 [41]. It was suggested that the global mean of BC DRF in several models should be +0.71 W m−2, and it was indicated that the BC DRF based on previous studies might be underestimated by a factor of 3 [42]. The ranges were larger at regional scales, especially in polluted urban areas such as East Asia, where BC DRF reaches up to 100 W m−2 [30,31,43,44,45,46]. Emphasis was placed on estimating the photolysis reaction rate changes induced by ADE using laboratory measurement and model simulation since the 1990s [37,47,48,49,50,51,52,53,54,55,56,57]. Previous studies indicated that absorbing particles reduce photolysis rates [35,58,59], and such influence is largely dependent on aerosol loadings, properties, and distribution, as well as numerical model structures. Therefore, the uncertainty of evaluation of the change in the photolysis rate due to ADE of the total aerosols [37,54,60,61] or specific types of aerosols [62,63,64] was increased in heavily polluted regions or megacities. Studies in eastern China found that reductions in photolysis rates varied from 6 to 50% due to ADE of the total aerosols [65,66,67]. It was suggested that the total aerosols reduced the photolysis rate of O3 at the surface by 5–15% over most of the Northern Hemisphere, mainly due to absorbing aerosols based on simulations from a global three-dimensional chemical transport models (CTM) [50]. It was found that the photolysis rate of O3 decreased by 10–20% in East Asia due to ADE of sulfate, carbonaceous aerosols, ammonium nitrate, sea salt, and mineral dust using MOZART-2. Using the sulfur transport and emissions model (STEM) [68], the O3 concentration was estimated to be reduced by 0.1–0.8% in northeastern China during the high-dust Asian Pacific regional aerosol characterization experiment (ACE-Asia) period because of the ADE of dust on photolysis rates [69]. It was suggested that reduction in the photolysis rate of O3 due to ADE of BC in eastern China was 4% and 2% during winter and summer, respectively, using GEOS-CHEM [70]. It was found in [34] that the ADE of BC reduced the photolysis rates of several pollutants in Eastern Los Angeles using an aerosol transfer radiation model (GATORM) to simulate the episode in Los Angeles. It was indicated that ADE of absorbing aerosols caused a greater reduction in the photolysis coefficient of Mexico City using the tropospheric ultraviolet and visible model (TUV) and a chemical kinetics model (KINMOD) [71]. The ADE of BC could reduce the photolysis rate of O3 in the boundary layer by 10–30% using a chemical transport model (HANK) when air pollution was heaviest in Houston, Texas [61]. The attenuation of photolysis rates of NO2 and O3 caused by ADE of BC reached a peak at about 6:00 and 18:00, up to −13.7% and −19.0% [72]. The related uncertainties in the radiative forcing and photolysis rate regard to ADE could be substantially reduced if the observed aerosol optical properties were used [73], which is also a premise for accurately estimating the ADE and for improving aerosol model performance.
A considerable number of observation-based studies were conducted on optical properties and DRF considering the surface aerosol [38,74,75,76,77,78,79,80,81] and columnar aerosol [29,82,83,84,85,86,87,88,89,90,91]. It was noted that studies based on surface data mainly focused on the aerosol absorption coefficient (AAC) and scattering coefficient (SC), while studies based on columnar observations can obtain the other key optical properties including aerosol optical depth (AOD), refractive index, and Ångström exponent (AE), and thus, the deficiency in the characteristics of aerosols in the atmosphere which are highly affected by the boundary layer conditions could be solved in a large extend [29]. The annual mean AODs were 0.14, 0.74, and 0.54, and the annual mean AEs were 0.97, 1.05, and 1.19 for rural sites, urban sites, and eastern China according to a systematic long-term measurement of the countrywide total AOD and AE in China from 2002 to 2013 from the China Aerosol Remote Sensing Network (CARSNET) [86]. In addition to the aerosol optical properties, the observation-based aerosol DRFs were estimated around the world [92,93]. However, almost all these investigations focused on the total aerosol forcing, especially in East Asia. The annual mean of 24 h integrated DRF of total aerosols at the surface in Taihu was −38.4 W m−2 and −17.8 W m−2 for shortwave and photosynthetically active radiation, respectively [94]. It was stated that the annual mean clear sky aerosol DRF in Nanjing at the surface was about −21.3 W m−2 [45]. It was estimated that the regional mean aerosol DRF in China was approximately −66 to −111 Wm−2 at the surface when the solar zenith angle was approximately 60° [89].
Although numerous studies of the observed aerosol optical properties in East Asia were carried out recently [45,81,84,95,96,97,98,99,100,101,102,103,104], especially in the regions with fast urbanization and intensive human activity, gaps in the current observations remain since most of these studies only addressed the optical properties and ADE of total aerosols. Few studies considered the different components of aerosols including the absorbing or scattering aerosols and the corresponding DRF, except for the work of [29], which introduced the size fractional optical parameters and the DRF of different aerosol components, as well as the aerosol physical properties of the different size fractions in urban Nanjing. Since aerosols have complicated compositions and distributions throughout the vast territory of East Asia, especially in rapidly developing regions [43,105,106,107], considerable differences might exist in the absorbing aerosol optical and physical properties as well as the corresponding DRF among various sites in East Asia. A few studies illustrated the DRF in the UV band where the ADE can affect near-surface photochemistry. Additionally, none of research mentioned above further studied the ADE on the photolysis rates. Therefore, a more integrated investigation of the absorbing aerosol optical and physical properties, as well as the corresponding DRF in the UV band and photolysis rate change, is still required.
Here, the unaddressed issues for the ADE on the radiative forcing and photolysis rate of absorbing aerosols in East Asia will be studied based on the measurements of CIMEL sun photometers at 25 sites from Aerosol Robotic Network (AERONET), combined with a radiation transfer model, namely TUV, model [108]. Additionally, the BC-dominated absorbing aerosols will be identified and illustrated according to the relationships among the aerosol optical properties at Beijing and Taihu sites, which are typical megacities in BTH and YRD regions, respectively, with long-term and continuous measurements. The results of this study will be contributable to further understanding of the characteristics of the ADE and ozone pollution over East Asia. Furthermore, this study will be advantageous to improve aerosol model performance in optical properties and climate effects. The aerosol optical properties and corresponding ADE on the radiative forcing and photolysis rate can be used to validate the simulations. The methodology is described in Section 2, and the results and discussions are presented in Section 3, followed by the conclusions in Section 4.

2. Data and Methodology

2.1. Description of AERONET Data

AERONET is a project dedicated to ground-based aerosols observation established by NASA (National Aeronautics and Space Administration) and LOA-PHOTONS (CNRS). It provides continuous data on the aerosol optical and radiative characteristics, which are primarily used for aerosol research and characterization, satellite product verification, and the synergy of other data. Equipped with CE-318 sun photometers, AERONET not only measures the wavelength-dependent AOD and AE, but the direct and diffuse solar radiances in the cloud-screened condition between 340 and 1640 nm [109,110], which are employed to retrieve a set of aerosol optical and microphysical properties according to the DOBVIC algorithm, such as corresponding single scattering albedo (SSA) and AAOD [111,112]. Therefore, the data above can be inverted to columnar optical aerosol parameters at four wavelengths of 440, 675, 870, 1020 nm. The data are available at https://aeronet.gsfc.nasa.gov/ (accessed on 10 May 2023), including 3 levels: Level 1.0, Level 1.5, and Level 2.0. Level 1.0 data were not processed and verified by the filtered cloud, which is quite noisy. Level 1.5 data were processed by screening the cloud. The accuracy of the verified data processed by the filter cloud at Level 2.0 was verified with the uncertainty less than 0.02 when the wavelength was shorter than 440 nm [110,113]. The absolute uncertainty of SSA ranged from 0.03 to 0.07, depending on the aerosol load and type [111]. AERONET data were widely used for aerosol research, as well as model and retrieval evaluation and validation in terms of properties, transmission, and radiation effects due to its high accuracy [114,115,116].
The AE and AOD at other wavelengths can be used to derive the AOD in the 330 nm band, and the absorbing Ångström exponent (AAE) and AAOD at other wavelengths can be used to derive the AAOD in the 330 nm band similarly, to illustrate the aerosols characteristics and radiative effects in the UV band according to Equations (1)–(4) [117]. Additionally, the scattering aerosol optical depth (SAOD) in the 330 nm band and the scattering Angström exponent (SAE) were further estimated based on Equations (5) and (6).
AOD 330   nm = AOD 440   nm × ( 330 nm 440 nm ) AE 870   nm 440   nm
AAE 870   nm 440   nm = log 440   nm 870   nm AAOD 870   nm AAOD 440   nm
AAOD 330   nm = AAOD 440   nm × ( 330 nm 440 nm ) AAE 870   nm 440   nm
SSA 330   nm = AOD 330   nm AAOD 330   nm AOD 330   nm
SAOD 330   nm = AOD 330   nm AAOD 330   nm
SAE 870   nm 440   nm = log 440   nm 870   nm SAOD 870   nm SAOD 440   nm
There are 23 AERONET sites in East Asia with observations dating back to 2000, which can be classified into three groups by region: China, Korea, and Japan. The site locations are listed in Table 1. The 12 sites in China can be further classified as sites in (a) north (6 sites), (b) south (8 sites), (c) Tibetan Plateau (2 sites), and (d) east (1 site). The sufficient observations were ensured by the use of observations from all sites. The AERONET hourly aerosol optical properties at the sites were averaged with available data, which included AOD, AE, SSA, AAOD, AAE, and surface albedo from the AEROSOL INVERSIONS (V3).

2.2. Description of Radiation Transfer Model TUV and Experimental Setting

Based on the above-mentioned wavelength-dependent optical properties, the clear-sky UV DRF of aerosols at sites were investigated using the radiation transfer model TUV [108]. The TUV model was widely used in the Weather Research and Forecasting Model coupled with Chemistry (WRF-Chem), STEM, Regional Climate and Chemistry Model (RegCM4), and other models due to its simple code and high computational accuracy [118,119,120] for calculating ultraviolet radiation, photochemical flux, and photolysis rate [121,122,123]. For instance, [124,125] used the TUV model to compare with ground observations and study the relationship between photochemical flux, ultraviolet radiation, aerosol, and O3 in the Pearl River Delta; ref. [126] used the TUV model to calculate global direct radiation, scattered radiation, and photochemical flux; and ref. [29] used the TUV model to study the DRF of the aerosols in urban Nanjing.
Here, only clear-sky UV DRF were addressed since almost all the measurements were carried out in cloud-free-sky conditions. In addition to the aerosol optical properties, the surface albedo [127] and aerosol vertical profiles might influence DRF significantly. It was suggested that the sensitivities of clear-sky aerosol DRF to the aerosol profiles were below 5% [29]. Hence, the wavelength-dependent surface albedo from AERONET and the default profile of TUV [127] were adopted when estimating the aerosol UV DRF. The absorbing aerosols in urban Nanjing were always in a mixed state, and thus, the absorbing aerosol UV DRF and the corresponding effects on photochemistry processes cannot be estimated directly [29]. Here, 2 experiments were conducted using TUV to derive these values from the difference between the total and scattering aerosol UV DRFs, which might be more representative.
In the control run, the UV DRF and corresponding effects on the photochemistry processes of all aerosols were considered with wavelength-dependent AOD, SSA, AE, and surface albedo to replace the default values. In the perturbed run, only the UV DRF and corresponding effects on the photochemistry processes of scattering aerosols were considered with wavelength-dependent SAOD, SSA, SAE, and surface albedo to replace the default values. Due to a lack of SSA observations of each aerosol component, the scattering aerosol UV DRF was estimated based on a given SSA value (0.9999, equal to that of sulfate or nitrate aerosol) in a reference [128]. Therefore, the UV DRF and corresponding effects on the photochemistry processes of the absorbing aerosol were defined as the difference between the two experiments. Model configuration options and settings are listed in Table 2.

3. Results and Discussion

3.1. Optical Properties of the Aerosols

The UV radiation was within a specific range on the electromagnetic spectrum from 280 to 400 nm, which can be categorized into UV-B (280–315 nm) and UV-A (315–400 nm). Therefore, the optical properties in this study refer to those at 330 nm band that were analyzed (AOD330, AAOD330, SSA330), among which AE, AAE, and SAE were in the wavelength from 440 to 870 nm ( AE 440 870 , AAE 440 870 , and SAE 440 870 ), unless otherwise specified.

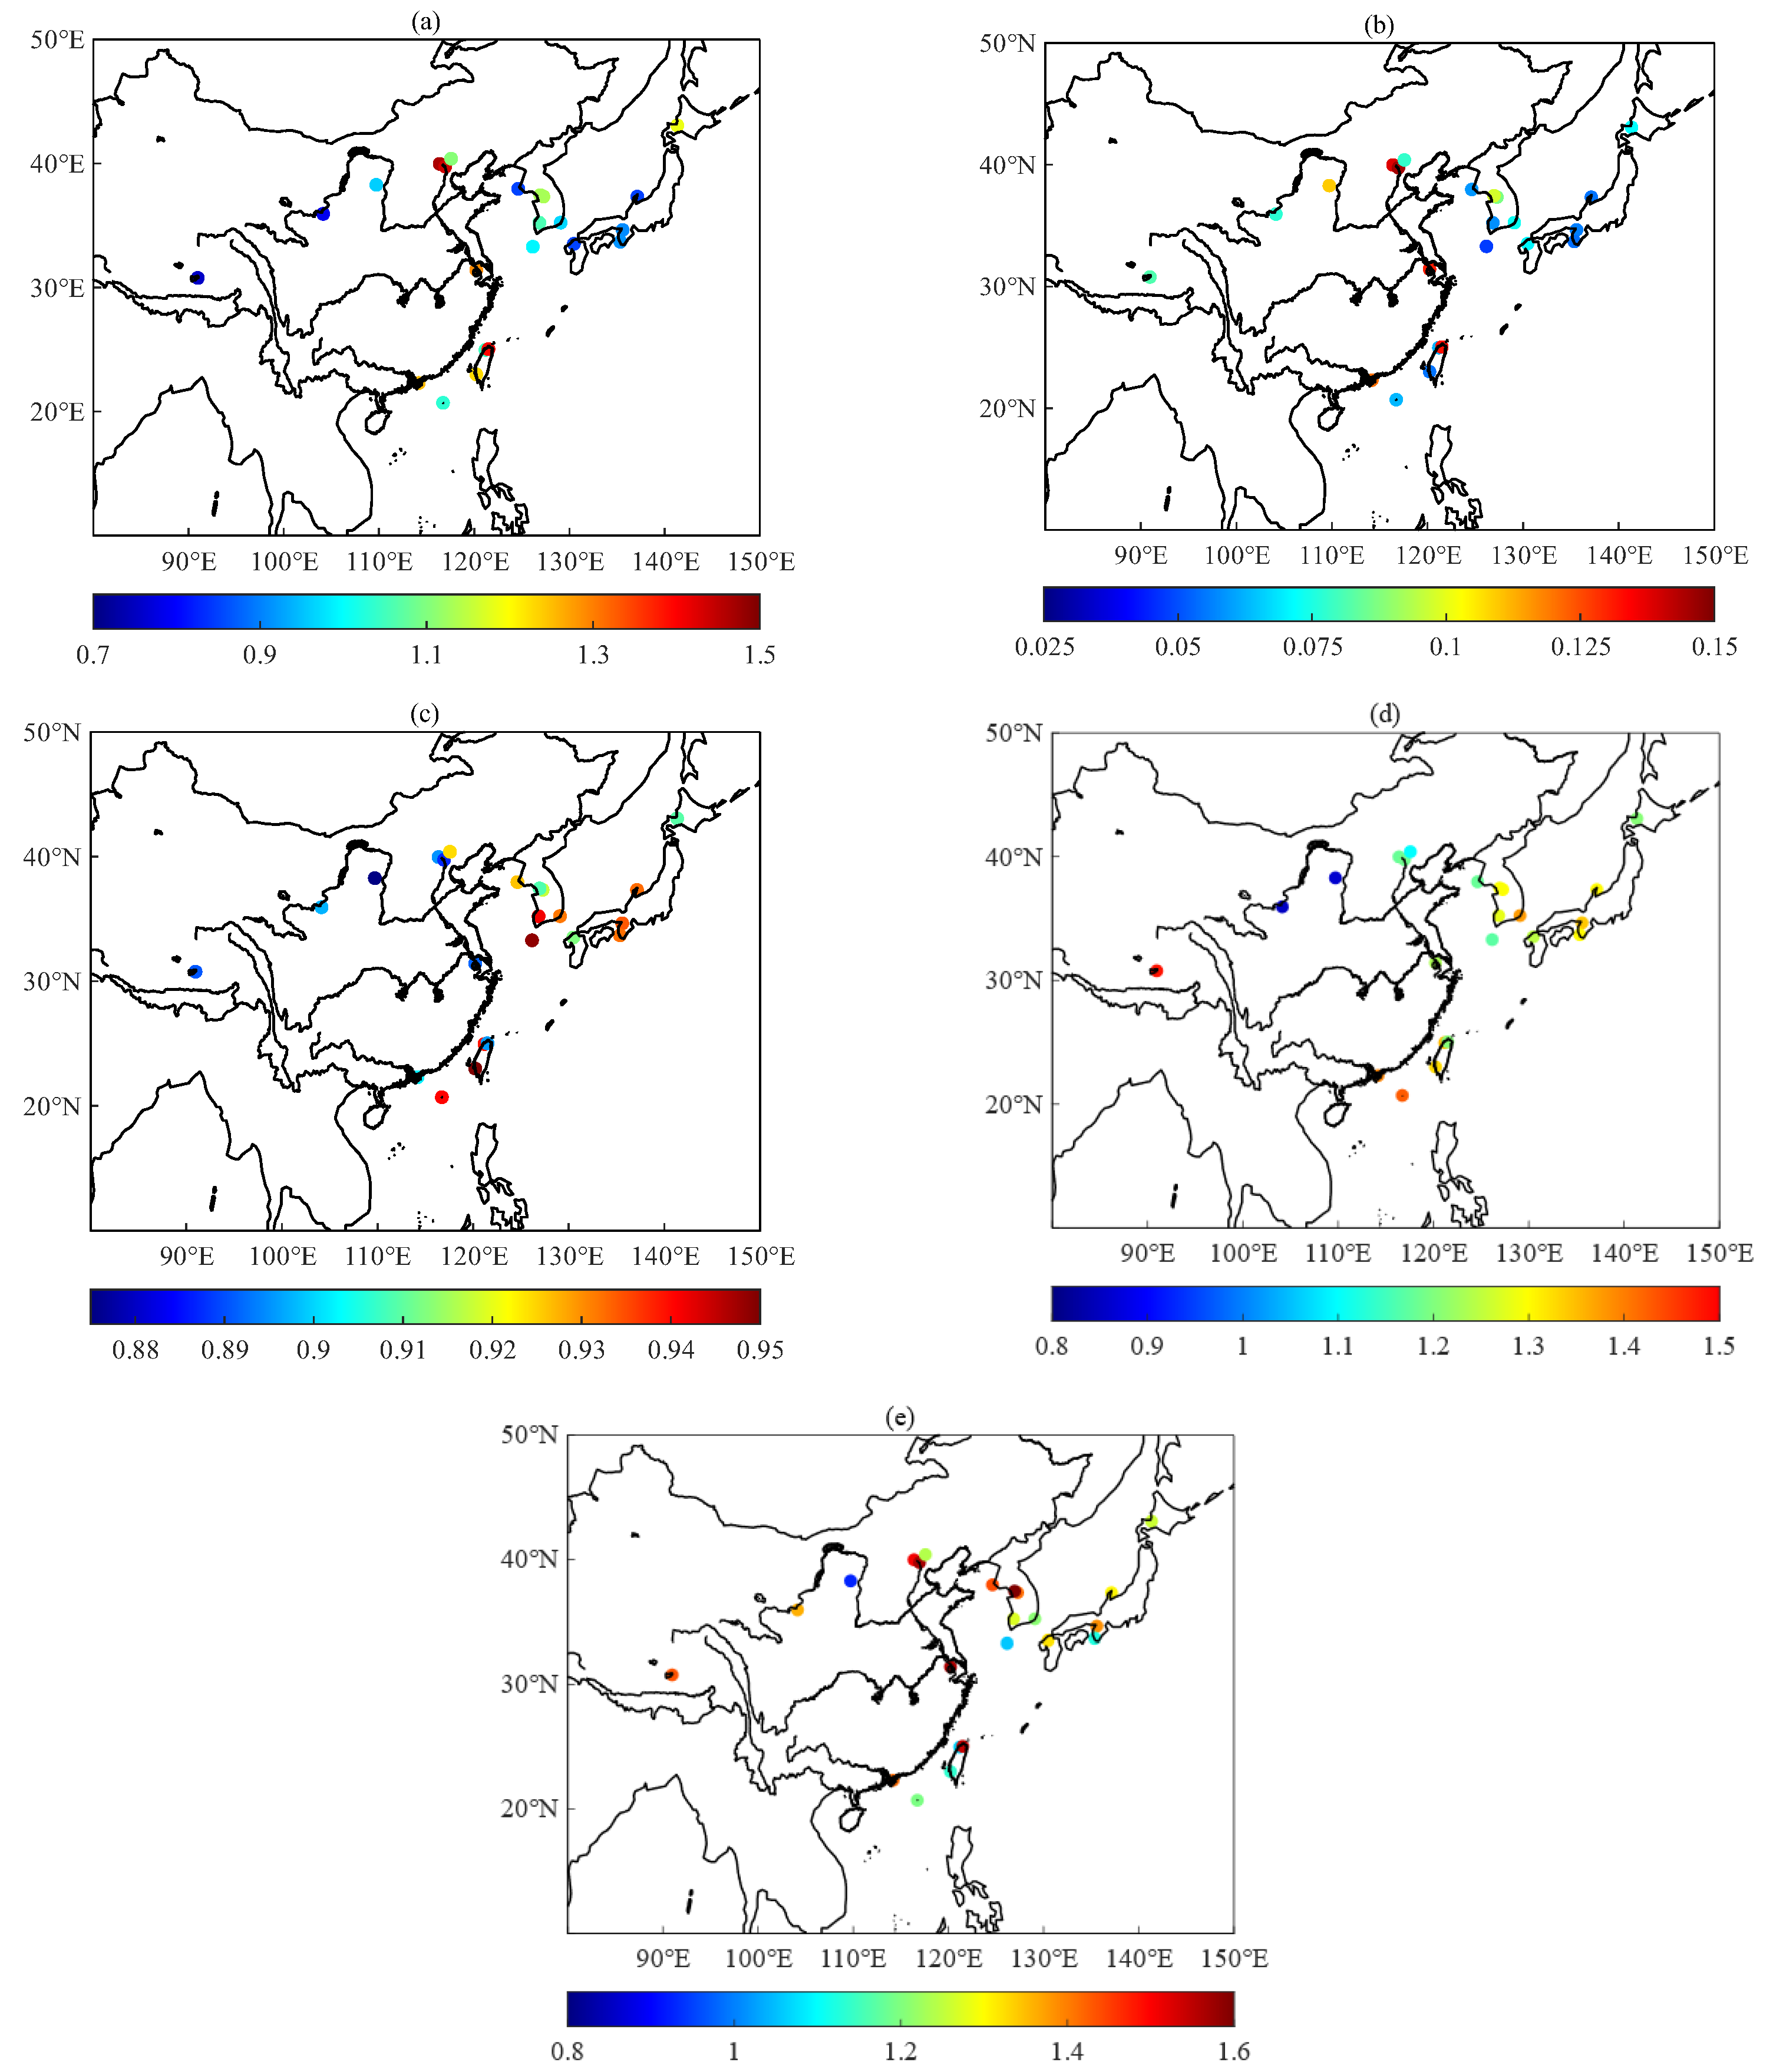
3.1.1. Spatial Variations in the Aerosol Optical Properties

Figure 1 presents a statistical summary of aerosol optical properties during a pertinent sampling period at AERONET sites in East Asia. It was suggested that among the 23 sites, the AOD was the highest at the Beijing site with an average of 1.46, while the AOD was lowest at a Qinghai–Tibet Plateau (QTP) site (NAM_CO), with an average of 0.76 (Figure 1a). The sites with AOD higher than 0.91 included three sites located in Japan, five sites located in South Korea, and ten sites located in China except those located in the Qinghai Tibet Plateau (NAM_CO site) and northwest China (SACOL site), which was the 75th percentile value of the AOD ranking from high to low among the twenty-three sites. High AOD generally occurs in megacities with dense population and high anthropogenic emissions [43,86], and the sites with AOD higher than 1.20 were located in China (except for the Hokkaido University site), which were mainly distributed in the BTH region (Beijing site and Xianghe site), the YRD region (Taihu site), the Pearl River Delta region (PRD; Hong_Kong_PolyU site and Chen-Kung Univ site), and Taiwan (Taipei site). The regional mean AOD of sites in China, South Korea, and Japan were 1.15, 1.02 and 0.94, respectively, which indicates that the extinction of aerosols in China were stronger than those in South Korea and Japan. Previous studies also suggested that West Africa, northern India, and northeast China were the main sources of aerosol emissions worldwide in the downwind direction of the dominant wind [129], and the air quality at sites in North China is poorer than those in northwest China [104].
Figure 1b shows that the AAOD at the Beijing site was the highest at 0.14, and the AAOD at Gosan_SNU site was lowest at 0.05. Generally, the AAOD at urban sites was higher than at rural sites, which is similar as AOD. It was noted that the AAOD at sites located in Western China (Yulin site, SACOL site, and NAM_CO site) were above 0.077, which was the 50th percentile value, while the corresponding AOD was below 0.96, which was the 70th percentile value, indicating that the contribution of absorbing aerosols to total aerosols at these sites was more prominent. The regional mean AAOD accounted for 8.61%, 6.69%, and 6.49% in AOD sites in China, South Korea, and Japan, respectively.
Figure 1c suggests that although the highest SSA was at the Chen-Kung University site in China (SSA = 0.96), the aerosols in China are less scattering compared with those in South Korea and Japan, especially those at the Yulin site, the SACOL site, the NAM_CO site, the Beijing site, the Xianghe site, the Taihu site, and Taipei site. It was found that SSA was generally higher than 0.9 in the global scope [104]. In China, aerosol scattering was strong at sites located in PRD region and Taiwan with an average of 0.95, including the Chen-Kung Univ site, the Dongsha_Island site, and the EPA-NCU site. Abundant moisture, higher air temperature, and stronger radiative forcing in southern China enabled the hygroscopic growth of aerosol, which increases scattering and gives rise to lower AAOD [87,89,103,130,131]. Although the AAOD at sites located in the BTH region (Beijing, Xianghe, and Xinglong sites) was generally higher than that in the northwest region (SACOL and Yulin sites), the aerosols were more absorbing in the northwest region in terms of absorbability (the ratio of AAOD to AOD). It should be noted that there were adjacent sites with obvious differences in aerosol optical properties in the BTH region and Taiwan (such as the Beijing and Xinglong sites, and the Taipei and EPA-NCU sites). On one hand, the sites were located in urban and suburban areas, respectively, which suggests that the underlying surfaces varied widely; on the other hand, the period of the measurements were different (Table 2).
Particles tend to become coarser from finer when AE increases from 0 to 1.5 [113], and a lower value of AE (less than 1.0) typically indicates a coarse-mode aerosol such as dust and sea salt, whereas a higher AE (greater than 2.0) indicates fine-mode aerosol associated with combustion byproducts [132]. The site with the highest AE of 1.48 was the NAM_CO site located in the QTP in China, and the site with the lowest AE of 0.85 was the SACOL site located in northwest China. It was suggested that aerosols in urban areas could show a higher AE than those in rural and desert areas, indicating that the aerosols particles size in urban areas is smaller [86,117,133,134,135]. It was also found that the aerosols in developed urban areas were finer, with the AE ranging from 1.0 to 1.6, and the aerosols also showed more scattering with SSA above 0.9 [136]. Additionally, sites located in south tend to have a higher AE than those located in north if the measurements were conducted during a similar period, which is possibly due to more frequent dust or sand events in the north and the active gas-particle conversion reactions and secondary organic aerosols conversion reactions from the volatile organic compounds [137], as well as the hydroscopic growth of fine aerosol particles [129] under higher temperature conditions in the south. The regional mean AE was 1.22, 1.27, and 1.28 for sites in China, South Korea, and Japan, respectively. Generally, the aerosols particle size in China and South Korea was larger than that of Japan.
To further analyze the optical characteristics of absorbing aerosols, AAE is represented in Figure 1e. Different from AE, the AAE of the Seoul_SNU site located in South Korea was the highest, 1.62, while the AAE of the Yulin site located in the west was the lowest, i.e., 0.93. The regional mean AAE of sites in China, South Korea, and Japan was 1.35, 1.33, and 1.28, respectively, suggesting that the size of absorbing aerosol particles in China was the largest.
Previous research on aerosol optical depth based on observations were implemented in recent decades. In China, according to [89], the AOD at 440 nm generally increased from north to south in China with an average of 0.74, and low AOD levels were found only in remote regions, including the QTP and parts of northwestern China, while large AOD mainly occurred in central and eastern China, where heavy industrial and other anthropogenic emissions [43,86,137] led to high aerosol loadings; the averaged AE 440 870 was 1.05, which were high at the sites in the southern reaches of the Yangtze River and at the clean sites in northeastern China on account of large proportions of fine particles. Ref. [138] retrieved the AOD, AE 440 870 , and SSA from measurements made by a CE318 sunphotometer in Northeast China from 2009 to 2013, which found that the average AOD at 550 hm and AE 440 870 of sites in Northeast China was 0.70 and 0.85.

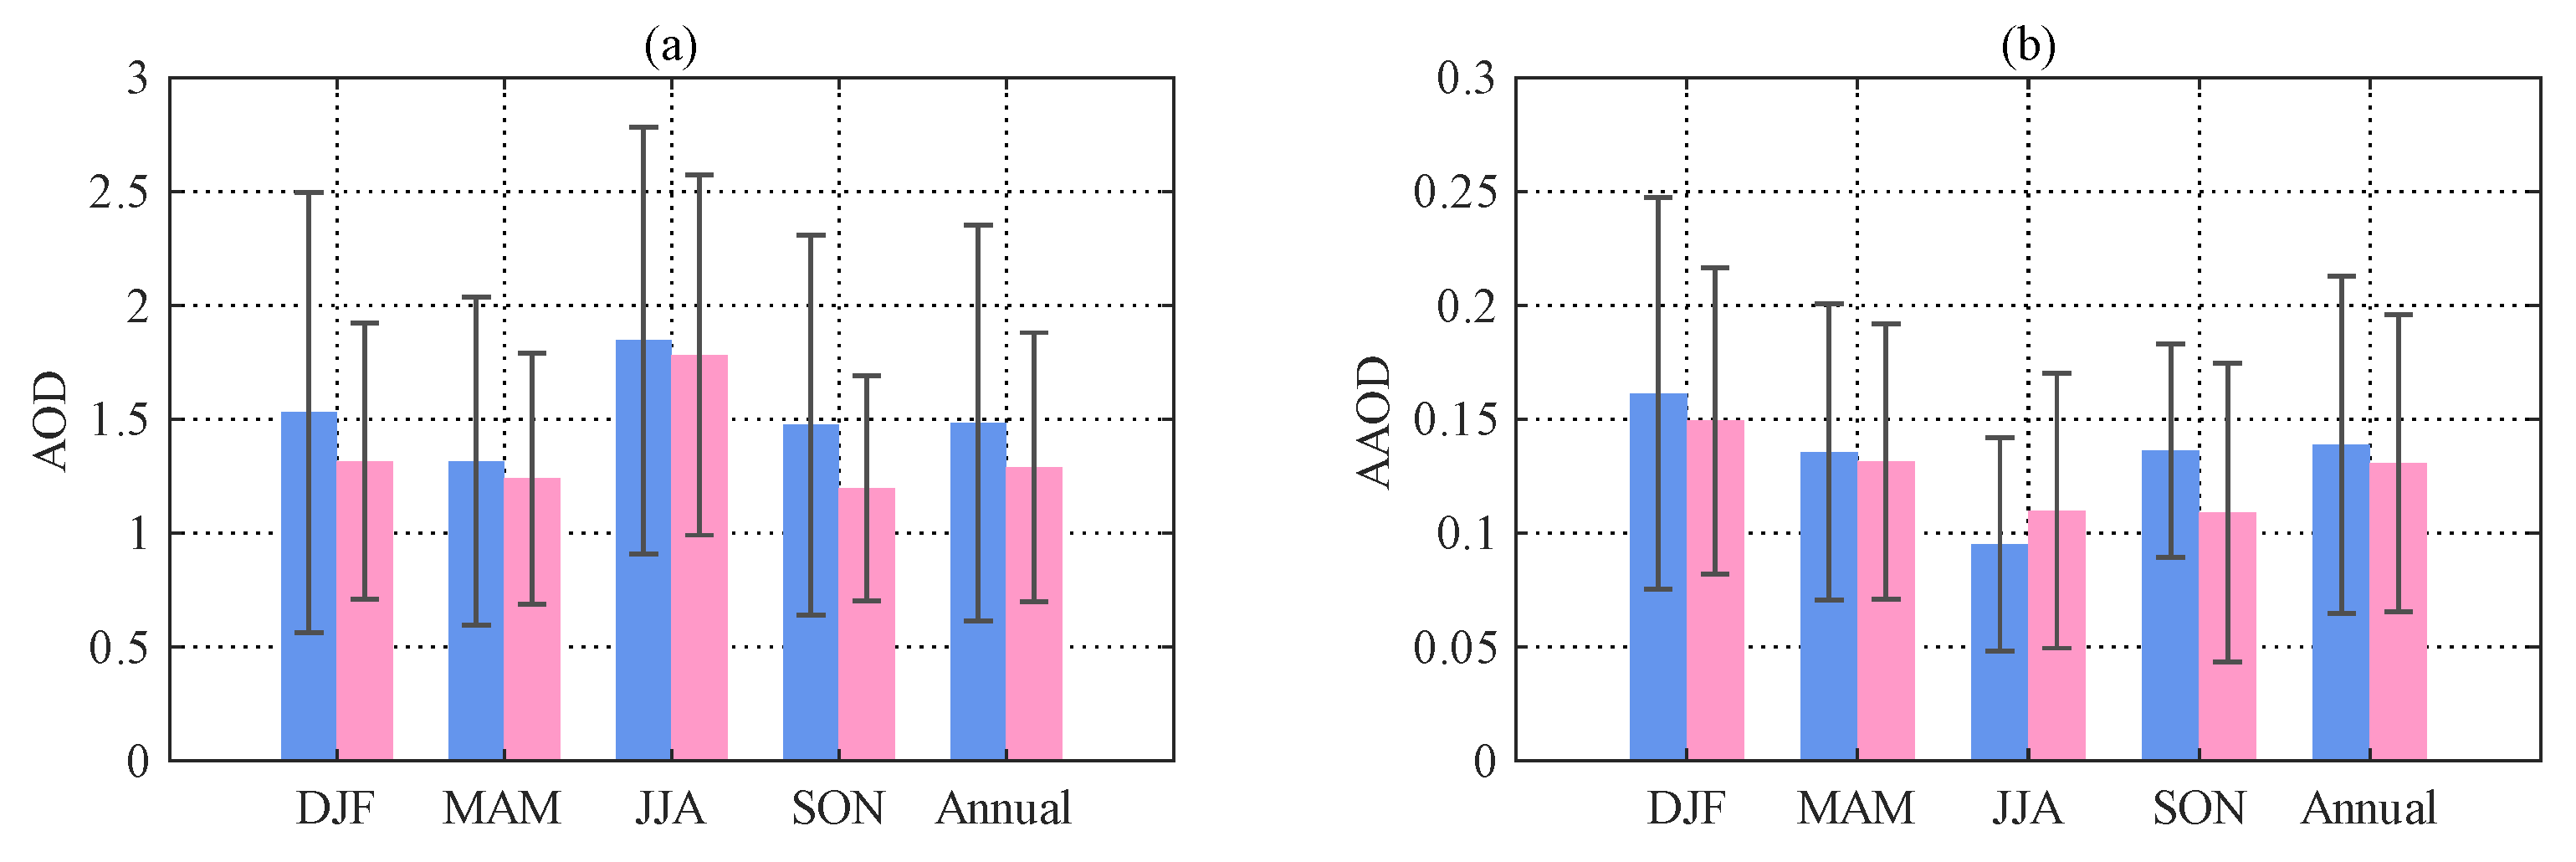
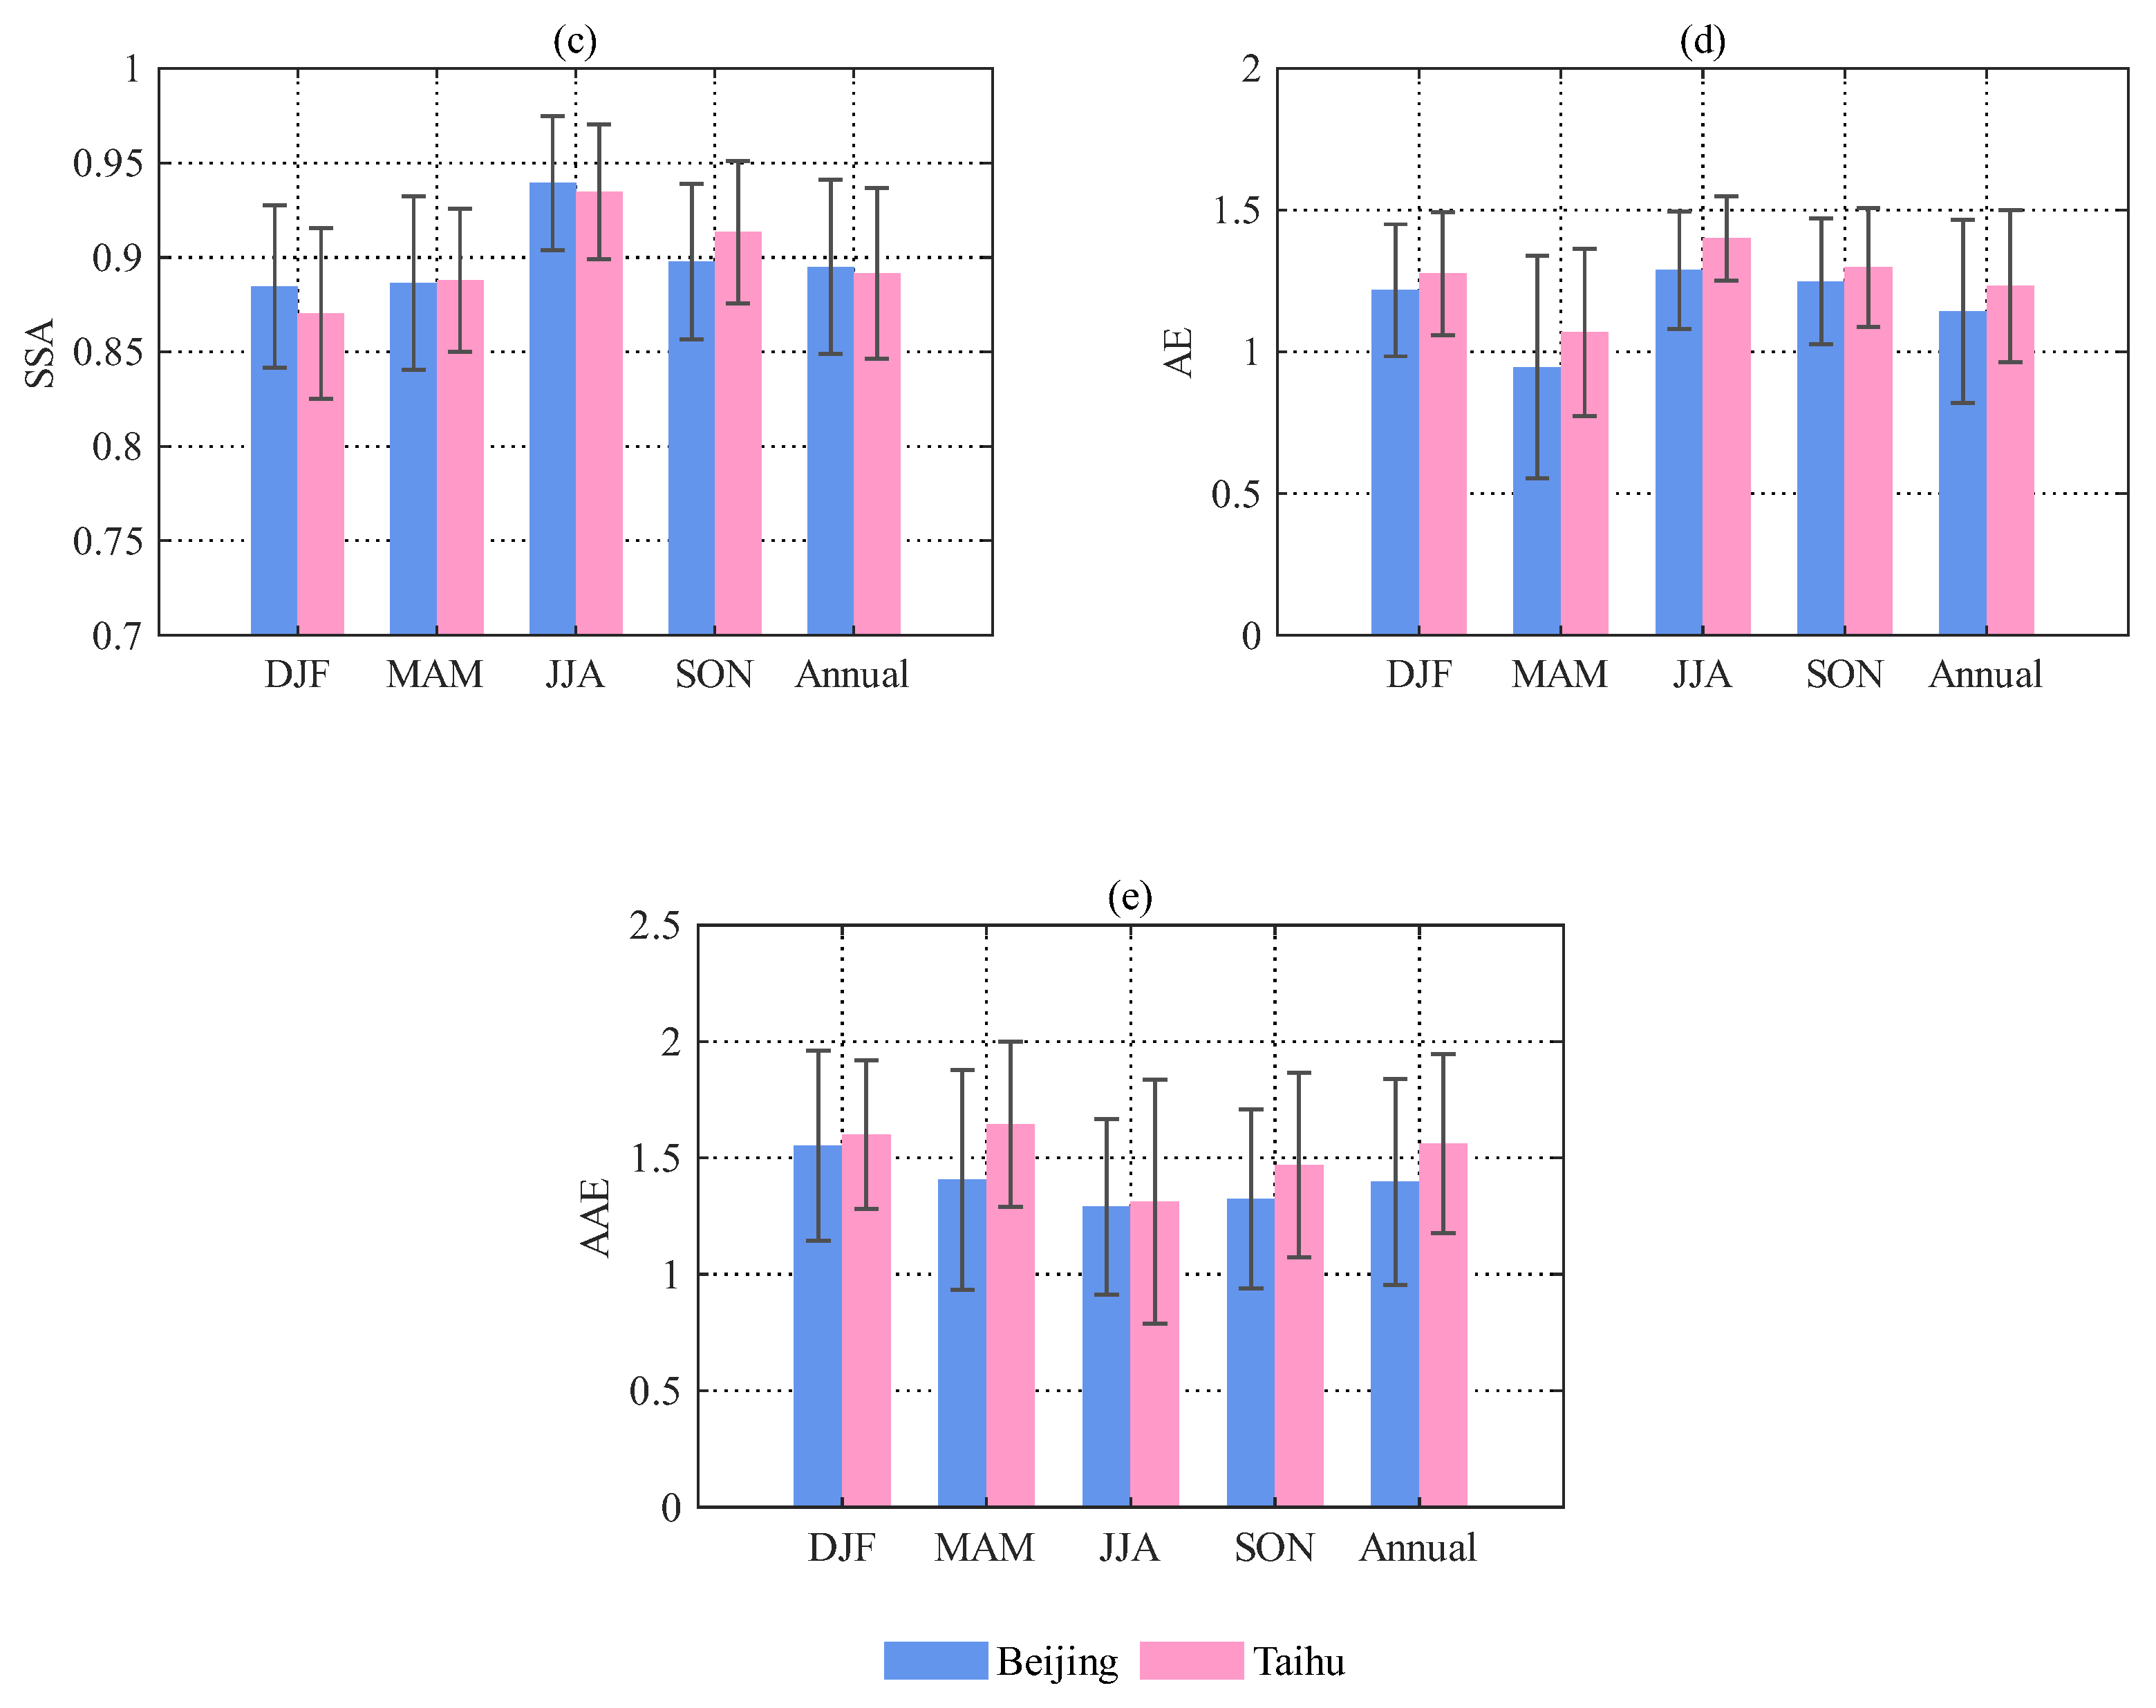
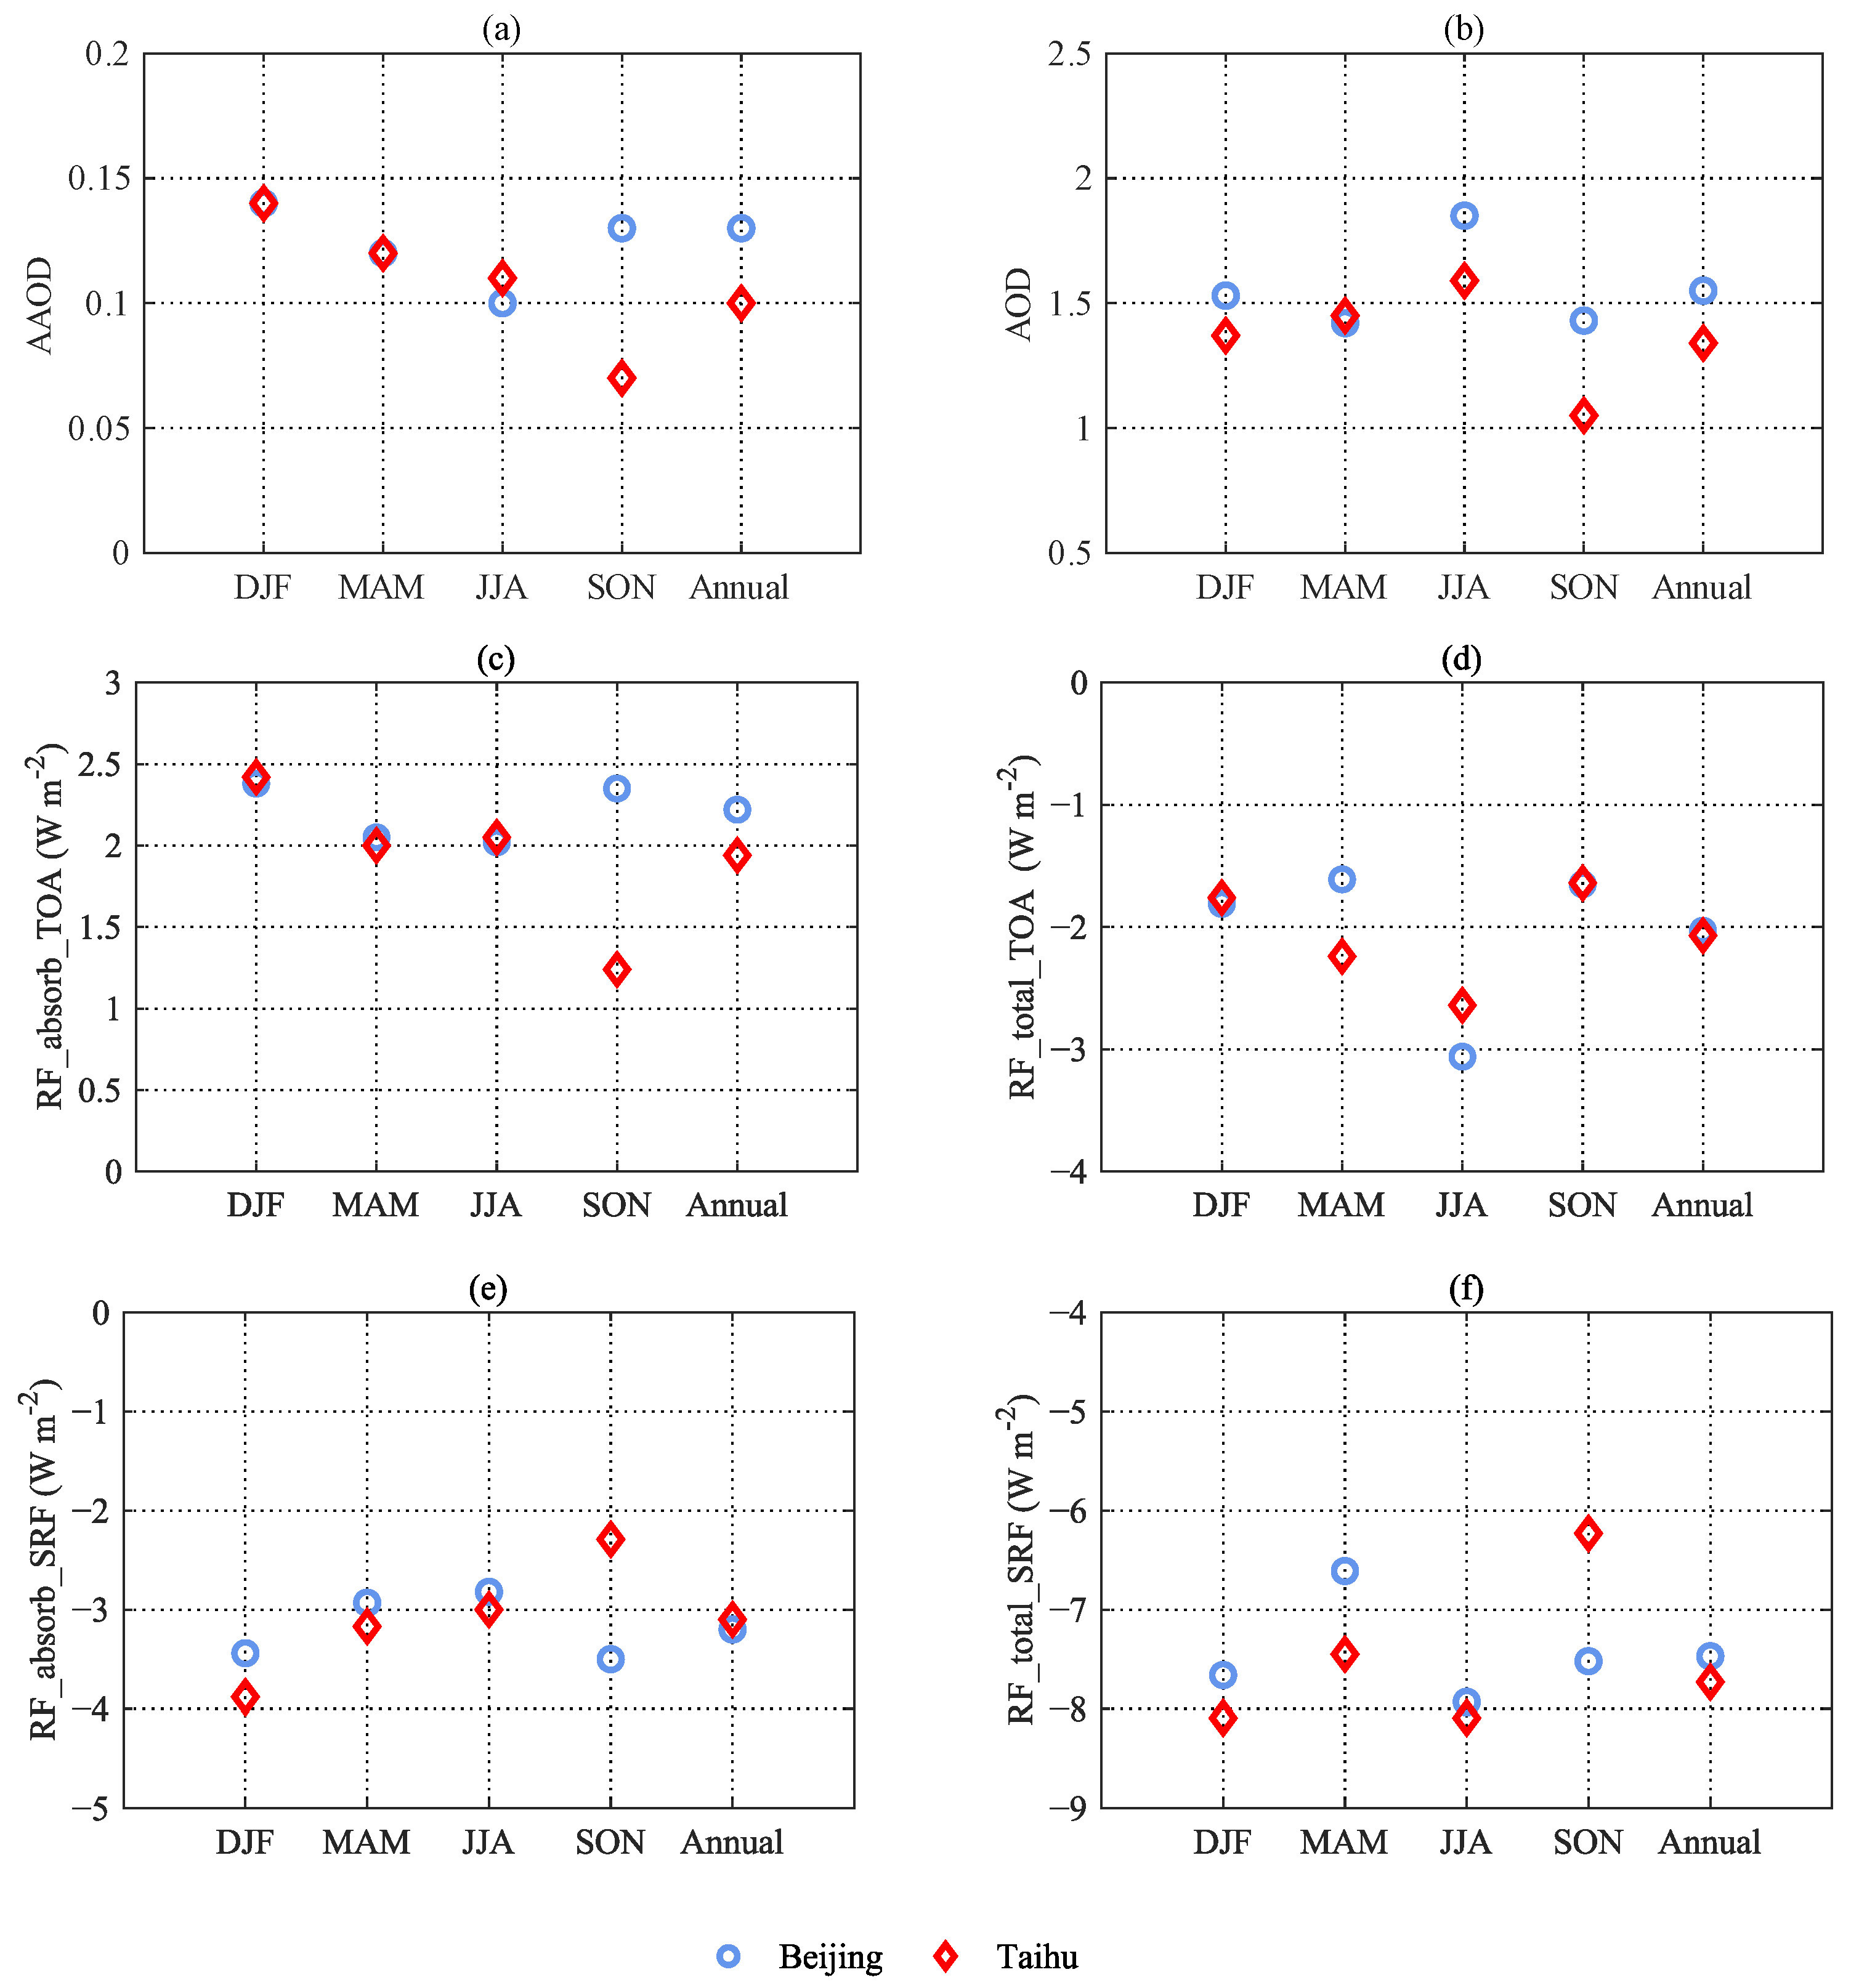
3.1.2. Seasonal Variations in the Aerosol Optical Properties in BTH and YRD

The Beijing site and Taihu site were located in the urban areas of the BTH and YRD regions, respectively, which are the most economically vibrant and densely populated areas of China and suffered from severe haze and ozone pollution in recent years. Continuous measurements of aerosols were performed for years at both sites. Therefore, they were selected as typical sites to further analyze the local aerosol optical characteristics in the BTH and YRD regions. Notably, only measurements conducted during 2005–2012 were applied for further analysis of the two sites, unless otherwise stated (Table 3), in order to improve the objectivity and accuracy. Daily average data were used for the data analysis.
Figure 2 represents the seasonal variations in the (a) AOD, (b) AAOD, (c) SSA, (d) AE, and (e) AAE at the two sites. Generally, higher AOD appeared in summer and winter, while lower AOD appeared in spring and autumn. Such seasonality is related to emission and weather patterns. More intensive emissions of trace gases and particles in winter contribute to the high concentration and optical depth of aerosols [139,140,141]. Additionally, the aerosols would accumulate under the important influences of subregional transport of pollutants from strong source regions and local synoptic weather such as an anticyclonic system before the passage of a cold front [142]. A high efficiency of aerosol hygroscopic growth and chemical transformation under the anticyclonic conditions in summer, e.g., high temperature and low wind speed, is also conducive to the concentration and optical depth of aerosols [129,130,143,144,145,146,147]. Additionally, the AOD would also increase when the subtropical anticyclone would move north and precipitation decreased from the end of summer to the beginning of autumn [83]. These impacts were prominent in the AOD seasonality of both sites. Overall, the AOD of the Beijing site was higher than that of the Taihu site, with averages of AOD being 1.48 ± 0.87 and 1.29 ± 0.59 for Beijing and Taihu, respectively.
The SSA was highest in summer at the Beijing and Taihu sites because of a high efficiency of moisture absorption growth and chemical transformation of scattering aerosols [29]. The average SSA of the Beijing and Taihu sites were 0.90 ± 0.05 and 0.89 ± 0.05, respectively, indicating that the ratios of scattering and absorbing aerosols were relatively close at both sites.
Substantial seasonal variations of AE can be found at both sites with peaks in summer possibly due to active gas–particle conversion reactions and secondary organic aerosols conversion reactions from the volatile organic compounds [138], as well as the hydroscopic growth of fine aerosol particles [129]. The low AE levels in spring were mainly due to the frequent dust events via long-distance transport from semiarid and arid regions in northwestern and northern China [45,86,145], one of the main sources of dust and dust-dominated aerosols [14,146,147], especially during spring, leading to a higher proportion of coarse aerosol particles. Previous studies indicated that northern and eastern China suffer from pollution caused by coarse particles, from air masses transported from northwest [148,149,150]. The average AE for the Beijing and Taihu sites was 1.14 ± 0.32 and 1.23 ± 0.27, respectively, suggesting aerosols were probably mixed with coarse-mode and fine-mode components [113,132]. The aerosol particles of Beijing site were coarser with more segments of different modes (including aerosols from fine to coarse modes) in terms of a lower AE with a larger standard deviation (1.14 ± 0.32).
Figure 2. Seasonal averages of (a) AOD, (b) AAOD, (c) SSA, (d) AE, and (e) AE at Beijing site and Taihu site based on AERONET measurements.
Remotesensing 15 02779 g002aRemotesensing 15 02779 g002b
The optical properties related to absorbing aerosols include AAOD and AAE. The remarkable influences of weather patterns on seasonal variations of AOD are also generally significant on those of AAOD, especially in winter. However, the AAOD is relatively low in summer at both sites, which indicated that the scattering aerosols account for a relatively high proportion in total aerosols than the absorbing aerosols [29]. The proportion of absorbing aerosols in total aerosols of the two sites is approximately equal (about 10%) although the AAOD of Beijing site was slightly higher than that of the Taihu site with averages of 0.14 ± 0.07 in Beijing and 0.13 ± 0.07 in Taihu, respectively. In addition, the average size of absorbing aerosol particles was smaller than that of total aerosol particles, and absorbing aerosols tended to have more measurable seasonal variations in the aerosol size, with maximum size appearing in summer due to the moisture absorption growth of absorbing aerosols of fine mode. The AAE of both sites is relatively low in summer. It is consistent with findings in our previous research [29], which suggests that the seasonality of the total aerosol AE is more consistent with that of the scattering aerosols, with the smallest AE appearing in the summer for the total absorbing aerosols but appearing in the spring for the total scattering aerosols. Additionally, higher AAE appears in Beijing site throughout the year, especially in spring. More coarse aerosol particles from the deserts stretching far and wide in northwest China and Central Asia would be transported to north China due to the Mongolian cyclones [151,152,153], and the dust-dominated aerosols in the northwest mainly take two paths to affect the northern and eastern China, one of which is from Inner Mongolia, passing through Hebei, Beijing, Shandong, and, finally, Jiangsu, and the other is from Shaanxi, Shanxi, Henan, Anhui, and, finally, Jiangsu [154,155]. Therefore, more exposure to sand and dust events in spring may lead to the larger size of absorbing aerosol particles at the Beijing site.
The seasonal means with the corresponding standard deviations for the aerosol optical properties at Beijing site and the Taihu site are summarized in Table S1, which reflects spatial inhomogeneity in the optical properties in BTH and YRD to a quantitative extent. Comparisons with previous research indicate that the magnitude are commensurate and seasonal variations are identical in the optical properties, although some differences of aerosols characteristics may exist due to different underlying surfaces and measurement periods. At the Beijing site, it is indicated that the AOD at 550 nm was about 0.68 during 2005 [156], and the maximum AOD at 675 nm appeared in spring and summer (both 0.52), while the minimum was in winter (0.35), the maximum AE appeared in summer (1.19), and the minimum was in spring (1.03) during August 2006 and July 2009 [157]. It was also indicated that the highest AOD was found in summer because of the stagnation planetary boundary layer and transport of pollutants from large pollution centers south of Beijing, since the high temperature and relative humidity in summer also favor the production of aerosol precursor and the hygroscopic growth of the existing particles locally, while the lowest AOD occurred in winter as the frequent cold air masses help pollutants diffuse easily [156,158]. The magnitude of AE was found to be relatively high throughout the year and the highest values (1.27) occurred in summer and the lowest (1.0) in spring, and the SSA was highest in summer (0.91) and lowest in winter (0.86) during 2002 to 2017 at Beijing site [159]. At the Taihu site, it was found that the maximum AOD at 440 nm appeared in summer (1.02), while the minimum was in winter (0.68), the maximum AE appeared in summer (1.35), and the maximum was in spring (0.90) during September 2005 and August 2006 [94]. It was also suggested that the lower AOD appeared in the winter and spring, and higher AOD appeared in the summer and autumn at the Taihu site [83,132]. Additionally, the aerosols absorb the most in the winter with a lower SSA [91,160]. High AE 440 870 occurred in autumn (1.33) and summer (1.26) and were the low in spring (1.08) during 2005 to 2009 at Taihu site [160]. The AOD at 440 nm showed a distinct seasonal variation with the highest value in summer and the lowest value in winter, and the AE were low in spring, which was attributed to the abundance of coarse particles over the Taihu rim region during 2005 to 2012 [161]. Optical properties were slightly spatially inhomogeneous within the BTH and YRD regions. The AOD levels at an urban site located in south Beijing were about 0.38, 0.41, 0.53, and 0.78 at 1020, 870, 670, and 440 nm, respectively, with the AE of 0.82, and the AOD levels at an urban site located in north Beijing were about 0.33, 0.37, 0.47, and 0.72 at 1020, 870, 670, and 440 nm, respectively, with the AE of 0.96 during 2004 to 2007 [156]. Additionally, the AOD, SSA at 440 nm band, and AE 440 870 at an urban site in Beijing from August to September 2015 when the World Athletics Championships and Victory Day military parade took place was 0.34, 0.94, and 1.38, respectively [90]. In North China Plain, it was suggested that the AOD at 500 nm was lower than 0.30 and increased to over 1.4, and the SSA was over 0.97 at the sites during 15 to 22 December 2016 when haze pollution developed, and the AE was over 0.80 for most of the study period [162]. In the YRD region, it was found in [87] that the annual mean AOD at 440 nm was 0.71–0.76 at the urban sites and 0.68 at the rural sites from 2011 to 2015, and the monthly average AOD at 440 nm showed peaks in June and September that resulted from increases in fine-mode aerosol particles. However, the AOD at 440 nm in July and August were the lowest over the year, and this was related to conditions favorable for aerosol dispersion. Additionally, the mean AE 440 870 was over 1.20 all year, indicating that small particles were predominant, and the SSA varied from 0.91 to 0.94, indicating that the aerosol particles were moderately absorbing, which was a result from the high industrial emissions and other anthropogenic activities [87]. The AAOD at 440 nm at the sites in YRD varied from 0.04 to 0.06, and AAE 440 870 varied from 0.88 to 1.16, which indicated that the absorbing aerosols were a combination of different categories including mixing, coating, and coagulation of black carbon with organic and inorganic materials; black carbon aerosols from the fossil fuel burning; and absorbing aerosols mainly from biomass burning or mineral dust.

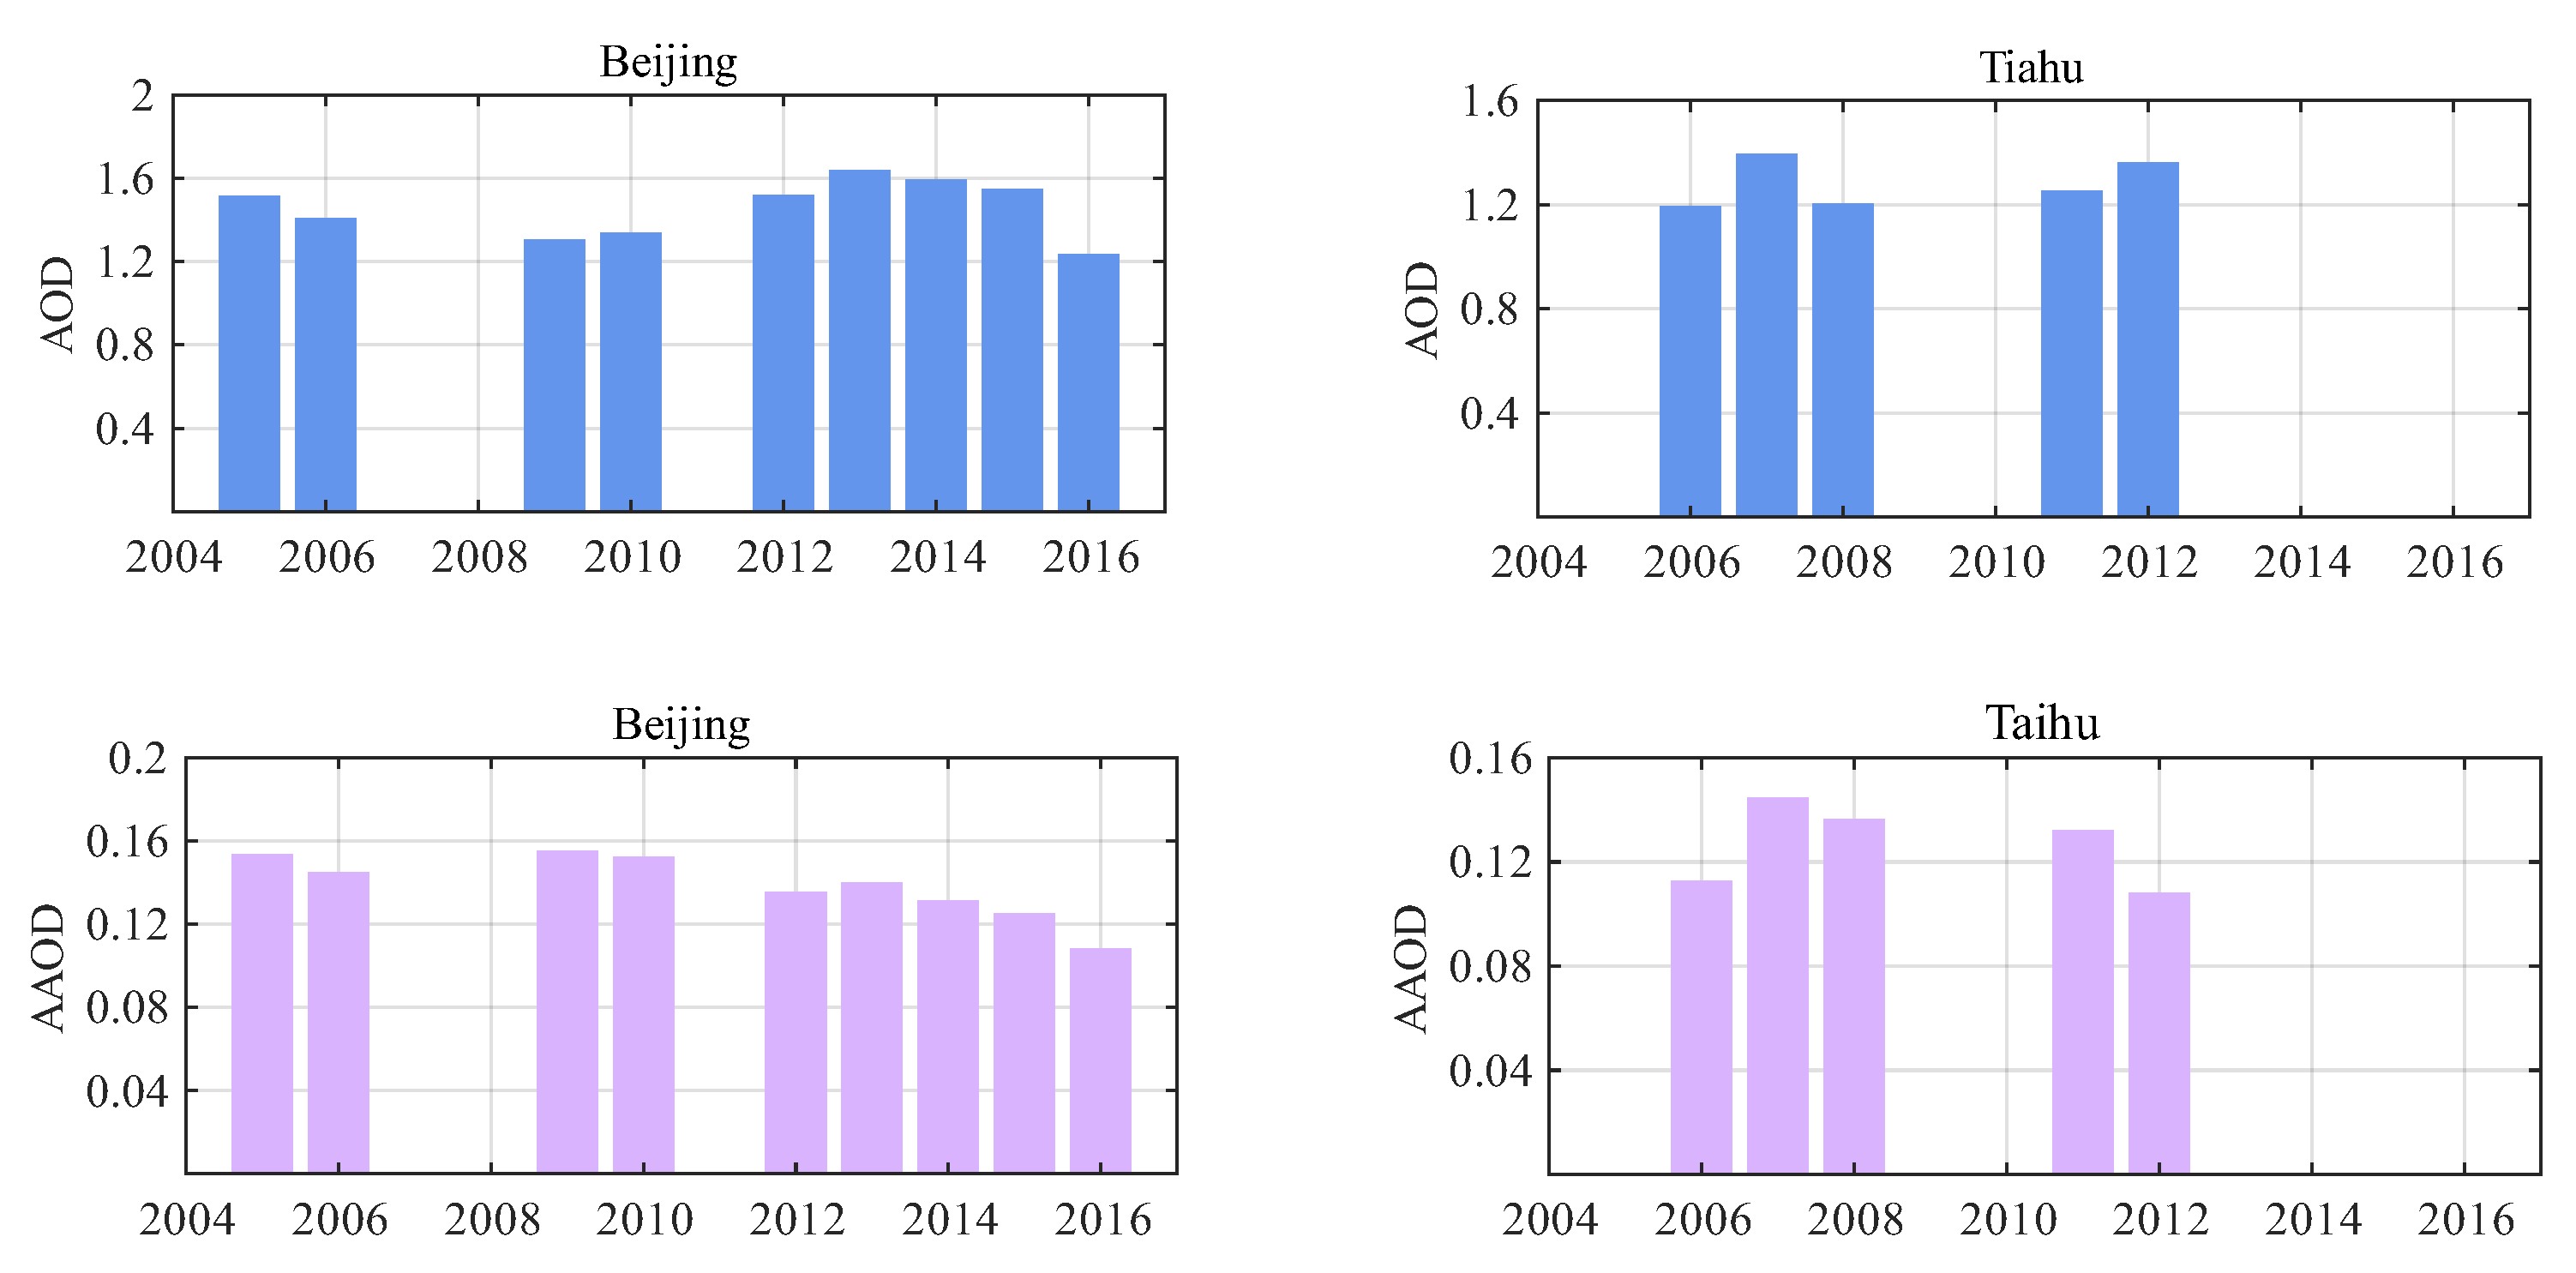
3.1.3. Interannual Variations in AOD and AAOD in BTH and YRD

The variations in annual AOD and AAOD of the Beijing and Taihu sites which were in operation for the entire study period, that is from 2005 to 2016 and from 2006 to 2012, respectively, are shown in Figure 3. For the Beijing site, it was suggested that overall decreases in AOD occurred from 2006 to 2010, although the decrease was not continuous. Additionally, the AOD apparently increased from 2012 to 2013, which was also illustrated in [86]. For the Taihu site, the AOD also increased since 2010. It is also noteworthy that the AOD of Beijing site decreased since 2013 when the clean air actions started in China. Both sites showed an overall increase in AAOD before 2010, and a decrease afterwards.
The anomalies of AOD and AAOD were further calculated. For the Beijing site, the AOD in 2005, 2012, 2013, 2014, and 2015 were higher than the muti-year average, and the AOD increased 0.33 from 2009 to 2013, while it decreased by 0.4 from 2013 to 2016. Additionally, the AAOD in 2005, 2006, 2009, and 2010 were higher than the muti-year average, and the AOD increased 0.33 from 2009 to 2013, and the AAOD increased 0.02 from 2005 to 2009, while it decreased by 0.05 afterwards. For the Taihu site, the AOD in 2007 and 2012 were higher than the muti-year average, and the AOD increased by 0.18 from 2006 to 2012. Moreover, the AAOD levels in 2007, 2008, and 2011 were higher than the muti-year average, and the AAOD increased by 0.03 from 2006 to 2011. The above interannual variations suggest that aerosol loadings in China may have increased from 2006 to 2013. One possible reason for this is that there was an increase in emissions. Furthermore, according to previous research, another possible reason for the interannual variations in AOD and AAOD is the changes in the East Asian monsoon [162,163,164,165,166]. For instance, although the emission rates continued to increase, the AAOD in 2012 of both sites had negative anomalies, which was regarded as a “strong” year in terms of the Asian monsoon, and this may reflect the influence of the intensified monsoon despite the increased emissions. However, since the preceding discussion is speculative, it is still necessary for more studies and research to address these issues.

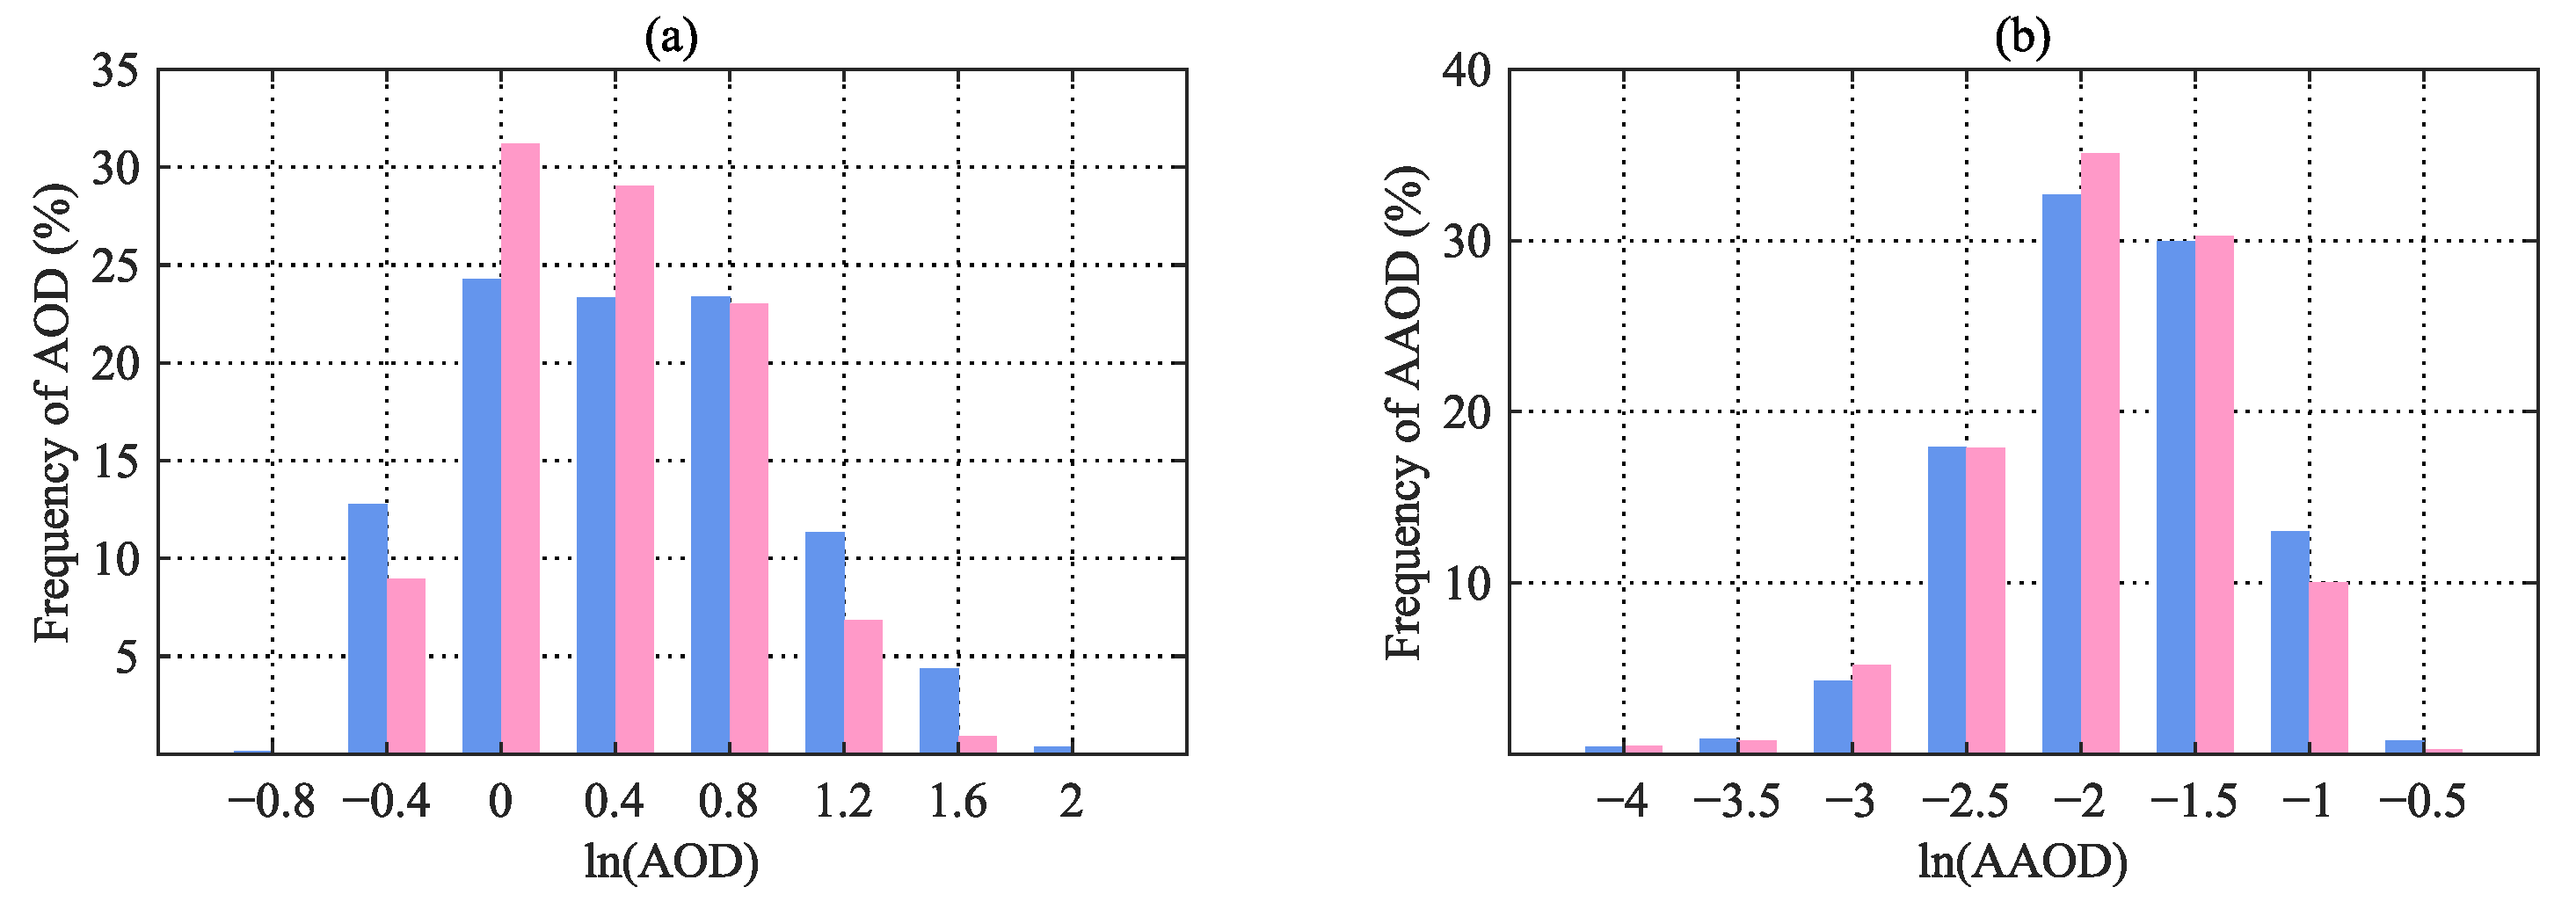
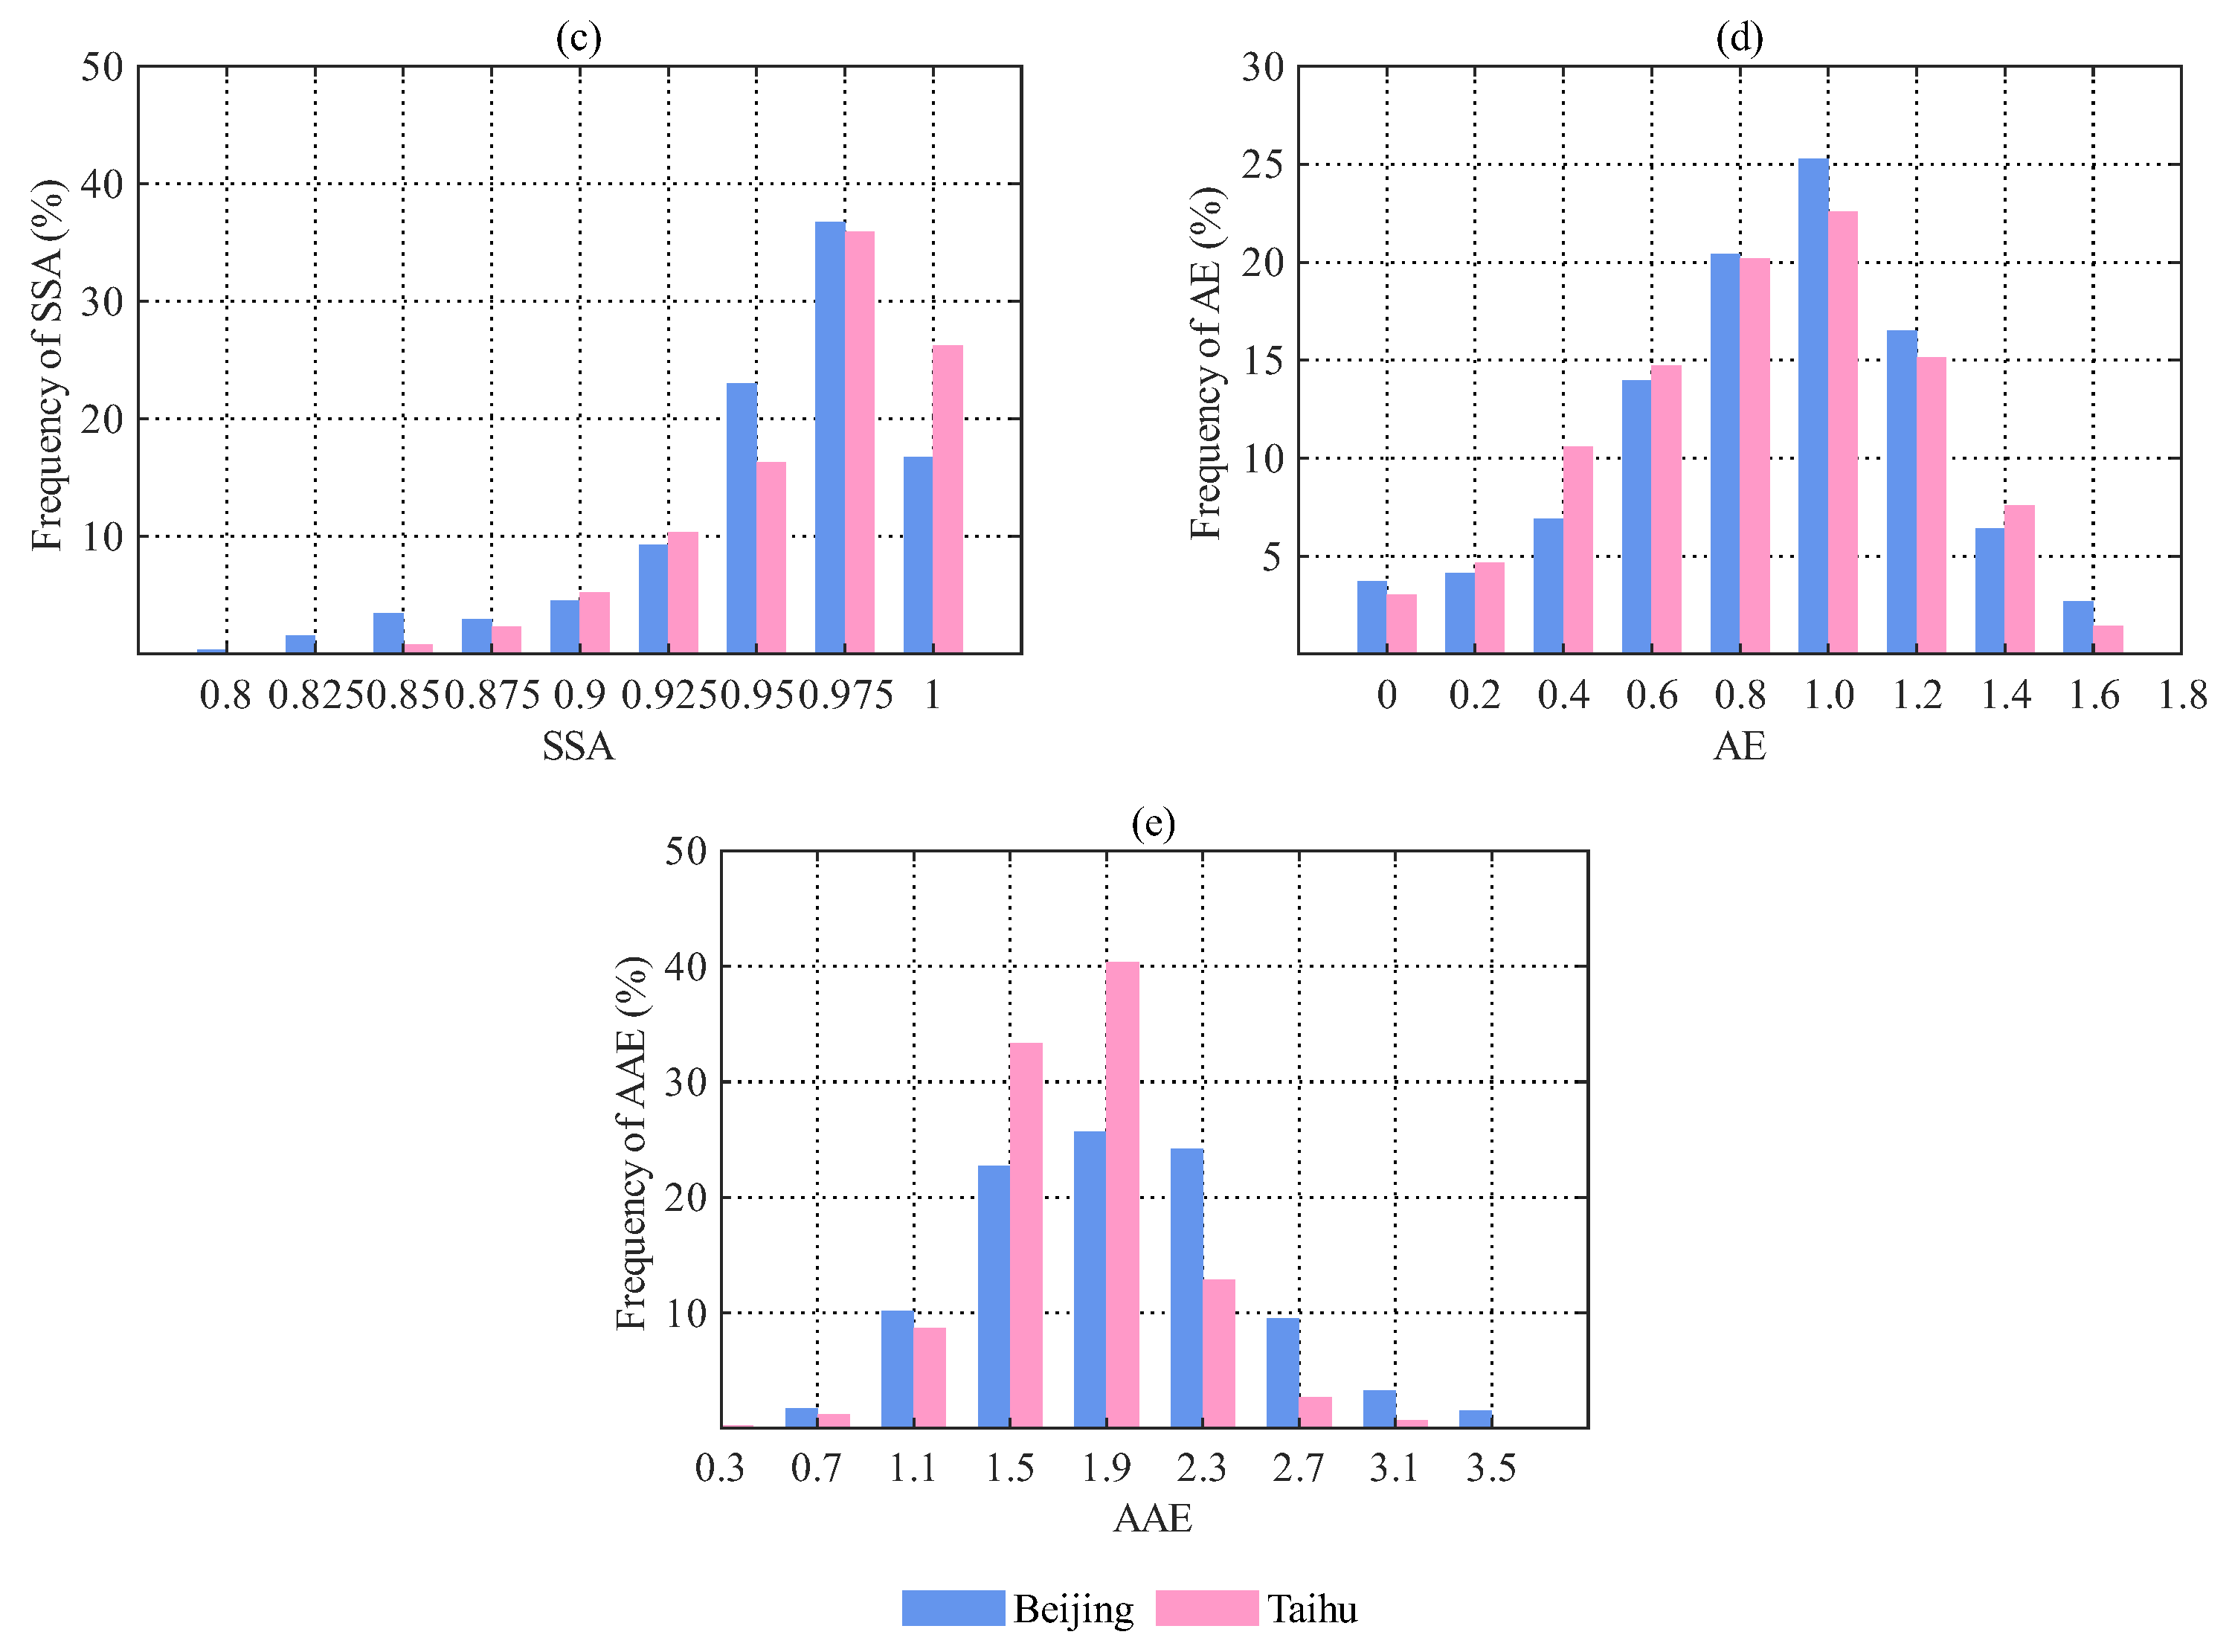
3.1.4. Frequency Distribution of the Aerosol Optical Properties BTH and YRD

Figure 4 presents the frequency distributions of aerosol optical properties. It was suggested that SSA, AE, and AAE follow a unimodal pattern at both sites, the bin intervals for which were set to 0.025, 0.2, and 0.4. The AOD and AAOD also follow a unimodal pattern at both sites after being natural logarithmically processed with bin intervals of 0.4 and 0.5 and, thus, they follow a near log-normal pattern [29,83]. The ranges around all aerosol optical properties’ averages were dominant, accounting for at least 60% of the total data samples during the entire study period. AOD primarily ranged from 1.0 to 2.2, and over 50% AOD was greater than 1.5 at both sites. AAOD mostly ranged from 0.08 to 0.22, and over 80% AAOD was greater than 0.14 at both sites. Both AOD and AAOD of the Beijing site were relatively larger, especially due to a more frequent distribution over 2.2 and 0.22, respectively. Additionally, the range of SSA varied from 0.68 to 0.99 at both sites, about 25% of which were less than 0.88, and about 25% of which were greater than 0.95, indicating that there are quite different types of aerosols (from strong absorbing aerosols to near pure scattering aerosols). About 80% AE ranged from 1.2 to 1.6 at both sites, most of which were greater than 1.0. Similarly, AE at Beijing site was relatively lower because of less frequent distribution between 1.6 and 1.8. A broader range of AAE than that of AE was observed at both sites, since the occurrences of smaller absorbing aerosol particles were relatively high, especially those with an AAE level higher than 1.8.

3.1.5. Brief Discussion

The results herein allow us to better understand the characteristics of the aerosols in the East Asia, especially in the BTH and YRD sites, and they might be also useful for improving aerosol model performances and their radiative effects as referred to in the Introduction.
Most studies of the aerosol optical properties mainly focused on the total aerosols, including AOD and AE, on short-term, annual, and decadal scales in China [29,86,90,160,162]. The results in this study show that the means of AOD and AAOD of 330 nm band of sites in China were greater than those in South Korea and Japan. It was further suggested that aerosols in urban areas likely had larger AODs and AEs than those in rural areas [160]. It was the same in the BTH region and Taiwan. The AOD and AAOD were higher in the BTH region than those in the YRD region. The AE in the urban YRD region was larger than that in northern China [29]. Our analysis showed similar results. It also showed that the aerosol SSAs at 440 nm in urban areas in the BTH and YRD regions were approximately over 0.90, which is consistent with this analysis [29,90]. This study further augments the current observations of the aerosol optical properties in East Asia compared with previous studies, especially in the BTH and YRD regions.

3.2. UV Direct Radiative Forcing of Absorbing Aerosols

The UV DRF of absorbing aerosols are shown in Figure 5, where the UV-A band covered 320–400 nm and the UV-B band covered 290–320 nm. It was indicated that the UV DRF of absorbing aerosols at the surface was approximately 2–3 times stronger than that at TOA (Figure 5a–d), which was also found in [30,31]. Furthermore, the DRF of absorbing aerosols in the UV-A band was far greater than that in the UV-B band (Figure 5a–d). Therefore, the spatial variation of the DRF in the UVA band will be emphatically analyzed. Hereinafter, the DRF, unless otherwise specified, represents that of absorbing aerosols in the UVA band.
Figure 4. Frequency distributions of (a) AOD, (b) AAOD, (c) SSA, (d) AE, and (e) AAE at Beijing site and Taihu site based on AERONET measurements. AOD and AAOD are natural logarithmically processed.
Remotesensing 15 02779 g004aRemotesensing 15 02779 g004b

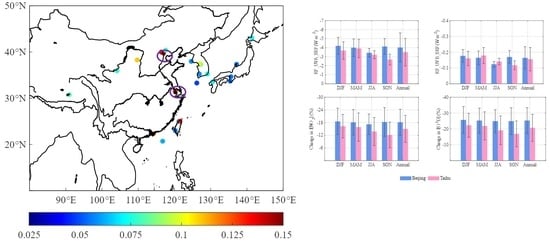
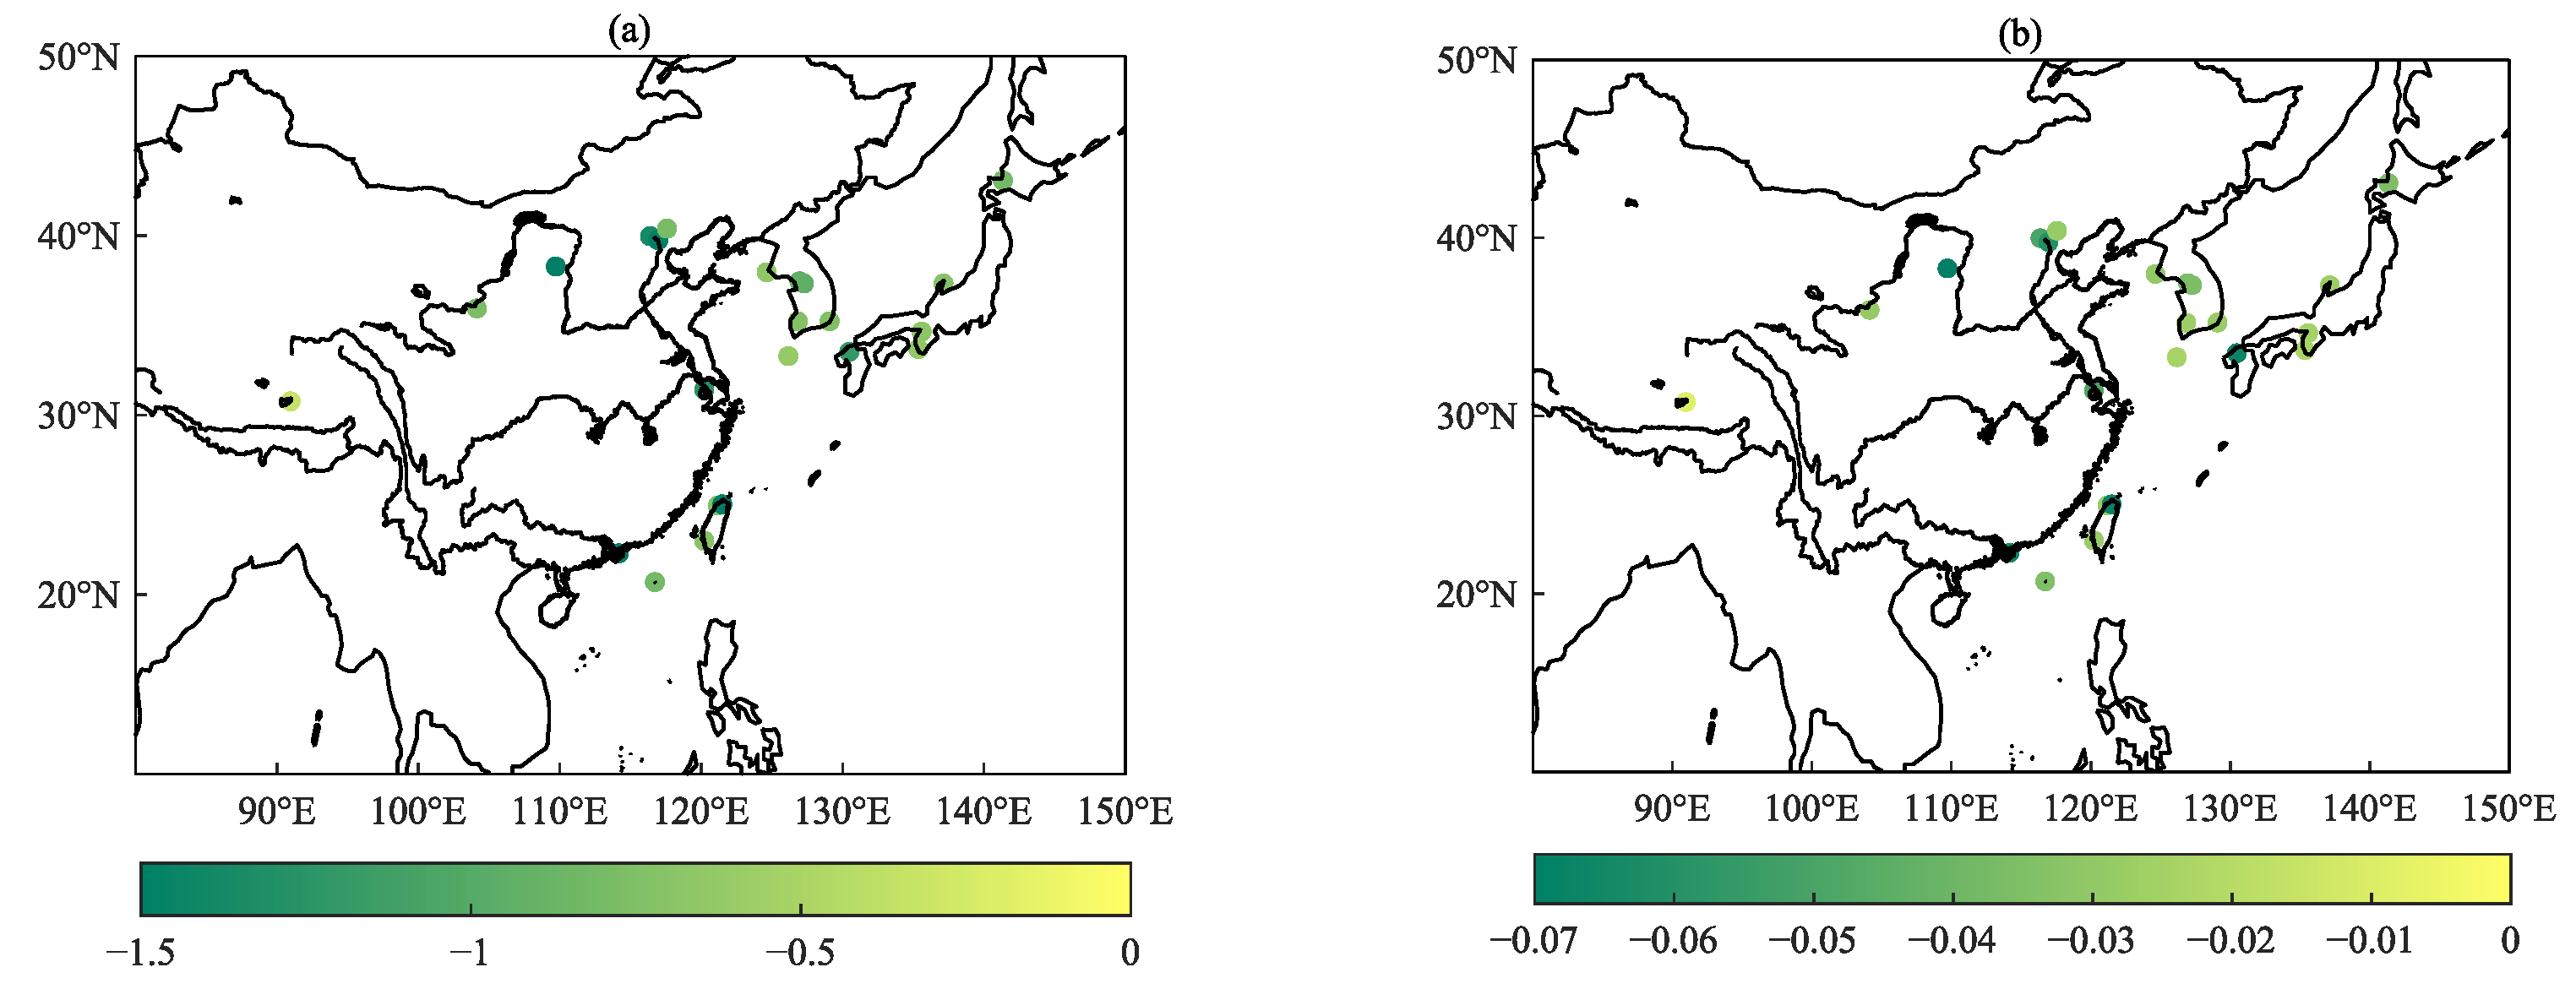
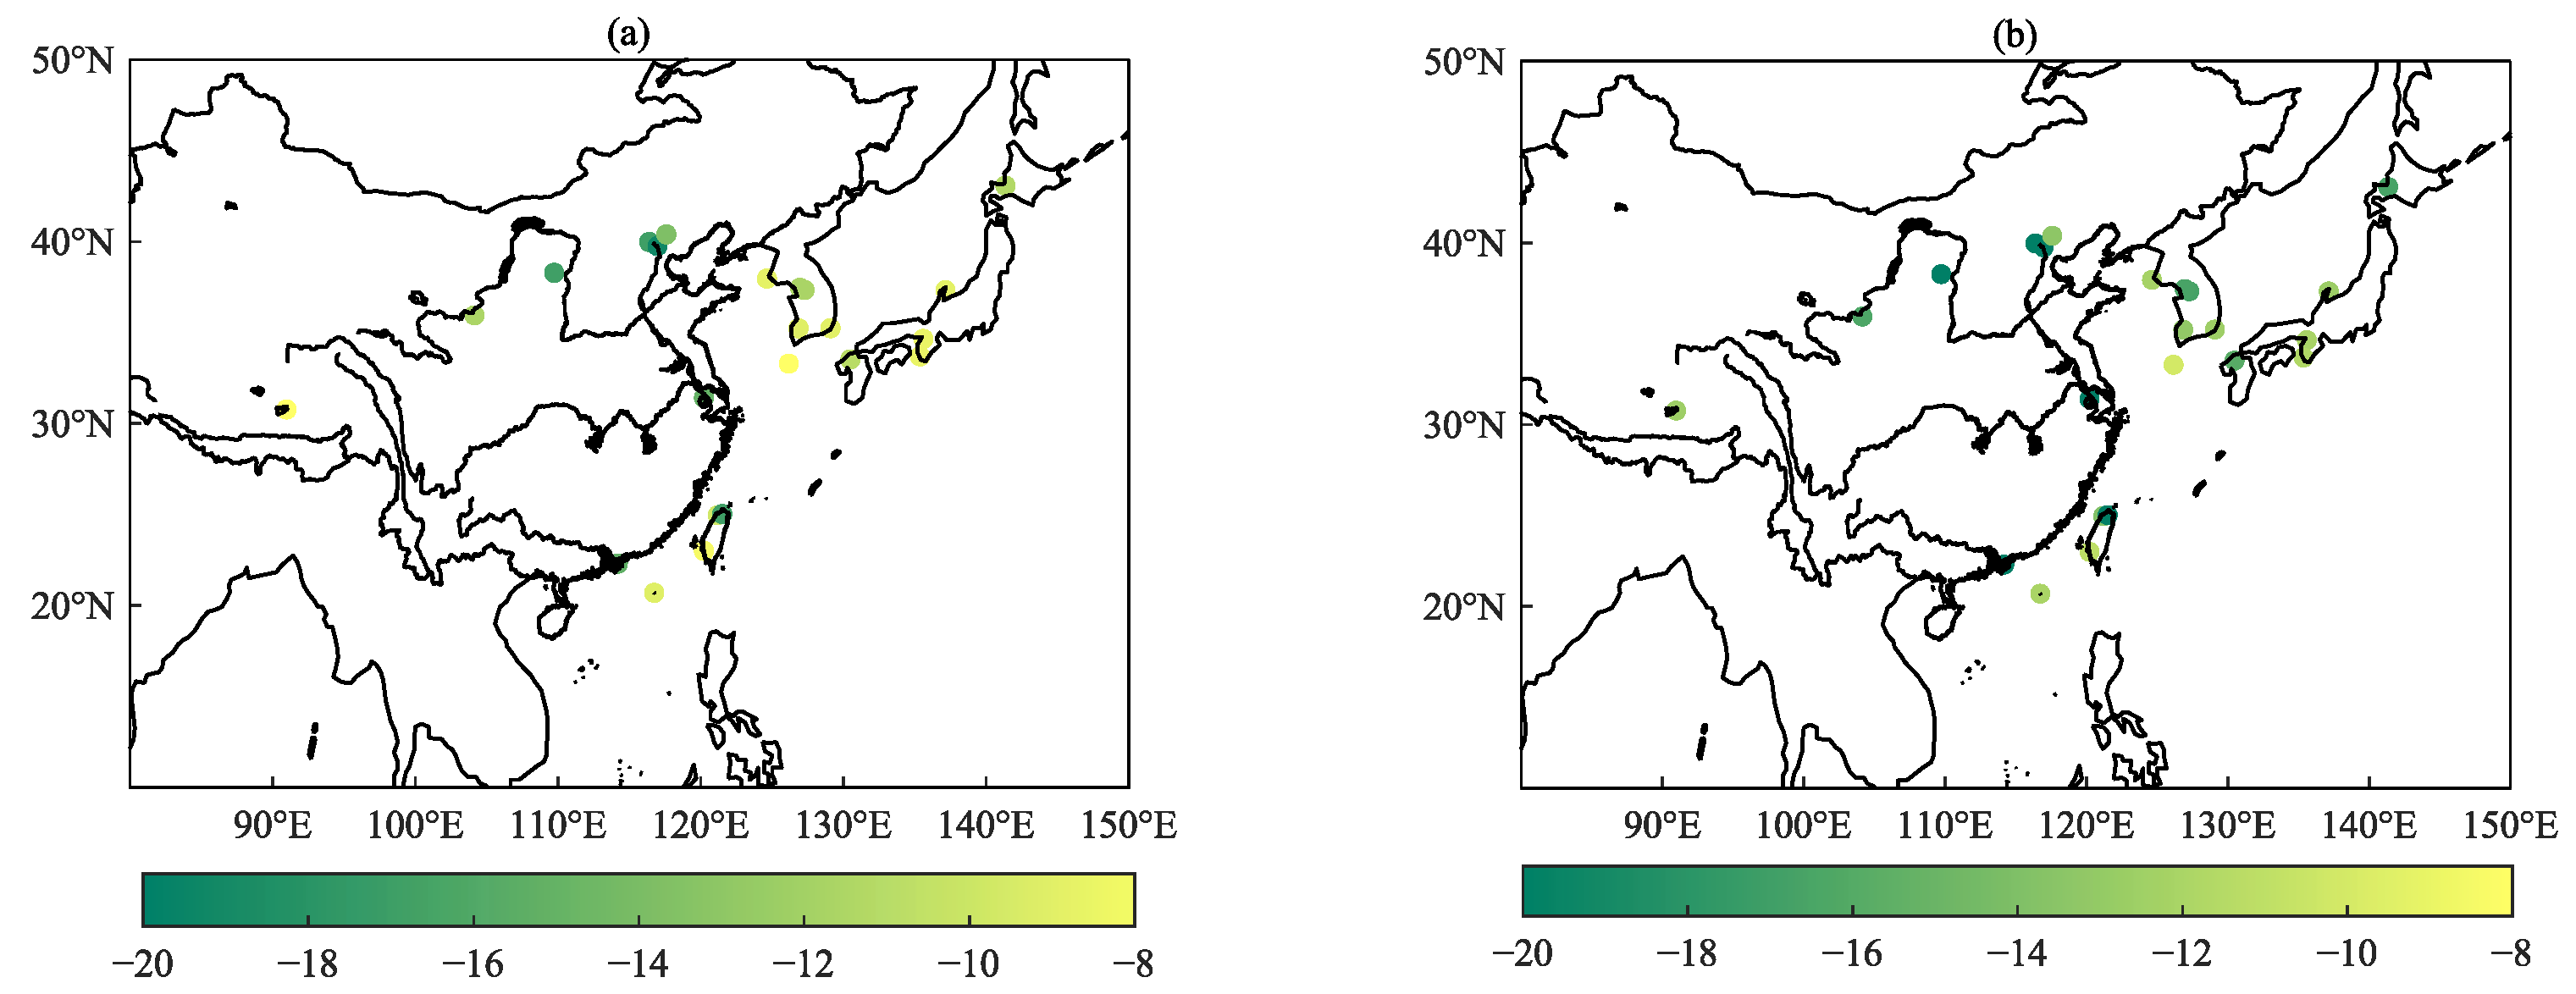
3.2.1. Spatial Variations in the DRF

Among the 23 sites in East Asia, the DRF at the TOA was strongest in the Xianghe site located in northern China, with an annual average DRF of 3.27 W m−2, while it was weakest in the NAM_CO site located in the Tibetan Plateau of China with an annual average DRF of 0.62 W m−2. Additionally, the DRF at the surface was strongest in Xianghe site with an annual average DRF of −4.65 W m−2, while it was weakest in the NAM_CO site with an annual average DRF of −0.87 W m−2.The sites with DRF at the TOA higher than 1.23 W m−2 included three sites in Japan, four sites in Korea, and all sites in China except the Dongsha_Island site and the NAM_CO site, which was the 75th percentile value of the DRF ranking from high to low. Moreover, 30% of sites with DRF over 2.00 W m−2 were all located in China with relatively high AAOD (over 0.078), mainly in northwest China (Yulin), the BTH region (Beijing and Xianghe sites), the YRD region (Taihu site), the PRD region (Hong_Kong_PolyU site), and Taiwan (Taipei site), except for the Fukuoka site located in Japan. The sites with DRF at the SRF stronger than −1.96 W m−2 included three sites in Japan, four sites in Korea, and all sites in China except the Chen-Kung Uni and NAM_CO sites, which was the 75th percentile value of the DRF ranking from strong to weak. The regional mean DRF at the TOA of sites in China, South Korea, and Japan was 2.05, 1.45, and 1.35 W m−2, respectively, and the DRF at the surface of sites in China, South Korea, and Japan was −3.09, −2.53, and −2.31 W m−2, respectively. Thus, it was indicated that a higher AAOD generally leads to a stronger DRF, and the direct radiative effect of absorbing aerosols in China was stronger than that in South Korea and Japan. Although the spatial distribution of DRF was generally consistent with that of AAOD regarding areas with high values, there are also differences to some extent, since the radiative forcing of aerosols also largely depends on other optical properties (AAOD, SSA, and AAE), solar zenith angle at measurement time, altitude, and underlying surface properties (surface albedo) [59]. For example, although the latitude of Yulin site was not much different from that of the sites in the BTH region, and the AAOD of Yulin site was also lower than that of the sites in the BTH region, the DRF of the Yulin site was stronger than that in BTH region probably because over 75% of the data at Yulin site were observed near noon (10:00–15:00), when the solar zenith angle is generally small.
Figure 5. Spatial distributions of DRF (W m−2) induced by absorbing aerosols (a) in the UVA band at the TOA, (b) in the UVB band at the TOA, (c) in the UVA band at the surface, and (d) in the UVB band at the surface based on AERONET measurements.
Remotesensing 15 02779 g005
Numerous studies of aerosol DRFs were carried out based on observations or numerical models. Refs. [44,167] estimated that simulated clear-sky DRFs were −4.97 W m−2 for total aerosols and +1.2 W m−2 for BC over East Asia, based on numerical simulations. The observation-based analysis indicated that the total aerosol DRFs always exceeded 101 W m−2 [92,127,168,169,170]. For example, the total aerosol DRF at the TOA could be as strong as −25 W m−2 over the QTP [93] and −30 W m−2 in the North China Plain [137,162]. Ref. [171] found the total aerosol DRF at the surface ranging from −7.9 to −35.8 Wm−2 in northwestern China. Ref. [93] evaluated that if BC mass fraction became greater than 0.05, and that an increase in BC mass fraction by 0.1 could increase RFE at TOA by 15.8 Wm−2 and decrease RFE at surface by 30.4 Wm−2, respectively. Ref. [29] evaluated that the absorbing aerosols in the urban area of the western YRD site could also exert very strong DRFs, reaching as high as 5.76 W m−2 at the TOA and −8.38 W m−2 at the surface. According to [72], who estimated the radiative forcing in the UV band of BC using TUV model and observation data in the northern suburbs of Nanjing, the daily maximum radiative forcing appeared at noon, and when the daily average AOD at 550 nm of BC reached 0.044, it would cause radiative forcing up to 1.5 W m−2 at TOA. This research further investigated the DRFs of absorbing aerosols at various sites in East Asia, which allows a better understanding of the spatial distribution of the effects of aerosols on solar shortwave radiation. These issues were rarely addressed in previous studies. These results are additionally contributable to numerical simulations validation and model performances evaluation concerning absorbing aerosol radiative effects in East Asia.

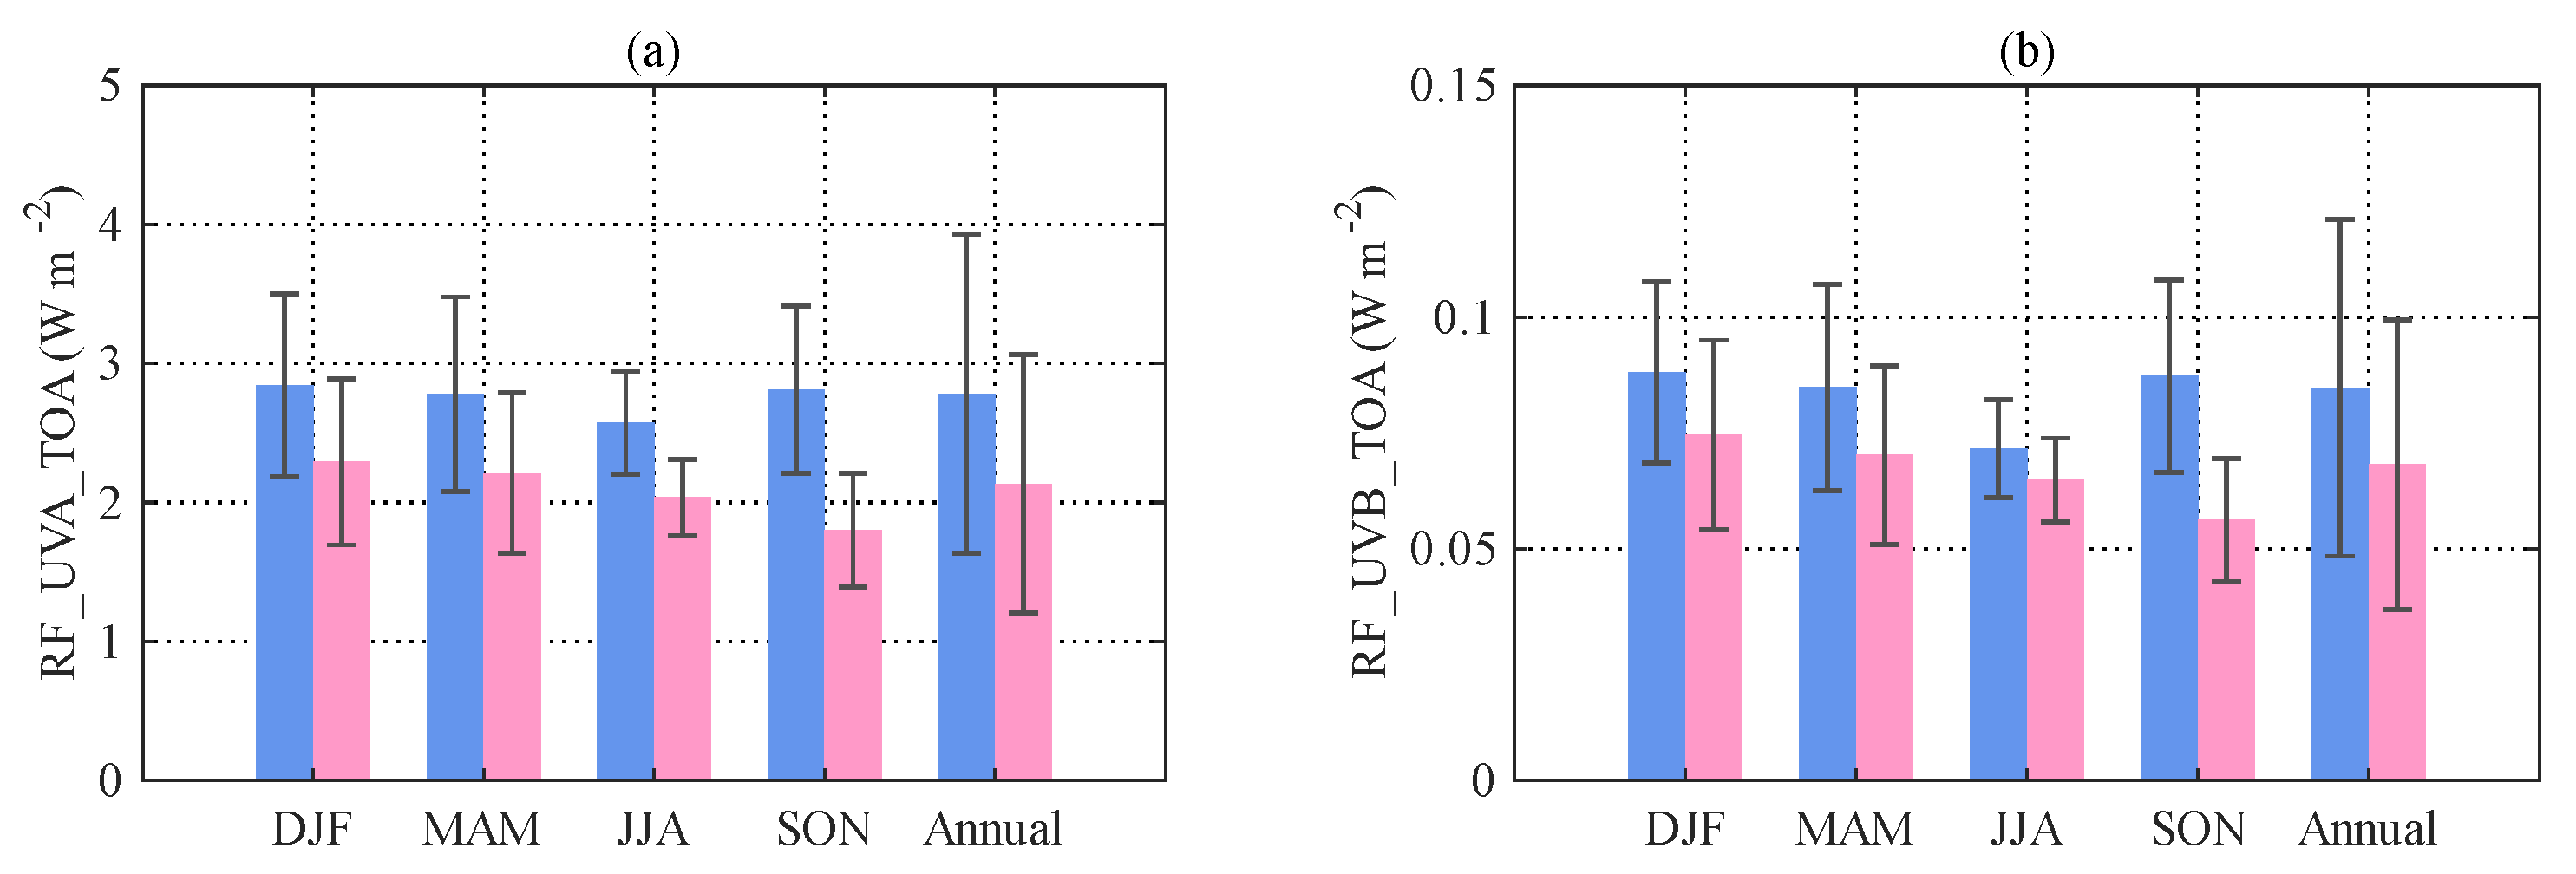
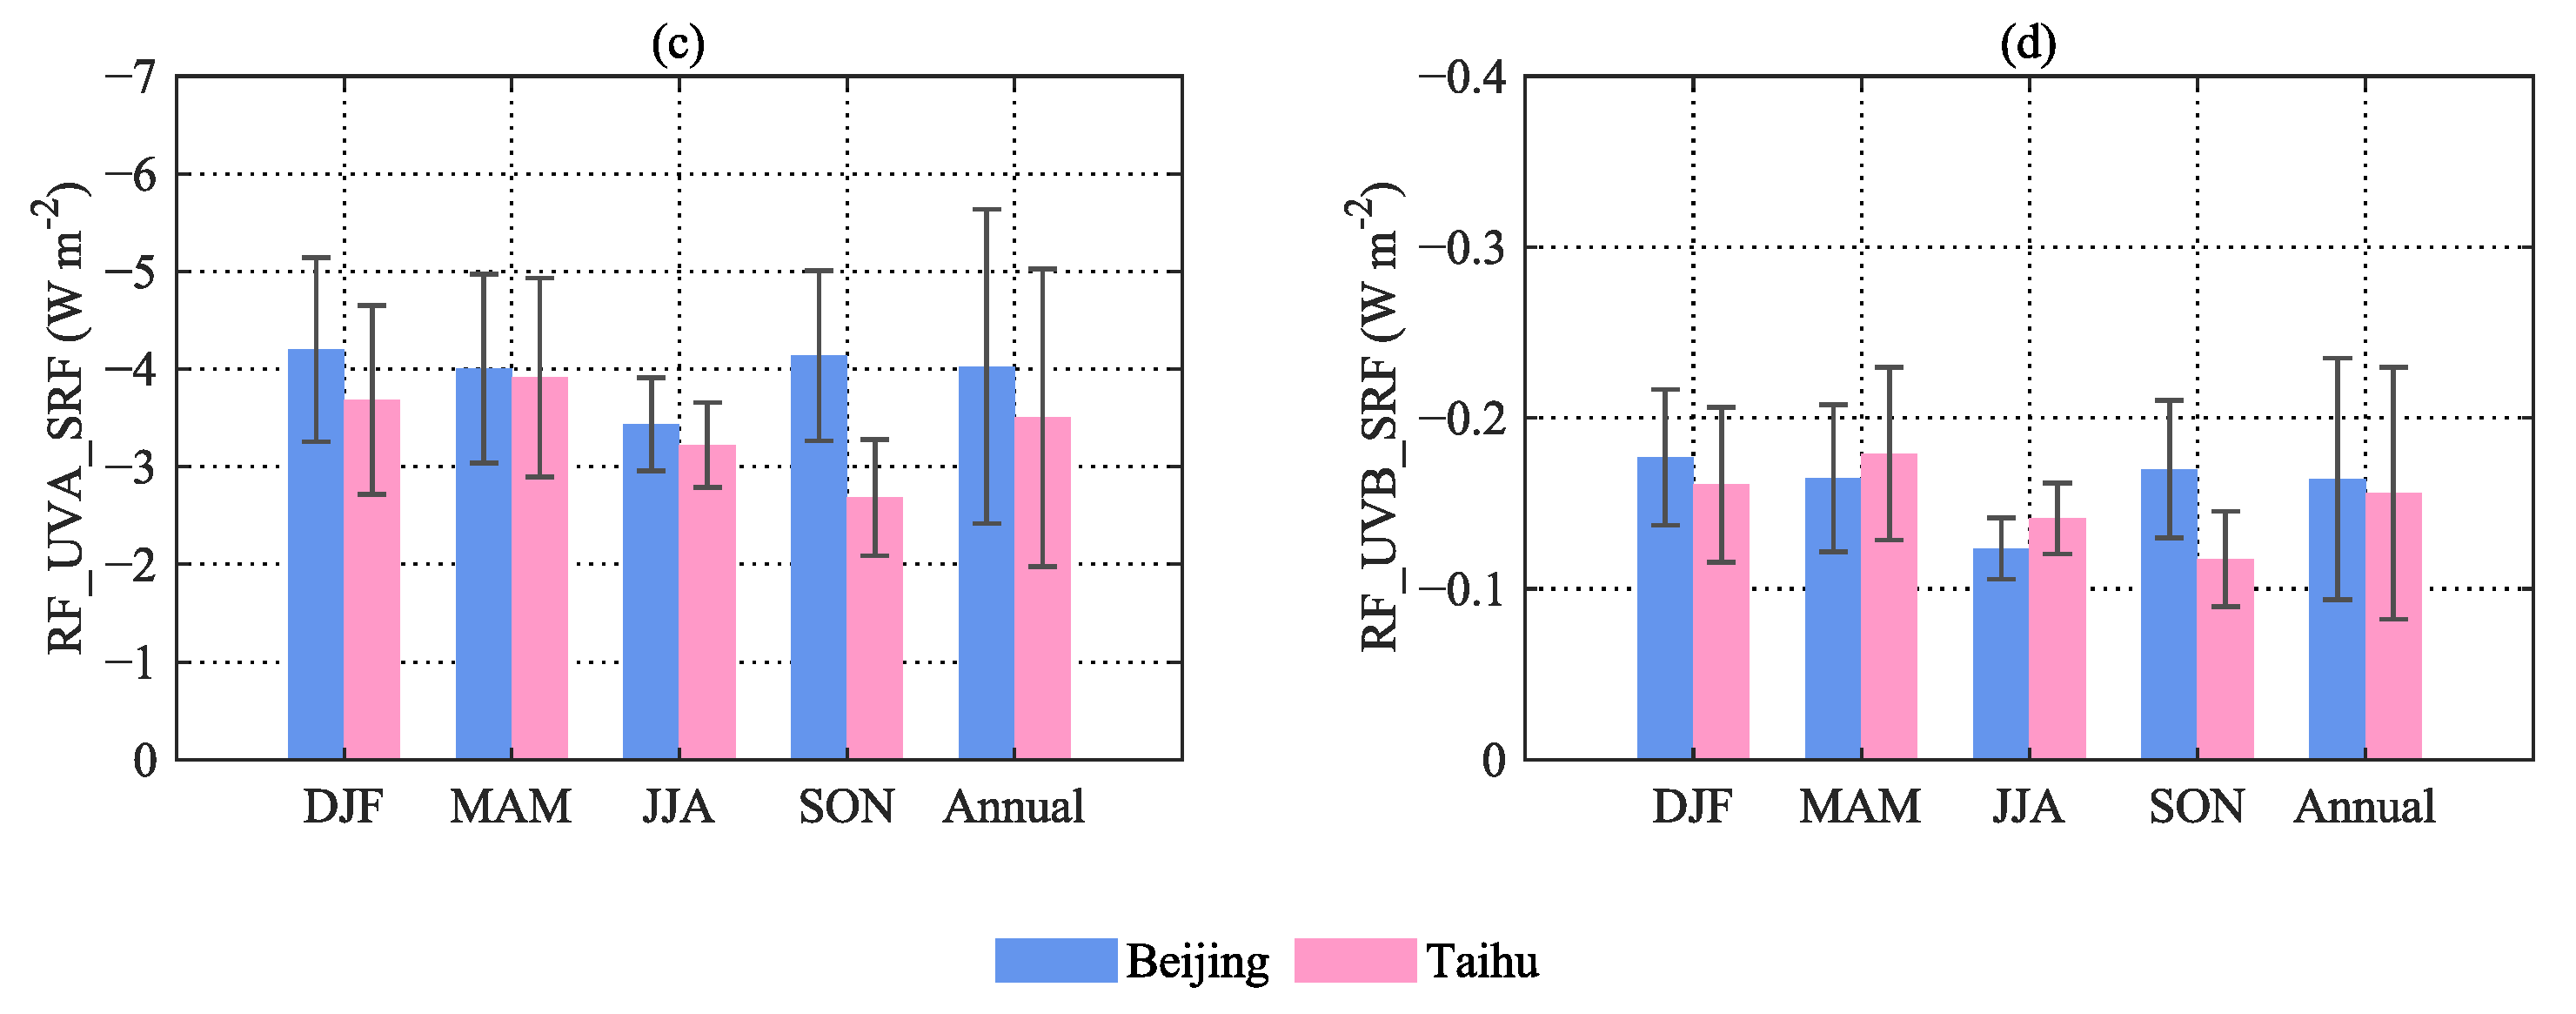
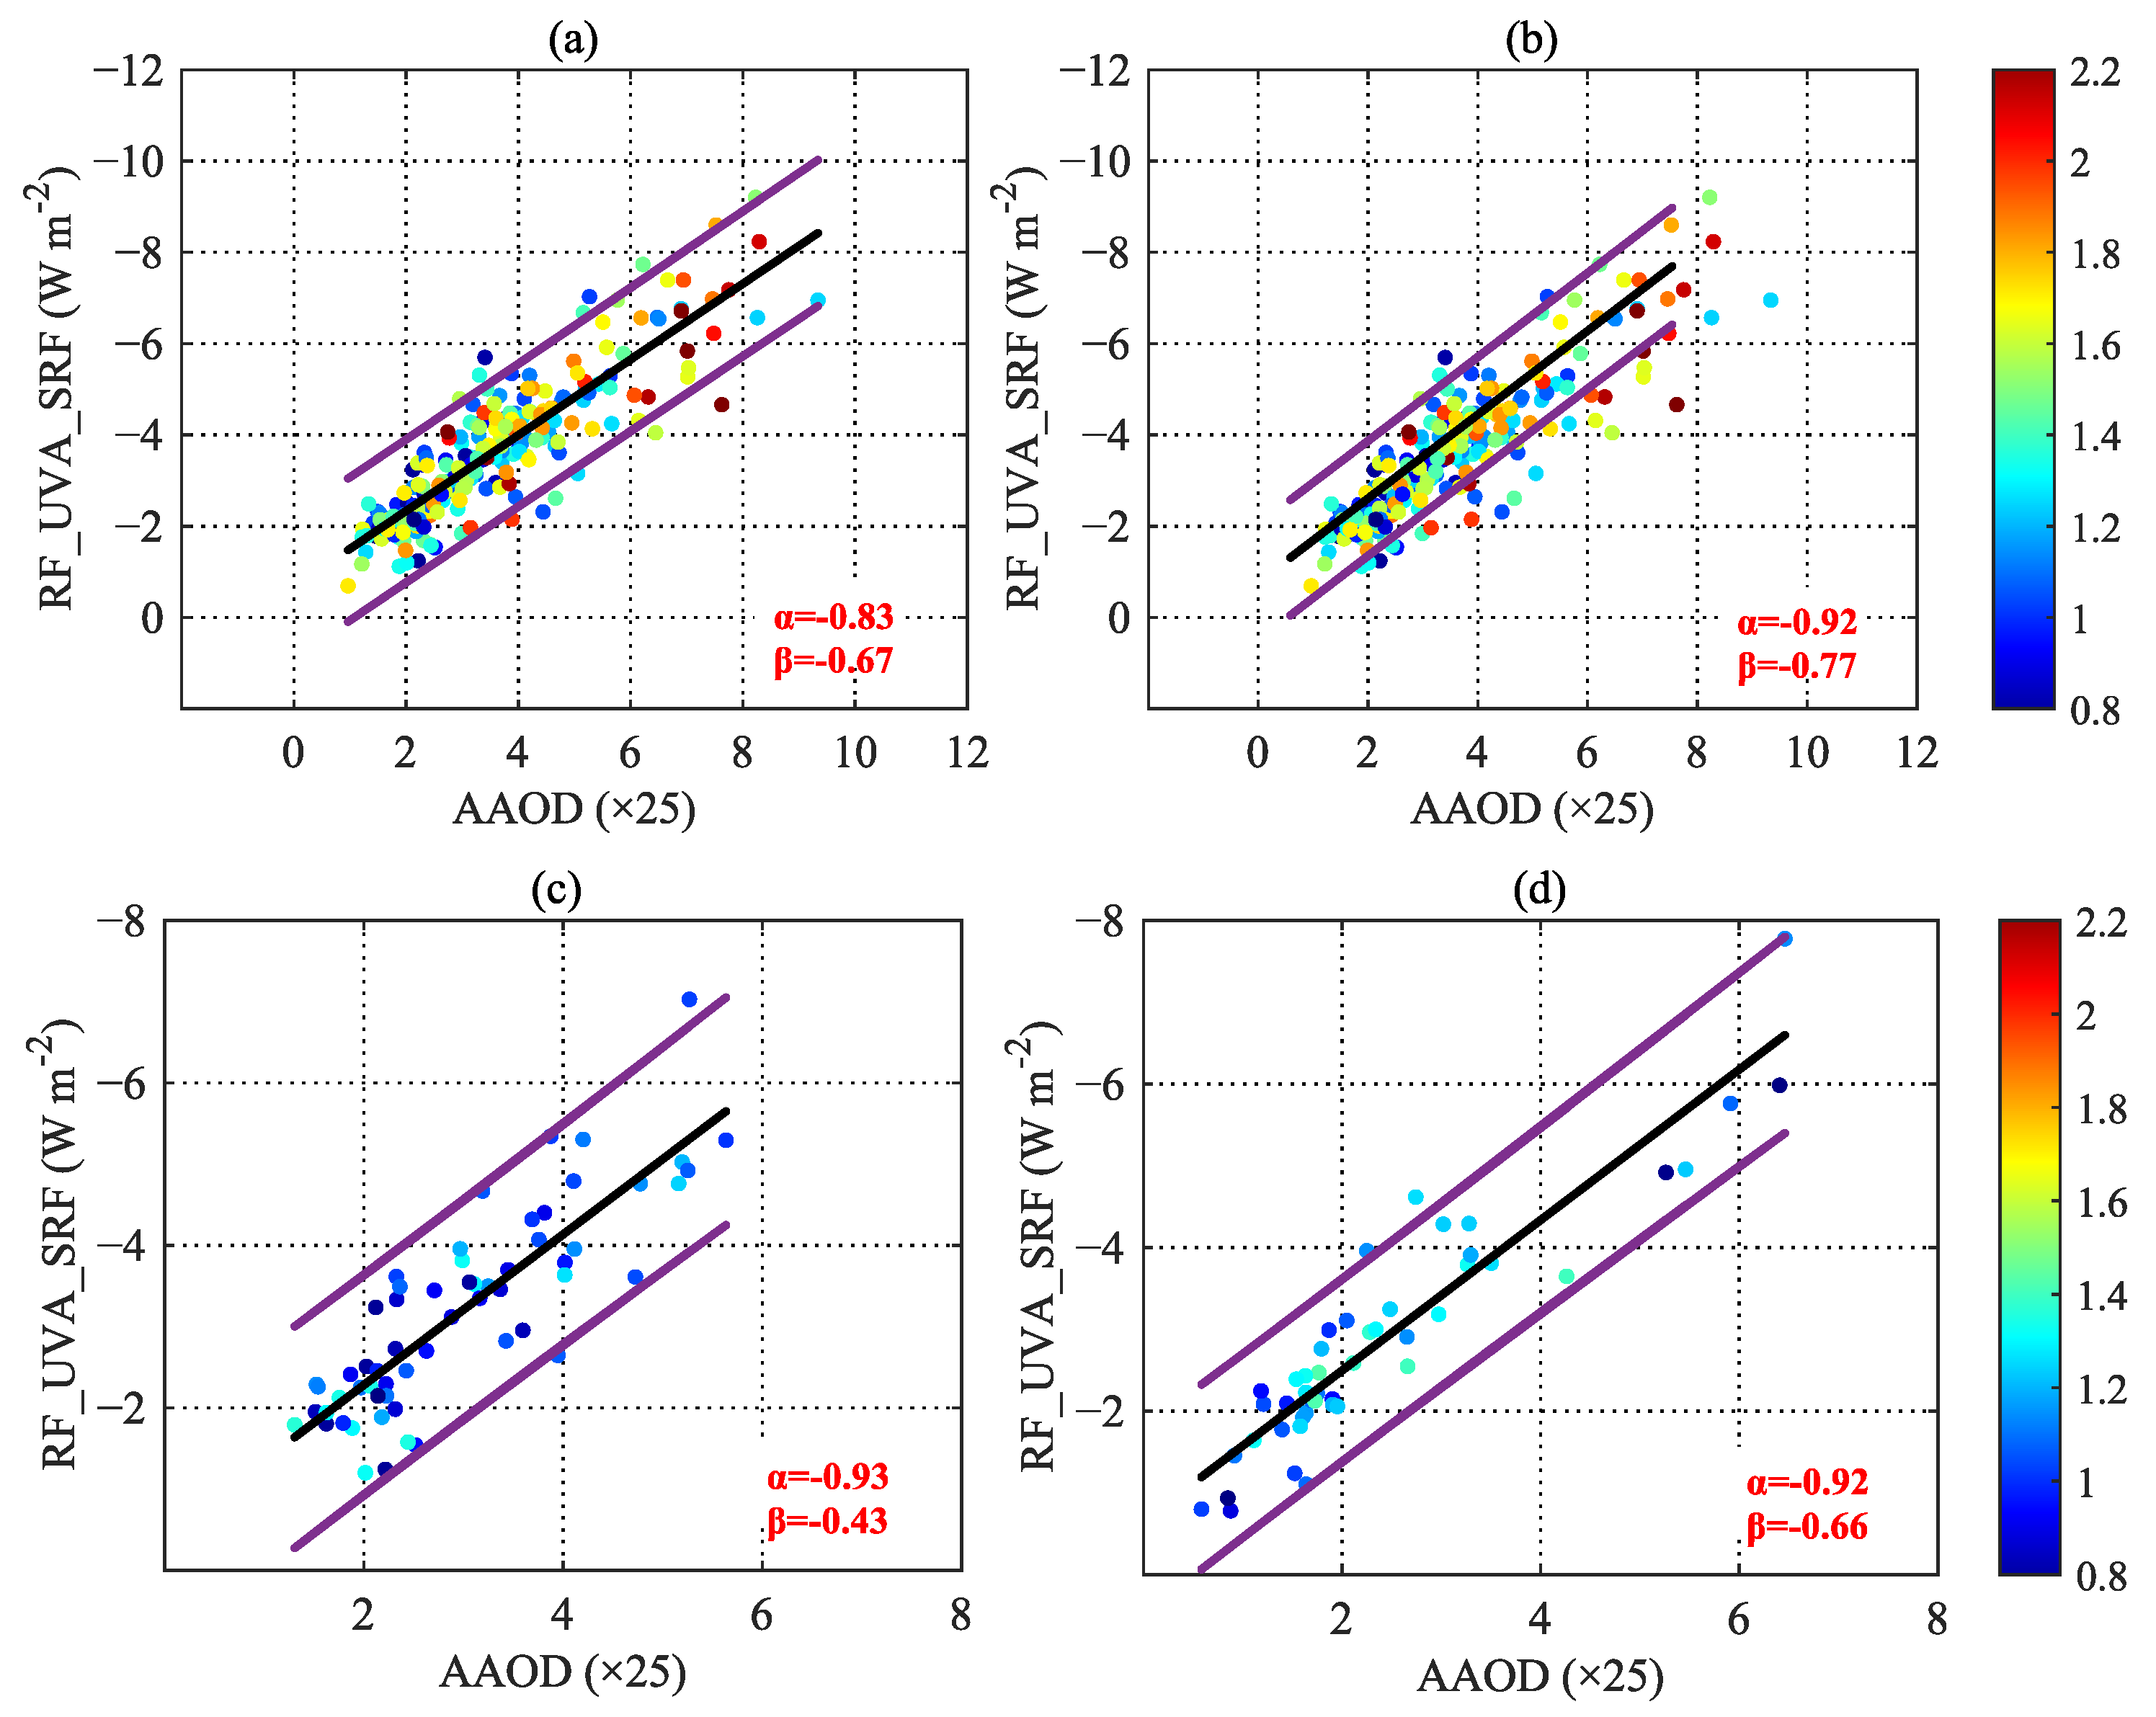
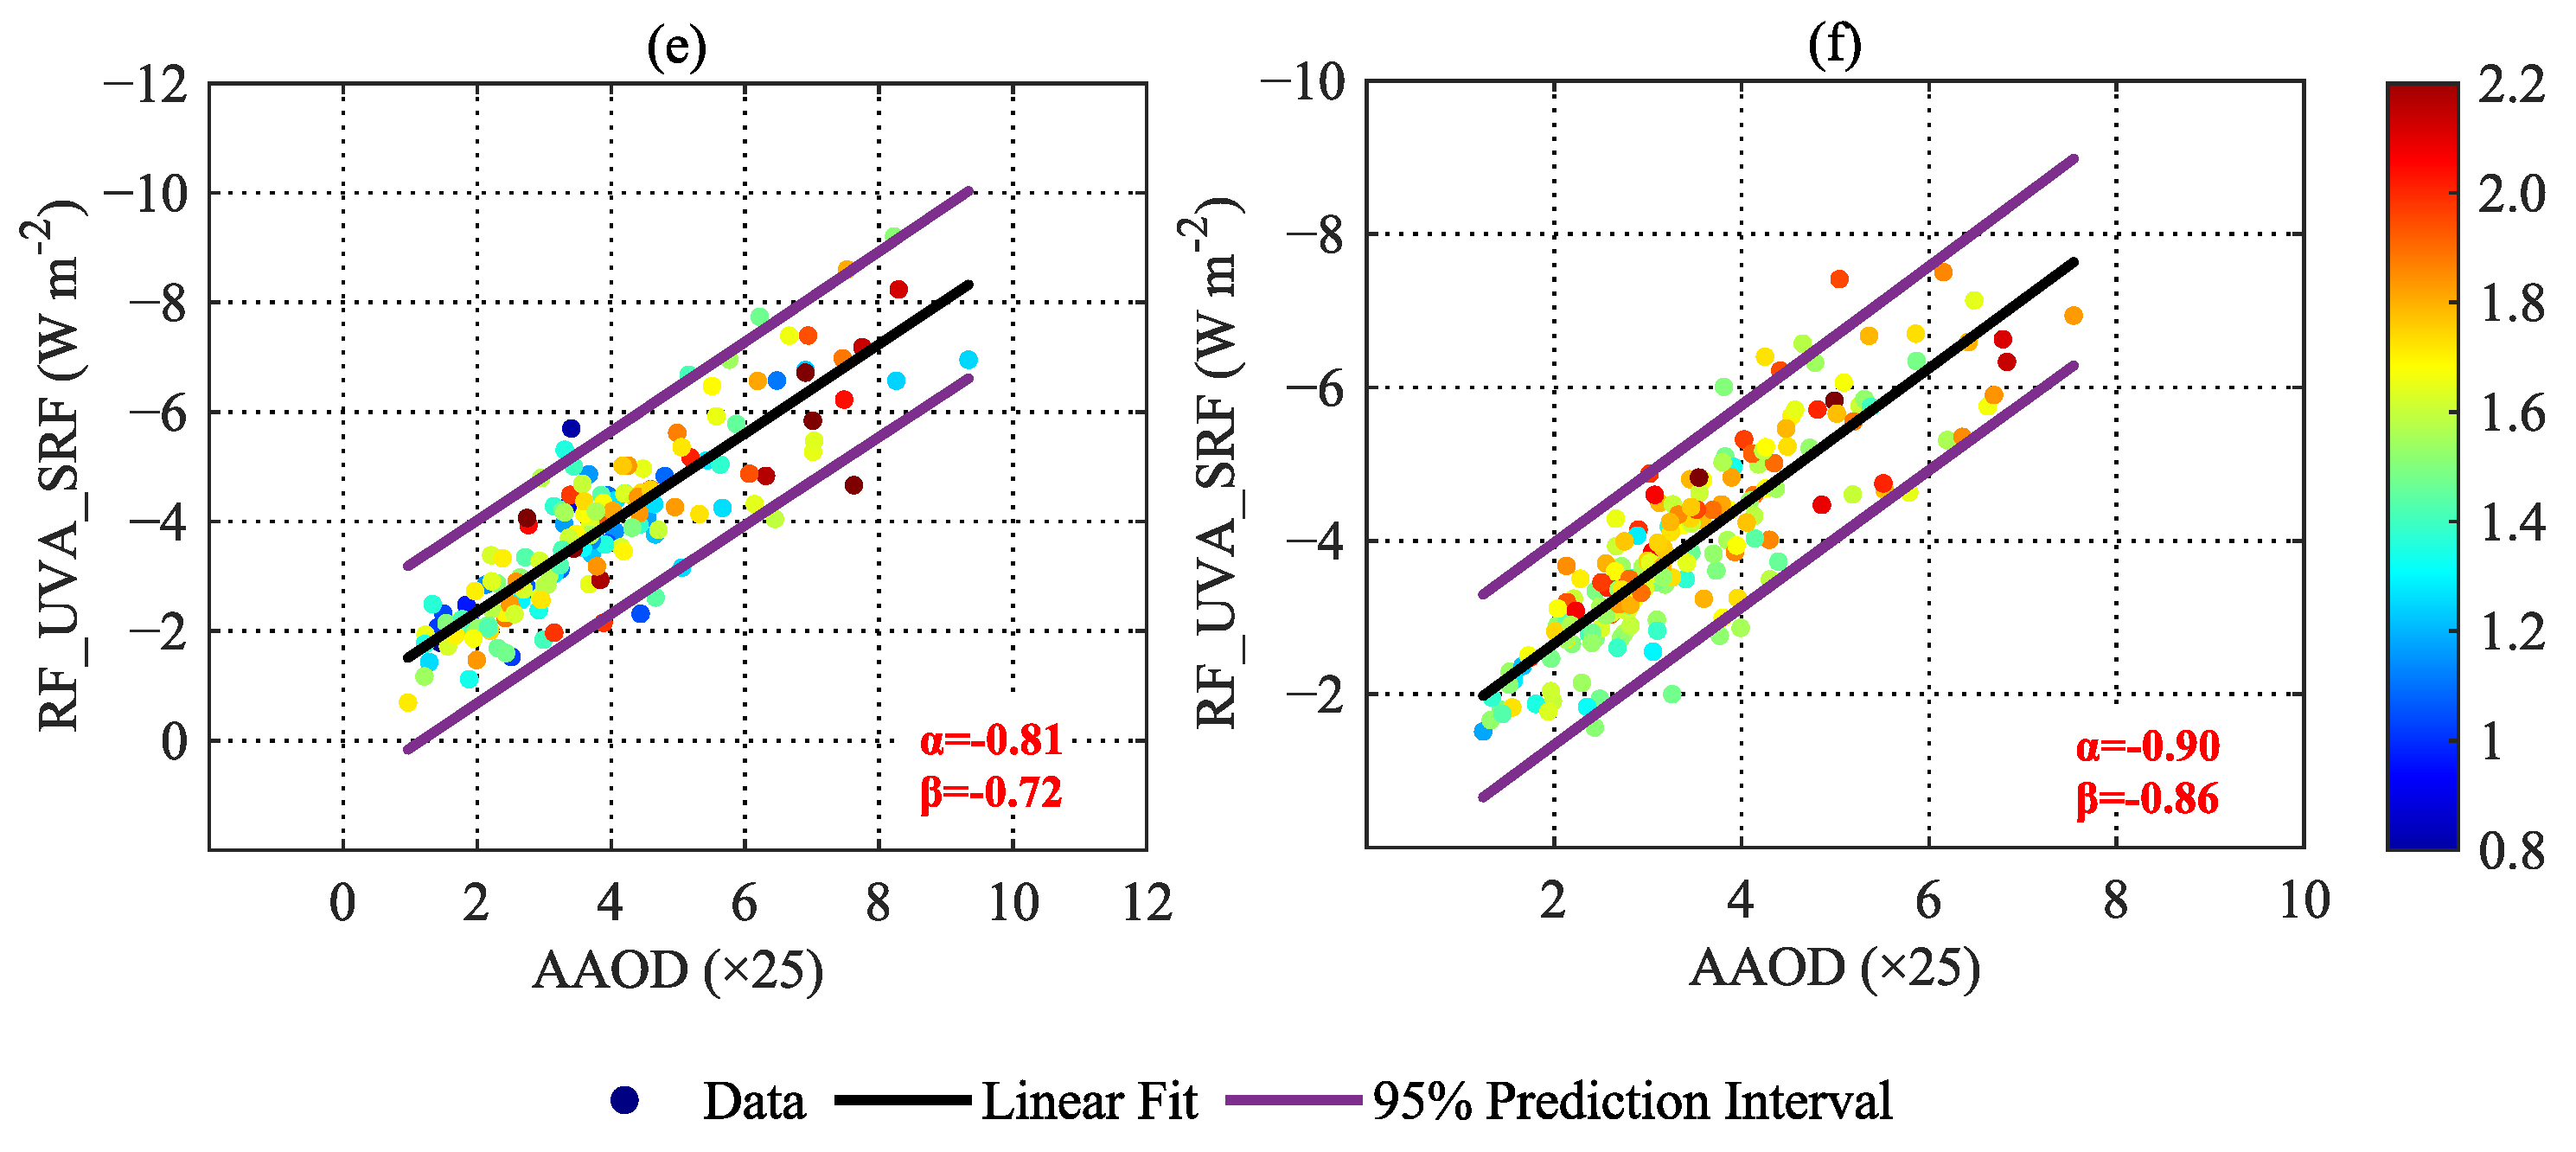
3.2.2. Seasonal Variations in the DRF Induced by Absorbing Aerosols

Similarly, the Beijing and Taihu sites were selected as representative sites to further analyze the direct effects of absorbing aerosols in the BTH and YRD regions. Daily average data were used for analysis. The seasonal variations in the DRF induced by absorbing aerosols in the UVA band induced by the absorbing aerosols of the Beijing and Taihu sites are shown in Figure 6, which will be emphatically analyzed.
The DRF induced by absorbing aerosols of the Beijing and Taihu sites showed different seasonal variations. The positive DRF at the TOA of Beijing site was strong in winter (2.84 W m−2), followed by autumn and spring (2.80 W m−2 and 2.78 W m−2, respectively), and relatively weak in summer (2.57 W m−2). However, the seasonal variations in the DRF at the TOA of the Taihu site were relatively weaker, which were strong in spring and winter (2.21 W m−2 and 2.29 W m−2, respectively), and relatively weak in summer and autumn (2.03 W m−2 and 1.80 W m−2, respectively). Similar seasonal variations of the corresponding negative DRF at the surface were also illustrated at both sites. Clearly, the DRF induced by absorbing aerosols were dependent on the corresponding AAOD. Therefore, the DRF was strong when the AAOD was high, especially in winter. The DARF-TOA values under clear conditions at Shenyang (urban area of northeastern China), Beijing (urban area of northern China), and Xianghe (rural area of northern China) showed a negative peak during June to August due to the large aerosol extinctions in the summer season [89,93]. It was indicated that the total shortwave DRF at the TOA caused by the absorbing aerosols of urban Nanjing was 5.76 W m−2 [29], which was higher than the results in this study (the annual averages at the Beijing and Taihu sites were 2.62 and 2.23 W m−2, respectively), because only the radiation forcing in the UV band was considered in this study.
Previous research on aerosols proposed a method for classification, which suggests that the aerosols can be identified as BC-dominated (including biomass burning and urban/industrial aerosols) dominated with monotonically decreasing SSA spectra over East Asia [128], and the method was applied in our previous research [29]. Therefore, to estimate the contribution of BC in absorbing aerosols in terms of the optical depth and the radiative forcing, the relationship between AAOD and DRF of different types of absorbing aerosols at both sites was further analyzed based on the SSA variation within the 330–990 nm band, including the total absorbing aerosols, the BC-dominated absorbing aerosols, and other absorbing aerosols. Here, the BC-dominated absorbing aerosols refer to the absorbing aerosols with the SSA decreasing monotonically with wavelength. The results are shown in Figure 7 color-coded with the AAE. The AAE 440 675 of BC-dominated absorbing aerosols is generally lower than 1.2 [137]. It was also pointed out that for pure BC particles (such as those represented in an external mixture) [172,173,174], the theoretical AAE 440 675 is 1 [175,176,177]; for BC particles in the core–shell internal mixing state, the AAE 440 675 varies in the range of 0.6–1.3 [175,178]; for the presence of brown carbon aerosols (BrC), the AAE 440 675 is in the range of 1.5–2.0 or higher [179,180]. According to Figure 7a,b, the AAE 440 675 of the identified BC-dominated absorbing aerosols was approximately 1, which further suggests that the method for classification applied in our research is reasonable.
Figure 6. Seasonal averages of DRF induced by absorbing aerosols (a) in the UVA band at the TOA (RF_UVA_TOA), (b) in the UVB band at the TOA (RF_UVB_TOA), (c) in the UVA band at the surface (RF_UVA_SRF), and (d) in the UVB band at the surface (RF_UVB_SRF) at the Beijing and Taihu sites based on AERONET measurements.
Remotesensing 15 02779 g006aRemotesensing 15 02779 g006b
Generally, the radiation efficiency of BC-dominated absorbing aerosols (defined as DRF to AAOD) is higher than that of other types of absorbing aerosols [181], probably indicating a higher contribution capability to the radiative forcing of the BC-dominated absorbing aerosols than other absorbing aerosols. It was also noticeable that the BC-dominated absorbing aerosols accounted for approximately 27% and 20% of the total absorbing aerosols throughout the year at the Beijing and Taihu sites, respectively, and the ratio was higher in summer and autumn. Our previous research also implied that BC-dominated aerosols in urban Nanjing was about 27% from 2012 to 2013, which is consistent with those in [182] for the monotonic categories [29]. Additionally, the frequent dust and sand storms in winter and spring would lead to higher occurrence of dust-dominated absorbing aerosols.
Figure 7. Linear fitting relationship between DRF in the UVA band at the surface induced by total absorbing aerosols (a,b), BC-dominated absorbing aerosols (c,d), and other absorbing aerosols (e,f) and corresponding AAOD at the Beijing (a,c,e), and Taihu sites (b,d,f) color-coded with AAE. The linear fitting coefficients α and β are shown in the bottom right corner of each panel.
Remotesensing 15 02779 g007aRemotesensing 15 02779 g007b
The seasonal variations in the DRF induced by BC-dominated absorbing aerosols (RF_absorb_TOA and RF_absorb_SRF) and BC-dominated total aerosols (RF_total_TOA and RF_total_SRF) are illustrated in Figure 8. Here, the BC-dominated total aerosols refer to aerosols with the absorbing portion dominated by BC.
The annual average DRF due to absorbing aerosols of the Beijing site was particularly higher than that of the Taihu site, especially for autumn, when the AAOD of the BC-dominated aerosols was relatively higher at the Beijing site, which, however, was different during winter, spring, and summer. For instance, the AAOD of both sites are approximately equal during spring, while the DRF at the TOA of the Beijing site is relatively higher, although the DRF at the surface is relatively weaker. In addition to AAOD, the surface albedo and solar zenith angle have a strong influence on the variations in the aerosol DRFs. As implied by [45], for a given AAOD, a higher surface albedo would promote more solar radiation absorbed by absorbing aerosols and decrease solar radiation scattered by scattering aerosols, resulting in a stronger and positive DRF and weaker and negative DRF at TOA. The surface albedo averaged from four wavelengths (440, 670, 870, and 1020 nm) was approximately 0.162 and 0.121 of the Beijing and Taihu sites, respectively. Therefore, the DRF between the Beijing and Taihu sites tended to have different features at the TOA and surface. Similarly, the DRF of the Taihu site during spring was stronger at the SRF and weaker at the TOA than that during summer, as a result of a higher surface albedo in summer (1.38). Additionally, the strongest DRF of the Beijing site appeared in winter, followed by autumn, spring, and summer in a descending subsequence. The DRF of the Taihu site was strongest in winter and lowest in autumn. The DRF of absorbing aerosols shared similar seasonal variations with AAOD. However, the seasonal variations in the DRF induced by BC-dominated total aerosols were different from that induced by BC-dominated absorbing aerosols. On the one side, the seasonal variations in the DRF between the two sites were different, although the annual averages were approximately equivalent with a relative difference of less than 10%. The DRF induced by the BC-dominated total aerosols of the Beijing site was strongest in summer and weakest in spring, and the DRF induced by the BC-dominated total aerosols of the Taihu site was strongest in summer and weakest in autumn, which was basically consistent with the seasonal variations of AOD. [87] suggested that these negative DRF at the TOA due to total aerosols under clear conditions at northern China showed a negative peak during summer due to the large aerosol extinctions [89,183], while large quantities of black carbon can be emitted from biomass burning in the YRD during the summer, which would cause a heating up of the atmosphere, resulting in lower negative DARF-TOA. Comparing the DRF at the surface induce by BC-dominated absorbing aerosols and total aerosols, it was found that the seasonal variations were identical to those at TOA. The DRF induced by BC-dominated absorbing aerosols accounted for over 45% of the DRF induced by BC-dominated total aerosols in winter and 35% in summer, which agreed with the seasonal variations of the proportion of AAOD in AOD. In addition, since AAOD accounted for approximately 10% of AOD, it can be inferred that the reduction efficiency of BC-dominated absorbing aerosols on the surface DRF was higher than that of BC-dominated total aerosols.

3.3. Impacts Absorbing Aerosols on Near-Surface Photochemistry of Absorbing Aerosols

Absorbing aerosols will affect the UV radiative forcing and actinic flux in the near-surface atmosphere, and then affect the photolysis rate and oxidant concentration. Hence, we mainly focused on the photolysis rate of NO2 (J[NO2]) and O3(J[O1D]).

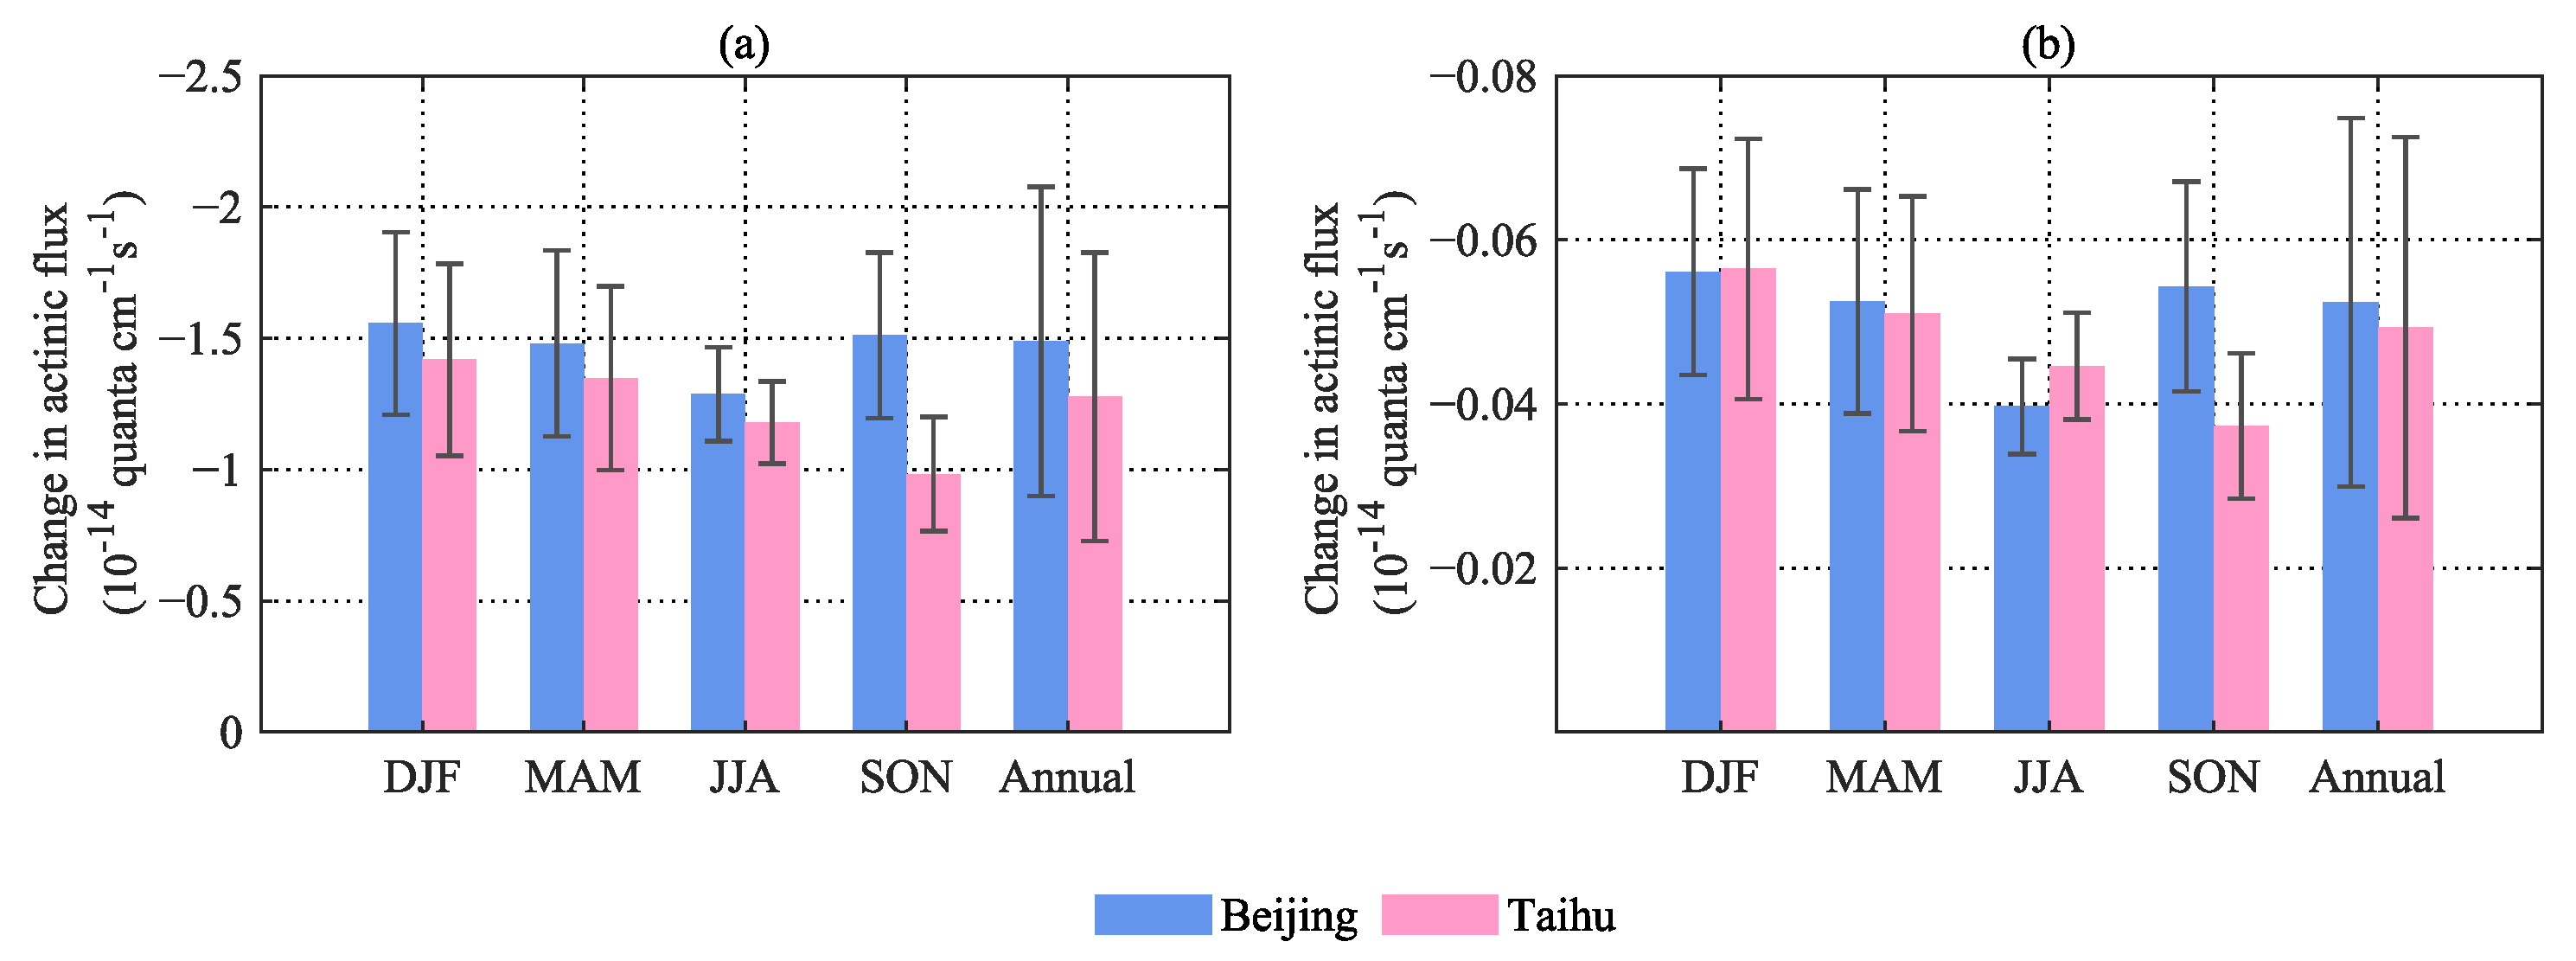
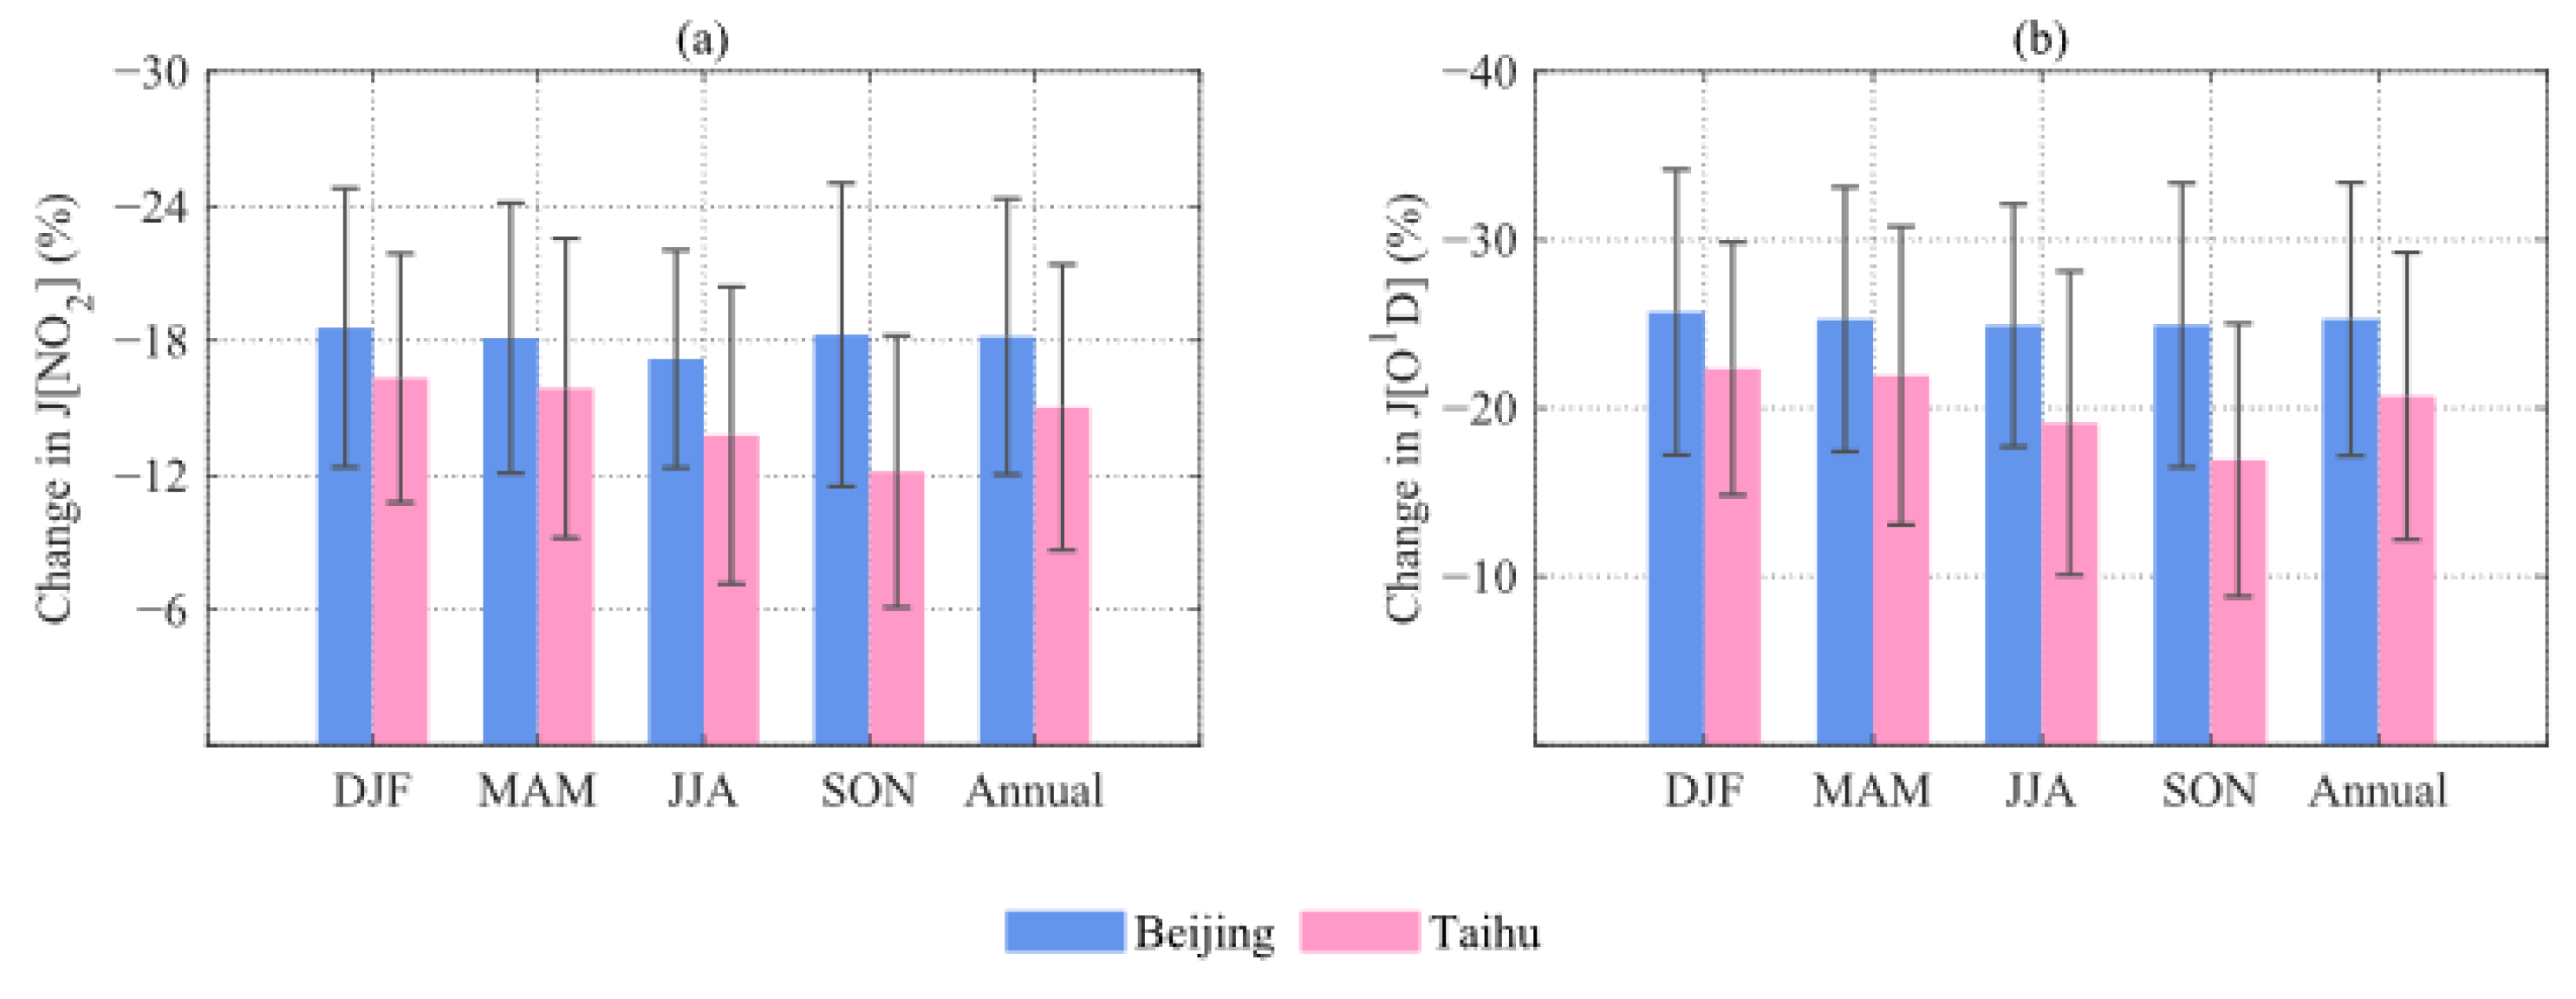
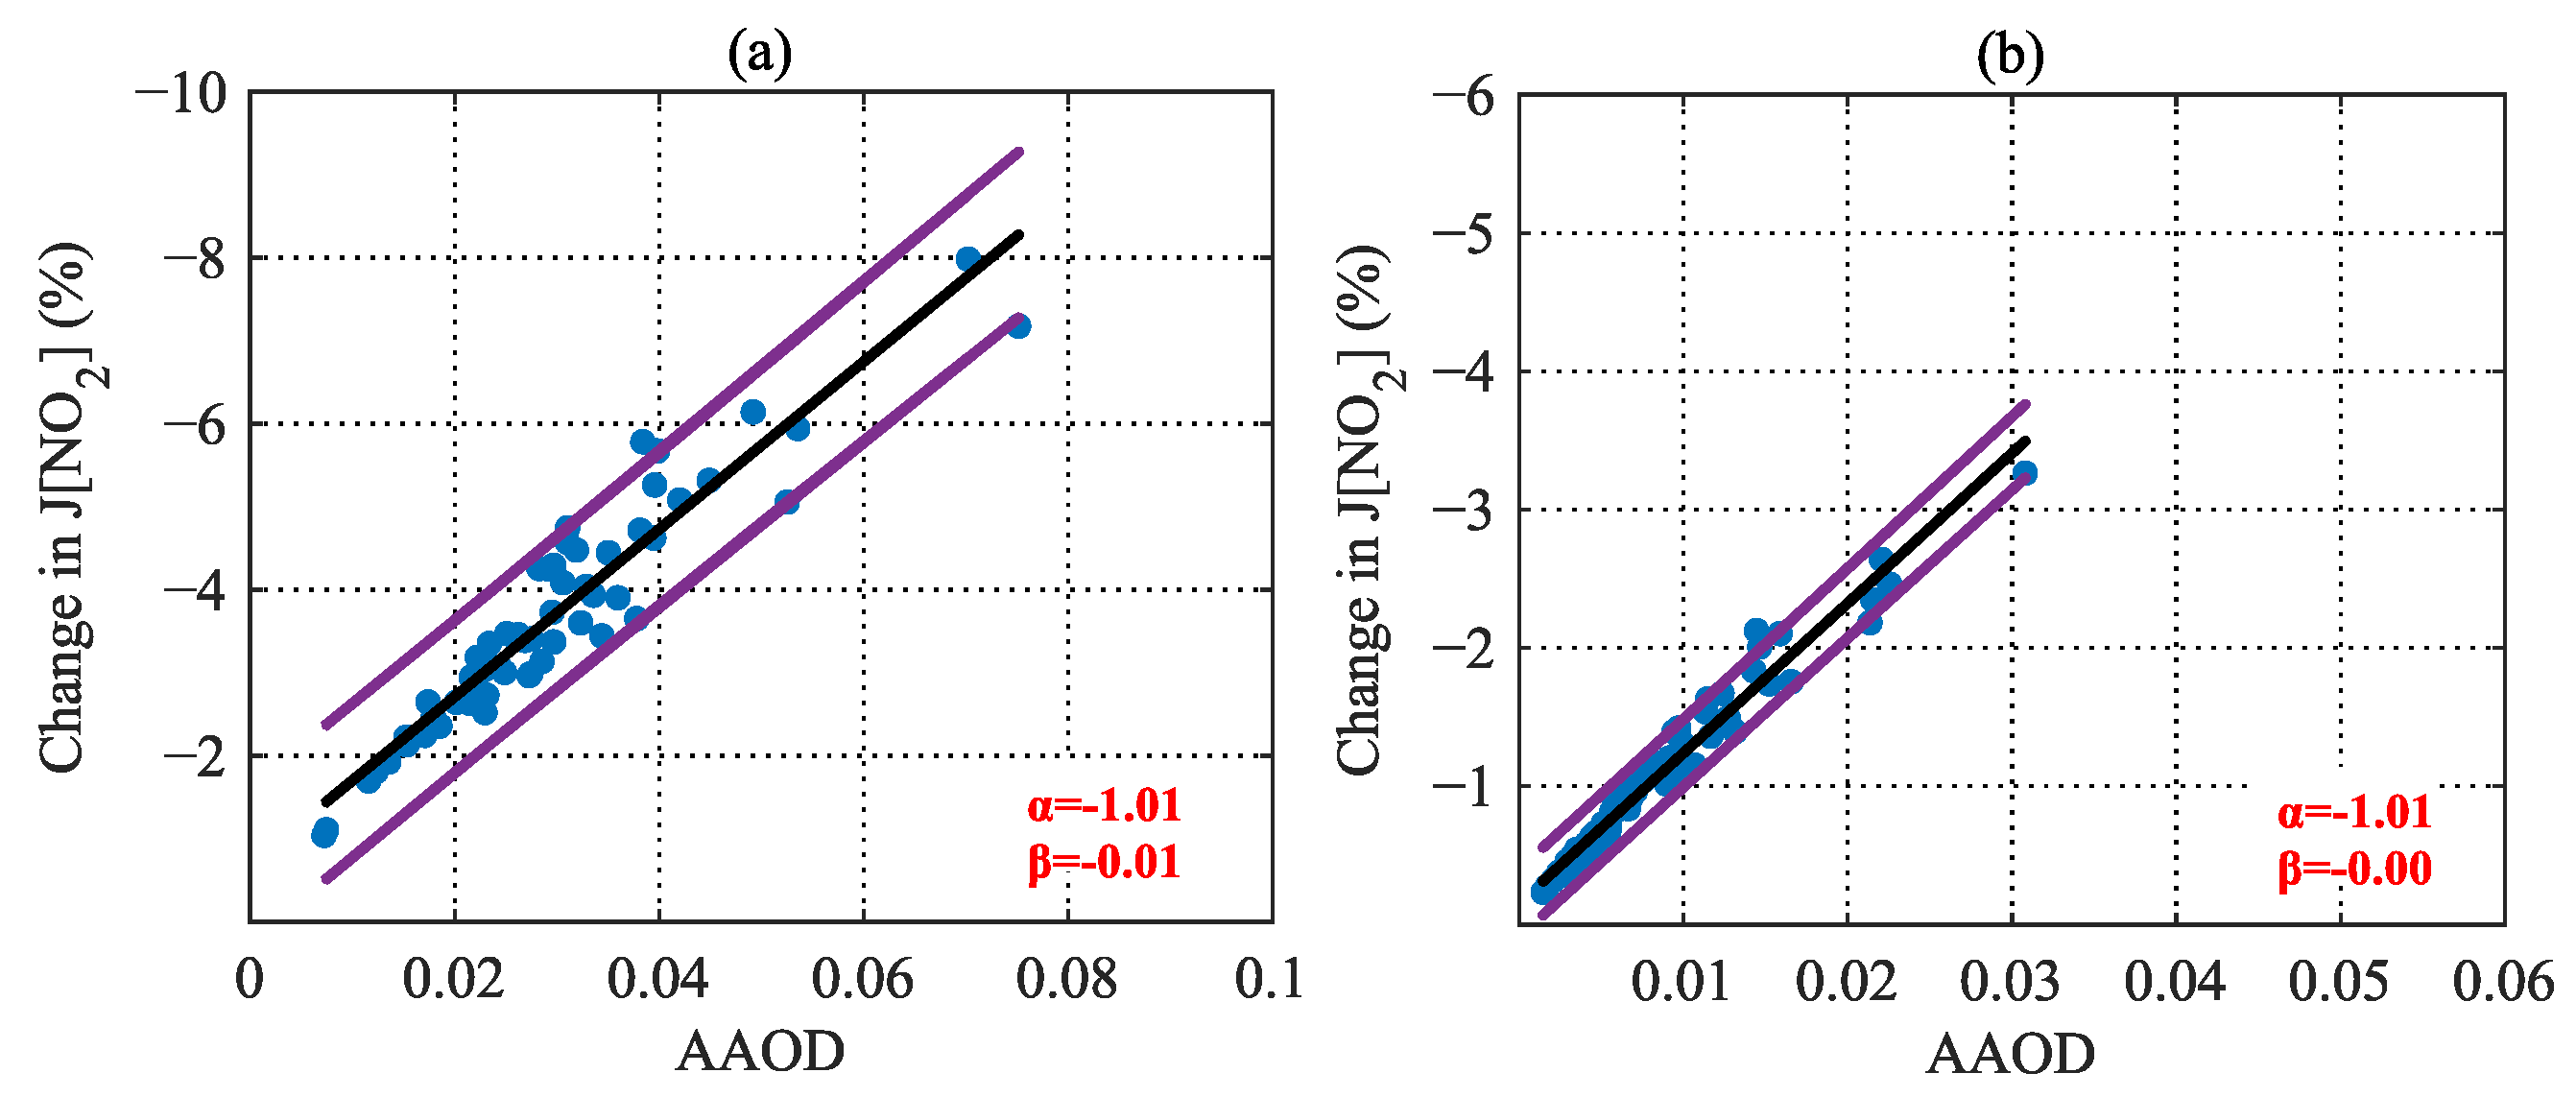
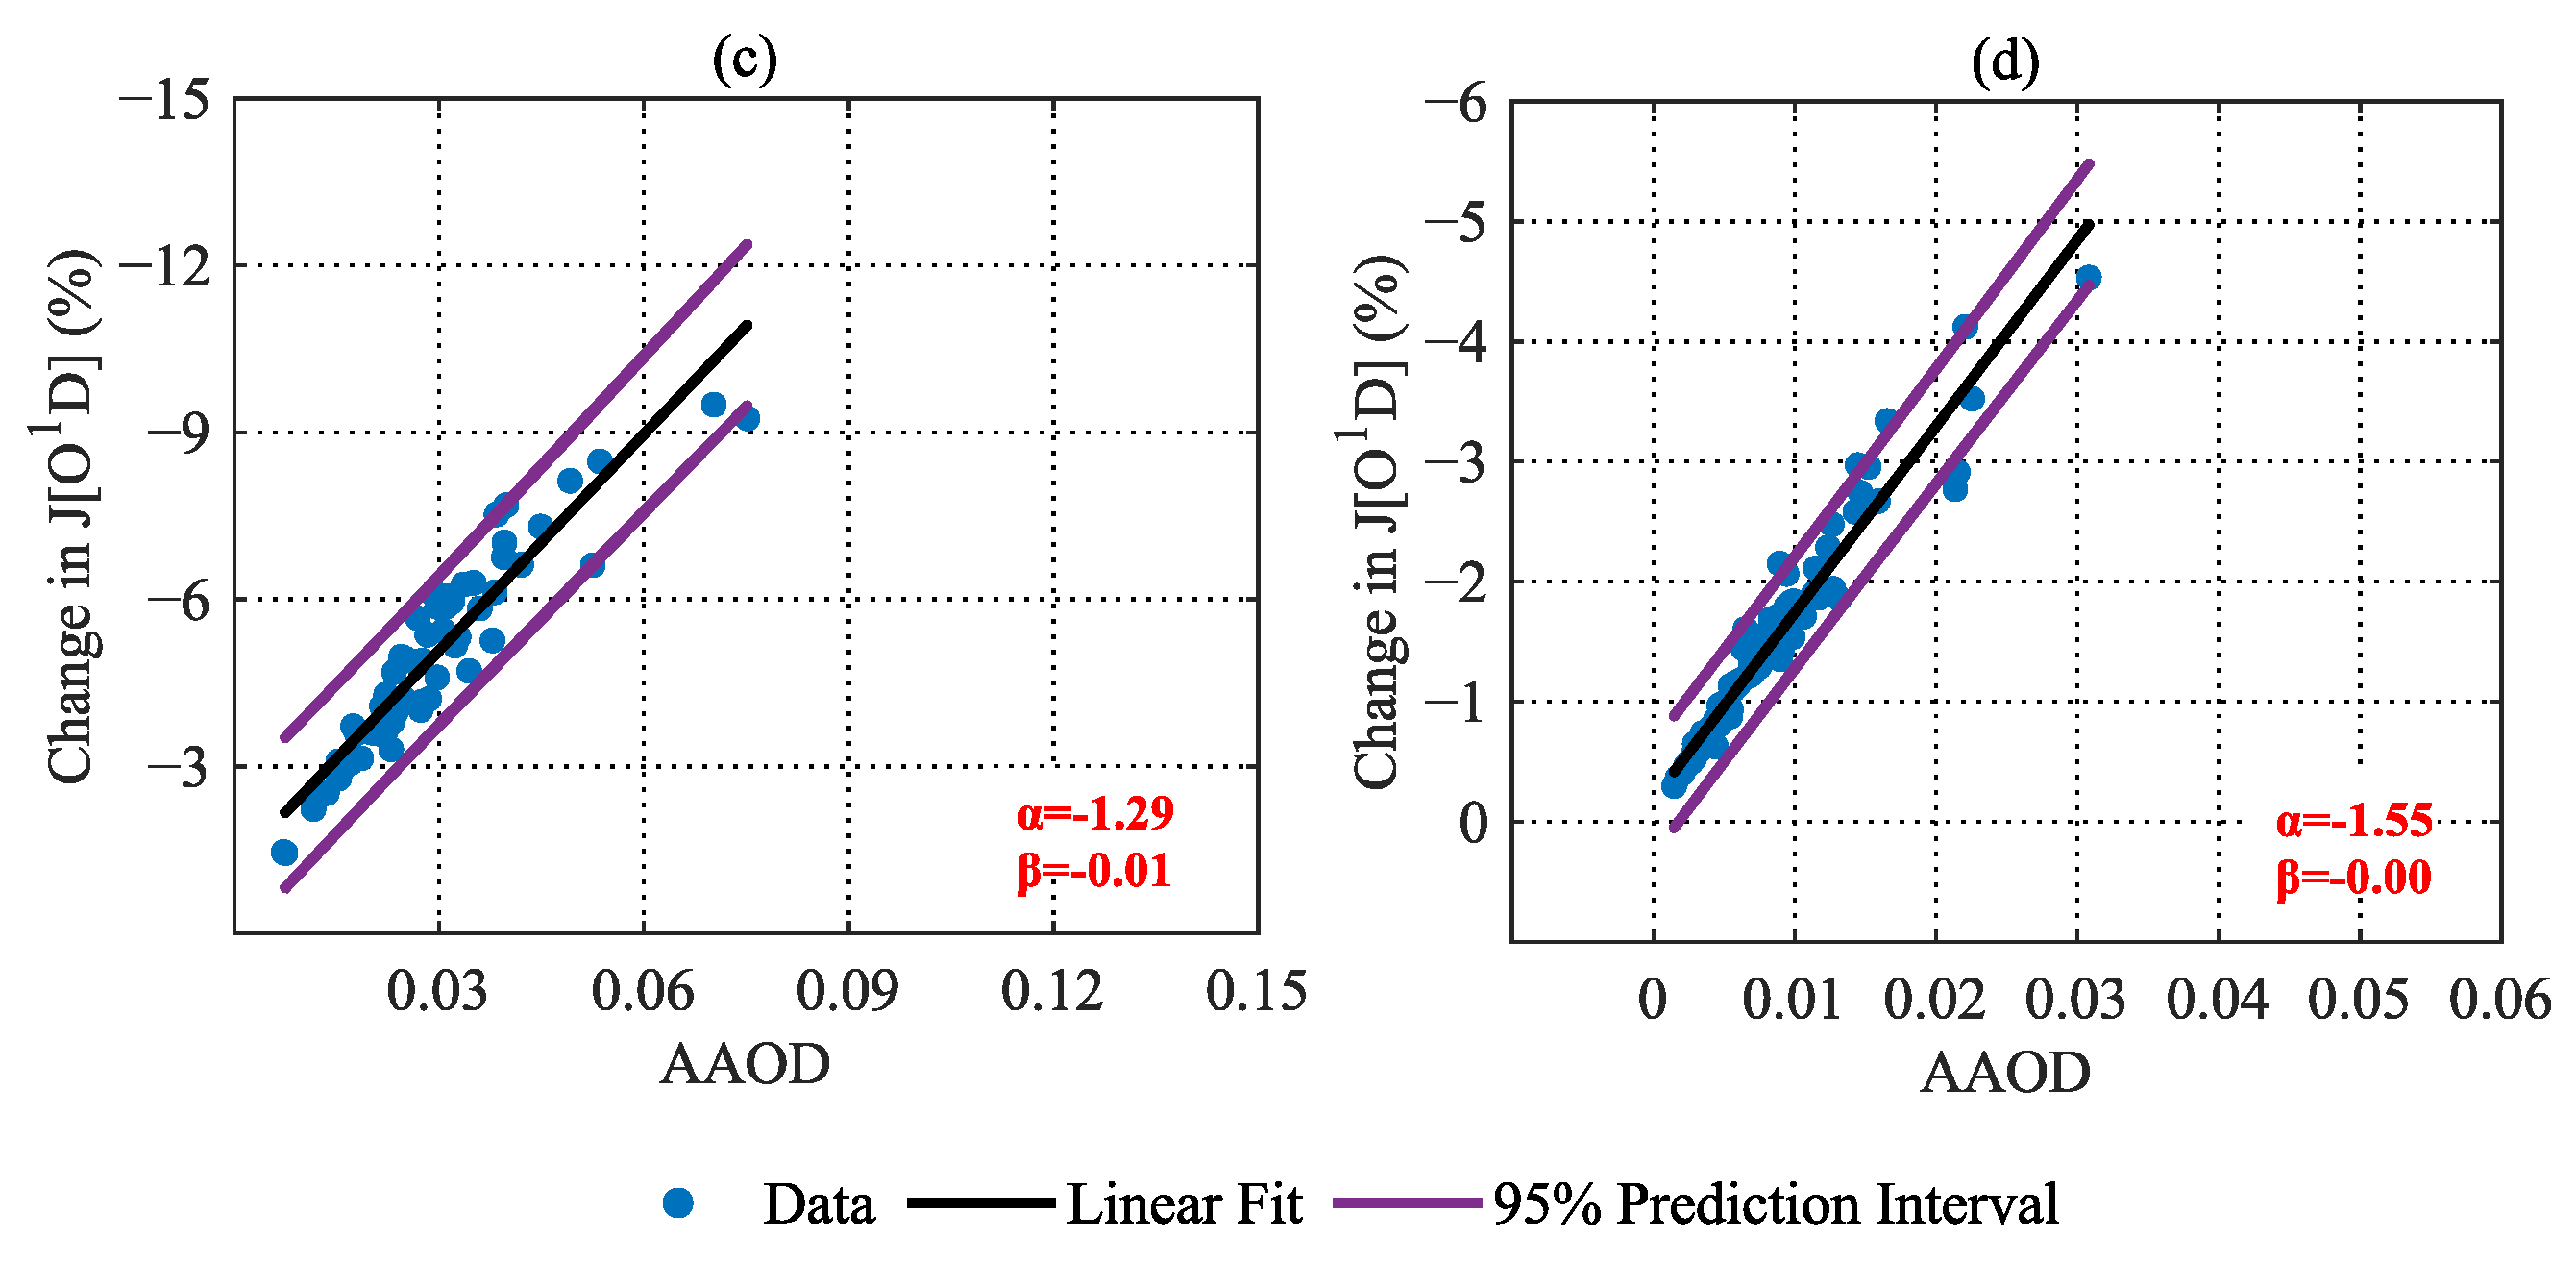
3.3.1. Spatial Variations in the Impacts of Absorbing Aerosols on the Actinic Flux and Photolysis Rates

The changes of the actinic flux and photolysis rates due to absorbing aerosols are shown in Figure 9 and Figure 10. Since the photolysis rate was directly affected by the actinic flux, the spatial distribution of the changes in the photolysis rate was basically consistent with that in the actinic flux, which will be further analyzed.
The absorbing aerosol radiative effects play an important role in reducing the actinic flux and photolysis rate (J[NO2] and J[O1D]) in the near-surface atmosphere. Generally, the spatial distribution of actinic flux is similar to that of DRF, with obvious reductions in BTH, YRD, PRD, and Taiwan, corresponding to areas with high AAOD. Therefore, the radiative effects of the absorbing aerosols reduce the actinic flux near the surface, thereby affecting the photochemistry reactions, thus slowing down the photolysis rates and the formation of O3.
Among the 23 sites, the most substantial reduction in photolysis rates occurred in Xinglong site in the BTH region, with J[NO2] and J[O1D] decreasing by more than 20%. The photolysis rate of sites in northwest (Yulin site), BTH (Beijing and Xianghe sites), YRD (Taihu site), PRD (Hong_Kong_PolyU site), and Taiwan (Taipei site) also decreased considerably. The weakest reduction in photolysis rates appeared in the Gosan_SNU site, where the average J[NO2] and J[O1D] decreased by 7.08% and 9.24%, respectively. It was found that the difference in the reduction in aerosols on J[NO2] and J[O1D] was due to the different bands where the photochemistry reactions occurred, and the photochemistry reactions of O3 mainly took place in the band of 300 nm, while the photochemistry reactions of NO2 mainly took place in the band of 400 nm and, thus, the absorbing aerosols would reduce J[O1D] more significantly [184].
The sites with reduction in J[NO2] exceeding 10.92% (the reduction in J[O1D] exceeding 15.86%) included two sites in South Korea and fourteen sites in China except the Chen-Kung University site, the EPA-NCU site, and the Dongsha Island site, which was the 60th percentile value among the photolysis rates reduction ranked from high to low. All the sites with reduction in J[NO2] exceeding 15% (the reduction in J[O1D] exceeding 20%) were located in eastern China, except the Yulin and SACOL sites, together with high AAOD and strong DRF (AAOD over 0.10, and DRF at the TOA and surface over 1.50 W m−2 and −2.15 W m−2, respectively). It was suggested that aerosols could lead to the daily J[NO2] (J[O1D]) decreasing by 10–30% based on the measurements at three sites in Mexico City from February to April 1994 using the TUV model [71]. The average J[NO2] (J[O1D]) decreased by 16.95% (22.42%), 9.61% (13.55%), and 9.63% (13.79%) at sites in China, South Korea, and Japan, respectively, which indicates that the impact of absorbing aerosols on photolysis rates in China is more significant than that in South Korea and Japan.

3.3.2. Seasonal Variations in the Impacts of Absorbing Aerosols on the Actinic Flux and Photolysis Rates

Similarly, the seasonal variations in the impacts on the near-surface actinic flux and photolysis rates at the Beijing and Taihu sites were further explored. The results are shown in Figure 11 and Figure 12. The changes in the actinic flux and photolysis rates at the Beijing site were higher than those at the Taihu site, while the differences among seasons of the Taihu site were more evident. There was reasonable concordance between the seasonal variations in the actinic flux and photolysis rates changes due to the absorbing aerosols and those of the DRF and AAOD. For the Beijing site, the maximum reduction in J[NO2] (J[O1D]) was 18.58% (25.69%) during winter and the minimum reduction in J[NO2] (J[O1D]) was 17.19% (24.91%) during summer; for the Taihu site, the maximum reduction in J[NO2] (J[O1D]) was 16.34% (22.33%) during winter and the minimum reduction in J[NO2] (J[O1D]) was 12.17% (20.71%) during autumn.
The changes in the photolysis rates due to BC-dominated absorbing aerosols were further linearly fitted with the corresponding AAOD, and the results are shown in Figure 13. Generally, the magnitudes of the linear fitting slopes of the two sites were comparable, but the slope of the Taihu site was slightly higher, especially the slope between the change in the J[O1D] and the corresponding AAOD, which indicates that the reduction efficiency due to BC-dominated absorbing aerosols at the Taihu site was slightly stronger than that of the Beijing site, which was different from that between DRF and AAOD. Although the DRF of the absorbing aerosols and the changes of its actinic flux are closely related to AAOD, the factors to be considered when estimating the changes in the photolysis rates also include the height of the solar zenith angle, which is reflected in the observation time of the data. The influence of the measurement time cannot be completely excluded, though the daily average was adopted. Furthermore, since absorbing aerosols were only qualitatively classified based on the observation data, different components of the absorbing aerosols at the two sites and their own photochemical properties were not completely identified. Therefore, the above findings can provide an analysis reference based on the observations for future research, even though it may be improbable to make an accurate attribution on the causes.
The seasonal variations of photolysis rates affected by BC-dominated absorbing aerosols are summarized in Table 4 (J[NO2]_day and J[O1D]_day). The photolysis rate at the Beijing site was higher in autumn and winter but lower in spring and summer, while the photolysis rate at the Taihu site was higher in winter and summer, but lower in spring and autumn. The maximum decreases in J[NO2] (J[O1D]) at the sites exceeded 15% (20%). Generally, the decrease in the Beijing site was more significant than that at the Taihu site. It was suggested that the impact of total aerosols on near-surface actinic flux and photolysis rates decreased more significantly in winter than in summer, with the maximum reduction of 38% in eastern China during winter using the GEOS-CHEM model, and the impacts of BC radiative effects on the actinic flux and photolysis rates also shared the above characteristics, thus leading to a reduction of about 3.0% (4.0%) of J[NO2] (J[O1D]) in eastern China in winter and about 1.5% (2%) of J[NO2] (J[O1D]) in summer [70].
In addition, since previous studies indicated that the impacts of aerosols radiative effects on UV radiation and actinic flux were strongest at noon [184,185], the changes in photolysis efficiency (J[NO2] _noon and J[O1D]_noon) due to BC-dominated absorbing aerosols at the two sites during 10:00–14:00 were also calculated. It was found that when the AOD of strong scattering aerosols (SSA = 0.99) increased from 0.5 to 2.5, the daily maximum values of J[NO2] (J[O1D]) in Guangzhou on 25 July 2006 decreased by 13.1% (30.3%) [184]. Moreover, when the BC AOD reached 0.044, the maximum daily drop of J[NO2] (J[O1D]) was 13.7% (19%) compared with that without BC based on the BC observation data of Pukou site in the northern suburb of Nanjing in June 2018 using the TUV model [72]. The Taihu site selected in this research is also located in the YRD region, and the J[NO2] (J[O1D]) reduction related to BC-dominated absorbing aerosols from 10:00 to 14:00 in summer was 13.96% (17.33%), with a commensurate magnitude.

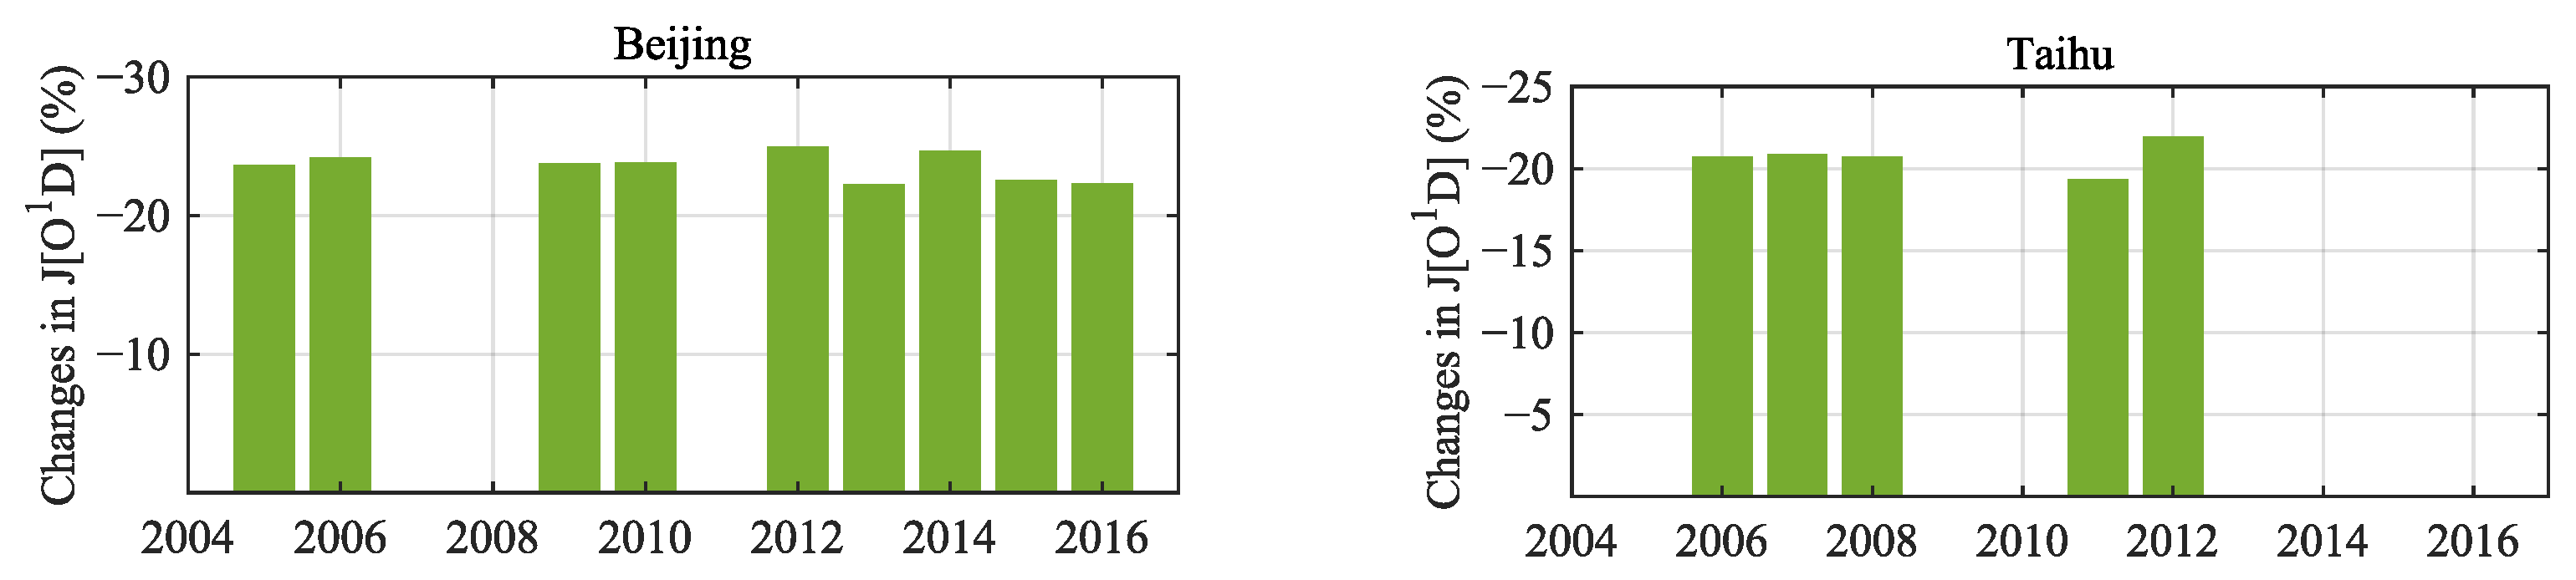
3.3.3. Interannual Variations in the Impacts of Absorbing Aerosols on the in BTH and YRD

The variations in annual changes in photolysis rates of the Beijing and Taihu sites are shown in Figure 14. The interannual variations of both sites in photolysis rates were in agreement with those in DRF (not shown). For the Beijing site, it was suggested that the photolysis rates were relatively lower in 2013 and 2015–2016, while the photolysis rates changes were approximately equal before 2010. For the Taihu site, the photolysis rates changes were approximately equal before 2008, while they decreased in 2011 and increased in 2012.
However, the interannual variations in AAOD of both sites were different to those in the changes in photolysis rates to certain extent. For instance, the AAOD in 2016 of the Beijing site was lower than the muti-year average, while the changes in the photolysis rates in 2006 were higher than the muti-year average. Additionally, the AAOD decreased since 2013, while the changes in the photolysis rates decreased since 2014. Such differences were probably caused by different surface albedo. The surface albedo of the Beijing site in 2006 was 0.14, lower than the muti-year average, leading to stronger negative DRF at the surface, and the surface albedo in 2013 was 0.16, which was about 0.03 higher than in 2014. Similarly, the maximum surface albedo of the Taihu site was in 2011, which was 0.06 higher than in 2012, and the minimum surface albedo was in 2006, which was 0.04 lower than in 2007. Overall, the existing discussion is theoretical, and more studies and observations will be needed to address these issues in the future.
Figure 14. Interannual variations of changes in the photolysis rate of O3 (J[O1D]) at the Beijing site and the Taihu site.
Remotesensing 15 02779 g014

4. Conclusions

Based on the ground-based measurements at 23 AERONET sites in East Asia, the optical properties of aerosols, UV DRF, and their effects on the near-surface photochemistry processes were investigated using the TUV model, and the main conclusions are as follows.
(1) The mean AOD of 330 nm band of sites in China, South Korea, and Japan was 1.15, 1.02, and 0.94, respectively, in which AAOD accounted for 8.61%, 6.69%, and 6.49%, respectively. As for the Beijing and Taihu sites, the AOD was 1.48 and 1.29 these figures were about 10.6 and 9.9 times higher than the corresponding AAOD, respectively. In BTH and YRD, the AOD was highest in summer due to the aerosols prone to moisture absorption growth and new particles generation under the high temperature and relative humidity condition, especially the fine and scattering aerosols with relatively high AE and SSA, while the AAOD was highest in winter as a result of the high anthropogenic emission rate.
(2) The influence of absorbing aerosols on the radiative forcing in the UV-A band was generally an order of magnitude stronger than that in the UV-B band, and the mean DRF at the TOA of the sites in China, South Korea, and Japan was 2.05, 1.45, and 1.35 W m−2, respectively. As for BTH and YRD, the UV-A DRF caused by absorbing aerosols at the TOA was 2.62 and 2.23 W m−2, respectively. The absorbing aerosols dominated by BC were further identified and analyzed according to the optical properties of aerosols. The reduction efficiency of absorbing aerosols dominated by BC on short-wave radiation was higher than that of other types of aerosols, as a result of a higher proportion of the DRF than optical depth of the BC-dominated absorbing aerosols to total aerosols.
(3) The absorbing aerosols could reduce the near-surface actinic flux and photolysis rates by absorbing solar radiation, and thus, the spatial and seasonal variations were closely related to the UV DRF. The near-surface J[NO2] (J[O1D]) decreased by 16.952% (22.42%), 9.61% (13.55%), and 9.63% (13.79%), respectively. As for BTH and YRD, the BC-dominated absorbing aerosols lead to the J[NO2] (J[O1D]) reduction of 14.90% (20.53%) and 13.71% (18.20%), respectively. The maximum photolysis rate generally appeared near noon due to the zenith angle, and thus, the reduction in photolysis rates between 10:00 and 14:00 was about 2–3% higher than the daily average.

Supplementary Materials

The following supporting information can be downloaded at: https://www.mdpi.com/article/10.3390/rs15112779/s1, Figure S1: Linear fitting relationship between DRF in the UVA band at the TOA induced by total absorbing aerosols ((a) and (b)), BC-dominated absorbing aerosols ((c) and (d)), and other absorbing aerosols ((e) and (f)) and corresponding AAOD at Beijing site ((a), (c), and (e)), and Taihu site ((b), (d), and (f)) color-coded with AAE. The linear fitting coefficients α and β are shown in the bottom right corner of each panel; Table S1: Seasonal averages of aerosol optical properties at Beijing and Taihu sites based on AERONET measurements; Table S2: Seasonal averages of DRF induced by BC-dominated absorbing and total aerosols and corresponding AAOD and AOD at Beijing site and Taihu site based on AERONET measurements. The abbreviations are for DRF induced by BC-dominated absorbing aerosols in the UVA band at the TOA (RF_absorb_TOA) and at the surface (RF_absorb_SRF), and for DRF induced by BC-dominated total aerosols in the UVA band at the TOA (RF_total_TOA) and at the surface (RF_total_SRF).

Author Contributions

All authors helped to review this manuscript; H.C. and B.Z. wrote the manuscript; Y.Z., Y.H., Y.G., W.W., H.L., Y.C., S.L., M.X. and M.L. helped to analyze the data; B.Z. and H.C. carried out the model calculation; J.L. and T.W. provided constructive comments on this study. All authors have read and agreed to the published version of the manuscript.

Funding

This work was supported by the National Natural Science Foundation of China, the National Key R&D Program of China, the Central University Basic Research Fund of China (42075099, 2019YFA0606803, 0207-14380169, 41675143, 42077192), and the Frontiers Science Center for Critical Earth Material Cycling of Nanjing University.

Data Availability Statement

The AERONET data are available at https://aeronet.gsfc.nasa.gov/ (accessed on 10 May 2023).

Acknowledgments

The authors thank the principal investigators and coinvestigators for daily maintenance of the instrument and providing the level 2.0 AERONET data.

Conflicts of Interest

The authors declare no conflict of interest.

References

  1. Zhao, X.J.; Zhao, P.S.; Xu, J.; Meng, W.; Pu, W.W.; Dong, F.; He, D.; Shi, Q.F. Analysis of a winter regional haze event and its formation mechanism in the North China Plain. Atmos. Chem. Phys. 2013, 13, 5685–5696. [Google Scholar] [CrossRef]
  2. He, J.; Gong, S.; Yu, Y.; Yu, L.; Wu, L.; Mao, H.; Song, C.; Zhao, S.; Liu, H.; Li, X. Air pollution characteristics and their relation to meteorological conditions during 2014–2015 in major Chinese cities. Environ. Pollut. 2017, 223, 484–496. [Google Scholar] [CrossRef] [PubMed]
  3. Wakamatsu, S.; Morikawa, T.; Ito, A. Air Pollution Trends in Japan between 1970 and 2012 and Impact of Urban Air Pollution Countermeasures. Asian J. Atmos. Environ. 2013, 7, 177–190. [Google Scholar] [CrossRef]
  4. Itahashi, S.; Hayami, H.; Shimadera, H.; Uno, I. The relationships between ground-based PM2.5 observation and space-borne aerosol optical depth. J. Jpn. Soc. Air Pollut. 2014, 49, 149–156. [Google Scholar]
  5. Qu, W.J.; Wang, J.; Zhang, X.Y.; Yang, Z.F.; Gao, S.H. Effect of cold wave on winter visibility over eastern China. J. Geophys. Res.-Atmos. 2015, 120, 2394–2406. [Google Scholar] [CrossRef]
  6. Chen, H.P.; Wang, H.J. Haze Days in North China and the associated atmospheric circulations based on daily visibility data from 1960 to 2012. J. Geophys. Res.-Atmos. 2015, 120, 5895–5909. [Google Scholar] [CrossRef]
  7. Li, M.; Hu, M.; Du, B.; Guo, Q.; Tan, T.; Zheng, J.; Huang, X.; He, L.; Wu, Z.; Guo, S. Temporal and spatial distribution of PM(2.5) chemical composition in a coastal city of Southeast China. Sci. Total Environ. 2017, 605–606, 337–346. [Google Scholar] [CrossRef]
  8. Song, C.; Wu, L.; Xie, Y.; He, J.; Chen, X.; Wang, T.; Lin, Y.; Jin, T.; Wang, A.; Liu, Y. Air pollution in China: Status and spatiotemporal variations. Environ. Pollut. 2017, 227, 334–347. [Google Scholar] [CrossRef]
  9. Yang, S.; Ma, Y.L.; Duan, F.K.; He, K.B.; Wang, L.T.; Wei, Z.; Zhu, L.D.; Ma, T.; Li, H.; Ye, S.Q. Characteristics and formation of typical winter haze in Handan, one of the most polluted cities in China. Sci. Total Environ. 2018, 613, 1367–1375. [Google Scholar] [CrossRef]
  10. Wang, J.Q.; Qu, W.J.; Li, C.; Zhao, C.H.; Zhong, X. Spatial distribution of wintertime air pollution in major cities over eastern China: Relationship with the evolution of trough, ridge and synoptic system over East Asia. Atmos. Res. 2018, 212, 186–201. [Google Scholar] [CrossRef]
  11. Yim, S.H.L.; Gu, Y.F.; Shapiro, M.; Stephens, B. Air quality and acid deposition impacts of local emissions and transboundary air pollution in Japan and South Korea. Atmos. Chem. Phys. 2019, 19, 13309–13323. [Google Scholar] [CrossRef]
  12. Zhang, Y.; Li, Y.; Guo, J.; Wang, Y.; Chen, D.; Chen, H. The climatology and trend of black carbon in China from 12-year ground observations. Clim. Dynam. 2019, 53, 5881–5892. [Google Scholar] [CrossRef]
  13. Zhang, Q.; Zheng, Y.; Tong, D.; Shao, M.; Wang, S.; Zhang, Y.; Xu, X.; Wang, J.; He, H.; Liu, W.; et al. Drivers of improved PM2.5 air quality in China from 2013 to 2017. Proc. Natl. Acad. Sci. USA 2019, 116, 24463–24469. [Google Scholar] [CrossRef]
  14. Yamagami, M.; Ikemori, F.; Nakashima, H.; Hisatsune, K.; Ueda, K.; Wakamatsu, S.; Osada, K. Trends in PM2.5 Concentration in Nagoya, Japan, from 2003 to 2018 and Impacts of PM2.5 Countermeasures. Atmosphere 2021, 12, 590–605. [Google Scholar] [CrossRef]
  15. Pope, C.A., 3rd; Dockery, D.W. Health effects of fine particulate air pollution: Lines that connect. J. Air Waste Manag. Assoc. 2006, 56, 709–742. [Google Scholar] [CrossRef]
  16. Takebayashi, T.; Asakura, K.; Yamada, M. Exposure to PM2.5 and Effects on Human Health: Implications for Health Risk Assessment in Japan. J. Jpn. Soc. Air Pollut. 2011, 46, 70–76. [Google Scholar]
  17. Wang, X.; Mauzerall, D.L. Evaluating impacts of air pollution in China on public health: Implications for future air pollution and energy policies. Atmos. Environ. 2006, 40, 1706–1721. [Google Scholar] [CrossRef]
  18. Cheng, Z.; Wang, S.; Jiang, J.; Fu, Q.; Chen, C.; Xu, B.; Yu, J.; Fu, X.; Hao, J. Long-term trend of haze pollution and impact of particulate matter in the Yangtze River Delta, China. Environ. Pollut. 2013, 182, 101–110. [Google Scholar] [CrossRef]
  19. Xu, P.; Chen, Y.; Ye, X. Haze, air pollution, and health in China. Lancet 2013, 382, 2067. [Google Scholar] [CrossRef]
  20. Xie, Y.B.; Chen, J.; Li, W. An assessment of PM2.5 related health risks and impaired values of Beijing residents in a consecutive high-level exposure during heavy haze days. Environ. Sci. 2014, 35, 1–8, (In Chinese with English abstract). [Google Scholar]
  21. Zhou, P.; Guo, J.; Zhou, X.; Zhang, W.; Liu, L.; Liu, Y.; Lin, K. PM2.5, PM10 and health risk assessment of heavy metals in a typical printed circuit noards manufacturing workshop. J. Environ. Sci. 2014, 26, 2018–2026. [Google Scholar] [CrossRef] [PubMed]
  22. Mehmood, K.; Wu, Y.; Wang, L.; Yu, S.; Seinfeld, J.H. Relative effects of open biomass burning and open crop straw burning on haze formation over central and eastern China: Modeling study driven by constrained emissions. Atmos. Chem. Phys. 2020, 20, 2419–2443. [Google Scholar] [CrossRef]
  23. Xie, X.; Wang, T.; Yue, X.; Li, S.; Zhuang, B.; Wang, M. Effects of atmospheric aerosols on terrestrial carbon fluxes and CO2 concentrations in China. Atmos. Res. 2020, 237, 104859. [Google Scholar] [CrossRef]
  24. Chylek, P.; Wong, J. Effect of absorbing aerosols on global radiation budget. Geophys. Res. Lett. 1995, 22, 929–931. [Google Scholar] [CrossRef]
  25. Gadhavi, H.; Jayaraman, A. Absorbing aerosols: Contribution of biomass burning and implications for radiative forcing. Ann. Geophys. 2010, 28, 103–111. [Google Scholar] [CrossRef]
  26. Meier, J.; Tegen, I.; Heinold, B.; Wolke, R. Direct and semi-direct radiative effects of absorbing aerosols in Europe: Results from a regional model. Geophys. Res. Lett. 2012, 39, L0982. [Google Scholar] [CrossRef]
  27. Wang, C. Impact of anthropogenic absorbing aerosols on clouds and precipitation: A review of recent progresses. Atmos. Res. 2013, 122, 237–249. [Google Scholar] [CrossRef]
  28. Sanap, S.D.; Pandithurai, G. The effect of absorbing aerosols on Indian monsoon circulation and rainfall: A review. Atmos. Res. 2015, 164, 318–327. [Google Scholar] [CrossRef]
  29. Zhuang, B.L.; Wang, T.J.; Liu, J.N.E.; Che, H.Z.; Han, Y.; Fu, Y.; Li, S.; Xie, M.; Li, M.M.; Chen, P.L.; et al. The optical properties, physical properties and direct radiative forcing of urban columnar aerosols in the Yangtze River Delta, China. Atmos. Chem. Phys. 2018, 18, 1419–1436. [Google Scholar] [CrossRef]
  30. Zhuang, B.L.; Chen, H.M.; Li, S.; Wang, T.J.; Liu, J.; Zhang, L.J.; Liu, H.N.; Xie, M.; Chen, P.L.; Li, M.M.; et al. The direct effects of black carbon aerosols from different source sectors in East Asia in summer. Clim. Dynam. 2019, 53, 5293–5310. [Google Scholar] [CrossRef]
  31. Chen, H.; Zhuang, B.; Liu, J.; Li, S.; Wang, T.; Xie, X.; Xie, M.; Li, M.; Zhao, M. Regional Climate Responses in East Asia to the Black Carbon Aerosol Direct Effects from India and China in Summer. J. Clim. 2020, 33, 9783–9800. [Google Scholar] [CrossRef]
  32. Schwartz, S.E. The whitehouse effect—Shortwave radiative forcing of climate by anthropogenic aerosols: An overview. J. Aerosol Sci. 1996, 27, 359–382. [Google Scholar] [CrossRef]
  33. Myhre, G.; Shindell, D.; Bréon, F.; Collins, W.; Zhang, H. Anthropogenic and Natural Radiative Forcing. In Climate Change 2013—The Physical Science Basis; Stocker, T.F., Qin, D., Plattner, G.-K., Tignor, M., Allen, S.K., Boschung, J., Nauels, A., Xia, Y., Bex, V., Midgley, P.M., Eds.; Cambridge University Press: Cambridge, UK; New York, NY, USA, 2013; p. 1535. [Google Scholar]
  34. Jacobson, M.Z. Studying the effects of aerosols on vertical photolysis rate coefficient and temperature profiles over an urban airshed. J. Geophys. Res. Atmos. 1998, 103, 10593–10604. [Google Scholar] [CrossRef]
  35. He, S.; Carmichael, G.R. Sensitivity of photolysis rates and ozone production in the troposphere to aerosol properties. J. Geophys. Res. Atmos. 1999, 104, 26307–26324. [Google Scholar] [CrossRef]
  36. Bellouin, N.; Boucher, O.; Tanré, D.; Dubovik, O. Aerosol absorption over the clear-sky oceans deduced from POLDER-1 and AERONET observations. Geophys. Res. Lett. 2003, 30, 1748–1754. [Google Scholar] [CrossRef]
  37. Liao, H. Interactions between tropospheric chemistry and aerosols in a unified general circulation model. J. Geophys. Res. 2003, 108, AAC 1-1–AAC 1-23. [Google Scholar] [CrossRef]
  38. Wu, Y.F.; Zhang, R.J.; Pu, Y.F.; Zhang, L.M.; Ho, K.F.; Fu, C.B. Aerosol Optical Properties Observed at a Semi-Arid Rural Site in Northeastern China. Aerosol Air Qual. Res. 2012, 12, 503–514. [Google Scholar] [CrossRef]
  39. Wang, T.J.; Zhuang, B.L.; Li, S.; Liu, J.; Xie, M.; Yin, C.Q.; Zhang, Y.; Yuan, C.; Zhu, J.L.; Ji, L.Q.; et al. The interactions between anthropogenic aerosols and the East Asian summer monsoon using RegCCMS. J. Geophys. Res. Atmos. 2015, 120, 5602–5621. [Google Scholar] [CrossRef]
  40. Zhuang, B.L.; Li, S.; Wang, T.J.; Liu, J.; Chen, H.M.; Chen, P.L.; Li, M.M.; Xie, M. Interaction between the Black Carbon Aerosol Warming Effect and East Asian Monsoon Using RegCM4. J. Clim. 2018, 31, 9367–9388. [Google Scholar] [CrossRef]
  41. Masson-Delmotte, V.; Zhai, P.; Pirani, A.; Connors, S.L.; Péan, C.; Berger, S.; Caud, N.; Chen, Y.; Goldfarb, L.; Gomis, M.I. (Eds.) IPCC, 2021: Summary for Policymakers. In Climate Change 2021: The Physical Science Basis Contribution of Working Group I to the Sixth Assessment Report of the Intergovernmental Panel on Climate Change; Cambridge University Press: Cambridge, UK; New York, NY, USA, 2021; pp. 3–32. [Google Scholar] [CrossRef]
  42. Bond, T.C.; Doherty, S.J.; Fahey, D.W.; Forster, P.M.; Berntsen, T.; DeAngelo, B.J.; Flanner, M.G.; Ghan, S.; Kärcher, B.; Koch, D.; et al. Bounding the role of black carbon in the climate system: A scientific assessment. J. Geophys. Res. Atmos. 2013, 118, 5380–5552. [Google Scholar] [CrossRef]
  43. Zhang, X.Y.; Wang, Y.Q.; Niu, T.; Zhang, X.C.; Gong, S.L.; Zhang, Y.M.; Sun, J.Y. Atmospheric aerosol compositions in China: Spatial/temporal variability, chemical signature, regional haze distribution and comparisons with global aerosols. Atmos. Chem. Phys. 2012, 12, 779–799. [Google Scholar] [CrossRef]
  44. Zhuang, B.; Liu, Q.; Wang, T.; Yin, C.; Li, S.; Xie, M.; Jiang, F.; Mao, H. Investigation on semi-direct and indirect climate effects of fossil fuel black carbon aerosol over China. Theor. Appl. Climatol. 2013, 114, 651–672. [Google Scholar] [CrossRef]
  45. Zhuang, B.L.; Wang, T.J.; Li, S.; Liu, J.; Talbot, R.; Mao, H.T.; Yang, X.Q.; Fu, C.B.; Yin, C.Q.; Zhu, J.L.; et al. Optical properties and radiative forcing of urban aerosols in Nanjing, China. Atmos. Environ. 2014, 83, 43–52. [Google Scholar] [CrossRef]
  46. Li, K.; Liao, H.; Mao, Y.; Ridley, D.A. Source sector and region contributions to concentration and direct radiative forcing of black carbon in China. Atmos. Environ. 2016, 124, 351–366. [Google Scholar] [CrossRef]
  47. Golden, D.M.; Manion, J. Applications of chemical kinetics. In Advances in Chemical Kinetics Dynamics; JAI Press: Greenwich, UK, 1992. [Google Scholar]
  48. Fenidel, W.; Matter, D.; Burtscher, H.; Schmidt-Ott, A. Interaction between carbon or iron aerosol particles and ozone. Atmos. Environ. 1995, 29, 967–973. [Google Scholar] [CrossRef]
  49. Ding, J.; Zhu, T. Heterogeneous reactions on the surface of fine particles in the atmosphere. Chin. Sci. Bull. 2003, 48, 2005–2013+2267–2276, (In Chinese with English abstract). [Google Scholar] [CrossRef]
  50. Martin, R.V.; Jacob, D.J.; Yantosca, R.M.; Chin, M.; Ginoux, P. Global and regional decreases in tropospheric oxidants from photochemical effects of aerosols. J. Geophys. Res. Atmos. 2003, 108, 4097–4115. [Google Scholar] [CrossRef]
  51. Evans, M.J.; Jacob, D.J. Impact of New Laboratory Studies of N2O5 Hydrolysis on Global Model Budgets of Tropospheric Nitrogen Oxides, Ozone, and OH. Geophys. Res. Lett. 2005, 32, 297–314. [Google Scholar] [CrossRef]
  52. Bian, H.; Han, S.; Tie, X.; Sun, M.; Liu, A. Evidence of impact of aerosols on surface ozone concentration in Tianjin, China. Atmos. Environ. 2007, 41, 4672–4681. [Google Scholar] [CrossRef]
  53. Pfister, G.G.; Wiedinmyer, C.; Emmons, L.K. Impacts of the fall 2007 California wildfires on surface ozone: Integrating local observations with global model simulations. Geophys. Res. Lett. 2008, 35, L19814–L19818. [Google Scholar] [CrossRef]
  54. Real, E.; Sartelet, K. Modeling of photolysis rates over Europe: Impact on chemical gaseous species and aerosols. Atmos. Chem. Phys. 2011, 11, 1711–1727. [Google Scholar] [CrossRef]
  55. Jaffe, D.A.; Wigder, N.; Downey, N.; Pfister, G.; Boynard, A.; Reid, S.B. Impact of wildfires on ozone exceptional events in the Western U.S. Environ. Sci. Technol. 2013, 47, 11065–11072. [Google Scholar] [CrossRef]
  56. Arnold, S.R.; Emmons, L.K.; Monks, S.A.; Law, K.S.; Ridley, D.A.; Turquety, S.; Tilmes, S.; Thomas, J.L.; Bouarar, I.; Flemming, J.; et al. Biomass burning influence on high-latitude tropospheric ozone and reactive nitrogen in summer 2008: A multi-model analysis based on POLMIP simulations. Atmos. Chem. Phys. 2015, 15, 6047–6068. [Google Scholar] [CrossRef]
  57. Li, K.; Jacob, D.J.; Liao, H.; Zhu, J.; Shah, V.; Shen, L.; Bates, K.H.; Zhang, Q.; Zhai, S. A two-pollutant strategy for improving ozone and particulate air quality in China. Nat. Geosci. 2019, 12, 906–910. [Google Scholar] [CrossRef]
  58. Dickerson, R.R.; Kondragunta, S.; Stenchikov, G.; Civerolo, K.L.; Doddridge, B.G.; Holben, B.N. The impact of aerosols on solar ultraviolet radiation and photochemical smog. Science 1997, 278, 827–830. [Google Scholar] [CrossRef]
  59. Liao, H.; Yung, Y.L.; Seinfeld, J.H. Effects of aerosols on tropospheric photolysis rates in clear and cloudy atmospheres. J. Geophys. Res. Atmos. 1999, 104, 23697–23707. [Google Scholar] [CrossRef]
  60. Bian, H.S.; Zender, C.S. Mineral dust and global tropospheric chemistry: Relative roles of photolysis and heterogeneous uptake. J. Geophys. Res.-Atmos. 2003, 108, 4672–4685. [Google Scholar] [CrossRef]
  61. Li, G.H.; Zhang, R.Y.; Fan, J.W.; Tie, X.X. Impacts of black carbon aerosol on photolysis and ozone. J. Geophys. Res.-Atmos. 2005, 110, 206–215. [Google Scholar] [CrossRef]
  62. Astitha, M.; Kallos, G. Gas-phase and aerosol chemistry interactions in South Europe and the Mediterranean region. Environ. Fluid Mech. 2008, 9, 3–22. [Google Scholar] [CrossRef]
  63. Ying, Z.; Tie, X.; Madronich, S.; Li, G.; Massie, S. Simulation of regional dust and its effect on photochemistry in the Mexico City area during MILAGRO experiment. Atmos. Environ. 2011, 45, 2549–2558. [Google Scholar] [CrossRef]
  64. Li, M.; Wang, T.; Han, Y.; Xie, M.; Li, S.; Zhuang, B.; Chen, P. Modeling of a severe dust event and its impacts on ozone photochemistry over the downstream Nanjing megacity of eastern China. Atmos. Environ. 2017, 160, 107–123. [Google Scholar] [CrossRef]
  65. Li, J.; Wang, W.-C.; Liao, H.; Chang, W. Past and future direct radiative forcing of nitrate aerosol in East Asia. Theor. Appl. Climatol. 2014, 121, 445–458. [Google Scholar] [CrossRef]
  66. Xu, J.W.; Tao, J.; Zhang, R.J.; Cheng, T.T.; Leng, C.P.; Chen, J.M.; Huang, G.H.; Li, X.; Zhu, Z.Q. Measurements of surface aerosol optical properties in winter of Shanghai. Atmos. Res. 2012, 109, 25–35. [Google Scholar] [CrossRef]
  67. Lou, S.; Liao, H.; Zhu, B. Impacts of aerosols on surface-layer ozone concentrations in China through heterogeneous reactions and changes in photolysis rates. Atmos. Environ. 2014, 85, 123–138. [Google Scholar] [CrossRef]
  68. Tie, X. Assessment of the global impact of aerosols on tropospheric oxidants. J. Geophys. Res. 2005, 110, 204–235. [Google Scholar] [CrossRef]
  69. Tang, Y.; Han, Y.; Ma, X.; Liu, Z. Elevated heat pump effects of dust aerosol over Northwestern China during summer. Atmos. Res. 2018, 203, 95–104. [Google Scholar] [CrossRef]
  70. Tian, R.; Ma, X.; Jia, H.; Yu, F.; Sha, T.; Zan, Y. Aerosol radiative effects on tropospheric photochemistry with GEOS-Chem simulations. Atmos. Environ. 2019, 208, 82–94. [Google Scholar] [CrossRef]
  71. Castro, T.; Madronich, S.; Rivale, S.; Muhlia, A.; Mar, B. The influence of aerosols on photochemical smog in Mexico City. Atmos. Environ. 2001, 35, 1765–1772. [Google Scholar] [CrossRef]
  72. Lv, H.; An, J.L.; Su, X.Q.; Zhu, B.; Shi, S.S. Study on the influence of black carbon aerosol on photolysis coefficient in northern suburb of Nanjing. China Environ. Sci. 2020, 40, 1421–1428, (In Chinese with English abstract). [Google Scholar]
  73. Xu, J.; Bergin, M.H.; Greenwald, R.; Russell, P.B. Direct aerosol radiative forcing in the Yangtze delta region of China: Observation and model estimation. J. Geophys. Res.-Atmos. 2003, 108, ACL 4-1–PEM 8-27. [Google Scholar] [CrossRef]
  74. Bergin, M.H.; Cass, G.R.; Xu, J.; Fang, C.; Zeng, L.M.; Yu, T.; Salmon, L.G.; Kiang, C.S.; Tang, X.Y.; Zhang, Y.H.; et al. Aerosol radiative, physical, and chemical properties in Beijing during June 1999. J. Geophys. Res.-Atmos. 2001, 106, 17969–17980. [Google Scholar] [CrossRef]
  75. Xu, J.; Bergin, M.H.; Yu, X.; Liu, G.; Zhao, J.; Carrico, C.M.; Baumann, K. Measurement of aerosol chemical, physical and radiative properties in the Yangtze delta region of China. Atmos. Environ. 2002, 36, 161–173. [Google Scholar] [CrossRef]
  76. Yan, P.; Tang, J.; Huang, J.; Mao, J.T.; Zhou, X.J.; Liu, Q.; Wang, Z.F.; Zhou, H.G. The measurement of aerosol optical properties at a rural site in Northern China. Atmos. Chem. Phys. 2008, 8, 2229–2242. [Google Scholar] [CrossRef]
  77. He, X.; Li, C.C.; Lau, A.K.H.; Deng, Z.Z.; Mao, J.T.; Wang, M.H.; Liu, X.Y. An intensive study of aerosol optical properties in Beijing urban area. Atmos. Chem. Phys. 2009, 9, 8903–8915. [Google Scholar] [CrossRef]
  78. Fan, X.H.; Chen, H.B.; Xia, X.G.; Li, Z.Q.; Cribb, M. Aerosol optical properties from the Atmospheric Radiation Measurement Mobile Facility at Shouxian, China. J. Geophys. Res.-Atmos. 2010, 115, D00K33–D00K45. [Google Scholar] [CrossRef]
  79. Yu, X.; Ma, J.; Raghavendra Kumar, K.; Zhu, B.; An, J.; He, J.; Li, M. Measurement and analysis of surface aerosol optical properties over urban Nanjing in the Chinese Yangtze River Delta. Sci. Total Environ. 2016, 542, 277–291. [Google Scholar] [CrossRef]
  80. Deng, J.; Zhang, Y.; Hong, Y.; Xu, L.; Chen, Y.; Du, W.; Chen, J. Optical properties of PM2.5 and the impacts of chemical compositions in the coastal city Xiamen in China. Sci. Total Environ. 2016, 557–558, 665–675. [Google Scholar] [CrossRef]
  81. Zhuang, B.L.; Wang, T.J.; Liu, J.; Li, S.; Xie, M.; Han, Y.; Chen, P.L.; Hu, Q.D.; Yang, X.Q.; Fu, C.B.; et al. The surface aerosol optical properties in the urban area of Nanjing, west Yangtze River Delta, China. Atmos. Chem. Phys. 2017, 17, 1143–1160. [Google Scholar] [CrossRef]
  82. Chiang, C.W.; Chen, W.N.; Liang, W.A.; Das, S.K.; Nee, J.B. Optical properties of tropospheric aerosols based on measurements of lidar, sun-photometer, and visibility at Chung-Li (25°N, 121°E). Atmos. Environ. 2007, 41, 4128–4137. [Google Scholar] [CrossRef]
  83. Pan, L.A.; Che, H.Z.; Geng, F.H.; Xia, X.G.; Wang, Y.Q.; Zhu, C.Z.; Chen, M.; Gao, W.; Guo, J.P. Aerosol optical properties based on ground measurements over the Chinese Yangtze Delta Region. Atmos. Environ. 2010, 44, 2587–2596. [Google Scholar] [CrossRef]
  84. Zhao, H.J.; Che, H.Z.; Zhang, X.Y.; Ma, Y.J.; Wang, Y.F.; Wang, X.X.; Liu, C.; Hou, B.; Che, H.C. Aerosol optical properties over urban and industrial region of Northeast China by using ground-based sun-photometer measurement. Atmos. Environ. 2013, 75, 270–278. [Google Scholar] [CrossRef]
  85. Zhu, J.; Che, H.Z.; Xia, X.G.; Chen, H.B.; Goloub, P.; Zhang, W.X. Column-integrated aerosol optical and physical properties at a regional background atmosphere in North China Plain. Atmos. Environ. 2014, 84, 54–64. [Google Scholar] [CrossRef]
  86. Che, H.; Zhang, X.Y.; Xia, X.; Goloub, P.; Holben, B.; Zhao, H.; Wang, Y.; Zhang, X.C.; Wang, H.; Blarel, L.; et al. Ground-based aerosol climatology of China: Aerosol optical depths from the China Aerosol Remote Sensing Network (CARSNET) 2002–2013. Atmos. Chem. Phys. 2015, 15, 7619–7652. [Google Scholar] [CrossRef]
  87. Che, H.Z.; Qi, B.; Zhao, H.J.; Xia, X.G.; Eck, T.F.; Goloub, P.; Dubovik, O.; Estelles, V.; Cuevas-Agullo, E.; Blarel, L.; et al. Aerosol optical properties and direct radiative forcing based on measurements from the China Aerosol Remote Sensing Network (CARSNET) in eastern China. Atmos. Chem. Phys. 2018, 18, 405–425. [Google Scholar] [CrossRef]
  88. Yu, J.; Che, H.Z.; Chen, Q.L.; Xia, X.G.; Zhao, H.J.; Wang, H.; Wang, Y.Q.; Zhang, X.Y.; Shi, G.Y. Investigation of Aerosol Optical Depth (AOD) and Angstrom Exponent over the Desert Region of Northwestern China Based on Measurements from the China Aerosol Remote Sensing Network (CARSNET). Aerosol Air Qual. Res. 2015, 15, 2024–2036. [Google Scholar] [CrossRef]
  89. Xia, X.; Che, H.; Zhu, J.; Chen, H.; Cong, Z.; Deng, X.; Fan, X.; Fu, Y.; Goloub, P.; Jiang, H.; et al. Ground-based remote sensing of aerosol climatology in China: Aerosol optical properties, direct radiative effect and its parameterization. Atmos. Environ. 2016, 124, 243–251. [Google Scholar] [CrossRef]
  90. Zheng, Y.; Che, H.Z.; Zhao, T.L.; Xia, X.G.; Gui, K.; An, L.C.; Qi, B.; Wang, H.; Wang, Y.Q.; Yu, J.; et al. Aerosol Optical Properties over Beijing during the World Athletics Championships and Victory Day Military Parade in August and September 2015. Atmosphere 2016, 7, 47. [Google Scholar] [CrossRef]
  91. Qi, B.; Hu, D.Y.; Che, H.Z.; Du, R.G.; Wu, Y.F.; Xia, X.G.; Zha, B.; Liu, J.; Niu, Y.W.; Wang, H.; et al. Seasonal Variation of Aerosol Optical Properties in an Urban Site of the Yangtze Delta Region of China. Aerosol Air Qual. Res. 2016, 16, 2884–2896. [Google Scholar] [CrossRef]
  92. Markowicz, K.M.; Flatau, P.J.; Remiszewska, J.; Witek, M.; Reid, E.A.; Reid, J.S.; Bucholtz, Z.; Hilben, B. Observations and modeling of the surface aerosol radiative forcing during UAE. J. Atmos. Sci. 2008, 65, 2877–2891. [Google Scholar] [CrossRef]
  93. Kuhlmann, J.; Quaas, J. How can aerosols affect the Asian summer monsoon? Assessment during three consecutive pre-monsoon seasons from CALIPSO satellite data. Atmos. Chem. Phys. 2010, 10, 4673–4688. [Google Scholar] [CrossRef]
  94. Xia, X.; Li, Z.; Holben, B.; Wang, P.; Eck, T.; Chen, H.; Cribb, M.; Zhao, Y. Aerosol optical properties and radiative effects in the Yangtze Delta region of China. J. Geophys. Res. 2007, 112, S12–S27. [Google Scholar] [CrossRef]
  95. Kim, S.W.; Yoon, S.C.; Kim, J.; Kim, S.Y. Seasonal and monthly variations of columnar aerosol optical properties over east Asia determined from multi-year MODIS, LIDAR, and AERONET Sun/sky radiometer measurements. Atmos. Environ. 2007, 41, 1634–1651. [Google Scholar] [CrossRef]
  96. Lee, K.; Chung, C.E. Observationally-constrained estimates of global fine-mode AOD. Atmos. Chem. Phys. 2013, 13, 2907–2921. [Google Scholar] [CrossRef]
  97. Panicker, A.S.; Lee, D.I.; Kumkar, Y.V.; Kim, D.; Maki, M.; Uyeda, H. Decadal climatological trends of aerosol optical parameters over three different environments in South Korea. Int. J. Climatol. 2013, 33, 1909–1916. [Google Scholar] [CrossRef]
  98. Alam, K.; Trautmann, T.; Blaschke, T.; Subhan, F. Changes in aerosol optical properties due to dust storms in the Middle East and Southwest Asia. Remote Sens. Environ. 2014, 143, 216–227. [Google Scholar] [CrossRef]
  99. Cheng, T.T.; Xu, C.; Duan, J.Y.; Wang, Y.F.; Leng, C.P.; Tao, J.; Che, H.Z.; He, Q.S.; Wu, Y.F.; Zhang, R.J.; et al. Seasonal variation and difference of aerosol optical properties in columnar and surface atmospheres over Shanghai. Atmos. Environ. 2015, 123, 315–326. [Google Scholar] [CrossRef]
  100. Bi, J.R.; Huang, J.P.; Holben, B.; Zhang, G.L. Comparison of key absorption and optical properties between pure and transported anthropogenic dust over East and Central Asia. Atmos. Chem. Phys. 2016, 16, 15501–15516. [Google Scholar] [CrossRef]
  101. Yu, J.; Che, H.Z.; Chen, Q.L.; Zhu, J.; Gui, K.; Zheng, Y. Characteristics Analysis of Aerosol on Dust Weather Cases in Northwestern China from 2010 to 2012. Meteorol. Environ. Sci. 2016, 262, 33–40, (In Chinese with English abstract). [Google Scholar]
  102. Xiao, Q.; Zhang, H.; Choi, M.; Li, S.; Kondragunta, S.; Kim, J.; Holben, B.; Levy, R.C.; Liu, Y. Evaluation of VIIRS, GOCI, and MODIS Collection 6 AOD retrievals against ground sunphotometer observations over East Asia. Atmos. Chem. Phys. 2016, 16, 1255–1269. [Google Scholar] [CrossRef]
  103. Kang, N.; Kumar, K.R.; Yu, X.; Yin, Y. Column-integrated aerosol optical properties and direct radiative forcing over the urban-industrial megacity Nanjing in the Yangtze River Delta, China. Environ. Sci. Pollut. Res. 2016, 23, 17532–17552. [Google Scholar] [CrossRef]
  104. Lin, J.; Zheng, Y.; Shen, X.; Xing, L.; Che, H. Global Aerosol Classification Based on Aerosol Robotic Network (AERONET) and Satellite Observation. Remote Sens. 2021, 13, 1114–1136. [Google Scholar] [CrossRef]
  105. Wang, M.X.; Zhang, R.J.; Pu, Y.F. Recent researches on aerosol in China. Adv. Atmos. Sci. 2001, 18, 576–586. [Google Scholar]
  106. Li, Z.Q. Aerosol and climate: A perspective from East Asia. In Observation, Theory and Modeling of Atmospheric Variability; World Scientific: Hackensack, NJ, USA, 2001; pp. 501–525. [Google Scholar]
  107. Mao, J.T.; Li, C.C. Observation study on aerosol radiative properties over China. Acta Meteorol. Sin. 2005, 20, 306–321, (In Chinese with English abstract). [Google Scholar]
  108. Madronich, S. Environmental Effects of UV; Tevini, M., Ed.; CRC Press: Boca Raton, FL, USA, 1993. [Google Scholar]
  109. Holben, B.N.; Eck, T.F.; Slutsker, I.; Tanre, D.; Buis, J.P.; Setzer, A.; Vermote, E.; Reagan, J.A.; Kaufman, Y.J.; Nakajima, T.; et al. AERONET—A federated instrument network and data archive for aerosol characterization. Remote Sens. Environ. 1998, 66, 1–16. [Google Scholar] [CrossRef]
  110. Smirnov, A.; Holben, B.N.; Eck, T.F.; Dubovik, O.; Slutsker, I. Cloud-Screening and Quality Control Algorithms for the AERONET Database. Remote Sens. Environ. 2000, 73, 337–349. [Google Scholar] [CrossRef]
  111. Dubovik, O.; King, M.D. A flexible inversion algorithm for retrieval of aerosol optical properties from Sun and sky radiance measurements. J. Geophys. Res. Atmos. 2000, 105, 20673–20696. [Google Scholar] [CrossRef]
  112. Dubovik, O.; Sinyuk, A.; Lapyonok, T.; Holben, B.N.; Mishchenko, M.; Yang, P.; Eck, T.F.; Volten, H.; Muñoz, O.; Veihelmann, B.; et al. Application of spheroid models to account for aerosol particle nonsphericity in remote sensing of desert dust. J. Geophys. Res. 2006, 111, 208–241. [Google Scholar] [CrossRef]
  113. Eck, T.F.; Holben, B.N.; Reid, J.S.; Dubovik, O.; Smirnov, A.; O’Neill, N.T.; Slutsker, I.; Kinne, S. Wavelength dependence of the optical depth of biomass burning, urban, and desert dust aerosols. J. Geophys. Res. Atmos. 1999, 104, 31333–31349. [Google Scholar] [CrossRef]
  114. Chin, M.; Ginoux, P.; Kinne, S.; Torres, O.; Holben, B.N.; Duncan, B.N.; Martin, R.V.; Logan, J.A.; Higurashi, A.; Nakajima, T. Tropospheric aerosol optical thickness from the GOCART model and comparisons with satellite and Sun photometer measurements. J. Atmos. Sci. 2002, 59, 461–483. [Google Scholar] [CrossRef]
  115. Remer, L.A.; Kaufman, Y.J.; Tanre, D.; Mattoo, S.; Chu, D.A.; Martins, J.V.; Li, R.R.; Ichoku, C.; Levy, R.C.; Kleidman, R.G.; et al. The MODIS aerosol algorithm, products, and validation. J. Atmos. Sci. 2005, 62, 947–973. [Google Scholar] [CrossRef]
  116. Korras-Carraca, M.B.; Hatzianastassiou, N.; Matsoukas, C.; Gkikas, A.; Papadimas, C.D. The regime of aerosol asymmetry parameter over Europe, the Mediterranean and the Middle East based on MODIS satellite data: Evaluation against surface AERONET measurements. Atmos. Chem. Phys. 2015, 15, 13113–13132. [Google Scholar] [CrossRef]
  117. Angström, A. On the atmospheric transmission of sun radiation and on dust in the air. Geogr. Ann. 1929, 11, 156–166. [Google Scholar]
  118. D’Allura, A.; Kulkarni, S.; Carmichael, G.R.; Finardi, S.; Adhikary, B.; Wei, C.; Streets, D.; Zhang, Q.; Pierce, R.B.; Al-Saadi, J.A.; et al. Meteorological and air quality forecasting using the WRF–STEM model during the 2008ARCTAS field campaign. Atmos. Environ. 2011, 45, 6901–6910. [Google Scholar] [CrossRef]
  119. Ryu, Y.H.; Hodzic, A.; Barre, J.; Descombes, G.; Minnis, P. Quantifying errors in surface ozone predictions associated with clouds over the CONUS: A WRF-Chem modeling study using satellite cloud retrievals. Atmos. Chem. Phys. 2018, 18, 7509–7525. [Google Scholar] [CrossRef]
  120. Shalaby, A.; Zakey, A.S.; Tawfik, A.B.; Solmon, F.; Giorgi, F.; Stordal, F.; Sillman, S.; Zaveri, R.A.; Steiner, A.L. Implementation and evaluation of online gas-phase chemistry within a regional climate model (RegCM-CHEM4). Geosci. Model Dev. 2012, 5, 741–760. [Google Scholar] [CrossRef]
  121. Deng, X.; Tie, X.; Wu, D.; Bi, X.; Tan, H.; Li, F.; Jiang, C.; Xia, D. Study on the influence of aerosol on actinic flux and ozone in megecities (II)—Analysis of Numerical experiment. Guangdong Meterol. 2006, 28, 5–11, (In Chinese with an English abstract). [Google Scholar]
  122. Palancar, G.G.; Lefer, B.L.; Hall, S.R.; Shaw, W.J.; Corr, C.A.; Herndon, S.C.; Slusser, J.R.; Madronich, S. Effect of aerosols and NO2 concentration on ultraviolet actinic flux near Mexico City during MILAGRO: Measurements and model calculations. Atmos. Chem. Phys. 2013, 12, 19243–19275. [Google Scholar]
  123. Lingaswamy, A.P.; Arafath, S.M.; Balakrishnaiah, G.; Gopal, K.R.; Siva, K.; Raja, O.; Reddy, R.R.; Rao, T.C. Observations of trace gases, photolysis rate coefficients and model simulations over semi-arid region, India. Atmos. Environ. 2017, 158, 246–258. [Google Scholar] [CrossRef]
  124. Deng, X.; Zhou, X.; Wu, D.; Tie, X.X.; Li, F.; Tan, H.; Bi, X.; Deng, T.; Jiang, D. Characterization of actinic flux and irradiances over Guangzhou region. China Environ. Sci. 2010, 30, 893–899, (In Chinese with an English abstract). [Google Scholar]
  125. Tan, H.; Li, F.; Tie, X.; Wu, D.; Deng, T.; Zhou, X.; Deng, X. Attenuation of atmospheric aerosols to the surface ultraviolet radiation in Guangzhou. Chin. Sci. Bull. 2012, 57, 1684–1691, (In Chinese with an English abstract). [Google Scholar]
  126. Mayer, B.; Fischer, C.A.; Madronich, S. Estimation of surface actinic flux from satellite (TOMS) ozone and cloud reflectivity measurements. Geophys. Res. Lett. 2013, 25, 4321–4324. [Google Scholar] [CrossRef]
  127. Palancar, G.G.; Toselli, B.M. Effects of meteorology and tropospheric aerosols on UV-B radiation: A 4-year study. Atmos. Environ. 2004, 118, 2749–2757. [Google Scholar] [CrossRef]
  128. Li, J.; Carlson, B.E.; Lacis, A.A. Using single-scattering albedo spectral curvature to characterize East Asian aerosol mixtures. J. Geophys. Res.-Atmos. 2015, 120, 2037–2052. [Google Scholar] [CrossRef]
  129. Eck, T.F.; Holben, B.N.; Sinyuk, A.; Pinker, R.T.; Goloub, P.; Chen, H.; Chatenet, B.; Li, Z.; Singh, R.P.; Tripathi, S.N.; et al. Climatological aspects of the optical properties of fine/coarse mode aerosol mixtures. J. Geophys. Res. 2010, 115, 205–224. [Google Scholar] [CrossRef]
  130. Li, S.; Wang, T.; Xie, M.; Han, Y.; Zhuang, B. Observed aerosol optical depth and angstrom exponent in urban area of Nanjing, China. Atmos. Environ. 2015, 123, 350–356. [Google Scholar] [CrossRef]
  131. Zhang, L.; Sun, J.Y.; Shen, X.J.; Zhang, Y.M.; Che, H.; Ma, Q.L.; Zhang, Y.W.; Zhang, X.Y.; Ogren, J.A. Observations of relative humidity effects on aerosol light scattering in the Yangtze River Delta of China. Atmos. Chem. Phys. 2015, 15, 8439–8454. [Google Scholar] [CrossRef]
  132. Schuster, G.L.; Dubovik, O.; Holben, B.N. Angstrom exponent and bimodal aerosol size distributions. J. Geophys. Res.-Atmos. 2006, 111, 207–220. [Google Scholar] [CrossRef]
  133. Smirnov, A.; Holben, B.N.; Kaufman, Y.J.; Dubovik, O.; Halthore, R.N. Optical Properties of Atmospheric Aerosol in Maritime Environments. J. Atmos. 2002, 59, 501. [Google Scholar] [CrossRef]
  134. Noh, Y.M.; Kim, Y.J.; Müller, D. Seasonal characteristics of lidar ratios measured with a Raman lidar at Gwangju, Korea in spring and autumn. Atmos. Environ. 2008, 42, 2208–2224. [Google Scholar] [CrossRef]
  135. Dey, S.; Di Girolamo, L. A climatology of aerosol optical and microphysical properties over the Indian subcontinent from 9 years (2000–2008) of Multiangle Imaging Spectroradiometer (MISR) data. J. Geophys. Res. Atmos. 2010, 115, D15204. [Google Scholar] [CrossRef]
  136. Russell, P.B.; Kacenelenbogen, M.; Livingston, J.M.; Hasekamp, O.P.; Burton, S.P.; Schuster, G.L.; Johnson, M.S.; Knobelspiesse, K.D.; Redemann, J.; Ramachandran, S.; et al. A multiparameter aerosol classification method and its application to retrievals from spaceborne polarimetry. J. Geophys. Res. Atmos. 2014, 119, 9838–9863. [Google Scholar] [CrossRef]
  137. Che, H.Z.; Zhao, H.J.; Wu, Y.F.; Xia, X.A.; Zhu, J.; Wang, H.; Wang, Y.Q.; Sun, J.Y.; Yu, J.; Zhang, X.Y.; et al. Analyses of aerosol optical properties and direct radiative forcing over urban and industrial regions in Northeast China. Meteorol. Atmos. Phys. 2015, 127, 345–354. [Google Scholar] [CrossRef]
  138. Shao, M.; Lu, S.; Liu, Y.; Xie, X.; Chang, C.; Huang, S.; Chen, Z. Volatile organic compounds measured in summer in Beijing and their role in ground-level ozone formation. J. Geophys. Res. 2009, 114, D00G06–D00G18. [Google Scholar] [CrossRef]
  139. Zhang, Q.; Streets, D.G.; Carmichael, G.R.; He, K.B.; Huo, H.; Kannari, A.; Klimont, Z.; Park, I.S.; Reddy, S.; Fu, J.S.; et al. Asian emissions in 2006 for the NASA INTEX-B mission. Atmos. Chem. Phys. 2009, 9, 5131–5153. [Google Scholar] [CrossRef]
  140. Zhang, R.J.; Cao, J.J.; Lee, S.C.; Shen, Z.X.; Ho, K.F. Carbonaceous aerosols in PM10 and pollution gases in winter in Beijing. J. Environ. Sci. 2007, 19, 564–571. [Google Scholar] [CrossRef]
  141. Li, M.; Zhang, Q.; Kurokawa, J.; Woo, J.H.; He, K.B.; Lu, Z.F.; Ohara, T.; Song, Y.; Streets, D.G.; Carmichael, G.R.; et al. MIX: A mosaic Asian anthropogenic emission inventory under the international collaboration framework of the MICS-Asia and HTAP. Atmos. Chem. Phys. 2017, 17, 935–963. [Google Scholar] [CrossRef]
  142. Chen, H.; Zhuang, B.; Liu, J.; Wang, T.; Li, S.; Xie, M.; Li, M.; Chen, P.; Zhao, M. Characteristics of ozone and particles in the near-surface atmosphere in the urban area of the Yangtze River Delta, China. Atmos. Chem. Phys. 2019, 19, 4153–4175. [Google Scholar] [CrossRef]
  143. Eck, T.F.; Holben, B.N.; Dubovik, O.; Smirnov, A.; Goloub, P.; Chen, H.B.; Chatenet, B.; Gomes, L.; Zhang, X.Y.; Tsay, S.C.; et al. Columnar aerosol optical properties at AERONET sites in central eastern Asia and aerosol transport to the tropical mid-Pacific. J. Geophys. Res. 2005, 110, D06202. [Google Scholar] [CrossRef]
  144. Bian, H.; Chin, M.; Rodriguez, J.M.; Yu, H.; Penner, J.E.; Strahan, S. Sensitivity of aerosol optical thickness and aerosol direct radiative effect to relative humidity. Atmos. Chem. Phys. 2009, 9, 2375–2386. [Google Scholar] [CrossRef]
  145. Li, W.J.; Shao, L.Y.; Buseck, P.R. Haze types in Beijing and the influence of agricultural biomass burning. Atmos. Chem. Phys. 2010, 10, 8119–8130. [Google Scholar] [CrossRef]
  146. Yan, P.; Pan, X.L.; Tang, J.; Zhou, X.J.; Zhang, R.J.; Zeng, L.M. Hygroscopic growth of aerosol scattering coefficient: A comparative analysis between urban and suburban sites at winter in Beijing. Particuology 2009, 7, 52–60. [Google Scholar] [CrossRef]
  147. Ding, A.J.; Fu, C.B.; Yang, X.Q.; Sun, J.N.; Zheng, L.F.; Xie, Y.N.; Herrmann, E.; Nie, W.; Petäjä, T.; Kerminen, V.-M.; et al. Ozone and fine particle in the western Yangtze River Delta: An overview of 1 yr data at the SORPES station. Atmos. Chem. Phys. 2013, 13, 5813–5830. [Google Scholar] [CrossRef]
  148. Sun, Y.L.; Wang, Z.F.; Du, W.; Zhang, Q.; Wang, Q.Q.; Fu, P.Q.; Pan, X.L.; Li, J.; Jayne, J.; Worsnop, D.R. Long-term real-time measurements of aerosol particle composition in Beijing, China: Seasonal variations, meteorological effects, and source analysis. Atmos. Chem. Phys. 2015, 15, 10149–10165. [Google Scholar] [CrossRef]
  149. Wang, S.; Zhao, W.X.; Xu, X.Z.; Fang, B.; Zhang, Q.L.; Qian, X.D.; Zhang, W.J.; Chen, W.D.; Pu, W.; Wang, X. Dependence of columnar aerosol size distribution, optical properties, and chemical components on regional transport in Beijing. Atmos. Environ. 2017, 169, 128–139. [Google Scholar] [CrossRef]
  150. Zhu, L.L.; Zhang, Y.H.; Kan, X.; Wang, J.G. Transport Paths and Identification for Potential Sources of Haze Pollution in the Yangtze River Delta Urban Agglomeration from 2014 to 2017. Atmosphere 2018, 9, 502. [Google Scholar] [CrossRef]
  151. Gong, S.L.; Zhang, X.Y.; Zhao, T.L.; McKendry, I.G.; Jaffe, D.A.; Lu, N.M. Characterization of soil dust aerosol in China and its transport and distribution during 2001 ACE-Asia: 2. Model simulation and validation. J. Geophys. Res. Atmos. 2003, 108, ACH4-1–ACH4-19. [Google Scholar] [CrossRef]
  152. Prospero, J.M.; Ginoux, P.; Torres, O.; Nicholson, S.E.; Gill, T.E. Environmental characterization of global sources of atmospheric soil dust identified with the Nimbus 7 Total Ozone Mapping Spectrometer (TOMS) absorbing aerosol product. Rev. Geophys. 2002, 40, 1002. [Google Scholar] [CrossRef]
  153. Yin, X.H.; Shi, S.Y.; Zhang, M.Y.; Li, J. Change Characteristic of Beijing Dust Weather and Its Sand-Dust Source Areas. Plateau Meteorol. 2007, 26, 1039–1044. [Google Scholar]
  154. Lin, J.; Shen, X.; Xing, L.; Che, H.; Holben, B.N. Analysis of Aerosol Type and Fine- and Coarse-mode Aerosol Direct Radiative Forcing over Regions in East and Southeast Asia Based on AERONET Version 3 Data. Aerosol Air Qual. Res. 2021, 21, 200503–200525. [Google Scholar] [CrossRef]
  155. Lin, J.Y. Analysis of Aerosol Types Based on Global AERONET Ground Observations. Master’s Thesis, Nanjing University of Information Science and Technology, Nanjing, China, 2021. [Google Scholar]
  156. Xia, X.; Chen, H.; Goloub, P.; Zhang, W.; Chatenet, B.; Wang, P. A compilation of aerosol optical properties and calculation of direct radiative forcing over an urban region in northern China. J. Geophys. Res. 2007, 112, 203–211. [Google Scholar] [CrossRef]
  157. Gao, Z.M.; Bi, J.R.; Huang, J.P. Analysis on Aerosol Optical Property over Northern China from AERONET and SKYNET Observations. Plateau Meteorol. 2013, 32, 1293–1307, (In Chinese with English abstract). [Google Scholar]
  158. Che, H.Z.; Zhang, X.Y.; Chen, H.B.; Damiri, B.; Goloub, P.; Li, Z.Q.; Zhang, X.C.; Wei, Y.; Zhou, H.G.; Dong, F.; et al. Instrument calibration and aerosol optical depth validation of the China Aerosol Remote Sensing Network. J. Geophys. Res.-Atmos. 2009, 114, 206–217. [Google Scholar] [CrossRef]
  159. Yu, X.; Zhu, B.; Zhang, M. Seasonal variability of aerosol optical properties over Beijing. Atmos. Environ. 2009, 43, 4095–4101. [Google Scholar] [CrossRef]
  160. Yu, X.N.; Zhu, B.; Yin, Y.; Fan, S.X.; Chen, A.J. Seasonal Variation of Columnar Aerosol Optical Properties in Yangtze River Delta in China. Adv. Atmos. Sci. 2011, 28, 1326–1335. [Google Scholar] [CrossRef]
  161. Zheng, Y.; Che, H.Z.; Yang, L.K.; Chen, J.; Wang, Y.Q.; Xia, X.G.; Zhao, H.J.; Wang, H.; Wang, D.Y.; Gui, K.; et al. Optical and Radiative Properties of Aerosols during a Severe Haze Episode over the North China Plain in December 2016. J. Meteorol. Res.-Prc. 2017, 31, 1045–1061. [Google Scholar] [CrossRef]
  162. Che, H.; Xia, X.; Zhu, J.; Li, Z.; Dubovik, O.; Holben, B.; Goloub, P.; Chen, H.; Estelles, V.; Cuevas-Agulló, E.; et al. Column aerosol optical properties and aerosol radiative forcing during a serious haze-fog month over North China Plain in 2013 based on ground-based sunphotometer measurements. Atmos. Chem. Phys. 2014, 14, 2125–2138. [Google Scholar] [CrossRef]
  163. Yoon, S.; Kim, S.; Choi, S.; Choi, I. Regional-scale relationships between aerosol and summer monsoon circulation, and precipitation over Northeast Asia. Asia-Pac. J. Atmos. Sci. 2010, 46, 279–286. [Google Scholar] [CrossRef]
  164. Jiang, Y.; Luo, Y.; Zhao, Z.; Tao, S. Changes in wind speed over China during 1956–2004. Theor. Appl. Climatol. 2010, 99, 421–430. [Google Scholar] [CrossRef]
  165. Fu, G.; Yu, J.; Zhang, Y.; Hu, S. Temporal variation of wind speed in China for 1961–2007. Theor. Appl. Climatol. 2011, 104, 313–324. [Google Scholar] [CrossRef]
  166. Li, S.; Wang, T.; Solmon, F.; Zhuang, B.; Wu, H.; Xie, M.; Han, Y.; Wang, X. Impact of aerosols on regional climate in southern and northern China during strong/weak East Asian summer monsoon years. J. Geophys. Res. Atmos. 2016, 121, 4069–4081. [Google Scholar] [CrossRef]
  167. Zhuang, B.L.; Li, S.; Wang, T.J.; Deng, J.J.; Xie, M.; Yin, C.Q.; Zhu, J.L. Direct radiative forcing and climate effects of anthropogenic aerosols with different mixing states over China. Atmos. Environ. 2013, 79, 349–361. [Google Scholar] [CrossRef]
  168. Khatri, P.; Ishizaka, Y.; Takamura, T. A study on aerosol optical properties in an urban atmosphere of Nagoya, Japan. J. Meteorol. Soc. Jpn. 2009, 87, 19–38. [Google Scholar] [CrossRef]
  169. Wang, Y.; Che, H.Z.; Ma, J.Z.; Wang, Q.; Shi, G.Y.; Chen, H.B.; Goloub, P.; Hao, X.J. Aerosol radiative forcing under clear, hazy, foggy, and dusty weather conditions over Beijing, China. Geophys. Res. Lett. 2009, 36, L06804. [Google Scholar] [CrossRef]
  170. Alam, K.; Trautmann, T.; Blaschke, T. Aerosol optical properties and radiative forcing over mega-city Karachi. Atmos. Res. 2011, 101, 773–782. [Google Scholar] [CrossRef]
  171. Ge, J.M.; Su, J.; Ackerman, T.P.; Fu, Q.; Huang, J.P.; Shi, J.S. Dust aerosol optical properties retrieval and radiative forcing over northwestern China during the 2008 China–U.S. joint field experiment. J. Geophys. Res. 2010, 115, D00K12. [Google Scholar] [CrossRef]
  172. Sandradewi, J.; Prévôt, A.S.H.; Szidat, S.; Perron, N.; Alfarra, M.R.; Lanz, V.A.; Weingartner, E.; Baltensperger, U. Using aerosol light absorption measurements for the quantitative determination of wood burning and traffic emission contributions to particulate matter. Environ. Sci. Technol. 2008, 42, 3316–3323. [Google Scholar] [CrossRef]
  173. Moosmüller, H.; Chakrabarty, R.K.; Ehlers, K.M.; Arnott, W.P. Absorption Ångström coefficient, brown carbon, and aerosols: Basic concepts, bulk matter, and spherical particles. Atmos. Chem. Phys. 2011, 11, 1217–1225. [Google Scholar] [CrossRef]
  174. Curci, G.; Alyuz, U.; Baro, R.; Bianconi, R.; Bieser, J.; Christensen, J.H.; Colette, A.; Farrow, A.; Francis, X.; Jimenez-Guerrero, P.; et al. Modelling black carbon absorption of solar radiation: Combining external and internal mixing assumptions. Atmos. Chem. Phys. 2019, 19, 181–204. [Google Scholar] [CrossRef]
  175. Lack, D.A.; Langridge, J.M. On the attribution of black and brown carbon light absorption using the Ångström exponent. Atmos. Chem. Phys. 2013, 13, 10535–10543. [Google Scholar] [CrossRef]
  176. Olson, M.R.; Victoria Garcia, M.; Robinson, M.A.; Van Rooy, P.; Dietenberger, M.A.; Bergin, M.; Schauer, J.J. Investigation of black and brown carbon multiple-wavelength-dependent light absorption from biomass and fossil fuel combustion source emissions. J. Geophys. Res.-Atmos. 2015, 120, 6682–6697. [Google Scholar] [CrossRef]
  177. Shen, Z.; Lei, Y.; Zhang, L.; Zhang, Q.; Zeng, Y.; Tao, J.; Zhu, C.; Cao, J.; Xu, H.; Liu, S. Methanol Extracted Brown Carbon in PM2.5 Over Xi’an, China: Seasonal Variation of Optical Properties and Sources Identification. Aerosol Sci. Eng. 2017, 1, 57–65. [Google Scholar] [CrossRef]
  178. Liu, C.; Li, J.; Yin, Y.; Zhu, B.; Feng, Q. Optical properties of black carbon aggregates with non-absorptive coating. J. Quant. Spectrosc. Radiat. Transf. 2017, 187, 443–452. [Google Scholar] [CrossRef]
  179. Russell, P.B.; Bergstrom, R.W.; Shinozuka, Y.; Clarke, A.D.; DeCarlo, P.F.; Jimenez, J.L.; Livingston, J.M.; Redemann, J.; Dubovik, O.; Strawa, A. Absorption Angstrom Exponent in AERONET and related data as an indicator of aerosol composition. Atmos. Chem. Phys. 2010, 10, 1155–1169. [Google Scholar] [CrossRef]
  180. Bahadur, R.; Praveen, P.S.; Xu, Y.; Ramanathan, V. Solar absorption by elemental and brown carbon determined from spectral observations. Proc. Natl. Acad. Sci. USA 2012, 109, 17366–17371. [Google Scholar] [CrossRef]
  181. Takemura, T. Simulation of climate response to aerosol direct and indirect effects with aerosol transport-radiation model. J. Geophys. Res. 2005, 110, 202–217. [Google Scholar] [CrossRef]
  182. Wang, X.; Heald, C.L.; Sedlacek, A.J.; de Sá, S.S.; Martin, S.T.; Alexander, M.L.; Watson, T.B.; Aiken, A.C.; Springston, S.R.; Artaxo, P. Deriving brown carbon from multiwavelength absorption measurements: Method and application to AERONET and Aethalometer observations. Atmos. Chem. Phys. 2016, 16, 12733–12752. [Google Scholar] [CrossRef]
  183. Zhao, H.; Che, H.; Ma, Y.; Xia, X.; Wang, Y.; Wang, P.; Wu, X. Temporal variability of the visibility, particulate matter mass concentration and aerosol optical properties over an urban site in Northeast China. Atmos. Res. 2015, 166, 204–212. [Google Scholar] [CrossRef]
  184. Zan, Y.; Ma, X.; Tian, R. A study on the influencing factors of tropospheric photolysis rate based on TUV model. China Environ. Sci. 2019, 39, 3707–3718, (In Chinese with English abstract). [Google Scholar]
  185. Deng, X.; Zhou, X.; Wu, D.; Tie, X.; Tan, H.; Li, F.; Bi, X.; Deng, T.; Jiang, D. Effect of atmospheric aerosol on surface ozone variation over the Pearl River Delta region. Sci. China Earth Sci. 2011, 54, 744–752. [Google Scholar] [CrossRef]
Figure 1. Spatial distributions of (a) AOD (b) AAOD, (c) SSA, (d) AE, and (e) AAE based on AERONET measurements.
Remotesensing 15 02779 g001
Figure 3. Interannual variations of AOD and AAOD at Beijing and Taihu site.
Remotesensing 15 02779 g003
Figure 8. Seasonal averages of DRF induced by BC-dominated absorbing aerosols and corresponding AAOD (a,c,e) and DRF induced by total aerosols and corresponding AOD (b,d,f) at the Beijing and Taihu sites based on AERONET measurements. The abbreviations are for DRF induced by BC-dominated absorbing aerosols in the UVA band at the TOA (RF_absorb_TOA) and at the surface (RF_absorb_SRF), and for DRF induced by BC-dominated total aerosols in the UVA band at the TOA (RF_total_TOA) and at the surface (RF_total_SRF).
Remotesensing 15 02779 g008
Figure 9. Spatial distributions of actinic flux changes (1014 quanta cm−2 s−1) induced by absorbing aerosols (a) in the UVA band at the SRF and (b) in the UVB band at the surface based on AERONET measurements.
Remotesensing 15 02779 g009
Figure 10. Spatial distributions of the near-surface photolysis rates changes (%) induced by absorbing aerosols of (a) NO2 (J[NO2]) and (b) O3 (J[O1D]).
Remotesensing 15 02779 g010
Figure 11. Seasonal averages of actinic flux changes induced by absorbing aerosols (a) in the UVA band at the surface and (b) in the UVB band at the surface at the Beijing and Taihu sites based on AERONET measurements.
Remotesensing 15 02779 g011
Figure 12. Seasonal averages of the near-surface photolysis rates changes induced by absorbing aerosols of (a) NO2 (J[NO2]) and (b) O3 (J[O1D]) at the Beijing and Taihu sites based on AERONET measurements.
Remotesensing 15 02779 g012
Figure 13. Linear fitting relationship between photolysis rates changes induced by BC-dominated absorbing aerosols of NO2 (a,b) and O3 (c,d) and corresponding AAOD at the Beijing site (a,c), and the Taihu site (b,d). The linear fitting coefficients α and β are shown in the bottom right corner of each panel.
Remotesensing 15 02779 g013aRemotesensing 15 02779 g013b
Table 1. The latitude, longitude, and time series collected from 23 AERONET sites in East Asia. The sites are grouped in nine regions.
RegionSiteLatitude (°N)Longitude (°N)Time Series (Year)
BTHBeijing39.977116.3812005–2016
Xianghe39.754116.9622005–2013
Xinglong40.396117.5782006–2012
Northwest ChinaSACOL35.946104.1372007–2012
Yulin38.283109.7172001–2002
YRDTaihu31.421120.2152006–2012
QTPNAM_CO30.77390.9622009
Hong KongHong_Kong_PolyU22.303114.182006–2012
TaiwanChen-Kung Uni23120.2172004–2014
EPA-NCU24.968121.1852007–2014
Taipei25.03121.52005–2015
Southern ChinaDongsha_Island20.699116.7292010–2015
JapanHokkaido_Uni43.075141.3412016
Noto37.334137.1372008–2015
Osaka34.651135.5912004–2015
Shirahama33.693135.3572003–2014
Fukuoka33.524130.8752013–2015
KoreaGangneung37.966124.632015
Seoul_SNU37.458126.9512002, 2012–2013
Hankuk_UFS37.339127.2662012–2016
Pusan_NU35.235129.0832015–2016
Gwangju_GIST35.228126.8432012–2016
Gosan_SNU33.292126.1622003–2014
Table 2. TUV model configuration options and settings.
TUV ParametersSettings
LocationAll sites
TimeObservation period
Vertical resolution1 km
Radiative transfer schemeδ-Eddington approximation
Table 3. Period and total numbers of observational data at the Beijing site and the Taihu site based on AERONET measurements.
SitePeriodTotalMAM (%)JJA (%)SON (%)DJF (%)
Beijing2005–2012137533122431
Taihu2005–201215193592234
Table 4. Seasonal averages of photolysis rates reduction induced by BC-dominated absorbing aerosols at the Beijing and Taihu sites based on AERONET measurements. The abbreviations are for photolysis rate of NO2 in the time of day (J[NO2]_day) and noon (J[NO2]_noon), and for photolysis rate of O3 in the time of day (J[O1D]_day) and noon (J[O1D]_noon).
BeijingTaihu BeijingTaihu
J[NO2]_day
(%)
DJF−16.34−16.72J[NO2]_noon
(%)
DJF−18.77−18.57
MAM−14.62−14.45MAM−16.77−18.23
JJA−12.37−13.17JJA−14.74−13.96
SON−16.11−9.32SON−16.88−11.26
J[O1D] _day
(%)
DJF−22.07−22.73J[O1D]_noon
(%)
DJF−24.03−23.79
MAM−20.47−20.04MAM−21.38−22.42
JJA−17.00−17.45JJA−18.42−17.91
SON−21.74−12.54SON−22.00−14.75
Disclaimer/Publisher’s Note: The statements, opinions and data contained in all publications are solely those of the individual author(s) and contributor(s) and not of MDPI and/or the editor(s). MDPI and/or the editor(s) disclaim responsibility for any injury to people or property resulting from any ideas, methods, instructions or products referred to in the content.

