
Using a Convolutional Neural Network and Mid-Infrared Spectral Images to Predict the Carbon Dioxide Content of Ship Exhaust
1
Navigation College, Dalian Maritime University, Dalian 116026, China
2
Institute of AI & Robotics, Academy for Engineering & Technology, Fudan University, Shanghai 200433, China
*
Author to whom correspondence should be addressed.
Remote Sens. 2023, 15(11), 2721; https://doi.org/10.3390/rs15112721
Submission received: 27 April 2023
/
Revised: 19 May 2023
/
Accepted: 22 May 2023
/
Published: 24 May 2023
Abstract
:Strengthening regulations on carbon emissions from ships is important for ensuring that China can achieve its dual carbon aims of reaching peak carbon emissions before 2030 and achieving carbon neutrality before 2060. Currently, the primary means of monitoring ship exhaust emissions are the sniffing method and non-imaging optical remote sensing; however, these methods suffer from a low prediction efficiency and high cost. We developed a method for predicting the CO2 content of ship exhaust that uses a convolutional neural network and mid-infrared spectral images. First, a bench experiment was performed to synchronously obtain mid-wave infrared spectral images of the ship exhaust plume and true values for the CO2 concentration from the online monitoring of eight spectral channels. Then, the ResNet50 residual neural network, which is suitable for image prediction tasks, was selected to predict the CO2 content. The preprocessed mid-infrared spectral image of each channel and the corresponding true value for the CO2 content were input to the neural network, and convolution was applied to extract the radiation characteristics. The neural network then mapped the relationship between the true CO2 content and the radiation characteristics for each channel, which it used to predict the CO2 content in the ship exhaust. The results demonstrated that the predicted and true CO2 contents had a root mean square error of <0.2, mean absolute error of <0.15, and mean absolute percentage error of <3.5 for all eight channels. The developed model demonstrated a high prediction accuracy with one channel in particular demonstrating the best performance. This study demonstrates that the method used for predicting the CO2 content of ship exhaust based on convolutional neural networks and mid-infrared spectral images is feasible and has reference significance for the remote monitoring of ship exhaust emissions.
1. Introduction
Excessive greenhouse gas (GHG) emissions have worsened global warming and have resulted in multiple natural disasters that threaten human lives and properties. The most important GHG is CO2, which accounted for 76% of GHG emissions in 2015 [1]. Thus, reducing CO2 emissions is an important step for addressing problems associated with climate change. As the world’s second-largest economy, China proposed the dual carbon goals of achieving a peak in CO2 emissions by 2030 and carbon neutrality by 2060 [2], realizing the dual carbon aims require the joint efforts of all industries. The shipping industry is responsible for ~2.89% of global CO2 emissions, 15% of NOX emissions, and 4–9% of SO2 emissions [3,4]. Note that >70% of the current international trade volume and >80% of international trade are by maritime transportation [5,6]. In 2021, the International Maritime Organization (IMO) adopted the target of reducing CO2 emissions from ships by 2% annually from 2023 to 2026, i.e., a total decrease of 11% compared to 2019 [7]. Achieving these aims requires both compliance from carriers and supervision by relevant departments. Currently, countries generally use sniffing and optical remote sensing technologies to monitor ship exhaust emissions [8,9,10]. The sniffing method usually involves mounting measurement equipment on platforms such as helicopters or unmanned aerial vehicles (UAVs) that then directly enter a ship’s exhaust plume for monitoring [11]. However, this method requires the aircraft to maintain a flight distance of 25–50 m from the ship’s chimney and stay in the plume for 15–20 s for effective measurement. The low-altitude flight of the aircraft affects the normal navigation of the ship, and ensuring that the aircraft is always in the optimal sampling area of the plume is difficult. Furthermore, it is difficult for the detector to measure the exhaust plume at the port of the ship’s chimney, and the temperature and concentration of gases are considerably lesser in the exhaust plume, which increases their sensitivity to meteorological conditions [12,13]. However, optical remote sensing can be used for long-distance detection without affecting the normal navigation of a ship and includes technologies such as differential optical absorption spectroscopy (DOAS), light detection and ranging (LIDAR), ultraviolet camera (UV-CAM), and thermal infrared camera (TIR-CAM). These devices can be placed at fixed locations such as on land or bridges, or on mobile platforms such as ships and aircraft [14,15,16]. DOAS, which can be used to determine the gas composition and concentration, uses active laser emissions to remotely detect the different narrowband absorption characteristics and absorption intensities of gas molecules in the ship exhaust. However, this system receives the exhaust gas concentration for the entire ship area, which cannot be imaged. It does not accurately measure the exhaust gas concentration at the chimney mouth, and the detection accuracy is not high [17]. LIDAR uses the emissions of multiple pulse signals of different wavelengths to determine the desired gas concentration based on the known gas molecular absorption coefficient and detected gas position information [18]. However, LIDAR detects local areas of the exhaust plume without considering the diffusion of gas over time.
The limitations of the abovementioned monitoring methods can be overcome by combining a convolutional neural network (CNN) with mid-infrared spectral images to predict the CO2 content of the ship exhaust plume. CNNs are popular to process image data and have seen rapid advances in computer vision for applications such as face recognition, unmanned driving, Structural damage diagnosis and medical imaging [19,20,21,22,23,24]. Infrared thermography [25] can be used to capture multiple images per second in the mid-infrared band and obtain information about the entire exhaust plume of a ship while successfully preserving the spatiotemporal variations in its characteristics. As a passive imaging detection technology, it effectively avoids the disadvantages of DOAS and LIDAR systems, which require expensive active laser-emitting equipment. This reduces the operating costs and difficulties of infrared thermography and makes it suitable for remote detection. Infrared thermography has been popular in fields such as target detection, volcanic gas concentration inversion, and industrial detection [26,27,28,29,30]. Tombet et al. [31] used thermal infrared multispectral imaging technology to observe and quantitatively analyze the passive degassing of CO2 from the sulfur reservoir of Kilauea Volcano. However, their approach is disadvantaged by the limited application scenarios. Platt et al. [32] used the absorption and thermal emission spectra of digital cameras, thermal infrared cameras, and ultraviolet cameras to obtain data on SO2, CO2, and other gases; however, they suggested that radiation transfer issues could limit the accuracy of their approach. Cao et al. [33,34] combined ultraviolet and infrared images using multi-task deep learning to retrieve the SO2, CO2, and NO2 concentrations in ship exhaust as well as the sulfur content of ship fuel based on the sulfur–nitrogen and sulfur–carbon ratios. The retrieval accuracy was relatively high, but the proposed method was not confirmed under actual ship navigation conditions.
We herein propose a method that combines a CNN with mid-infrared spectral images to predict the CO2 content of a ship’s exhaust plume. In a bench experiment, we used a thermal infrared camera to image a ship’s exhaust plume and obtain mid-infrared spectral image data in eight channels as well as online monitoring equipment to obtain the true values of the CO2 content in the chimney pipes. We then used the Resnet50 residual neural network as a basis for developing a prediction model of the CO2 content. We then performed experiments to evaluate the performance of the prediction model and demonstrate the feasibility of our proposed method.
2. Materials and Methods
2.1. Bench Experiment
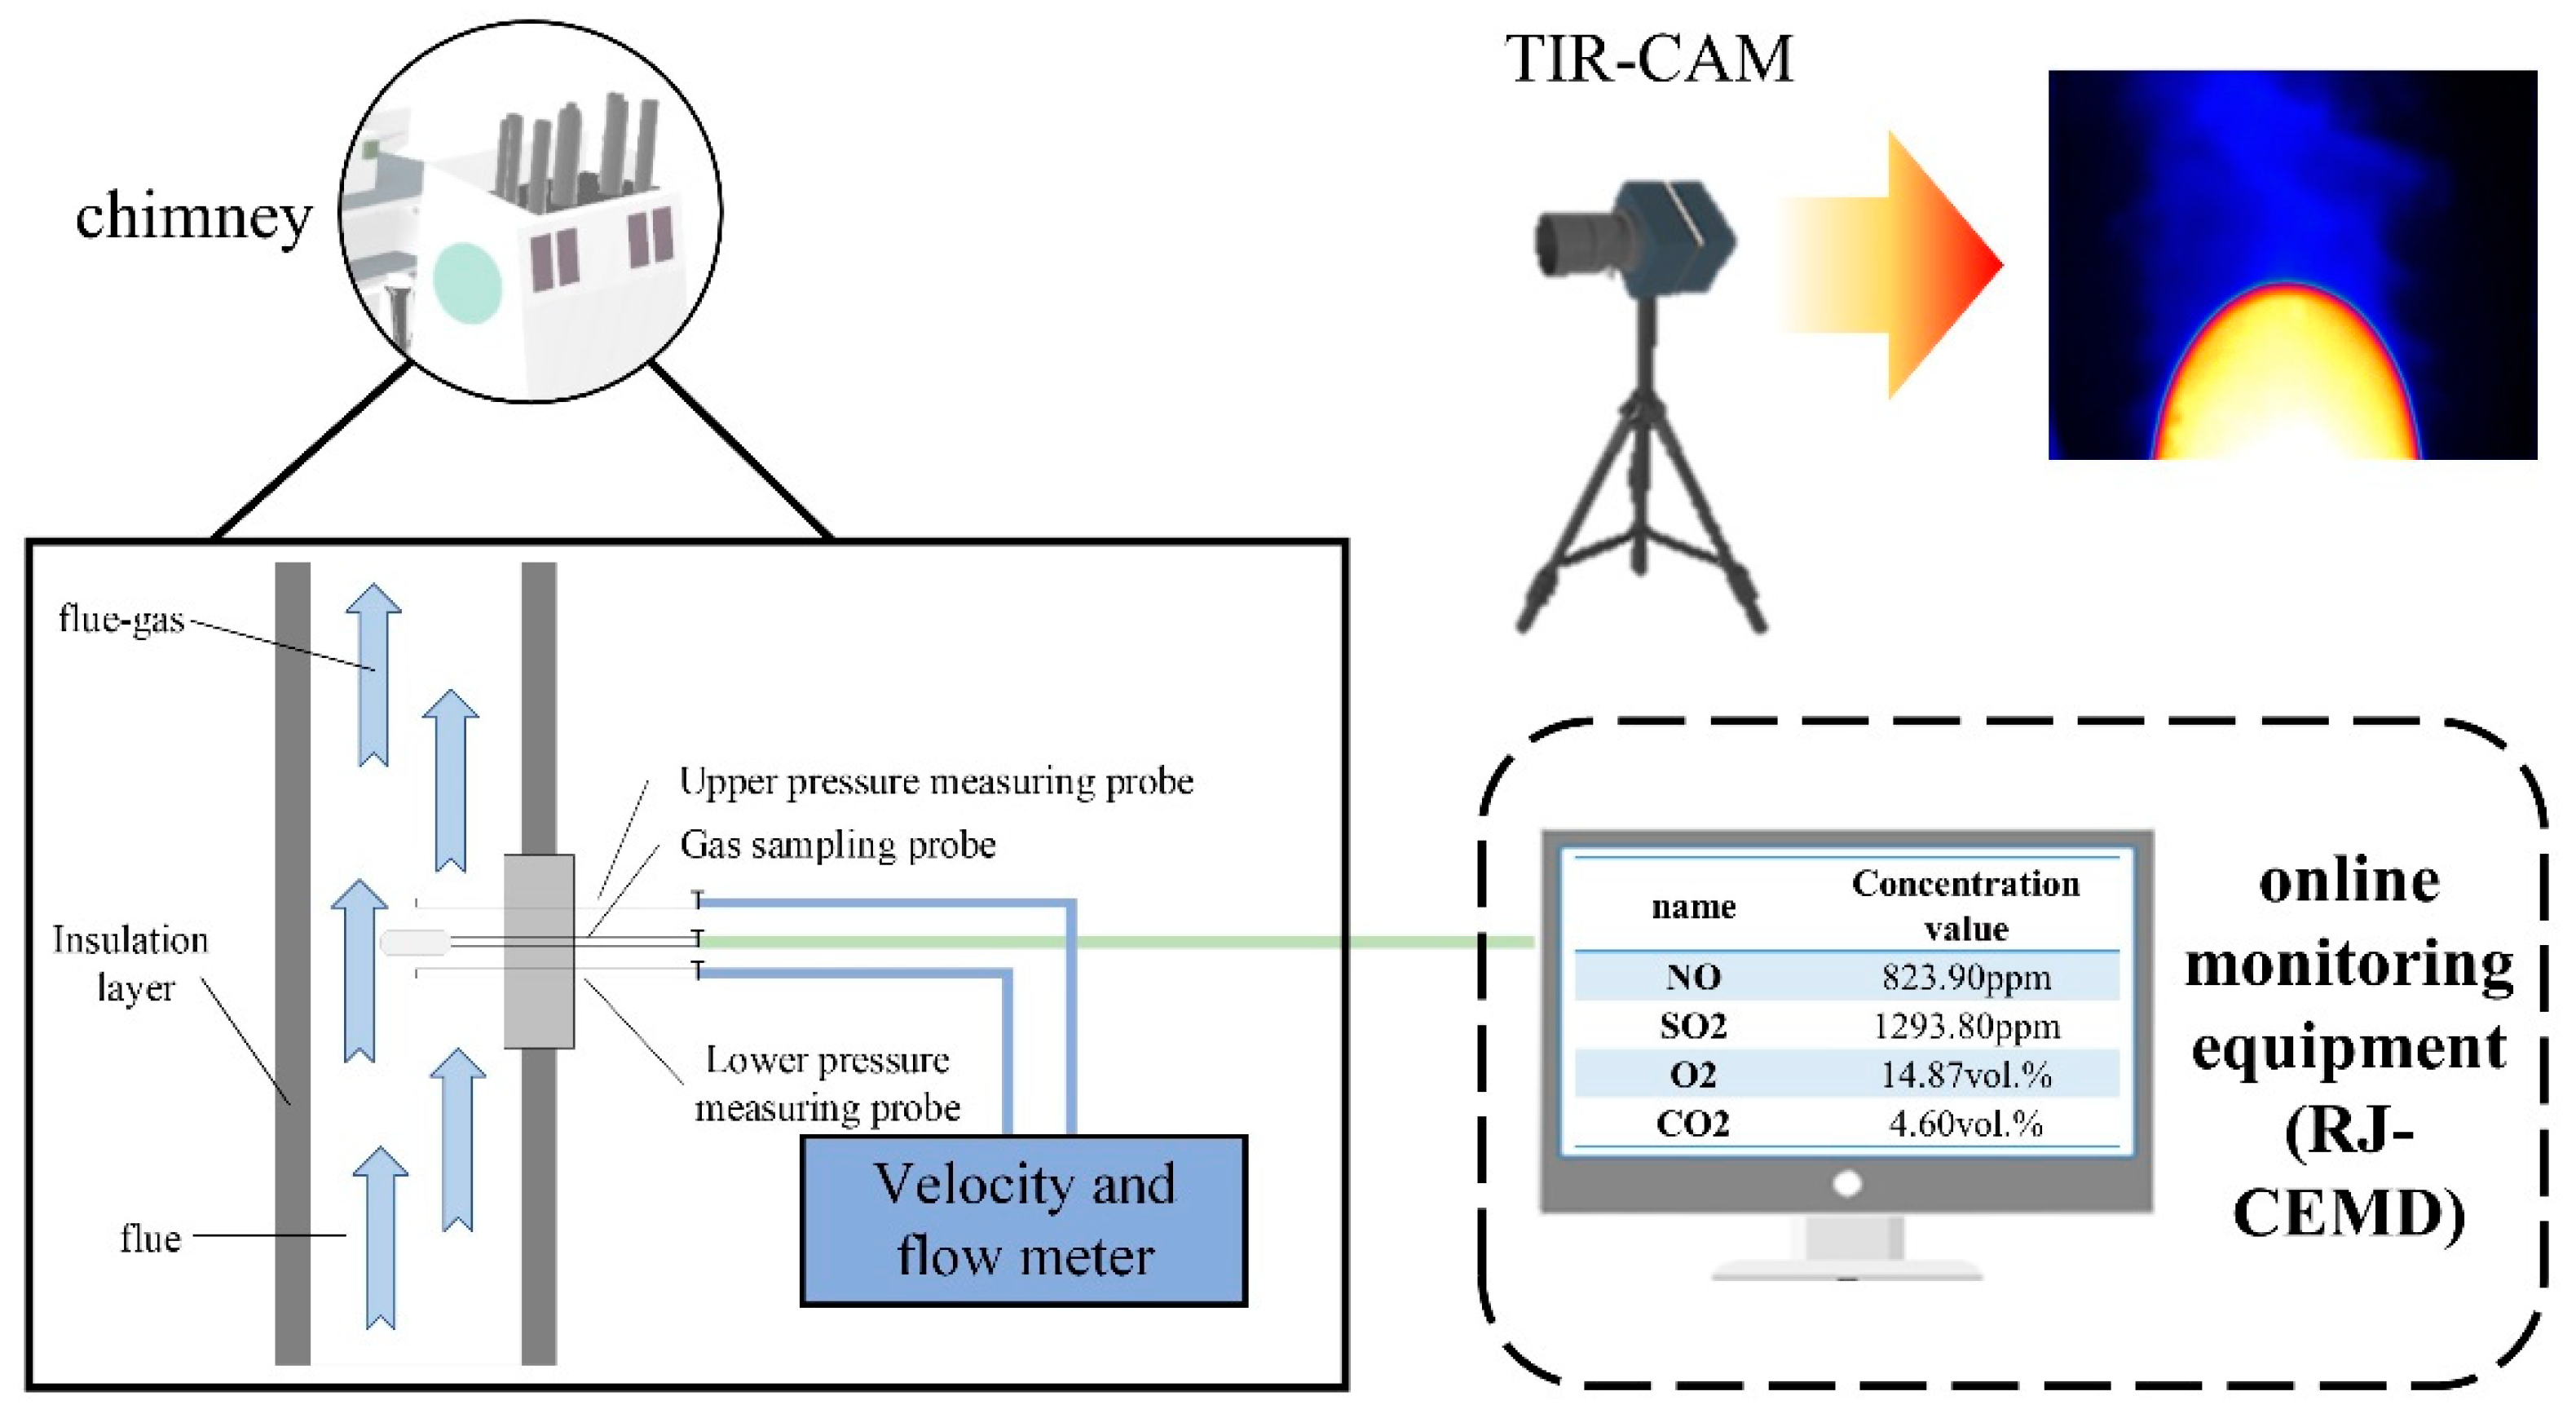
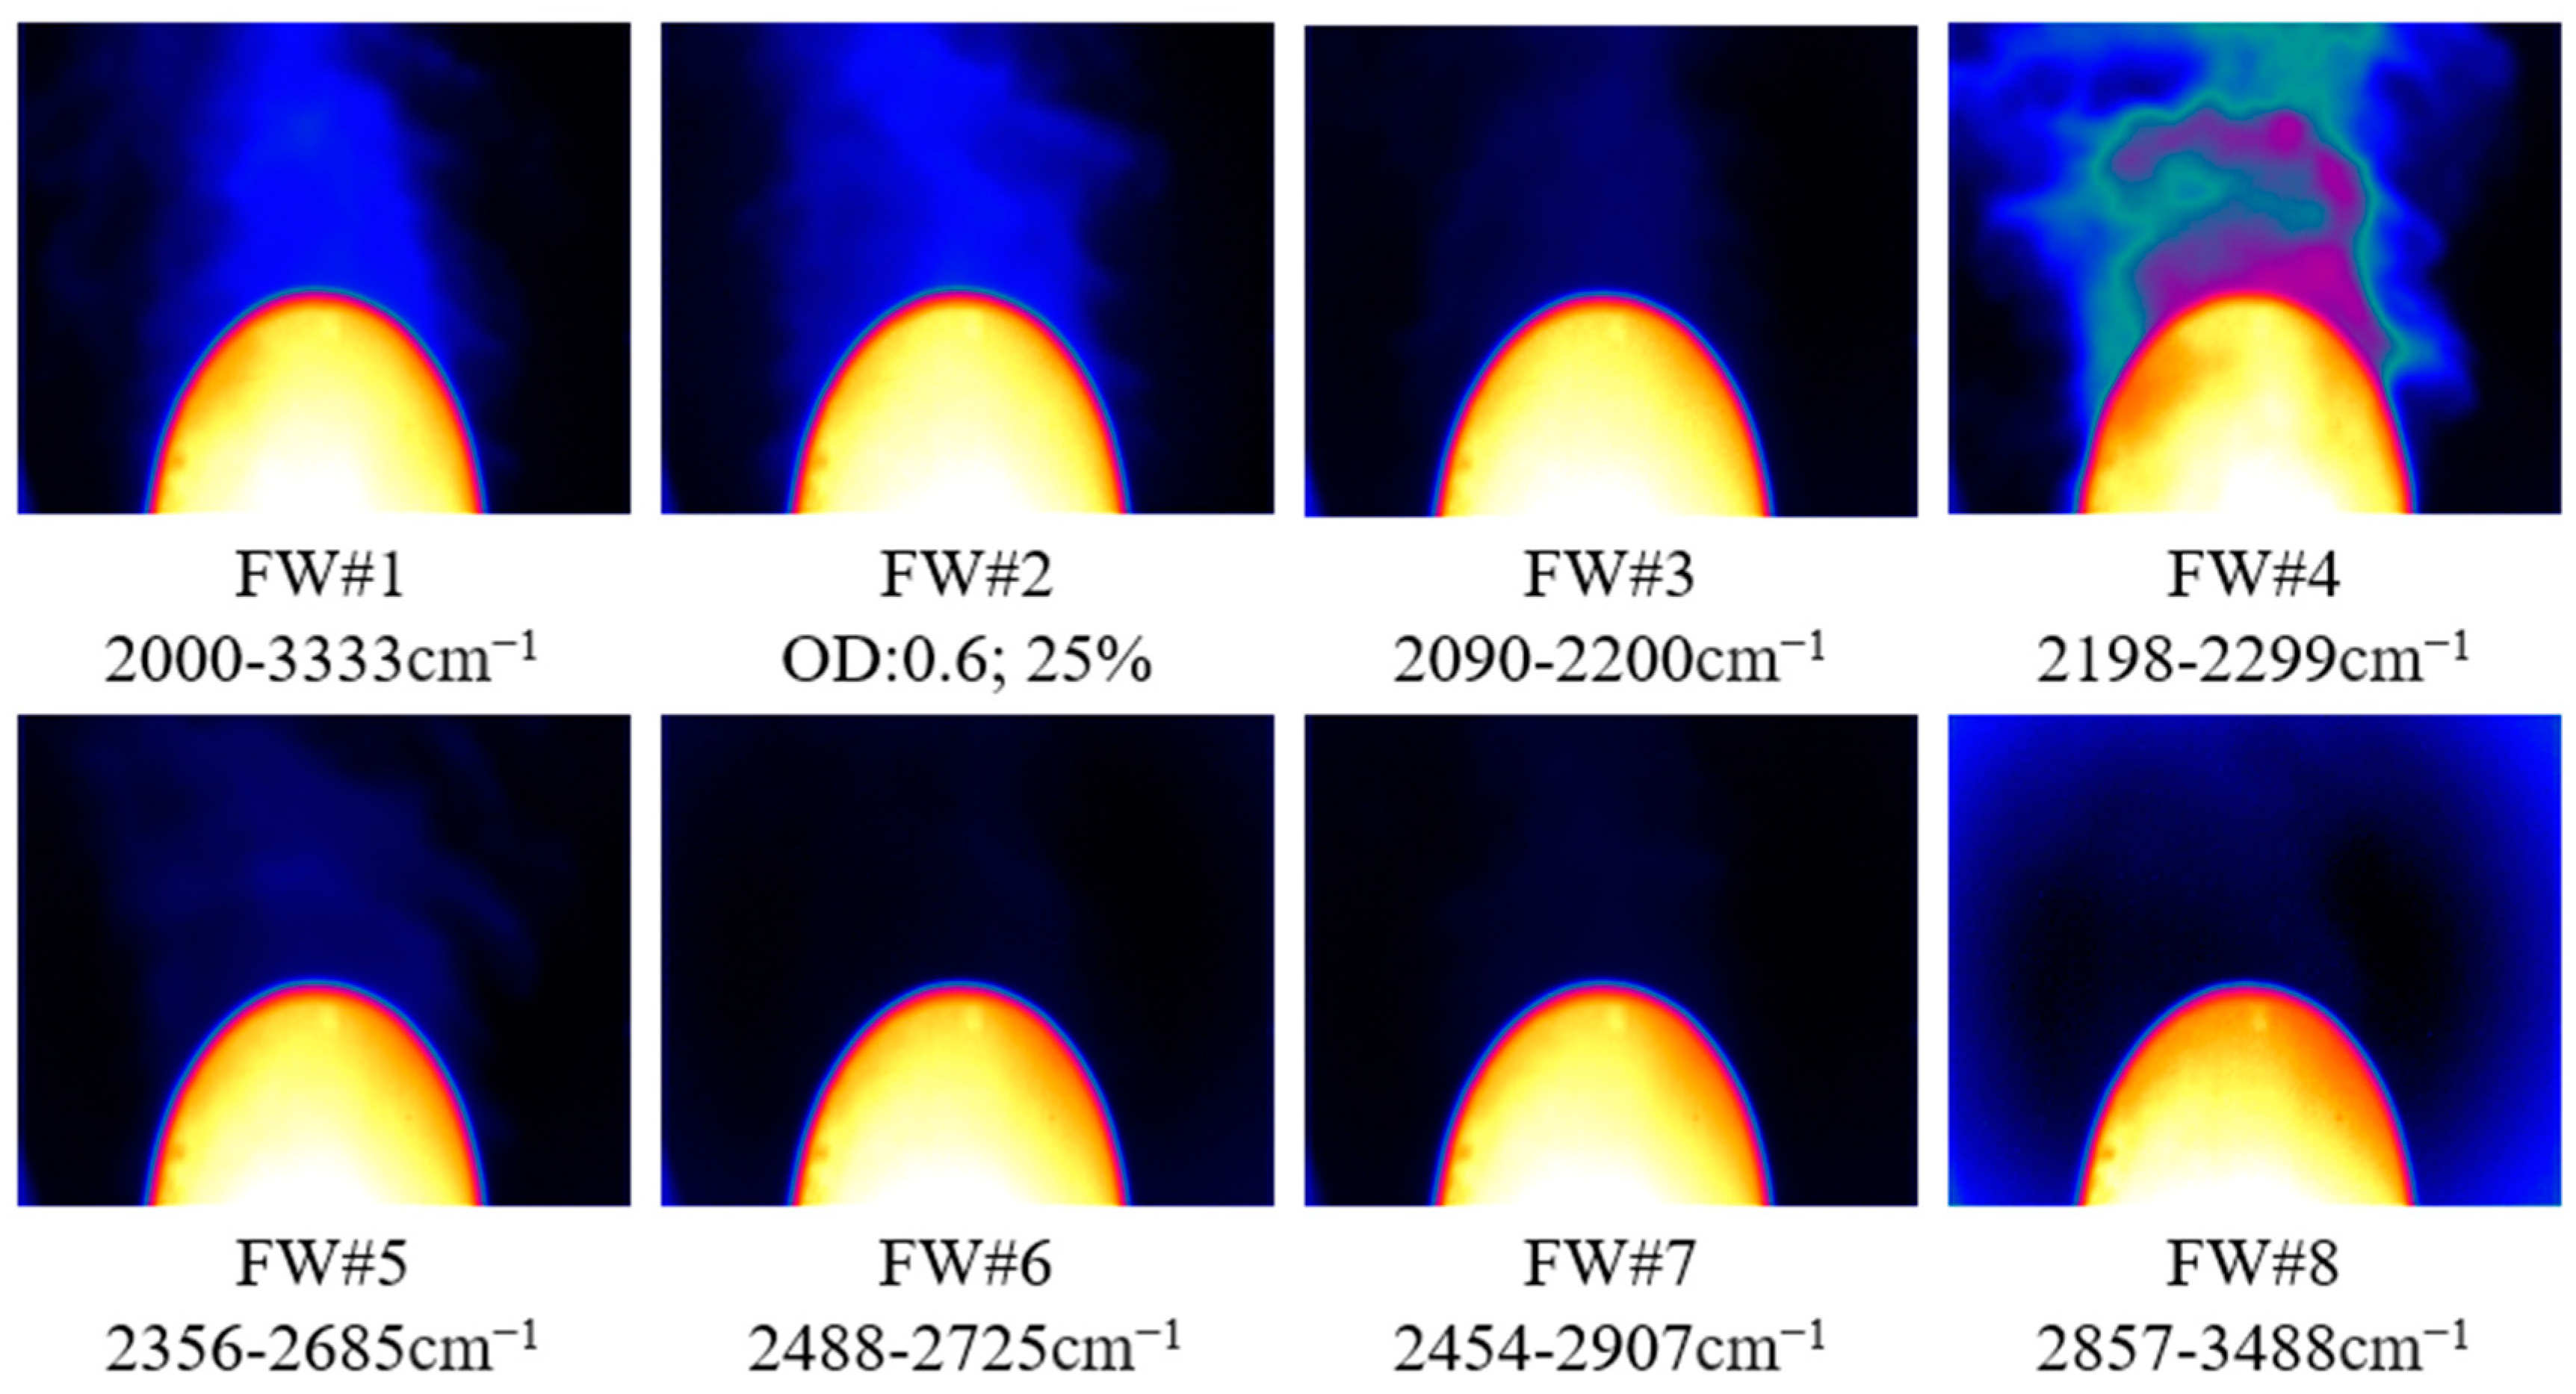
We performed a bench experiment using an online monitoring device to obtain the true value for the CO2 concentration in the ship exhaust and a shore-based thermal infrared camera to obtain infrared images of the exhaust plume. The experiment was then conducted at different infrared wavelengths and host power. Figure 1 shows a schematic of the bench experiment. As per Kirchhoff’s law of thermal radiation, the spectral radiation force varies with the wavelength and temperature. We then used a thermal infrared camera (Telops Corp., Montreal, QC, Canada) that shoots in eight spectral channels corresponding to different wavelengths. Each shot generated eight datasets with different sensitivities to CO2. We then set up the thermal infrared camera 50–60 m away from the ship’s chimney to capture mid-infrared spectral images of the exhaust plume. Table 1 presents the eight channels used in the experiment and their band information. Figure 2 shows a mid-infrared spectral image obtained in eight channels.
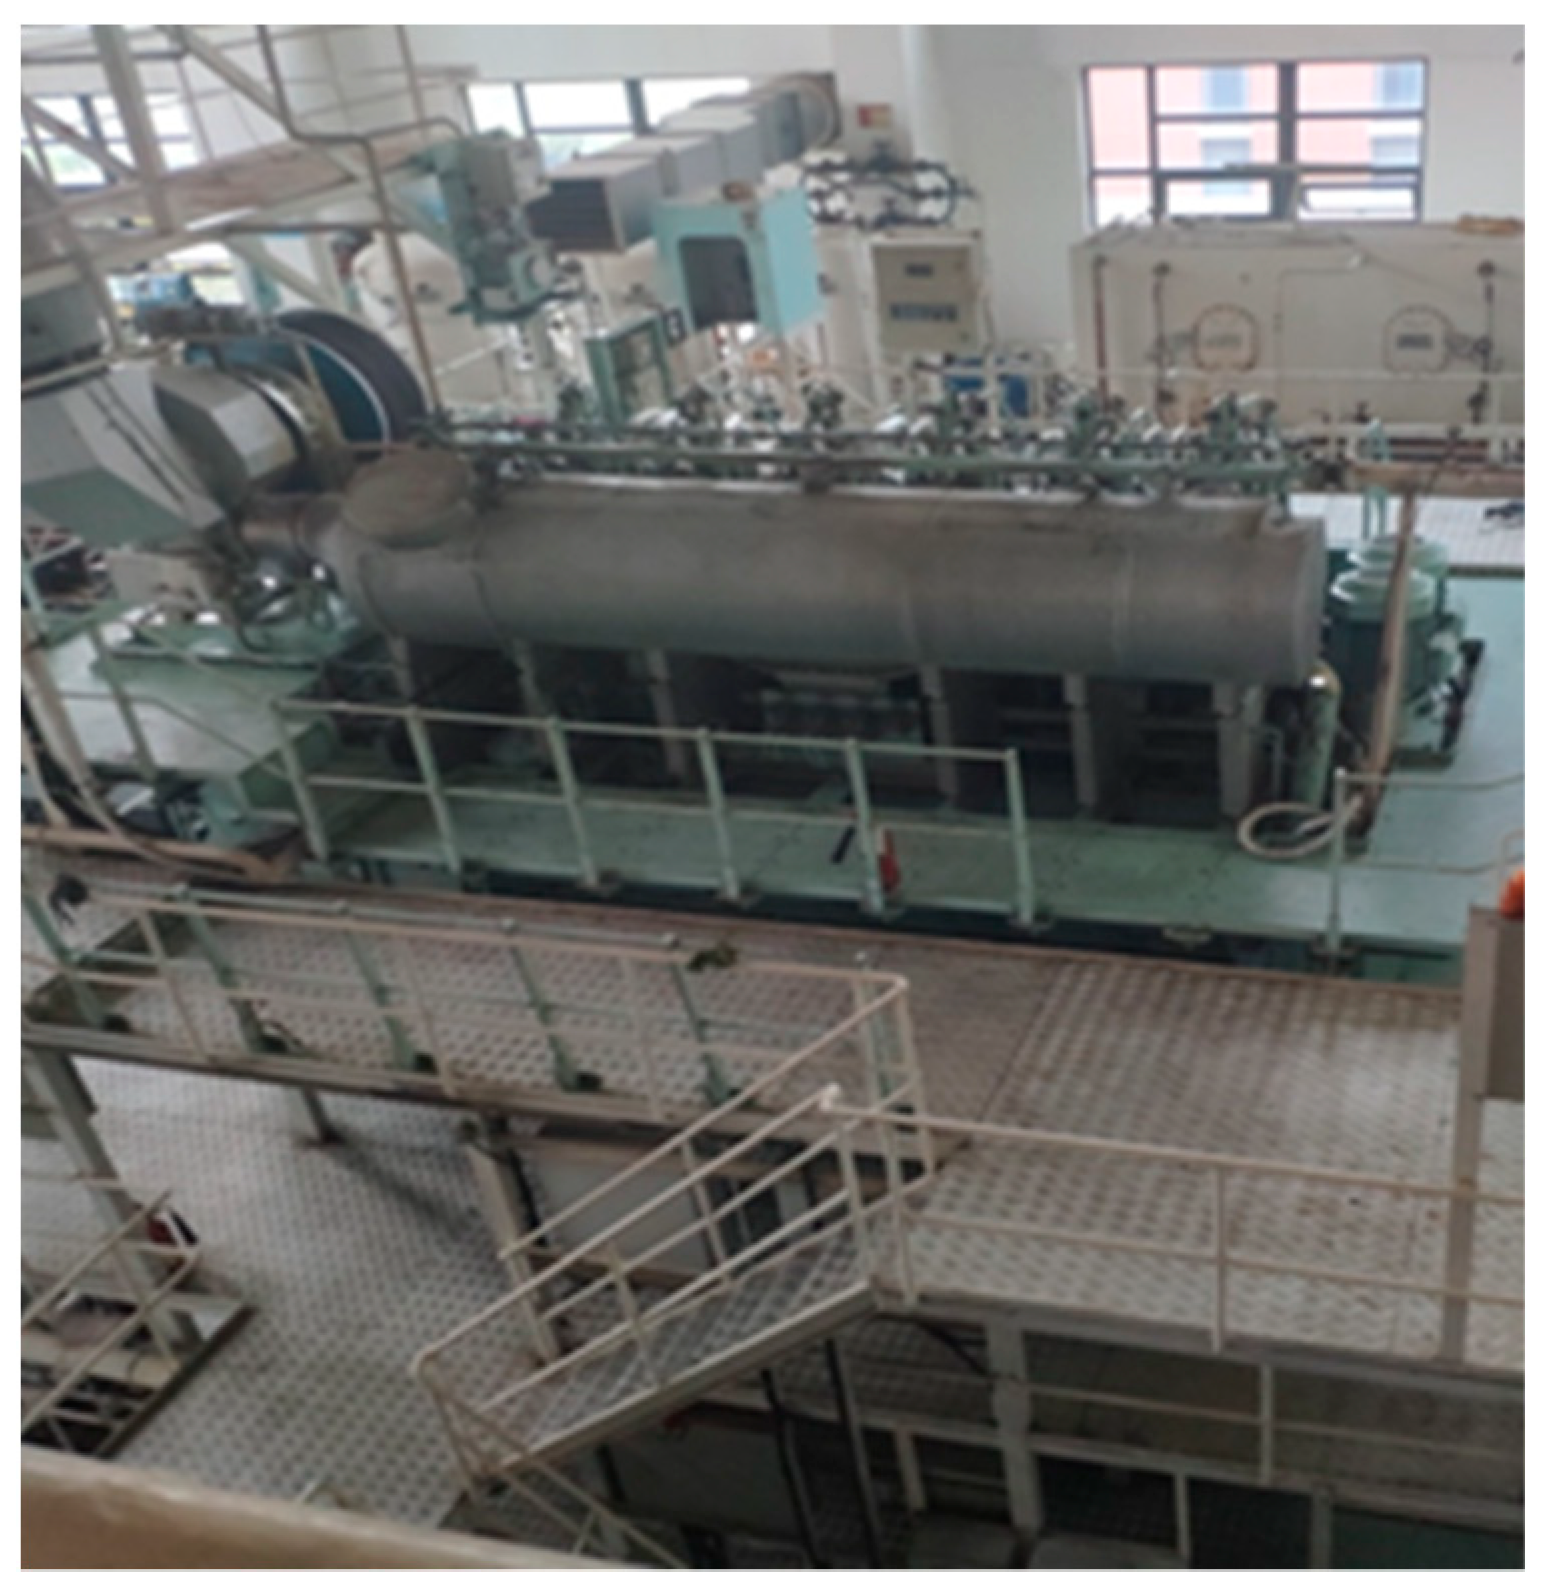
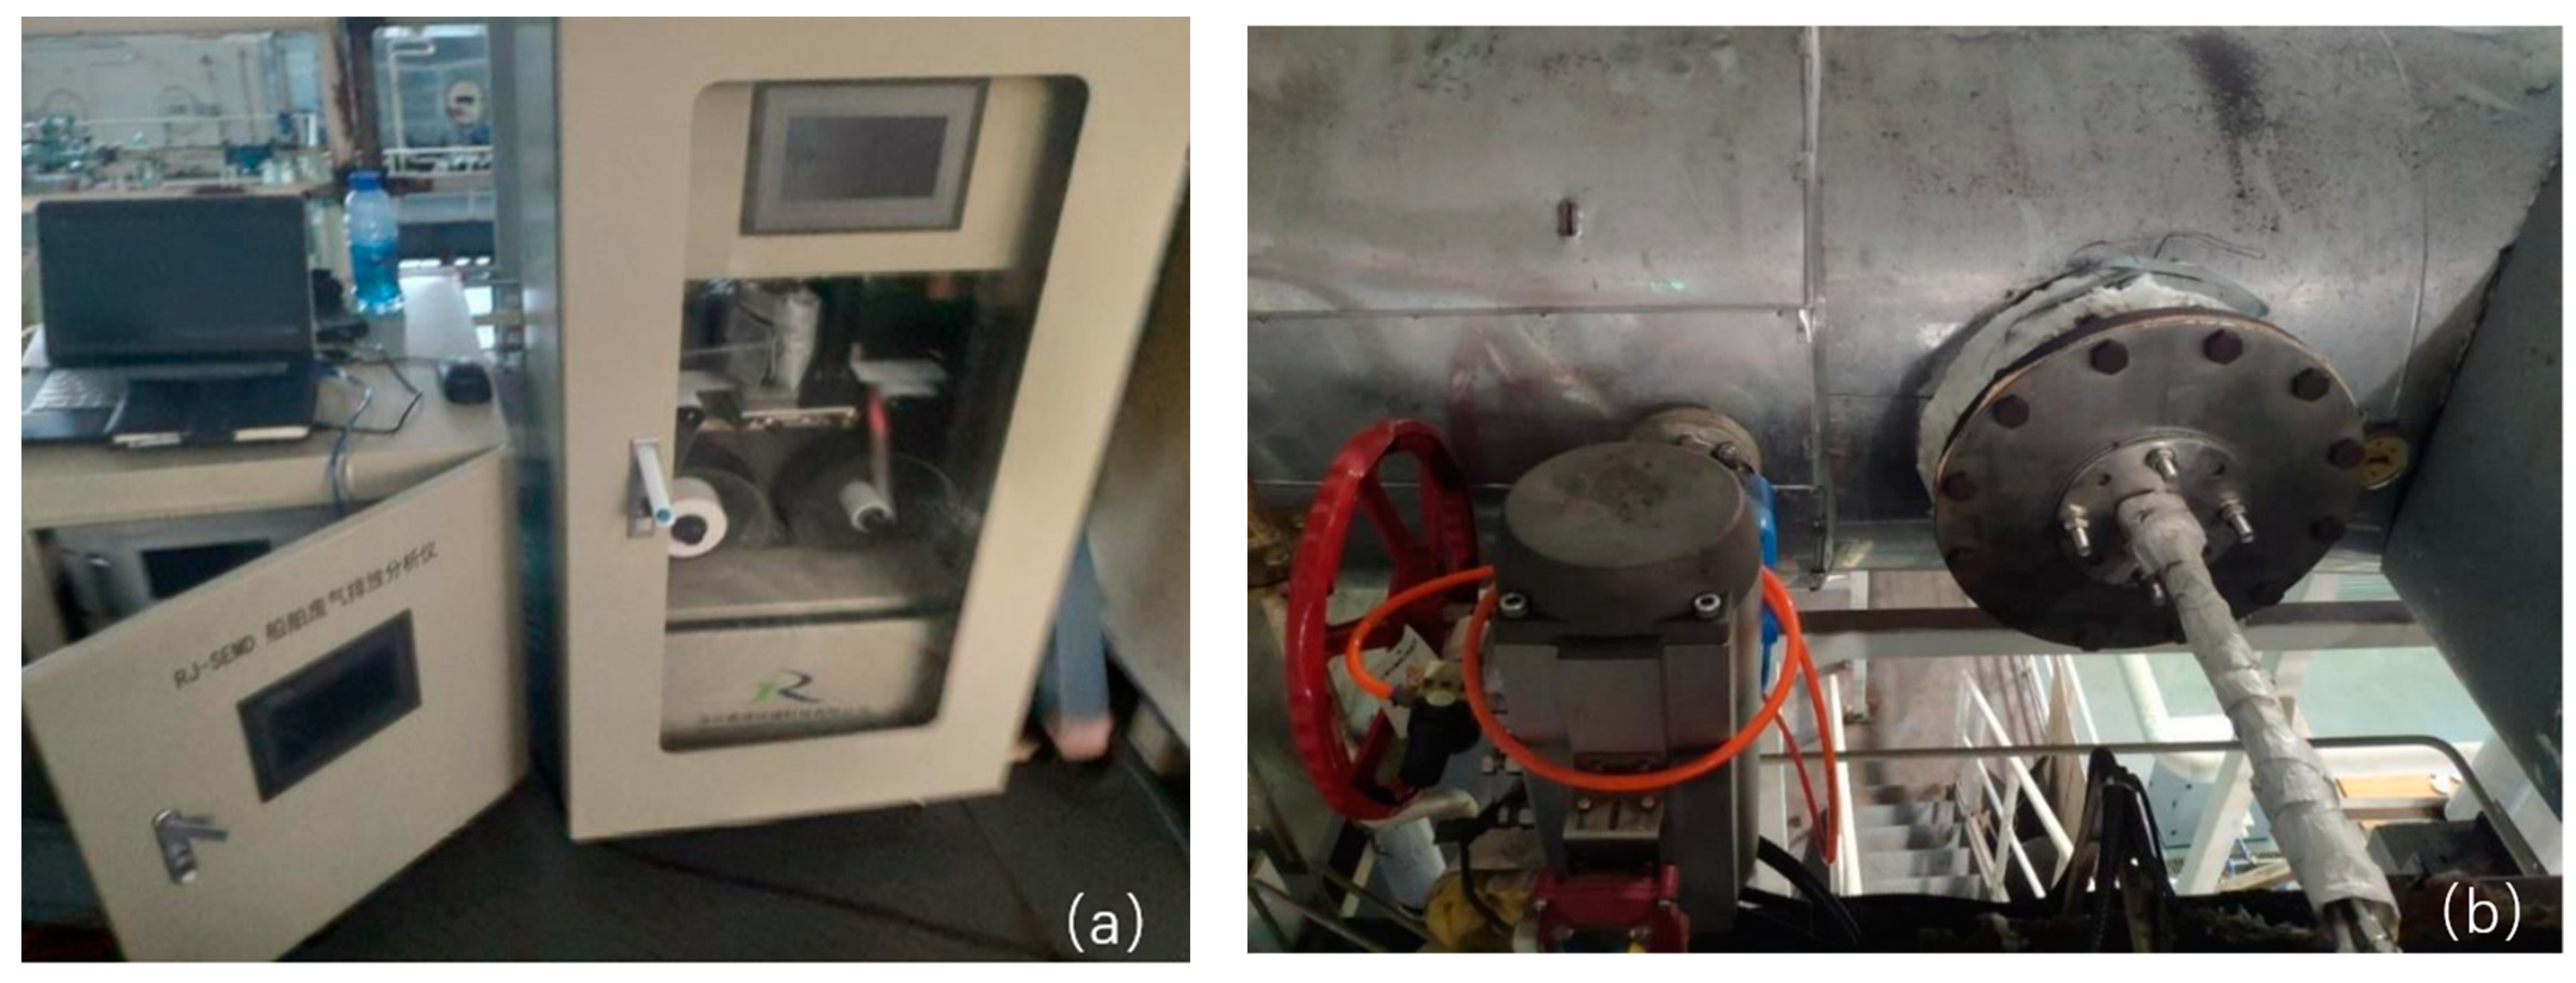
The measurements were carried out in the engine laboratory conditions using a marine engine. Figure 3 shows the MAN B&W 6S35ME-B9 diesel engine used in the experiment, which is an electronically controlled two-stroke six-cylinder crosshead marine main engine having a rated power of 3400 kW, rated rotational speed of 142 rpm, and maximum gas flow of 30,000 kg/h. We used marine oil obtained in the experiment by mixing RME with 2.5% m/m FSC and MGO with 0.1% m/m FSC. If the ship fuel is unchanged, the operating conditions of the main engine significantly affect the CO2 emissions of the ship exhaust. Therefore, the engine power was varied within a range of 0–100% to generate 13 different stable operating conditions, as listed in Table 2. We obtained different concentrations of CO2 emissions from ship exhaust under different stable operating conditions. We used online monitoring equipment (RJ-CEMD) to obtain the true values of the CO2 content in the ship exhaust plume and applied flue gas dilution sampling technology to automatically and continuously measure the CO2 content in the ship exhaust and other environmental parameters such as the content, temperature, and pressure of NO2, SO2, and other polluting gases. The sampling probe of the online monitoring equipment was installed in a perforated pipe serving as the chimney of the ship, and the exhaust gas was directly extracted. Figure 4 shows the online monitoring equipment and sampling probes used in the experiment.
The experiment was performed on two clear and cloudless days, and ~200,000 mid-infrared spectral images were collected in total with different wavelengths and under different operating conditions. Data preprocessing to filter out invalid and redundant data retained 190,844 mid-infrared spectral images with a size of 224 × 224 pixels, in addition to the corresponding true values for the power, time, band, and CO2 content of each image.
2.2. Prediction Model
We selected a CNN as the basis of the design for our prediction model of the CO2 content. Using the powerful functions of the CNN for image feature extraction, we can extract the radiation characteristics from mid-infrared spectral images of the exhaust plume and map the relationship between a mid-infrared spectral image and the true value of the CO2 content to accurately predict the CO2 content in the ship exhaust.
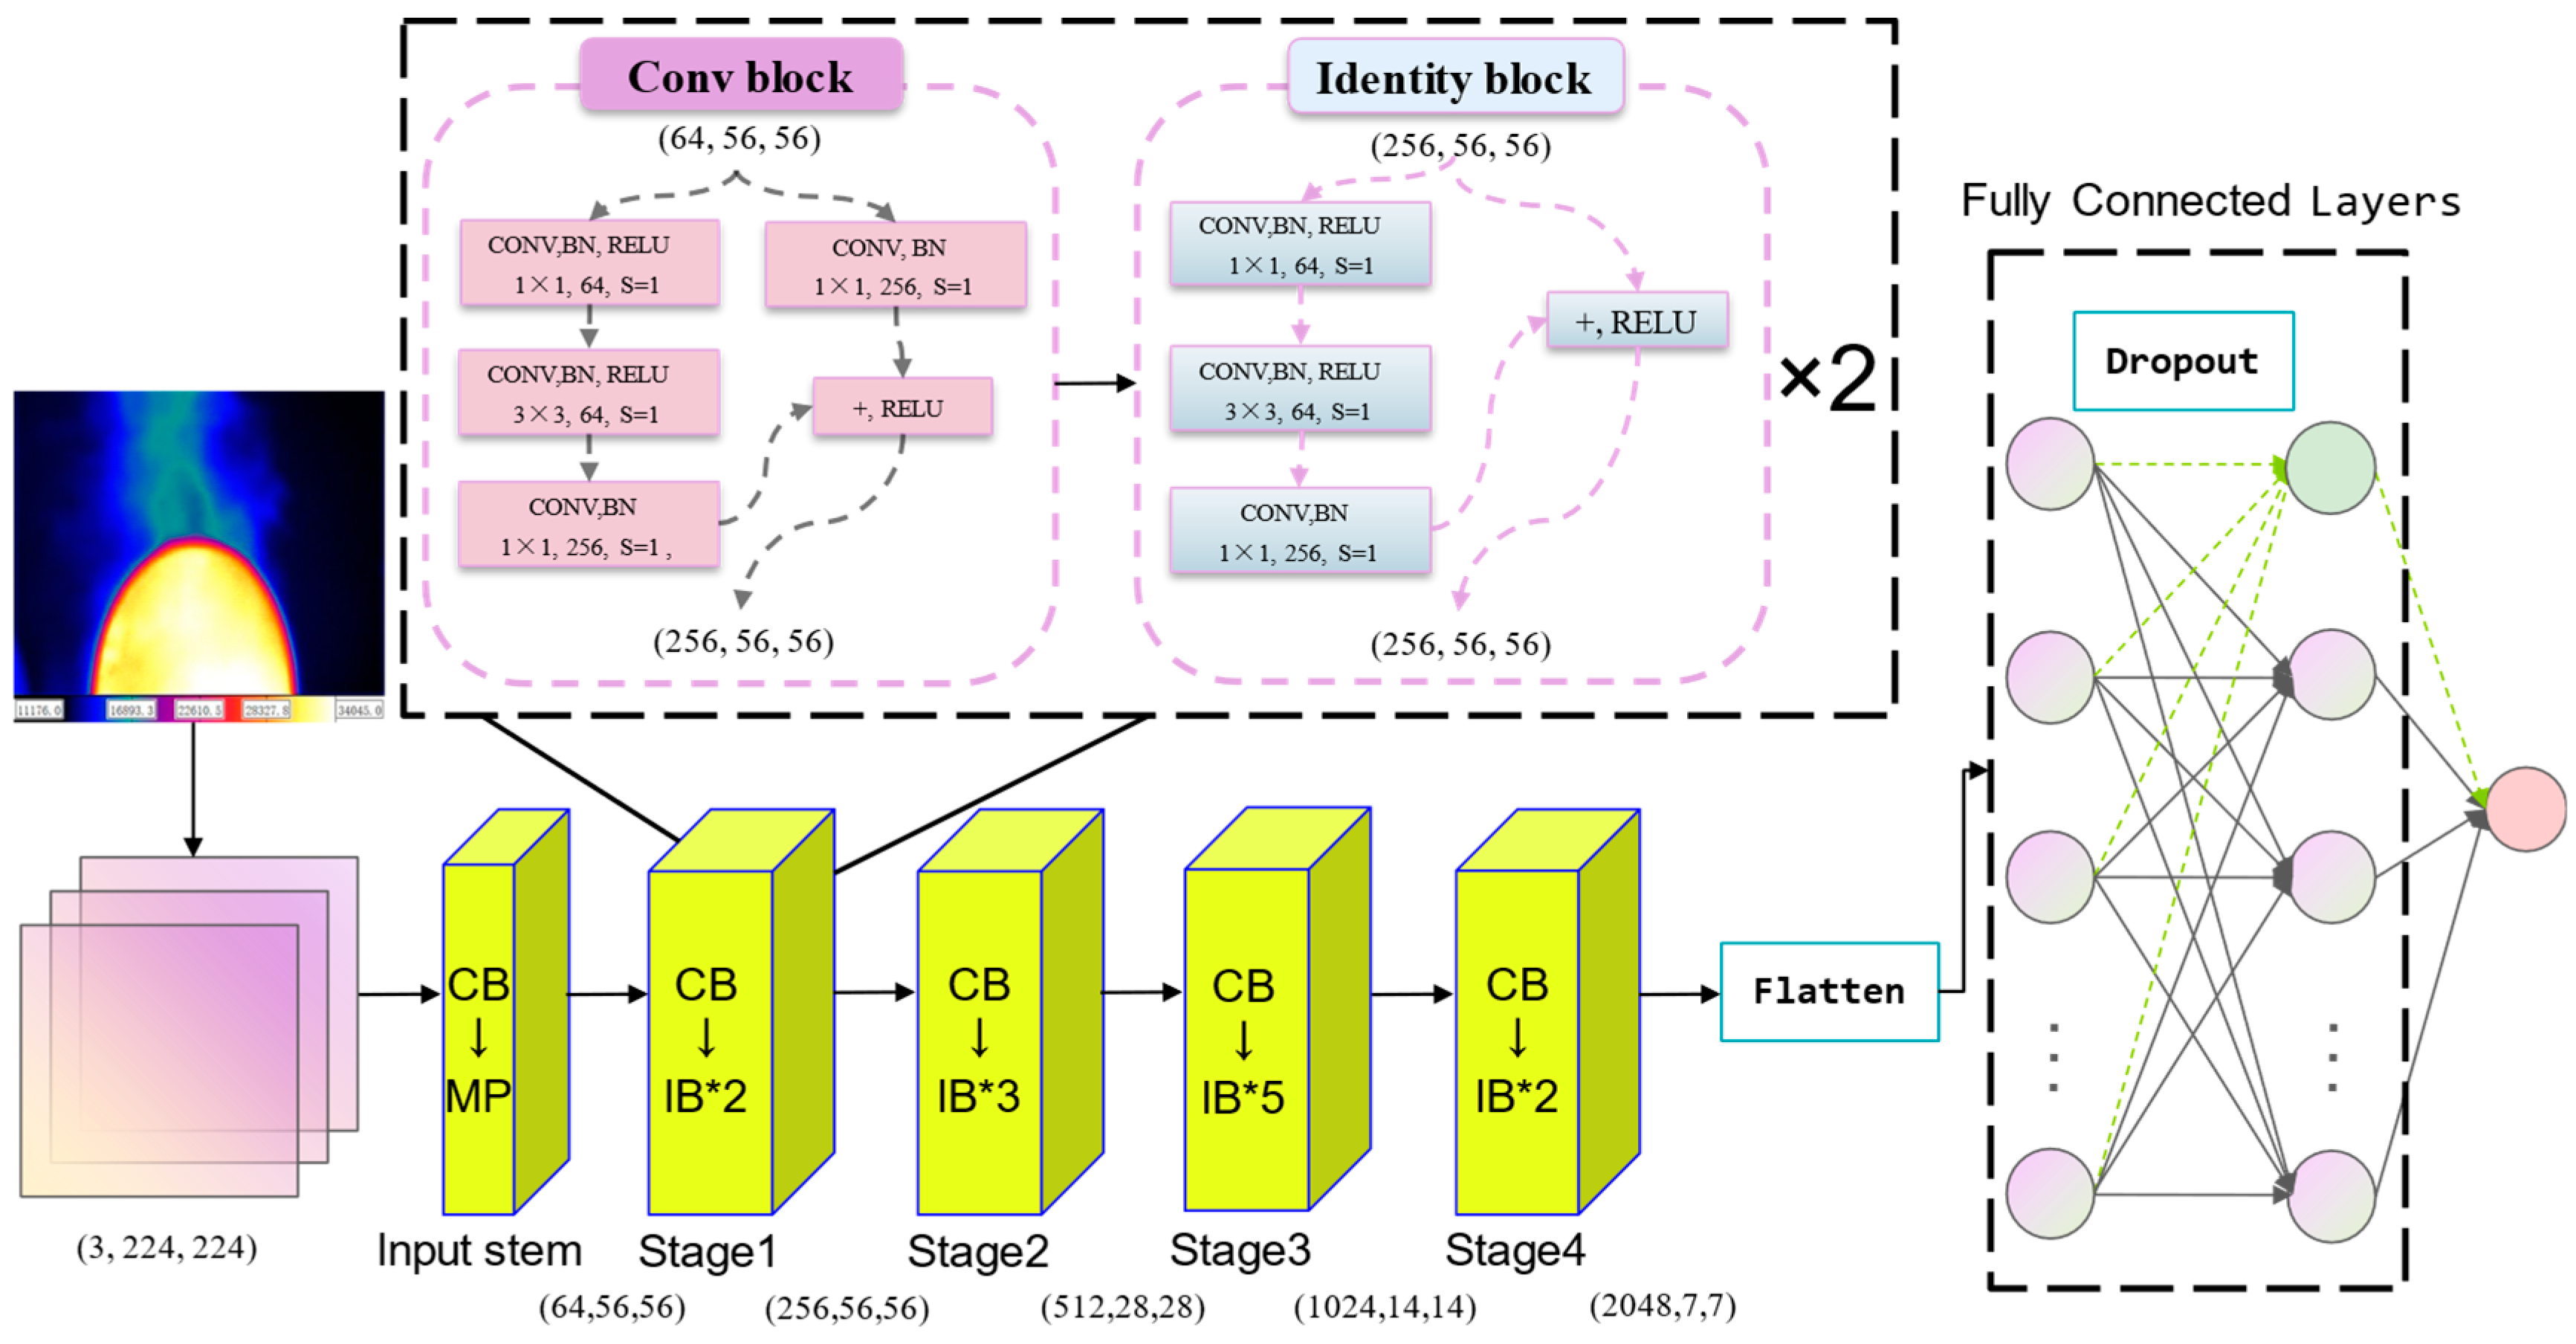
Owing to the working principle of a CNN, a large number of weights are generated by each layer. Therefore, training a network requires large amounts of time and computational resources. To solve this limitation, we introduced transfer learning to the network design, which involves applying a mature network model trained on large datasets to a task. For the network to work on our data, it is necessary to remove the top layer from the loaded pretraining model, set the weight of the network structure to the weight of the image network, and freeze the pretraining layer to ensure that only the input data participate in the training to avoid losing the features they have learned during the training process. Based on our available computational resources and a comparison of existing mature CNNs, we selected Residual Network 50 (ResNet50) for our experiments. ResNet50 is characterized by the addition of residual learning to a conventional CNN to solve the problems of gradient dispersion and reduced accuracy of training sets for deep networks. Figure 5 shows a structural diagram of the CNN used for our CO2 content prediction model.
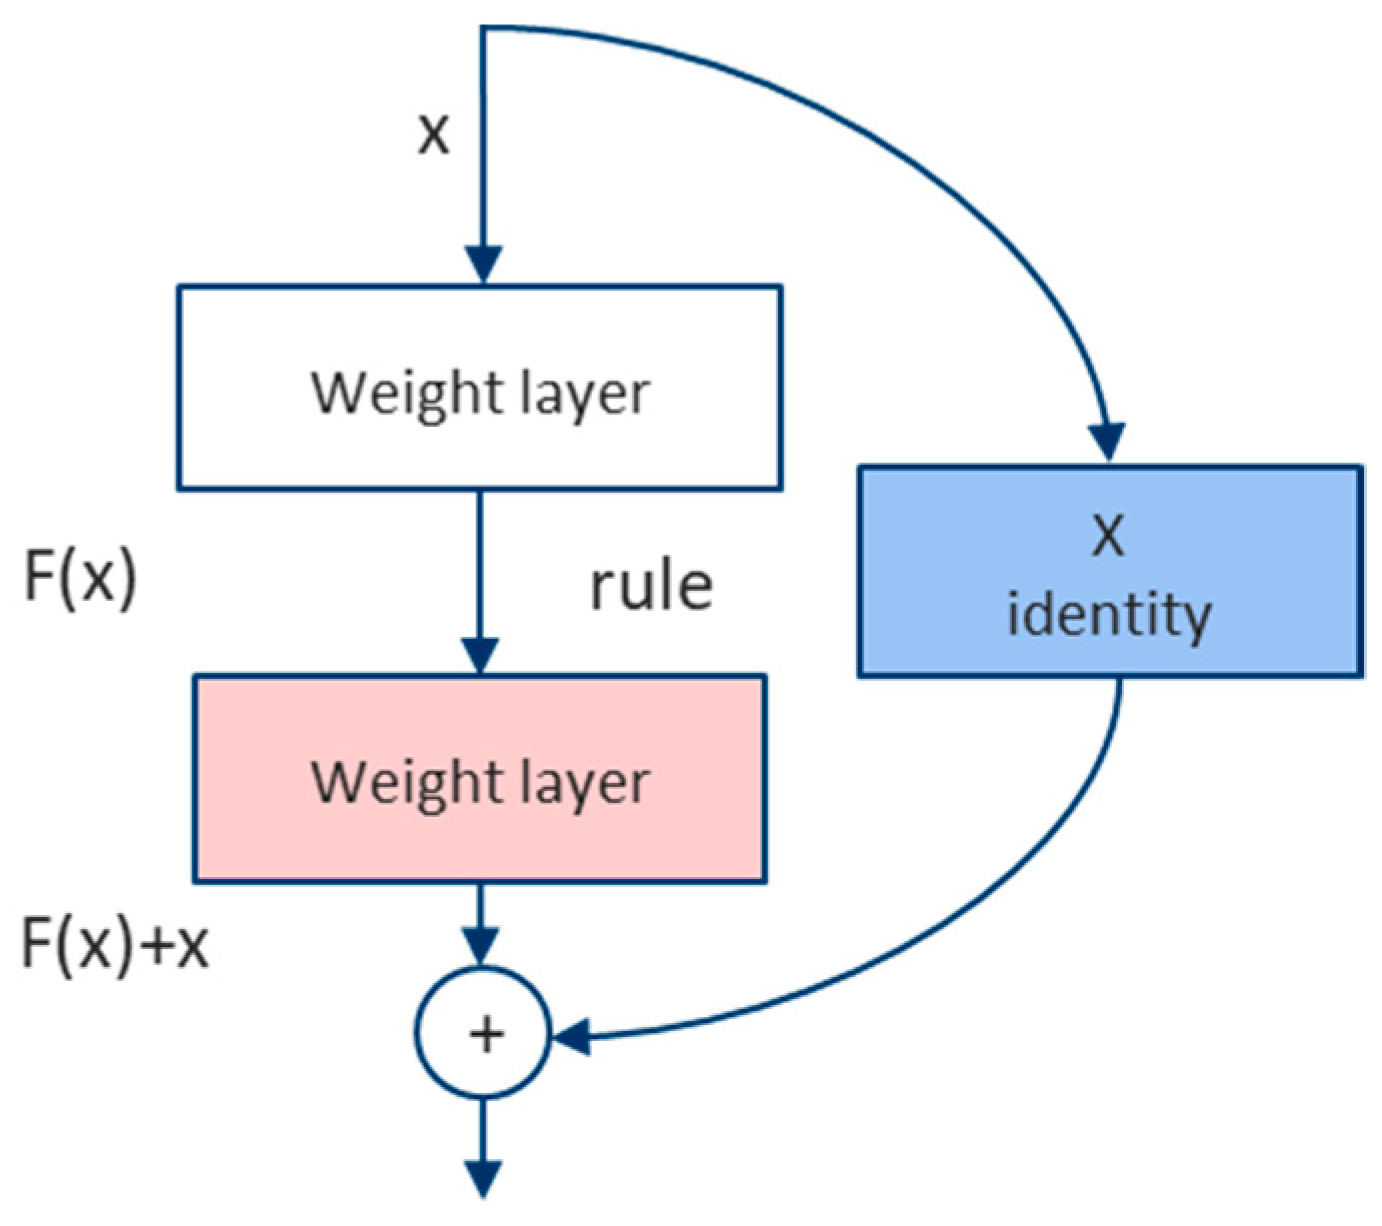
The core unit of ResNet50 is a residual block, for which Figure 6 shows a schematic [22]. The core operation of a residual block is to add the output of the previous layer (or layers) to the calculation of the current layer and to input the sum in the activation function as the output of the current layer. This is expressed as follows:
where x is the input, F(x) is the output of the residual block before the activation function of the second layer, Wi is the weight, and σ is the activation function of the rectified linear unit (ReLU). In Equation (1), the dimensions of the terms are equal, and therefore x and F(x) can be added element by element. If the dimensions are different, then Equation (2) is used, where Ws is needed for the linear mapping of x.
The residual block primarily works in the convolutional layer, which is the key to learning the radiation characteristics from mid-infrared spectroscopy images of a ship’s exhaust plume. The radiation characteristics are extracted from the sliding convolution operation of the convolution kernel on an image of the exhaust plume. The convolutional layer of the network has five stages in which each stage contains different combinations of two basic residual blocks: Conv Block (CB) and Identity Block (IB). CBs change the dimensions of the input and output (channel number and size), and they cannot be continuously concatenated to change the dimensions of the network. IBs can be concatenated with the same input and output dimensions (channel number and size) to deepen the network. The input mid-infrared spectral image data undergoes five stages of convolution operations in the convolutional layer and outputs a large amount of multidimensional data. We can use the Flatten function to compress the multidimensional data output from the convolutional layer into one-dimensional data and input it to the fully connected layer. Then, backpropagation of the network inversely generates the predicted CO2 content of the ship’s exhaust plume. To prevent overfitting, we can use the Dropout function to randomly deactivate 50% of the neurons, which simplifies the network structure and increases the prediction accuracy.
3. Results
3.1. Data Processing
A three-channel image of 224 × 224 pixels was set as the ResNet50 input. To meet the input requirements, we performed preprocessing work such as false color setting and noise reduction on the obtained single-channel infrared spectral images. We used the built-in tools Pandas and Numpy in Python (Python 3.12. 0a1) to preprocess the obtained experimental data and establish a relationship between the mid-wave infrared spectral image data of the ship’s exhaust plume and the true CO2 content based on time information. We set the mean square error (MSE) as the loss function and trained the model by using Adam as the optimizer. The learning rate was set to a low value of 0.0001 to accelerate the convergence of the fully connected layer. The mean absolute error (MAE) and mean absolute percentage error (MAPE) were selected as evaluation functions for the trained model. The collected eight-channel data were divided into training and test sets at a ratio of 9:1.
3.2. Analysis
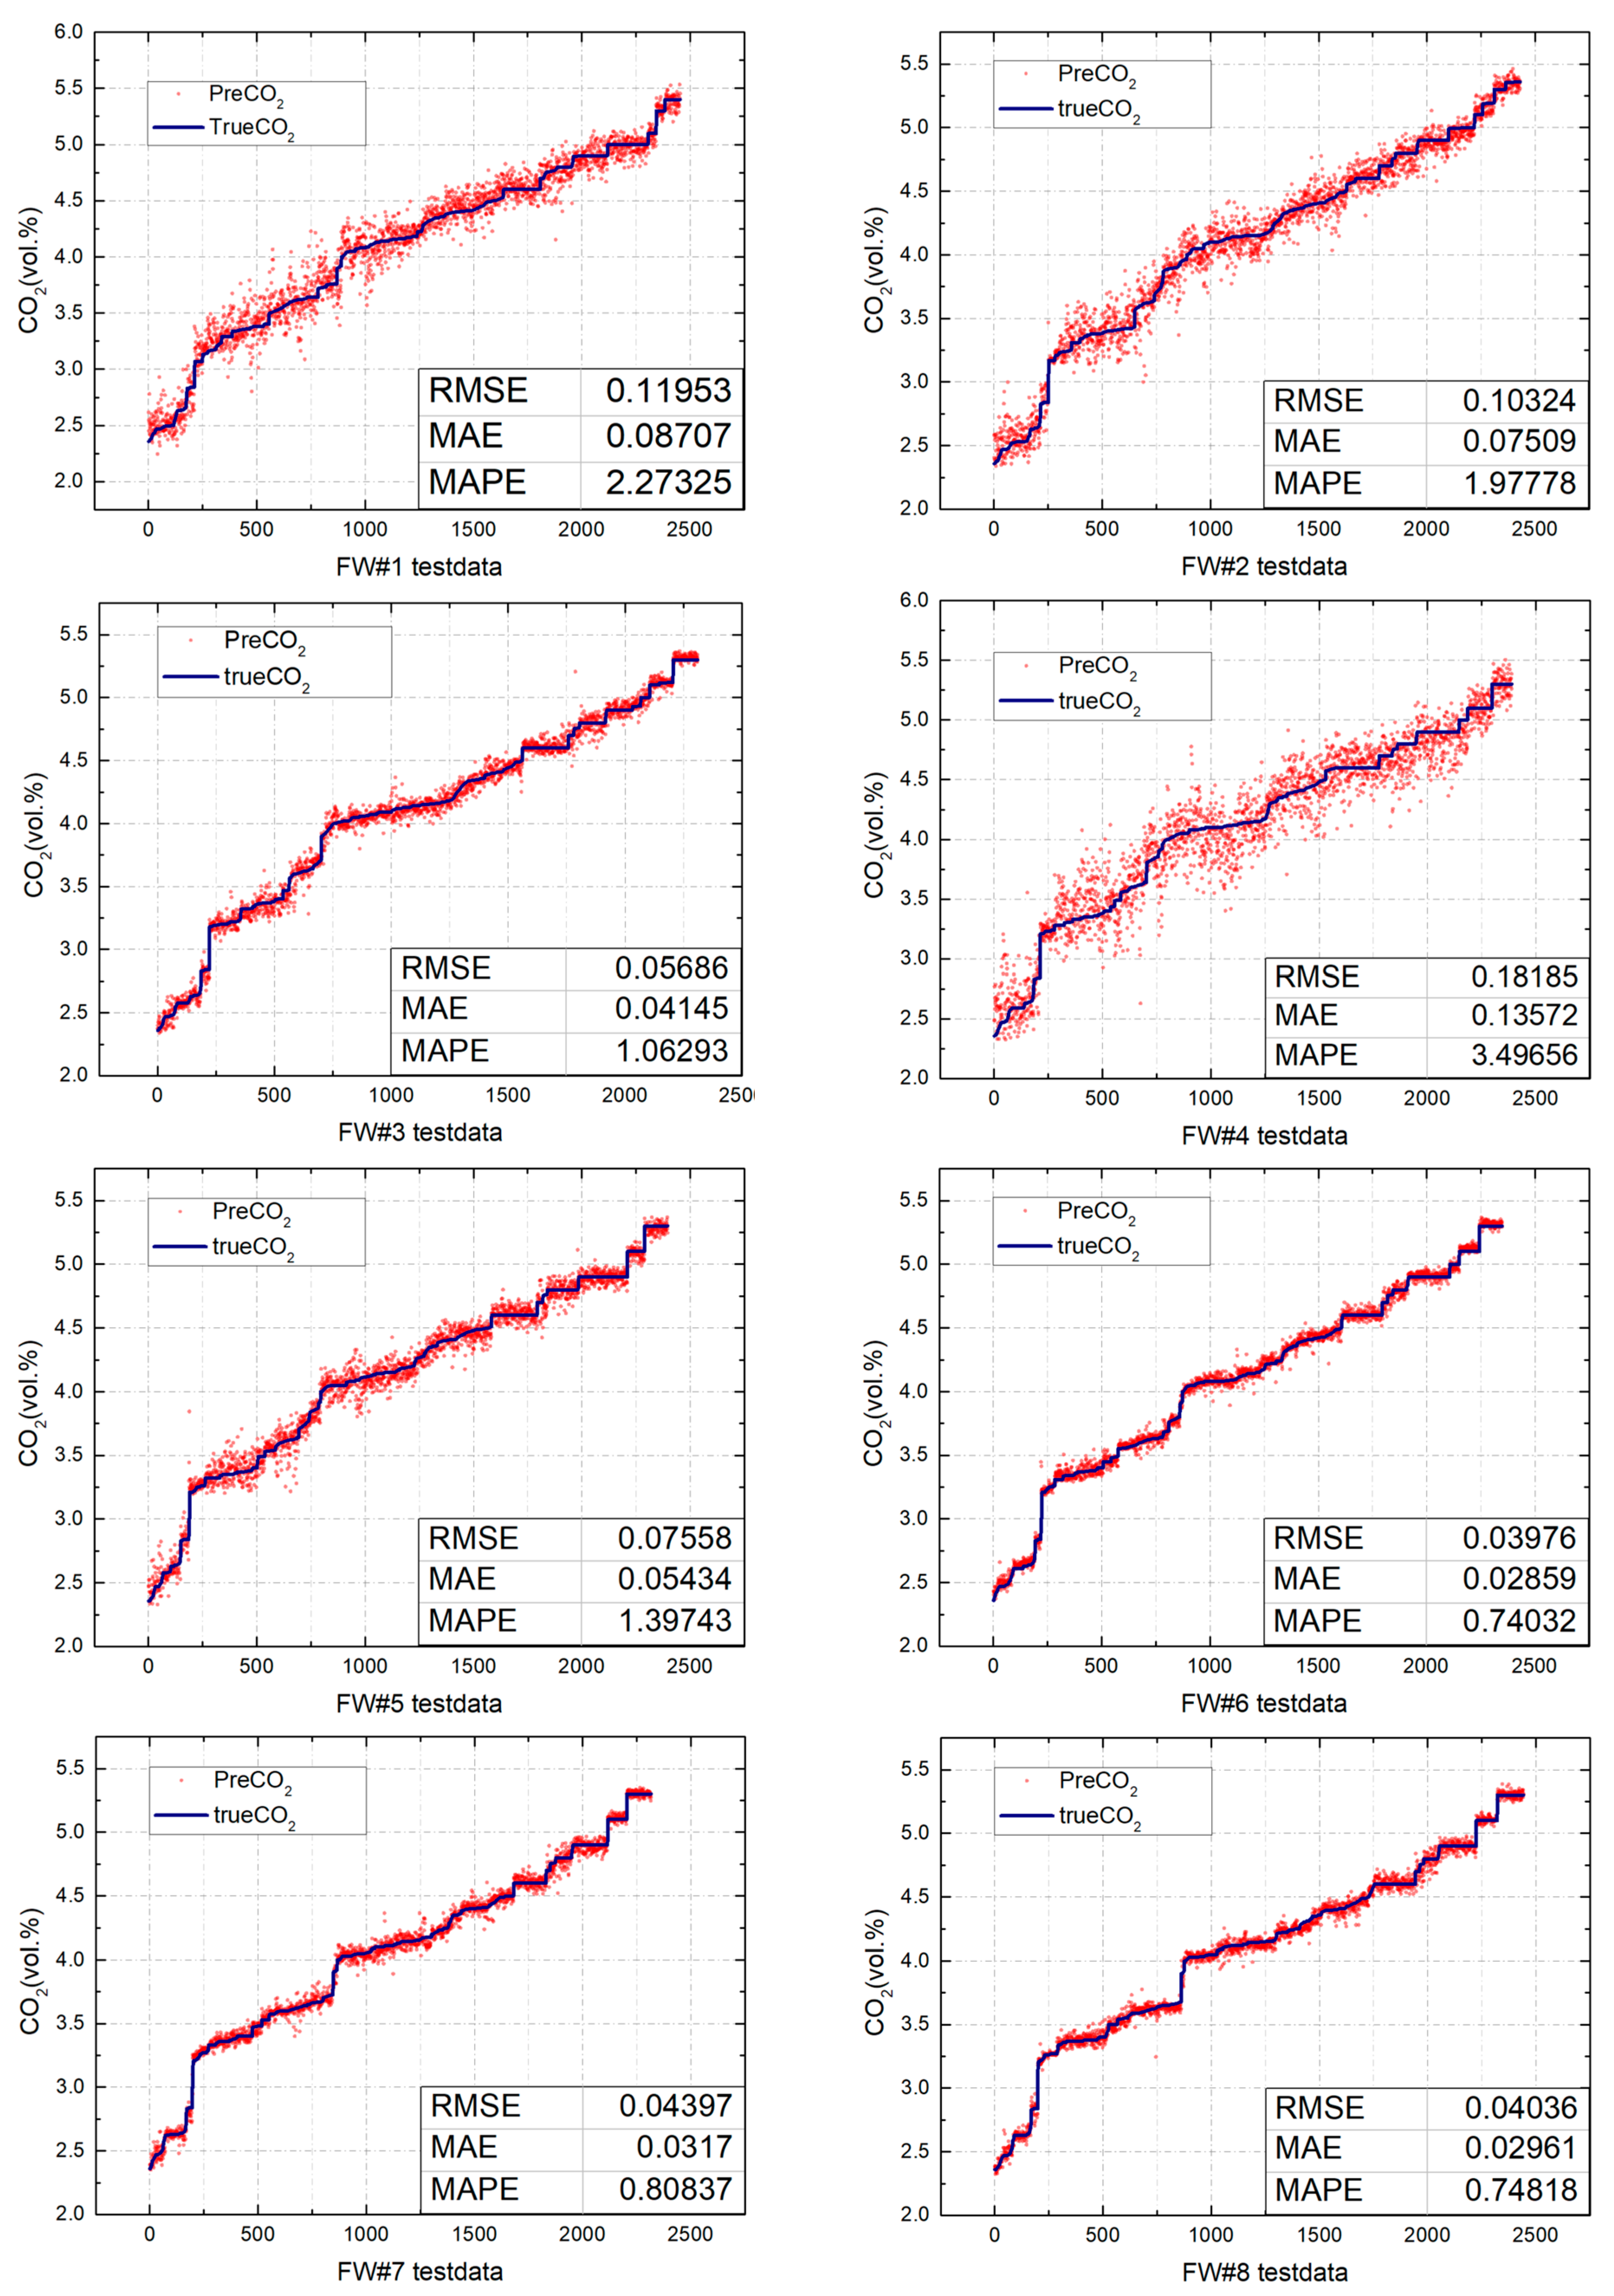
The trained model was applied to predicting the CO2 content based on the eight channels of each infrared image. The RMSE, MAE, and MAPE were used as evaluation indicators of the prediction accuracy. Figure 7 compares the true and predicted values for the CO2 content sorted by the magnitude of the true value. Among these, the horizontal axis describes the data sequence number of each channel sorted by CO2 concentration, whereas the vertical axis represents the CO2 concentration value. Visual comparison demonstrates that the distribution of predicted values was relatively dispersed in channels FW#1, FW#2, and FW#4, and the error between the predicted and true values was considerably greater in these channels than in the other channels. The RMSE, MAE, and MAPE for these channels were higher than for the other five channels, which confirmed the lower prediction accuracy. Comparative analysis of the eight datasets demonstrated that channel FW#6 (band 3.670–4.020 µm) resulted in the best prediction accuracy with the lowest RMSE, MAE, and MAPE, followed by channel FW#8. Although the prediction results varied from band to band, the overall prediction accuracy was good with all channels having an RMSE of <0.2 vol.%, MAE of <0.15 vol.%, and MAPE of <3.5%. These results indicate that the error between the predicted and actual values for the CO2 content was small, which demonstrates the high accuracy of the prediction model and feasibility of our proposed method.
4. Discussion
Most gases have radiation properties, among which triatomic, multi-atomic, and diatomic gases with asymmetric molecular structures have strong radiation and absorption capabilities. The exhaust plume of a ship contains large amounts of water vapor and CO2, in addition to nitrogen oxides (NOX), sulfur oxides (SOX), carbon monoxide (CO), hydrocarbons (HC), particulate matter (PM), and other pollutants. At high temperatures, the absorption and radiation of the multiple gas components interfere with each other. This makes distinguishing the radiation energy emitted by CO2 in the ship exhaust difficult. Infrared images are obtained by detecting the energy radiated outward from an object and represent the distribution of infrared radiation in the acquired space. The temperature and radiation distributions of different objects have their own characteristics that affect their energy distribution in infrared images. In contrast to the conventional approach of using optical remote sensing to monitor exhaust gas, we chose to use a thermal infrared camera to capture the entire exhaust plume. We then used a CNN to extract features from the infrared image, which can be used by the prediction model to predict the CO2 content. This ensures a high prediction accuracy and simplified learning process. A comparative analysis of the radiation curves of multiple gas components in the exhaust plume demonstrated that certain gas components such as NO2 had no or weak radiation phenomena in channel FW#6. Thus, they had less effect on this band, which improved the prediction accuracy. Furthermore, channel FW#8 was located in a band with weak radiation interference from SO2, which improved the prediction accuracy. This explains the high prediction accuracy with channel FW#8, which was inferior only to that of channel FW#6.
This experiment involved simulating the emissions of a ship’s exhaust plume, which limited the control variable to the power of the main engine. Because the ship power can considerably vary under actual operating conditions, further experiments are necessary to collect continuous values for the power of the main engine and input them into the model for learning and updating to realize practical application of the proposed method. The experiment was conducted on sunny and cloudy days, and we ignored the possible effects of noise generated by the skylight background on the monitoring images of the exhaust plumes during actual navigation. The effects of an overcast sky, rain, fog, and other adverse weather conditions should be considered for infrared image acquisition. However, our proposed method presents a new approach to monitoring the CO2 content of ship exhaust. The results demonstrate the feasibility of combining infrared spectral images and a CNN to predict the CO2 concentration in the exhaust plume for monitoring the carbon emissions of ships. Moreover, compared with other commonly used monitoring methods, such as sniffing [35] and DOAS [36], it reduces the difficulty of monitoring while ensuring high inversion accuracy.
5. Conclusions
Under the measurement conditions of marine main engine in the laboratory, we performed a bench experiment to collect data from a ship’s exhaust plume and used a thermal infrared camera and online monitoring equipment to obtain eight channels of mid-infrared spectral images and the true CO2 content at the corresponding time. A CO2 content prediction model was established based on ResNet50, where preprocessed mid-infrared spectral images of each channel and the corresponding real-time CO2 content data were simultaneously input. The radiation characteristics of mid-infrared spectral images were extracted by convolution, and the relationship between the true CO2 content and the radiation characteristics of the exhaust plume were mapped using deep learning. The trained model was then used to predict the CO2 content in the ship exhaust. Experimental results demonstrated that the error between the predicted and true CO2 content was small for all eight channels, which demonstrated the high prediction accuracy of the prediction model. These results demonstrate the feasibility of our proposed method and that infrared images can be used to predict the CO2 content of an exhaust plume, which can contribute to the development of a new approach to monitoring and regulating the carbon emissions of ships. In the future, this method will be used to predict the concentration of other gases in ship exhaust and further explore the prediction of sulfur content in ship fuel.
Author Contributions
Conceptualization, Z.Z. and H.W.; methodology, Z.Z.; software, H.W.; validation, Y.L., K.C. and Z.Z.; formal analysis, Z.Z.; investigation, K.C.; resources, Z.Z.; data curation, H.W.; writing—original draft preparation, H.W.; writing—review and editing, Z.Z., H.W., K.C. and Y.L.; visualization, K.C.; supervision, Y.L.; project administration, Y.L.; funding acquisition, K.C. All authors have read and agreed to the published version of the manuscript.
Funding
This work was financially supported by the National Natural Science Foundation of China (52101398).
Data Availability Statement
The data presented in this study are available on request from the corresponding author. The data are not publicly available because of a few restrictions, e.g., privacy or ethical.
Acknowledgments
We appreciate the assistance provided by Zheng Wenbo and others during the early stages of the experiment.
Conflicts of Interest
The authors declare no conflict of interest.
References
- Hockstad, L.; Hanel, L. Inventory of US Greenhouse Gas Emissions and Sinks; Environmental System Science Data Infrastructure for a Virtual Ecosystem. 2018. Available online: https://www.osti.gov/dataexplorer/biblio/dataset/1464240) (accessed on 21 May 2023).
- Central Committee of the Communist Party of China; State Council. Opinions of the Central Committee of the Communist Party of China and the State Council on Completely and Accurately Implementing the New Development Concept and Doing a Good Job of Carbon Peak and Carbon Neutralization. In Chinese Enterprise Reform and Development 2021 Blue Book; China Commerce and Trade Press: Beijing, China, 2021; Volume 6. [Google Scholar]
- IMO. Fourth IMO GHG Study 2020 Full Report. Int. Marit. Organ. 2021, 6, 951–952. [Google Scholar]
- Eyring, V.; Isaksen, I.S.; Berntsen, T.; Collins, W.J.; Corbett, J.J.; Endresen, O.; Grainger, R.G.; Moldanova, J.; Schlager, H.; Stevenson, D.S. Transport impacts on atmosphere and climate: Shipping. Atmos. Env. 2010, 44, 4735–4771. [Google Scholar] [CrossRef]
- UNCTAD. Review of Maritime Report 2021; United Nations Publications: New York, NY, USA, 2021. [Google Scholar]
- United Nations. Trade and Development Report 2021, from Recovery Resilience: The Development Dimension Overview; United Nations: San Francisco, CA, USA, 2021. [Google Scholar]
- IMO (International Maritime Organization). Guidelines on the Operational Carbon Intensity Reduction Factors Relative to Reference Lines (CII Reduction Factors Guidelines, G3); MEPC: London, UK, 2021; Volume 338. [Google Scholar]
- Beecken, J. Remote Measurements of Gas and Particulate Matter Emissions from Individual Ships. Ph.D. Dissertation, Chalmers Tekniska Hogskola, Gothenburg, Sweden, 2015. [Google Scholar]
- Pirjola, L. Mobile measurements of ship emissions in two harbour areas in Finland. Atmos. Meas. Tech. 2014, 7, 149–161. [Google Scholar] [CrossRef]
- Fan, Z.; Yunli, F.; Jing, Z.; Bowen, A. Ship emission monitoring sensor web for research and application. Ocean Eng. 2022, 249, 110980. [Google Scholar] [CrossRef]
- Kattner, L.; Mathieu-Üffing, B.; Burrows, J.P.; Richter, A.; Schmolke, S.; Seyler, A.; Wittrock, F. Monitoring compliance with sulfur content regulations of shipping fuel by in situ measurements of ship emissions. Atmos. Chem. Phys. 2015, 15, 10087–10092. [Google Scholar] [CrossRef]
- Anand, A.; Wei, P.; Gali, N.K.; Sun, L.; Yang, F.; Westerdahl, D.; Zhang, Q.; Deng, Z.; Wang, Y.; Liu, D.; et al. Protocol development for real-time ship fuel sulfur content determination using drone based plume sniffing microsensor system. Sci. Total Environ. 2020, 744, 140885. [Google Scholar] [CrossRef]
- Shen, L.; Wang, Y.; Liu, K.; Yang, Z.; Shi, X.; Yang, X.; Jing, K. Synergistic path planning of multi-UAVs for air pollution detection of ships in ports. Trans. Res. E-Log. 2020, 144, 102128. [Google Scholar] [CrossRef]
- Balzani Lööv, J.M.; Alfoldy, B.; Gast, L.F.; Hjorth, J.; Lagler, F.; Mellqvist, J.; Beecken, J.; Berg, N.; Duyzer, J.; Westrate, H.; et al. Field test of available methods to measure remotely SOx and NOx emissions from ships. Atmos. Meas. Tech. 2014, 7, 2597–2613. [Google Scholar] [CrossRef]
- Gagnon, J.P.; Larivière-Bastien, M.; Thibodeau, J.; Tombet, S.B. Remote estimation of sulfur content in fuel from SO2 and CO2 quantification of ship exhaust plumes. In Proceedings of the 2021 11th Workshop on Hyperspectral Imaging and Signal Processing: Evolution in Remote Sensing (WHISPERS), Amsterdam, The Netherlands, 24–26 March 2021; pp. 1–4. [Google Scholar]
- Zhang, Z.; Zheng, W.; Cao, K.; Li, Y.; Xie, M. An improved method for optimizing detection bands of marine exhaust SO2 concentration in ultraviolet dual-band measurements based on signal-to-noise ratio. Atmos. Pollut. Res. 2022, 13, 101479. [Google Scholar] [CrossRef]
- Hao, W.; Chao, W.; Enhui, C.; Zhirui, Y. Development of a spectrum-based ship fuel sulfur content real-time evaluation method. Mar. Pollut. Bull. 2023, 188, 114484. [Google Scholar] [CrossRef]
- Yang, Z.H.; Zhang, Y.K.; Chen, Y.; Li, X.F.; Jiang, Y.; Feng, Z.Z.; Zhou, D.F. Simultaneous detection of multiple gaseous pollutants using multi-wavelength differential absorption LIDAR. Opt. Commun. 2022, 518, 128359. [Google Scholar] [CrossRef]
- Kumar, K.A.; Prasad, A.Y.; Metan, J. A hybrid deep CNN-Cov-19-Res-Net Transfer learning architype for an enhanced brain tumor detection and classification scheme in medical image processing. Biomed. Signal Process. Control. 2022, 76, 103631. [Google Scholar] [CrossRef]
- Rajeshkumar, G.; Braveen, M.; Venkatesh, R.; Shermila, P.J.; Prabu, B.G.; Veerasamy, B.; Jeyam, A. Smart office automation via faster R-CNN based face recognition and internet of things. Meas. Sens. 2023, 27, 100719. [Google Scholar] [CrossRef]
- Muhammet, F.A.; Akif, D.; Abdullah, Y.; Alper, Y. HVIOnet: A deep learning based hybrid visual–inertial odometry approach for unmanned aerial system position estimation. Neural Netw. 2022, 155, 461–474. [Google Scholar] [CrossRef]
- He, K.; Zhang, X.; Ren, S.; Sun, J. Deep residual learning for image recognition. In Proceedings of the 2016 IEEE Conference on Computer Vision and Pattern Recognition (CVPR), Las Vegas, NV, USA, 27–30 June 2016; pp. 770–778. [Google Scholar] [CrossRef]
- Yu, Y.; Liang, S.; Samali, B.; Nguyen, T.N.; Zhai, C.; Li, J.; Xie, X. Torsional capacity evaluation of RC beams using an improved bird swarm algorithm optimised 2D convolutional neural network. Eng. Struct. 2022, 273, 115066. [Google Scholar] [CrossRef]
- Yu, Y.; Li, J.; Li, J.; Xia, Y.; Ding, Z.; Samali, B. Automated damage diagnosis of concrete jack arch beam using optimized deep stacked autoencoders and multi-sensor fusion. Dev. Built. Environ. 2023, 14, 100128. [Google Scholar] [CrossRef]
- Peter, J.M.; Robert, O.K.; Jonathan, G. Chapter 6—Surface-based thermal infrared spectrometers. In Field Measurements for Passive Environmental Remote Sensing; Elsevier: Amsterdam, The Netherlands, 2023; pp. 101–120. [Google Scholar] [CrossRef]
- Jiang, C.; Ren, H.; Ye, X.; Zhu, J.; Zeng, H.; Nan, Y.; Huo, H. Object detection from UAV thermal infrared images and videos using YOLO models. Int. J. Appl. Earth Obs. Geoinf. 2022, 112, 102912. [Google Scholar] [CrossRef]
- Ji, D.-C.; Min, Y.-K. A Sensor Fusion System with Thermal Infrared Camera and LiDAR for Autonomous Vehicles and Deep Learning Based Object Detection; ICT Express: Tamworth, UK, 2022. [Google Scholar] [CrossRef]
- Prata, A.J.; Cirilo, B. Retrieval of sulfur dioxide from a ground-based thermal infrared imaging camera. Atmos. Meas. Tech. 2014, 7, 2807–2828. [Google Scholar] [CrossRef]
- Jiacheng, W.; Yu, H.; Fei, W.; Yuyu, H.; Xiaoxu, R.; Mingjun, C.; Yang, W.; Honghao, Y.; Junyan, L. Convolutional neural network assisted infrared imaging technology: An enhanced online processing state monitoring method for laser powder bed fusion. Infrared Phys. Technol. 2023, 131, 104661. [Google Scholar] [CrossRef]
- Rongwei, Y.; Shun, G.; Yong, H.; Huajun, D.; Shubiao, Q.; Yong, P.; Kehong, W. Prediction of variable-groove weld penetration using texture features of infrared thermal images and machine learning methods. J. Mater. Res. Technol. 2023, 23, 1039–1051. [Google Scholar] [CrossRef]
- Tombet, S.B.; Gatti, S.; Eisele, A.; Morton, V. Observation and quantification of CO2 passive degassing at sulphur banks from Kilauea Volcano using thermal infrared multispectral imaging. In Proceedings of the Copernicus Meetings, Online, 4–8 May 2020. [Google Scholar]
- Platt, U.; Bobrowski, N.; Butz, A. Ground-based remote sensing and imaging of volcanic gases and quantitative determination of multi-species emission fluxes. Geosciences 2018, 8, 44. [Google Scholar] [CrossRef]
- Kai, C.; Zhenduo, Z.; Ying, L.; Wenbo, Z.; Ming, X. Ship fuel sulfur content prediction based on convolutional neural network and ultraviolet camera images. Environ. Pollut. 2021, 273, 116501. [Google Scholar]
- Kai, C.; Zhenduo, Z.; Ying, L.; Ming, X.; Wenbo, Z. Surveillance of ship emissions and fuel sulfur content based on imaging detection and multi-task deep learning. Environ. Pollut. 2021, 288, 117698. [Google Scholar]
- Hashim, M.; Ng, H.L.; Zakari, D.M.; Sani, D.A.; Chindo, M.M.; Hassan, N.; Azmy, M.M.; Pour, A.B. Mapping of greenhouse gas concentration in Peninsular Malaysia Industrial Areas using unmanned aerial vehicle-based sniffer sensor. Remote Sens. 2023, 15, 255. [Google Scholar] [CrossRef]
- Siozos, P.; Psyllakis, G.; Velegrakis, M. Remote operation of an open-path, laser-based instrument for atmospheric CO2 and CH4 monitoring. Photonics 2023, 10, 386. [Google Scholar] [CrossRef]
Figure 1.
Schematic of the bench experiment.

Figure 2.
Mid-infrared spectral image in eight channels.

Figure 3.
Engine used in the experiment.

Figure 4.
(a) Online monitoring equipment and (b) sampling probes.

Figure 5.
Structural diagram of the convolutional neural network.

Figure 6.
Structural diagram of the residual block.

Figure 7.
Predicted CO2 contents in the eight channels.


Table 1.
Eight channels used in the bench experiment and their band information.
| Filter Wheel Position | Content | OD | Cut-In [µm] | Cut-Out [µm] | Average Transmittance [%] |
|---|---|---|---|---|---|
| 1 | Band-Pass Filter BBP 3000 to 5000 | N/A | 3.0 | 5.0 | N/A |
| 2 | Neutral Density filter OD 0.6 | 0.6 | N/A | N/A | 25% |
| 3 | Band-Pass Filter BP 4665-240 nm | N/A | 4.545 | 4.785 | N/A |
| 4 | Band-Pass Filter BP 4450-200 nm | N/A | 4.35 | 4.55 | N/A |
| 5 | Band-Pass Filter BBP 3725 to 4245 | N/A | 3.725 | 4.245 | N/A |
| 6 | Band-Pass Filter BBP 3670 to 4020 | N/A | 3.670 | 4.020 | N/A |
| 7 | Band-Pass Filter BBP 3440 to 4075 | N/A | 3.440 | 4.075 | N/A |
| 8 | Band-Pass Filter BBP 2900 to 3500 | N/A | 2.900 | 3.500 | N/A |
Table 2.
Operating conditions of the engine used in the experiment.
| Number | 1 | 2 | 3 | 4 | 5 | 6 | 7 | 8 | 9 | 10 | 11 | 12 | 13 |
| Power percentage (%) | 0 | 5 | 10 | 15 | 20 | 25 | 30 | 40 | 50 | 60 | 80 | 90 | 100 |
Disclaimer/Publisher’s Note: The statements, opinions and data contained in all publications are solely those of the individual author(s) and contributor(s) and not of MDPI and/or the editor(s). MDPI and/or the editor(s) disclaim responsibility for any injury to people or property resulting from any ideas, methods, instructions or products referred to in the content. |
© 2023 by the authors. Licensee MDPI, Basel, Switzerland. This article is an open access article distributed under the terms and conditions of the Creative Commons Attribution (CC BY) license (https://creativecommons.org/licenses/by/4.0/).
Share and Cite
MDPI and ACS Style
Zhang, Z.; Wang, H.; Cao, K.; Li, Y. Using a Convolutional Neural Network and Mid-Infrared Spectral Images to Predict the Carbon Dioxide Content of Ship Exhaust. Remote Sens. 2023, 15, 2721. https://doi.org/10.3390/rs15112721
AMA Style
Zhang Z, Wang H, Cao K, Li Y. Using a Convolutional Neural Network and Mid-Infrared Spectral Images to Predict the Carbon Dioxide Content of Ship Exhaust. Remote Sensing. 2023; 15(11):2721. https://doi.org/10.3390/rs15112721
Chicago/Turabian StyleZhang, Zhenduo, Huijie Wang, Kai Cao, and Ying Li. 2023. "Using a Convolutional Neural Network and Mid-Infrared Spectral Images to Predict the Carbon Dioxide Content of Ship Exhaust" Remote Sensing 15, no. 11: 2721. https://doi.org/10.3390/rs15112721
Note that from the first issue of 2016, this journal uses article numbers instead of page numbers. See further details here.