Article

A Self-Adaptive Thresholding Approach for Automatic Water Extraction Using Sentinel-1 SAR Imagery Based on OTSU Algorithm and Distance Block

1
School of Traffic and Transportation Engineering, Changsha University of Science & Technology, Changsha 410114, China
2
Institute of Geographic Sciences and Natural Resources Research, Chinese Academy of Sciences, Beijing 100101, China
3
Sichuan Land Consolidation and Rehabilitation Center, Chengdu 610041, China
4
Beijing Zhongke Lantu Technology Development Co., Ltd. Chengdu Branch, Chengdu 610041, China
5
Xi’an Center of Mineral Resources Survey, China Geological Survey, Xi’an 710100, China
*
Author to whom correspondence should be addressed.
Remote Sens. 2023, 15(10), 2690; https://doi.org/10.3390/rs15102690
Submission received: 27 March 2023 / Revised: 22 April 2023 / Accepted: 29 April 2023 / Published: 22 May 2023

Abstract

:
As an indispensable material for animals, plants and human beings, obtaining accurate water body information rapidly is of great significance to maintain the balance of ecosystems and ensure normal production and the life of human beings. Due to its independence of the time of day and the weather conditions, synthetic aperture radar (SAR) data have been increasingly applied in the extraction of water bodies. However, there is a great deal of speckle noise in SAR images, which seriously affect the extraction accuracy of water. At present, most of the processing methods are filtering methods, which will cause the loss of detailed information. Based on the characteristic of side-looking SAR, this paper proposed a self-adaptive thresholding approach for automatic water extraction based on an OTSU algorithm and distance block. In this method, the whole images were firstly divided into uniform image blocks through a distance layer which was produced by the distance to the orbit. Then, a self-adaptive processing was conducted for merging blocks. The OTSU algorithm was used to obtain a threshold for classification and the Jeffries–Matusita (JM) distance was calculated with the classification result. The merge processing continued until the separability of image blocks reached the maximum. Subsequently, we started from the next block to repeat the merger, and so on until all blocks were processed. Ten study areas around the world and the local Dongting Lake area were applied to test the feasibility of the proposed method. In comparison with five other global threshold segmentation algorithms such as the traditional OTSU, MOMENTS, MEAN, ISODATA and MINERROR, the proposed method obtains the highest overall accuracy (OA) and kappa coefficient (KC), while this approach also demonstrates greater robustness in the analysis of time series. The findings of this study offer an effective method to improve water detection accuracy as well as reducing the influence of speckle noise and retaining details in the image.

1. Introduction

As the kidneys of the earth, wetlands are a type of ecosystem with some of the highest productivity and biodiversity, which provide most of the fresh water and fish resources for human life and play a vital role in maintaining species, regulating climate, conserving water, improving water quality and so on [1,2]. Among them, lakes are a key factor in ecological water cycles and regional climate regulation, and are important sources of industry, agriculture and living water [3]. In the past few decades, the amount, surface area, water level and reserves of lakes have changed significantly due to climate changes and the effects of human activities. Hence, it is necessary for us to quickly extract accurate water range information for resource management, environmental assessment and policy formulation.
Satellite images are extensively applied in the research of lake coverage, which relies on its characteristics of large scale, long time series and high quality [1]. Optical remote sensing satellites such as MODIS, Landsat and SPOT could provide large-scale and long-term open data. With the development of remote sensing technology, the spatial-temporal resolution of images is continuously increasing, and it is widely used in various studies [4,5]. However, optical data quality will be seriously affected by cloudy and rainy weather conditions. SAR sensors can realize all-weather observation because they emit microwave signals, which can penetrate clouds, snow and rain. In addition, their echo signals are especially sensitive to water bodies, resulting in their popular application in depleting surface water study and wetland maps [6]. SAR emits microwaves of specific wavelengths towards the target object and measures the backscatter signal to form images, in which the water surface shows darker than other classes as the characteristic of specular reflectors [7]. Global threshold methods utilize a single threshold to isolate the whole scene, which is suitable for handling images with different gray ranges between object and background, and has the characteristics of simple implementation, steadiness and no need to consider spatial information [8,9].
As a classic threshold segmentation algorithm, the OTSU method has been widely applied in the field of image segmentation. This method can automatically calculate the global threshold based on the criterion of maximum between-class variance, and has high classification accuracy for images with uniform bimodal distribution of gray histogram. However, if the histogram is unimodal or has non-uniform illumination, the traditional OTSU algorithm will fail and favor the class with large variance, so the classification accuracy is poor [10,11]. Cao et al. [12] found that the segmentation performance of OTSU degrades significantly when the object is less than 10% of the whole area, so that it is not suitable for long-time water detection with frequent dynamic changes. Researchers have proposed many improved methods, which are mainly divided into two aspects. The first are those improved by mathematical principles, including the weighted object variance method [8,11] and valley-emphasis method [13,14]. These methods can enhance the segmentation accuracy to a certain extent, but are usually used under specific conditions. Another improvement adopts the split-based method, which divides the whole image into rectangular blocks with fixed or variable size and selects the appropriate sub-image as the minimum frequency greater than 10% [15,16,17,18].
Moreover, because of the influence of thermal disturbances in the imaging system and the atmospheric scattering, and when the roughness length of the object surface is shorter than the wavelength, there is a lot of salt-and-pepper noise in the image [19,20], which sharply affects classification accuracy. At present, most denoising techniques involve smoothing by filters, but they will lose some details and decrease the extraction accuracy of small water bodies [20]. Many studies have demonstrated that SAR, which is a side-looking imaging technique, causes the acquired backscatter to gradually decline with an increase in incident angle [21,22,23] and the brightness of corresponding pixels to diminish, where the noise intensity will be lower [20]. This indicates that the signals received by the same land cover at different incident angles will be different; the noise intensity will also change. Zhao et al. [24] clustered the whole scene into three strips in the range direction; separation value is determined manually, which may suffer accuracy degradation in different environments. Thus, it is necessary to develop a fully automatic, simple and robust blocking method for open water recognition.
This study aims to propose an adaptive threshold segmentation method based on distance block to improve water body recognition accuracy using SAR imaging. The study randomly took ten study areas around the world on the world wetland list, including Dongting Lake, as examples to test the feasibility of the proposed method. The main objectives of this paper are (1) proposing a self-adaptive approach for water extraction with distance block; (2) evaluating classification accuracy and comparing with other global methods; (3) testing the robustness of the proposed method for mapping water extent using time series Sentinel-1 images.

2. Datasets and Methods
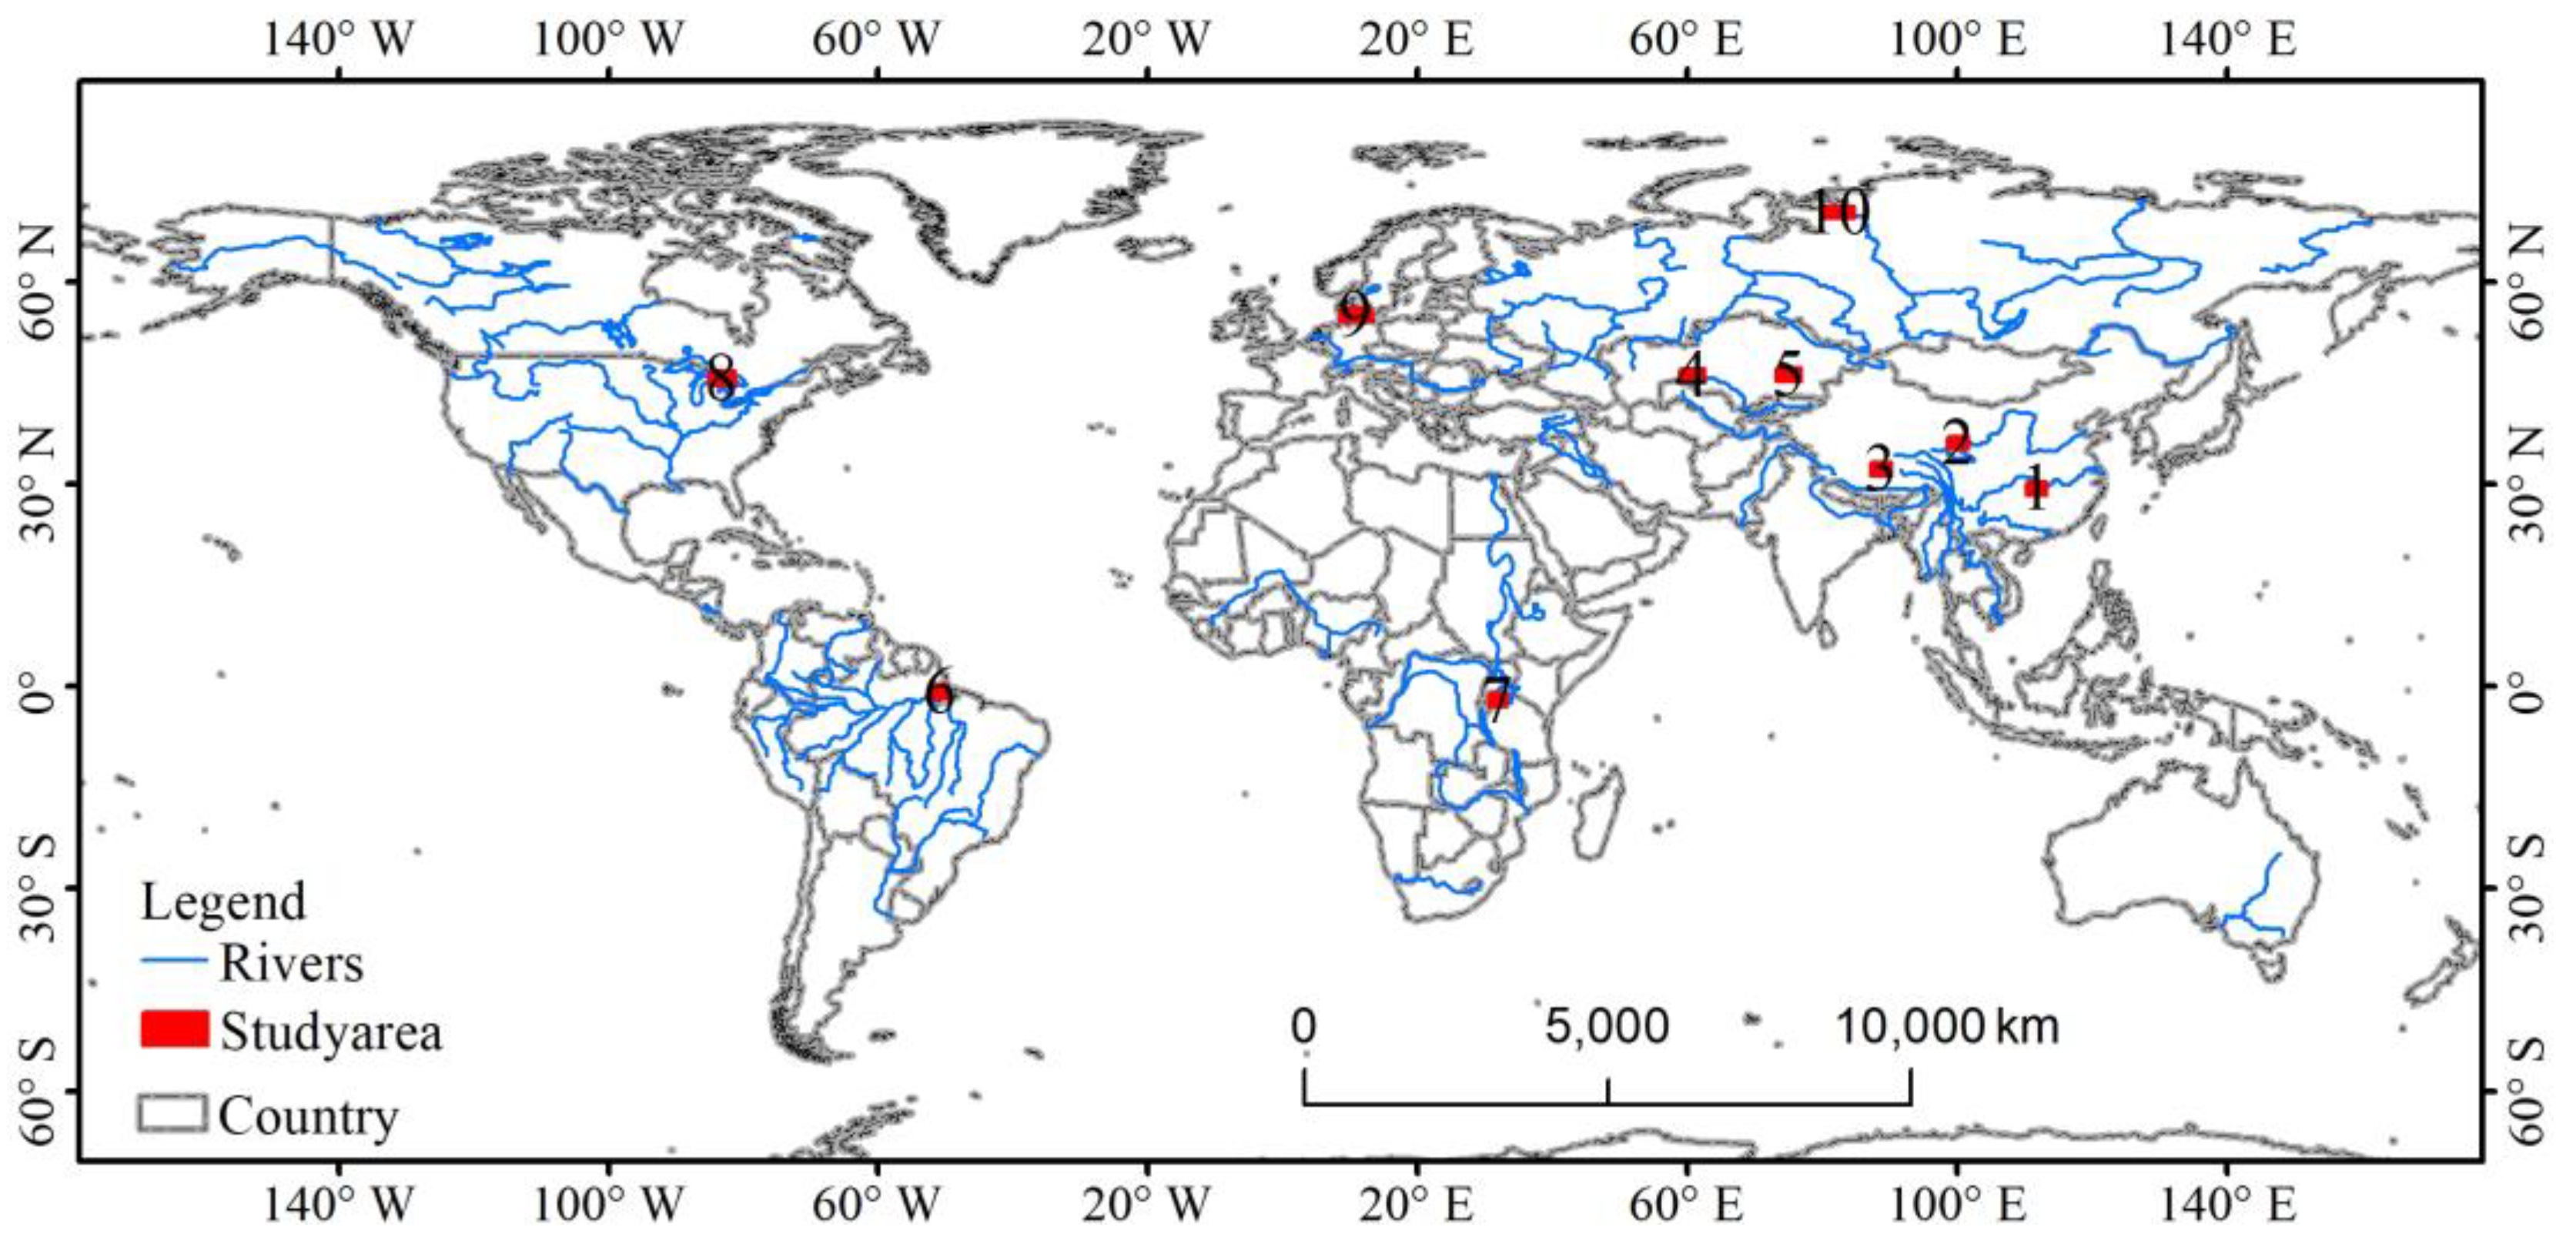
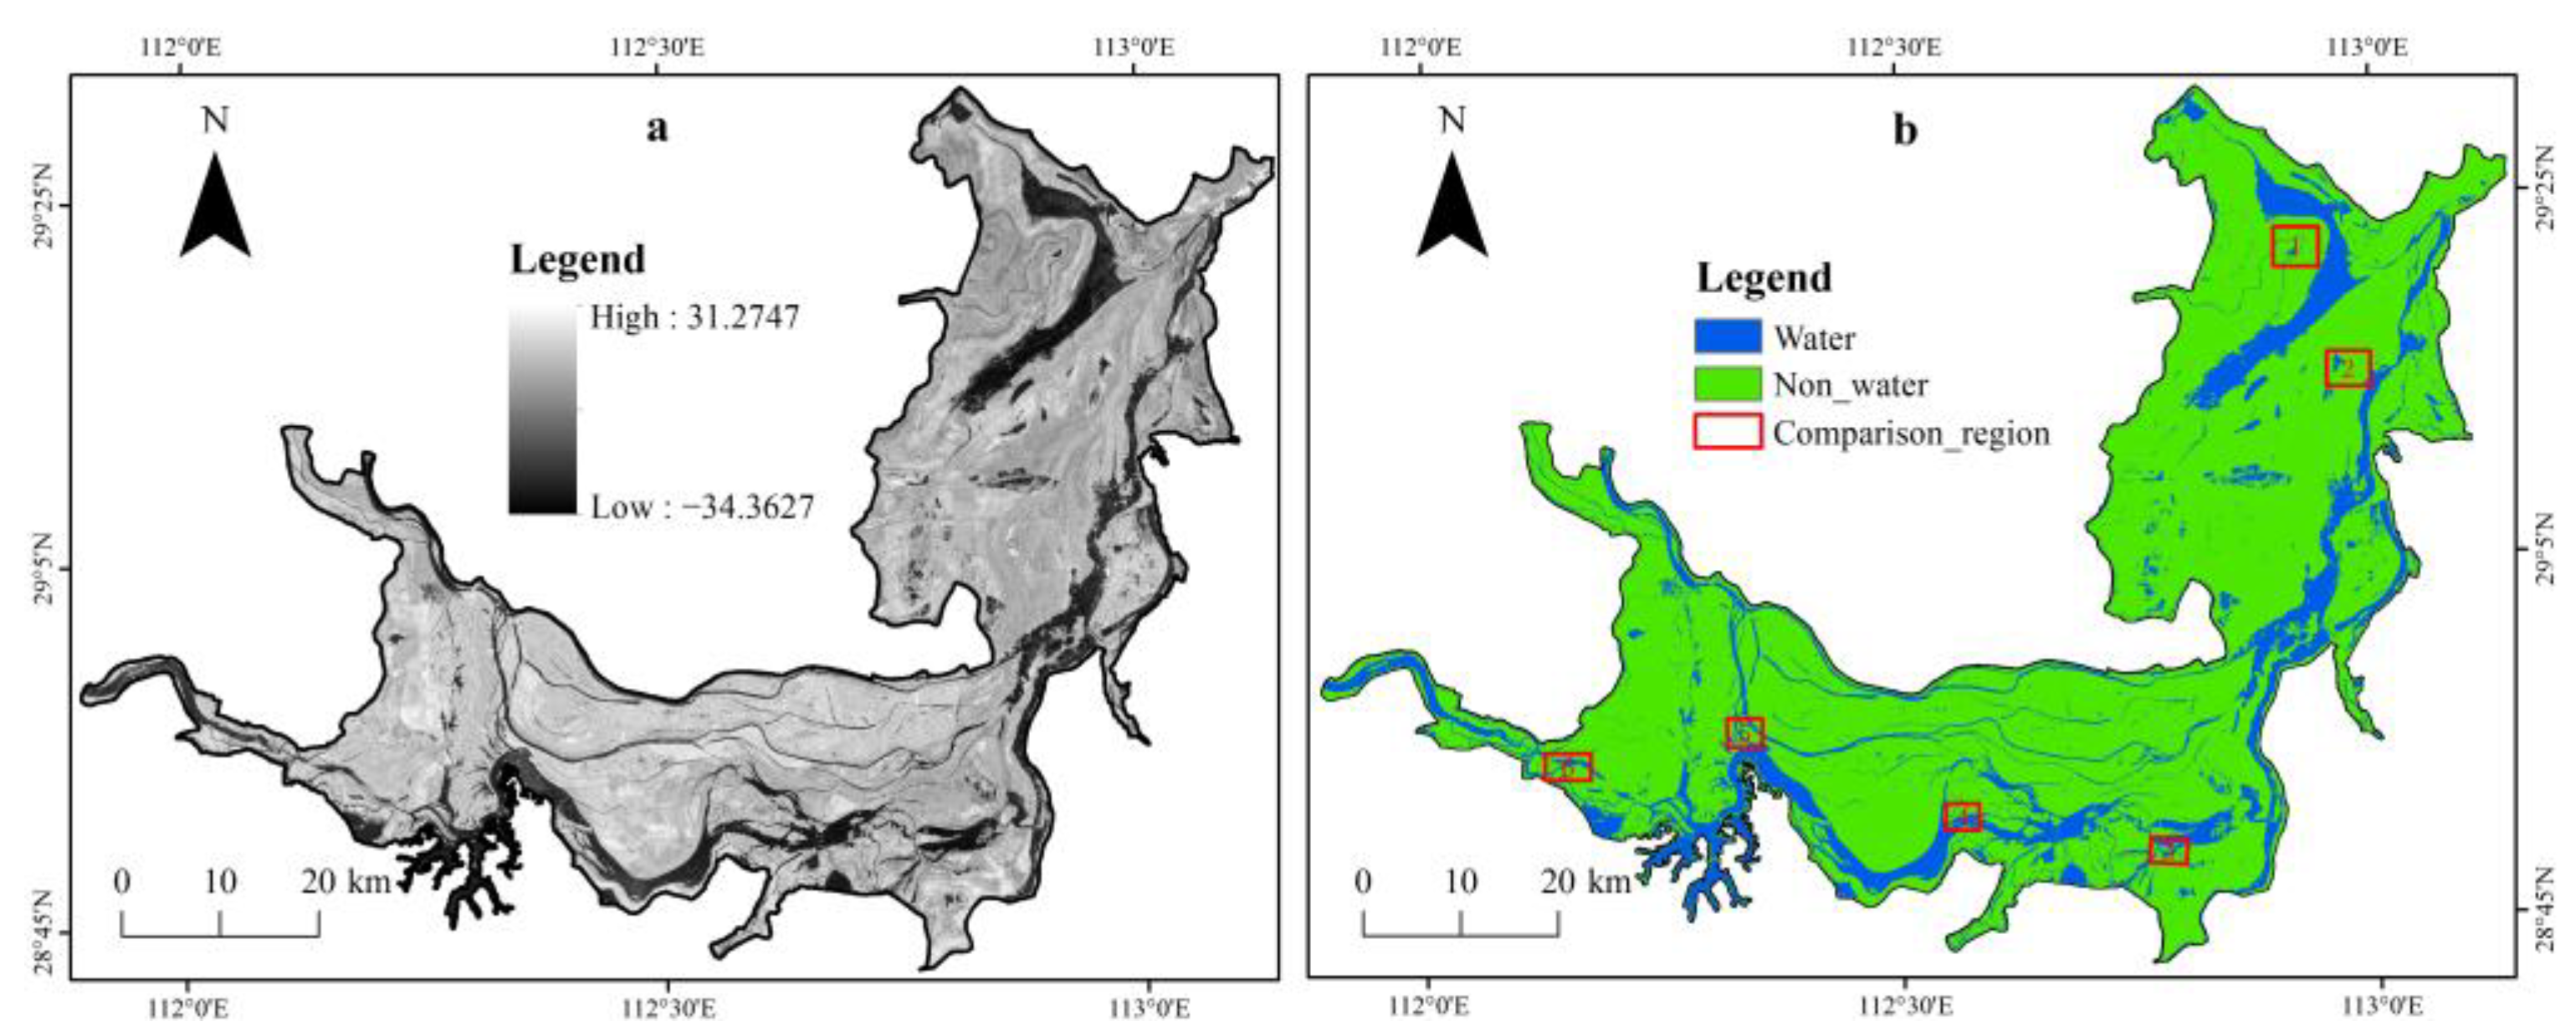
2.1. Study Area

Ten study areas around the world are randomly selected as the study area. The location of these study areas is presented in Figure 1 and their description is shown in Table 1. The study areas contain almost all kinds of water including plateau lake, saltwater, estuary, and inland lake, and are located across five continents. Study area 1, Dongting Lake, is further applied for detailed analysis. Dongting Lake (28°30′N–30°20′N, 111°40′E–113°10′E), is the second-largest freshwater lake in China, located in the north of Hunan Province, adjacent to Hubei Province [25]. This district is located in the subtropical monsoon climate zone, with rainy season between July and September and dry season from November to the following February [26]. With the evolution of hydrological and geomorphic characteristics, Dongting Lake is gradually divided into East, South, and West Dongting Lake [27].

2.2. Data Sources

This paper used Sentinel-1 SAR images for water extent mapping, which has high temporal and spatial resolution and is provided free of charge by the European Space Agency (ESA). Sentinel-1 is a dual satellite system with C-band SAR, which has a revisit period decreasing from 12 to 6 days. Sentinel-1A and -1B were launched on 3 April 2014 and 25 April 2016, respectively, and their data can be downloaded from the ESA Copernicus Open Access Hub (https://scihub.copernicus.eu/, accessed on 25 January 2022) [25]. The wide swath of the imagery is 250 km, the spatial resolutions in the range direction and azimuth direction are 5 m and 20 m, respectively, and the resampling pixel size is 10 m [28]. As the separability of water and land was better than the VH polarization mode [28,29], the VV polarization mode images were taken as test data for accuracy evaluation and comparative analysis. The Sentinel-1A IW Level-1 GRD scenes with VV polarization modes of all study areas were collected (Table 2). The other 29 Sentinel-1 images of Dongting Lake throughout 2017 were obtained for time series analysis.
Sentinel-2 images in this study were used to validate the precision of water extent derived from SAR. The Sentinel-2 mission also includes two satellites, Sentinel-2A and -2B, which were launched on 23 June 2015 and 7 March 2017, respectively [30,31]. The satellite is equipped with MSI sensors, covering thirteen spectral bands from visible near-infrared (NIR) to short-wave infrared, with different spatial resolutions [30]. To be consistent with Sentinel-1 data, the green and NIR bands with spatial resolution of 10 m were utilized. The authors of this paper downloaded the cloud-free Sentinel-2A images of each study area whose time was equal or near to that of Sentinel-1 (Table 2).

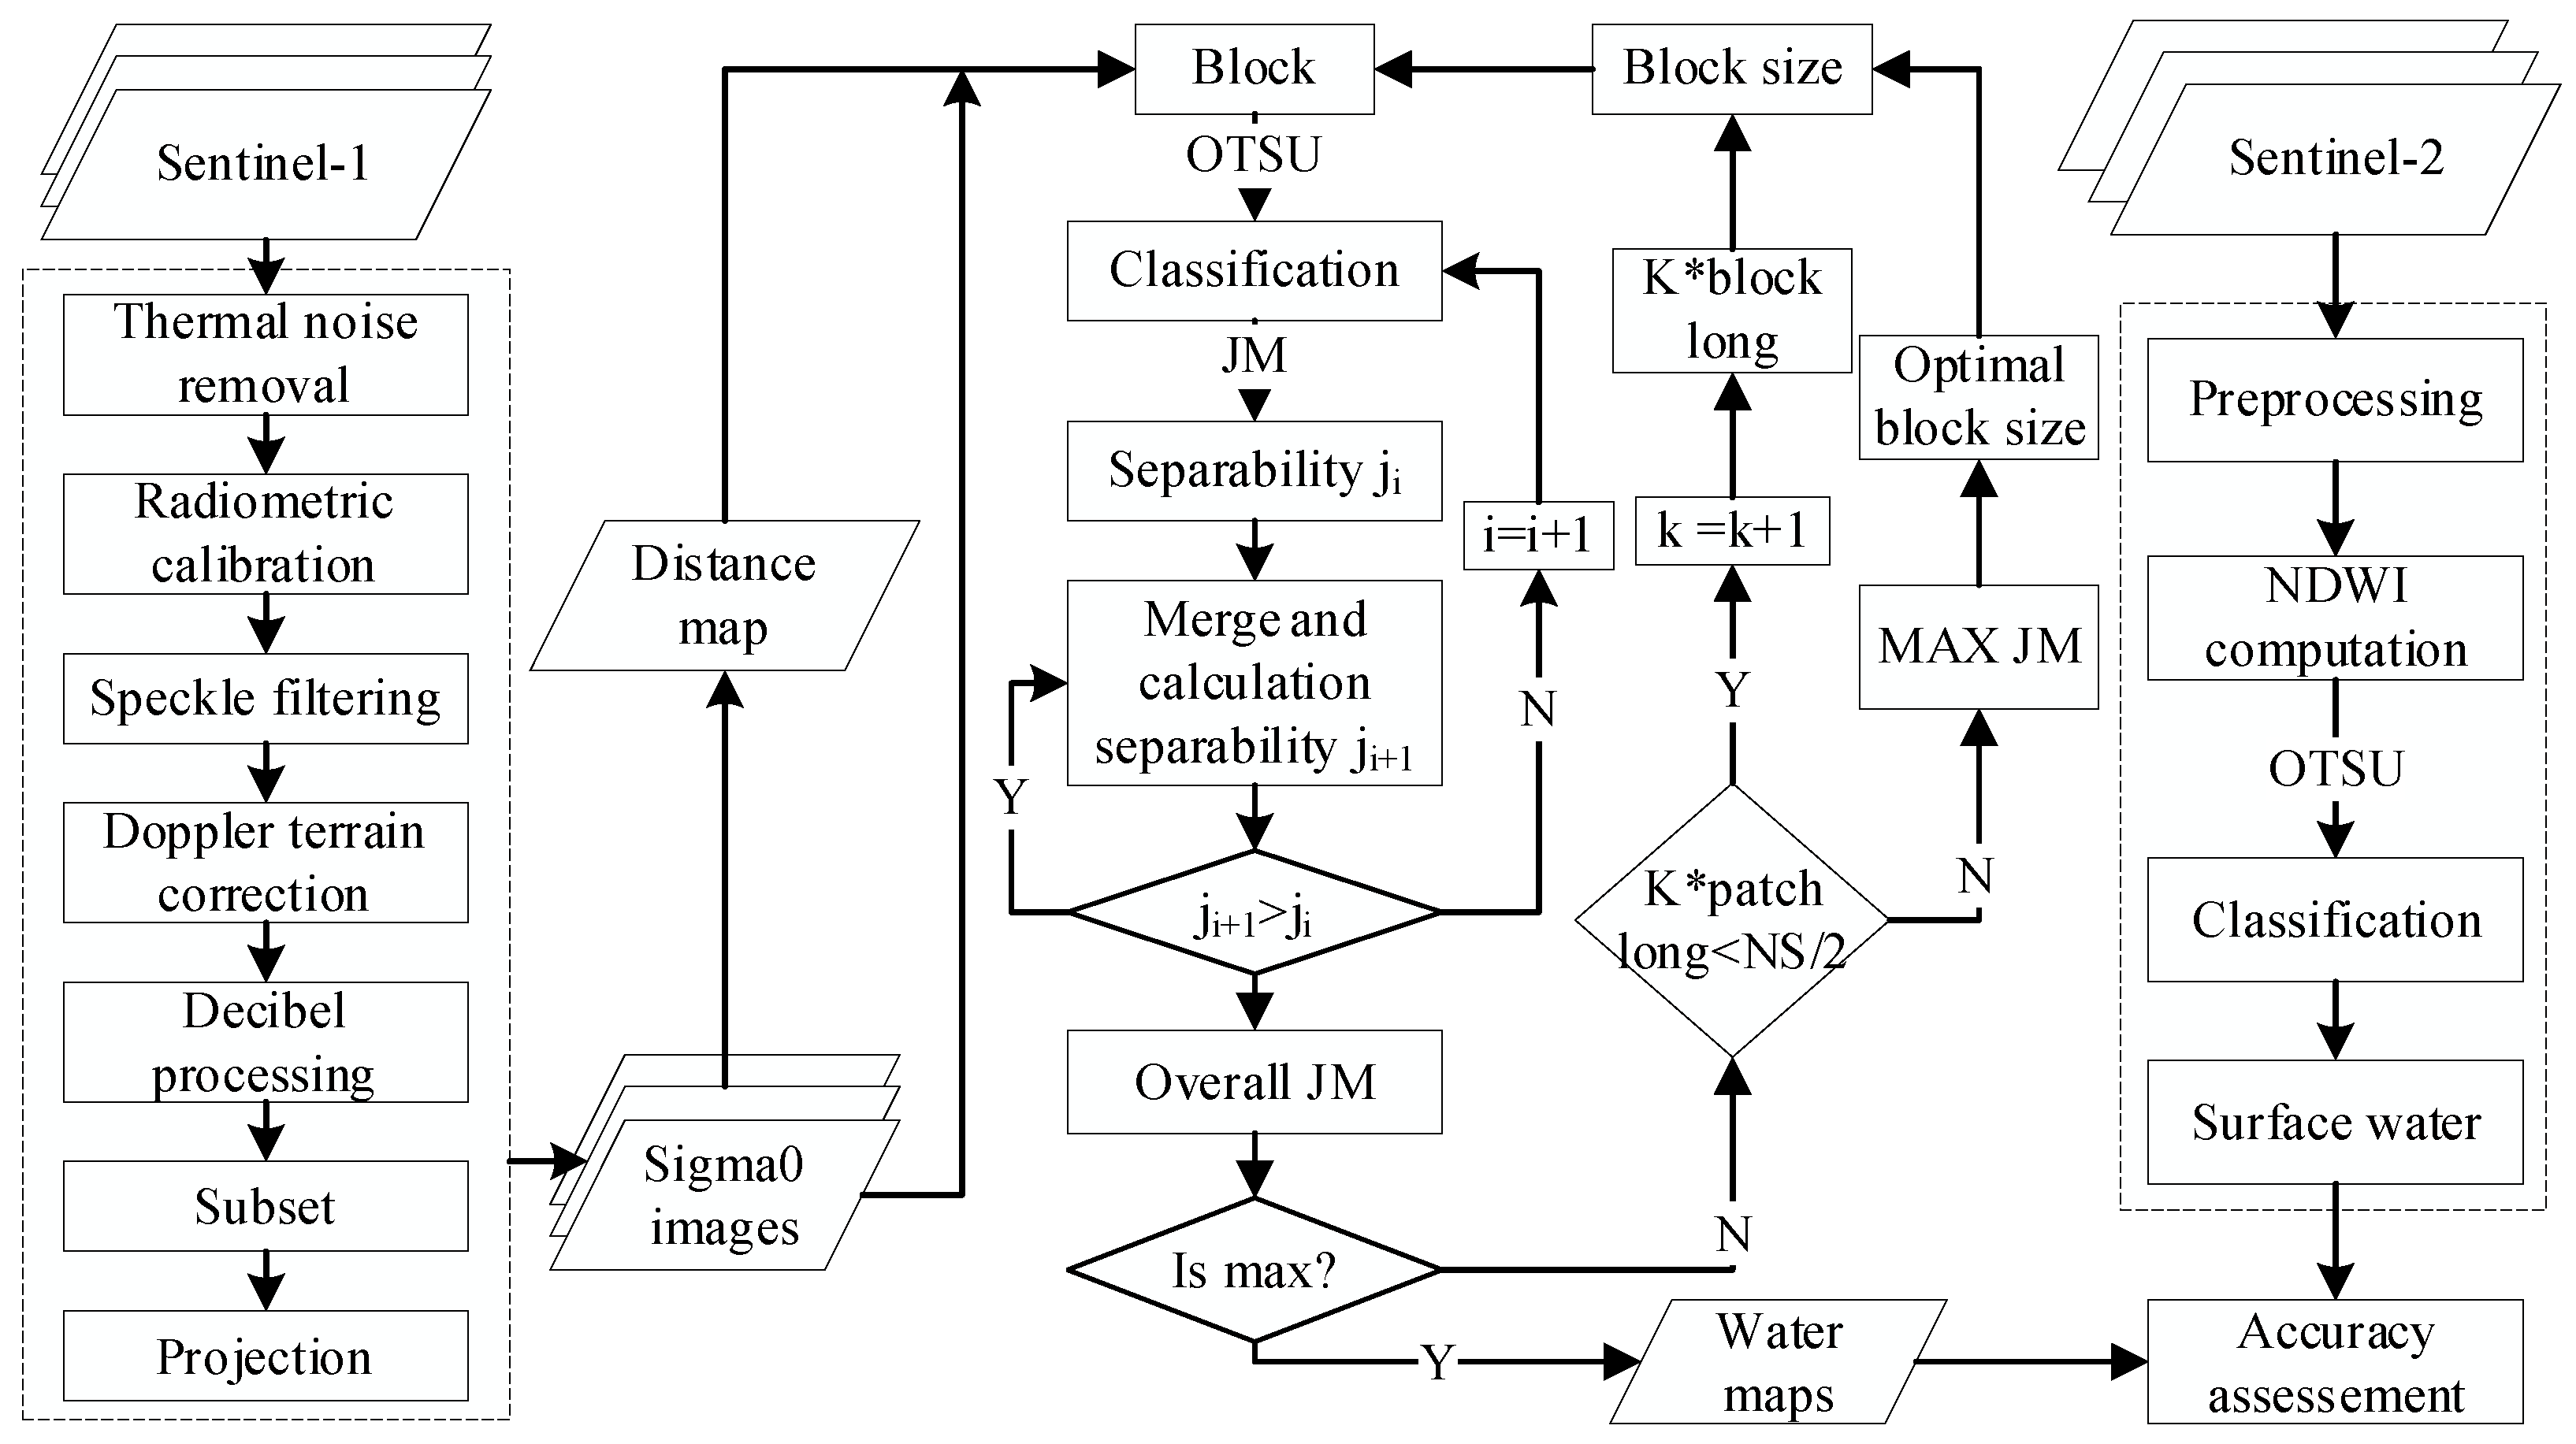
2.3. Water Extraction Method

The adaptive method mainly has four steps, as shown in Figure 2. Firstly, the Sentinel-1 image is preprocessed, and then divided into blocks based on the distance layer. Thirdly, the automatic iterative algorithm (self-adaptive) is used to make the water distribution map. Finally, the accuracy of the result is evaluated combined with the Sentinel-2 water surface.

2.3.1. Data Processing

Sentinel-1 image preprocessing is carried out in Sentinel Application Platform (SNAP) software, including thermal noise, radiation correction, noise filtering, Doppler terrain correction, decibel processing, clipping, and projection [31]. Thermal noise removal is used to eliminate the thermal noise generated by the operation of the Instrument Processing Facility (IPF), which will seriously affect cross-polarization channels [32]. Radiometric calibration is performed to convert the intensity signal to backscatter coefficient sigma0. Then, the frequently-used Refined Lee filter assists in removing noise [33]. After using the 30 m Shuttle Radar Topography Mission (SRTM) to correct terrain, decibel processing is executed. Finally, the region of interest is subset from the image and projected. The preprocessing of the Sentinel-2 images is implemented in ENVI, containing band fusion, mosaic, and clipping, and projected to WGS84 coordinate system; the water index is calculated. Normalized Difference Water Index (NDWI) and modified NDWI (MNDWI) are the most commonly used spectral water indices in the literature. In this study, we selected the NDWI due to its more stable effect [28,34,35]. Furthermore, the OTSU algorithm is used to classify to obtain the reference water map.

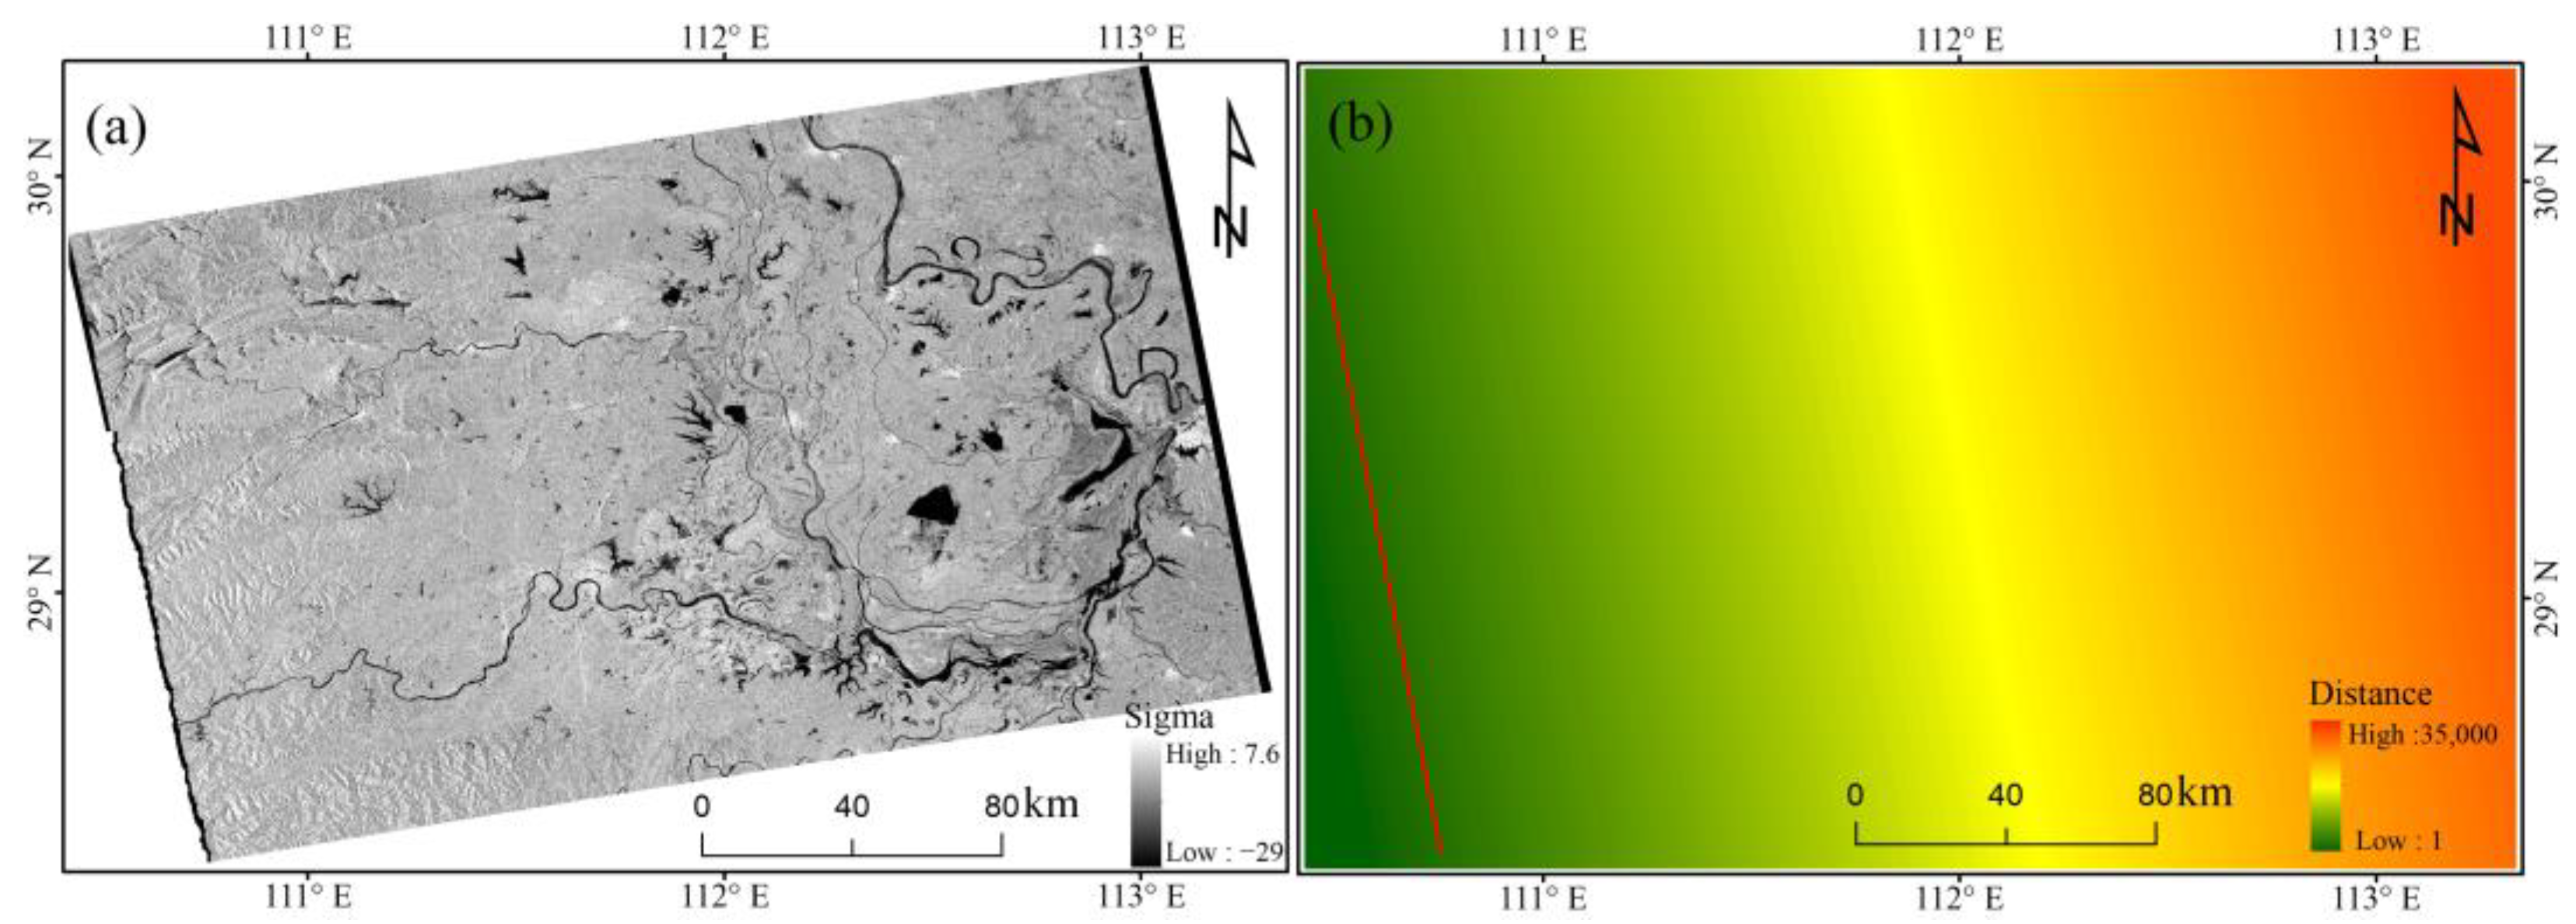
2.3.2. Distance Image

First, we need to calculate the distance value of the image. The value of distance is measured by the number of pixels from its position to the orbit of the Sentinel-1 image. To acquire the distance image, the column number of each Sentinel-1 image was obtained. With the orbital inclination of Sentinel-1, the distance can be calculated through rotating processing using Equation (1).
Distance = Rot ( images ( Cols ) ,   90 o r b i t a l   i n c l i n a t i o n )
where Rot is the rotating processing, and images ( Cols ) represents the column number of images.
Through the above processing, the distance image of each study area is easily accessed. The distance image of study area 1 is shown in Figure 3 and the distance is a relative value to the orbit. Pixels with the same distance value constitute a line which is parallel to the orbit.

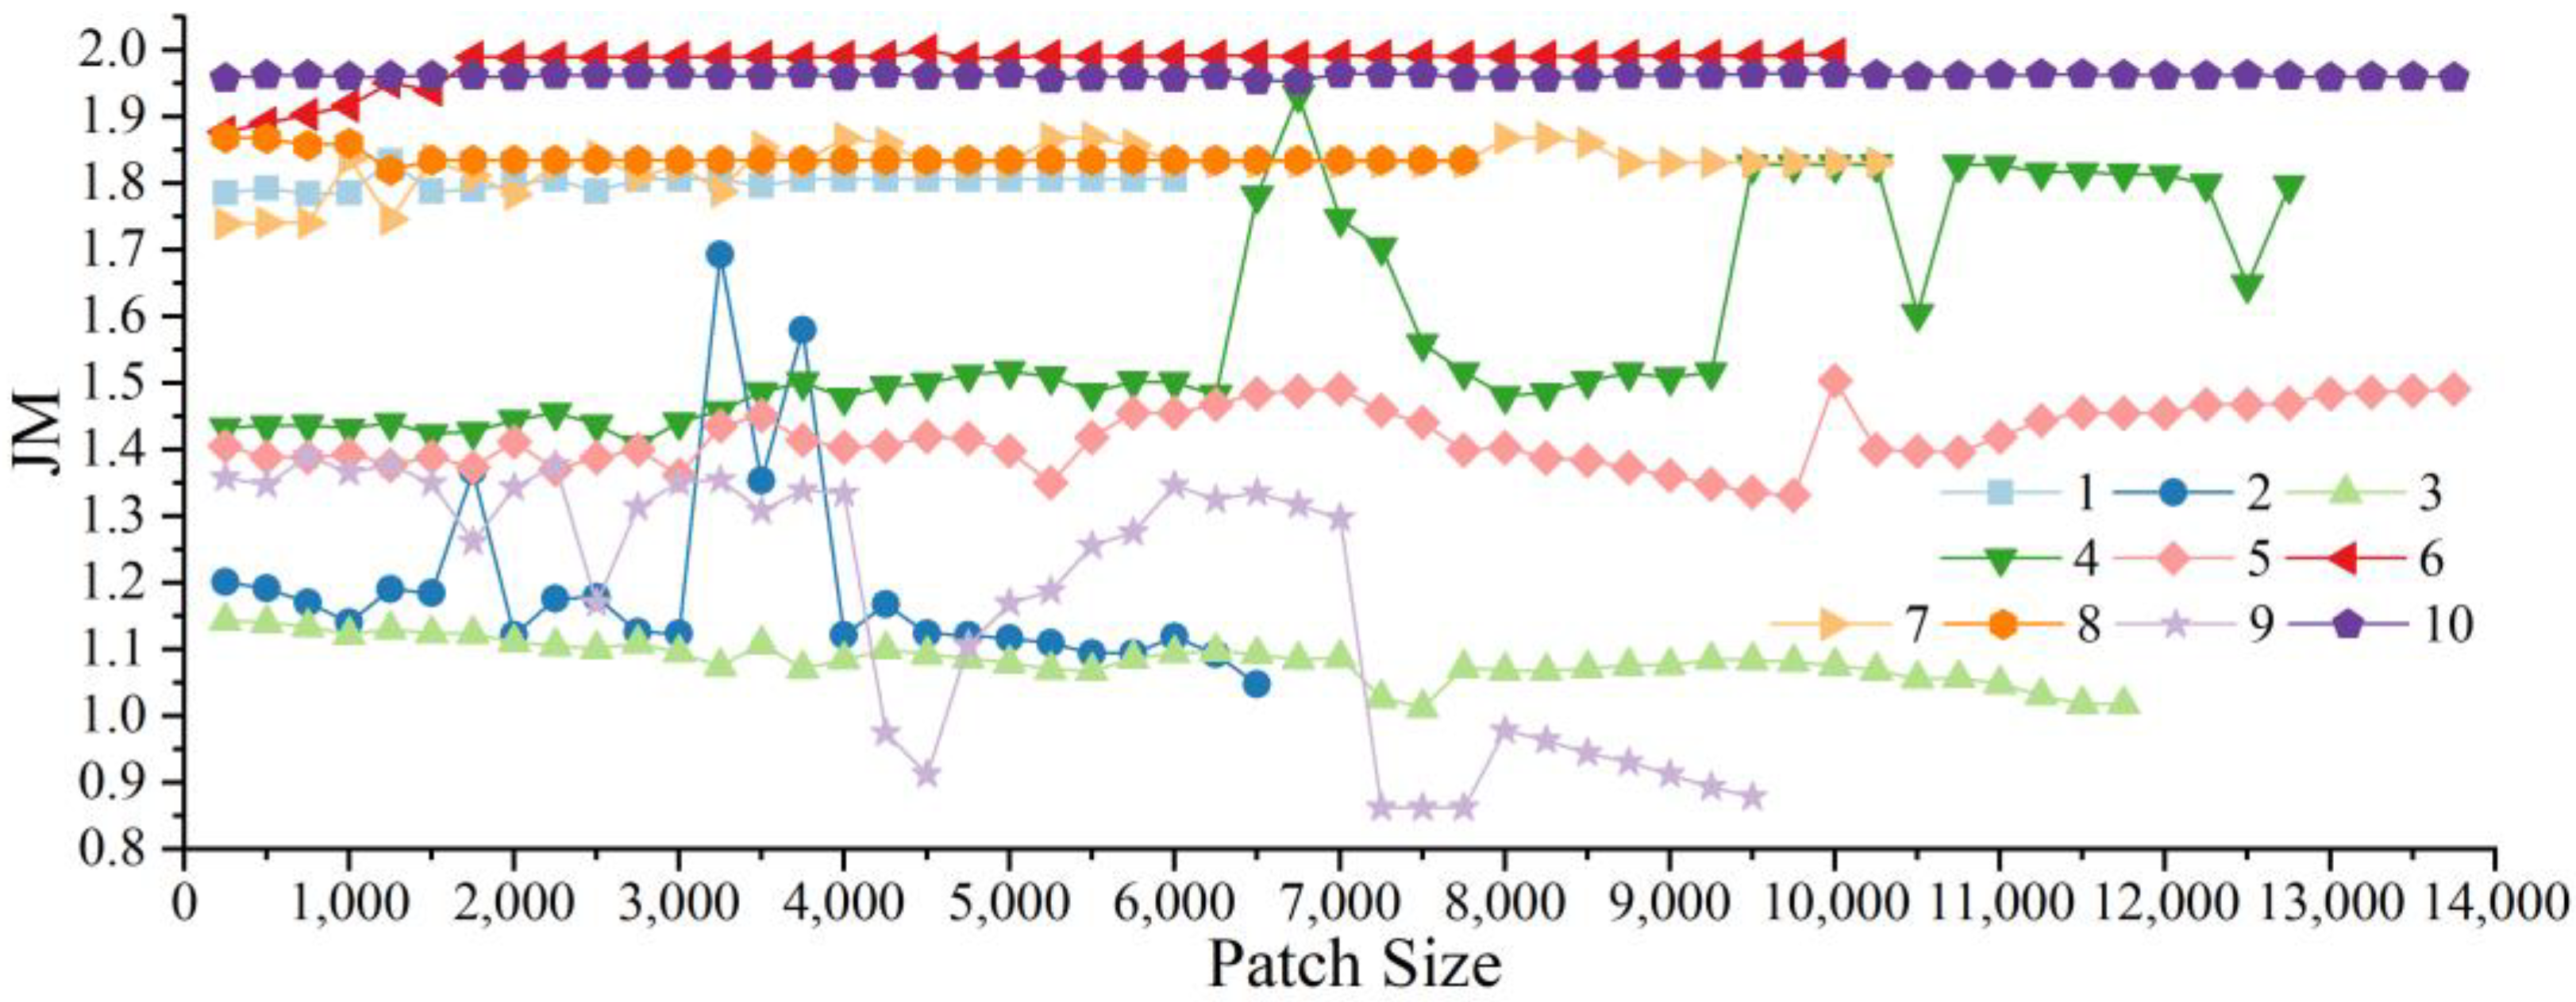
2.3.3. Implementation of Self-Adaptive Iterative Algorithm

This method sets the initial value (Block size) of segmentation, and divides images into uniform blocks Q i ( i = 1 , 2 , , k ) from near to far according to a distance map. Starting from the first block, this method calculates the segmentation threshold to classify the image block Q i with the OTSU algorithm and its histogram [36]. Then, the JM distance criterion [37] is used to evaluate the separability j i of water and non-water in the classified image A i The formulas are as follows:
B = ( m 1 m 2 ) 2 4 × ( σ 1 2 + σ 2 2 ) + 1 2 × ln ( σ 1 2 + σ 2 2 2 × σ 1 × σ 2 )
j i = 2 × ( 1 e B )
where m 1 and m 2 are the mean values of water and non-water, respectively; σ 1 and σ 2 are the standard deviation of water and non-water, respectively. The value range of separability is greater than 0 and less than 2, and when the value is 2, the separability of the image is the best.
Next, merged with the next block Q i + 1 , the segmentation threshold is calculated again to obtain the classification A i + 1 , and the separability j i + 1 is computed. If j i + 1 > j i , the merge operation will be repeated; otherwise, it will be the final classification result. Then, the merge procedure will be continuously applied for the next blocks that have not been classified. The above cyclic operation is interactively repeated until all image blocks’ classification processing is completed (Figure 2). For the adaptive threshold segmentation method, the overall separability is defined in Equation (4).
o v e r a l l _ J M = i = 1 n j i × c i M
where n is the number of blocks after merging image blocks; c i and j i are the number of pixels and separability in block i , respectively, and M is the number of pixels in the image.
The size of the initial block may affect the result. A procedure of search optimal initial block is added in the proposed method. The initial block size is first set to k times patch long, where k equals 1, and overall JM is recorded with the above cyclic operation. Then, k is added to 1 and the procedure is repeated until k*patch long is greater than the number of column (NS)/2. Then, the initial block achieving the maximum overall JM is regarded as the optimal initial block. The water map produced by the self-adaptive iterative algorithm with optimal initial block is the final result (Figure 2). In this study, patch long is defined as 250 pixels with the consideration of efficient and easy operation.

2.3.4. Accuracy Evaluation

The accuracy evaluation of the water distribution map is the key step in image classification. In order to quantitatively analyze the extraction accuracy of the proposed adaptive threshold segmentation method, this paper calculates the confusion matrix [38] compared with the reference water map, and evaluates the accuracy in combination with the producer accuracy (PA), user accuracy (UA), overall accuracy (OA), and kappa coefficient (KC). The calculation formula is as follows:
P A = T P T P + F P
U A = T P T P + F N
O A = T P + T N T P + F N + F P + T N
K C = N × ( T P + T N ) ( T P + F P ) × ( F N + T N ) N 2 ( T P + F P ) × ( F N + T N )
where T P and T N are the total number of correctly identified images of water and non-water, respectively. Similarly, F P and F N represent the total number of erroneous recognitions of water and non-water, respectively. N is the number of all the image pixels.
In order to further analyze the extraction accuracy of adaptive threshold segmentation, this article compares with other usually applied and automatic water extraction methods such as MOMENT [39], MINERROR [40], MEAN [41], ISODATA [42], and global OTSU method. The comparison is conducted by calculating their overall accuracy and kappa coefficient with the reference water map derived from Sentinel-2 images, and also the overall separability.
For the local study area, Dongting Lake, this paper extracts the water surface area in 2017 and analyzes the change trend to fully reflect the annual change. The calculation formula of water area ( S ) is as follows:
S = N u m * S i z e
where N u m is the number of pixels of the water body and S i z e is the area of a pixel.
Based on the water area of the whole year, the water frequency distribution map of Dongting Lake is calculated; the water frequency ( P i ) of the pixel i is computed by
P i = F i N a l l × 100 %
where N a l l is the total number of images, and F i represents the number of times that pixels are submerged in the year.

3. Results and Analysis

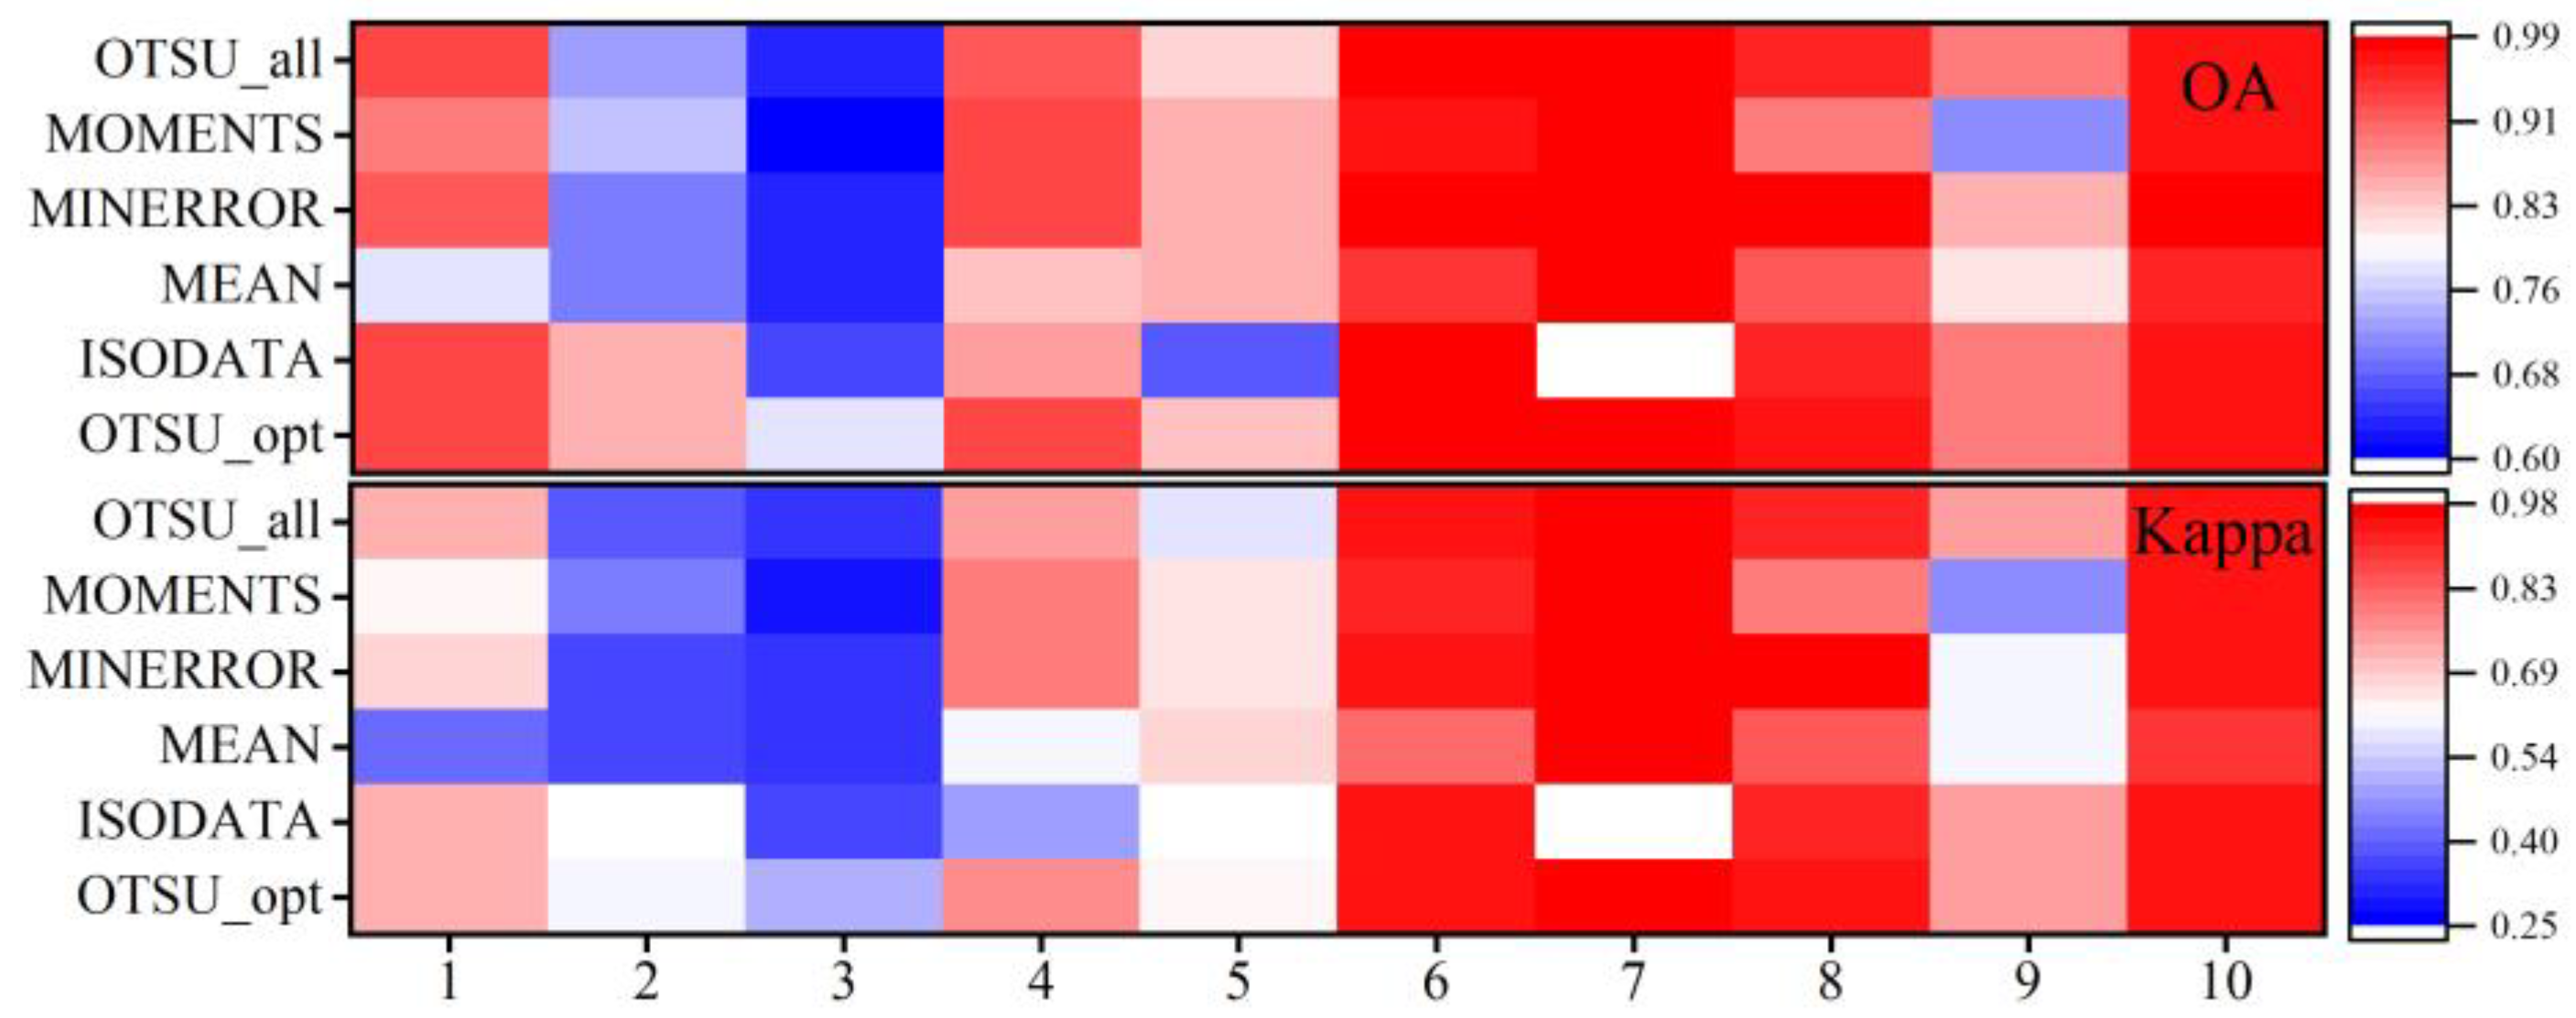
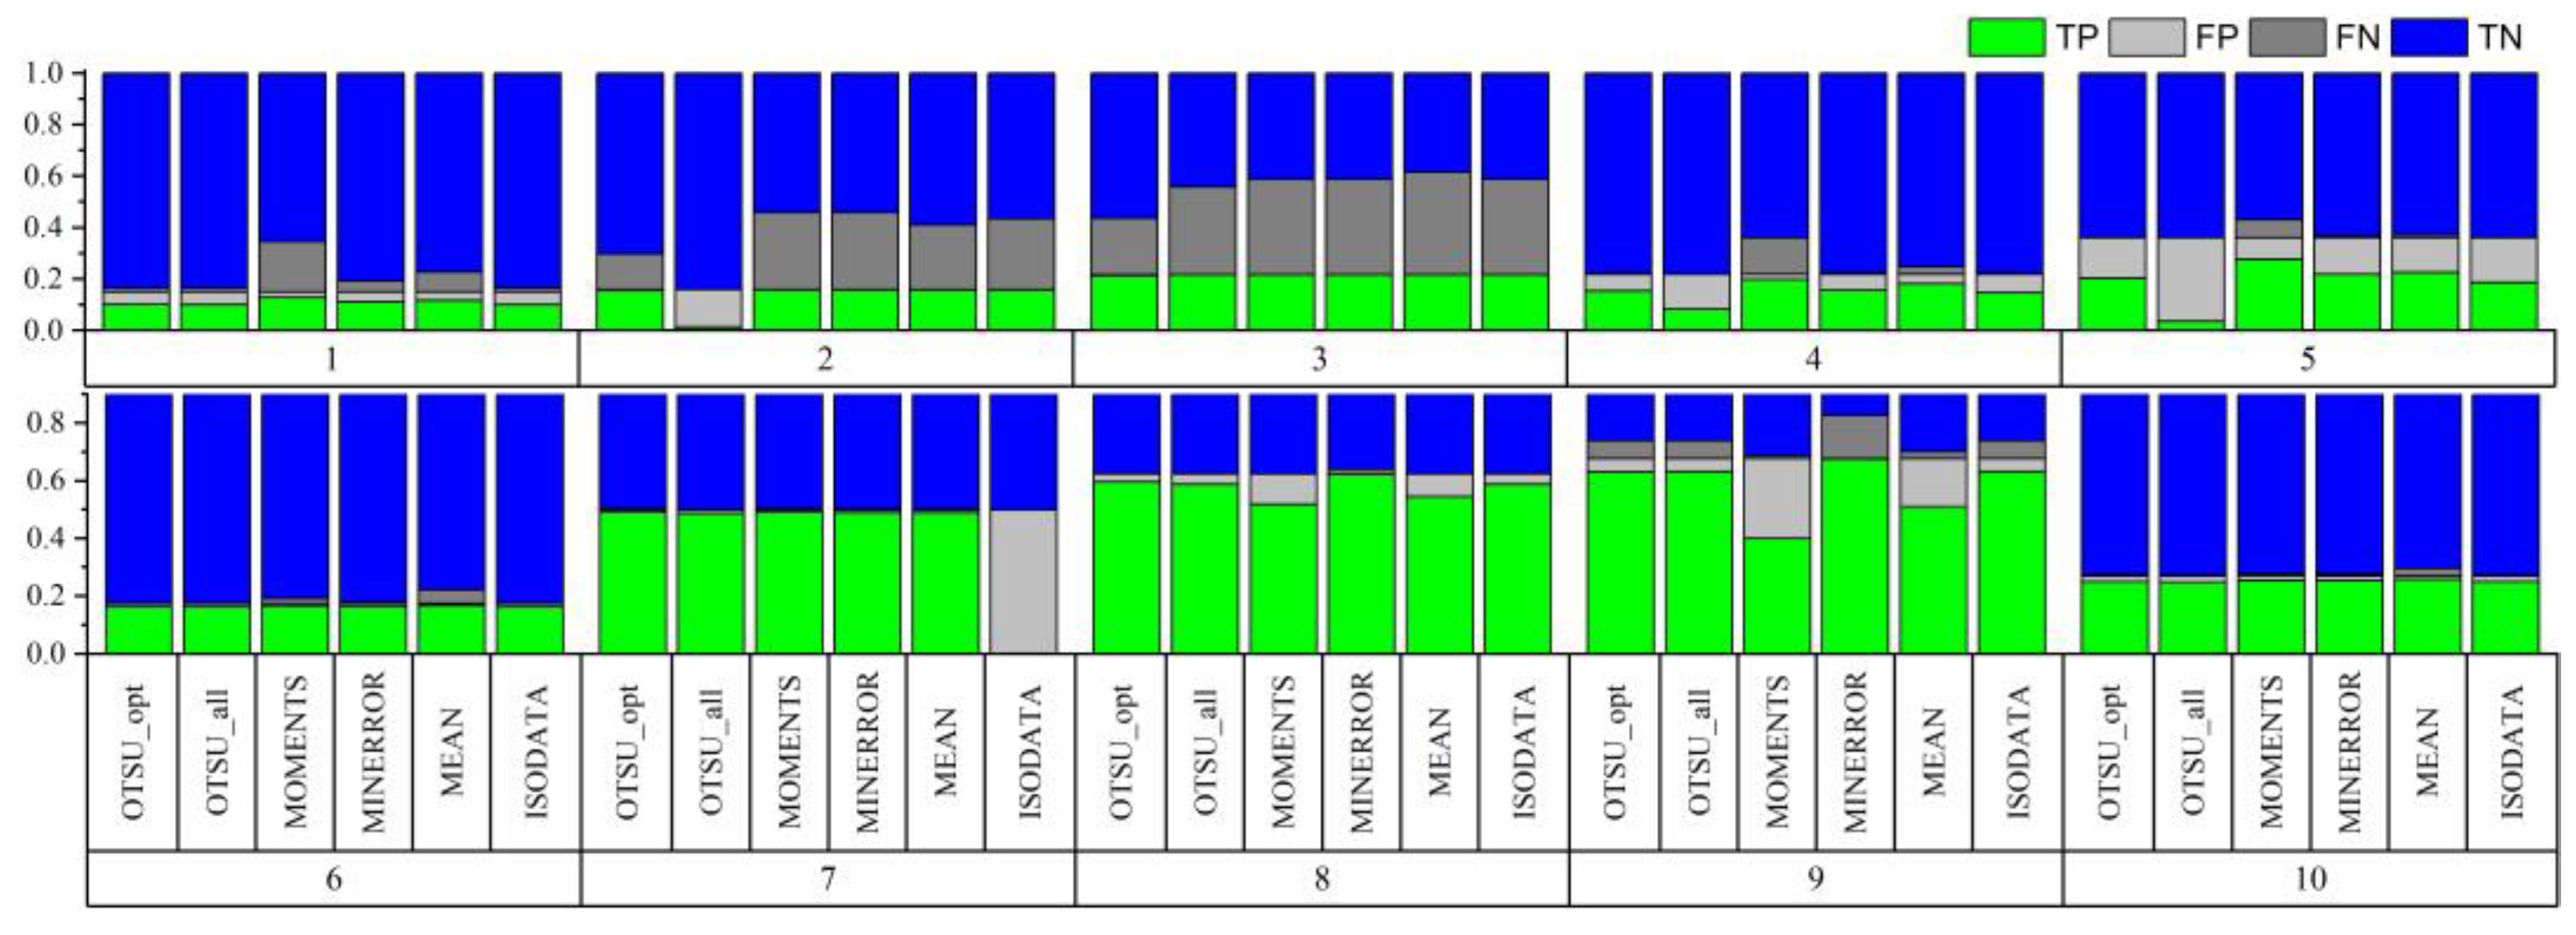
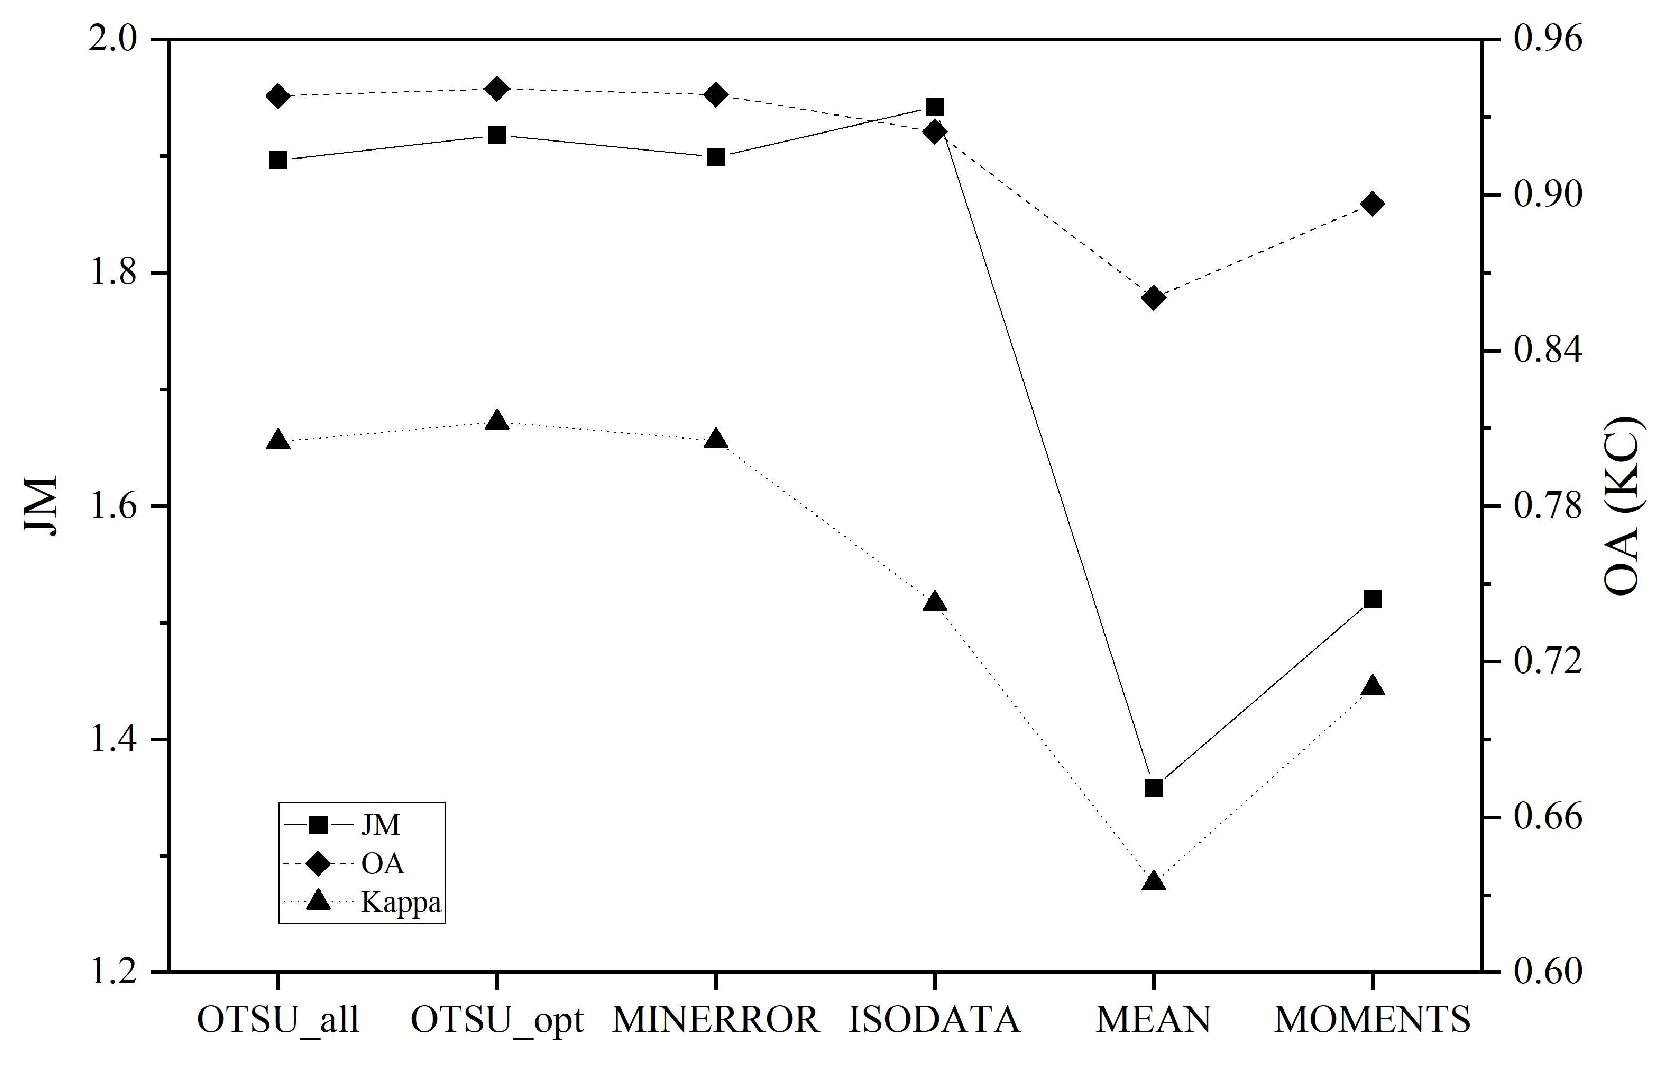
3.1. Accuracy of Extracted Water Bodies

The overall JM values of each study area under different initial patch sizes are presented in Figure 4. For study area 1, the optimal patch size is 1250, while it is 3250 and 6750 for study areas 2 and 3. For study areas 10 and 6, the relationship between the initial patch size and overall JM is insignificant. In all, different study areas have their own optimal patch size for segmentation.
With the optimal patch size, the water surface of each study area overlapping with a Sentinel-2 image was extracted. Combined with the reference water map derived from Sentinel-2, the accuracy of different methods along with the study area were available, which is presented in Figure 5. The proposed method is labeled as “OTSU_opt” and the global OTSU method is labeled as “OTSU_all”. From study areas 1 to 4 and study areas 7 to 9, the proposed method outperformed for both OA and Kappa value. For study areas 6 and 10, the accuracy among different methods is almost the same. The accuracy of OTSU_all is relatively high, which implies the robustness of the OTSU method.

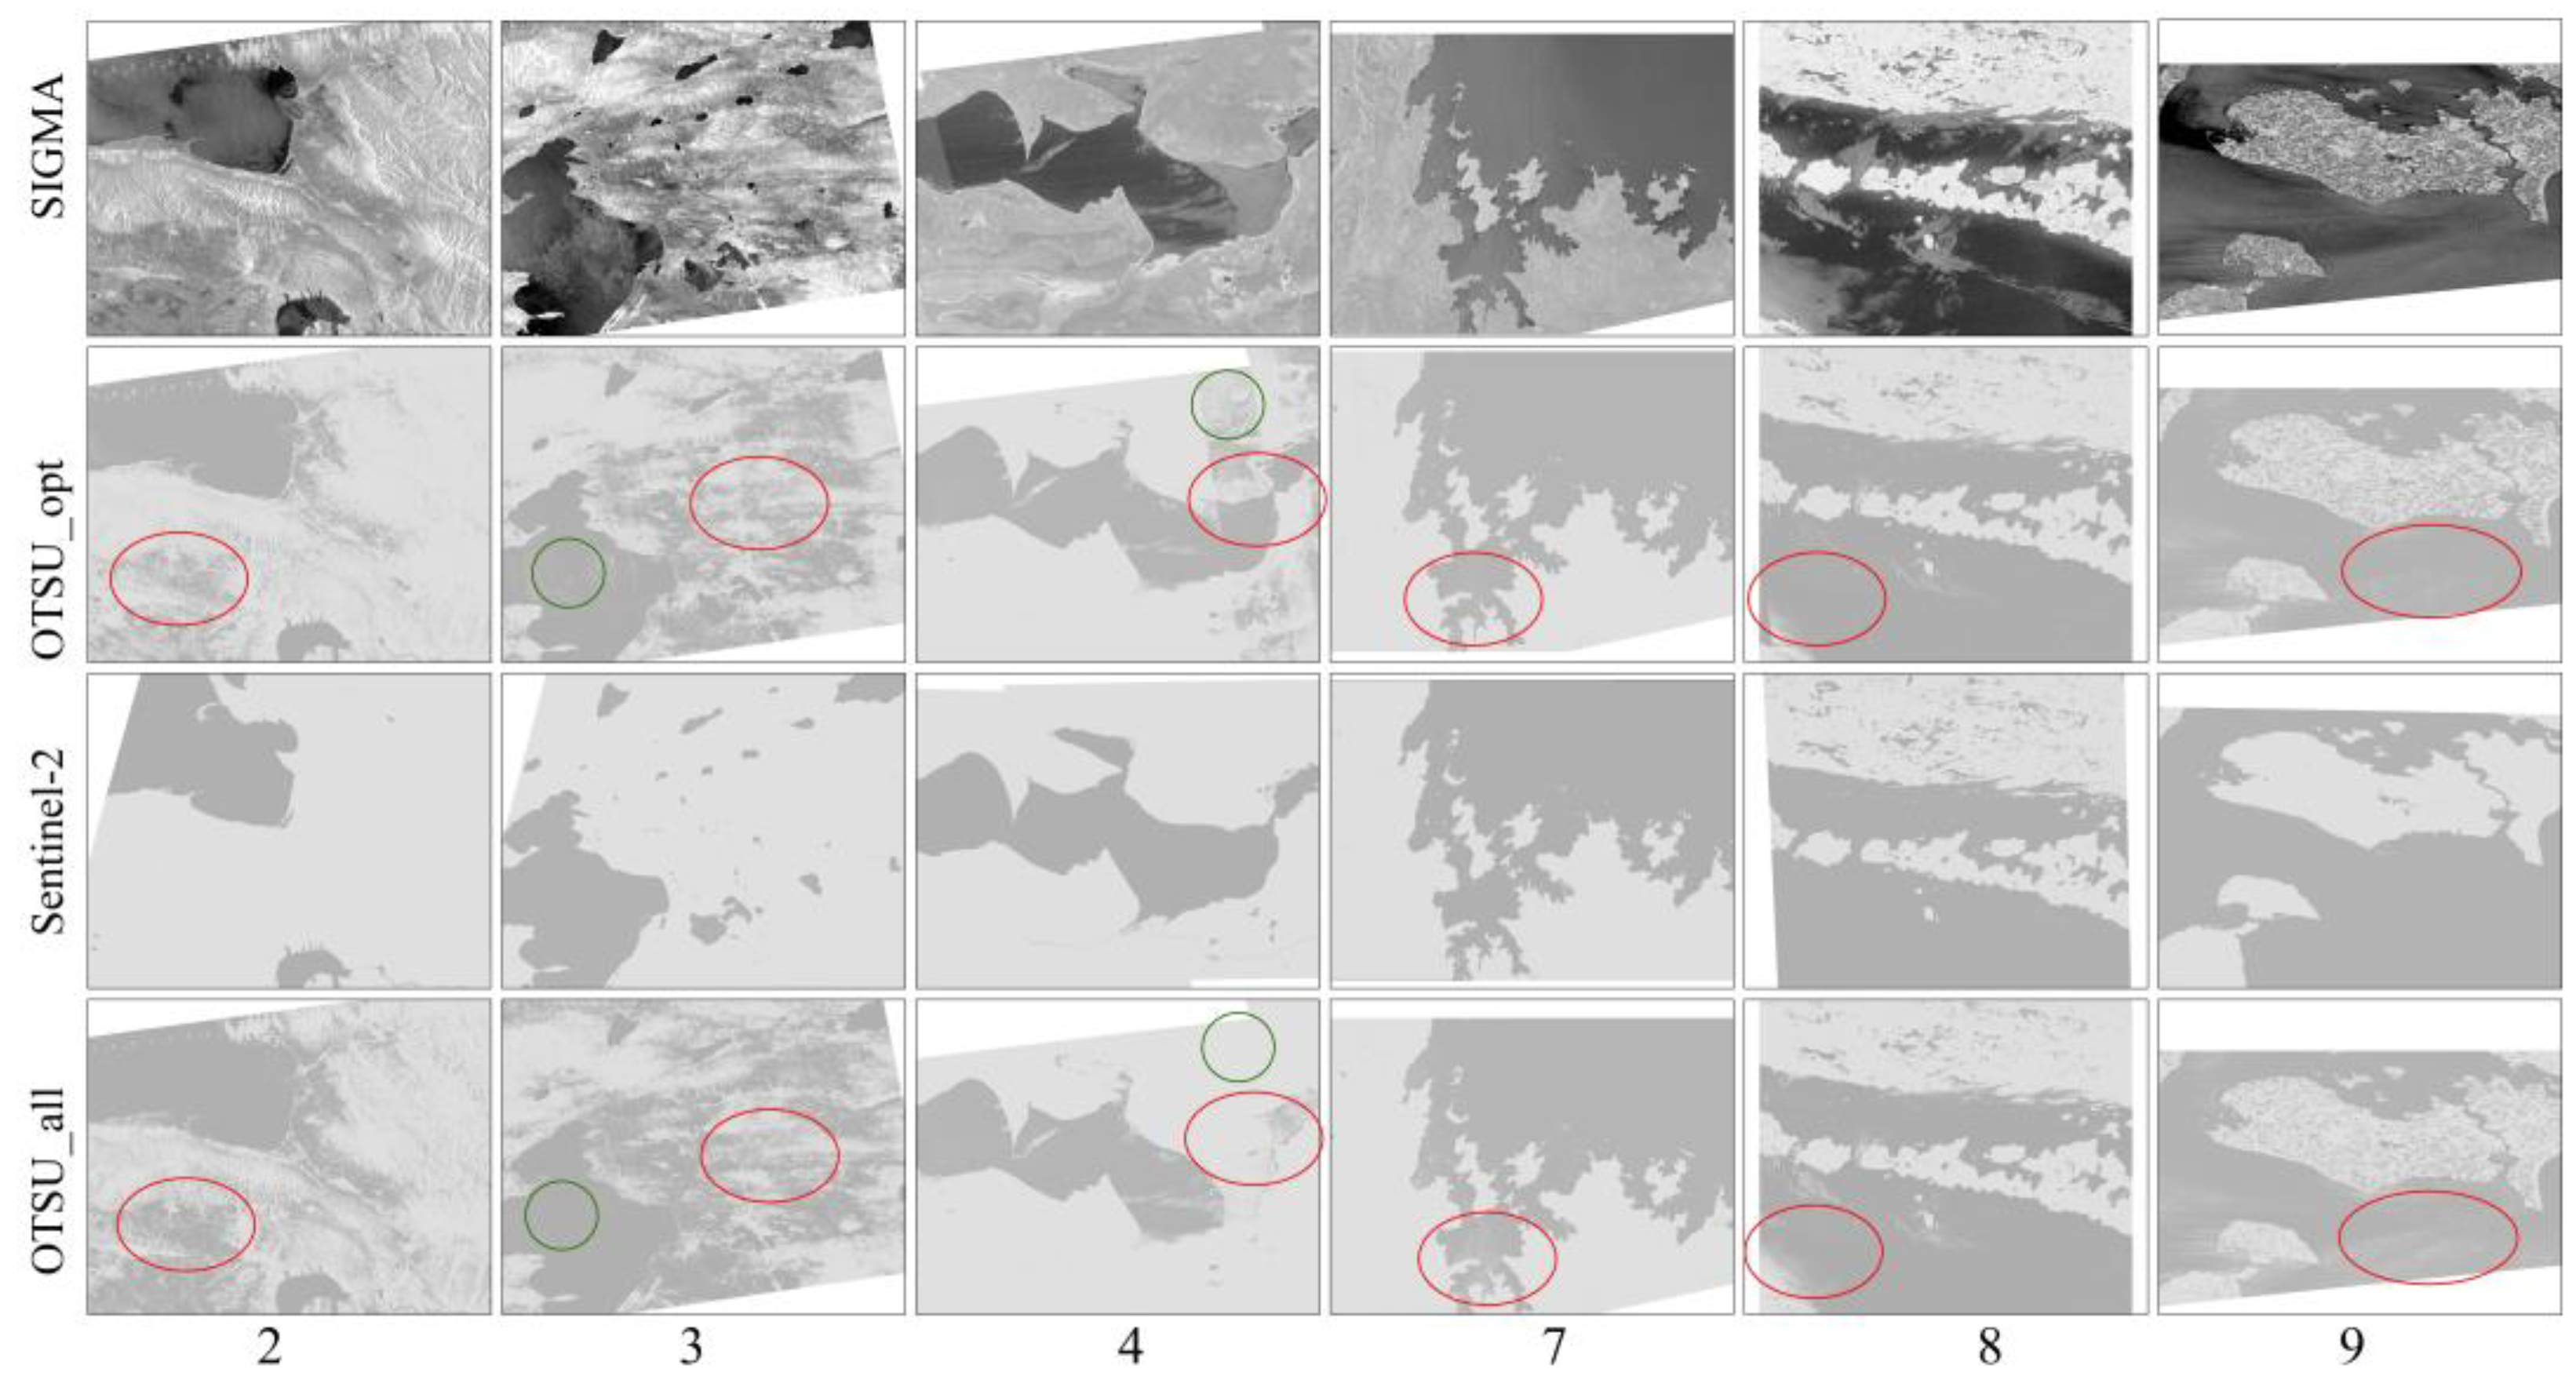
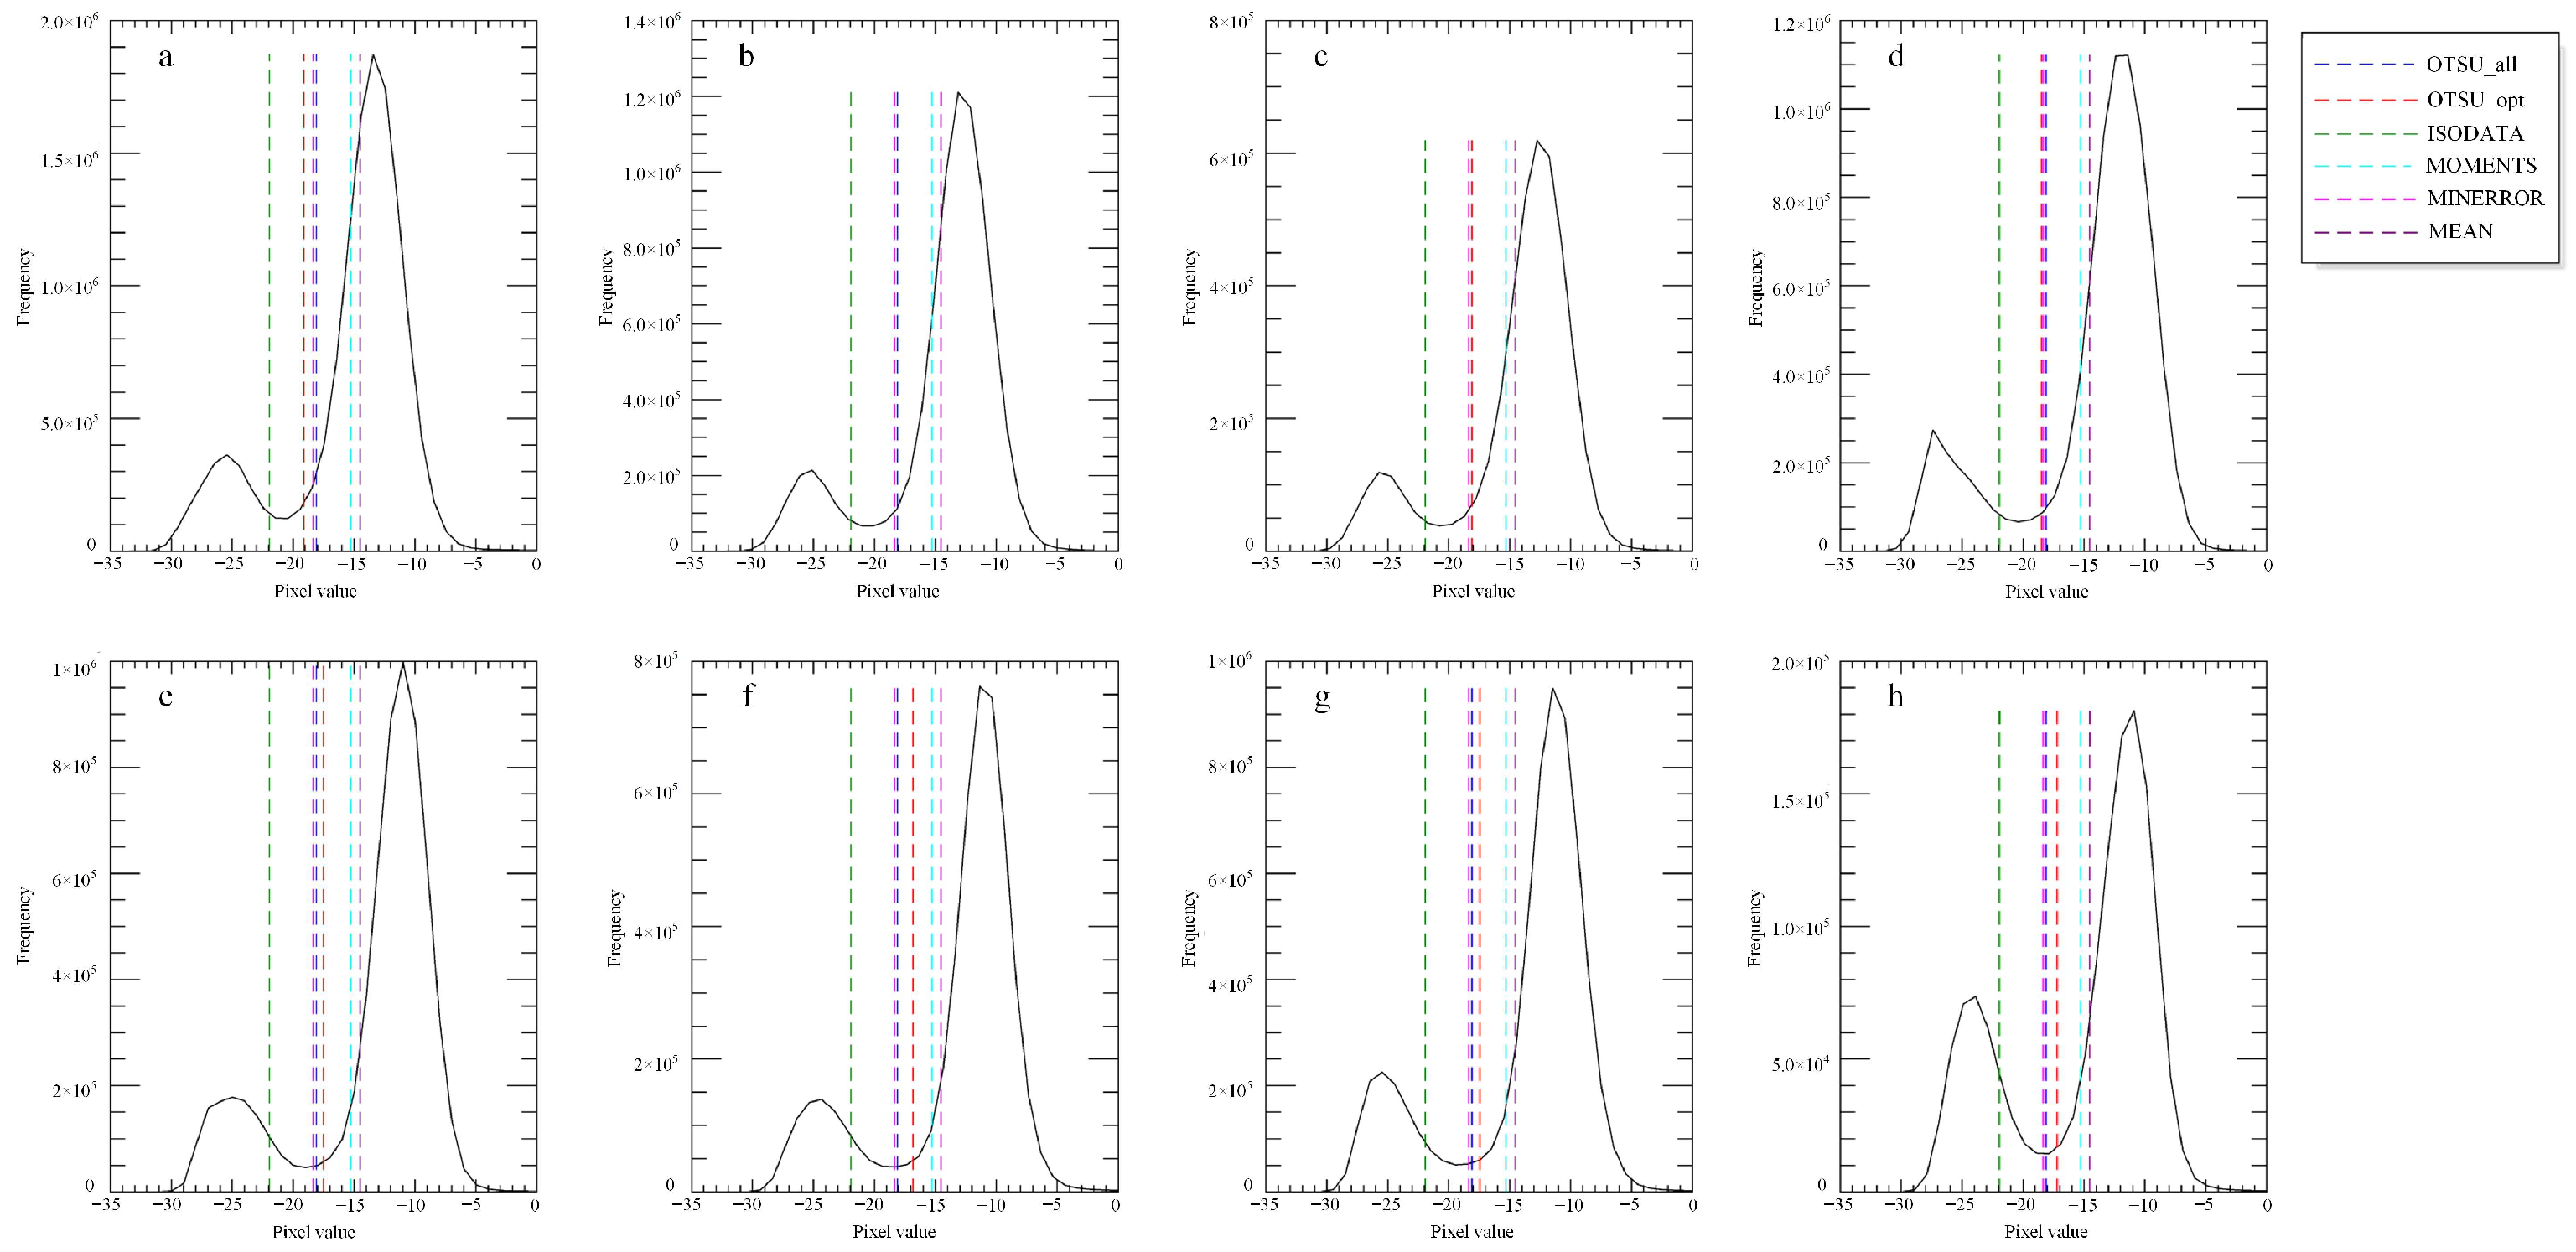
3.2. Spatial Consistency Analysis

The TP and TN indicate the percentage of spatially consistent water pixels and no-water pixels between the result with automatic water extraction method and the reference map. The FP means the percentage of pixels which are no-water in the result with the automatic water extraction method and water in the reference map. Meanwhile, the FN means the percentage of pixels which are water in the water map with the automatic water extraction method and no-water in the reference map. The result of TP, TN, FP, and FN of different methods along the study area are presented in Figure 6. The proportion of TP and TN of the proposed method is generally higher than other methods (Figure 6). In study areas 6 and 10, the result among these methods is highly consistent. Compared with other methods, the proposed method outperformed other methods in study areas 1, 2, 3, 4, 5, 8, and 9 (Figure 6). In study areas 1, 6, 7, and 10, the result of the proposed method is similar to OTSU_all.
The spatial distribution of water with OTSU_opt and OTSU_all were compared in study areas 2, 3, 4, 7, 8, and 9 (Figure 7). In the SAR images, there are many pixels with low backscattering coefficient in the land region and high backscattering coefficient in the water region. These noises are significant and complex, which makes them hard to remove (Figure 7). In study area 2, there are many pixels with low backscattering coefficient misclassified as water in the no-water region; OTSU_opt outperformed OTSU_all in this region, as well as in study area 3 (Figure 7, red circle in study areas 2 and 3). In study areas 4, 7, 8, and 9, many pixels with high backscattering coefficient distributed in the water region are misclassified as land (Figure 7, red circle in study areas 4, 7, 8, and 9). However, there are some regions where OTSU_all outperformed OTSU_opt (Figure 7, green circle in study areas 3 and 4). For the proposed method, if pixels with low backscattering coefficient in the no-water region were classified as land, the pixels with relatively high backscattering coefficient in the water region might be classified as land (Figure 7, green circle in study area 3). To the contrary, if pixels with high backscattering coefficient in the water region were classified as water, pixels with low backscattering coefficient in the no-water region might be easily classified as water (Figure 7, green circle in study area 4). In general, the water map with OTSU_opt is more consistent with that derived from Sentinel-2 compared to OTSU_all.
Study area 1 was further applied to test the feasibility of the proposed method in processing the whole scene of Sentinel-1. The result with the proposed method was compared with five other automatic water extraction methods (Figure 8). Overall, the water map with the proposed method is highly consistent with that of OTSU_all and ISODATA method. It seems that the MEAN, MINERROR, and MOMENT methods overestimated the region of water. A sub window of each method was compared with the water map derived from Sentinel-2 (Figure 8, red rectangle). Through the comparison, the result of the proposed method is highly consistent with the result of Sentinel-2. Many land pixels in the land–water ecotone in Dongting Lake were misclassified into water during the application of OTSU_all and ISODATA, especially for MEAN, MINERROR, and MOMENT (Figure 8, sub window).

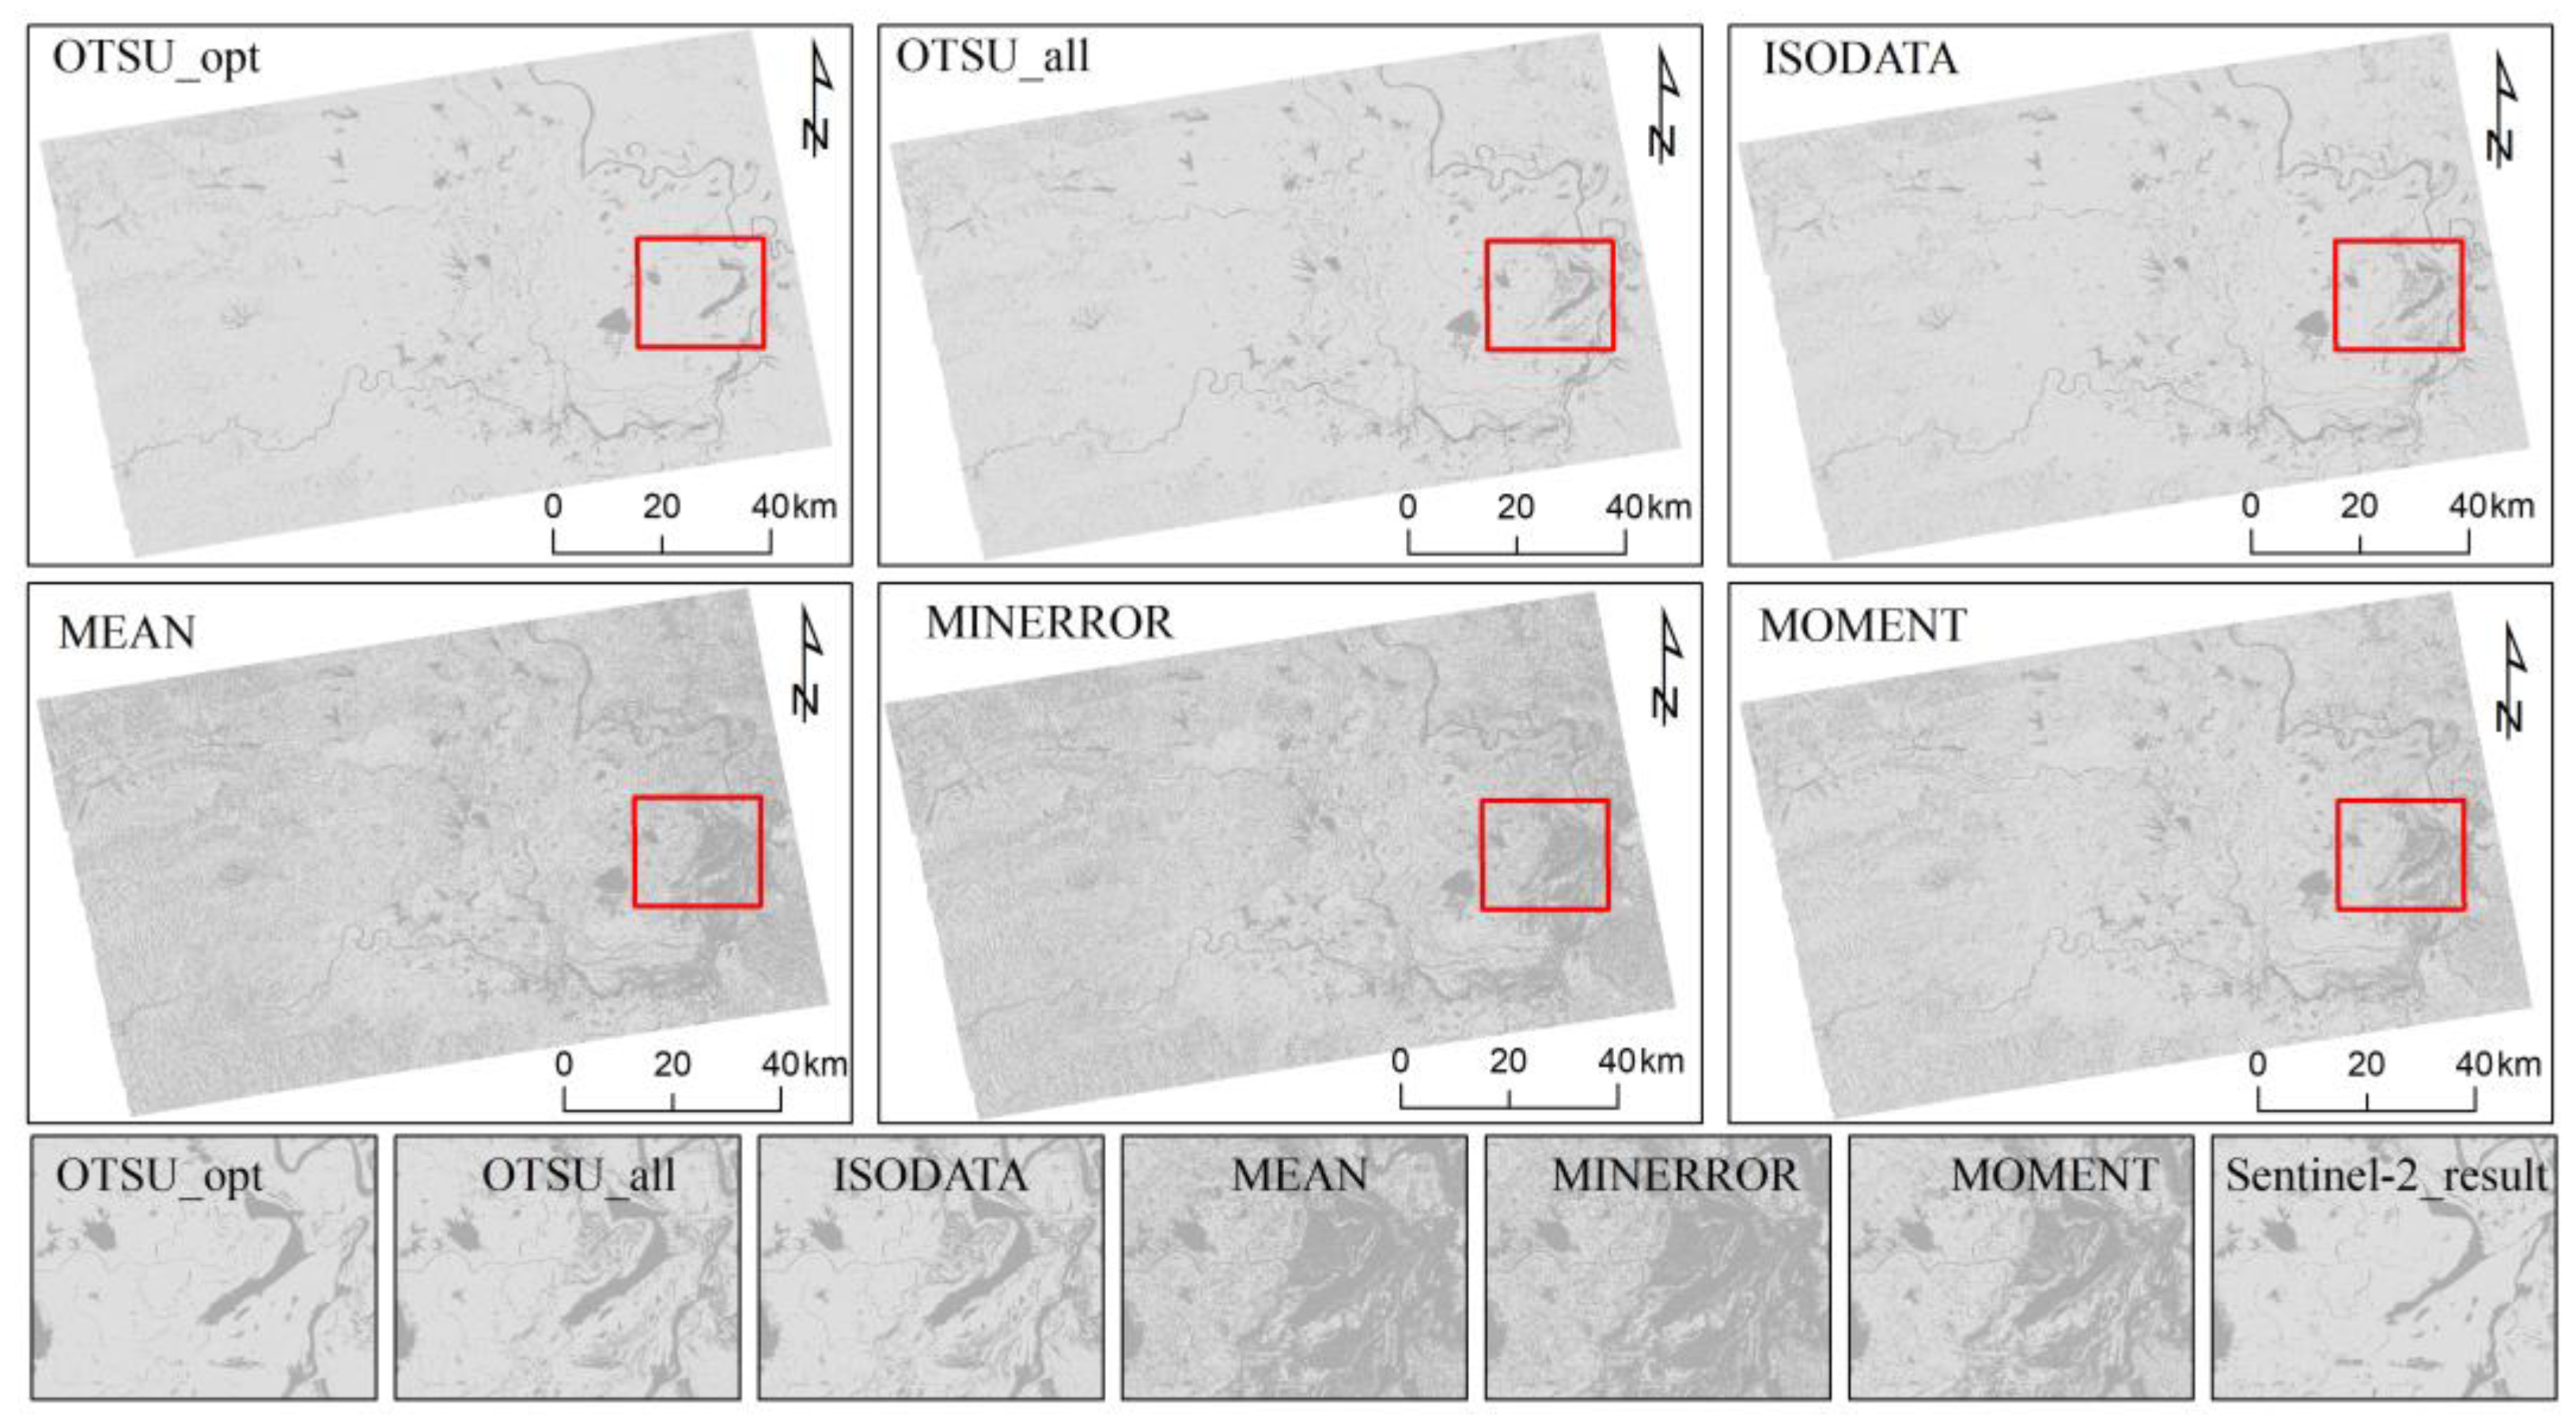
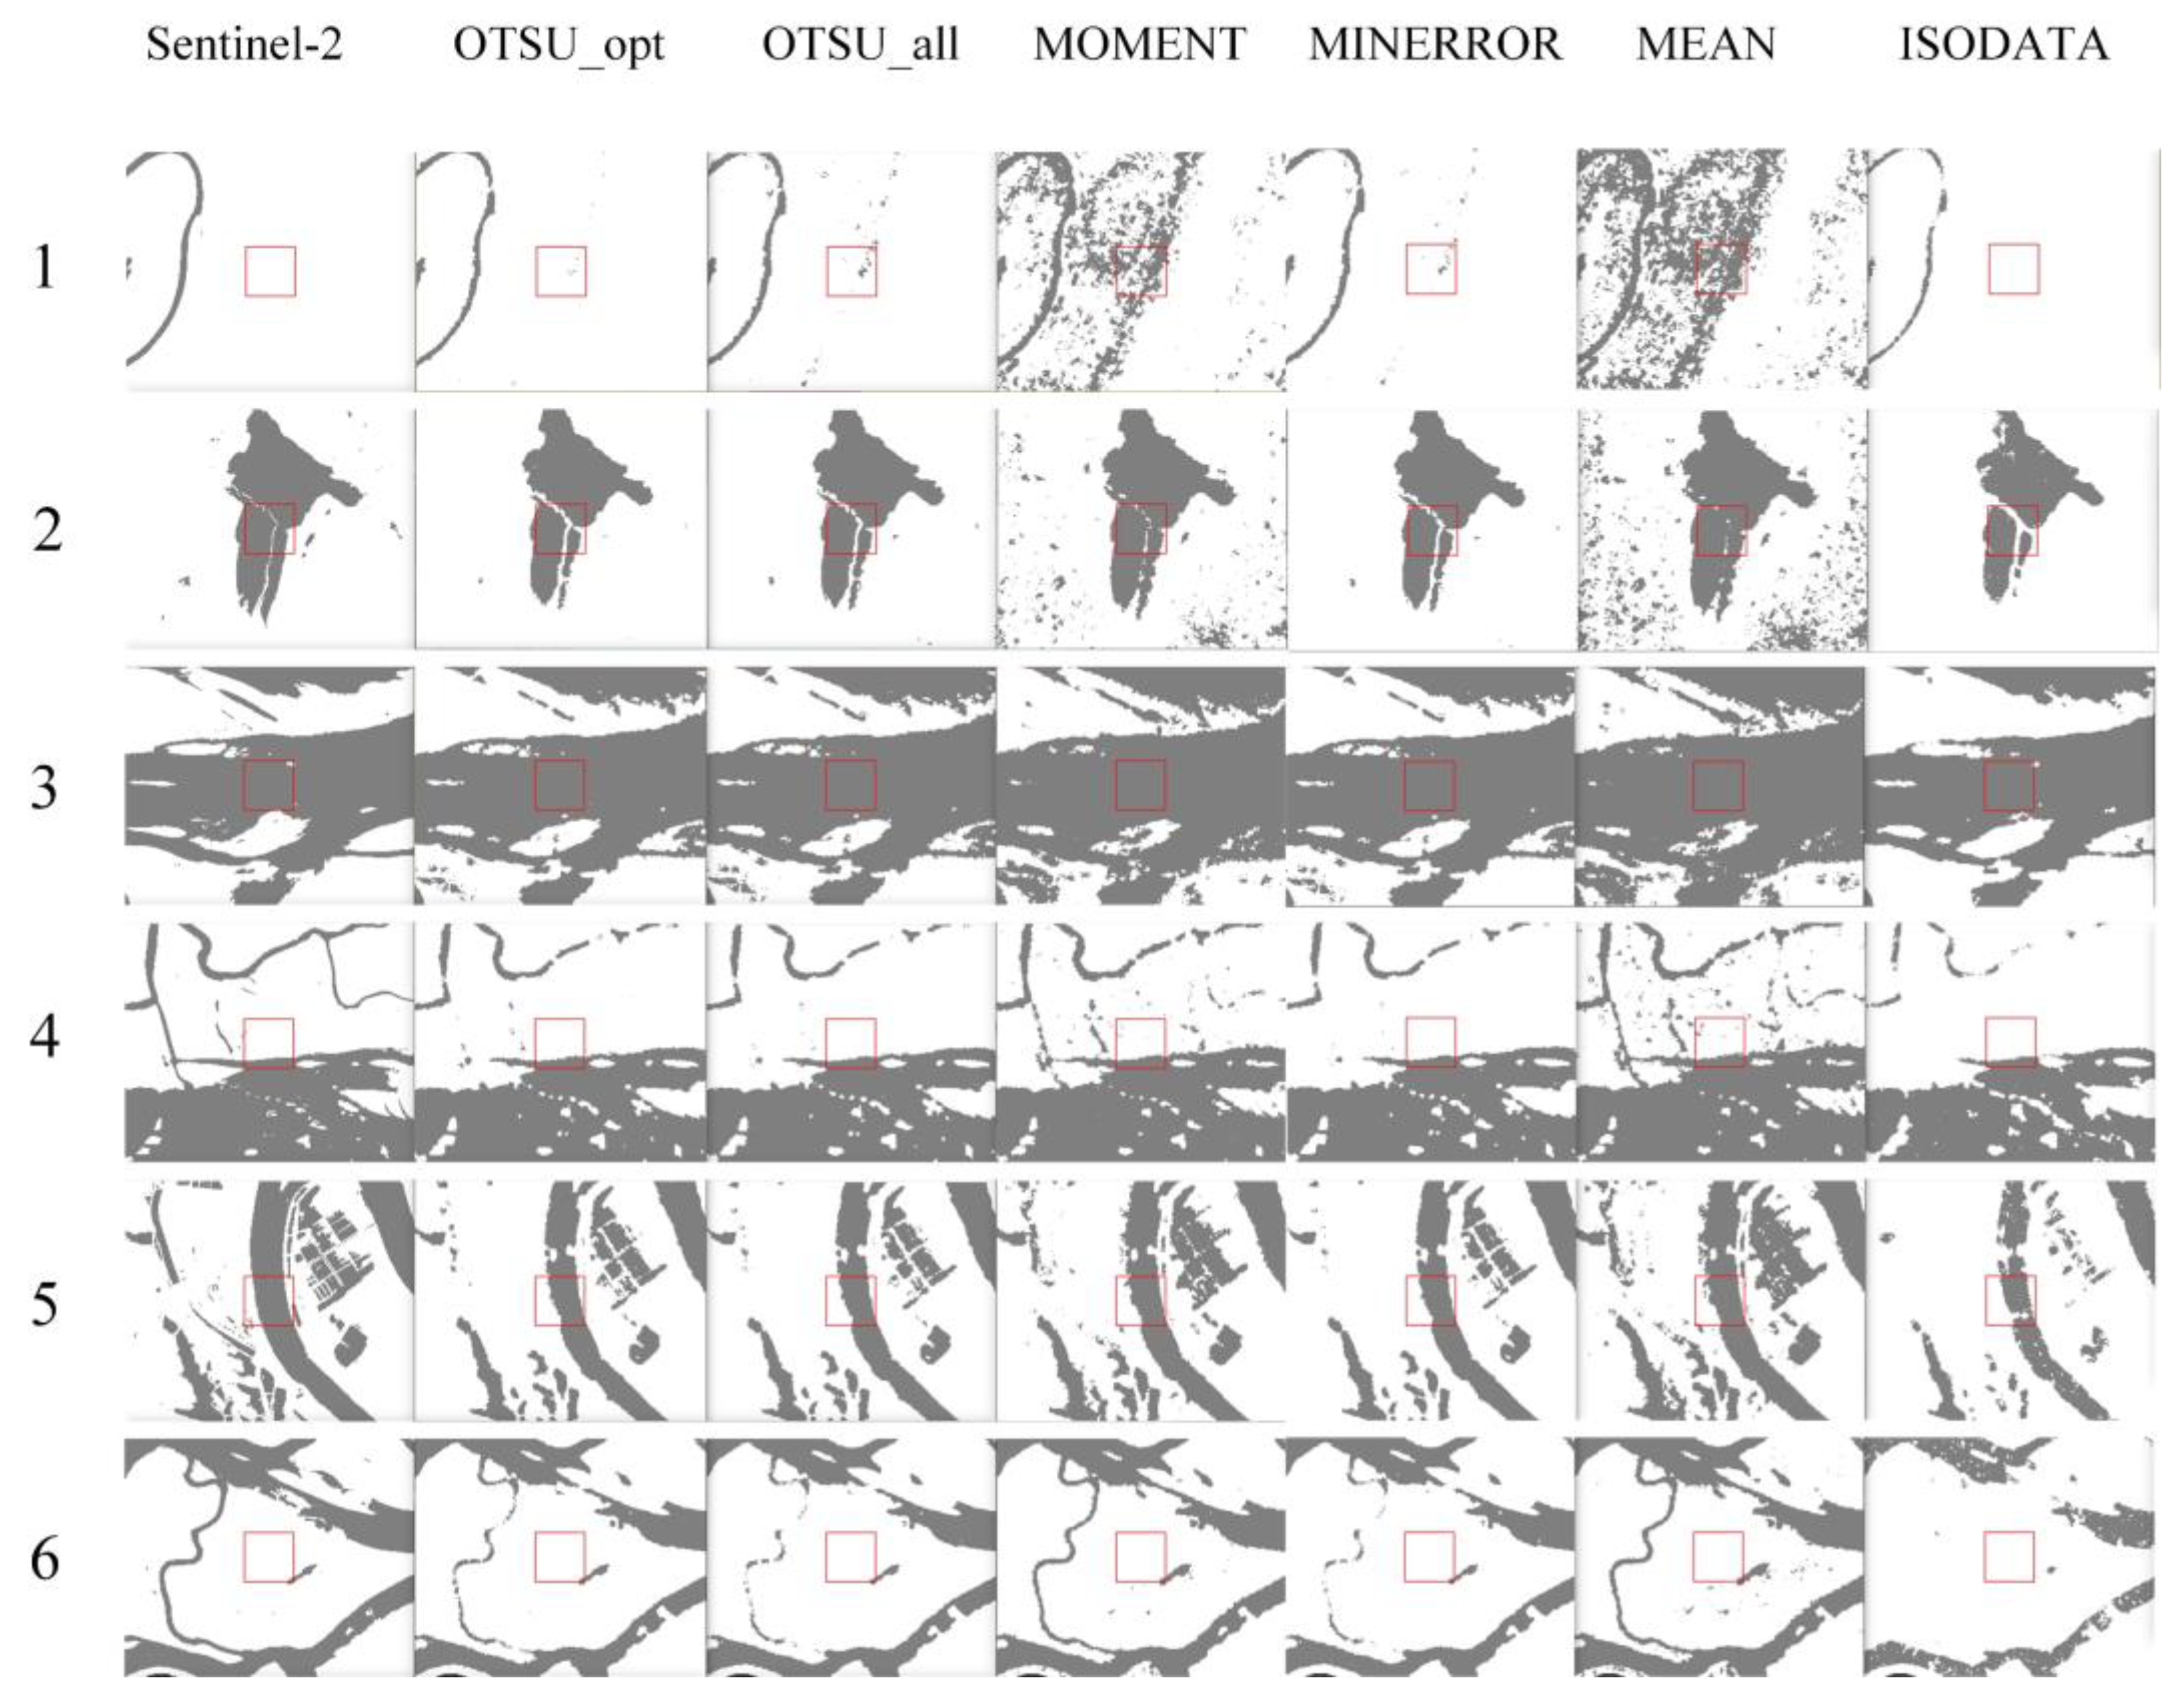
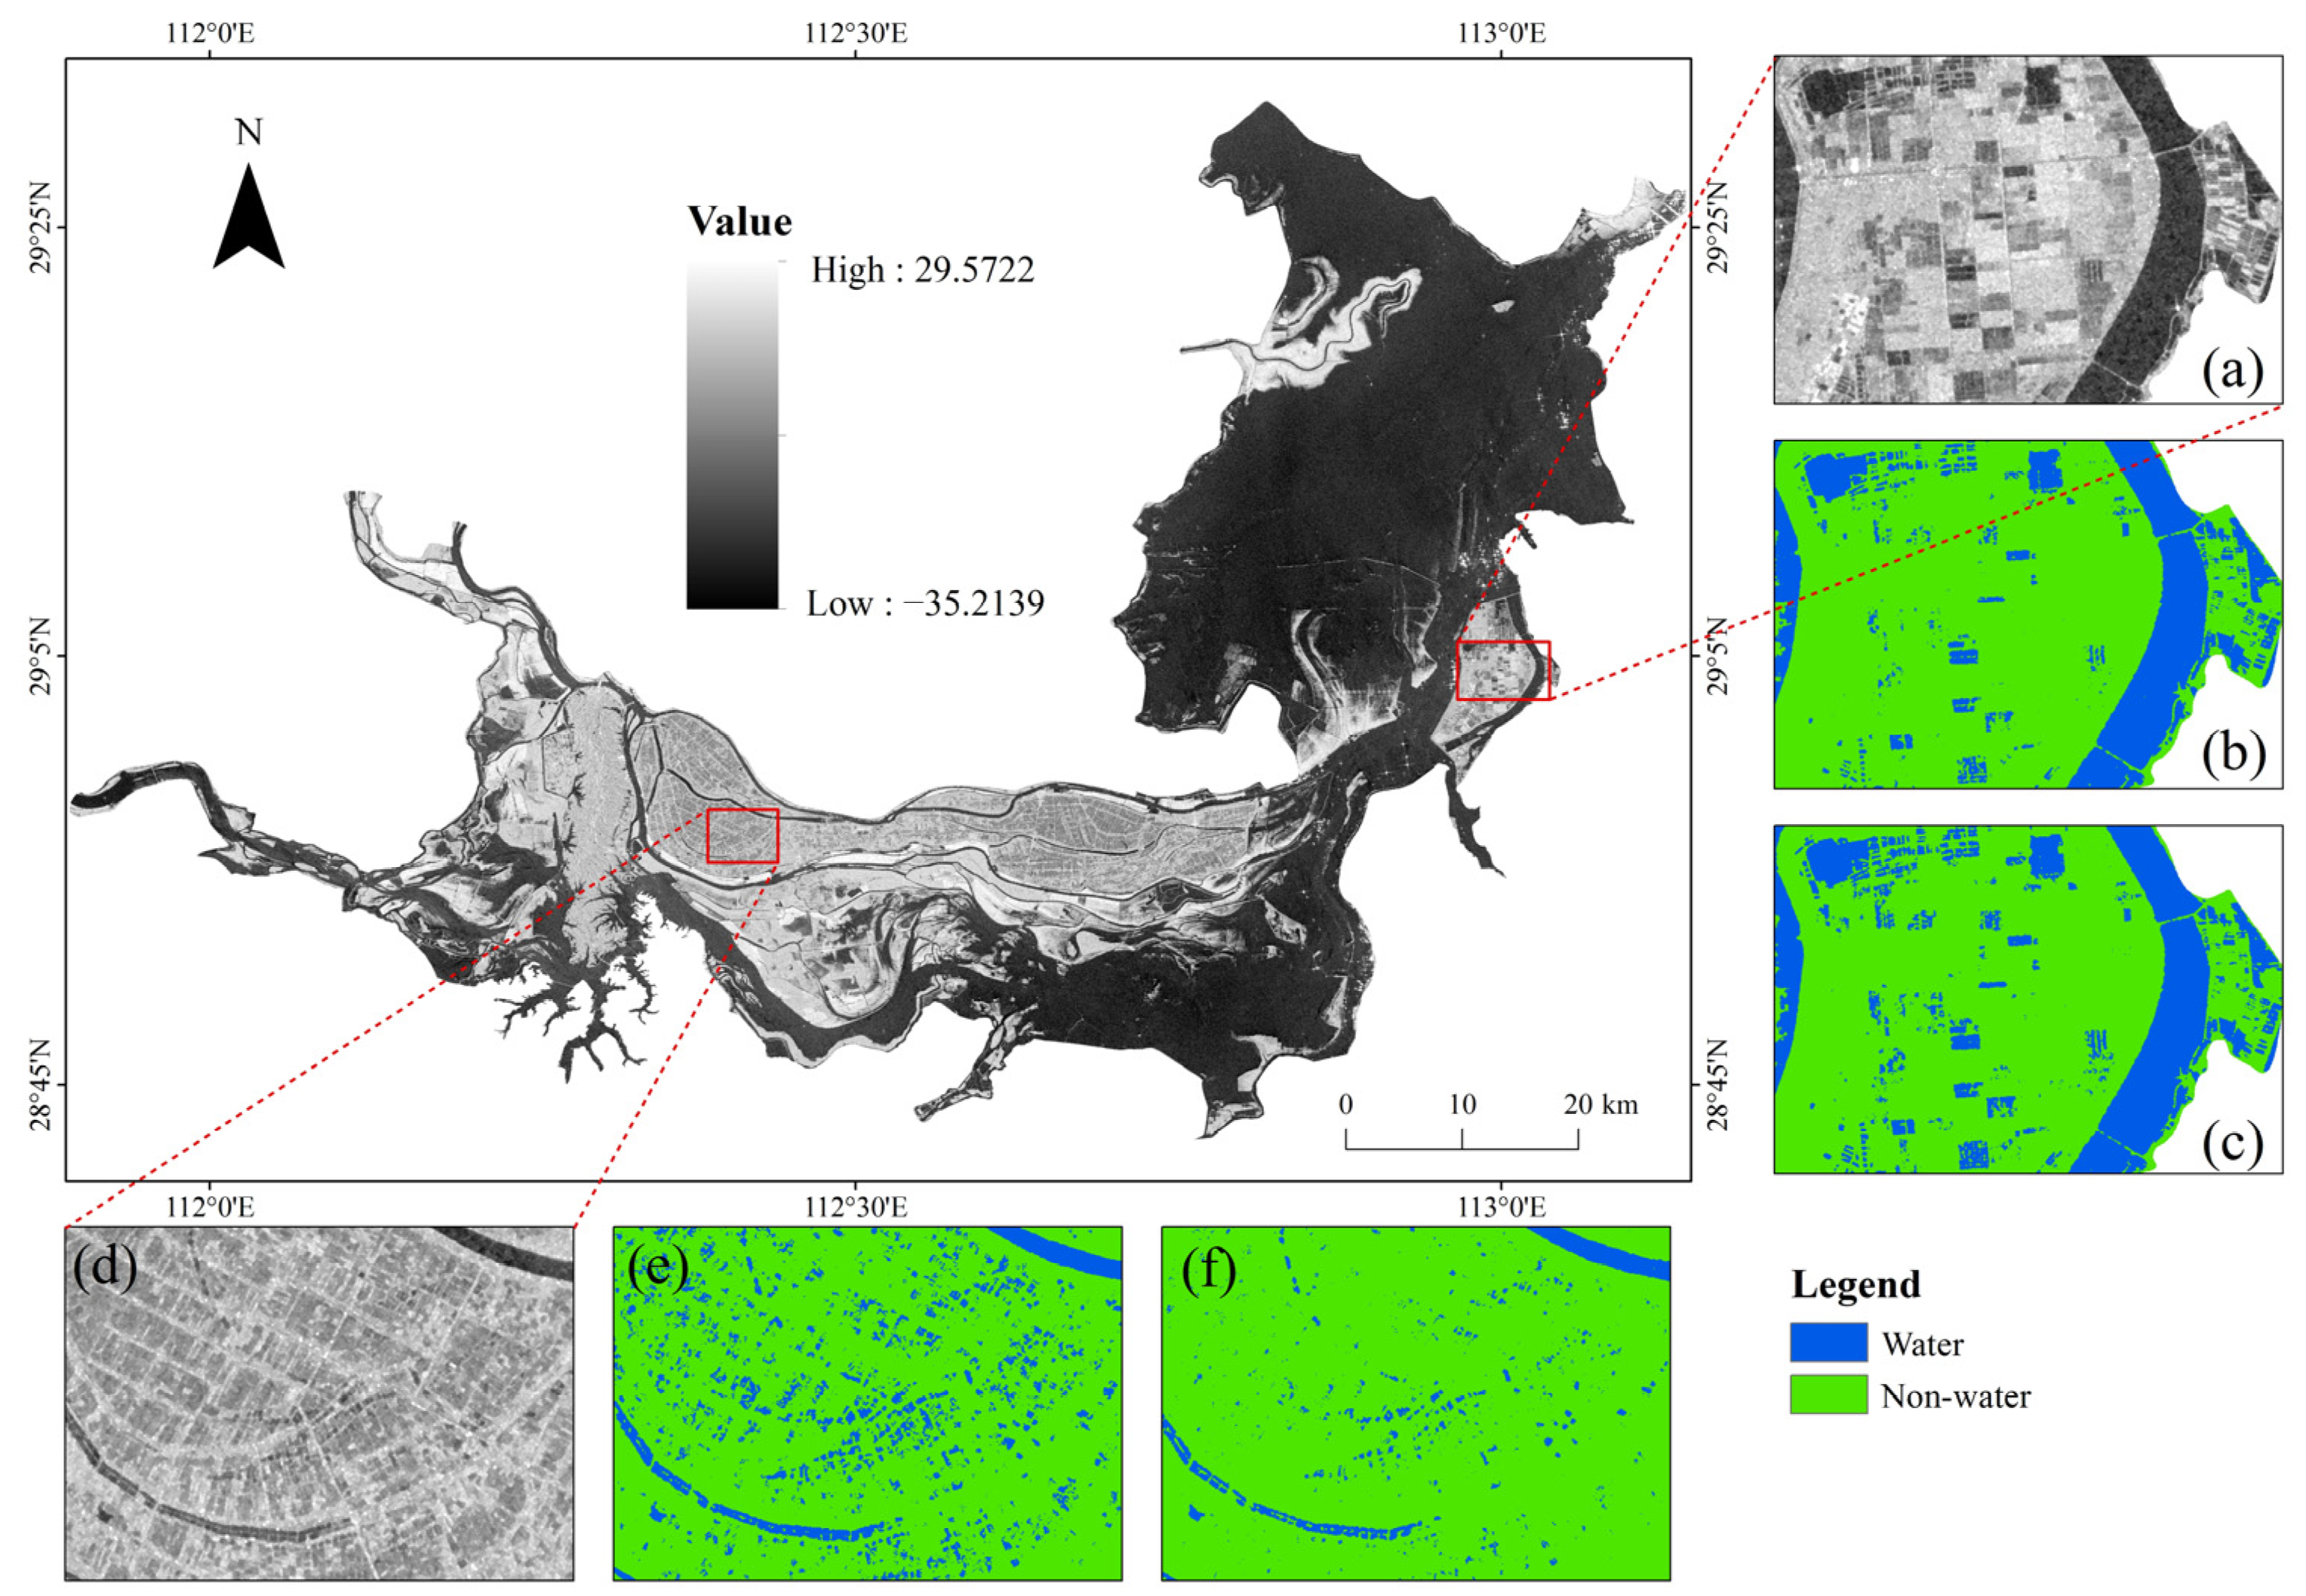
3.3. Local Analysis of Dongting Lake

Dongting Lake was applied for the local analysis. As shown in Figure 9, the water body extracted by the proposed method has a higher degree of overlap with the dark area in the original SAR image through the visual interpretation method. The water distribution also conforms to the water characteristics in the dry season, during which the water level is at the lowest and the water body is mainly located in the heart of Dongting Lake.
This proposed method achieves high OA value, and PA value and UA value also reach more than 0.8 with the Sentinel-2 water map as reference (Table 3). The low PA value is primarily due to the large number of ships in the estuary of Dongting Lake, which will generate high backscatter, causing some water areas to be divided into non-water bodies. In addition, there is a wide range of paddy fields, lotus ponds, aquaculture farms, and other ground objects in the south of the study area, which are complex in distribution, and these will produce a serious double bounce effect, resulting in more commission and omission.
In Figure 10, the water bodies extracted by six methods are compared and analyzed in six comparison regions. Comparing sub-region 1 with sub-region 2, MOMENT and MEAN have obvious over-segmentation of water bodies, and a large number of land areas are identified as water areas, creating high commission errors. The ISODATA method apparently underestimates the water area, as of the tributary in sub-region 6 and the artificial water body in sub-region 5, only a little is identified. The water boundary obtained by ISODATA, MOMENT, and MEAN is rough, and the classification accuracy is low. The classification results of OTSU_all and MINERROR method have high similarity, which is also reflected in their segmentation threshold, with a difference of only 0.25. From the tributary extraction results of sub-region 5 and sub-region 4, the proposed method can obtain more complete water bodies than the global algorithm, and from the classification results of region 1, it can be seen that the OTSU_all method and MINERROR method have more noise.
On the whole, in the West Dongting Lake and South Dongting Lake, which have many tributaries and complex terrain (sub-regions 3–6), this method can detect relatively complete small tributaries, while in the East Dongting Lake with a large water area (sub-region 1–2), the OTSU_opt method can also maintain low detection noise and a smooth water boundary on the basis of keeping high classification accuracy.
As shown in Figure 11, compared with the other five methods, the self-adaptive threshold segmentation method can obtain the highest KC and OA, which are 0.81 and 0.94, respectively, and the JM value also exceeds 1.9. In addition to the ISODATA method, the separability of the other five methods is in good agreement with OA and KC, while the higher separability is also accompanied by higher OA and KC. Figure 12 shows the threshold differences calculated by proposed method and the global method in different image blocks. It can be clearly seen that the threshold value calculated by the ISODATA method is biased towards the water body, which results in less commission but high omission error. This method has a noticeable threshold difference with the other five methods, and has more a obvious effect in the second half of the lake, that is, the faraway district. To sum up, this algorithm can effectively improve the classification effect, and has higher classification accuracy and stability.

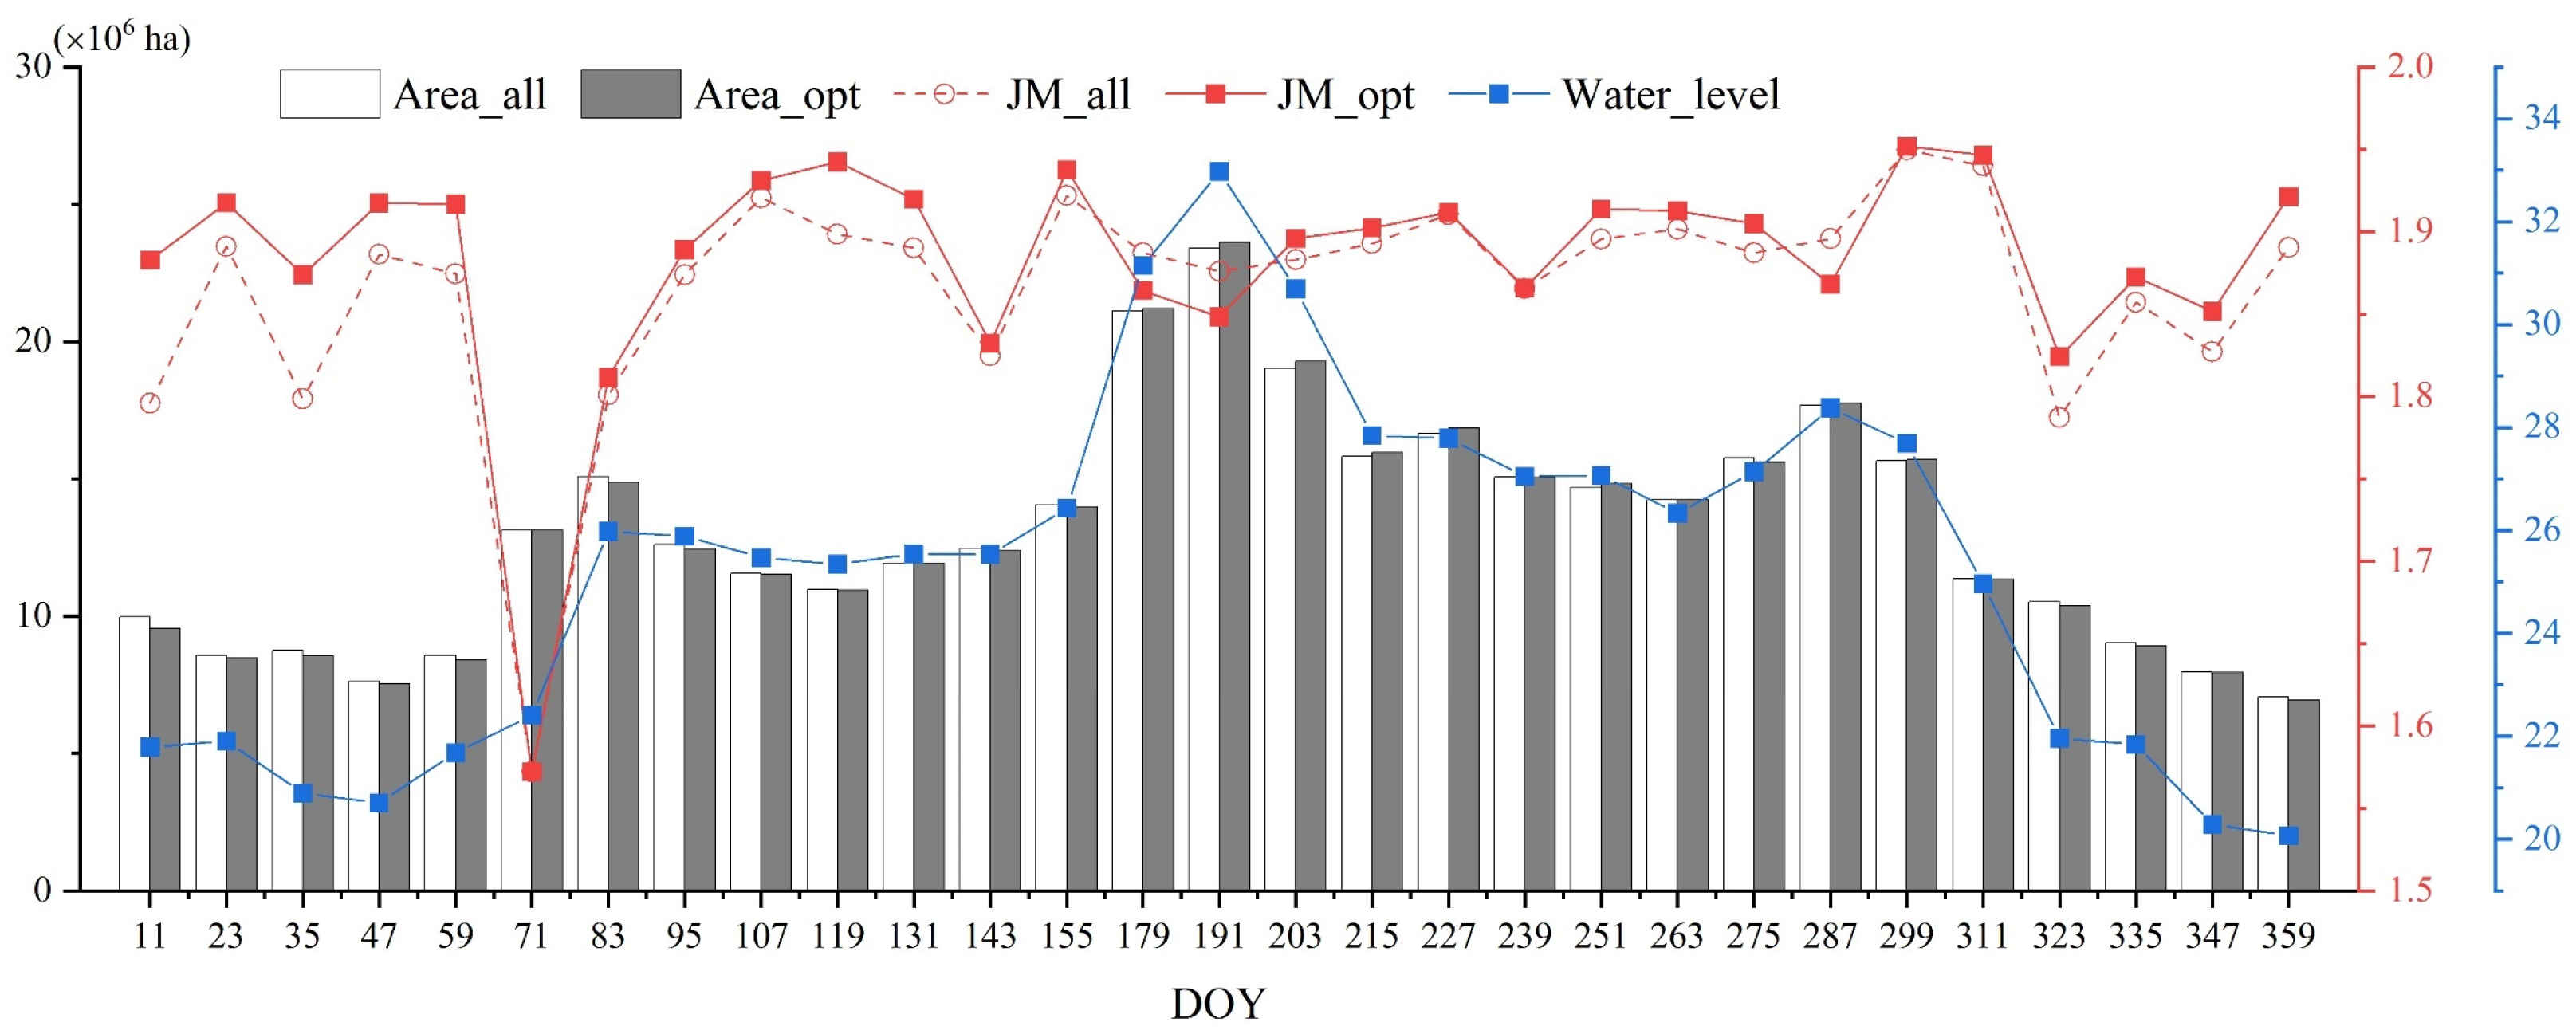
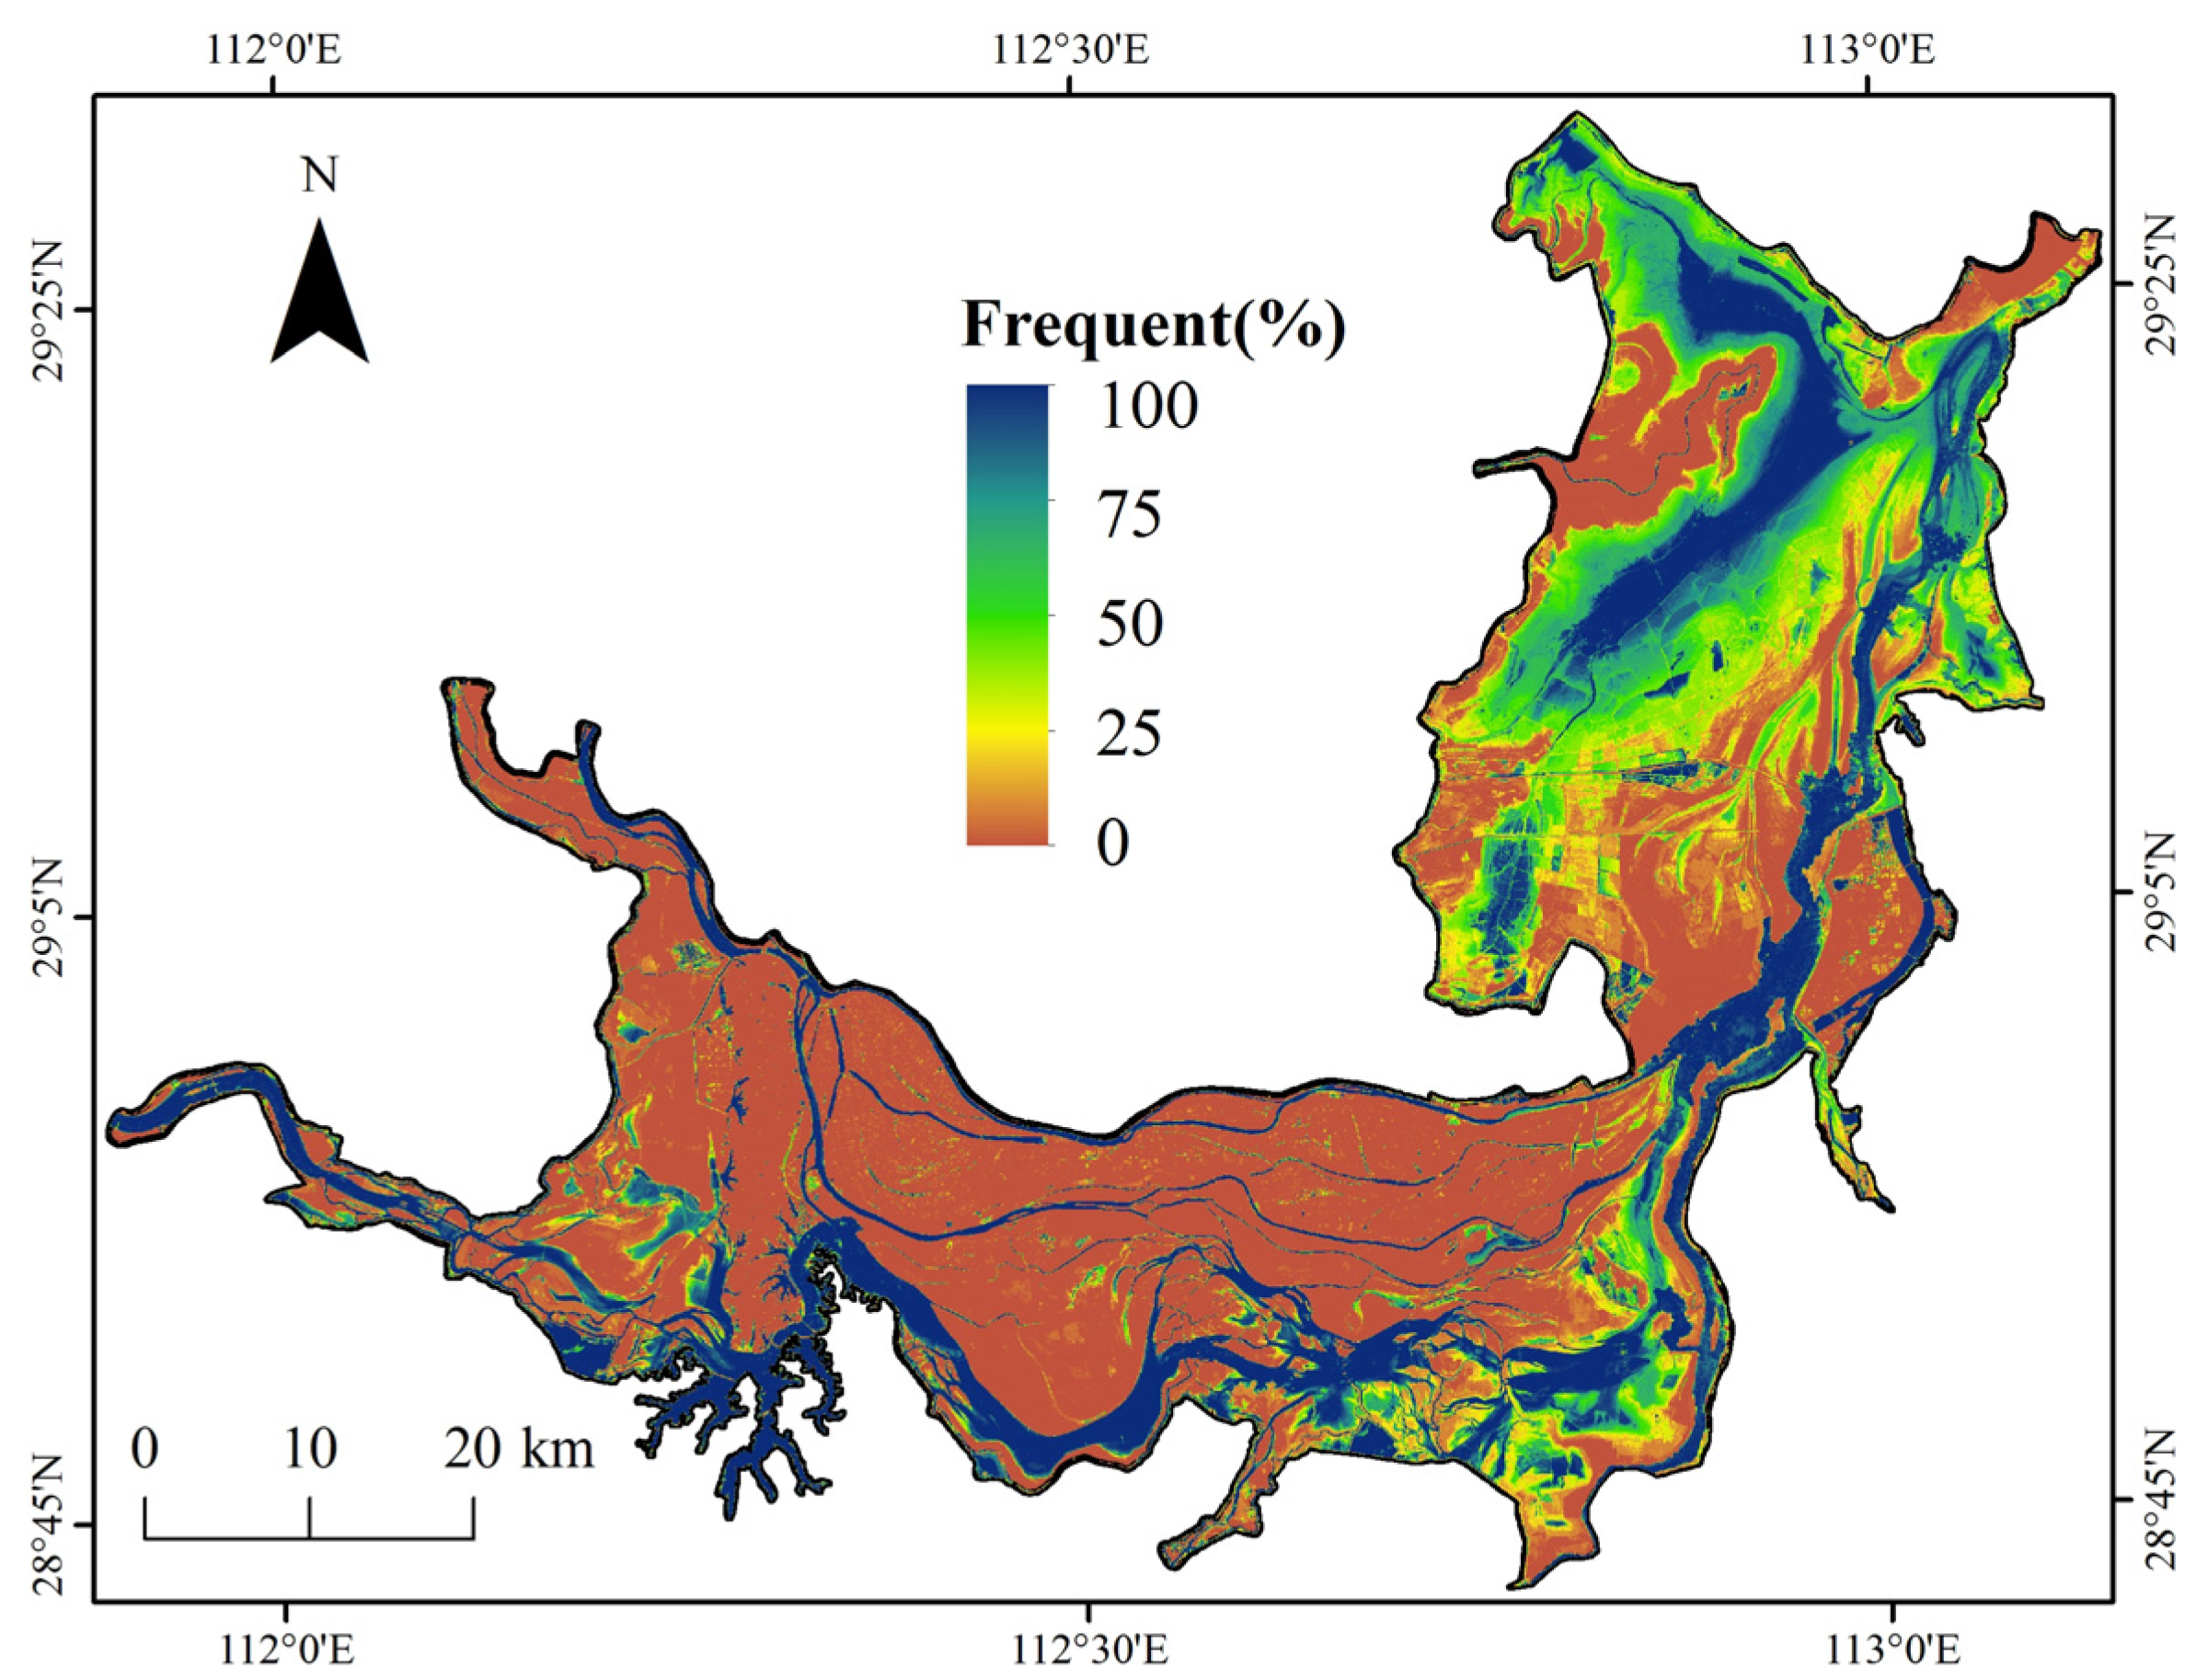
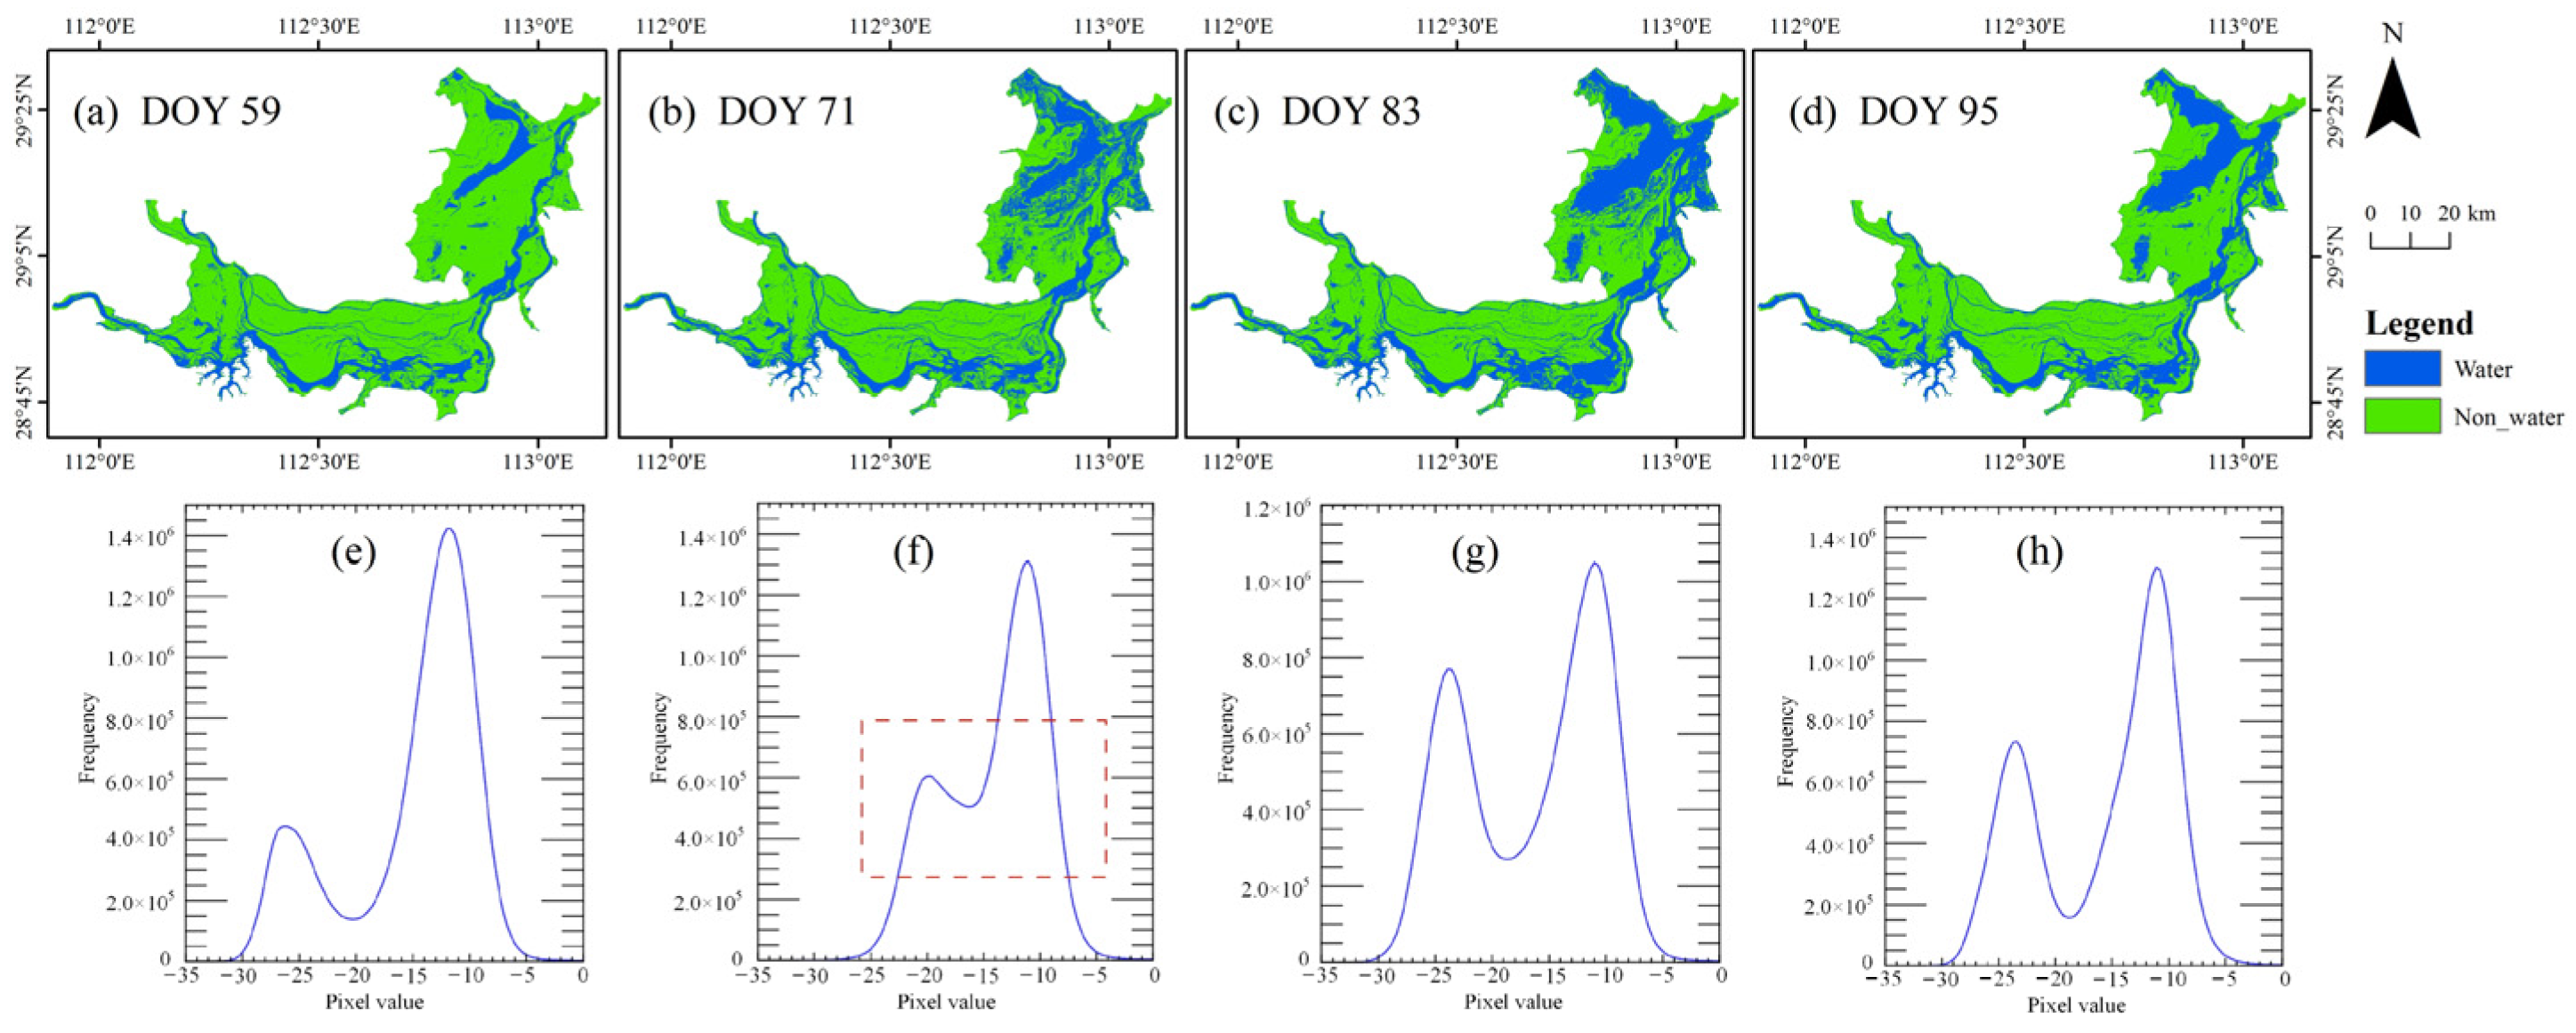
3.4. Annual Variation of Dongting Lake

The water area, water level, and corresponding JM value in 2017 are presented in Figure 13. The trend of water area change is highly consistent with the variation curve of the water level from the Chenglingji meteorological station. Most of the water areas extracted by this method are lower than OTSU_all, but the difference is very small. In March, July, and October, the water area of Dongting Lake increased significantly and the JM value decreased. According to the historical meteorological data of the Hunan Statistical Yearbook (http://222.240.193.190/18tjnj/indexch.htm, accessed on 15 April 2022), there was heavy rainfall in these three periods, which resulted in moist soil and temporary stagnant water. This led to low back backscatter coefficient in the region without inundation. Consequently, it became more difficult to separate water and land with SAR images, resulting in a decrease in JM value. This may hinder the ability of JM value to present the robustness of the method in extracting water, with the result that the JM value of OTSU_opt in these time points is not as good as the existing global OSTU method. In all, among the 29 images, the separability of 26 classified images obtained by OTSU_opt is better than OTSU_all, which shows that this self-adaptive threshold segmentation method has a better classification effect.
The water frequency map of Dongting Lake in 2017 was derived from the OTSU_opt water maps exhibited in Figure 14. The permanent water body (p > 75%; [43]) is mainly located in the north of Dongting and on the main stream, with an area of 788.523 km2. The waters with medium frequency, i.e., 25% < p < 75%, are often defined as seasonal water bodies, which are affected by climate and human production activities, while the water bodies with water frequency less than 25% are temporary water bodies, which may be flood disaster districts or noise. As the main region of Dongting Lake, the water area of East Dongting Lake changes widely; the water body basically covers the entire East Dongting Lake region. The east of South Dongting Lake is the region with greater river alluvial influence; it also has a wide annual variation, while the water body distribution of West Dongting Lake remains stable, and most of it is located in the main stream area.

4. Discussion

Aiming at the poor effect of the global threshold segmentation method on water extraction in images with large category variance, a self-adaptive thresholding method based on distance segmentation is proposed according to the negative correlation between the backscatter coefficient and distance as a result of side-view imaging. The distance image is easily available with the rotation of column image. Moreover, iterative merging of image blocks by using the JM index can adaptively obtain the optimal image blocks to achieve the best segmentation effect. Compared with the extraction results of five global segmentation algorithms, this method can gain higher overall accuracy and kappa coefficient, detect more small water bodies, and obtain more robust results in the case of complex terrain. Therefore, the improved method has potential to reduce the negative impact of the salt-and-pepper noise of SAR, and promote the accurate identification ability of water bodies using SAR data, so as to be applied to the fields of water resource management, ecological protection, and so on.

4.1. Influencing Factors

Firstly, this paper uses the distance to the orbit as block basis, and the classification effect also has a certain relationship with the distance. Each distance block has its own threshold for water extraction. In this way, the effects of noise on water extraction can be weakened and the proposed method generally outperformed other global methods through the ten study areas around the world. However, it may lead to some significant boundaries among distance blocks (Figure 7: study area 4). From the results of the whole scene of Sentinel-1 (Figure 8), the proposed method has a great impact on a section of the lake, but for the left region (land area), its result is very close to that of the global method. The method of segmentation with distance may potentially improve the accuracy of automatic water extraction.
In this paper, the image is segmented with the patch size whose overall JM is maximum. At the same time, like with transformed divergence (TD; [37]) and the spectral discrimination index (SDI; [44]), the JM distance utilizes the difference of standard deviation to indicate between-group variance and the difference of variance to measure the within-group variance, which will result in high separability even though the two categories are badly misclassified, just as the water body extracted by ISODATA method is seriously underestimated, but a high JM value is obtained (Figure 10). Furthermore, as shown in Figure 12, when the segmentation threshold appears on both sides of the bimodal intersection, the JM value will be inconsistent with the OA and KC. Thus, finding a more robust index to evaluate the separability of categories can further improve the accuracy of water extraction.

4.2. Stability

For a local study area, the water area will also have large fluctuations when the water level changes greatly (Figure 13). In the case of inconsistent changes in water bodies and water levels, such as day of year (DOY) 71 and DOY 323, the separability of image classification drops significantly. Take the image on DOY 71 as an example; a small amount of water level rise has a large area expansion. Comparing the water distribution and histogram of four adjacent times (Figure 15), the histogram overlap area between water and non-water in the image on DOY 71 (red dashed rectangle in Figure 15f) is very high and the distribution of water bodies is sparse. This situation is most likely driven by the absorption or reduction of the signal due to phenological changes in the structure of low vegetation classes [24,45]. Although there has been a decrease, the feasibility of this method is still higher than that of the global method, indicating that it can better handle complex environments.
In the water body extraction results using the OTSU_optimized method, the separability of three images is lower than that of the global method, and all of them are in the period of rapid expansion of water bodies (Figure 13). This paper takes the image of DOY 191 as an example to analyze the above situation. In these regions where the water area is large, the two methods can accurately extract the water bodies in the above areas and the OTSU_optimized identified some water bodies as lands in farmland and lotus pond regions (Figure 16b,c). In the West Dongting Lake region (Figure 16e,f), the OTSU_optimized method extracted more water in the production region where land was domain. Comparing with the global OTSU method, the OTSU_optimized method shrinks the area of water in a large water region and shrinks the area of land in a land domain region. Therefore, the self-adaptive threshold segmentation method tends to balance the areas of the two categories. This can overcome the disadvantage of the global method which ignored this balance in terms of the total area. However, according to the historical meteorological data of the Hunan Statistical Yearbook, there are heavy rains in DOY 190 which lead to low back backscatter coefficient in the land domain region. Combined with the merit of the OTSU_optimized method, it may lead to omission of land in the West Dongting Lake region (Figure 16e).
In general, both for spatial comparison and statistics of accuracy, the proposed method has the highest classification accuracy across ten different regions around the world, compared with other global methods. On the other hand, with the classification results of long time series images in local region, the proposed method also presented a higher robustness. Therefore, compared to the global method, this OTSU_optimized method is more adaptable to complex situations and achieves higher water extraction accuracy even though it may omit land in some regions after heavy rain.

4.3. Extracted Water Body Versus Previous Studies

For the accurate extraction of water, many studies have been done at home and abroad. Martinis et al. [18] proposed a split-based automatic thresholding procedure for near real-time flood detection using high-resolution TerraSAR-X data. The method uses statistical analysis of SAR backscatter values to split the image into smaller regions to achieve an obviously bimodal histogram of the image value. Chini et al. [15] proposed a hierarchical split-based approach for parametric thresholding of SAR images for flood inundation mapping. The method continue to split images into segmentation from coarse to finer, till the a bimodal histogram is available and acquire a local threshold values. These methods are more suitable for dealing with regions where the area of water is smaller as discussed in their research and the split processing may be not able to work when the water or land region is large. It is hard for them dealing with the imbalance datasets. Song et al. [46] artificially divided the Poyang Lake region through water frequency and the Sentinel-2 water distribution map, so that each area is similar and contains water and land. However, this blocking method mainly relies on manual division; an automatic method is more suitable to other different types of lakes. Liang et al. [47] proposed to use the global threshold for preliminary segmentation, and then combine the whole extracted water body with each land cluster for threshold segmentation again, which increase the proportion of water in the segmentation, but this method will improve the misclassification probability of islands. The procedures of the proposed method in this study is automated with a self-adapting way and does not require additional data to perform segmentation of SAR data. The distance-based segmentation criterion can also reduce the influence of SAR data noise, which greatly improved accuracy of water extraction. Combined the analysis of the result, this proposed method can achieve a more feasible classification varying with different regions which imply the good feasibility of the proposed method in dealing with the imbalance datasets.
In addition, the former researcher’s study area is a region with serious flood disaster activity, where adopting the global OTSU method can also achieve 98% accuracy. However, the Dongting Lake studied in this paper, especially the South Dongting Lake and the West Dongting Lake, has a more complex environment, where the global OTSU method can only achieve an overall accuracy of 93.8%. With the results of ten study areas around the world, the OTSU_optimized method outperformed other methods, which at least increased more than 3.2% in OA and 5.1% in Kappa value. The spatial comparisons also imply the good robustness of the OTSU_optimized method across different areas. During the time series analysis in the local region, the JM value indicated that the OTSU_optimized method outperformed global OTSU in 26 of 29 series. Although the self-adaptive water extraction method has some shortcomings, these results show that this method is feasible and can acquire high extraction accuracy in complex research areas.

5. Conclusions

Based on the relationship between incident angle, backscatter, and noise intensity in SAR images, we propose a self-adaptive thresholding approach based on distance block to extract water from Sentinel-1A images. Taking ten study areas around the world, with whole scene extent and the local region as an example, through the quantitative analysis of OA, KC, and JM index, the comparative analysis with Sentinel-2 classification results and the other five global methods’ segmentation results generally shows that this method has improved the extraction accuracy and weakened the impact of noise, and can extract more accurate water areas and identify small water bodies in each image block. This is of great significance for obtaining the scope of the lake and studying the relationship between water body and vegetation in the water region. This method has achieved better classification accuracy for most of the processing of all images in 2017 in the local region and it has good robustness. The inadequacy is that this method tends to harmonize the areas of the two groups. When the water range is larger, part of the water body will be divided into land. In this paper, the self-adaptive threshold segmentation algorithm only processes the data in Sentinel-1A IW mode, but it is also applicable to images with data signals related to distance. Even if the method is simple, the results imply that it is feasible and it can also be used to improve other global classification algorithms and extract other linear features.

Author Contributions

Conceptualization, Methodology, J.T.; Writing—original draft, Validation, Y.T.; Validation, Investigation, B.L.; Data curation, Methodology, G.Z.; Validation, Y.M.; Investigation, M.S.; Investigation, B.W. All authors have read and agreed to the published version of the manuscript.

Funding

This research was funded by the National Key Research & Development Program of China (2022YFF1301801), Changsha University of Science and Technology Graduate Research Innovation Project (CXCLY2022022), and Investigation, monitoring and evaluation of natural resource interaction and ecological degradation in Qinling–Loess Plateau transitional zone (ZD20220882).

Data Availability Statement

Not applicable.

Acknowledgments

We express our respects and gratitude to editors and anonymous reviewers for their useful comments. We also acknowledge editors for their efforts in promoting the manuscript.

Conflicts of Interest

The authors declare no conflict of interest.

References

  1. Deng, Y.; Jiang, W.; Tang, Z.; Ling, Z.; Wu, Z. Long-Term Changes of Open-Surface Water Bodies in the Yangtze River Basin Based on the Google Earth Engine Cloud Platform. Remote Sens. 2019, 11, 2213. [Google Scholar] [CrossRef]
  2. Assessment, M.E. Ecosystems and Human Well-Being: Wetlands and Water; World Resources Institute: Washington, DC, USA, 2005. [Google Scholar]
  3. Duan, Z.; Bastiaanssen, W.G.M. Estimating water volume variations in lakes and reservoirs from four operational satellite altimetry databases and satellite imagery data. Remote Sens. Environ. 2013, 134, 403–416. [Google Scholar] [CrossRef]
  4. Khandelwal, A.; Karpatne, A.; Marlier, M.E.; Kim, J.; Lettenmaier, D.P.; Kumar, V. An approach for global monitoring of surface water extent variations in reservoirs using MODIS data. Remote Sens. Environ. 2017, 202, 113–128. [Google Scholar] [CrossRef]
  5. Pickens, A.H.; Hansen, M.C.; Hancher, M.; Stehman, S.V.; Tyukavina, A.; Potapov, P.; Marroquin, B.; Sherani, Z. Mapping and sampling to characterize global inland water dynamics from 1999 to 2018 with full Landsat time-series. Remote Sens. Environ. 2020, 243, 111792. [Google Scholar] [CrossRef]
  6. Huth, J.; Gessner, U.; Klein, I.; Yesou, H.; Lai, X.; Oppelt, N.; Kuenzer, C. Analyzing Water Dynamics Based on Sentinel-1 Time Series—A Study for Dongting Lake Wetlands in China. Remote Sens. 2020, 12, 1761. [Google Scholar] [CrossRef]
  7. Ottinger, M.; Clauss, K.; Kuenzer, C. Large-Scale Assessment of Coastal Aquaculture Ponds with Sentinel-1 Time Series Data. Remote Sens. 2017, 9, 440. [Google Scholar] [CrossRef]
  8. Fan, Y.; Chen, Y.; Chen, X.; Zhang, H.; Liu, C.; Duan, Q. Estimating the aquatic-plant area on a pond surface using a hue-saturation-component combination and an improved Otsu method. Comput. Electron. Agric. 2021, 188, 106372. [Google Scholar] [CrossRef]
  9. Suh, H.K.; Hofstee, J.W.; van Henten, E.J. Investigation on combinations of colour indices and threshold techniques in vegetation segmentation for volunteer potato control in sugar beet. Comput. Electron. Agric. 2020, 179, 105819. [Google Scholar] [CrossRef]
  10. Xu, X.; Xu, S.; Jin, L.; Song, E. Characteristic analysis of Otsu threshold and its applications. Pattern Recognit. Lett. 2011, 32, 956–961. [Google Scholar] [CrossRef]
  11. Yuan, X.-C.; Wu, L.-S.; Peng, Q. An improved Otsu method using the weighted object variance for defect detection. Appl. Surf. Sci. 2015, 349, 472–484. [Google Scholar] [CrossRef]
  12. Cao, H.; Zhang, H.; Wang, C.; Zhang, B. Operational Flood Detection Using Sentinel-1 SAR Data over Large Areas. Water 2019, 11, 786. [Google Scholar] [CrossRef]
  13. Ng, H.-F. Automatic thresholding for defect detection. Pattern Recognit. Lett. 2006, 27, 1644–1649. [Google Scholar] [CrossRef]
  14. Fan, J.-L.; Lei, B. A modified valley-emphasis method for automatic thresholding. Pattern Recognit. Lett. 2012, 33, 703–708. [Google Scholar] [CrossRef]
  15. Chini, M.; Hostache, R.; Giustarini, L.; Matgen, P. A Hierarchical Split-Based Approach for Parametric Thresholding of SAR Images: Flood Inundation as a Test Case. IEEE Trans. Geosci. Remote Sens. 2017, 55, 6975–6988. [Google Scholar] [CrossRef]
  16. Martinis, S.; Kersten, J.; Twele, A. A fully automated TerraSAR-X based flood service. ISPRS J. Photogramm. Remote Sens. 2015, 104, 203–212. [Google Scholar] [CrossRef]
  17. Bovolo, F.; Bruzzone, L. A Split-Based Approach to Unsupervised Change Detection in Large-Size Multitemporal Images: Application to Tsunami-Damage Assessment. IEEE Trans. Geosci. Remote Sens. 2007, 45, 1658–1670. [Google Scholar] [CrossRef]
  18. Martinis, S.; Twele, A.; Voigt, S. Towards operational near real-time flood detection using a split-based automatic thresholding procedure on high resolution TerraSAR-X data. Nat. Hazards Earth Syst. Sci. 2009, 9, 303–314. [Google Scholar] [CrossRef]
  19. Joseph, S.I.T.; Sasikala, J.; Juliet, D.S.; Velliangiri, S. Hybrid spatio-frequency domain global thresholding filter (HSFGTF) model for SAR image enhancement. Pattern Recognit. Lett. 2021, 146, 8–14. [Google Scholar] [CrossRef]
  20. Tabassum, N.; Vaccari, A.; Acton, S. Speckle removal and change preservation by distance-driven anisotropic diffusion of synthetic aperture radar temporal stacks. Digit. Signal Process. 2018, 74, 43–55. [Google Scholar] [CrossRef]
  21. Lang, M.; Townsend, P.; Kasischke, E. Influence of incidence angle on detecting flooded forests using C-HH synthetic aperture radar data. Remote Sens. Environ. 2008, 112, 3898–3907. [Google Scholar] [CrossRef]
  22. Gauthier, Y.; Bernier, M.; Fortin, J.P. Aspect and incidence angle sensitivity in ERS-1 SAR data. Int. J. Remote Sens. 2010, 19, 2001–2006. [Google Scholar] [CrossRef]
  23. Skrunes, S.; Brekke, C.; Jones, C.E.; Espeseth, M.M.; Holt, B. Effect of wind direction and incidence angle on polarimetric SAR observations of slicked and unslicked sea surfaces. Remote Sens. Environ. 2018, 213, 73–91. [Google Scholar] [CrossRef]
  24. Zhao, J.; Pelich, R.; Hostache, R.; Matgen, P.; Wagner, W.; Chini, M. A large-scale 2005–2012 flood map record derived from ENVISAT-ASAR data: United Kingdom as a test case. Remote Sens. Environ. 2021, 256, 112338. [Google Scholar] [CrossRef]
  25. Tan, J.; Chen, M.; Xie, X.; Zhang, C.; Mao, B.; Lei, G.; Wang, B.; Meng, X.; Guan, X.; Zhang, Y. Riparian zone DEM generation from time-series Sentinel-1 and corresponding water level: A novel waterline method. IEEE Trans. Geosci. Remote Sens. 2022, 60, 1–10. [Google Scholar] [CrossRef]
  26. Tan, J.; Xie, X.; Zuo, J.; Xing, X.; Liu, B.; Xia, Q.; Zhang, Y. Coupling random forest and inverse distance weighting to generate climate surfaces of precipitation and temperature with Multiple-Covariates. J. Hydrol. 2021, 598, 126270. [Google Scholar] [CrossRef]
  27. Ding, X.; Li, X. Monitoring of the water-area variations of Lake Dongting in China with ENVISAT ASAR images. Int. J. Appl. Earth Obs. Geoinf. 2011, 13, 894–901. [Google Scholar] [CrossRef]
  28. Wang, J.; Ding, J.; Li, G.; Liang, J.; Yu, D.; Aishan, T.; Zhang, F.; Yang, J.; Abulimiti, A.; Liu, J. Dynamic detection of water surface area of Ebinur Lake using multi-source satellite data (Landsat and Sentinel-1A) and its responses to changing environment. Catena 2019, 177, 189–201. [Google Scholar] [CrossRef]
  29. Huang, W.; DeVries, B.; Huang, C.; Lang, M.; Jones, J.; Creed, I.; Carroll, M. Automated Extraction of Surface Water Extent from Sentinel-1 Data. Remote Sens. 2018, 10, 797. [Google Scholar] [CrossRef]
  30. Drusch, M.; Del Bello, U.; Carlier, S.; Colin, O.; Fernandez, V.; Gascon, F.; Hoersch, B.; Isola, C.; Laberinti, P.; Martimort, P.; et al. Sentinel-2: ESA’s Optical High-Resolution Mission for GMES Operational Services. Remote Sens. Environ. 2012, 120, 25–36. [Google Scholar] [CrossRef]
  31. Salameh, E.; Frappart, F.; Turki, I.; Laignel, B. Intertidal topography mapping using the waterline method from Sentinel-1 & -2 images: The examples of Arcachon and Veys Bays in France. ISPRS J. Photogramm. Remote Sens. 2020, 163, 98–120. [Google Scholar] [CrossRef]
  32. Park, J.-W.; Korosov, A.A.; Babiker, M.; Sandven, S.; Won, J.-S. Efficient Thermal Noise Removal for Sentinel-1 TOPSAR Cross-Polarization Channel. IEEE Trans. Geosci. Remote Sens. 2018, 56, 1555–1565. [Google Scholar] [CrossRef]
  33. Lee, J.-S. Refined filtering of image noise using local statistics. Comput. Graph. Image Process. 1981, 15, 380–389. [Google Scholar] [CrossRef]
  34. McFeeters, S.K. The use of the Normalized Difference Water Index (NDWI) in the delineation of open water features. Int. J. Remote Sens. 1996, 17, 1425–1432. [Google Scholar] [CrossRef]
  35. Sekertekin, A.; Cicekli, S.Y.; Arslan, N. Index-Based Identification of Surface Water Resources Using Sentinel-2 Satellite Imagery. In Proceedings of the 2018 2nd International Symposium on Multidisciplinary Studies and Innovative Technologies (ISMSIT), Ankara, Turkey, 19–21 October 2018. [Google Scholar]
  36. Otsu, N. A threshold selection method from gray-level histograms. IEEE Trans. Syst. Man Cybern. 1979, 9, 62–66. [Google Scholar] [CrossRef]
  37. Swain, P.H.; King, R.C. Two Effective Feature Selection Criteria for Multispectral Remote Sensing. LARS Tech. Rep. 1973, 39, 1–6. [Google Scholar]
  38. Foody, G.M. Status of land cover classification accuracy assessment. Remote Sens. Environ. 2002, 80, 185–201. [Google Scholar] [CrossRef]
  39. Tsai, W.-H. Moment-preserving thresolding: A new approach. Comput. Vis. Graph. Image Process. 1985, 29, 377–393. [Google Scholar] [CrossRef]
  40. Kittler, J.; Illingworth, J.; Illingworth, J. Minimum error thresholding. Pattern Recognit. 1986, 19, 41–47. [Google Scholar] [CrossRef]
  41. Glasbey, C.A. An Analysis of Histogram-Based Thresholding Algorithms. Graph. Model. Image Process. 1993, 55, 532–537. [Google Scholar] [CrossRef]
  42. Ball, G.H.; Hall, D.J. A clustering technique for summarizing multivariate data. Behav. Sci. 1967, 12, 153–155. [Google Scholar] [CrossRef]
  43. Zou, Z.; Xiao, X.; Dong, J.; Qin, Y.; Doughty, R.B.; Menarguez, M.A.; Zhang, G.; Wang, J. Divergent trends of open-surface water body area in the contiguous United States from 1984 to 2016. Proc. Natl. Acad. Sci. USA 2018, 115, 3810–3815. [Google Scholar] [CrossRef] [PubMed]
  44. Pereira, J.M.C. A comparative evaluation of NOAA/AVHRR vegetation indexes for burned surface detection and mapping. IEEE Trans. Geosci. Remote Sens. 1999, 37, 217–226. [Google Scholar] [CrossRef]
  45. Vreugdenhil, M.; Wagner, W.; Bauer-Marschallinger, B.; Pfeil, I.; Teubner, I.; Rüdiger, C.; Strauss, P. Sensitivity of Sentinel-1 Backscatter to Vegetation Dynamics: An Austrian Case Study. Remote Sens. 2018, 10, 1396. [Google Scholar] [CrossRef]
  46. Song, L.; Song, C.; Luo, S.; Chen, T.; Liu, K.; Li, Y.; Jing, H.; Xu, J. Refining and densifying the water inundation area and storage estimates of Poyang Lake by integrating Sentinel-1/2 and bathymetry data. Int. J. Appl. Earth Obs. Geoinf. 2021, 105, 102601. [Google Scholar] [CrossRef]
  47. Liang, J.; Liu, D. A local thresholding approach to flood water delineation using Sentinel-1 SAR imagery. ISPRS J. Photogramm. Remote Sens. 2020, 159, 53–62. [Google Scholar] [CrossRef]
Figure 1. The position of ten study areas around the world.
Remotesensing 15 02690 g001
Figure 2. Workflow of the proposed method.
Remotesensing 15 02690 g002
Figure 3. The Sentinel-1A map (a) and illustration map of distance (b) for one study area (the red line parallel to the orbit).
Remotesensing 15 02690 g003
Figure 4. The overall JM value under different initial patch sizes for segmentation of study areas.
Remotesensing 15 02690 g004
Figure 5. The OA and Kappa values of different methods along with study areas.
Remotesensing 15 02690 g005
Figure 6. The TP, FP, FN, and TN values of each method for each study area.
Remotesensing 15 02690 g006
Figure 7. The SAR SIGMA images, distribution of water with the proposed method, OTSU_all and sentinel-2 in study areas 2, 3, 4, 7, 8, and 9 (gray is water body and white is land).
Remotesensing 15 02690 g007
Figure 8. Comparison of classification results of a whole scene under six methods (gray is water body and white is land).
Remotesensing 15 02690 g008
Figure 9. The Sentinel-1A data in VV polarization mode (a) and corresponding water map with proposed method (b) on 25 December 2017.
Remotesensing 15 02690 g009
Figure 10. Classification results of six sub-regions under six methods (Gray is water body and white is land).
Remotesensing 15 02690 g010
Figure 11. Quantitative evaluation of six methods.
Remotesensing 15 02690 g011
Figure 12. The thresholds calculated by ISODATA, MEAN, MINERROR, MOMENTS, OTSU_all, and OTSU_opt in blocks from near-range to far-range (ah).
Remotesensing 15 02690 g012
Figure 13. Dongting Lake water extents, water levels, and JM values in 2017.
Remotesensing 15 02690 g013
Figure 14. Water frequency map of Dongting Lake in 2017 derived from the OTSU_opt water maps.
Remotesensing 15 02690 g014
Figure 15. The water distribution maps on DOY 59, 71, 83 and 95 (ad), and corresponding histograms (eh).
Remotesensing 15 02690 g015
Figure 16. The VV polarization image on DOY 191 with six detail images (af), where (b,e) are the classification maps using this proposed method, and (c,f) are the results using the global OTSU method.
Remotesensing 15 02690 g016
Table 1. The description of ten study areas.
Study No.12345678910
CountryChinaChinaChinaKazakhstanKazakhstanBrazilTanzaniaCanada/USADenmarkRussia
LakeDongtingKoko NorSiling CoAral SeaBalkhash/VictoriaGreat LakesBaltic Sea/
TypePlainPlateauPlateauSaltwaterInlandEstuaryPlateauFreshwaterSeaEstuary
RiverYangziHuang HeZa’gya ZangboSyr DaryaIliAmazonKageraSaint Clair/Yenisey
Table 2. The time of Sentinel-1 and Sentinel-2 in each study area.
Study No.12345678910
Sentinel-125122017240820203008202030082020310820200809202010092020220520201009202029082020
Sentinel-224122017250820200109202029082020310820201009202011092020220520201109202028082020
Table 3. Confusion matrix for accuracy evaluation of the proposed method.
ActualReference
WaterNon-WaterTotal
Water5,332,818720,8046,053,622
Non-water1,174,48224,816,47925,990,961
Total6,507,30025,537,28332,044,583
Accuracy  PA = 0.819  UA = 0.881   OA = 0.941  KC = 0.812
Disclaimer/Publisher’s Note: The statements, opinions and data contained in all publications are solely those of the individual author(s) and contributor(s) and not of MDPI and/or the editor(s). MDPI and/or the editor(s) disclaim responsibility for any injury to people or property resulting from any ideas, methods, instructions or products referred to in the content.

