
Recent Advances in Crop Disease Detection Using UAV and Deep Learning Techniques


1
School of Engineering and Technology, Central Queensland University, Rockhampton, QLD 4701, Australia
2
Research Institute for Northern Agriculture, Faculty of Science and Technology, Charles Darwin University, Brinkin, NT 0909, Australia
*
Author to whom correspondence should be addressed.
Remote Sens. 2023, 15(9), 2450; https://doi.org/10.3390/rs15092450
Submission received: 22 March 2023
/
Revised: 1 May 2023
/
Accepted: 3 May 2023
/
Published: 6 May 2023
(This article belongs to the Special Issue Crop Disease Detection Using Remote Sensing Image Analysis II)
Abstract
:Because of the recent advances in drones or Unmanned Aerial Vehicle (UAV) platforms, sensors and software, UAVs have gained popularity among precision agriculture researchers and stakeholders for estimating traits such as crop yield and diseases. Early detection of crop disease is essential to prevent possible losses on crop yield and ultimately increasing the benefits. However, accurate estimation of crop disease requires modern data analysis techniques such as machine learning and deep learning. This work aims to review the actual progress in crop disease detection, with an emphasis on machine learning and deep learning techniques using UAV-based remote sensing. First, we present the importance of different sensors and image-processing techniques for improving crop disease estimation with UAV imagery. Second, we propose a taxonomy to accumulate and categorize the existing works on crop disease detection with UAV imagery. Third, we analyze and summarize the performance of various machine learning and deep learning methods for crop disease detection. Finally, we underscore the challenges, opportunities and research directions of UAV-based remote sensing for crop disease detection.
Keywords:
UAV; crop disease; drone; deep learning; remote sensing; detection; classification; segmentation1. Introduction
Crops are subjected to various stresses from their environment, which decreases their productivity. Stress occurs in two forms: abiotic and biotic. Abiotic stress is due to environmental factors, including drought, floods, extreme temperatures, and so on, whereas biotic stress is caused by various pests and pathogens such as fungi, bacteria, and nematodes [1].
The traditional farm practice relies on the manual scouting of crops for visual identification of any crop disease by farm staff, with backup advice from a crop disease specialist or plant pathologist [2]. Furthermore, the visual observation of symptomatology, microscopy, and isolation of pathogen culture are used for crop disease diagnosis, which is quite tedious, time-consuming and often cumbersome [3,4]. In this scenario, the development of Unmanned Aerial Vehicles (UAVs), the Internet of Things (IoT) and advanced artificial intelligence techniques is creating promising tools for crop disease detection. These tools might not require highly sophisticated and complex procedures and are less time-consuming compared to other techniques [5]. Since the early detection of pests and crop diseases allows sufficient time to mitigate the possible disease epidemic and yield losses for the farmers and other stakeholders, precision agriculture researchers are constantly looking for innovative and cost-effective solutions which would address the crop disease detection problem in an easy and effective way [6,7,8]. A multidisciplinary approach which combines remote sensing, drones and artificial intelligence (AI) techniques might be an alternative for such a solution [9].
Remote sensing is an alternative approach for fast and unbiased disease scouting and measurement [6]. Here, the common information carrier is electromagnetic (EM) radiation. The range of all types of EM radiation is known as the EM spectrum, which consists of a range of spectra from shorter wavelengths (e.g., gamma-rays) to longer wavelengths (e.g., radio waves). Various sensors such as RGB (or visible), multispectral and hyperspectral [10,11] sensors are used to capture the different portions of the EM spectrum. These sensors have different sensing capabilities and costs, where the cost and sensing ability have an inverse trade-off [12]. Recently, UAV-based remote sensing has been explored by researchers to tackle various precision agriculture (PA) tasks such as disease detection [7], plant health monitoring [13], and yield estimations [14]. UAVs became a more common choice among PA researchers because of their flexibility in revisiting the field and their ability to capture high-resolution imagery at much closer distances to the plant in comparison to other airborne imagery [15]. With such high-resolution images, automatic disease detection for various crops, including yellow rust detection in wheat [16], peanut leaf wilt estimation [8], and tomato spot wilt disease estimation [17], have been reported in the literature.
Many studies on plant phenotyping have used the red-green-blue (RGB) [8], multispectral [18] and hyperspectral sensors [16] embedded in UAVs. Vegetation indices (VIs) are derived to measure the crop traits such as canopy coverage, biomass and height, thereby estimating the crop yield and stress. A few studies have reported the successful application of disease estimation using UAV-based remote sensing [8,16,17]. In these studies, for plot-level data extraction, either a mean value of the vegetation index or the number of pixels below a certain threshold in a given plot was used to estimate the disease score. For instance, Patrick et al. [17] examined the use of multispectral image-derived vegetation indices such as Normalized Difference Red Edge (NDRE) and Normalized Difference Vegetation Index (NDVI) for tomato spot wilt disease estimation in peanuts. They extracted the vegetation index from the multispectral images acquired with a Micasense Red-edge camera. They established a threshold to distinguish the healthy and disease pixel value in these vegetation index (VI) images. Then they used the number of pixels below or above the threshold as a predictor and disease percentage as a target variable for linear regression analysis. Here, the optimal threshold for each vegetation index was selected manually, which makes this approach less ideal for automation. Additionally, some vegetation indices might not have a clear threshold for distinguishing healthy and diseased plot, which further impedes the application of this approach to those vegetation indices.
Given the recent development of UAV platforms and sensors, the possibility of cheaper and more frequent image acquisition has emerged rapidly, which might support more accurate estimates of crop diseases using predictive approaches such as conventional machine learning (ML) and deep learning (DL) methods [19]. For instance, Abdulridha et al. [20] implemented a hyperspectral-based remote sensing technique for tomato disease detection using vegetation indices (VIs) and machine learning methods such as artificial neural networks (ANN). Similarly, a wheat yellow rust detection method using multispectral UAV imagery and machine learning was proposed in [21]. For the machine learning method, a random forest (RF) classifier was trained at pixel level, where image pixels were classified into healthy, moderate, and severely diseased groups with high accuracy of 89.3% [21].
Initially, Barbedo et al. [22] synthesized various works on the use of UAVs and sensors for monitoring and assessing plant stresses. The study critically analyzed 100 published articles on crop stress monitoring using UAVs and listed out the challenges that have been already addressed by the existing works as well as recommendations for future researchers working on crop protection. However, the review did not discuss advanced data-driven methods such as ML and DL for crop protection using UAVs comprehensively and systematically. Furthermore, Neupane et al. [23] surveyed the various sensors and methods for the automatic monitoring and identification of crop diseases using UAV technology. It was extensively focused on the discussion of various types of UAVs and cameras such as RGB, multispectral and hyperspectral, thereby highlighting the advantages of employing sensors for accurate and effective crop disease detection to the growers. However, it still needs to be complemented by elaborating the crucial ML and DL methods used for crop disease detection, along with their evaluations. A short survey on the applications of UAVs and deep learning for crop disease detection was reported by Bouguettaya et al. [24]. Their work mainly focused on early crop disease identification utilizing UAV images and DL methods. The survey was brief and did not cover competitive methods such as conventional machine learning and vegetation index-based methods. Furthermore, it did not cover the taxonomy of crop disease detection along with the performance comparison of various crop disease estimation methods using UAV technology. In their recent work, Bouguettaya et al. [25] surveyed various deep learning-based methods for crop disease detection using UAV images. Their survey compared and contrasted the performance of various deep learning methods for crop disease detection. However, they did not discuss the overall taxonomy of crop disease detection using UAV imagery or a meta-analysis of the literature. The summary of highly relevant existing survey works is presented in Table 1 including the focus area, main features and limitations of each study.
In this survey, we aim to fill the aforementioned gaps by providing an overall taxonomy of crop disease estimation using UAV imagery. In addition, the main contributions of our work are as follows:
- (i)
- We present the importance of different UAV platforms and sensors for improving crop disease detection.
- (ii)
- We provide a taxonomy for crop disease estimation and explain the general steps involved in the working pipelines with UAV-based remote sensing.
- (iii)
- We analyze and summarize the performance of various conventional ML and DL methods for crop disease detection using UAV imagery.
- (iv)
- We report a meta-analysis of the existing literature to gain the current research trends and directions.
- (v)
- We underscore the challenges, opportunities and research avenues of UVA-based remote sensing for crop disease detection.
The paper is organized as follows. The systematic approach used to find the research publications included in this survey is discussed in Section 2. Some brief background information on various related topics such as remote sensing, vegetation indices and ML/DL that helps understand the survey better is provided in Section 3. The main taxonomy for crop disease detection using UAV imagery is elaborated in Section 4. The meta-analysis and synthesis of results from the survey are reported in Section 5. Finally, Section 6 concludes our paper with future recommendations.
2. The Approach for the Survey
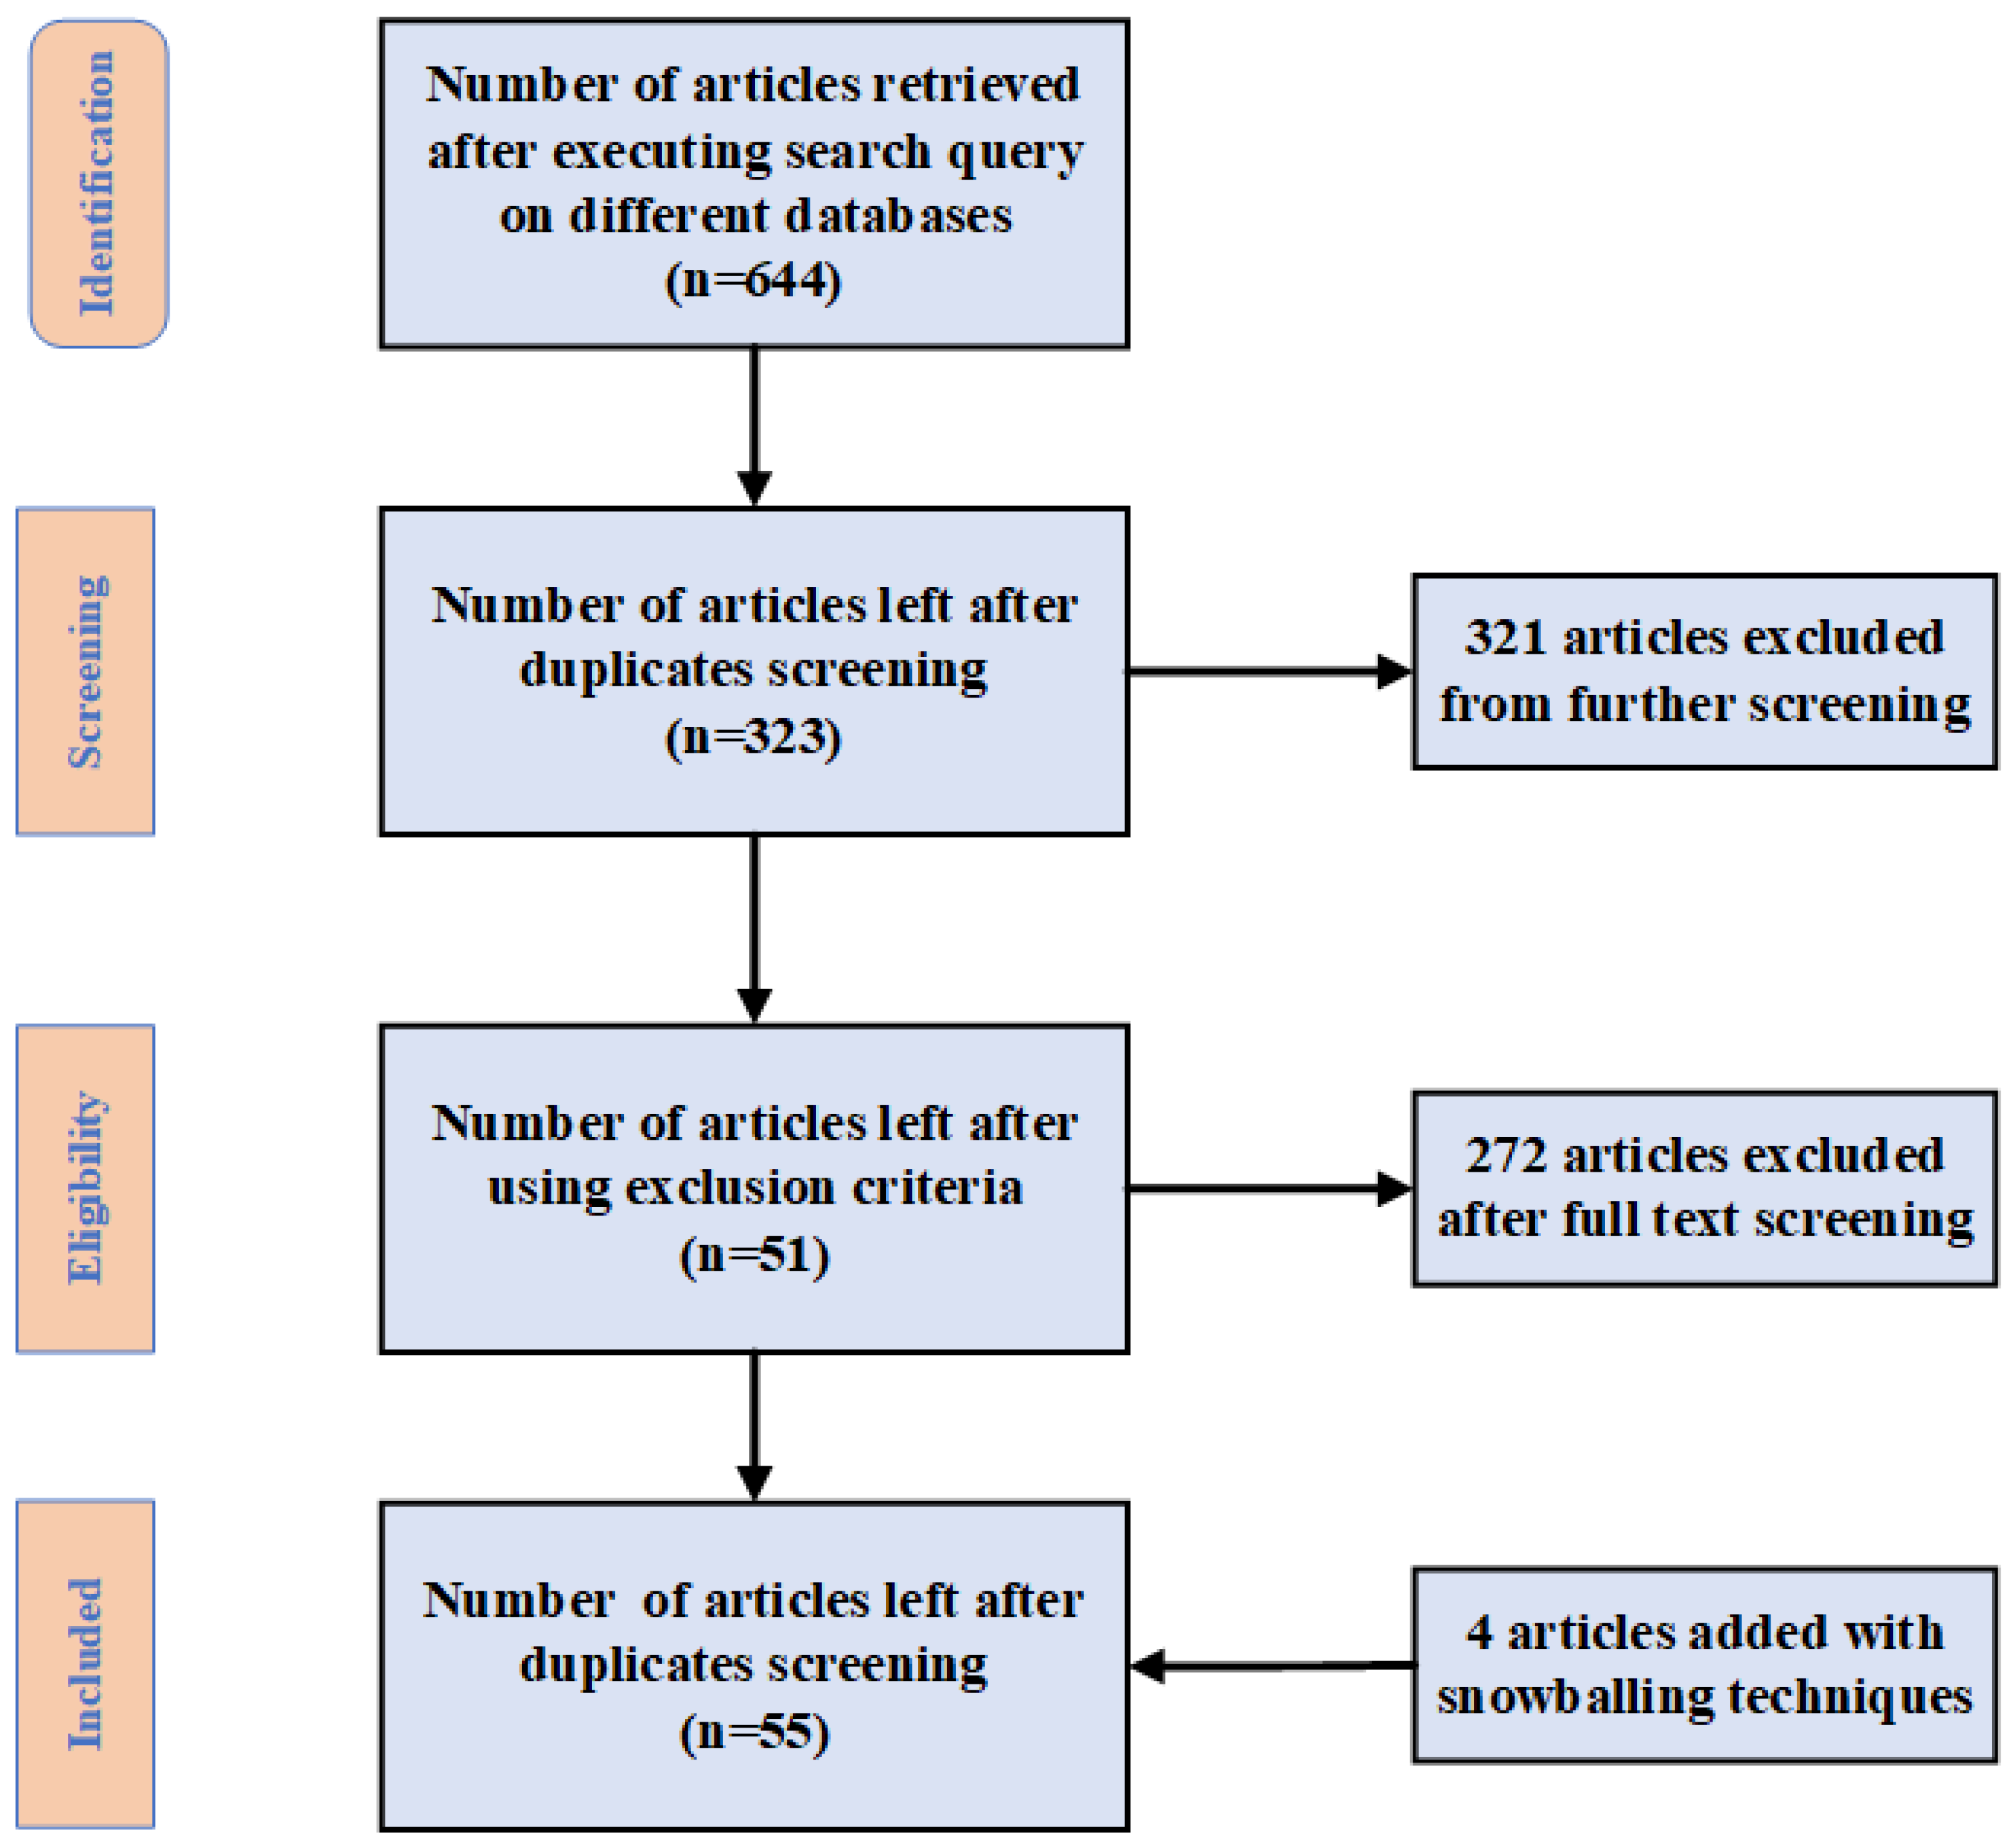
Since we aimed to highlight the existing research gap and potential avenues of machine learning and deep learning methods for crop disease detection using UAV-based remote sensing, we follow the standard approach for systematic literature reviews to collect the research articles and integrated the information based on the research questions that we aimed to explore in this study. This systematic literature review follows the PRISMA (Preferred Reporting Items for Systematic Reviews and Meta-Analyses) guidelines [29] and utilizes the systematic procedure as shown in Figure 1 to retrieve the relevant publications.
We consider the following research questions as a guideline in this survey.
RQ1: What are the most popular and successful UAV platforms and sensors for crop disease detection? This question helps us identify the most effective sensors among the multiple sensors available, such as RGB, multispectral and hyperspectral sensors, for deployment on various types of UAVs for crop disease detection.
RQ2: What different types of crop diseases were investigated using UAV-based remote sensing along with data-driven methods such as conventional ML and DL? Since various crop diseases are caused by different agents such as fungi, bacteria, insect pests and viruses, each showing distinct symptoms over the canopy area such as the crop leaf and stem, it is essential to analyze what kind of crops and crop diseases were more successfully detected using data-driven methods such as conventional ML and DL. This question will serve this purpose.
RQ3: What are the most successful and accurate data-driven methods for crop disease detection using UAVs? This question helps us to compare the performance of various data-driven methods such as machine learning and deep learning for crop disease detection using UAVs. This is the major research question that makes this work more impactful.
RQ4: What are the main challenges and opportunities in using UVA-based remote sensing for crop disease detection? This question helps us to explore the limitations and challenges of existing methods for crop disease detection, thereby suggesting possible avenues of research on UAV-based remote sensing for crop disease estimation.
Based on the formulated research questions, we first designed an article search strategy that is able to narrow down the search space from the major concepts such as “machine learning” and “deep learning” to “crop disease” and “UAV” and take us to the most relevant literature. Using such phrases, we designed the following query string: (“Unmanned aerial vehicle” OR “UAV”) AND (“crop disease”) AND (“Machine Learning” OR “Deep Learning”). This sting was used to perform a search on four popular databases: IEEE Explorer, Scopus, Google Scholar, and MDPI. Initially, the search was limited to the title and abstract of each article from 2012 to 2022 (as machine learning and deep learning extensively evolved after 2012 [30]).
The article selection process includes the following steps. Firstly, duplicates and non-peer-reviewed articles (e.g., pre-prints) received from multiple sources were removed. Secondly, irrelevant articles were removed after a careful screening of article titles, abstracts, keywords, and full texts based on the following exclusion criteria:
- (i)
- Articles that are written in a language other than the English language;
- (ii)
- Publications that are about agriculture but do not address crop disease estimation;
- (iii)
- Publications that are related to crop disease but do not use UAV-based remote sensing.
After applying the procedure depicted in Figure 1, we finally ended up with 55 publications that are considered for systematic analysis and synthesis to answer the research questions (RQ1 to RQ4).
3. Background
3.1. Remote Sensing and UAVs
Remote sensing is a non-destructive way of detecting and monitoring the physical characteristics of an object by acquiring information with the reflected or emitted energy from targets at a distance [31]. The basic pipeline of active remote sensing techniques consists of interaction with the target, recording the reflected energy from the target, transmission, reception and analysis of images. Remote sensing techniques are widely used for smart farm management or precision agriculture (PA). Since PA requires the temporal and spatial information of the agricultural field to make more informed decisions, advanced technologies such as field-based sensors, airborne sensors and networking are essential. Various PA tasks such as precise pesticide applications [32], yield estimation [33] and irrigation management [34,35] have been effectively managed using various sensing technologies. Basically, the remote sensing techniques employed for PA tasks can be grouped into three categories: field-based sensors, satellite or aircraft-based sensors and drone-based sensors.
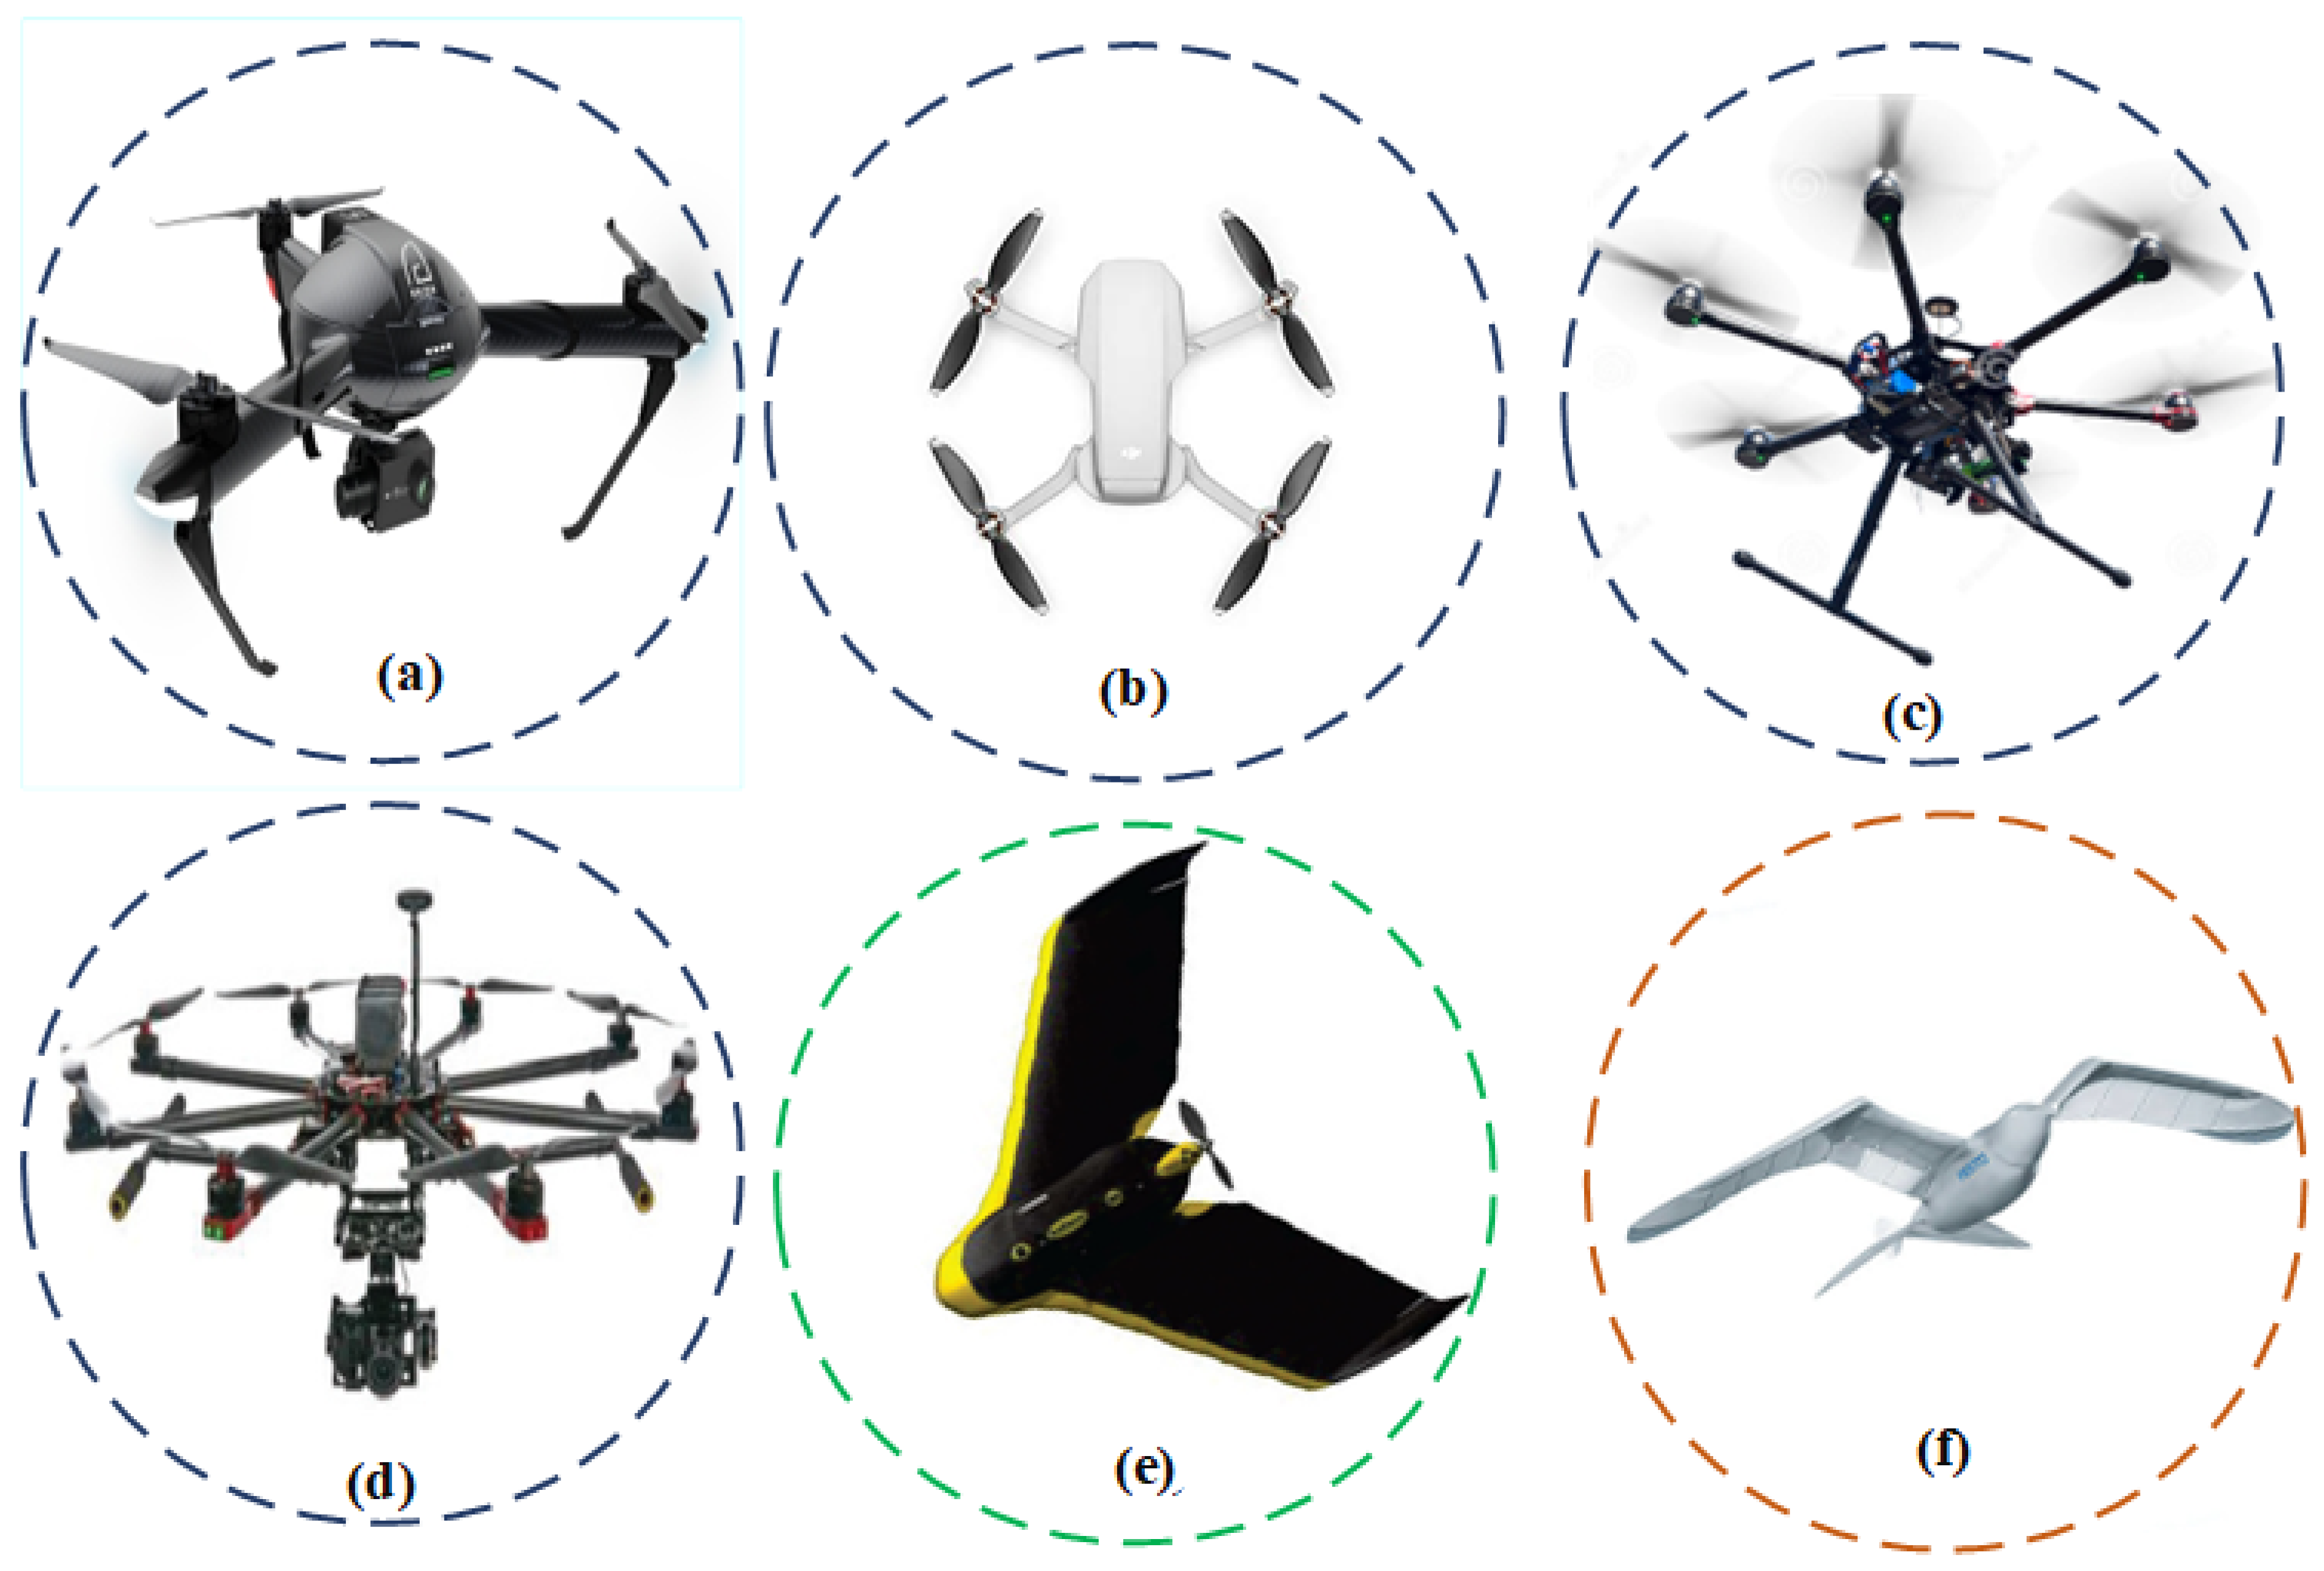
The field-based sensors [36] have the limitation of acquiring field information at scale as they need to move from place to place, which adds extra labor and cost [37]. Furthermore, satellite- or aircraft-based spectral images are costly to acquire and may not be available as and when required [38]. Alternatively, unmanned aerial vehicles (UAVs), also known as drones, which have recently been introduced to PA, can fly very close to crops and provide very high spatial resolution field images. In addition, UAVs offer flexibility by allowing users to revisit fields at any time, as long as weather conditions permit, resulting in high temporal resolution imagery [39]. The UAVs come in a variety of designs based on their wings, size or weight and altitude. Based on the wings, rotatory wing and fixed-wing UAVs are widely used in precision agriculture. Other UAVs such as flapping, hybrid and para-foil wings are also employed by a few existing works. Figure 2 reports the popular UAVs used in precision agriculture [12]. Since a fixed-wing UAV can fly at high speed and cover a large area with more payloads, it is suitable for large-scale surveys. However, they require a large space for a runway, whereas rotary-wing UAVs can take off like helicopters and land vertically. Therefore, rotary wing UAVs are more popular in precision agriculture for their easy operability and flexibility [40].
In UAV-based remote sensing, various sensors are used to capture the light spectrum reflected by Earth objects such as water, soil and green plants. The amount of reflectance from such objects is differentiable and can be useful while monitoring crop growth [42]. Differentiable information can be derived as a result of pixel-level information calculated with various algebraic operations on multiple bands of spectral images, which is widely known as vegetation index (VI) images. Based on the types of sensors used to capture the light spectrum, the VIs can be grouped into (a) RGB-based VIs, (b) multispectral VIs and (c) hyperspectral VIs [43]. Vegetation indices that are used in plant disease monitoring are mostly based on the red and near-infrared bands (multispectral and hyperspectral sensors). However, RGB-based VIs are also used in conjunction with multispectral or hyperspectral VIs. As an illustration, a list of widely used vegetation indices along their derivation formulas are reported in Table 2.
3.2. Machine Learning
In the last few years, there has been tremendous progress in machine learning and data analytics. The success of machine learning techniques not only lies in the traditional data-intensive domains such as stock market prediction [52], computer vision [19] and text mining [53] but also in other domains such as biomedical image analysis [54] and precision agriculture [55]. Their success in these domains is attributed to their capability of finding decisive insights from a large amount of data. Due to advancements in sensors, GPS technology and the Internet of Things, agricultural farms are now integrated with such technologies and produce a large amount of agriculture data, thereby demanding agricultural data analysis at a large scale. Machine learning methods can be explored for such a large-scale data analysis to make more accurate decisions concerning farm management activities, such as yield prediction, disease detection, crop monitoring, irrigation management and so on [40].
Machine learning methods firstly learn the patterns or rules from the training data and apply them to the test data. The training process can be achieved in two ways: supervised learning and unsupervised learning. Most works [56,57,58,59] used supervised learning such as support vector machine (SVM), decision tree (DT), random forest (RF), Naive Bayes (NB) and multi-layer perceptron (MLP) neural networks. Notable, supervised machine learning requires the manual labeling of diseased areas on the UAV images to train the model [60]. Once the model is trained with the given data, it can be deployed on previously unseen crop field images to predict diseased crops [57].
An unsupervised ML model works on unlabeled data and can learn the associated pattern from the data by itself [61]. For instance, the K-means clustering technique was used for cotton rot root disease detection by Wang et al. [62]. Here, they grouped the image pixels based on their similarity, measured using the K-means strategy, thereby being able to cluster the healthy pixels vs. diseased pixels into two distinct clusters.
3.3. Deep Learning
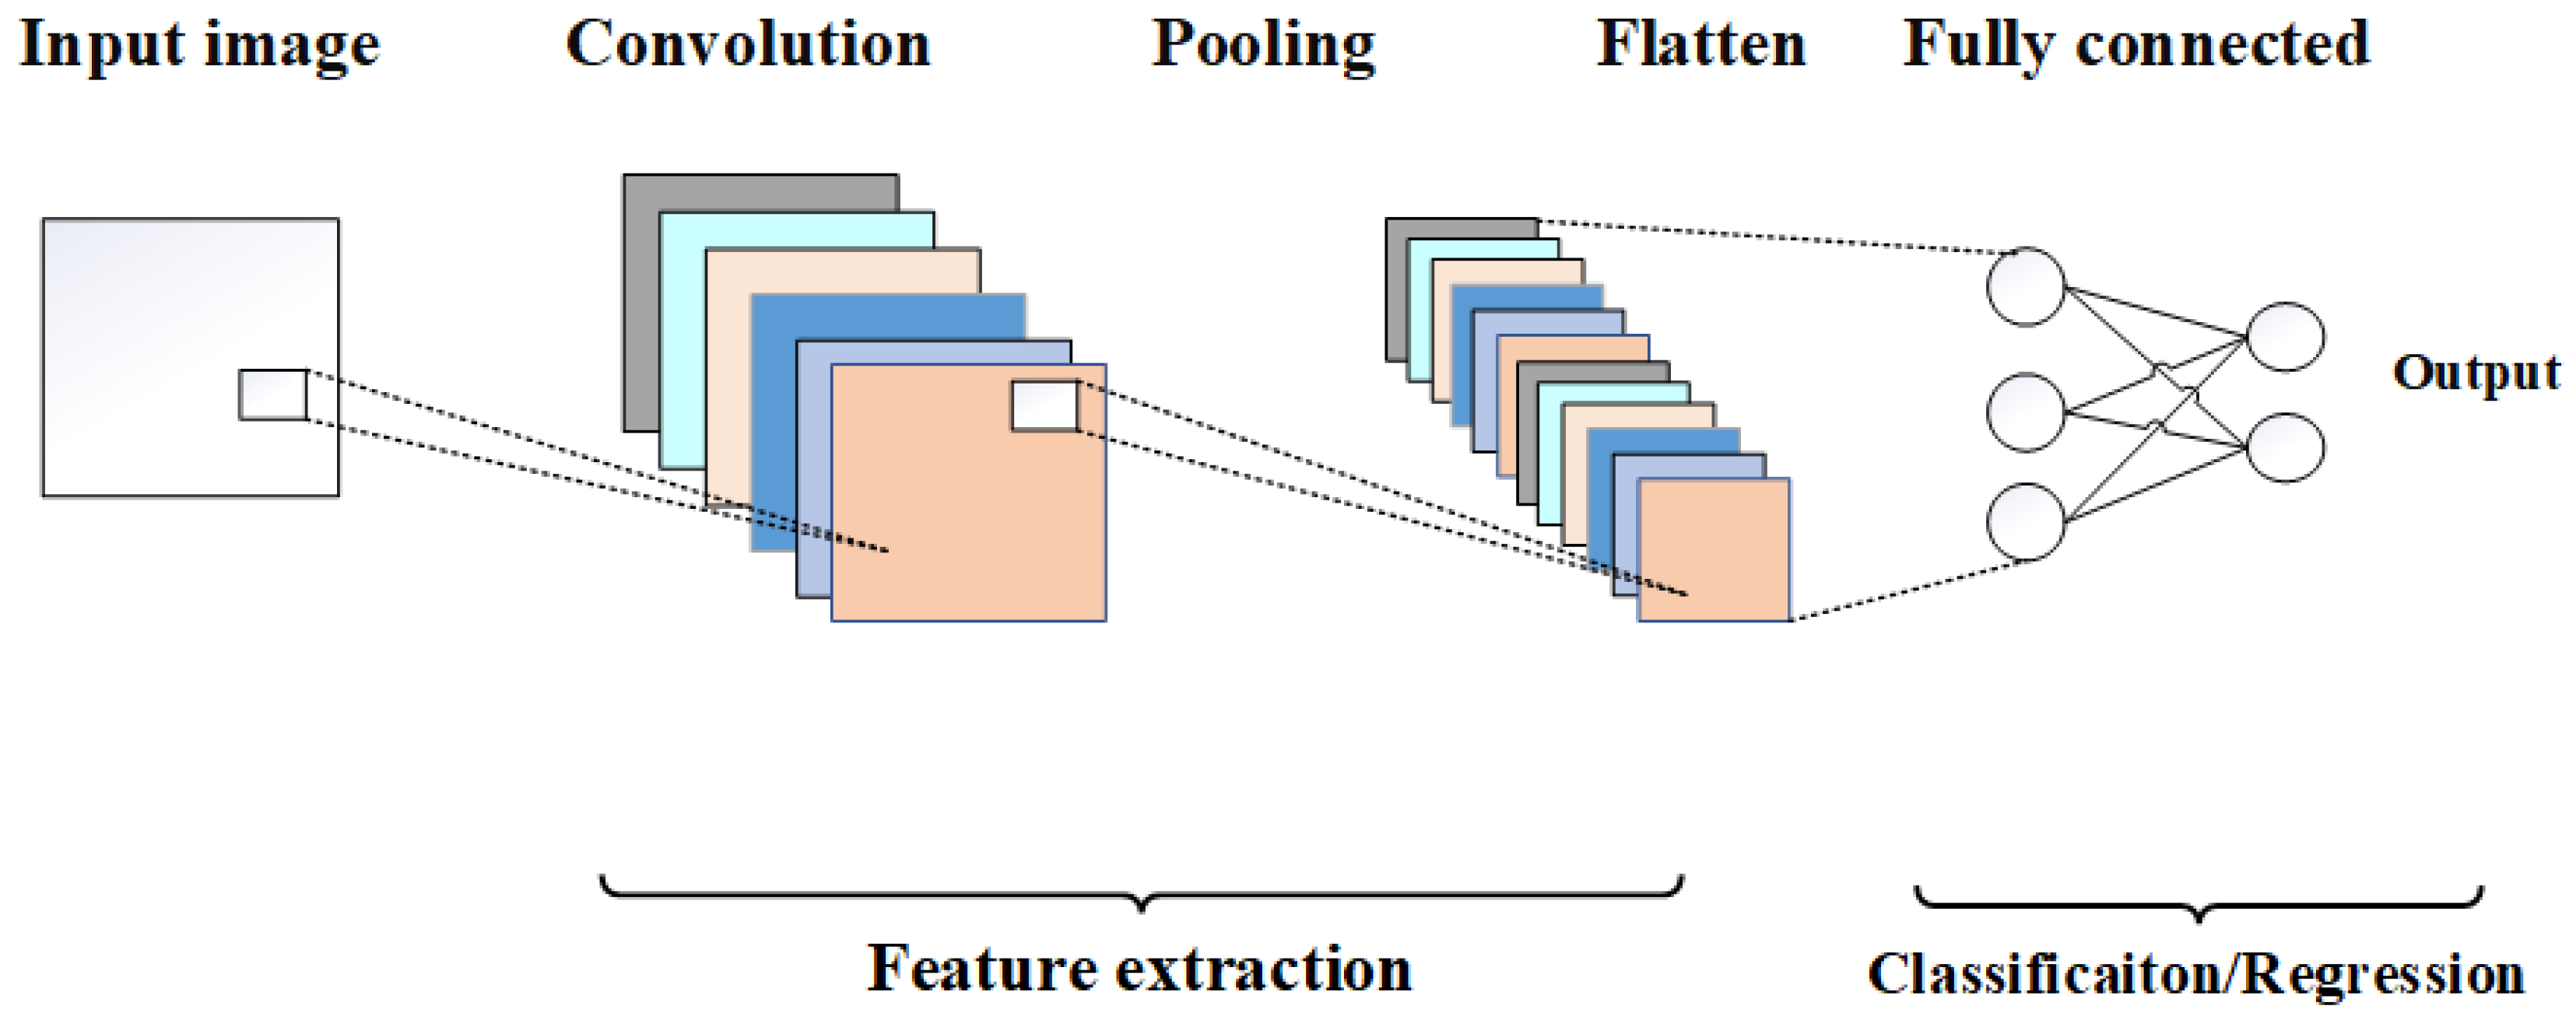
Deep learning (DL) is one of the fastest growing technologies in the last decade and has caused a paradigm shift in data analysis and pattern recognition in various domains, including computer vision [19], satellite image analysis [63] and precision agriculture [55]. Deep learning is an extension of neural networks in both width and depth. The success of deep learning mainly lies in the stacking of layers one over the other to learn the hierarchical object features. Among the deep learning architecture, convolutional neural networks (CNN), as shown in Figure 3, are the most widely used and most popular architectures for computer vision tasks such as image classification and recognition [64]. CNNs capture the higher-order semantic features from their intermediate layers using different operations such as convolution, pooling, activation and so on. These are the basic operation involved in different CNNs, such as VGG [65], DenseNet [66], ResNet [67] and GoogleNet [68]. As a result, CNNs have produced groundbreaking performances in several areas such as health informatics [54,69], remote sensing and drones [40,70] and natural language processing [71].
Recently, there is an immense application of deep learning to address precision agriculture tasks. For instance, Zhang et al. [72] proposed a deep learning-based framework for yellow rust disease detection on wheat from UAV aerial images. They used existing deep learning architectures, such as Inception-v3 [73], ResNet50 [74], VGG [65] and Xception [75], for yellow rust classification. They achieved an accuracy of 99.04% when they trained and tested these models on the RGB images acquired by flying the drone at an altitude of 2 m. This shows that highly accurate disease estimation is possible with such advanced deep-learning models. However, they require high-resolution imagery that should be taken at the lowest altitude, which may not be possible due to legal and other constraints such as battery capacity. Here, it should be noted that the flight altitude is inversely proportional to the area covered by the UAV’s trail.
3.4. Evaluation Matrices
In this section, a brief discussion of various evaluation metrics used by existing works to report the performance of crop disease detection methods is provided, as it will help shed light while comparing the different models in the later sections of this paper. The coefficient of determination () (Equation (1)) is widely used to evaluate the disease estimation methods when the dependent variable is continuous (e.g., represents the disease score or percentage of diseases):
The precision (Equation (2)), recall (Equation (3)), f-score (Equation (4)) and accuracy (Equation (5)) are mostly used to evaluate the disease estimation methods when the dependent variable is discrete (e.g., represent the class or category):
where , , and represent true positive, true negative, false positive and false negative, respectively. In addition, P, R, F and A denote precision, recall, f-score and accuracy.
4. Taxonomy of Crop Disease Assessment Using UAV Imagery
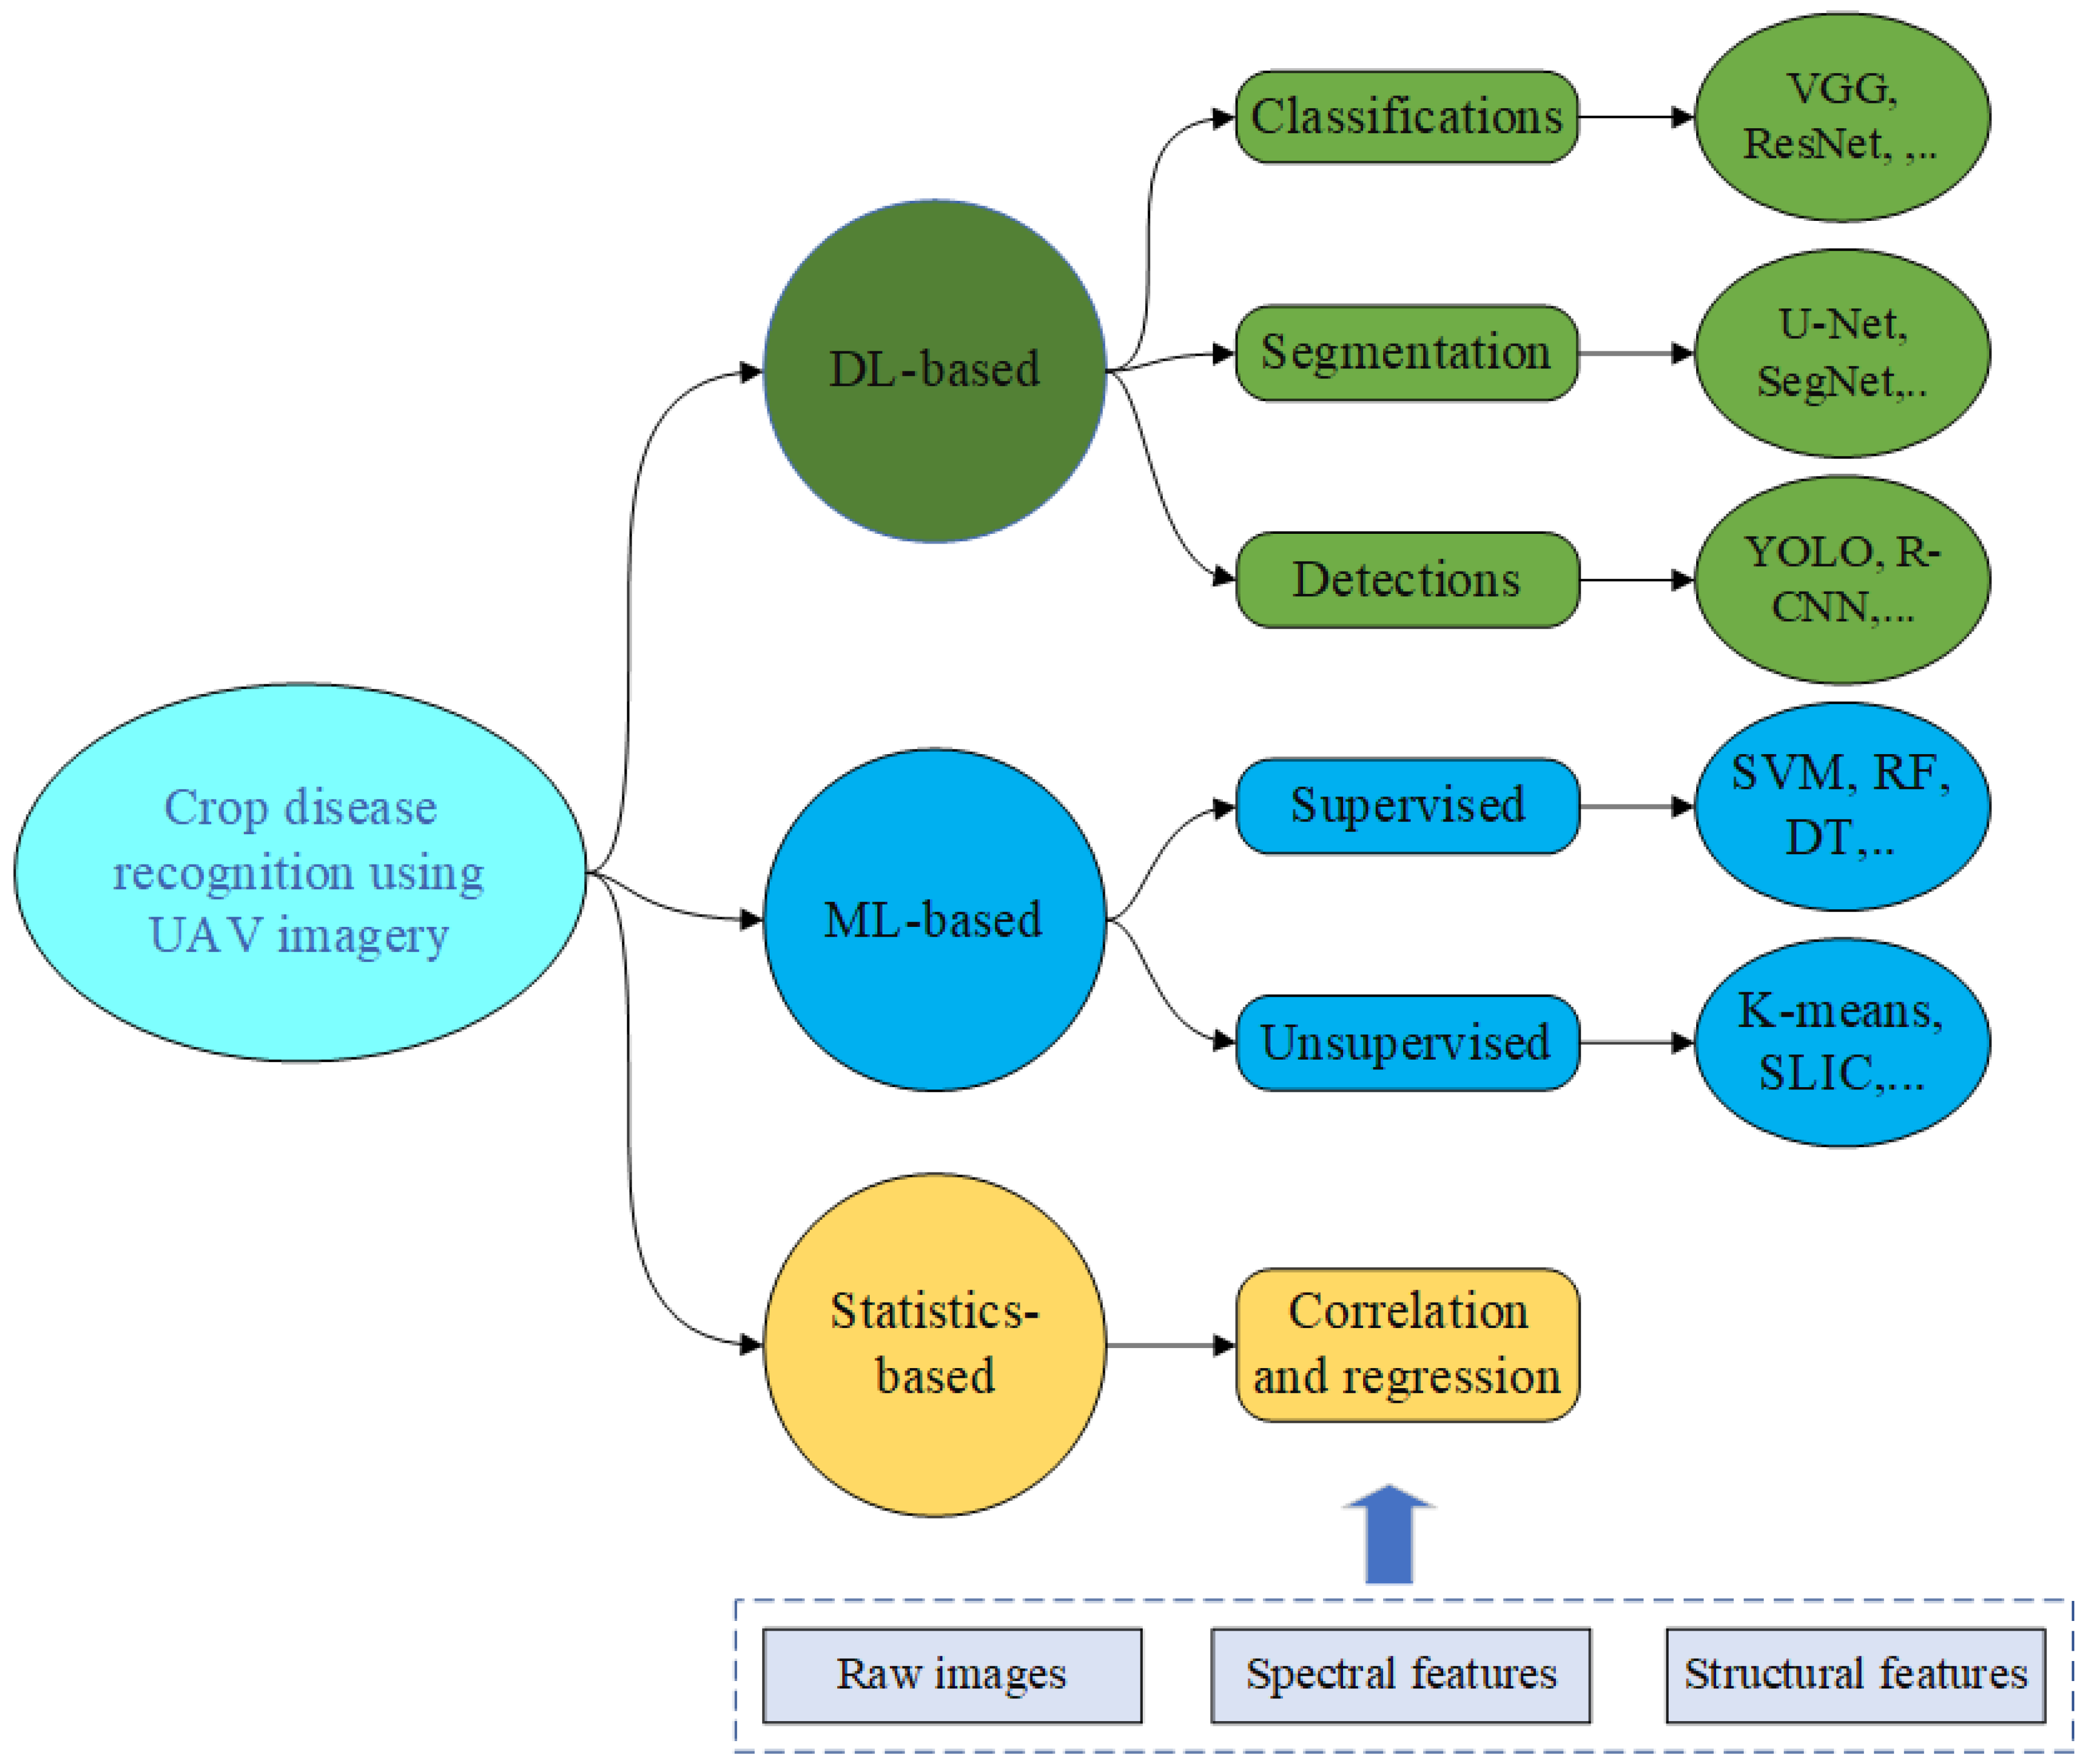
In this section, we devise a taxonomy to group the existing work on the basis of methods used for crop disease recognition from UAV imagery. While conducting this survey, we found that there are mainly three approaches used to address crop disease estimation using UAVs (Figure 4) First, statistics-based methods use correlation and regression analyses. They establish the linear relationship between disease and the spectral information acquired from UAV imagery. Here, the various vegetation indices (VIs) were used for extracting crop-related traits. Second, conventional ML-based methods which are based on traditional supervised or unsupervised machine learning methods use the vegetation indices as input features while building the disease estimation model. Finally, the deep learning methods use the raw images in addition to other features to train the model in an end-to-end fashion for disease recognition with UAV.
4.1. Statistics-Based Methods
Statistics (ST)-based methods for crop disease estimation utilize the disease score as the target variable and crop-related traits derived from UAV imagery as independent variables. The correlation between these independent variables and the disease score determines the strength of a linear relationship. The overall pipeline of such methods involves three steps: UAV image pre-processing, vegetation index generation and statistical analysis. Image pre-processing is essential to prepare spatial data products such as reflectance maps and a digital surface model which can be used to extract the crop-related traits at the plot or field level. Once the reflectance map is generated, the individual spectral band form such a reflectance map can be employed to generate the various vegetation indices. Most existing works used these vegetation indices as independent variables and performed the correlation and regression analysis for crop disease estimation.
Vegetation indices (VIs) have been employed for the remote sensing of vegetation, such as to detect canopy cover, growth and vigor, using various remote sensing platforms such as satellites and UAVs [36]. The canopy information obtained from VIs is effective to measure crop traits such as yield, leaf area index and water stress [76]. Several researchers have utilized the different vegetation indices extracted with UAV-based sensing platforms for crop disease estimation [56,57]. However, the basic pipeline for disease estimation using VIs includes the extraction of vegetation indices from crop field images and performing the correlation and regression analysis considering VIs as the independent variables and disease score as a dependent variable [8,16,17]. For VI extraction, the crop field is first divided into individual plots, and then the plot-level vegetation extraction is carried out using the mean value of the vegetation index in the given plot. Some works also employed the threshold-based technique for such the extraction of such data, as demonstrated by Patrick et al. [17]. They first calculated multiple vegetation indices, such as NDRE, NDVI and DVI. Then, a threshold was determined to count the number of healthy pixels vs. diseased pixels in the given threshold. Finally, the count of healthy pixels or diseased pixels was used as an independent variable, whereas the disease score was used as the dependent or target variable. However, it might be difficult to clearly distinguish between healthy and diseased plots with a particular threshold because some vegetation indices might not have a clear threshold for healthy and diseased plot segmentation. In such a situation, the alternative may be to use the coefficient of variation or the measurement index, as proposed by Shahi et al. [77]
As reported in Table 3, peanut wilt disease detection using NDRE, NRRE, GDVI and other vegetation indices derived from UAV images has the highest correlation of 0.73 with a manual disease score. In their study, the NDRE performs the best when calculated with UAV images taken after 120 days from a seedling. Chang et al. [50] implemented the UAV-based crop disease estimation framework for citrus greening diseases. They experimented with four VIs, namely, the normalized difference VI (NDVI), the modified soil-adjusted VI (MSAVI), the normalized difference RedEdge index (NDRE) and the chlorophyll index (CI). Using a two-sample t-test, they showed that the four VIs have ability to differentiate the healthy and disease groups at the 5% significance level. Sugiura et al. [78] utilized a technique different but similar to VI for potato blight monitoring using UAVs. They derived the HSV color space images from RGB images acquired with UAVs and attempted to distinguish between the diseased and healthy crops with a high coefficient of determination () of 0.73. Ye et al. [79] attempted to estimate Fusarium wilt in bananas. Here, they used three VIs, namely, CI, NDVI and NDRE, and achieved an overall accuracy of 91.7%, which is the highest accuracy. Hyperspectral (HS) vegetation indices were explored by Guo et al. [16] for wheat yellow rust monitoring. They added extra features such as texture along with VI while analyzing the yellow rust using partial least square regression (PLSR). Similarly, Bhandari et al. [51] assessed foliar disease in wheat with vegetation indices derived from RGB sensors. They calculated three VIs and found their correlation with a coefficient of infection (CI) by foliar disease on wheat and achieved the highest of 0.79 using the GLI index. Furthermore, wheat leaf rust and stripe rust were estimated using RGB-based VIs such as SRI and LRI. They achieved a correlation coefficient (r) of 0.92 ( = 0.81) and 0.96 for white leaf rust and white stripe rust severity, respectively. This study demonstrated the possibility of using RGB sensors for crop disease estimation using UAVs.
While comparing the existing studies based on the sensors they employed, the majority (6 out of 11) of the works utilized multispectral sensors followed by RGB (3 out of 11) and hyperspectral sensors (2 out of 11). The reason for this might be the costs and spectral resolutions associated with these sensors. For instance, hyperspectral sensors are costly but cover more than hundreds of spectral bands and hence can capture more useful canopy information. However, multispectral sensors are in the middle of hyperspectral and RGB sensors in terms of their cost and spectral resolution. Multispectral sensors can cover a wider range of the spectrum (including outside of visible range) compared to RGB sensors but at a higher cost, whereas RGB sensors are of special interest because of their low cost and wide availability. However, they only capture the spectral information in the visible range and hence might miss important crop disease information. Besides these sensors, a few works [80,81] investigated the potential of thermal sensors to estimate abiotic stress on the crop.

Table 3.
Summary of ST-based methods for crop disease estimation using UAV imagery. The abbreviations used for diseases are WD (wilt disease), FD (foliar disease), GD (greening disease), LB (late blight), FW (Fusarium wilt), WLD (white leaf disease), LR (leaf rust), SR (stripe rust), VW (Verticillium wilt) and YR (yellow rust). Note that the other notations used are OA (overall accuracy), (coefficient of determination), MS (multispectral sensor), HS (hyperspectral sensor) and RGB (red, green and blue).
| Ref. | Crop | Disease | Sensors | VIs | Eval. Metrics | Remarks |
|---|---|---|---|---|---|---|
| [80] | Olive | VW | Thermal and HS | PRI, CWSI | = 0.83 | The early detection of disease was achieved using CWSI index with strong correlation |
| [82] | Potato | LB | MS | NDVI | - | NDVI map was used to visually map the regions affected by the disease |
| [83] | Grape | Leaf stripe | MS | NDVI | - | Statistical analysis was performed to distinguish the healthy vine vs. diseased vine |
| [17] | Peanuts | WD | MS | NDRE, NRRE, GDVI, GNDVI, etc. | = 0.82 | The NDRE was best suited for wilt disease estimation, with high correlation between manual disease score and UAV images taken at 120 days from seed |
| [51] | Wheat | FD | RGB | NDI, GI and GLI | = 0.79 | They calculated three VIs and found their correlation with a coefficient of infection (CI) by foliar disease on wheat and achieved the highest with the GLI index |
| [50] | Citrus | GD | MS | NDVI, MSAVI, NDRE and CI | = 0.90 | Using two-sample t-test, it was shown that the four VIs have the ability to differentiate the healthy and diseased citrus group at a 5% significance level |
| [78] | Potato | LB | RGB | HSV | = 0.73 | They utilized the HSV color space to distinguish the diseased and healthy crops |
| [79] | Banana | FW | MS | CI, NDVI, NDRE | OA = 0.91 | The VIs were used in conjunction with binary logistic regression to classify the pixels into either diseased or healthy classes |
| [45] | Sugarcane | WLD | MS | NDRE, NDVI, GNDVI, RVI, OSAVI, etc. | - | Twelve vegetation indices were calculated and used to distinguish the healthy vs. diseased leaf area. The NDRE and GNDVI were able to make a difference of 49.88% and 49.37% between the two groups. |
| [84] | Wheat | LR and SR | RGB | SRI, LRI | = 0.81 | The correlation coefficients (r) of 0.92 ( = 0.81) and 0.96 were achieved for white leaf rust and white stripe rust severity between UAV-estimated values and observed values |
| [16] | Wheat | YR | HS | SIPI, PRI, TCARI, PSRI, YRI GI, etc. | = 0.88 | VIs and texture features were analyzed for yellow rust detection with PLSR. The combination of VIs and TFs provided the highest accuracy ( = 0.88) at the late infection stages. |
4.2. Conventional Machine Learning (ML)-Based Method
Traditional machine learning methods, such as support vector machines [85], artificial neural networks [20] and random forest [21], have been used for crop disease and stress detection using UAV imagery. The machine learning methods attempt to learn the patterns associated with the given data [53]. The two broad categories of machine learning methods are supervised and unsupervised learning. Here, supervised learning is based on labeled pairs of input and output data, whereas unsupervised learning explores the hidden patterns of unlabeled data. Furthermore, supervised learning algorithms, such as support vector machine (SVM), random forest (RF), decision tree (DT) and so on, use the training data to learn the rules and use these rules to classify or predict the output for the test data. However, unsupervised learning algorithms such as the K-means and SLIC methods process the input data to uncover the hidden patterns without any external supervision [40].
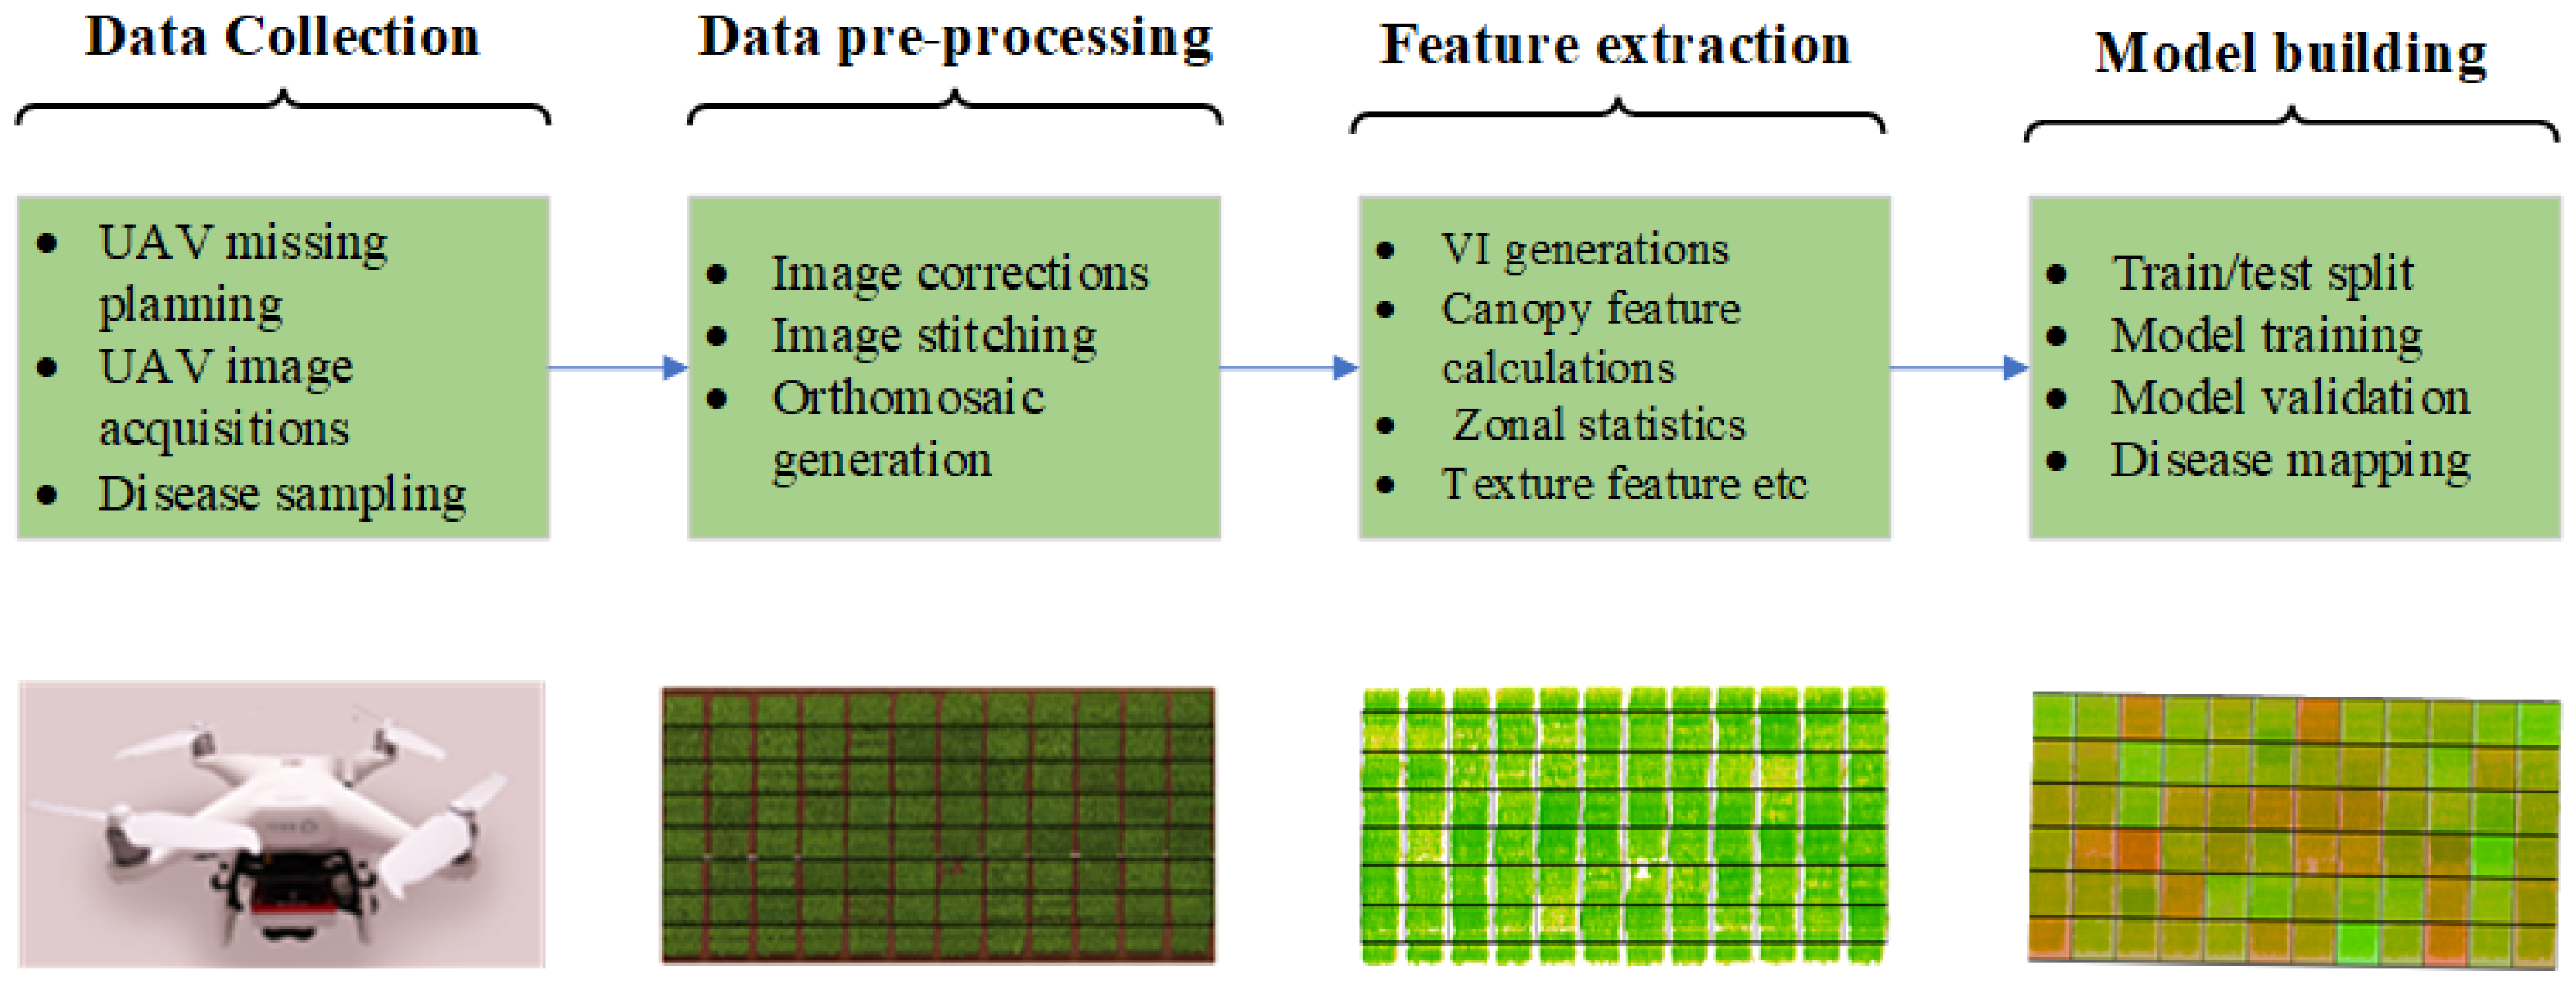
As the general pipeline of machine learning includes input data collection, feature extraction and model building [63], the conventional ML-based approach for crop disease detection with UAV imagery can be depicted as shown in Figure 5. Data collection, pre-processing, feature extraction and model building are the major steps involved in this pipeline. Once the field images are collected with drones, it is necessary to perform image pre-processing activities such as image corrections and image stitching to generate the final data product, such as orthomosaic images [40]. Next, useful information is extracted from the orthomosaic images using various feature extraction strategies, such as canopy features, vegetation indices and so on. Finally, model-building activities such as model training, validation and deployment are performed.
Essentially, the conventional ML-based approach adds an extra feature extraction step on top of ST-based approaches, where the first few steps (data collection and pre-processing) are similar. The extra features, such as structural canopy features (e.g., crop height, volume, etc.), zonal statistics and texture features, are utilized while building ML models for crop disease estimation.
Given the ML pipeline shown in Figure 5, we synthesize the existing works on conventional ML-based approaches for crop disease estimation into two groups: supervised and unsupervised methods. The supervised approaches are further categorized into classification- and regression-based approaches based on how the crop disease variable is treated in the given work.
As reported in Table 4, the researchers tackled the crop disease detection task as either a classification or a regression task. Here, the classification-based approach represents the diseases as a discrete variable, where each pixel in the agricultural field images is classified as either diseased or non-diseased pixels (other pixels). Their performance is measured based on how many pixels are correctly classified. Aligned with this category, Xavier et al. [86] implemented a machine learning classifier using SVM, MLR and RF with three spectral bands (NIR, red and green) as input features. With these bands, the SVM outperformed all other ML models for leaf blight detection on cotton. Similarly, Ye et al. [58] investigated the potential success of ML models such as SVM, RF and ANN for FW detection in bananas using only spectral bands (SB) as input features. With only SB, they reported the highest accuracy of 91.40% when using SVM as a disease classifier.
Besides the spectral bands, the VIs were also employed as features while implementing ML models for corp disease detection. For instance, potato late blight detection was investigated by Rodriguez et al. [87] using multispectral vegetation indices and ML models such as RF, GBM, SVC and KNN. The highest overall accuracy of 87.00% was reported with GBM. Tao et al. [56] utilized NDVI, RENDVI, DSM and the spectral band as input features to build a corn army-worm disease detection model. They experimented with multiple ML models such as RF, MLP, NB and SVM and achieved the highest accuracy of 98.50 with RF. The army-worm pest was successfully detected using these ML models with field imagery acquired at an altitude of 120m via drone. Furthermore, Fusarium head blight detection in wheat using hyperspectral vegetation index, texture features and original spectral bands was implemented by Liu et al. [59]. They build the disease classifier using a back-propagation neural network (BPNN) and simulated annealing and reported an accuracy of 98.00%. A Fusarium wilt (FW) detection task was performed on potatoes by [88] using mean VI and crop height as input features to the ML models. They used a tree-based model called gradient boosting machine (GBM) to build the FW detection model and reported an accuracy of only 84.00%. With these studies on FW detection on various crops using ML models, it can be noticed that the accuracies of various ML models on different crops have large variations. Therefore, it is very difficult to compare their performance as straightforward. It would be better to suggest that the use of these models depends on various factors such as climatic conditions, agricultural landscape and crop types.
Besides the classification models, the regression mapping of crop disease estimation was also carried out by a number of researchers [89,90]. Zhu et al. [89] utilized partial least square regression (PLSR), support vector regression (SVR) and a back propagation neural network (BPNN) for wheat scab (WS) estimation using UAV multispectral imagery. With various VIs and texture features, the SVR achieved the highest coefficient of determination () of 0.83 and a minimum error (RMSE) of 3.35. Furthermore, yellow rust (YR) on wheat was investigated by Bohnenkamp et al. [90] using a hyperspectral sensor and an SVM. They reported an of 0.63 with a combination of various VIs as input features. A UAV-based hyperspectral vegetation index, spectral bands and wavelet features were employed for Fusarium head blight (FHB) detection on wheat using an SVM [85]. With aerial imagery captured at an altitude of 60m, a strong correlation ( = 0.88) was found between the image-derived disease score and the manual disease score. These encouraging results demonstrated that UAV-based hyperspectral imagery has great potential for rapid and objective crop disease assessment.
There are very few works that use the unsupervised approach for crop disease estimation using UAV imagery. For instance, Wang et al. [62] implemented a K-means technique for cotton root rot (CRR) detection, where they combined it with SVM and achieved the highest accuracy of 88.50% with three spectral bands: red, green and NIR. In addition, Zhang et al. [57] utilized the iterative self-organizing data analysis technique (ISODATA), along with other supervised ML models such as SVM, BPNN, LR and RF, for Fusarium wilt (FW) detection on the banana crop. The ISODATA technique is an iterative algorithm that assigns the pixels to the nearest clusters and refines these clusters in each iteration. It is similar to the K-means but allows a different number of clusters while the number of clusters is fixed in the K-means in advance.
Table 4.
The summary of conventional ML methods for crop disease estimation. Note that the disease abbreviations used in the tables are FW (Fusarium wilt), FHB (Fusarium head blight), LB (late blight), WS (wheat scab), YR (yellow rust), WLD (white leaf disease) CGD (citrus greening disease), CRR (cotton root rot), BRR (basal stem rot) and AW (army-worms). The other abbreviations are HA (hotspot analysis), SB (spectral band), TF (texture features), WV (wavelet feature) and DSM (digital terrain model).
| Ref. | Crop | Disease | Sensors | Features | ML Methods | Eval. Metrics |
|---|---|---|---|---|---|---|
| [86] | Cotton | Leaf blight | MS | GRE, RED and NIR | MLR, SVM and RF | A = 79.00 |
| [57] | Banana | FW | MS | WDRVI, NDVI, TDVI | SVM, RF, BPNN, LR, HA, ISODATA | A = 97.28 |
| [58] | Banana | FW | MS | SBs | SVM, RF and ANN | A = 91.40 |
| [59] | Wheat | FW | HS | SBs, VI and TF | BP with SA | A = 98.00 |
| [88] | Potato | FW | MS | mean VI and Heights | GBM | A = 84.00 |
| [85] | Wheat | FHB | HS | SBs, VIs, and WFs | SVM | = 0.88 |
| [87] | Potato | LB | MS | SBs and VI | RF, GBM, SVC and KNN | A = 87.8 |
| [89] | Wheat | WS | MS | VI and TF | PLSR, SVR, and BPNN | = 83.00 |
| [90] | Wheat | YR | HS | VIs | SVM | = 63.00 |
| [91] | Sugarcane | WLD | MS | VIs | XGB, RF, DT and KNN | A = 92.00 |
| [92] | Citrus | CGD | MS | VIs | SVM | A = 81.75 |
| [62] | Cotton | CRR | MS | GRE, RED and NIR | K-means, SVM | A = 88.50 |
| [93] | Pam oil | BSR | MS | GRE, RED and NIR | ANN | A = 72.73 |
| [56] | Corn | AW | MS | NDVI, RENDVI, DSM, red, green, RE and NIR | RF, MLP, NB, SVM | A = 98.50 |
4.3. Deep Learning (DL)-Based Methods
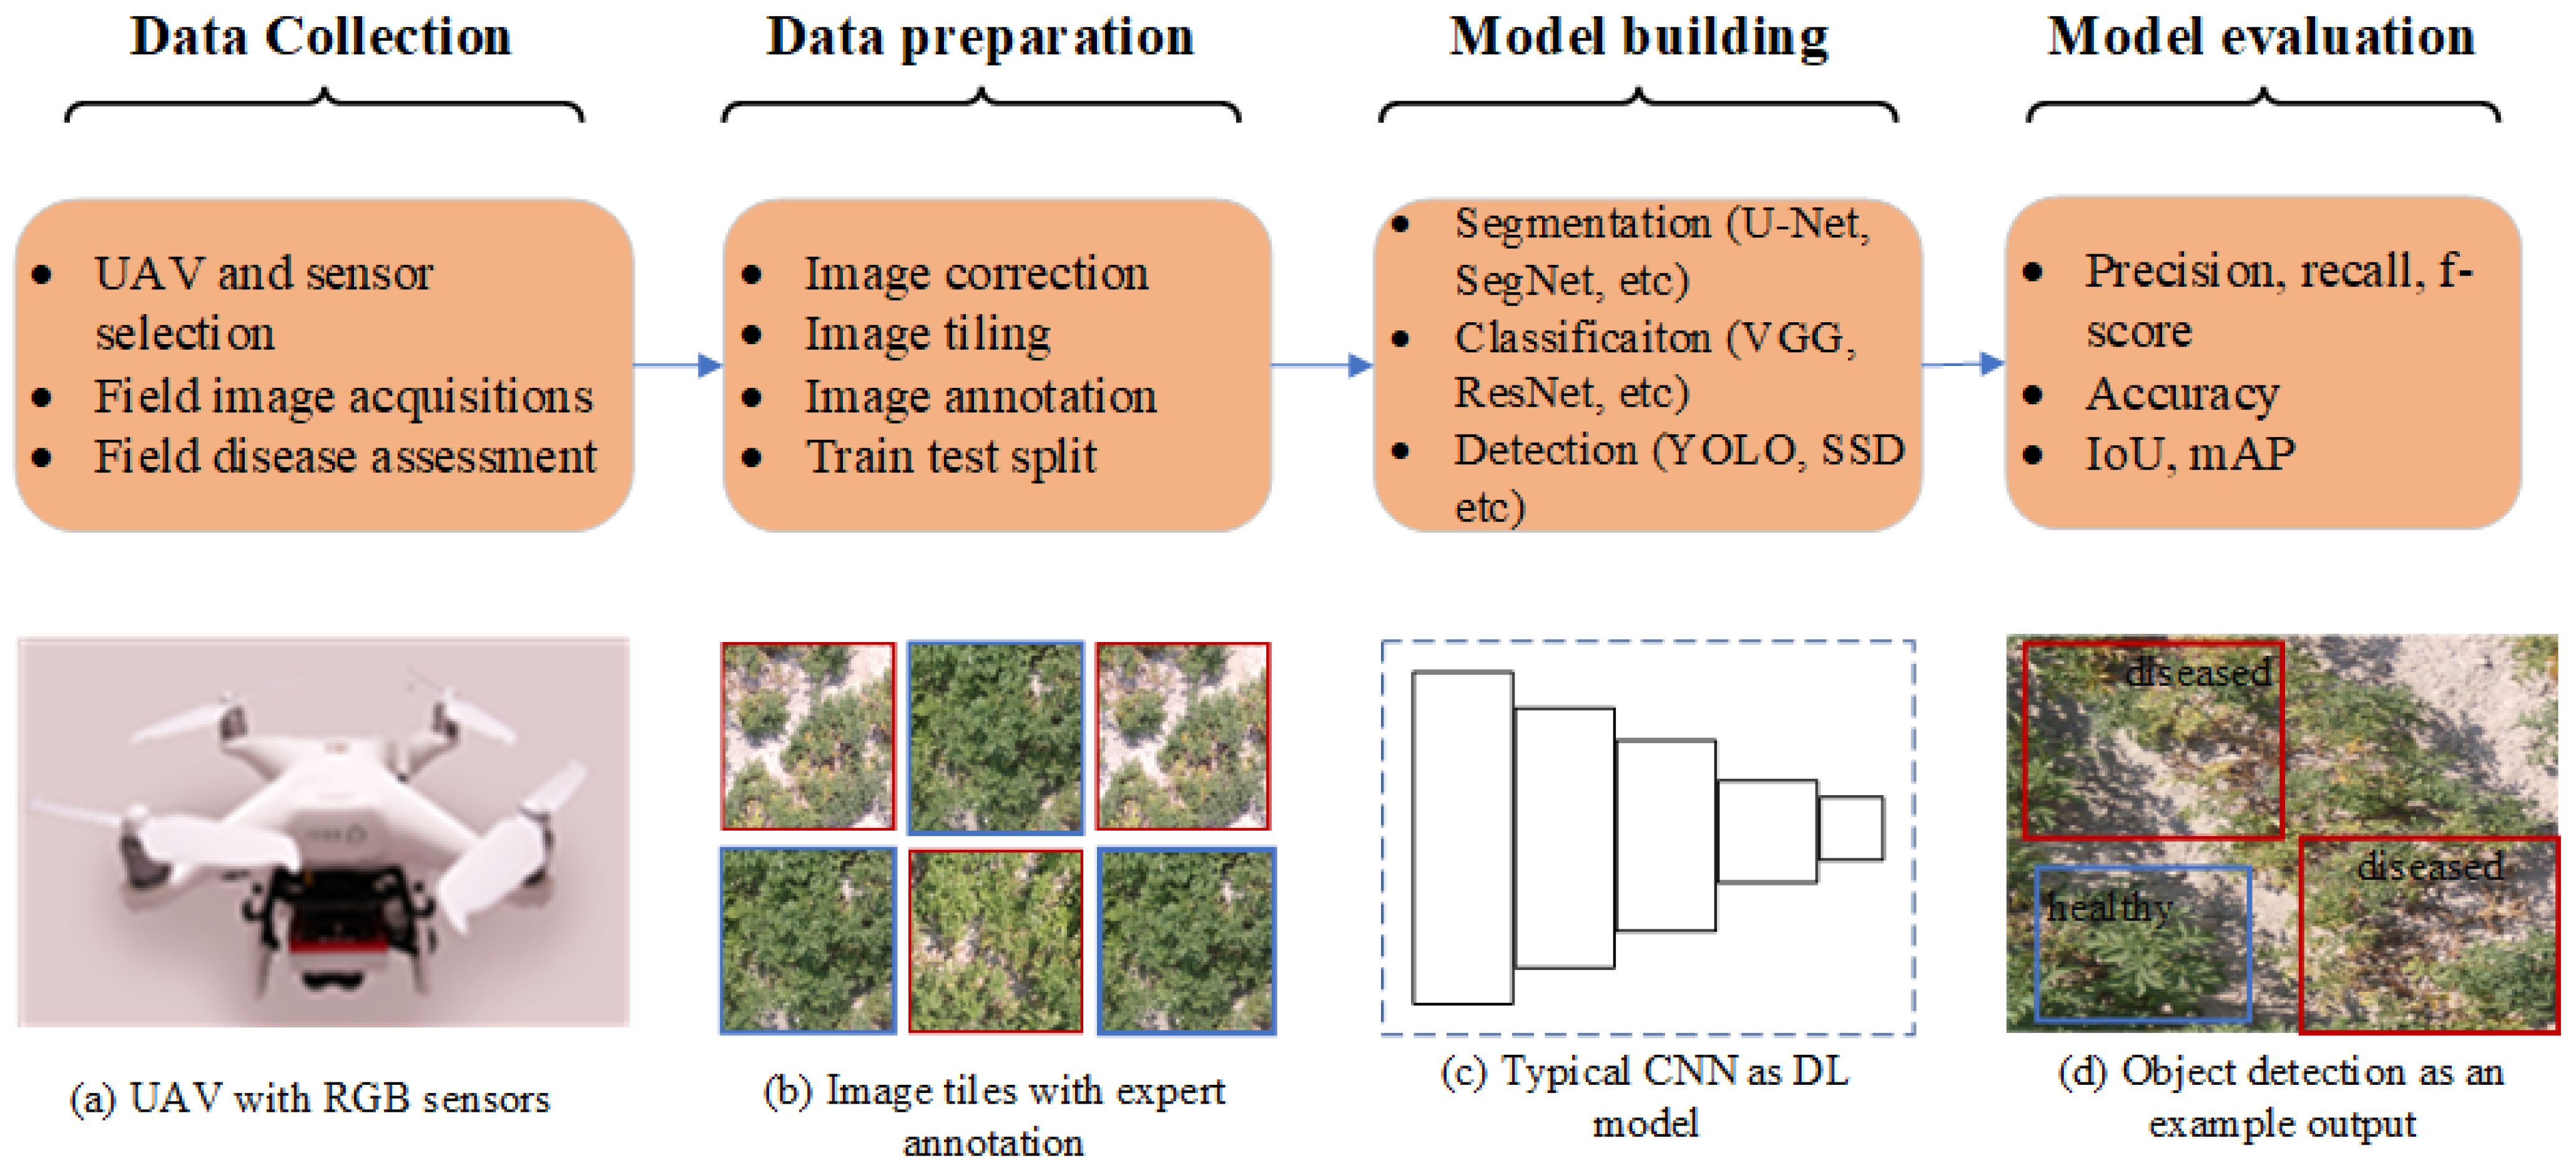
Deep learning methods such as U-Net [94], SegNet [95], YOLO [96], Faster R-CNN [97], VGG [74] and ResNet [98] have been used extensively for crop disease estimation using UAV imagery. The basic building block of the deep learning architecture is basically the success of convolutional neural networks (CNN). The general pipeline for a deep learning framework for UAV-based crop disease estimation is shown in Figure 6 and consists of similar steps as in other learning frameworks such as data collection, data preparation, model building and model evaluation. However, there are specific needs during data collection and preparation when using UAV images. The data preparation steps involve specific tasks such as image stitching, image tiling and image annotation, which are essential to building the DL model for crop disease recognition.
As shown in Figure 4, the deep learning models implemented for crop disease estimation using UAV imagery can be categorized into classification-based, segmentation-based and detection-based approaches. Segmentation-based models attempt to classify each pixel in an image into different categories such as healthy vs. diseased pixels, whereas classification-based models look into overall images and classify the image into pre-defined disease classes. Furthermore, the detection-based models draw a bounding box around the object of interest (localization) along with its label (e.g., disease or healthy as shown in Figure 6). Based on the approaches used to build crop disease models, their evaluation matrices are accuracy, precision, recall intersection over union (IoU) and mean average precision (mAP). Table 5, Table 6 and Table 7 report the performance of each deep learning method along with other parameters such as crop and disease types, sensors and flight heights.
4.3.1. Pixel-Based Segmentation Models
The image segmentation model normally classifies the image pixels into different regions or categories. Traditional methods of image segmentation include clustering the pixels into different groups using iterative techniques such as K-means or ISODATA. Deep learning-based image segmentation methods utilized the encoder–decoder structure where the encoder includes the combination of convolutions and down-sampling operations to represent the input image into the latent space and then the decoder reconstructs the segmentation map from such latent space using up-sampling operations. The popular encoder–decoder architectures for image segmentation used cooperatively with UAV imagery are U-Net [94] PSPNet [99], SegNet [95] and others [100], as reported in Table 5.
The majority of the existing works [94,101,102] for crop disease segmentation in UAV imagery utilized U-Net [103], one of the widely used DL architectures for semantic segmentation. A wheat yellow rust monitoring using UAV was implemented by Su et al. [94]. The U-Net with various input combinations were designed and tested where the five-band input outperforms all other combinations such as RGB only and VIs. Furthermore, U-Net was used to detect the nematodes on coffee with RGB images acquired at a flight altitude of 10 m by Oliveira et al. [101]. They also trained PSPNet to detect the nematode pest on coffee images at different resolutions and compared its performance to U-Net, where the U-net outperformed the PSPNet with an overall precision of 69.00%. A modified version of U-Net was proposed by Zhang et al. [102] for wheat yellow rust detection with the RGB aerial images. They improved U-net architecture by adding irregular encoder and decoder modules along with a channel-wise re-weight module and compared its performance with the original U-net. Their results showed that the modified U-Net achieved an overall accuracy of 97.13% with five bands of an input image. Another study on yellow rust detection on wheat with multispectral images and U-net was conducted by [104] with an overall accuracy of 96.3%. With these observations, it can be put forward that the U-net has merits for crop disease segmentation with aerial images either with multispectral sensors or RGB sensors. However, it should also be noted that these UAV images should come with high resolutions and be acquired within the range of less than 30 m of altitude.
Similarly, Mask R-CNN [105], SegNet [95], FCN [106], PSPNet [99], DeepLabV3 [100], CropDocNet [107] and VddNet [108] were also utilized for the segmentation of various crop diseases, as reported in Table 5. For instance, Stewart et al. [105] implemented an instance segmentation model based on Mask R-CNN for northern leaf blight (NLB) on maize. They achieved an average precision of 0.96, while the intersection over union (IOU) was set to 0.50. With such promising results, it is projected that deep learning-based methods for instance segmentation using UAV imagery have a great potential for plant disease detection. Mildew disease detection in vine was investigated by Kerkech et al. [95] using multispectral images and SegNet [109]. They used SegNet to classify each pixel of the vine field images into shadow, ground, healthy and mildew symptom classes. Their method achieved the highest detection accuracy of 92% at the grapevine level while the detection accuracy was 87% at the leaf level. Similarly, Cercospora leaf spot (CLS) detection on sugar beet was investigated by [106] using a fully connected neural network (FCN). Their FCN was based on DenseNet [66], which was trained on pixels classified as CLS, healthy and background. Their method achieved an f-score of 44.48%, 88.26% and 93.90 for CLS, healthy and background pixels, respectively, under changing field conditions.
Table 5.
Summary of pixel-based segmentation DL models for crop disease detection using UAV imagery. Note that the disease abbreviations are denoted as NLB (northern leaf blight), VD (vine disease), CLS (Cercospora leaf spot), YR (yellow rust), NM (nematodes), SR (stripe rust), LB (late blight).
Table 5.
Summary of pixel-based segmentation DL models for crop disease detection using UAV imagery. Note that the disease abbreviations are denoted as NLB (northern leaf blight), VD (vine disease), CLS (Cercospora leaf spot), YR (yellow rust), NM (nematodes), SR (stripe rust), LB (late blight).
| Ref. | Crop | Disease | Sensors | Height | DL Methods | B | Recall | F-Score | Acc. |
|---|---|---|---|---|---|---|---|---|---|
| [105] | Maize | NLB | RGB | 6 m | Mask R-CNN | 96.00 | - | - | - |
| [95] | Grape | VD | RGB & NIR | - | SegNet | 84.04 | 90.47 | 87.12 | - |
| [106] | Sugar | CLS | RGB | - | FCN | 74.81 | 80.25 | 75.55 | - |
| [99] | Wheat | YR | RGB | PSPNet | - | - | - | 94.00 | |
| [94] | Wheat | YR | MS | 20 m | U-Net | 91.30 | 92.60 | 92.00 | - |
| [101] | Coffee | NM | RGB | 10 m | U-Net & PSPNet | - | - | 69.00 | - |
| [100] | wheat | SR | RGB | 50 m | DeepLabv3+ | - | - | 81.00 | - |
| [102] | wheat | YR | RGB | - | lr-UNet | - | - | - | 97.13 |
| [107] | Potato | LB | HS | 30 m | CropdocNet | - | - | - | 95.75 |
| [105] | Maize | NLB | RGB | 6 m | Mask R-CNN | 96.00 | - | - | - |
| [106] | Sugar | CLS | RGB | - | CNN | 74.81 | 80.25 | 75.55 | - |
| [108] | Vine | VD | RGB-NIR-D | 25 m | VddNet | - | - | - | 93.72 |
| [104] | Wheat | YR | MS | 20 m | UNet, DF-UNet | - | - | - | 96.93 |
4.3.2. Object-Level Classification Models
The object-level classification models take an image as input and classify the images into one of the predetermined object classes. Since UAV images are acquired as overlapped tiles of agricultural fields and are later stitched into a single agricultural field map, the crop field region can be divided into small object-level tiles. Then, using such tiles, the deep learning model can be trained to classify the image tiles into diseased regions or healthy regions. As a post-processing task, these outputs can be merged again to rebuild the original agricultural field map with diseased vs. healthy regions. As reported in Table 6, two types of DL methods were used for crop disease classification using UAV imagery: first, existing pre-trained deep learning architectures such as ResNet [98], Inception-v3 [110], VGG [74], DenseNet [111], MobileNet [112] and GoogleNet [113], which were mostly trained on ImageNet [114] and are easily available for use in any other task as transfer learning, and second, custom-designed convolutional neural networks (CNNs) specific to a particular task that need training from scratch.
A transfer learning approach using ResNet [67] architecture was implemented by Wu et al. [98] for lesion detection on maize with high-resolution RGB UAV imagery captured by flying a drone 6m above the ground in two stages. In the first stage, they trained a backbone CNN (ResNet [67]) by randomly cropping sub-images of size . Furthermore, transfer learning was implemented using the ResNet-34 pre-trained on ImageNet [114]. Next, a disease heat map was generated with the output of a previously trained CNN while feeding the patch generated with sliding windows over the original UAV images. Similarly, a transfer learning approach with multiple existing deep learning architectures, such as VGG, ReseNet, Inception and Xceptio, for soybean leaf disease classification using RGB imagery was implemented by Tetila et al. [110]. Their framework included three steps: (a) UAV image acquisition, (b) leaf segmentation using SLIC and (c) the classification of leaves into various disease levels using existing DL methods. Comparing the performance of the DL models, the Inception network outperformed all other DL models with an overall accuracy of 99.04%. Similarly, a deep learning method based on InceptionResNet [73] was investigated by Zhang et al. [72] for yellow rust detection on wheat using hyperspectral imagery. Here, a sliding window approach was used to create the patch of an image, and then these patches are fed into a DCNN (Inception-ResNet) for rust classification with an overall accuracy of 85.00%. Finally, post-processing was carried out to visualize the rust map.
Besides the existing pre-trained DL models, few researchers have implemented custom CNNs specially designed for the detection of particular crop diseases. For instance, Kerkech et al. [115] implemented a CNN (inspired by LeNet-5 [116]) for RGB images at the block or patch level that classifies sliding windows of images (object) into four designated classes: ground, healthy, partially diseased and diseased. Then, each image patch was post-processed to generate the disease map. They reported the highest accuracy of 95.8%, while classifying the tiles into four classes. Similarly, a convolutional neural network (CNN) that shared the basic architecture of the classic LeNet-5 was designed by Huang et al. [117] for HLB classification on wheat with RGB imagery. When comparing its performance with SVM with various features such as LBP, histogram and VIs, an overall accuracy of 91.43% was achieved with CNN, whereas SVM provided only 90.00% accuracy.
Table 6.
Summary of object-level classification-based DL models for crop disease detection using UAV imagery. Note that the abbreviations used are NLB (northern late blight), YR (yellow rust), SD (Soybean disease), FW (Fusarium wilt), corn disease (CD), BD (banana diseases), FAW (fall army-worms), VD (vine disease) and HLB (Helminthosporium leaf blotch).
| Ref. | Crop | Disease | Sensors | Height | DL Methods | Acc. (%) |
|---|---|---|---|---|---|---|
| [118] | Potato | virus | RGB | 10 m | CNN | 84.00 |
| [98] | Maize | NLB | RGB | 6 m | ResNet-34 | 95.10 |
| [72] | Wheat | YR | HS | 30 m | Inception-ResNet | 85.00 |
| [110] | Soybean | SD | RGB | 2 m | Inception-v3, ResNet50, VGG-19, Xception | 99.04 |
| [74] | Radish | FW | RGB | - | VGG | 93.30 |
| [111] | Corn | CD | RGB | 12 m | VGG, ResNet, Inception, DenseNet169 | 100.00 |
| [113] | Radish | FW | RGB | 10 m | GoogleNet | 90.00 |
| [119] | Banana | BD | RGB | 50 m | VGG and CNN | 92.00 |
| [112] | Maize | FAW | RGB | 5 m | VGG16, VGG19, Inception-v3 and MobileNet | 100.00 |
| [115] | Grape | VD | RGB | 25 m | CNN | 95.80 |
| [117] | Wheat | HLB | RGB | 80 m | CNN | 91.43 |
4.3.3. Object Detection-Based Models
Object detection is one of the most investigated tasks in the computer vision field [120]. It consists of both object classification and localization, which makes it more challenging compared to image classification tasks. Image classification involves assigning a specific class to a single image, whereas object detection involves assigning a label to an object and drawing a bounding box around the object of interest (localization) [96].
There are various methods proposed for object detection, which can be grouped into two broad categories: two-stage and single-stage detectors. The two-stage object detectors, such as R-CNN [121], first propose a set of RoIs (regions of interest) using an algorithm such as selective search. From these candidate regions, a DL architecture, such as VGG [65], extracts the deep features, and finally, a classifier, such as a linear SVM, classifies them into known classes. However, in one-stage detectors, the input images are required to pass through the DL model only once, and thereby, the bounding boxes for the object are predicted. As shown in Table 7, most works use one-stage detectors such as YOLO [96], RetinaNet [122], CenterNet [123] and so on. Two-stage detectors, such as Faster R-CNN [121], are used by very few works [97].
Table 7.
The summary of object-detection-based crop disease detection using UAV imagery. Note that the abbreviations used for the diseases are CRR (cotton rot root), WW (worm-whole) WLD (white leaf disease), DS (drought stress) and TLB (tea leaf blight).
Table 7.
The summary of object-detection-based crop disease detection using UAV imagery. Note that the abbreviations used for the diseases are CRR (cotton rot root), WW (worm-whole) WLD (white leaf disease), DS (drought stress) and TLB (tea leaf blight).
| Ref. | Crop | Disease | Sensors | Height | Methods | Metrics (%) |
|---|---|---|---|---|---|---|
| [96] | Cotton | CRR | MS | 120 m | YOLOV5 | A = 70.00 |
| [123] | Brassica chinensis | WW | RGB | 2 m | CenterNet | A = 87.20 |
| [97] | Sugar | WLD | RGB | 20 m | YOLOV5, Faster R-CNN, DETR | P = 95.00 |
| [122] | Potato | DS | RGB | - | RetinaNet-Ag | P = 74.00 |
| [124] | Tea | TLB | RGB | 5 m | DDMA-YOLO | P = 73.8 |
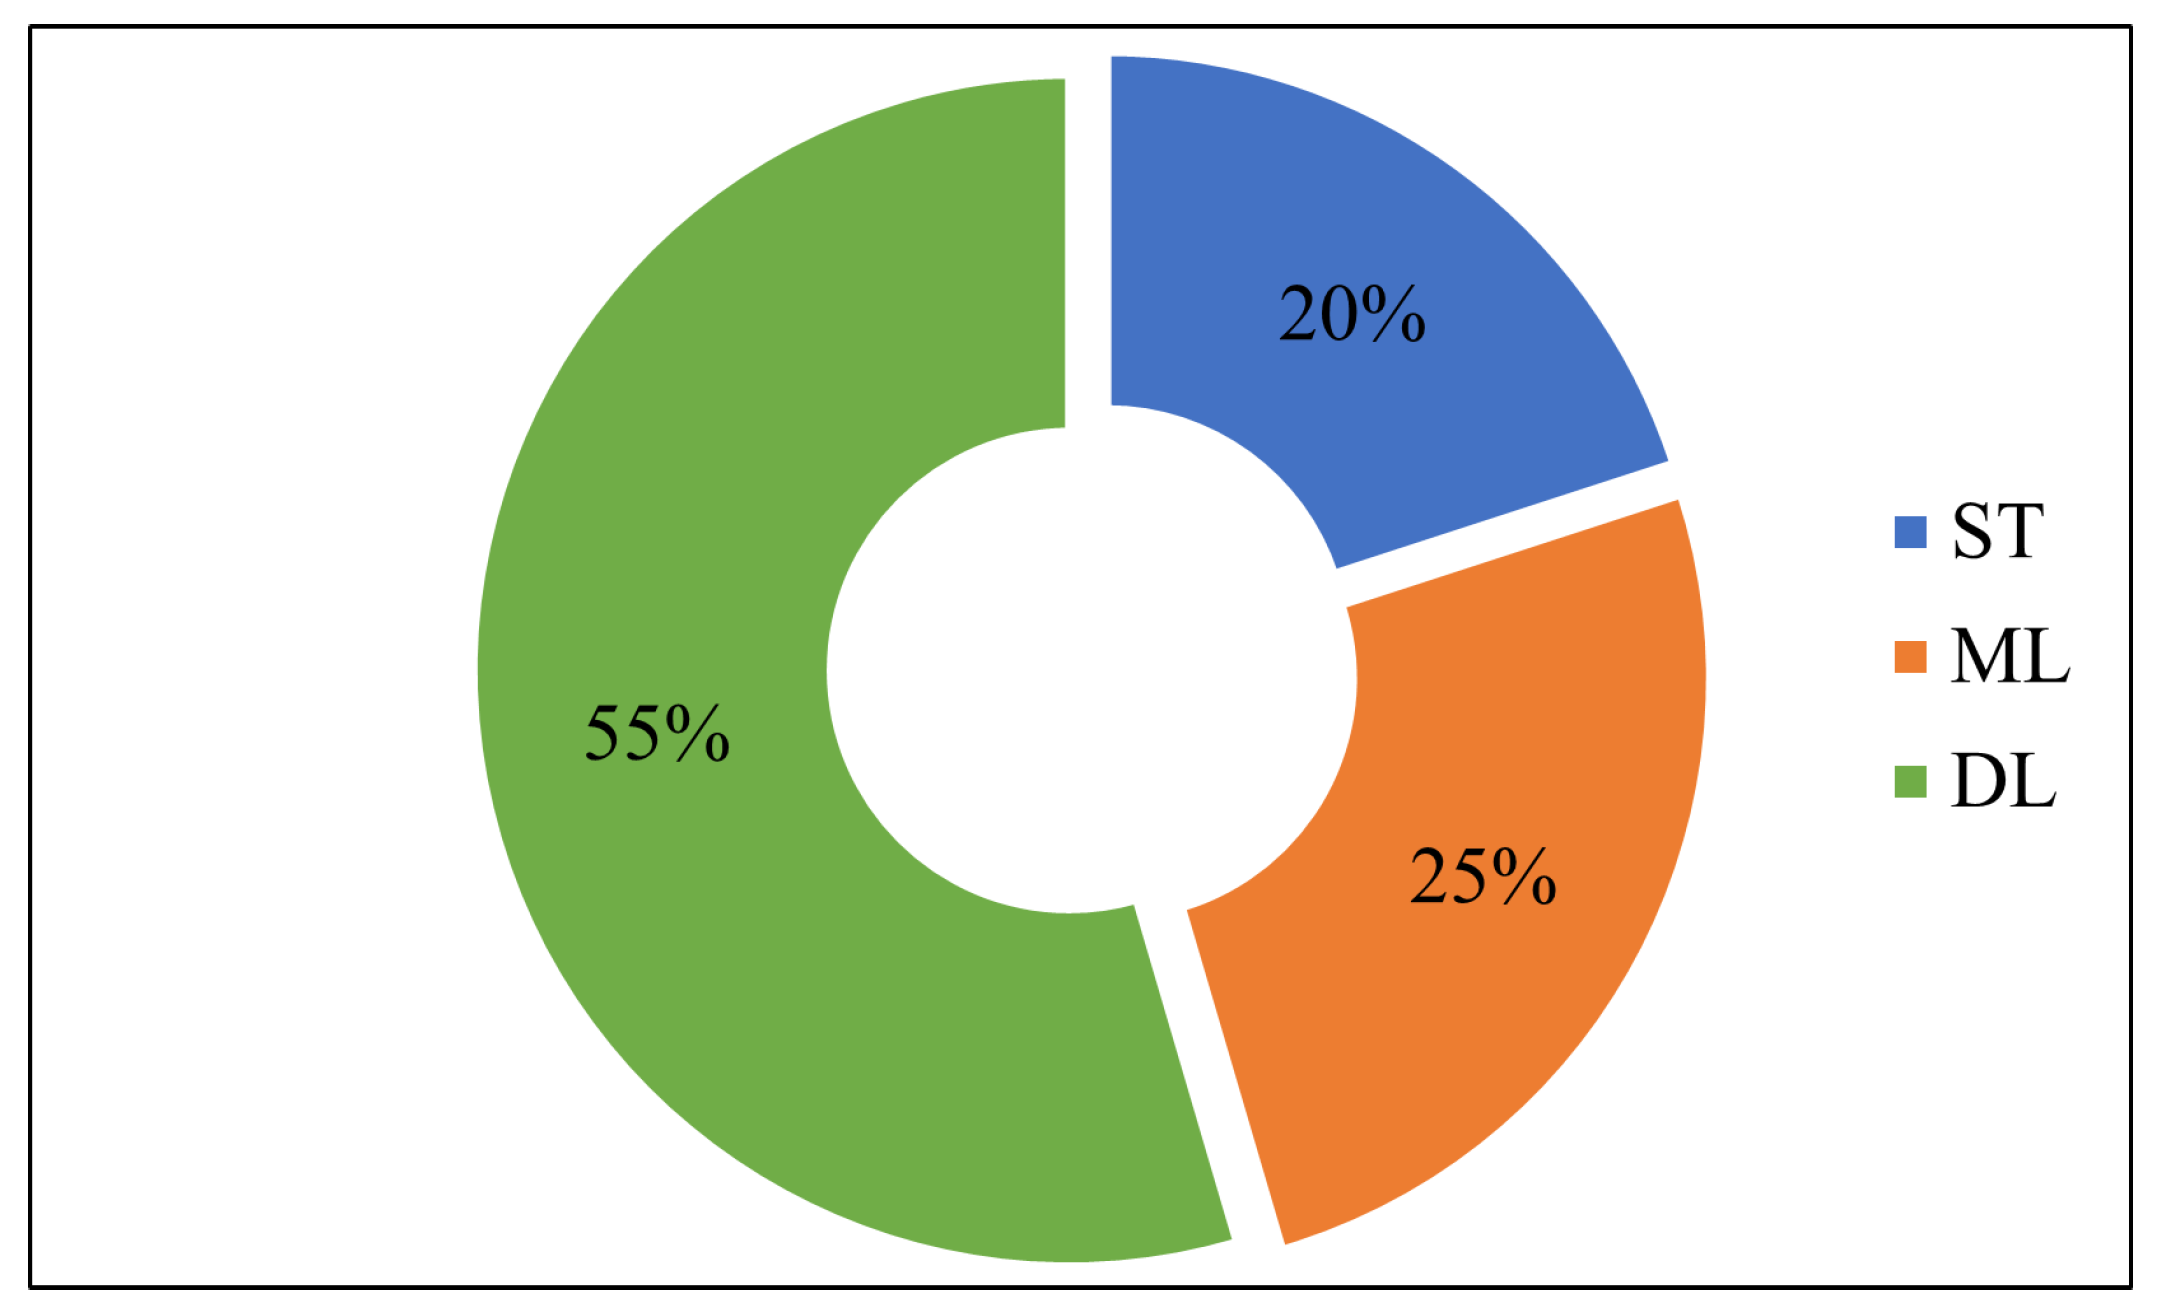
The overall distribution of the existing works based on the given taxonomy (refer to Figure 4) is reported in Figure 7, where the majority of the works (55%) include deep learning techniques, followed by 25% which use machine learning-based techniques. Statistics-based techniques are use by the lowest number of publications. This also shows the high inclination of precision agriculture researchers towards deep learning methods for crop disease estimation based on UAVs and remote sensing technology.
5. Results and Discussion
In this section, we report the synthesis of existing work covered under the review questions outlined in Section 2. Accordingly, we first discuss the various UAV platforms, sensors and their configurations, such as flight height, used by the existing literature. Furthermore, we overview the impact of such platforms on the performance of crop disease estimation methods listed in the taxonomy. Second, we listed the most successful vegetation indices along with their achievements in particular crop disease detection. In addition, we also analyzed the performance of advanced data-driven crop disease estimation methods such as conventional ML and DL, along with various features, including vegetation indices. Finally, we wrap up this section with limitations, challenges and future avenues of UAV-based crop disease estimations.
5.1. UAV Sensing Systems
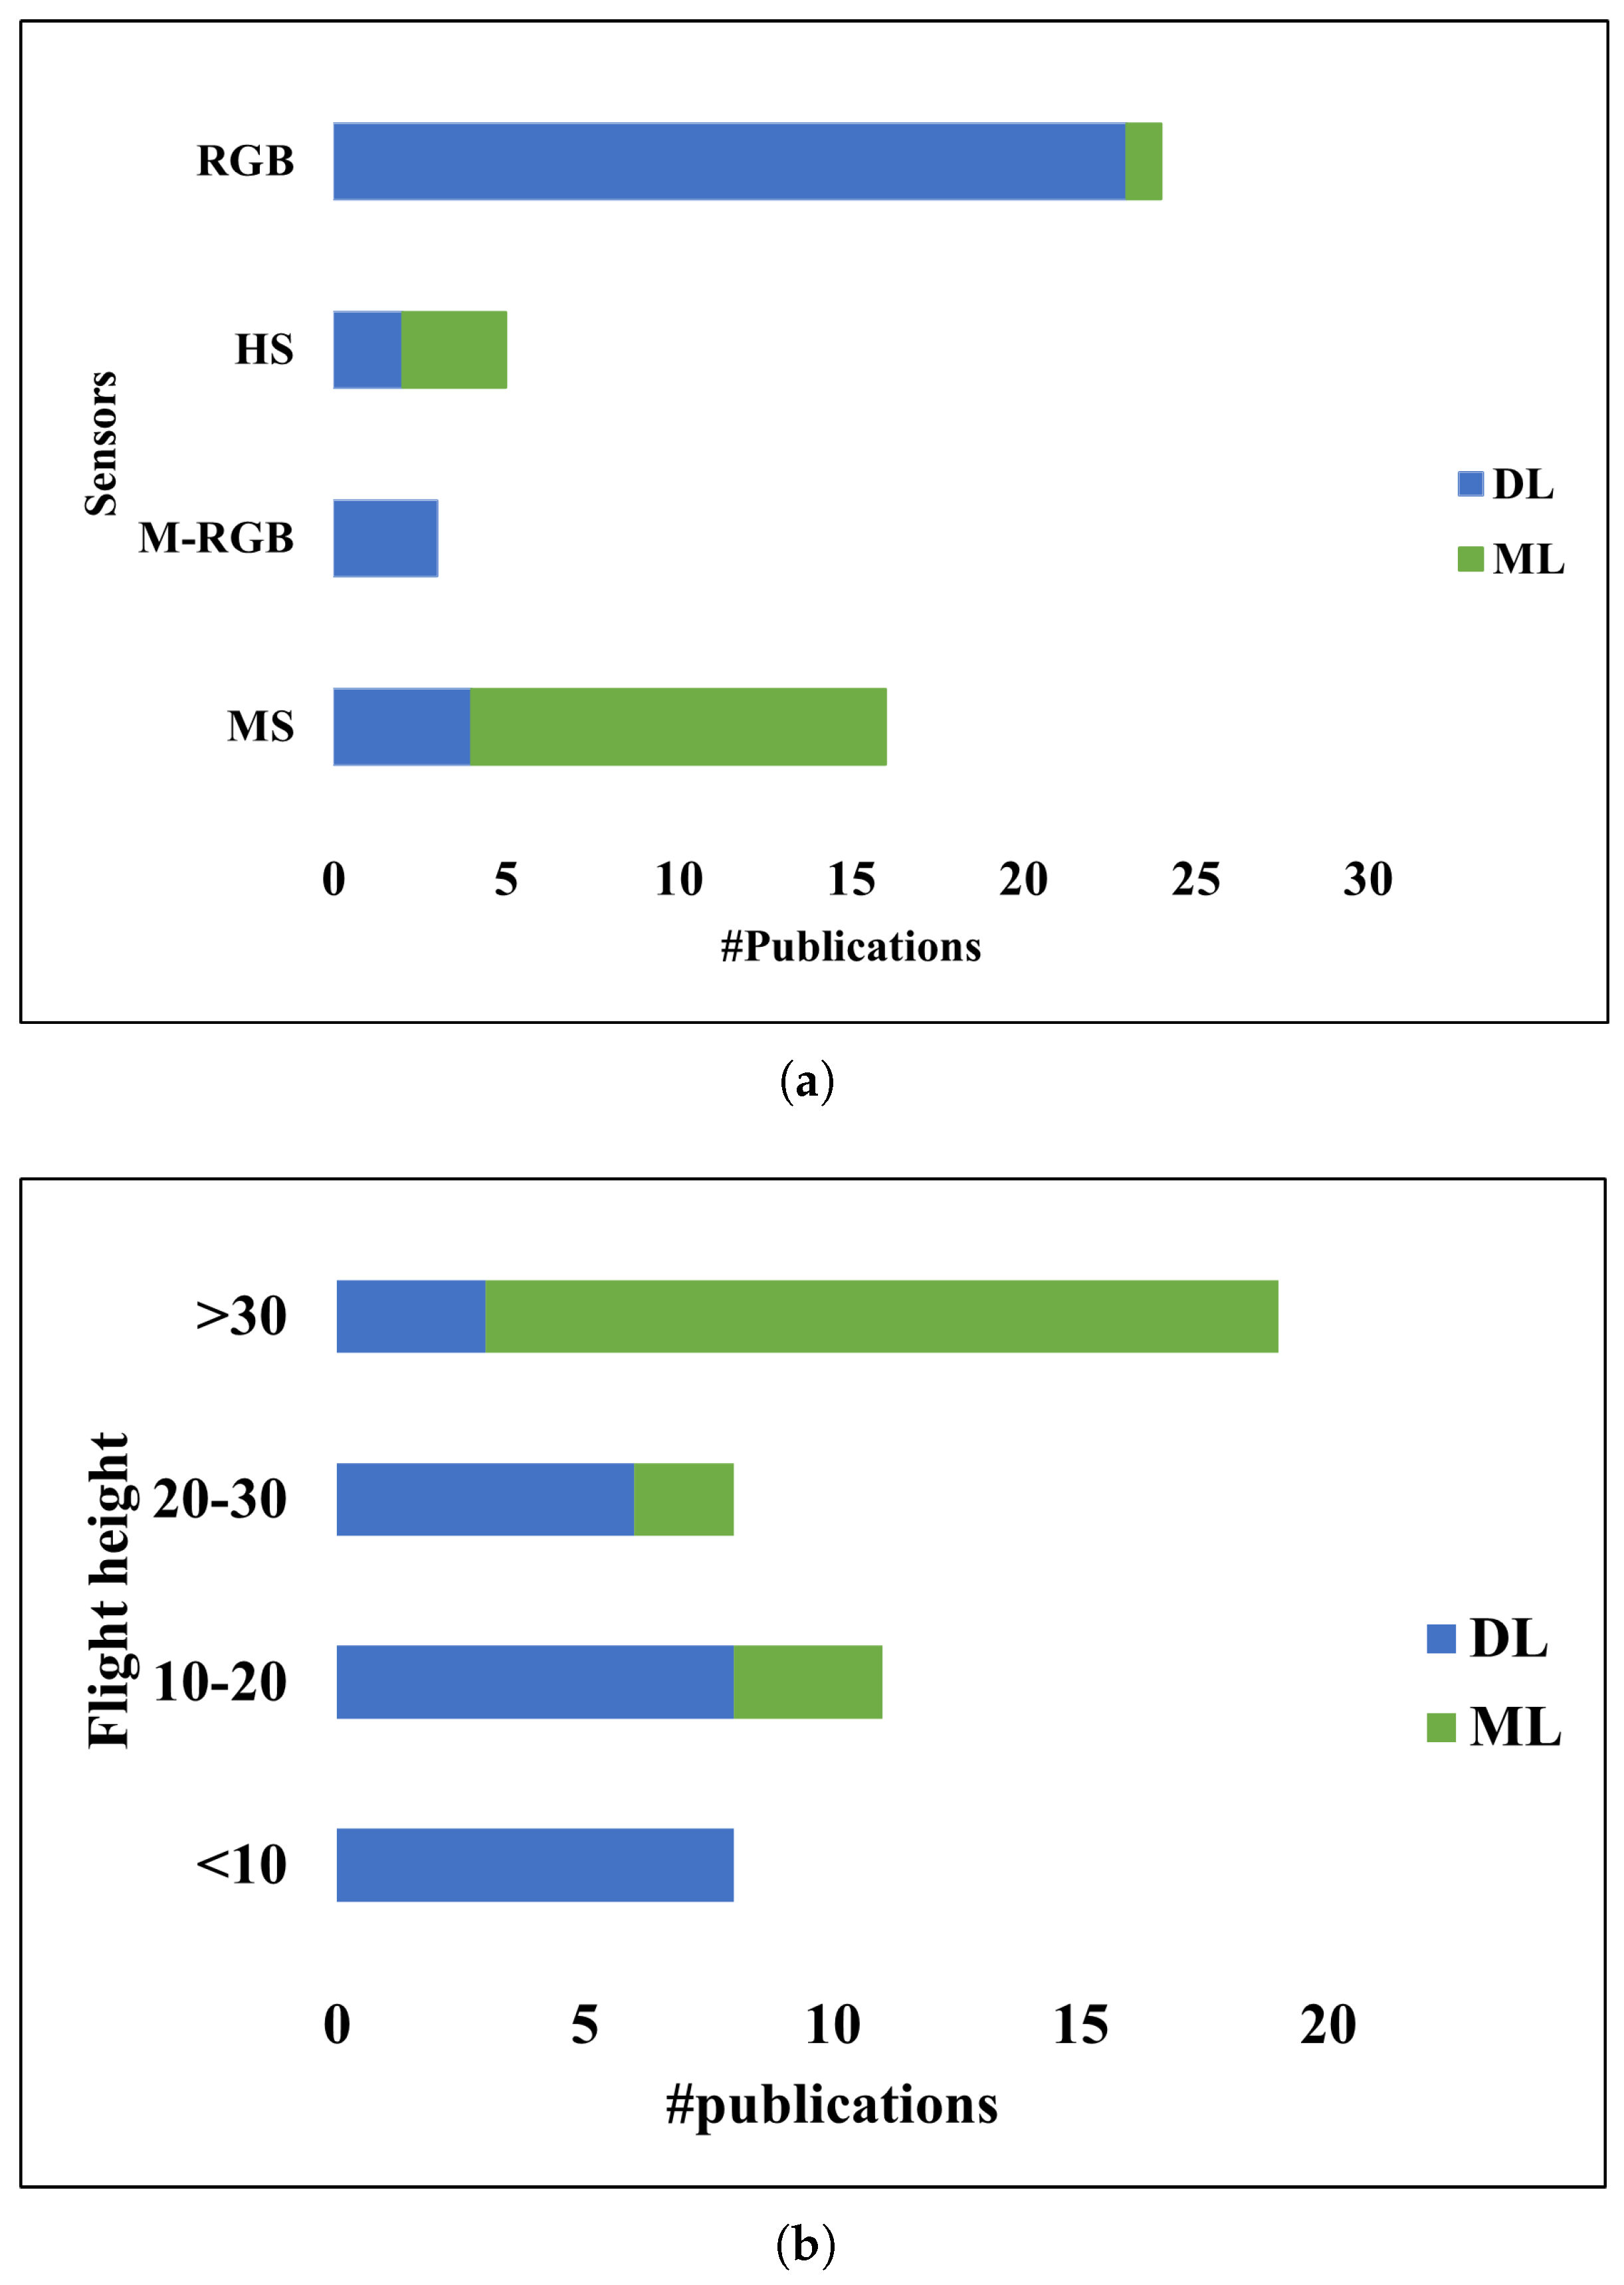
UAV sensing systems have progressed well over the past few decades as a useful tool for crop health monitoring and early disease detection, thereby providing an opportunity to manage crop disease epidemics [40]. When we seek the answer to RQ1 (refer to Section 2), the most popular and successful UAV platforms and sensors were rotary-wing UAVs combined with RGB, multispectral and hyperspectral sensors in general. However, when comparing ML-based or DL-based approaches used for crop disease estimation, we found that RGB sensors were frequently used together with a DL-based approach, while MS sensors were more often combined with ML-based methods (refer to Figure 8). These statistics further evidence that the DL-based methods demand very high spatial resolution images taken closer to the crops, which can be acquired with RGB sensors. Hyperspectral sensors have been used in very few works (both in ML-based as well as DL-based approaches), as seen in Figure 8. This might be attributed to the high cost associated with these sensors as well as to the complexity involved in processing HS data.
Interestingly, the altitude used for UAV flight has a distinct relationship with crop disease modeling approaches. Here, all publications based on the ML framework have used UAV flight altitudes greater than 10 m and the majority of them belong to flight heights greater than 30 m. However, the trend is just the opposite when DL-based approaches are considered. Very few publications used UAV images acquired at an altitude greater than 30 m, while the majority (more than half) of works set the flight height to less than 20 m (refer to Figure 8). This further indicates that the demands of high-spatial-resolution images from DL-based methods were met by RGB sensors at lower altitudes.
5.2. Type of Crops and Crop Diseases
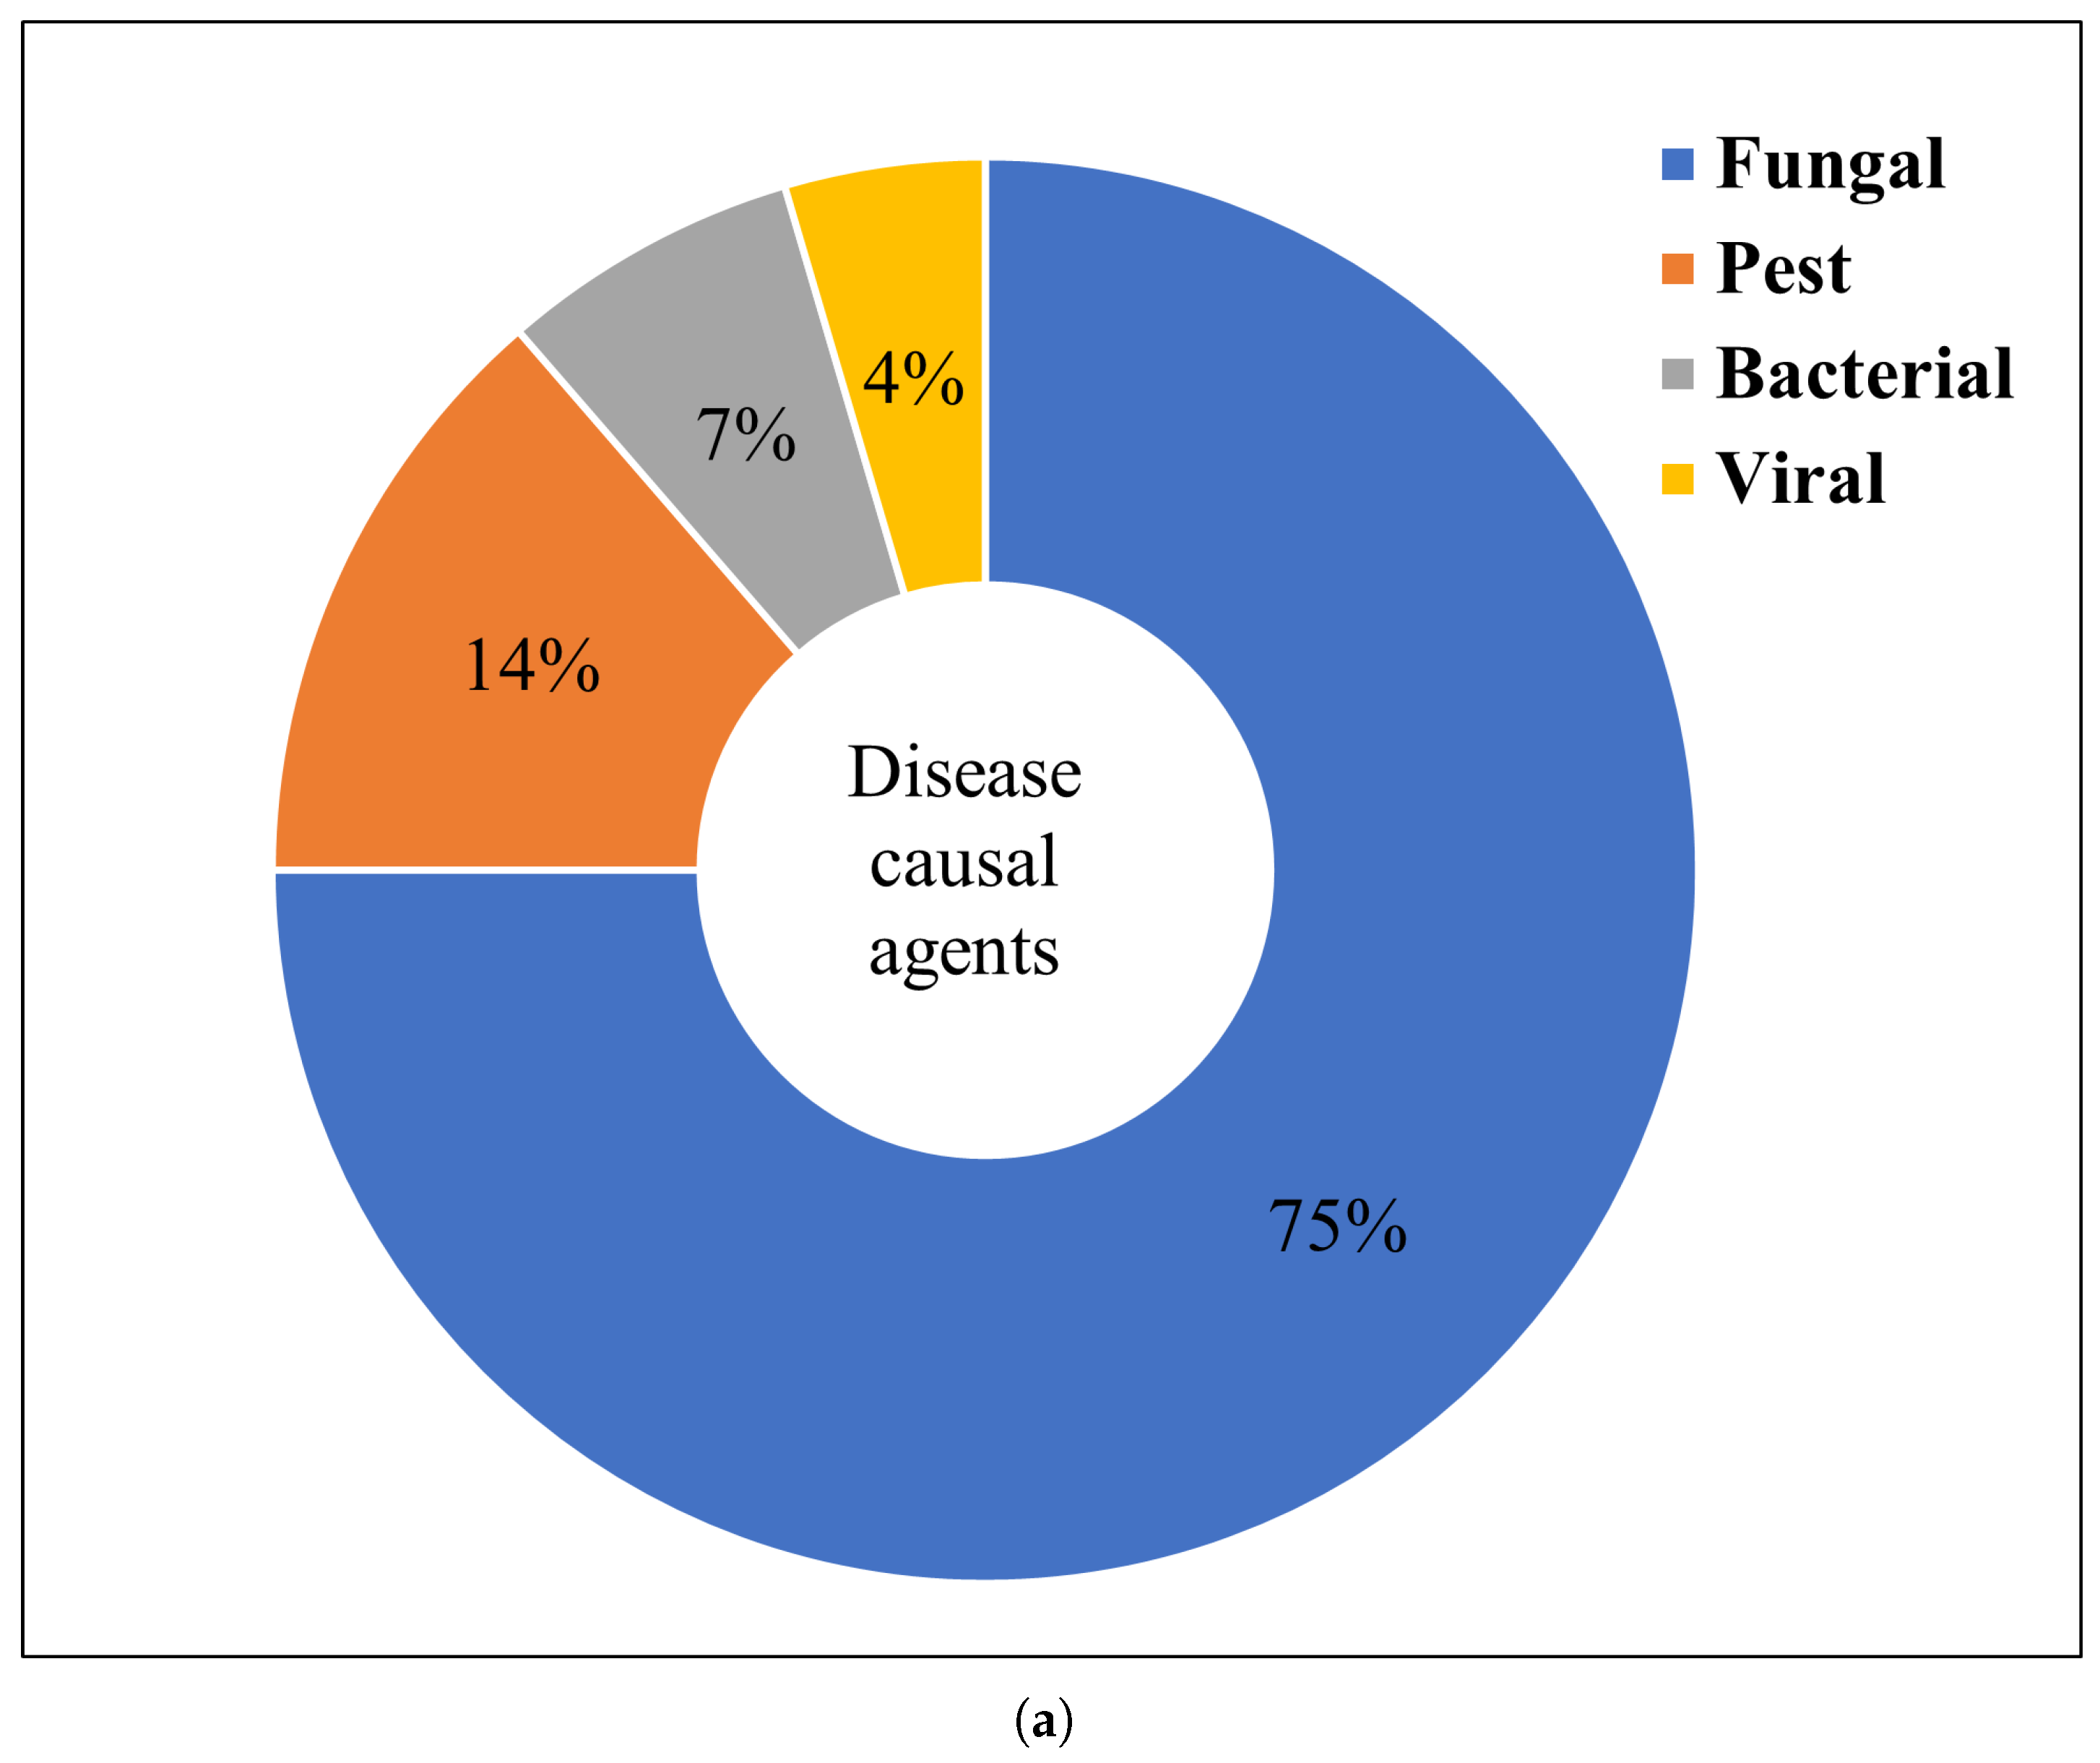
The crop stresses caused by biotic agents such as fungi, bacteria and viruses are infectious and require a well-equipped prevention and protection plan to prevent them from becoming an epidemic. Observable crop disease symptoms include changes in the color and shape of the plant, which are mostly reflected on the leaves, such as leaf spots, yellowing of the leaves and so on. Therefore, manual assessment of crop disease relies on the visual symptoms that appear on the various parts of the crop. These symptoms depend on the type of crop disease and its causal agents. For example, crop diseases caused by fungi show symptoms such as leaf rust, yellowing of leaves, leaf spots, white mold and stem rust. Therefore, it is reasonable to analyze the existing works on crop disease using UAV imagery, based on casual agents. We grouped the available works into four groups: insect pests and fungal, bacterial and viral diseases, as shown in Figure 9 along with the crop types they affect.
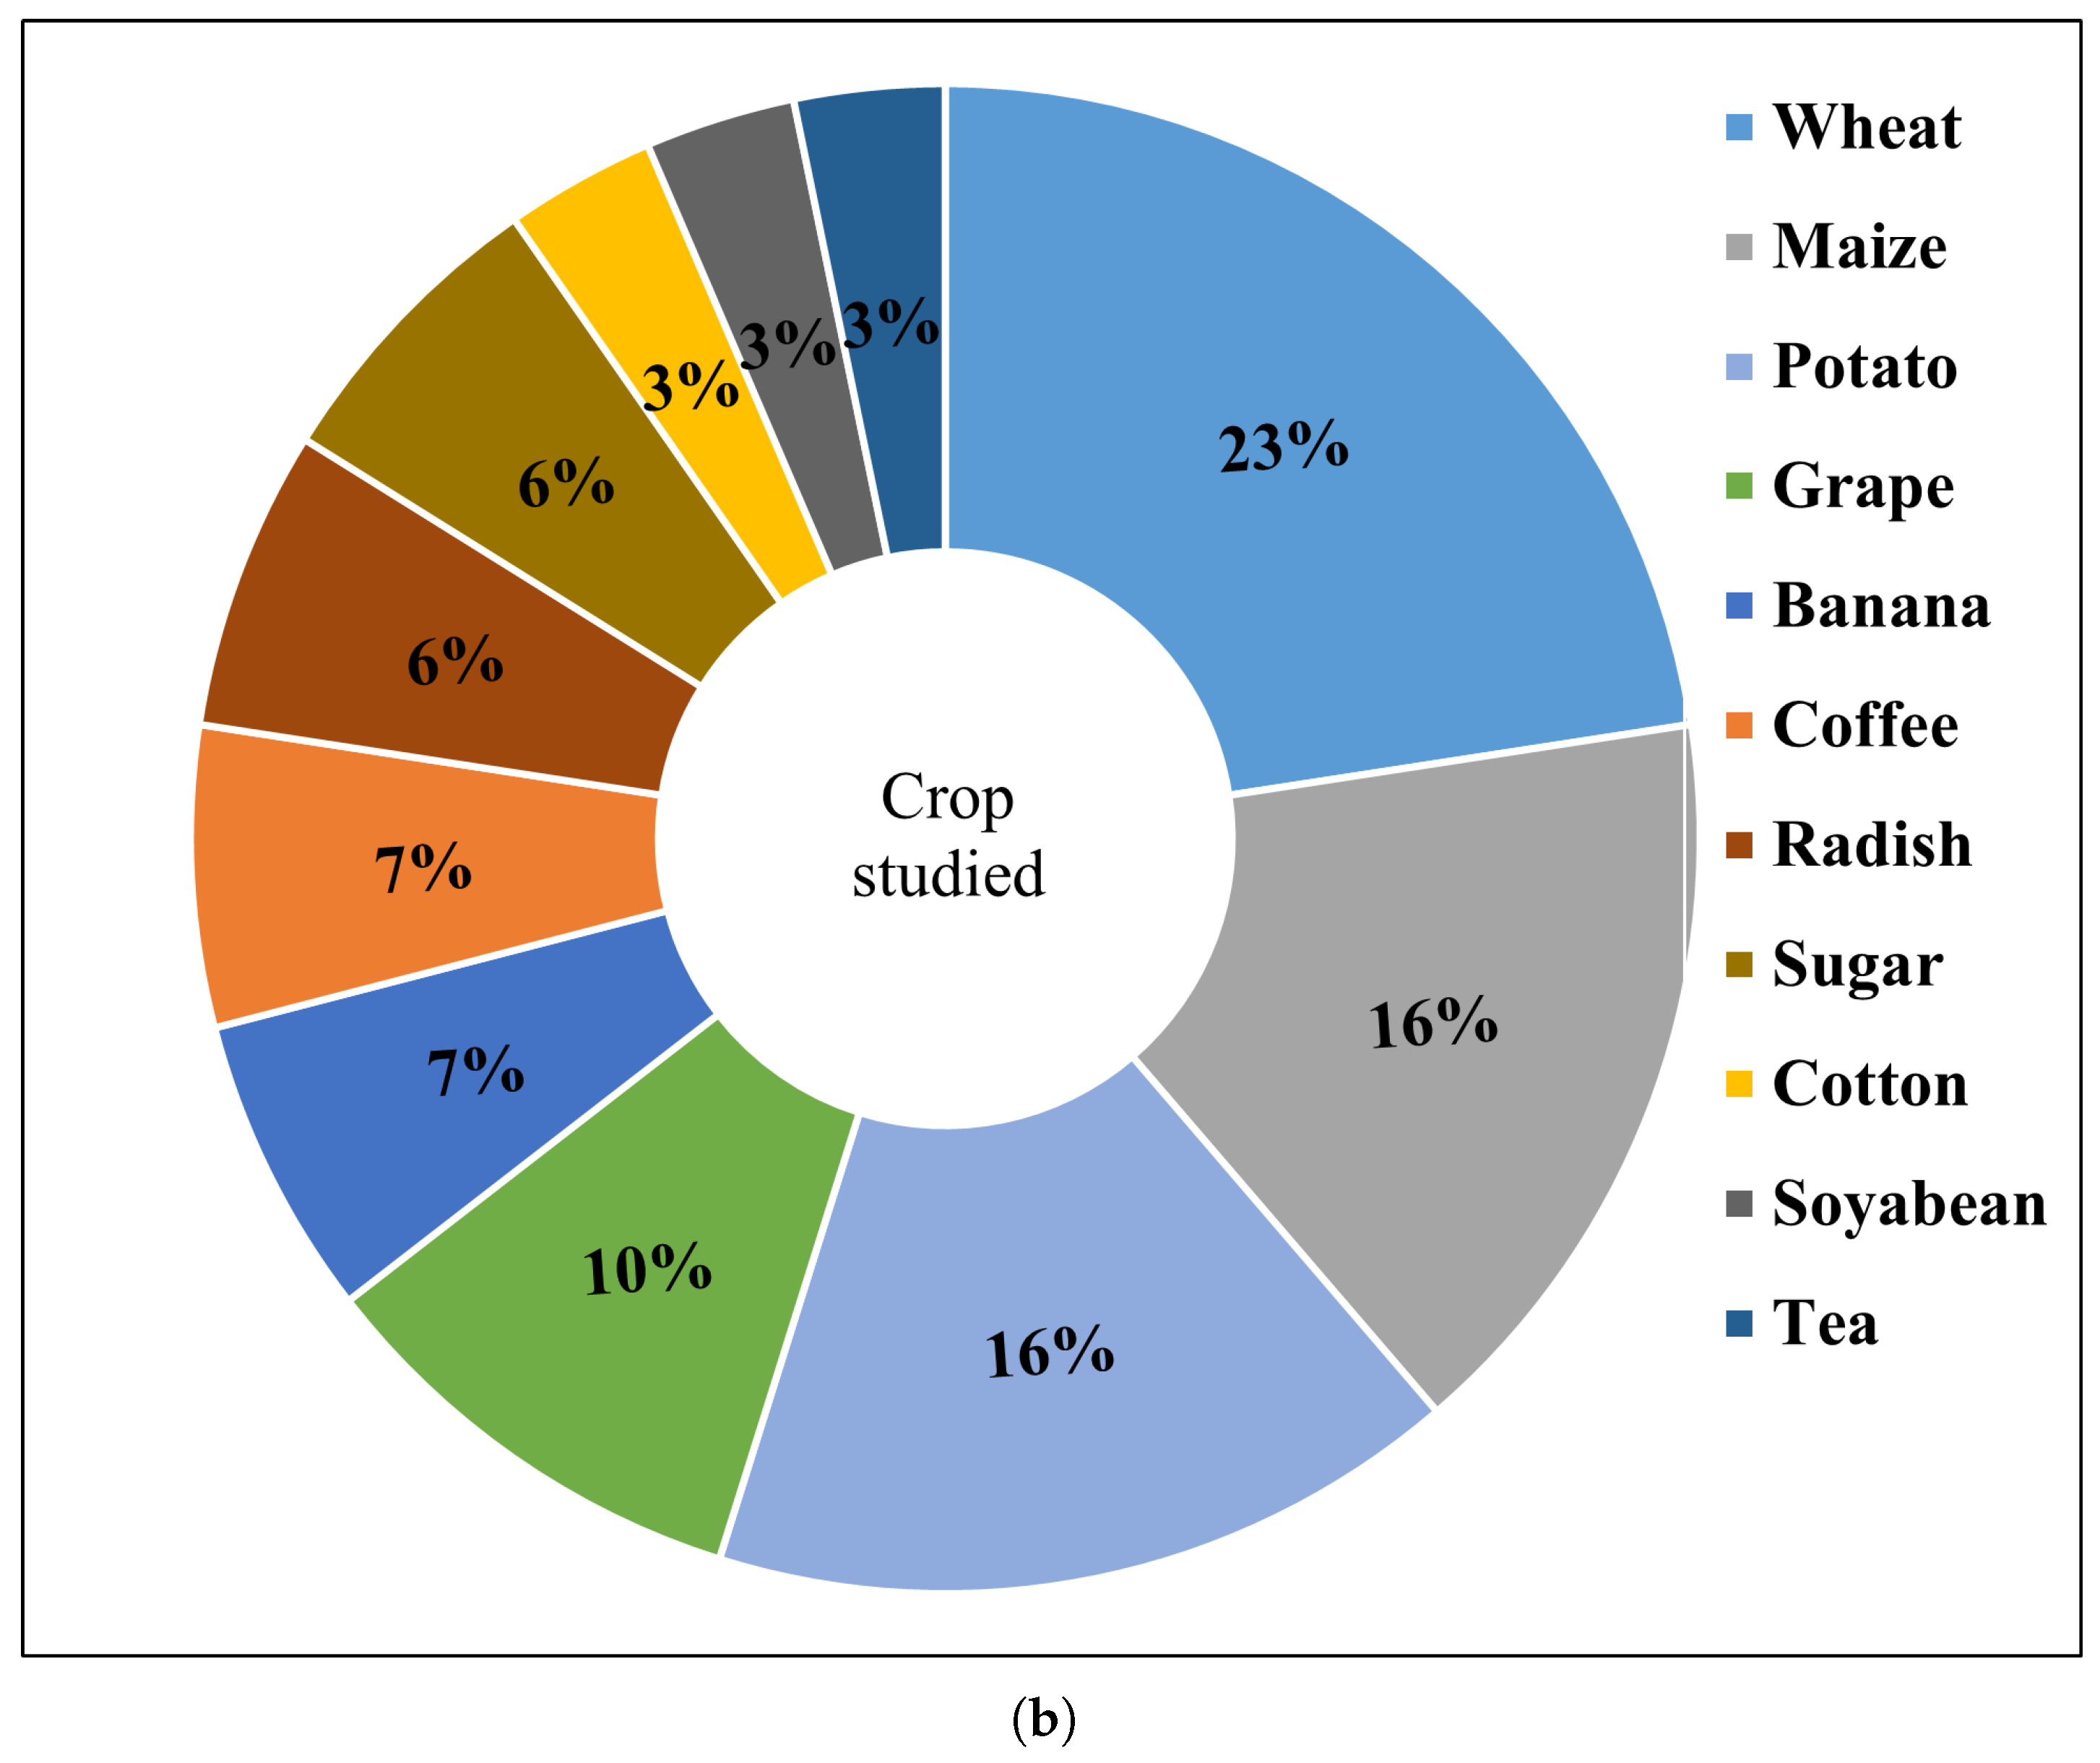
It can be clearly seen from Figure 9 that fungal diseases cover 75% of the total publications considered in this survey. This might be due to the fact that fungal diseases are more common crop diseases and thus need more attention from researchers. In addition, the symptoms of fungal diseases are highly visually observable and can be captured with RGB images used by the majority of the DL-based approaches (refer to Figure 10). Among the crop diseases considered, disease detection in wheat crops was investigated by 23% of the total works, followed by maize (16%) and potato (16%) diseases. Fusarium wilt (fungal disease) in wheat is widely investigated and successfully detected by the majority of the works using DL and ML techniques based on UAV imagery.
5.3. Conventional ML and DL Methods
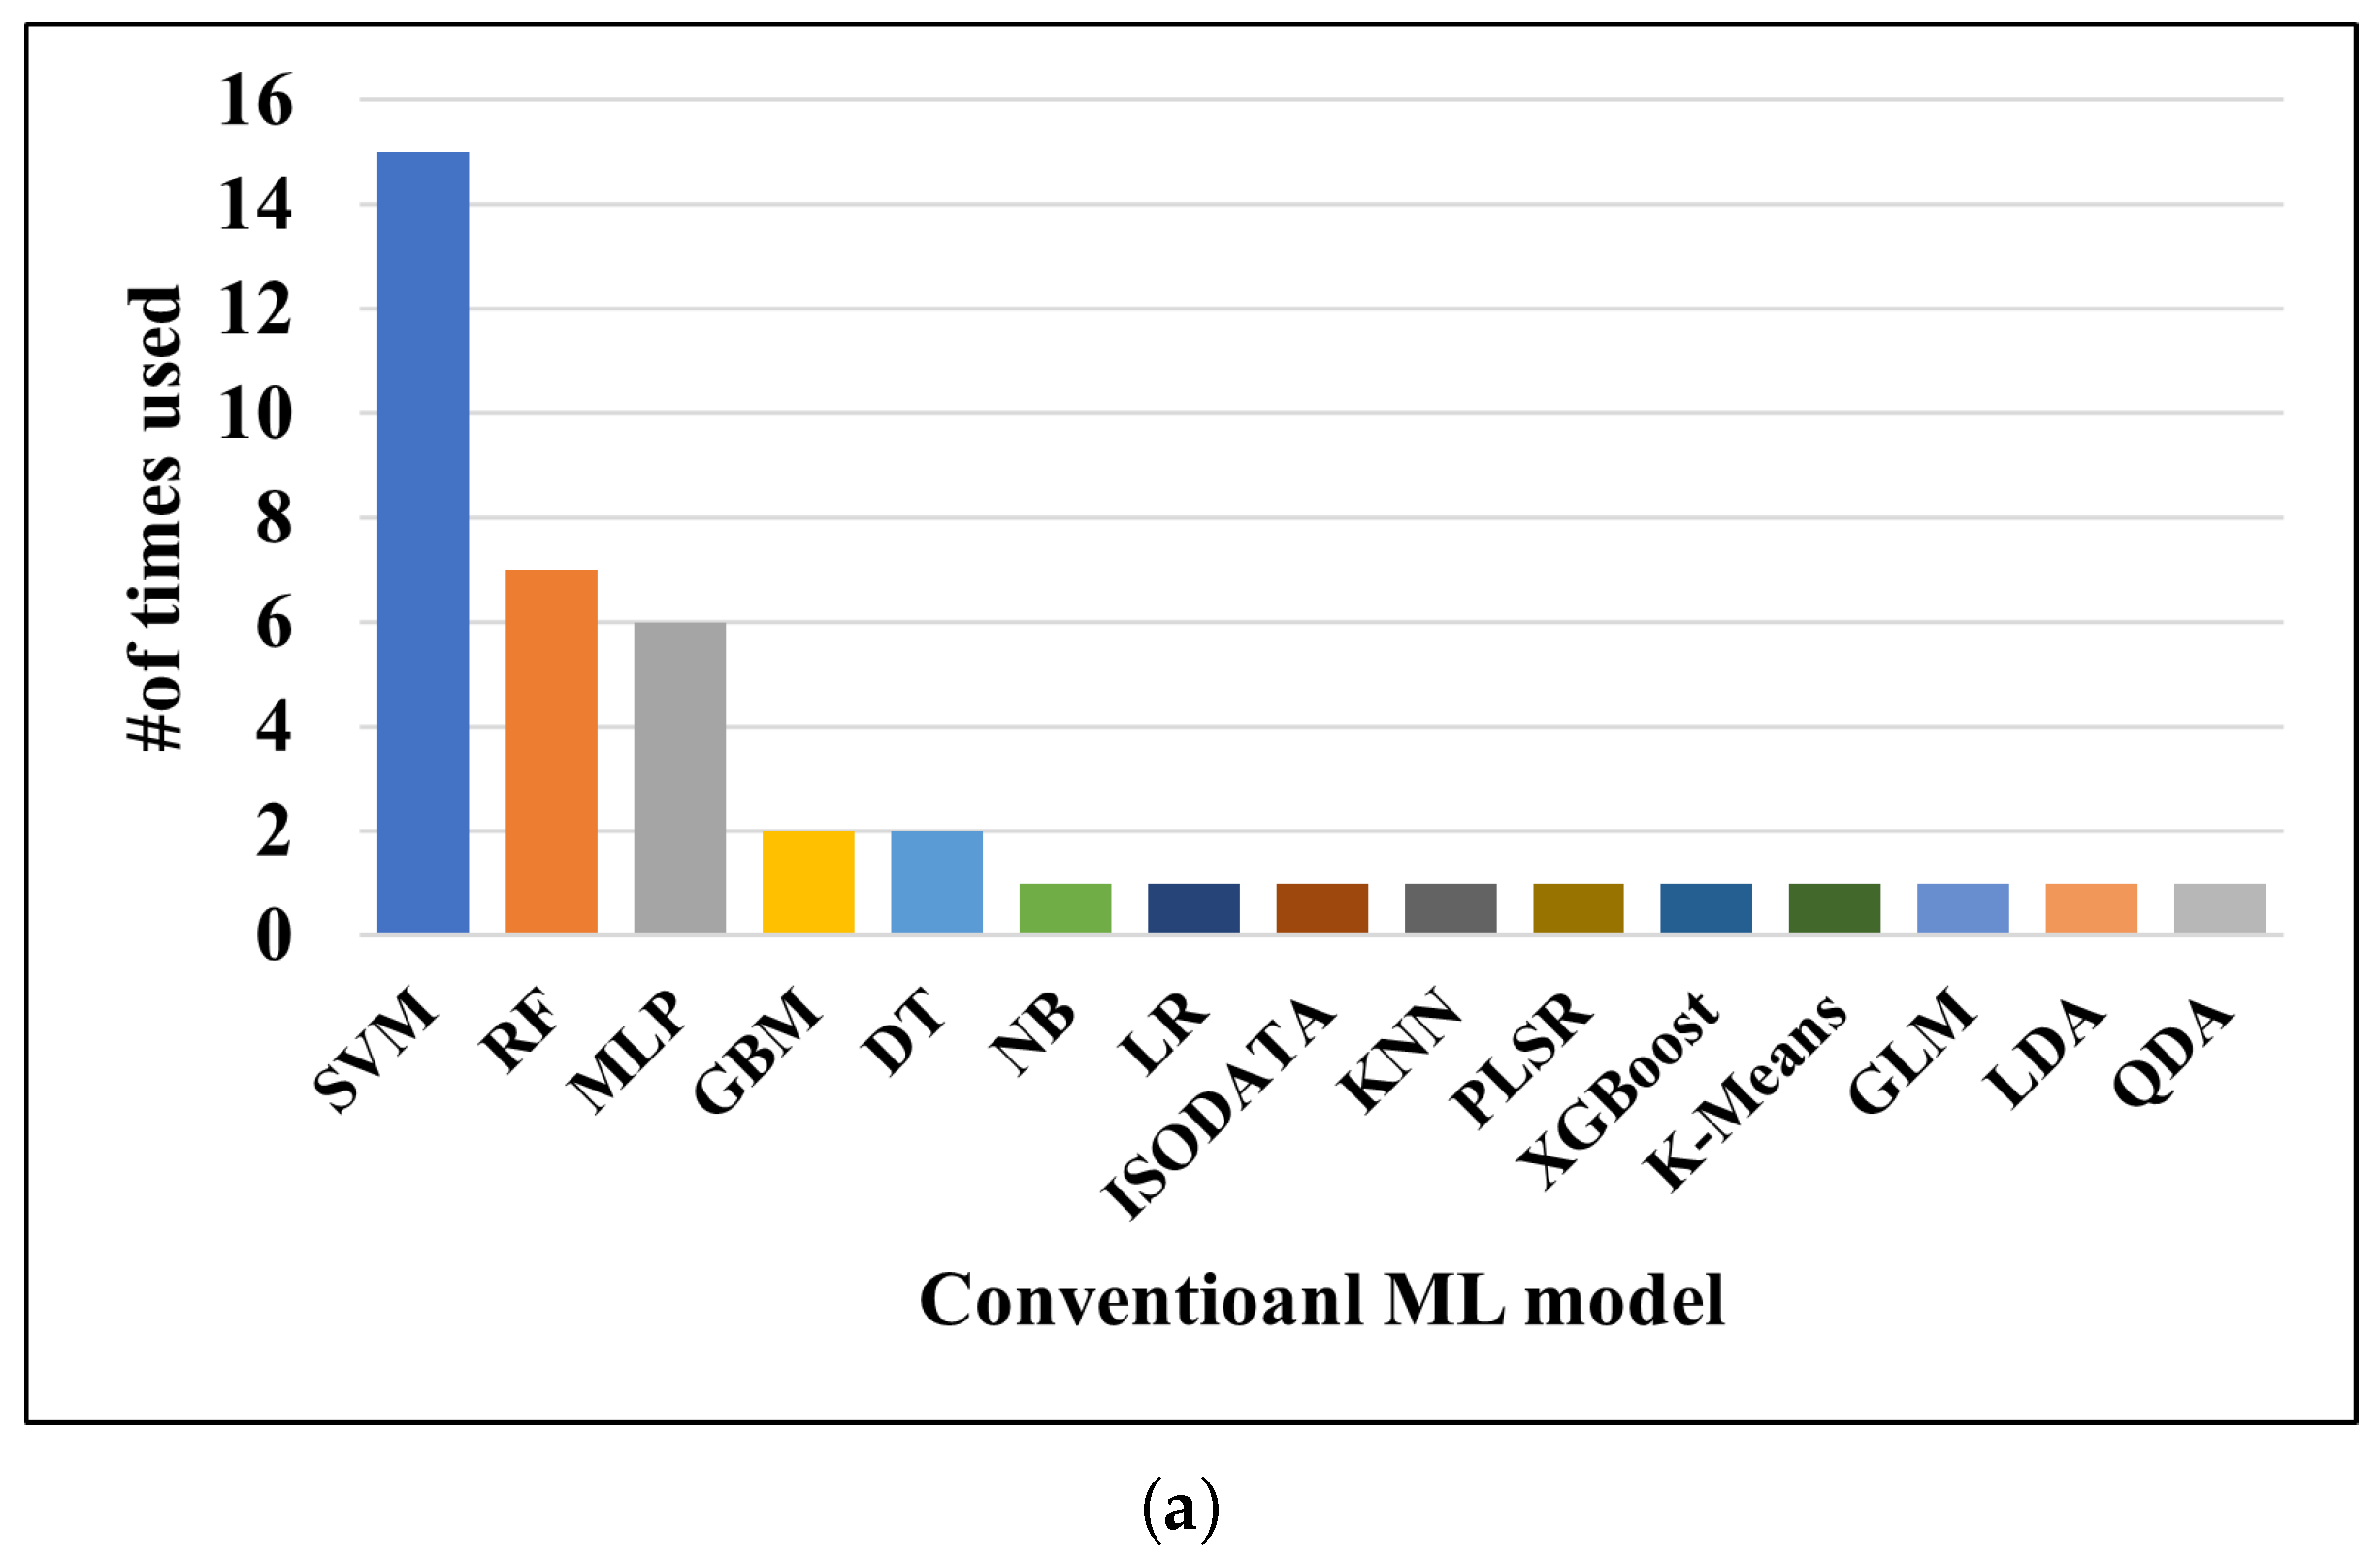
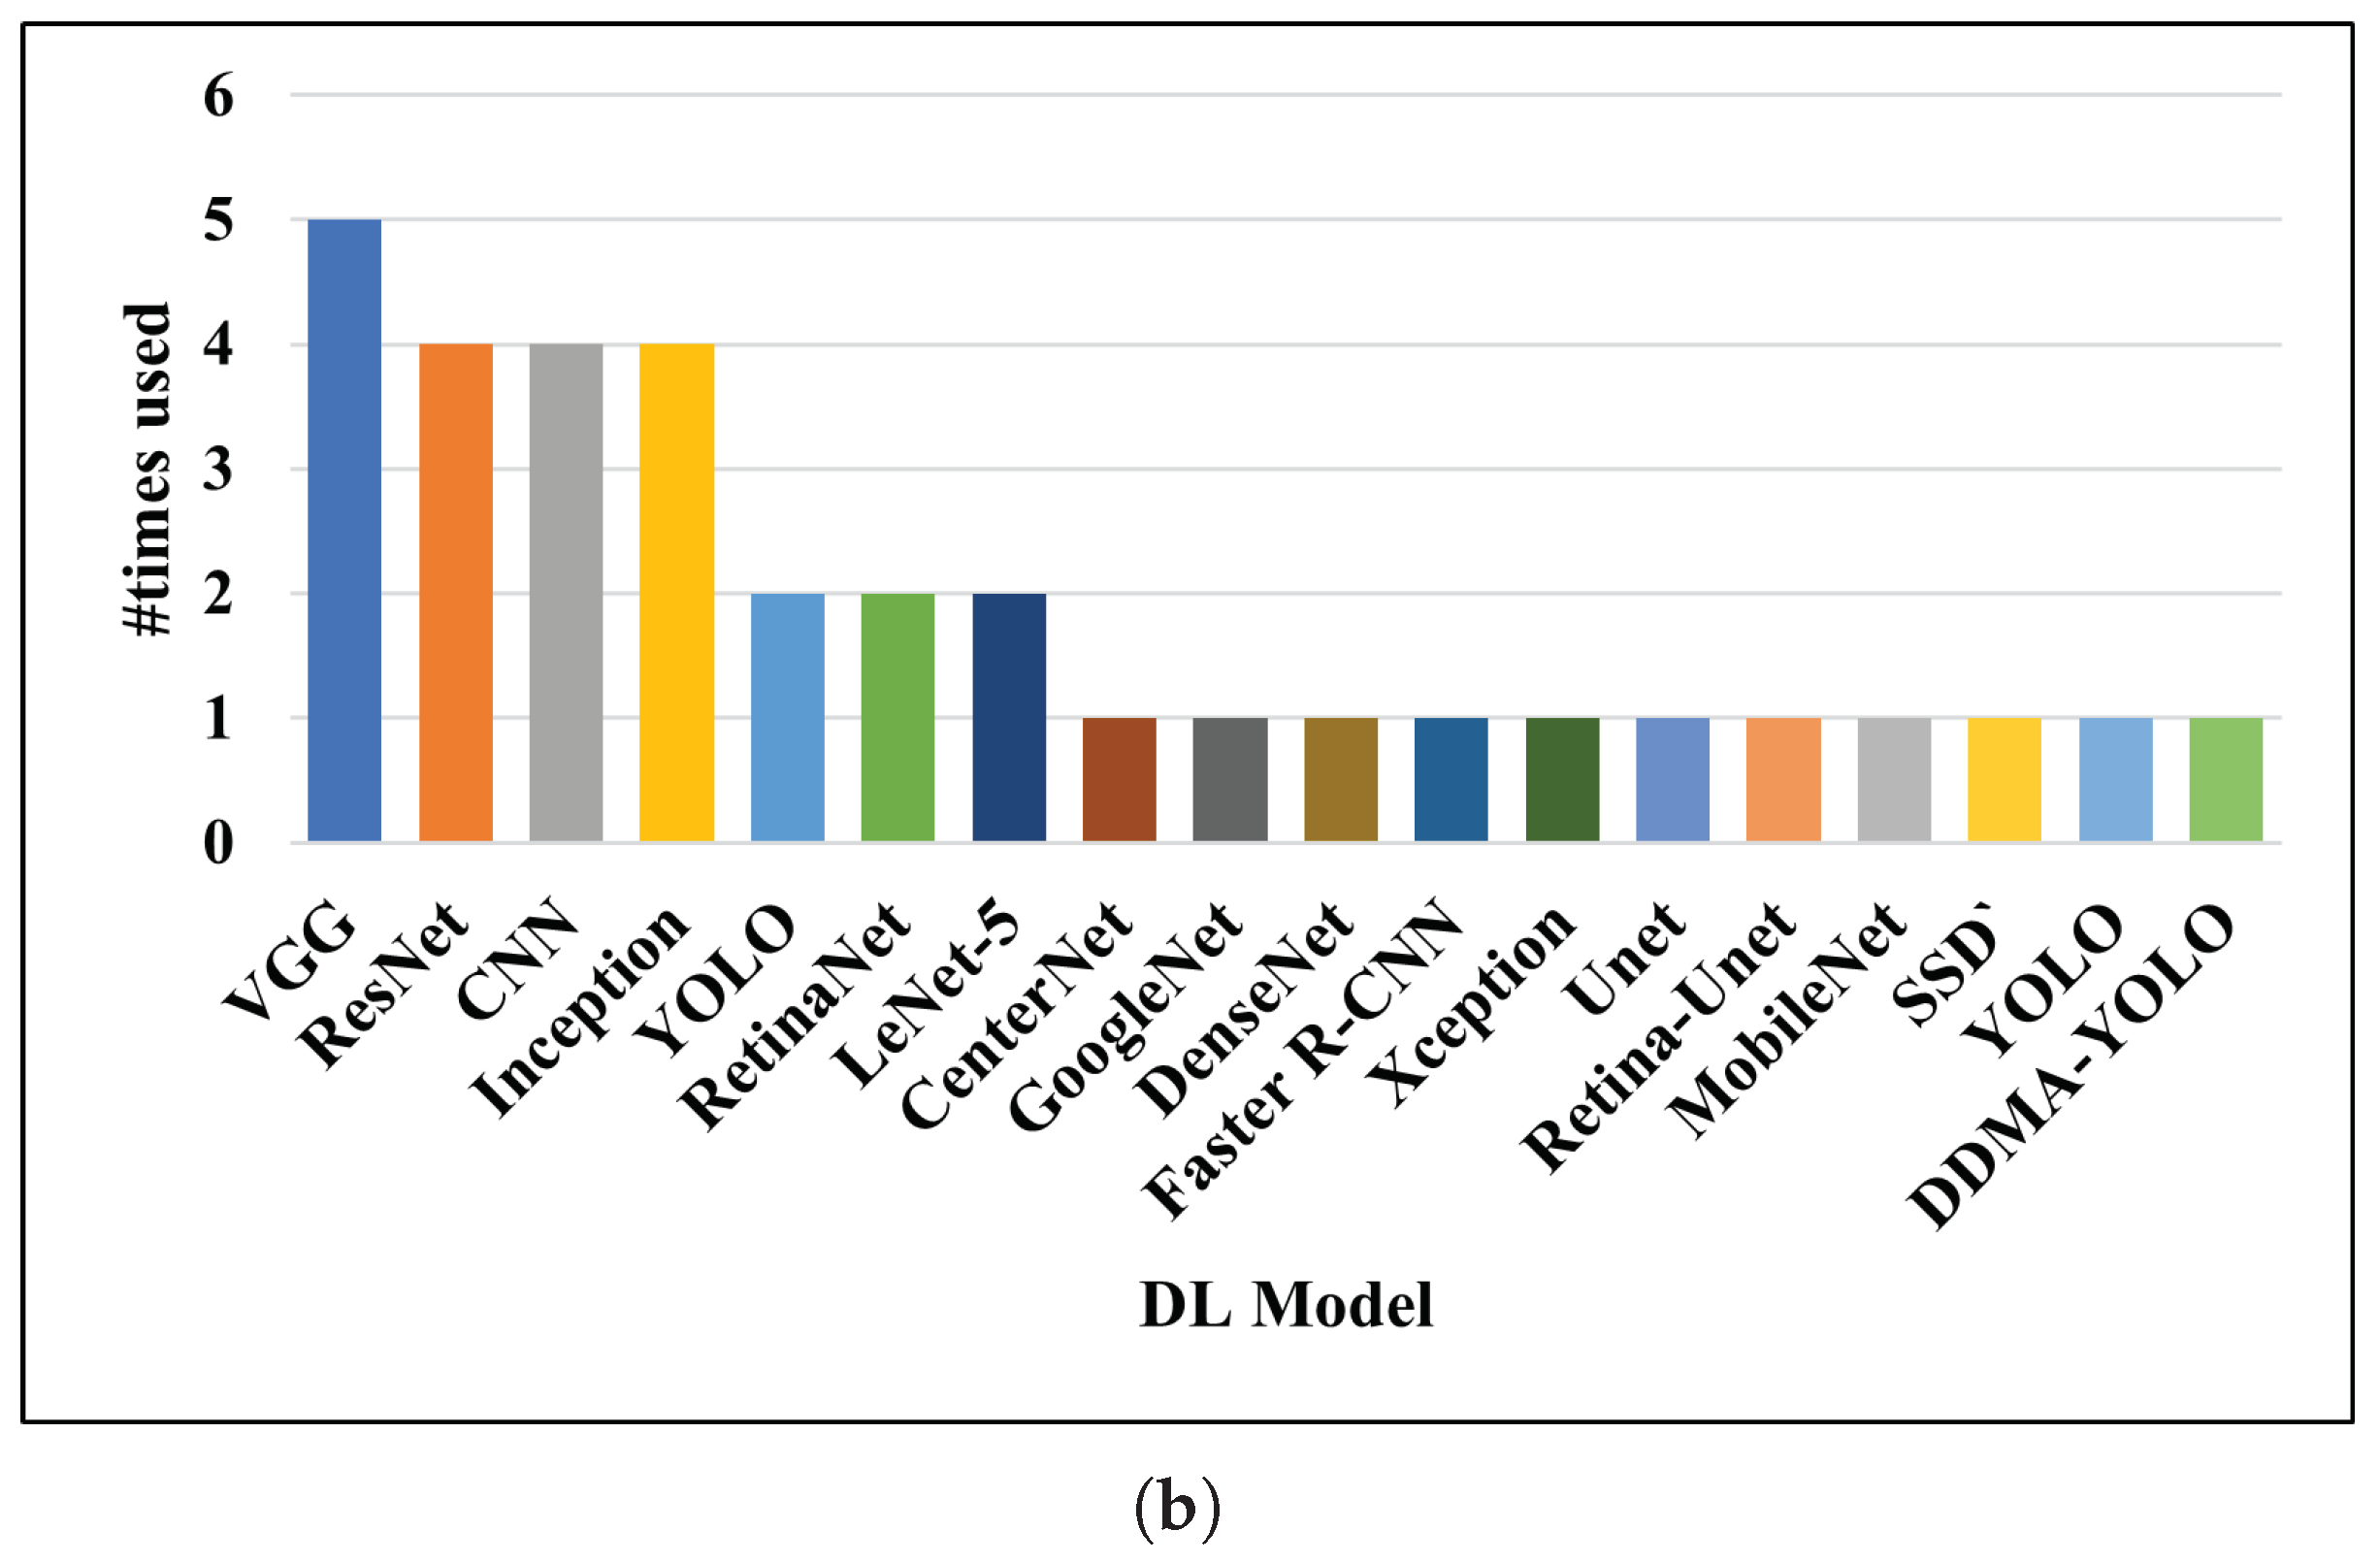
Due to the availability of a large amount of data from various imaging sensors and UAVs, data-driven methods such as conventional ML and DL have shown promising results for crop disease estimation compared to traditional ST-based methods. Nevertheless, these results come with the aid of the expert-labeled data required to train the ML and DL models. To look into a research trend on the use of ML and DL, the number of times a particular ML and DL model used in each research work is reported in Figure 10. From Figure 10, it is noticed that SVM is the most popular and most used conventional ML model for crop disease estimation using UAVs, followed by RF, MLP and GBM. Similarly, VGG is the most frequently used DL model, followed by ResNet, CNN, Inception and so on.
When looking into the performance of conventional ML models (refer to Table 4), the accuracies of these ML models for estimating various crop diseases range from 72% to 98% for classification, and their coefficients of determination range from 63% to 88%. The highest accuracy of 98.00% was reported for Fusarium wilt detection in banana, whereas the lowest accuracy of 72.73% was achieved for cotton rot root detection. Since the performances of these ML models are influenced by various parameters such as the sensors used to acquire crop images, the types of crops and diseases (pests or pathogens) consider and the UAV’s flight altitude, it is hard to recommend any particular ML method as a perfect solution over other ML methods. However, it can be concluded that the ML methods in general worked better for crop disease estimation with multispectral and hyperspectral sensors compared to RGB sensors.
Similarly, the accuracies of DL models for crop disease segmentation range from 93% to 97%, and classification ranges from 85% to 100%, which showed that the DL models are more accurate than their counterparts (ML- and ST-based methods) for crop disease detection. However, the DL-based methods are not as straightforward as ML- and ST-based methods as they normally required pre- and post-processing of UAV images to generate disease maps (Figure 6).
5.4. Summary of Findings
We summarize the finding of this survey as follows: (a) the strength of existing works, (b) the current focus and research trends of UAV-based crop disease estimation and (c) the current challenges and their possible solutions. The development of UAV platforms and sensors is rapidly changing the paradigm of crop disease detection with the aid of ML and DL methods. It can be seen from the survey that RGB sensors are largely used for crop disease estimation using DL methods, which shows the changing trend of using low-cost sensors in place of high-cost sensors such as HS and MS. Similarly, while considering the performance of crop disease estimation methods, DL methods with high accuracy have emerged as a promising solution over the traditional ST-based and ML-based methods. Furthermore, the meta-analysis of the existing literature revealed that crop diseases caused by fungi (fungal diseases) are the most investigated diseases using UAV-based remote sensing compared to other crop diseases such as those caused by bacteria, viruses and pests. Owing to the success of advanced DL-based models for crop disease estimation using UAV technology, we detail the following challenges and possible strategies as future avenues of research:
- (i)
- The UAV sensing systems’ parameters, such as flight altitude, payloads and sensors (for image acquisition), affect the performance of crop disease estimations. For instance, small UAVs have a limited payload, which prevents their use for large-scale crop disease estimations. Hence, further research and development are expected towards low-cost sensing technology with higher payloads. In addition, image resolution is critical while using DL models, where high-spatial-resolution images can be obtained by flying the UAV at a low altitude or using other up-sampling techniques.
- (ii)
- The promising results on crop disease estimation using DL models show the possibility for the further expansion of DL models to various crop disease detection tasks. However, the main challenge associated with such models is the scarcity of labeled data. It is quite expensive to label the UAV-acquired images with corresponding disease labels, as it requires the involvement of crop disease experts. However, unsupervised or semi-supervised techniques might be developed in the near future.
- (iii)
- When choosing to use conventional ML as well as DL models for crop disease detection, it is hard to make a decision among the existing DL architectures, as they have produced different levels of accuracy in different works. It would be interesting to develop a benchmark dataset for various crop diseases so that various DL models can be benchmarked and compared for better performance considerations.
- (iv)
- Since DL-based methods require high computational resources, it is essential to work towards light-weight DL models which can be easily simulated on edge computing platforms such as the IoT.
6. Conclusions
In this survey, a systematic review and meta-analysis of existing works on crop disease estimation using UAVs is performed by providing a taxonomy which categorizes the crop disease estimation methods used in the existing literature into three broad groups: ST-based, conventional ML-based and DL-based. Using such a detailed taxonomy for crop disease estimation, we compare and contrast the impact of the UAV platforms and sensors for crop disease estimation, while conventional ML and DL methods are used for data analysis. Then, the performance of ML and DL methods for crop disease estimation using UAVs are reported and compared with the traditional ST-based methods. The survey results reveal that the multispectral sensors are widely utilized by ST-based methods and ML-based methods, whereas RGB sensors are preferred by DL-based methods. On average, for the majority of the works, the DL-based methods provided the highest accuracy for crop disease estimation, followed by ML- and ST-based methods.
To sum up, this review demystifies the use of various UAV platforms, sensors and data analysis techniques for the UAV-based remote sensing of crop diseases by providing a detailed taxonomy and meta-analysis of the existing literature. It also presents challenges, opportunities and possible research directions on drone-based remote sensing for crop disease estimation. Needless to say, the DL-based models are the most successful in UAV-based crop disease estimation compared with the ML- and ST-based methods. Nevertheless, the DL models are more like a black box and will require sufficient attention to address their transparency and explainability, which will ultimately build trust in them and increase their reliability. An emerging challenge seems to be exploring the possibility of combining the various modalities of remote sensing data for crop disease detection. Another direction is to develop light-weight DL models so that they can be easily simulated on edge computing platforms such as the IoT.
Author Contributions
Conceptualization, T.B.S.; methodology, T.B.S.; data curation, T.B.S.; writing—original draft preparation, T.B.S.; writing—review and editing, T.B.S.; A.N., C.-Y.X. and W.G.; visualization, T.B.S.; supervision, A.N., C.-Y.X. and W.G. All authors have read and agreed to the published version of the manuscript.
Funding
This research received no external funding.
Acknowledgments
The authors would like to acknowledge the Research Training Program (RTP) scholarship funded by the Australian Government and the support and resources provided by CQUniversity. We also express our thankful words to Ram Khadka (Scientist—Plant Pathology, Nepal Agricultural Research Council) for his expert feedback on crop diseases.
Conflicts of Interest
The authors declare no conflict of interest.
Abbreviations
The following abbreviations are used in this manuscript:
| ANN | Artificial neural network |
| BPNN | Back propagation neural network |
| CNN | Convolutional neural network |
| DL | Deep learning |
| DT | Decision tree |
| DSM | Digital surface model |
| DL | Deep learning |
| DCNN | Deep convolution neural network |
| FCN | Fully connected neural network |
| GPS | Geographical positioning system |
| GBM | Gradient boosting machine |
| GLM | Generalized linear models |
| ISODATA | Iterative self organizing data analysis technique |
| IoT | Internet of things |
| IoU | Intersection of union |
| KNN | K-nearest neighbor |
| LR | Linear regression |
| LDA | Linear discriminant analysis |
| mAP | Mean average precision |
| MLP | Multi-layer perceptron |
| ML | Machine learning |
| MLR | Multiple linear regression |
| NB | Naive Bayes |
| PLSR | Partial least square regression |
| PA | Precision agriculture |
| QDA | Quadratic discriminant analysis |
| RF | Random forest |
| ROI | Region of interest |
| SVM | Support vector machine |
| UAV | Unmanned aerial vehicle |
| VI | Vegetation index |
| VGG | Visual geometry group |
| XGBoost | eXtreme gradient boosting |
References
- Suzuki, N.; Rivero, R.M.; Shulaev, V.; Blumwald, E.; Mittler, R. Abiotic and biotic stress combinations. New Phytol. 2014, 203, 32–43. [Google Scholar] [CrossRef] [PubMed]
- Khakimov, A.; Salakhutdinov, I.; Omolikov, A.; Utaganov, S. Traditional and current-prospective methods of agricultural plant diseases detection: A review. In Proceedings of the IOP Conference Series: Earth and Environmental Science; IOP Publishing: Bristol, UK, 2022; Volume 951, p. 012002. [Google Scholar]
- Kalischuk, M.; Paret, M.L.; Freeman, J.H.; Raj, D.; Da Silva, S.; Eubanks, S.; Wiggins, D.; Lollar, M.; Marois, J.J.; Mellinger, H.C.; et al. An improved crop scouting technique incorporating unmanned aerial vehicle–assisted multispectral crop imaging into conventional scouting practice for gummy stem blight in watermelon. Plant Dis. 2019, 103, 1642–1650. [Google Scholar] [CrossRef] [PubMed]
- Wang, Y.M.; Ostendorf, B.; Gautam, D.; Habili, N.; Pagay, V. Plant Viral Disease Detection: From Molecular Diagnosis to Optical Sensing Technology—A Multidisciplinary Review. Remote Sens. 2022, 14, 1542. [Google Scholar] [CrossRef]
- Singh, V.; Sharma, N.; Singh, S. A review of imaging techniques for plant disease detection. Artif. Intell. Agric. 2020, 4, 229–242. [Google Scholar] [CrossRef]
- Usha, K.; Singh, B. Potential applications of remote sensing in horticulture—A review. Sci. Hortic. 2013, 153, 71–83. [Google Scholar] [CrossRef]
- de Castro, A.I.; Ehsani, R.; Ploetz, R.C.; Crane, J.H.; Buchanon, S. Detection of laurel wilt disease in avocado using low altitude aerial imaging. PLoS ONE 2015, 10, e0124642. [Google Scholar] [CrossRef] [PubMed]
- Sarkar, S.; Ramsey, A.F.; Cazenave, A.B.; Balota, M. Peanut leaf wilting estimation from RGB color indices and logistic models. Front. Plant Sci. 2021, 12, 713. [Google Scholar] [CrossRef] [PubMed]
- Su, J.; Zhu, X.; Li, S.; Chen, W.H. AI meets UAVs: A survey on AI empowered UAV perception systems for precision agriculture. Neurocomputing 2023, 518, 242–270. [Google Scholar] [CrossRef]
- Radoglou-Grammatikis, P.; Sarigiannidis, P.; Lagkas, T.; Moscholios, I. A compilation of UAV applications for precision agriculture. Comput. Netw. 2020, 172, 107148. [Google Scholar] [CrossRef]
- Terentev, A.; Dolzhenko, V.; Fedotov, A.; Eremenko, D. Current state of hyperspectral remote sensing for early plant disease detection: A review. Sensors 2022, 22, 757. [Google Scholar] [CrossRef]
- Tsouros, D.C.; Bibi, S.; Sarigiannidis, P.G. A review on UAV-based applications for precision agriculture. Information 2019, 10, 349. [Google Scholar] [CrossRef]
- García-Martínez, H.; Flores-Magdaleno, H.; Ascencio-Hernández, R.; Khalil-Gardezi, A.; Tijerina-Chávez, L.; Mancilla-Villa, O.R.; Vázquez-Peña, M.A. Corn grain yield estimation from vegetation indices, canopy cover, plant density, and a neural network using multispectral and RGB images acquired with unmanned aerial vehicles. Agriculture 2020, 10, 277. [Google Scholar] [CrossRef]
- Yang, Q.; Shi, L.; Lin, L. Plot-scale rice grain yield estimation using UAV-based remotely sensed images via CNN with time-invariant deep features decomposition. In Proceedings of the IGARSS 2019–2019 IEEE International Geoscience and Remote Sensing Symposium, Yokohama, Japan, 28 July–2 August 2019; pp. 7180–7183. [Google Scholar]
- Maes, W.H.; Steppe, K. Perspectives for remote sensing with unmanned aerial vehicles in precision agriculture. Trends Plant Sci. 2019, 24, 152–164. [Google Scholar] [CrossRef] [PubMed]
- Guo, A.; Huang, W.; Dong, Y.; Ye, H.; Ma, H.; Liu, B.; Wu, W.; Ren, Y.; Ruan, C.; Geng, Y. Wheat yellow rust detection using UAV-based hyperspectral technology. Remote Sens. 2021, 13, 123. [Google Scholar] [CrossRef]
- Patrick, A.; Pelham, S.; Culbreath, A.; Holbrook, C.C.; De Godoy, I.J.; Li, C. High throughput phenotyping of tomato spot wilt disease in peanuts using unmanned aerial systems and multispectral imaging. IEEE Instrum. Meas. Mag. 2017, 20, 4–12. [Google Scholar] [CrossRef]
- Xu, R.; Li, C.; Paterson, A.H. Multispectral imaging and unmanned aerial systems for cotton plant phenotyping. PLoS ONE 2019, 14, e0205083. [Google Scholar] [CrossRef]
- Bhandari, M.; Shahi, T.B.; Neupane, A.; Walsh, K.B. BotanicX-AI: Identification of Tomato Leaf Diseases Using an Explanation-Driven Deep-Learning Model. J. Imaging 2023, 9, 53. [Google Scholar] [CrossRef]
- Abdulridha, J.; Ampatzidis, Y.; Qureshi, J.; Roberts, P. Laboratory and UAV-based identification and classification of tomato yellow leaf curl, bacterial spot, and target spot diseases in tomato utilizing hyperspectral imaging and machine learning. Remote Sens. 2020, 12, 2732. [Google Scholar] [CrossRef]
- Su, J.; Liu, C.; Coombes, M.; Hu, X.; Wang, C.; Xu, X.; Li, Q.; Guo, L.; Chen, W.H. Wheat yellow rust monitoring by learning from multispectral UAV aerial imagery. Comput. Electron. Agric. 2018, 155, 157–166. [Google Scholar] [CrossRef]
- Barbedo, J.G.A. A review on the use of unmanned aerial vehicles and imaging sensors for monitoring and assessing plant stresses. Drones 2019, 3, 40. [Google Scholar] [CrossRef]
- Neupane, K.; Baysal-Gurel, F. Automatic identification and monitoring of plant diseases using unmanned aerial vehicles: A review. Remote Sens. 2021, 13, 3841. [Google Scholar] [CrossRef]
- Bouguettaya, A.; Zarzour, H.; Kechida, A.; Taberkit, A.M. Recent Advances on UAV and Deep Learning for Early Crop Diseases Identification: A Short Review. In Proceedings of the 2021 International Conference on Information Technology (ICIT), Amman, Jordan, 14–15 July 2021; pp. 334–339. [Google Scholar]
- Bouguettaya, A.; Zarzour, H.; Kechida, A.; Taberkit, A.M. Deep learning techniques to classify agricultural crops through UAV imagery: A review. Neural Comput. Appl. 2022, 34, 9511–9536. [Google Scholar] [CrossRef] [PubMed]
- Bouguettaya, A.; Zarzour, H.; Kechida, A.; Taberkit, A.M. A survey on deep learning-based identification of plant and crop diseases from UAV-based aerial images. Cluster Comput. 2022, 26, 1297–1317. [Google Scholar] [CrossRef] [PubMed]
- Kuswidiyanto, L.W.; Noh, H.H.; Han, X. Plant Disease Diagnosis Using Deep Learning Based on Aerial Hyperspectral Images: A Review. Remote Sens. 2022, 14, 6031. [Google Scholar] [CrossRef]
- Messina, G.; Modica, G. Applications of UAV thermal imagery in precision agriculture: State of the art and future research outlook. Remote Sens. 2020, 12, 1491. [Google Scholar] [CrossRef]
- Page, M.J.; McKenzie, J.E.; Bossuyt, P.M.; Boutron, I.; Hoffmann, T.C.; Mulrow, C.D.; Shamseer, L.; Tetzlaff, J.M.; Akl, E.A.; Brennan, S.E.; et al. The PRISMA 2020 statement: An updated guideline for reporting systematic reviews. Int. J. Surg. 2021, 88, 105906. [Google Scholar] [CrossRef]
- Muruganantham, P.; Wibowo, S.; Grandhi, S.; Samrat, N.H.; Islam, N. A systematic literature review on crop yield prediction with deep learning and remote sensing. Remote Sens. 2022, 14, 1990. [Google Scholar] [CrossRef]
- Awange, J.L.; Kiema, J.B.K. Fundamentals of remote sensing. In Environmental Geoinformatics; Springer: Berlin/Heidelberg, Germany, 2013; pp. 111–118. [Google Scholar]
- Chen, C.J.; Huang, Y.Y.; Li, Y.S.; Chen, Y.C.; Chang, C.Y.; Huang, Y.M. Identification of fruit tree pests with deep learning on embedded drone to achieve accurate pesticide spraying. IEEE Access 2021, 9, 21986–21997. [Google Scholar] [CrossRef]
- Geipel, J.; Link, J.; Claupein, W. Combined spectral and spatial modeling of corn yield based on aerial images and crop surface models acquired with an unmanned aircraft system. Remote Sens. 2014, 6, 10335–10355. [Google Scholar] [CrossRef]
- Albornoz, C.; Giraldo, L.F. Trajectory design for efficient crop irrigation with a UAV. In Proceedings of the 2017 IEEE 3rd Colombian Conference on Automatic Control (CCAC), Indias, Colombia, 18–20 October 2017; pp. 1–6. [Google Scholar]
- Gonzalez-Dugo, V.; Zarco-Tejada, P.; Nicolás, E.; Nortes, P.A.; Alarcón, J.; Intrigliolo, D.S.; Fereres, E. Using high resolution UAV thermal imagery to assess the variability in the water status of five fruit tree species within a commercial orchard. Precis. Agric. 2013, 14, 660–678. [Google Scholar] [CrossRef]
- Mulla, D.J. Twenty five years of remote sensing in precision agriculture: Key advances and remaining knowledge gaps. Biosyst. Eng. 2013, 114, 358–371. [Google Scholar] [CrossRef]
- Huang, Y.; Reddy, K.N.; Fletcher, R.S.; Pennington, D. UAV low-altitude remote sensing for precision weed management. Weed Technol. 2018, 32, 2–6. [Google Scholar] [CrossRef]
- Panday, U.S.; Shrestha, N.; Maharjan, S.; Pratihast, A.K.; Shahnawaz; Shrestha, K.L.; Aryal, J. Correlating the plant height of wheat with above-ground biomass and crop yield using drone imagery and crop surface model, a case study from Nepal. Drones 2020, 4, 28. [Google Scholar] [CrossRef]
- Ballester, C.; Brinkhoff, J.; Quayle, W.C.; Hornbuckle, J. Monitoring the effects of water stress in cotton using the green red vegetation index and red edge ratio. Remote Sens. 2019, 11, 873. [Google Scholar] [CrossRef]
- Shahi, T.B.; Xu, C.Y.; Neupane, A.; Guo, W. Machine learning methods for precision agriculture with UAV imagery: A review. Electron. Res. Arch. 2022, 30, 4277–4317. [Google Scholar] [CrossRef]
- Cai, G.; Dias, J.; Seneviratne, L. A survey of small-scale unmanned aerial vehicles: Recent advances and future development trends. Unmanned Syst. 2014, 2, 175–199. [Google Scholar] [CrossRef]
- Mogili, U.R.; Deepak, B. Review on application of drone systems in precision agriculture. Procedia Comput. Sci. 2018, 133, 502–509. [Google Scholar] [CrossRef]
- Adão, T.; Hruška, J.; Pádua, L.; Bessa, J.; Peres, E.; Morais, R.; Sousa, J.J. Hyperspectral imaging: A review on UAV-based sensors, data processing and applications for agriculture and forestry. Remote Sens. 2017, 9, 1110. [Google Scholar] [CrossRef]
- Huang, S.; Tang, L.; Hupy, J.P.; Wang, Y.; Shao, G. A commentary review on the use of normalized difference vegetation index (NDVI) in the era of popular remote sensing. J. For. Res. 2021, 32, 1–6. [Google Scholar] [CrossRef]
- Sanseechan, P.; Saengprachathanarug, K.; Posom, J.; Wongpichet, S.; Chea, C.; Wongphati, M. Use of vegetation indices in monitoring sugarcane white leaf disease symptoms in sugarcane field using multispectral UAV aerial imagery. In Proceedings of the IOP Conference Series: Earth and Environmental Science; IOP Publishing: Bristol, UK, 2019; Volume 301, p. 012025. [Google Scholar]
- Kauth, R.J.; Thomas, G. The tasselled cap–a graphic description of the spectral-temporal development of agricultural crops as seen by Landsat. In Proceedings of the LARS Symposia, West Lafayette, IN, USA, 29 June–1 July 1976; p. 159. [Google Scholar]
- Cao, X.; Luo, Y.; Zhou, Y.; Fan, J.; Xu, X.; West, J.S.; Duan, X.; Cheng, D. Detection of powdery mildew in two winter wheat plant densities and prediction of grain yield using canopy hyperspectral reflectance. PLoS ONE 2015, 10, e0121462. [Google Scholar] [CrossRef]
- Lu, N.; Zhou, J.; Han, Z.; Li, D.; Cao, Q.; Yao, X.; Tian, Y.; Zhu, Y.; Cao, W.; Cheng, T. Improved estimation of aboveground biomass in wheat from RGB imagery and point cloud data acquired with a low-cost unmanned aerial vehicle system. Plant Methods 2019, 15, 1–16. [Google Scholar] [CrossRef] [PubMed]
- Phadikar, S.; Goswami, J. Vegetation indices based segmentation for automatic classification of brown spot and blast diseases of rice. In Proceedings of the 2016 3rd International Conference on Recent Advances in Information Technology (RAIT), Dhanbad, India, 3–5 March 2016; pp. 284–289. [Google Scholar]
- Chang, A.; Yeom, J.; Jung, J.; Landivar, J. Comparison of canopy shape and vegetation indices of citrus trees derived from UAV multispectral images for characterization of citrus greening disease. Remote Sens. 2020, 12, 4122. [Google Scholar] [CrossRef]
- Bhandari, M.; Ibrahim, A.M.; Xue, Q.; Jung, J.; Chang, A.; Rudd, J.C.; Maeda, M.; Rajan, N.; Neely, H.; Landivar, J. Assessing winter wheat foliage disease severity using aerial imagery acquired from small Unmanned Aerial Vehicle (UAV). Comput. Electron. Agric. 2020, 176, 105665. [Google Scholar] [CrossRef]
- Shahi, T.B.; Shrestha, A.; Neupane, A.; Guo, W. Stock price forecasting with deep learning: A comparative study. Mathematics 2020, 8, 1441. [Google Scholar] [CrossRef]
- Shahi, T.B.; Sitaula, C. Natural language processing for Nepali text: A review. Artif. Intell. Rev. 2022, 55, 3401–3429. [Google Scholar] [CrossRef]
- Bhandari, M.; Shahi, T.B.; Siku, B.; Neupane, A. Explanatory classification of CXR images into COVID-19, Pneumonia and Tuberculosis using deep learning and XAI. Comput. Biol. Med. 2022, 150, 106156. [Google Scholar] [CrossRef]
- Shahi, T.B.; Sitaula, C.; Neupane, A.; Guo, W. Fruit classification using attention-based MobileNetV2 for industrial applications. PLoS ONE 2022, 17, e0264586. [Google Scholar] [CrossRef]
- Tao, W.; Wang, X.; Xue, J.H.; Su, W.; Zhang, M.; Yin, D.; Zhu, D.; Xie, Z.; Zhang, Y. Monitoring the damage of armyworm as a pest in summer corn by unmanned aerial vehicle imaging. Pest Manag. Sci. 2022, 78, 2265–2276. [Google Scholar] [CrossRef]
- Zhang, S.; Li, X.; Ba, Y.; Lyu, X.; Zhang, M.; Li, M. Banana Fusarium Wilt Disease Detection by Supervised and Unsupervised Methods from UAV-Based Multispectral Imagery. Remote Sens. 2022, 14, 1231. [Google Scholar] [CrossRef]
- Ye, H.; Huang, W.; Huang, S.; Cui, B.; Dong, Y.; Guo, A.; Ren, Y.; Jin, Y. Identification of banana fusarium wilt using supervised classification algorithms with UAV-based multi-spectral imagery. Int. J. Agric. Biol. Eng. 2020, 13, 136–142. [Google Scholar] [CrossRef]
- Liu, L.; Dong, Y.; Huang, W.; Du, X.; Ma, H. Monitoring wheat fusarium head blight using unmanned aerial vehicle hyperspectral imagery. Remote Sens. 2020, 12, 3811. [Google Scholar] [CrossRef]
- Shahi, T.B.; Xu, C.Y.; Neupane, A.; Fleischfresser, D.B.; O’Connor, D.J.; Wright, G.C.; Guo, W. Peanut yield prediction with UAV multispectral imagery using a cooperative machine learning approach. Electron. Res. Arch. 2023, 31, 3343–3361. [Google Scholar] [CrossRef]
- Schmarje, L.; Santarossa, M.; Schröder, S.M.; Koch, R. A survey on semi-, self-and unsupervised learning for image classification. IEEE Access 2021, 9, 82146–82168. [Google Scholar] [CrossRef]
- Wang, T.; Thomasson, J.A.; Yang, C.; Isakeit, T.; Nichols, R.L. Automatic classification of cotton root rot disease based on UAV remote sensing. Remote Sens. 2020, 12, 1310. [Google Scholar] [CrossRef]
- Mishra, B.; Dahal, A.; Luintel, N.; Shahi, T.B.; Panthi, S.; Pariyar, S.; Ghimire, B.R. Methods in the spatial deep learning: Current status and future direction. Spat. Inf. Res. 2022, 30, 18. [Google Scholar] [CrossRef]
- LeCun, Y.; Bengio, Y.; Hinton, G. Deep learning. Nature 2015, 521, 436–444. [Google Scholar] [CrossRef]
- Simonyan, K.; Zisserman, A. Very Deep Convolutional Networks for Large-Scale Image Recognition. In Proceedings of the International Conference on Learning Representations, San Diego, CA, USA, 7–9 May 2015. [Google Scholar]
- Huang, G.; Liu, Z.; Van Der Maaten, L.; Weinberger, K.Q. Densely connected convolutional networks. In Proceedings of the IEEE Conference on Computer Vision and Pattern Recognition, Honolulu, HI, USA, 21–26 July 2017; pp. 4700–4708. [Google Scholar]
- He, K.; Zhang, X.; Ren, S.; Sun, J. Deep residual learning for image recognition. In Proceedings of the IEEE Conference on Computer Vision and Pattern Recognition, Las Vegas, NV, USA, 27–30 June 2016; pp. 770–778. [Google Scholar]
- Szegedy, C.; Liu, W.; Jia, Y.; Sermanet, P.; Reed, S.; Anguelov, D.; Erhan, D.; Vanhoucke, V.; Rabinovich, A. Going deeper with convolutions. In Proceedings of the IEEE Conference on Computer Vision and Pattern Recognition, Boston, MA, USA, 7–12 June 2015; pp. 1–9. [Google Scholar]
- Sitaula, C.; Shahi, T.B.; Aryal, S.; Marzbanrad, F. Fusion of multi-scale bag of deep visual words features of chest X-ray images to detect COVID-19 infection. Sci. Rep. 2021, 11, 1–12. [Google Scholar] [CrossRef]
- Mishra, B.; Shahi, T.B. Deep learning-based framework for spatiotemporal data fusion: An instance of landsat 8 and sentinel 2 NDVI. J. Appl. Remote Sens. 2021, 15, 034520. [Google Scholar] [CrossRef]
- Sitaula, C.; Basnet, A.; Mainali, A.; Shahi, T.B. Deep learning-based methods for sentiment analysis on Nepali COVID-19-related tweets. Comput. Intell. Neurosci. 2021, 2021. [Google Scholar] [CrossRef]
- Zhang, X.; Han, L.; Dong, Y.; Shi, Y.; Huang, W.; Han, L.; González-Moreno, P.; Ma, H.; Ye, H.; Sobeih, T. A deep learning-based approach for automated yellow rust disease detection from high-resolution hyperspectral UAV images. Remote Sens. 2019, 11, 1554. [Google Scholar] [CrossRef]
- Szegedy, C.; Ioffe, S.; Vanhoucke, V.; Alemi, A. Inception-v4, inception-resnet and the impact of residual connections on learning. In Proceedings of the AAAI Conference on Artificial Intelligence, San Francisco, CA, USA, 4–9 February 2017; Volume 31. [Google Scholar]
- Ha, J.G.; Moon, H.; Kwak, J.T.; Hassan, S.I.; Dang, M.; Lee, O.N.; Park, H.Y. Deep convolutional neural network for classifying Fusarium wilt of radish from unmanned aerial vehicles. J. Appl. Remote Sens. 2017, 11, 042621. [Google Scholar] [CrossRef]
- Chollet, F. Xception: Deep learning with depthwise separable convolutions. In Proceedings of the IEEE Conference on Computer Vision and Pattern Recognition, Honolulu, HI, USA, 21–26 July 2017; pp. 1251–1258. [Google Scholar]
- Xue, J.; Su, B. Significant remote sensing vegetation indices: A review of developments and applications. J. Sensors 2017, 2017. [Google Scholar] [CrossRef]
- Shahi, T.B.; Xu, C.Y.; Neupane, A.; Fresser, D.; O’Connor, D.; Wright, G.; Guo, W. A cooperative scheme for late leaf spot estimation in peanut using UAV multispectral images. PLoS ONE 2023, 18, e0282486. [Google Scholar] [CrossRef] [PubMed]
- Sugiura, R.; Tsuda, S.; Tamiya, S.; Itoh, A.; Nishiwaki, K.; Murakami, N.; Shibuya, Y.; Hirafuji, M.; Nuske, S. Field phenotyping system for the assessment of potato late blight resistance using RGB imagery from an unmanned aerial vehicle. Biosyst. Eng. 2016, 148, 1–10. [Google Scholar] [CrossRef]
- Ye, H.; Huang, W.; Huang, S.; Cui, B.; Dong, Y.; Guo, A.; Ren, Y.; Jin, Y. Recognition of banana fusarium wilt based on UAV remote sensing. Remote Sens. 2020, 12, 938. [Google Scholar] [CrossRef]
- Calderón Madrid, R.; Navas Cortés, J.A.; Lucena León, C.; Zarco-Tejada, P.J. High-resolution hyperspectral and thermal imagery acquired from UAV platforms for early detection of Verticillium wilt using fluorescence, temperature and narrow-band indices. In Proceedings of the UAV-based Remote Sensing Methods for Monitoring Vegetation, Cologne, Germany, 11–12 September 2013. [Google Scholar]
- Matese, A.; Baraldi, R.; Berton, A.; Cesaraccio, C.; Di Gennaro, S.F.; Duce, P.; Facini, O.; Mameli, M.G.; Piga, A.; Zaldei, A. Estimation of water stress in grapevines using proximal and remote sensing methods. Remote Sens. 2018, 10, 114. [Google Scholar] [CrossRef]
- Nebiker, S.; Lack, N.; Abächerli, M.; Läderach, S. Light-weight multispectral UAV sensors and their capabilities for predicting grain yield and detecting plant diseases. Int. Arch. Photogramm. Remote Sens. Spat. Inf. Sci. 2016, XLI-B1, 963–970. [Google Scholar]
- Di Gennaro, S.F.; Battiston, E.; Di Marco, S.; Facini, O.; Matese, A.; Nocentini, M.; Palliotti, A.; Mugnai, L. Unmanned Aerial Vehicle (UAV)-based remote sensing to monitor grapevine leaf stripe disease within a vineyard affected by esca complex. Phytopathol. Mediterr. 2016, 55, 262–275. [Google Scholar]
- Heidarian Dehkordi, R.; El Jarroudi, M.; Kouadio, L.; Meersmans, J.; Beyer, M. Monitoring wheat leaf rust and stripe rust in winter wheat using high-resolution UAV-based red-green-blue imagery. Remote Sens. 2020, 12, 3696. [Google Scholar] [CrossRef]
- Ma, H.; Huang, W.; Dong, Y.; Liu, L.; Guo, A. Using UAV-Based Hyperspectral Imagery to Detect Winter Wheat Fusarium Head Blight. Remote Sens. 2021, 13, 3024. [Google Scholar] [CrossRef]
- Xavier, T.W.; Souto, R.N.; Statella, T.; Galbieri, R.; Santos, E.S.; S. Suli, G.; Zeilhofer, P. Identification of Ramularia leaf blight cotton disease infection levels by multispectral, multiscale UAV imagery. Drones 2019, 3, 33. [Google Scholar] [CrossRef]
- Rodriguez, J.; Lizarazo, I.; Prieto, F.; Angulo-Morales, V. Assessment of potato late blight from UAV-based multispectral imagery. Comput. Electron. Agric. 2021, 184, 106061. [Google Scholar] [CrossRef]
- Lizarazo, I.; Rodriguez, J.L.; Cristancho, O.; Olaya, F.; Duarte, M.; Prieto, F. Identification of symptoms related to potato Verticillium wilt from UAV-based multispectral imagery using an ensemble of gradient boosting machines. Smart Agric. Technol. 2023, 3, 100138. [Google Scholar] [CrossRef]
- Zhu, W.; Feng, Z.; Dai, S.; Zhang, P.; Wei, X. Using UAV Multispectral Remote Sensing with Appropriate Spatial Resolution and Machine Learning to Monitor Wheat Scab. Agriculture 2022, 12, 1785. [Google Scholar] [CrossRef]
- Bohnenkamp, D.; Behmann, J.; Mahlein, A.K. In-field detection of yellow rust in wheat on the ground canopy and UAV scale. Remote Sens. 2019, 11, 2495. [Google Scholar] [CrossRef]
- Narmilan, A.; Gonzalez, F.; Salgadoe, A.S.A.; Powell, K. Detection of white leaf disease in sugarcane using machine learning techniques over UAV multispectral images. Drones 2022, 6, 230. [Google Scholar] [CrossRef]
- DadrasJavan, F.; Samadzadegan, F.; Seyed Pourazar, S.H.; Fazeli, H. UAV-based multispectral imagery for fast Citrus Greening detection. J. Plant Dis. Prot. 2019, 126, 307–318. [Google Scholar] [CrossRef]
- Ahmadi, P.; Mansor, S.; Farjad, B.; Ghaderpour, E. Unmanned Aerial Vehicle (UAV)-based remote sensing for early-stage detection of Ganoderma. Remote Sens. 2022, 14, 1239. [Google Scholar] [CrossRef]
- Su, J.; Yi, D.; Su, B.; Mi, Z.; Liu, C.; Hu, X.; Xu, X.; Guo, L.; Chen, W.H. Aerial visual perception in smart farming: Field study of wheat yellow rust monitoring. IEEE Trans. Ind. Inform. 2020, 17, 2242–2249. [Google Scholar] [CrossRef]
- Kerkech, M.; Hafiane, A.; Canals, R. Vine disease detection in UAV multispectral images using optimized image registration and deep learning segmentation approach. Comput. Electron. Agric. 2020, 174, 105446. [Google Scholar] [CrossRef]
- Qian, Q.; Yu, K.; Yadav, P.K.; Dhal, S.; Kalafatis, S.; Thomasson, J.A.; Hardin IV, R.G. Cotton crop disease detection on remotely collected aerial images with deep learning. In Proceedings of the Autonomous Air and Ground Sensing Systems for Agricultural Optimization and Phenotyping VII; SPIE: Bellingham, DC, USA, 2022; Volume 12114, pp. 23–31. [Google Scholar]
- Amarasingam, N.; Gonzalez, F.; Salgadoe, A.S.A.; Sandino, J.; Powell, K. Detection of White Leaf Disease in Sugarcane Crops Using UAV-Derived RGB Imagery with Existing Deep Learning Models. Remote Sens. 2022, 14, 6137. [Google Scholar] [CrossRef]
- Wu, H.; Wiesner-Hanks, T.; Stewart, E.L.; DeChant, C.; Kaczmar, N.; Gore, M.A.; Nelson, R.J.; Lipson, H. Autonomous detection of plant disease symptoms directly from aerial imagery. Plant Phenome J. 2019, 2, 1–9. [Google Scholar] [CrossRef]
- Pan, Q.; Gao, M.; Wu, P.; Yan, J.; Li, S. A deep-learning-based approach for wheat yellow rust disease recognition from unmanned aerial vehicle images. Sensors 2021, 21, 6540. [Google Scholar] [CrossRef]
- Deng, J.; Zhou, H.; Lv, X.; Yang, L.; Shang, J.; Sun, Q.; Zheng, X.; Zhou, C.; Zhao, B.; Wu, J.; et al. Applying convolutional neural networks for detecting wheat stripe rust transmission centers under complex field conditions using RGB-based high spatial resolution images from UAVs. Comput. Electron. Agric. 2022, 200, 107211. [Google Scholar] [CrossRef]
- Oliveira, A.J.; Assis, G.A.; Faria, E.R.; Souza, J.R.; Vivaldini, K.C.; Guizilini, V.; Ramos, F.; Mendes, C.C.; Wolf, D.F. Analysis of nematodes in coffee crops at different altitudes using aerial images. In Proceedings of the 2019 27th European Signal Processing Conference (EUSIPCO), A Coruna, Spain, 2–6 September 2019; pp. 1–5. [Google Scholar]
- Zhang, T.; Xu, Z.; Su, J.; Yang, Z.; Liu, C.; Chen, W.H.; Li, J. Ir-unet: Irregular segmentation u-shape network for wheat yellow rust detection by UAV multispectral imagery. Remote Sens. 2021, 13, 3892. [Google Scholar] [CrossRef]
- Ronneberger, O.; Fischer, P.; Brox, T. U-net: Convolutional networks for biomedical image segmentation. In Proceedings of the Medical Image Computing and Computer-Assisted Intervention—MICCAI 2015: 18th International Conference, Munich, Germany, 5–9 October 2015; Proceedings, Part III 18. Springer: Berlin/Heidelberg, Germany, 2015; pp. 234–241. [Google Scholar]
- Zhang, T.; Yang, Z.; Xu, Z.; Li, J. Wheat yellow rust severity detection by efficient DF-UNet and UAV multispectral imagery. IEEE Sens. J. 2022, 22, 9057–9068. [Google Scholar] [CrossRef]
- Stewart, E.L.; Wiesner-Hanks, T.; Kaczmar, N.; DeChant, C.; Wu, H.; Lipson, H.; Nelson, R.J.; Gore, M.A. Quantitative phenotyping of Northern Leaf Blight in UAV images using deep learning. Remote Sens. 2019, 11, 2209. [Google Scholar] [CrossRef]
- Görlich, F.; Marks, E.; Mahlein, A.K.; König, K.; Lottes, P.; Stachniss, C. Uav-based classification of cercospora leaf spot using rgb images. Drones 2021, 5, 34. [Google Scholar] [CrossRef]
- Shi, Y.; Han, L.; Kleerekoper, A.; Chang, S.; Hu, T. Novel cropdocnet model for automated potato late blight disease detection from unmanned aerial vehicle-based hyperspectral imagery. Remote Sens. 2022, 14, 396. [Google Scholar] [CrossRef]
- Kerkech, M.; Hafiane, A.; Canals, R. VddNet: Vine disease detection network based on multispectral images and depth map. Remote Sens. 2020, 12, 3305. [Google Scholar] [CrossRef]
- Badrinarayanan, V.; Kendall, A.; Cipolla, R. Segnet: A deep convolutional encoder-decoder architecture for image segmentation. IEEE Trans. Pattern Anal. Mach. Intell. 2017, 39, 2481–2495. [Google Scholar] [CrossRef] [PubMed]
- Tetila, E.C.; Machado, B.B.; Menezes, G.K.; Oliveira, A.d.S.; Alvarez, M.; Amorim, W.P.; Belete, N.A.D.S.; Da Silva, G.G.; Pistori, H. Automatic recognition of soybean leaf diseases using UAV images and deep convolutional neural networks. IEEE Geosci. Remote Sens. Lett. 2019, 17, 903–907. [Google Scholar] [CrossRef]
- Ahmad, A.; Aggarwal, V.; Saraswat, D.; El Gamal, A.; Johal, G.S. GeoDLS: A deep learning-based corn disease tracking and location system using RTK geolocated UAS imagery. Remote Sens. 2022, 14, 4140. [Google Scholar] [CrossRef]
- Ishengoma, F.S.; Rai, I.A.; Said, R.N. Identification of maize leaves infected by fall armyworms using UAV-based imagery and convolutional neural networks. Comput. Electron. Agric. 2021, 184, 106124. [Google Scholar] [CrossRef]
- Dang, L.M.; Hassan, S.I.; Suhyeon, I.; kumar Sangaiah, A.; Mehmood, I.; Rho, S.; Seo, S.; Moon, H. UAV based wilt detection system via convolutional neural networks. Sustain. Comput. Inform. Syst. 2020, 28, 100250. [Google Scholar] [CrossRef]
- Russakovsky, O.; Deng, J.; Su, H.; Krause, J.; Satheesh, S.; Ma, S.; Huang, Z.; Karpathy, A.; Khosla, A.; Bernstein, M.; et al. Imagenet large scale visual recognition challenge. Int. J. Comput. Vis. 2015, 115, 211–252. [Google Scholar] [CrossRef]
- Kerkech, M.; Hafiane, A.; Canals, R. Deep leaning approach with colorimetric spaces and vegetation indices for vine diseases detection in UAV images. Comput. Electron. Agric. 2018, 155, 237–243. [Google Scholar] [CrossRef]
- LeCun, Y.; Bottou, L.; Bengio, Y.; Haffner, P. Gradient-based learning applied to document recognition. Proc. IEEE 1998, 86, 2278–2324. [Google Scholar] [CrossRef]
- Huang, H.; Deng, J.; Lan, Y.; Yang, A.; Zhang, L.; Wen, S.; Zhang, H.; Zhang, Y.; Deng, Y. Detection of helminthosporium leaf blotch disease based on UAV imagery. Appl. Sci. 2019, 9, 558. [Google Scholar] [CrossRef]
- Sugiura, R.; Tsuda, S.; Tsuji, H.; Murakami, N. Virus-infected plant detection in potato seed production field by UAV imagery. In Proceedings of the 2018 ASABE Annual International Meeting. American Society of Agricultural and Biological Engineers, Detroit, MI, USA, 29 July–1 August 2018; p. 1. [Google Scholar]
- Selvaraj, M.G.; Vergara, A.; Montenegro, F.; Ruiz, H.A.; Safari, N.; Raymaekers, D.; Ocimati, W.; Ntamwira, J.; Tits, L.; Omondi, A.B.; et al. Detection of banana plants and their major diseases through aerial images and machine learning methods: A case study in DR Congo and Republic of Benin. ISPRS J. Photogramm. Remote Sens. 2020, 169, 110–124. [Google Scholar] [CrossRef]
- Zhao, Z.Q.; Zheng, P.; Xu, S.t.; Wu, X. Object detection with deep learning: A review. IEEE Trans. Neural Netw. Learn. Syst. 2019, 30, 3212–3232. [Google Scholar] [CrossRef] [PubMed]
- Ren, S.; He, K.; Girshick, R.; Sun, J. Faster r-cnn: Towards real-time object detection with region proposal networks. IEEE Trans. Pattern Anal. Mach. Intell. 2015, 39, 1137–1149. [Google Scholar] [CrossRef] [PubMed]
- Butte, S.; Vakanski, A.; Duellman, K.; Wang, H.; Mirkouei, A. Potato crop stress identification in aerial images using deep learning-based object detection. Agron. J. 2021, 113, 3991–4002. [Google Scholar] [CrossRef]
- Zhao, R.; Shi, F. A novel strategy for pest disease detection of Brassica chinensis based on UAV imagery and deep learning. Int. J. Remote Sens. 2022, 43, 7083–7103. [Google Scholar] [CrossRef]
- Bao, W.; Zhu, Z.; Hu, G.; Zhou, X.; Zhang, D.; Yang, X. UAV remote sensing detection of tea leaf blight based on DDMA-YOLO. Comput. Electron. Agric. 2023, 205, 107637. [Google Scholar] [CrossRef]
Figure 1.
A step-wise procedure used to retrieve the articles for systematic review.

Figure 2.
The popular UAVs used in precision agriculture: (a) rotary wing (tri-copter), (b) rotary wing (quadcopter), (c) rotary wing (hexacopter) (d), rotary wing (octocopter), (e) fixed-wing (eBee) and (f) flapping wing (SmartBird) [41].
Figure 2.
The popular UAVs used in precision agriculture: (a) rotary wing (tri-copter), (b) rotary wing (quadcopter), (c) rotary wing (hexacopter) (d), rotary wing (octocopter), (e) fixed-wing (eBee) and (f) flapping wing (SmartBird) [41].

Figure 3.
An illustration of a typical convolutional neural network (CNN).

Figure 4.
A taxonomy of crop disease assessment using UAV-based remote sensing. Note that the elements included in the dotted box represents the image features used in one and/or all branches.
Figure 4.
A taxonomy of crop disease assessment using UAV-based remote sensing. Note that the elements included in the dotted box represents the image features used in one and/or all branches.

Figure 5.
The general pipeline of conventional ML-based crop disease detection using UAV imagery.

Figure 6.
The general pipeline of DL-based crop disease detection using UAV imagery.

Figure 7.
The distribution of existing works (N = 55) based on the methods used for crop disease estimation using UAV imagery. Note that “ST”, “ML” and “DL” represent the statistics-based, conventional machine learning-based and deep learning-based methods, respectively.
Figure 7.
The distribution of existing works (N = 55) based on the methods used for crop disease estimation using UAV imagery. Note that “ST”, “ML” and “DL” represent the statistics-based, conventional machine learning-based and deep learning-based methods, respectively.

Figure 8.
The distribution of existing works based on (a) sensors and (b) flight altitudes used in UAV image acquisition. Note that M-RGB denotes modified RGB sensors.
Figure 8.
The distribution of existing works based on (a) sensors and (b) flight altitudes used in UAV image acquisition. Note that M-RGB denotes modified RGB sensors.

Figure 9.
The distribution of existing works based on (a) crop diseases’ causal agents and (b) crops studied.
Figure 9.
The distribution of existing works based on (a) crop diseases’ causal agents and (b) crops studied.


Figure 10.
The distribution of existing works based on (a) conventional ML-based methods and (b) DL-based methods.
Figure 10.
The distribution of existing works based on (a) conventional ML-based methods and (b) DL-based methods.


Table 1.
Summary of existing survey works on precision agriculture and crop disease estimation using UAV imagery.
Table 1.
Summary of existing survey works on precision agriculture and crop disease estimation using UAV imagery.
| Ref. | Focused Area | Features and Highlights | Limitations and Gaps |
|---|---|---|---|
| [22] | Plant stress monitoring |
|
|
| [23] | Crop disease detection with UAVs |
|
|
| [24] | Early crop disease identification |
|
|
| [26] | UAVs for plant and crop disease detection |
|
|
| [9] | UAVs for precision agriculture |
|
|
| [27] | Aerial HS imaging for crop disease |
|
|
| [28] | UAV thermal imagery for PA |
|
|
Table 2.
An illustrative list of vegetation indices (VI) with their derivation formulas. Note that “R”, “G”, “B”, “NIR” and “RE” denote the red, green, blue, near-infra red and red edge spectral bands, respectively.
Table 2.
An illustrative list of vegetation indices (VI) with their derivation formulas. Note that “R”, “G”, “B”, “NIR” and “RE” denote the red, green, blue, near-infra red and red edge spectral bands, respectively.
| Ref. | Vegetation Index | Formula |
|---|---|---|
| [44] | Normalized difference VI (NDVI) | |
| [45] | Normalized difference red edge VI (NDRE) | |
| [46] | Green VI (GVI) | |
| [47] | Difference VI (DVI) | |
| [48] | Excess Green (ExG) VI | |
| [49] | Green normalized difference VI (GNDVI) | |
| [49] | Soil adjusted VI (SAVI) | |
| [17] | Simple ratio (SR) | |
| [16] | Plant senescence reflectance index (PSRI) | |
| [50] | Chlorophyll Index (CI) | |
| [51] | Green leaf index (GLI) |
Disclaimer/Publisher’s Note: The statements, opinions and data contained in all publications are solely those of the individual author(s) and contributor(s) and not of MDPI and/or the editor(s). MDPI and/or the editor(s) disclaim responsibility for any injury to people or property resulting from any ideas, methods, instructions or products referred to in the content. |
© 2023 by the authors. Licensee MDPI, Basel, Switzerland. This article is an open access article distributed under the terms and conditions of the Creative Commons Attribution (CC BY) license (https://creativecommons.org/licenses/by/4.0/).
Share and Cite
MDPI and ACS Style
Shahi, T.B.; Xu, C.-Y.; Neupane, A.; Guo, W. Recent Advances in Crop Disease Detection Using UAV and Deep Learning Techniques. Remote Sens. 2023, 15, 2450. https://doi.org/10.3390/rs15092450
AMA Style
Shahi TB, Xu C-Y, Neupane A, Guo W. Recent Advances in Crop Disease Detection Using UAV and Deep Learning Techniques. Remote Sensing. 2023; 15(9):2450. https://doi.org/10.3390/rs15092450
Chicago/Turabian StyleShahi, Tej Bahadur, Cheng-Yuan Xu, Arjun Neupane, and William Guo. 2023. "Recent Advances in Crop Disease Detection Using UAV and Deep Learning Techniques" Remote Sensing 15, no. 9: 2450. https://doi.org/10.3390/rs15092450
Note that from the first issue of 2016, this journal uses article numbers instead of page numbers. See further details here.