

NDVI-Based Assessment of Land Degradation Trends in Balochistan, Pakistan, and Analysis of the Drivers

1
Xinjiang Institute of Ecology and Geography Chinese Academy of Sciences, Urumqi 830011, China
2
University of Chinese Academy of Sciences, Beijing 100049, China
3
National Engineering Technology Research Center for Desert-Oasis Ecological Construction, Urumqi 830011, China
*
Author to whom correspondence should be addressed.
Remote Sens. 2023, 15(9), 2388; https://doi.org/10.3390/rs15092388
Submission received: 6 March 2023
/
Revised: 19 April 2023
/
Accepted: 26 April 2023
/
Published: 2 May 2023
Abstract
:Land degradation destroys human habitats, and vegetation is a marker reflecting land degradation. In this article, the Balochistan Province of Pakistan, which has a fragile ecological environment, was selected as a typical case to analyze its land degradation over 21 years. Relevant studies that used the NDVI and remote sensing data to monitor land degradation already existed. Based on the data product of MODIS, this study obtained the spatio-temporal trends of the normalized difference vegetation index (NDVI) changes from 2000 to 2020 using the sen+ Mann–Kendall (MK) test and Hurst index and analyzed the driving factors of land degradation and restoration by employing the multiple stepwise regression method. The residual analysis method was an effective tool for distinguishing between anthropogenic and climatic impacts, given that not all regions have a significant correlation between the NDVI and rainfall. The main climatic drivers of the NDVI were derived based on the Geodetector analysis and stripped of the main climatic factors by residual analysis to explore the influence of anthropogenic factors on the NDVI. The results show the following: (1) Balochistan is dominated by land restoration. Land restoration is mainly dominated by climate as well as both climate and human factors, and land degradation is mainly dominated by climate and human factors. (2) The Geodetector-based study found high correlations between the NDVI and TMP, MAP, AET and PET, complementing most previous residual analyses that considered only precipitation and temperature. In Balochistan, TMP, AET, PET and MAP were the dominant climatic factors affecting the spatial distribution of the NDVI; TMP with MAP and TMP with AET were the main interactive factors in the spatial distribution of the NDVI. (3) The article quantifies the impact of the anthropogenic drivers on land degradation. Human activities positively influenced the NDVI in 91.02% of the area and negatively influenced it in 8.98% of the area. (4) The overall trend of the NDVI was mainly stable, with stronger improvement than degradation, and showed strong persistence. The above findings enrich our understanding of the climatic impacts of land degradation and human impacts in arid or semi-arid regions and provide a scientific basis for ecological engineering to achieve ecological conservation and quality development in Balochistan, Pakistan.
1. Introduction
Land degradation is a global development and environmental issue identified by the United Nations Convention to Combat Desertification (UNCCD) and the United Nations (UN) [1,2]. Over the past three decades, 30% of the world’s land, including 33% of grasslands, 25% of croplands, and 23% of forest lands, has experienced land degradation, with nearly 1.5 billion people suffering from the effects, and an annual cost of approximately USD 300 billion [3]. The UNCCD stated in 2015 that the effects and progress of work toward meeting land degradation neutrality, according to the 2030 Agenda for Sustainable Development and the Sustainable Development Goals (SDGs), would be monitored and assessed [4]. Therefore, a quantitative assessment of the characteristics and trends of land degradation and a discussion of the relationship between the driving factors of climate and human activities and vegetation cover change has received more attention in recent years and serves as the basis for evaluating the realization of SDG 15.3 [5,6].
The normalized difference vegetation index (NDVI) is widely used to study the spatio-temporal evolution trends of vegetation cover because it can eliminate most of the radiation errors caused by instrument calibration, solar angles, terrains, cloud shadows and other factors, giving it strong vegetation response ability [7,8,9,10,11]. Relevant studies show that hydrothermal conditions and vegetation types differ in different regions. There are also large spatial differences in vegetation changes and responses to climate change [12,13]. Surface vegetation is an important part of the terrestrial ecosystem and an important factor affecting the quality of the ecological environment [14]. The impact of increasing human activities on vegetation cannot be ignored [15]. Especially in the 21st century, the positive effects of human activities, such as land use, industrial and agricultural development, soil and water conservation, and vegetation construction on the environment, have been particularly prominent [16,17,18,19,20]. Thomas et al. used vegetation index data to assess a statistical and ecological framework for land degradation and desertification, reviewed the development of desertification assessment techniques as a multi-temporal analysis, and suggested future research directions [21]. Huang et al. assessed the land degradation dynamics using a normalized index (NDVI) time series based on the Theil-Sen slope and MK test in three northern protection forest areas and found that the NDVI in the study area mainly showed an increasing trend [10]. Yi and Wang et al. used MODIS NDVI time-series data to analyze the spatial and temporal characteristics of vegetation in the middle reaches of the Yangtze River from 1999 to 2015 by methods such as trend analysis and found that the NDVI increased from 1999 to 2015 and nearly two-thirds of the vegetation showed a significant improvement trend during this period [14]. In terms of the research methods for determining the relationship between climate and human activities, Wessels et al. found that the residual analysis method was effective in controlling the impact of rainfall and evaluating land degradation caused by human activities when estimating the vegetation yield in South Africa [22]. On the other hand, Quyet et al. used annual rainfall and temperature time-series data as well as the stepwise trend correlation and residual trend analysis method to distinguish regions of biomass decline caused by human activities and climate and analyze the types of ecological degradation [23]. On this basis, they proposed that the development of land degradation control policies should be targeted at specific regional strategies [23]. Eckert et al. found that the MODIS NDVI satellite time-series data can detect areas of vegetation change and identify land degradation and regeneration in Mongolia [11]. Evans et al. distinguished between climatic- and human-induced dryland degradation techniques using residual analysis methods based on AVHRR NDVI and precipitation data and found that the reduction in green biomass, identified in the AVHRR time series (precipitation-corrected), closely matched the overall picture of the overgrazed and degraded areas identified by the Syrian Ministry of Agriculture in its field survey [24]. In order to improve our understanding of the dynamic change process of land degradation, one effective method is to analyze the comprehensive effect of the anthropogenic factors on land degradation by excluding the influence of climate factors, considering that climate factors are difficult to change in a short time [19]. Through reviewing the previous literature, it was found that the data accuracy of some studies is not high, and only considers the correlation between the NDVI and rainfall and does not quantitatively express the driving factors of land degradation.
Balochistan Province is the largest administrative region in Pakistan, with 43% of the total land area of the country [25]. It has very little rainfall [26], which makes it one of the regions vulnerable to drought, which causes the most serious land degradation. In recent years, under the influence of climate change and human activities, the climatic and human factors affecting the vegetation cover and ecological environment change in Balochistan—an important hub of natural resources in Pakistan [25]—and the degree of their impact are still lacking quantitative evidence. Therefore, based on the Sen+mk test, stepwise multiple regression, Geodetector, residual analysis, and the Hurst index, in this study, we clarified the spatio-temporal characteristics of the vegetation difference normalization index (NDVI) in Balochistan Province from 2000 to 2020, and determined and quantified the driving factors of climate and human activities and the spatial distribution of the contributions to the NDVI change. On this basis, the future trend of regional land degradation was predicted. This not only contributes to a comprehensive understanding of the characteristics of Balochistan’s ecosystem evolution, but it is also important for formulating regional ecological and environmental protection policies to serve the global 2030 Sustainable Development Goals.
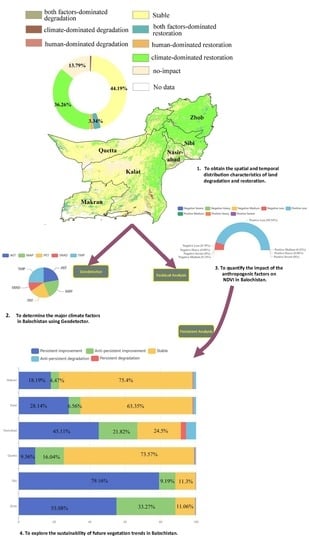
The objectives of this paper are as follows:
- To obtain the spatial and temporal distribution characteristics of land degradation and restoration in Balochistan province based on multiple regression analysis.
- To determine the major climate factors in Balochistan using Geodetector.
- Quantifying the impact of the anthropogenic factors on NDVI in Balochistan.
- To explore the sustainability of future vegetation trends in Balochistan.
2. Materials and Methods
2.1. Overview of the Study Area
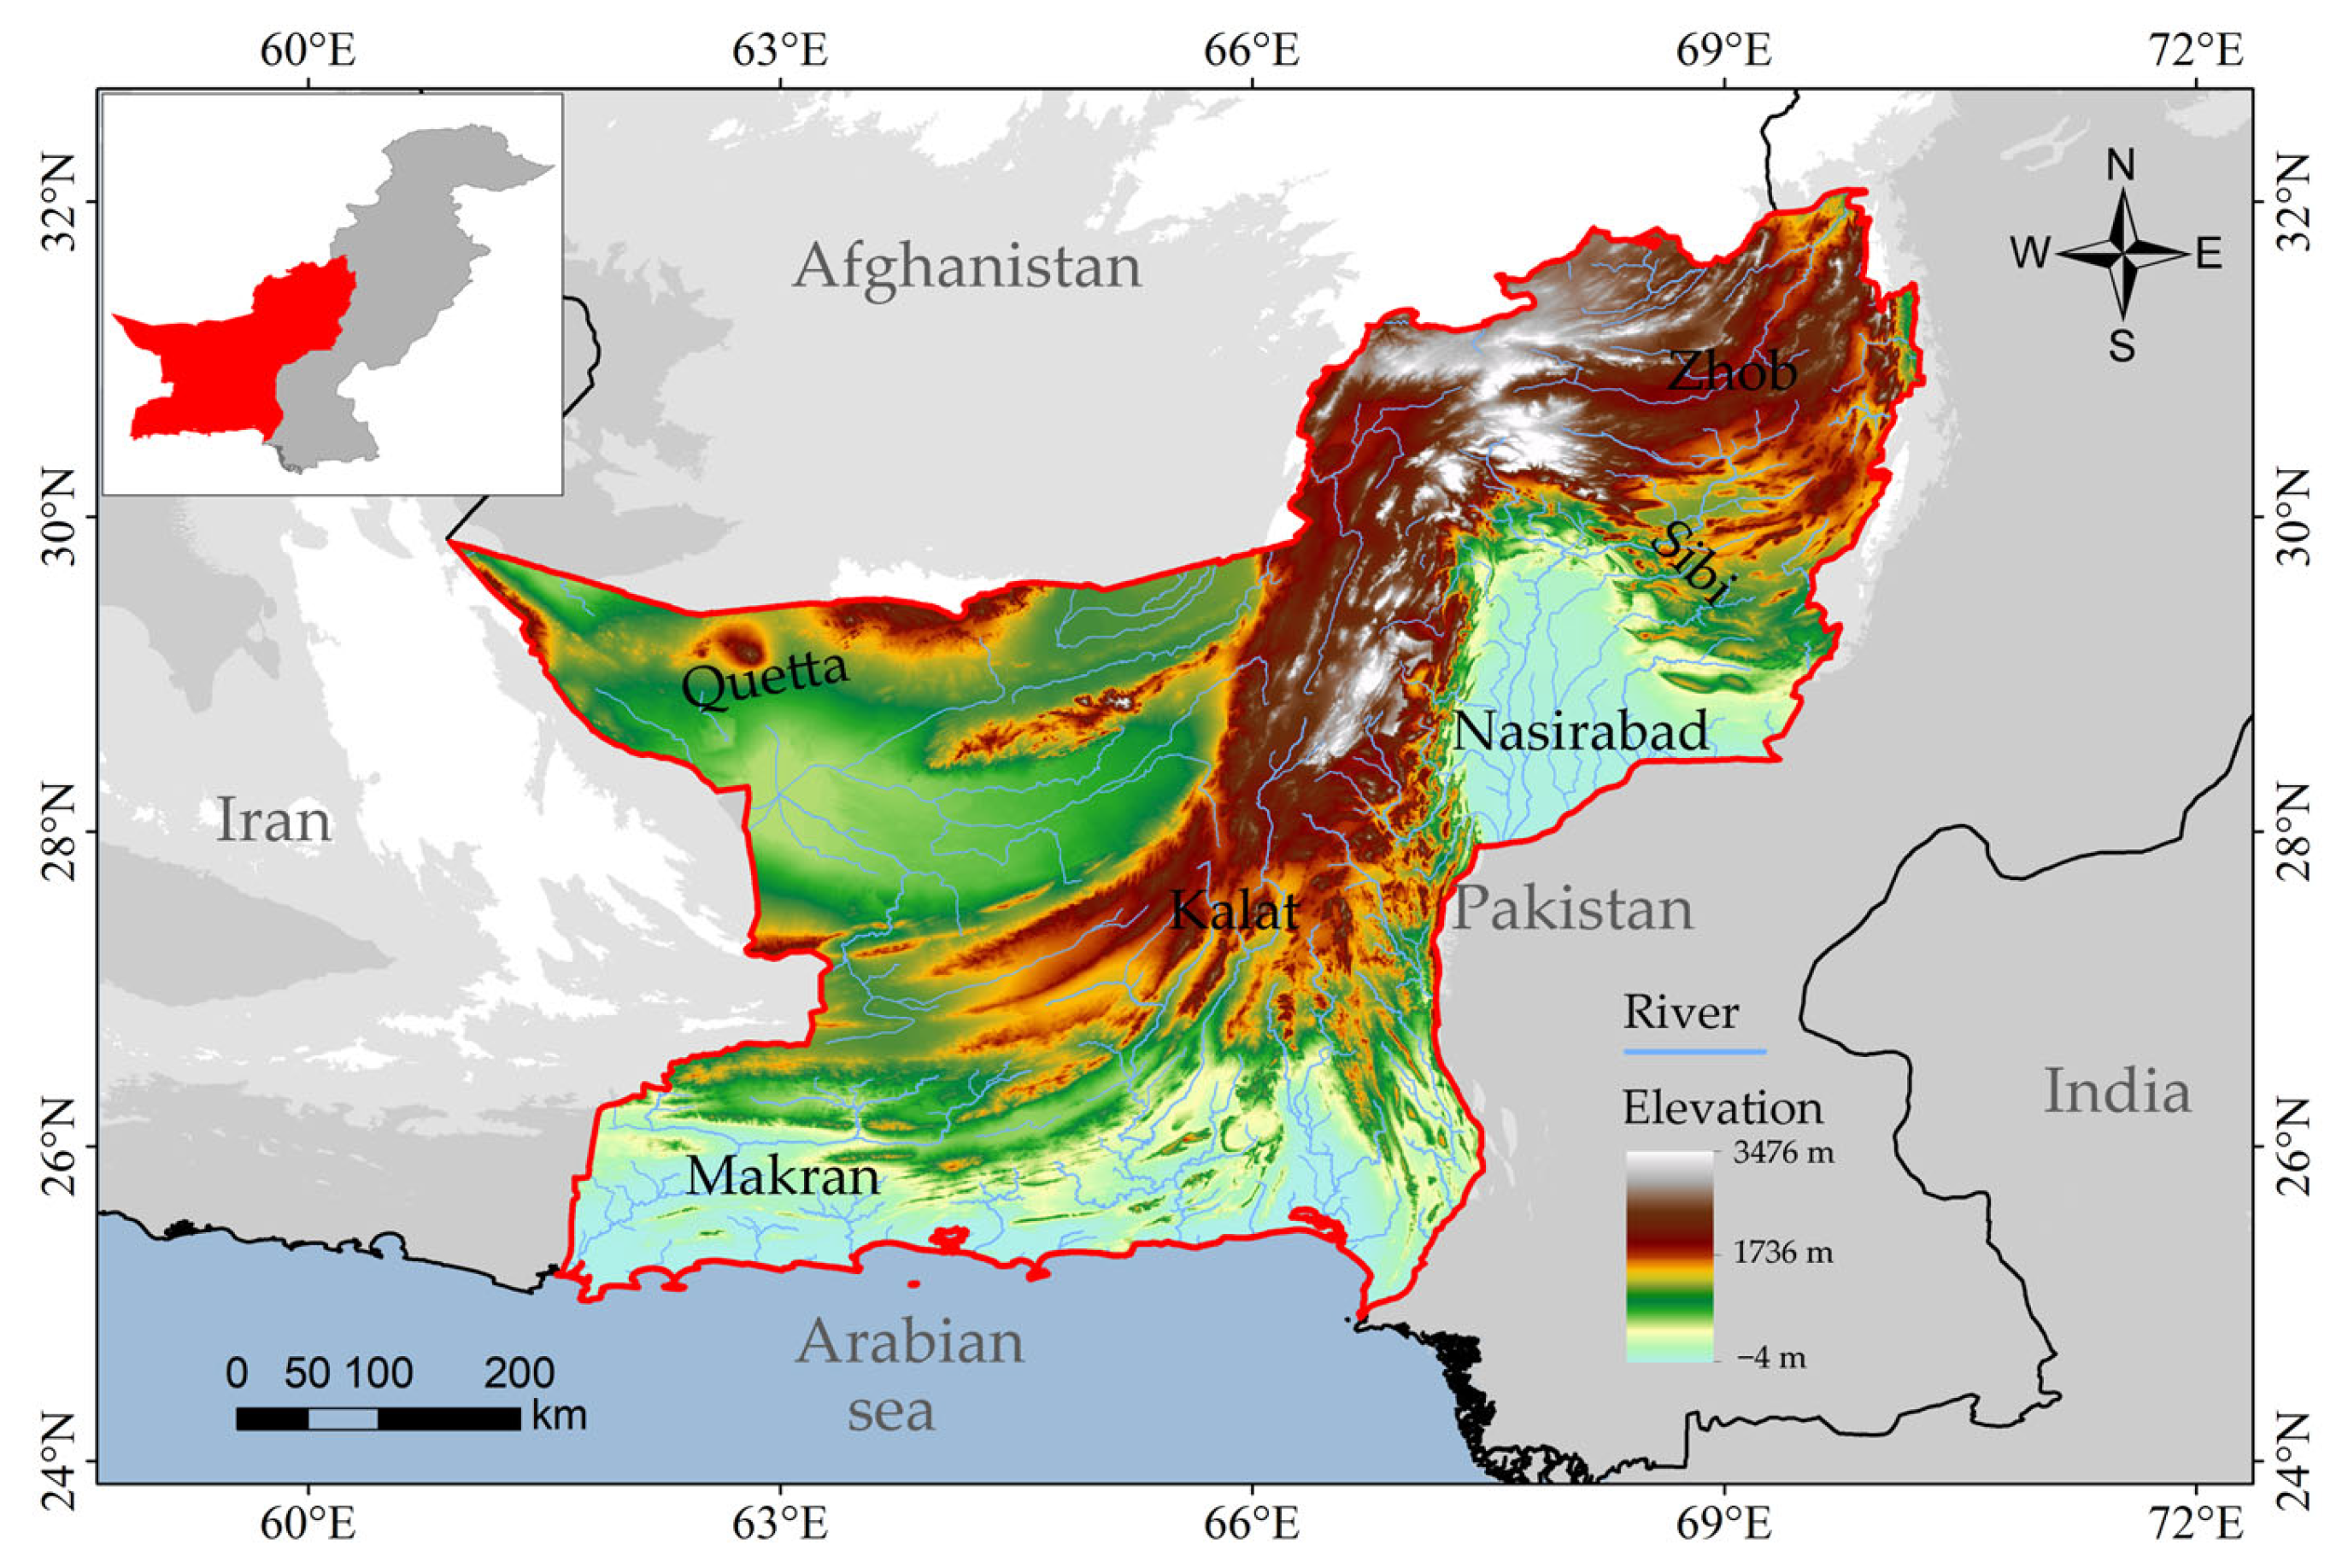
Balochistan province, located in southwest Pakistan, ranges from 60°52′E to 70°21′E and 24°51′N to 32°5′N. Its districts include the Quetta, Kalat, Makran, Nasirabad, Sibi and Zhob Districts. The landform is mainly desert; the climate is dry, and there is little rainfall. The natural conditions have been terrible for a long time. The main geographical units of the study area include the Sulaiman Mountains in the northeast, the Gilgit Mountains in the central region, and the Makran Coastal Mountains and Makran Sea in the southwest (Figure 1). The central and northeastern regions have high terrain, while the southern region is close to the sea. Balochistan Province is geographically very important. It borders the Sindh and Punjab provinces to the east and northeast, Iran to the west, the Arabian Sea to the south, and Afghanistan to the north. It is the only way from East Asia to West Asia, a trade channel for Central Asian countries and Afghanistan to carry out entrepot trade, and is an important node of the energy channel from the Middle East and Central Asia to East Asia. The geographical location of the research area is shown in Figure 1.
2.2. Data Sources
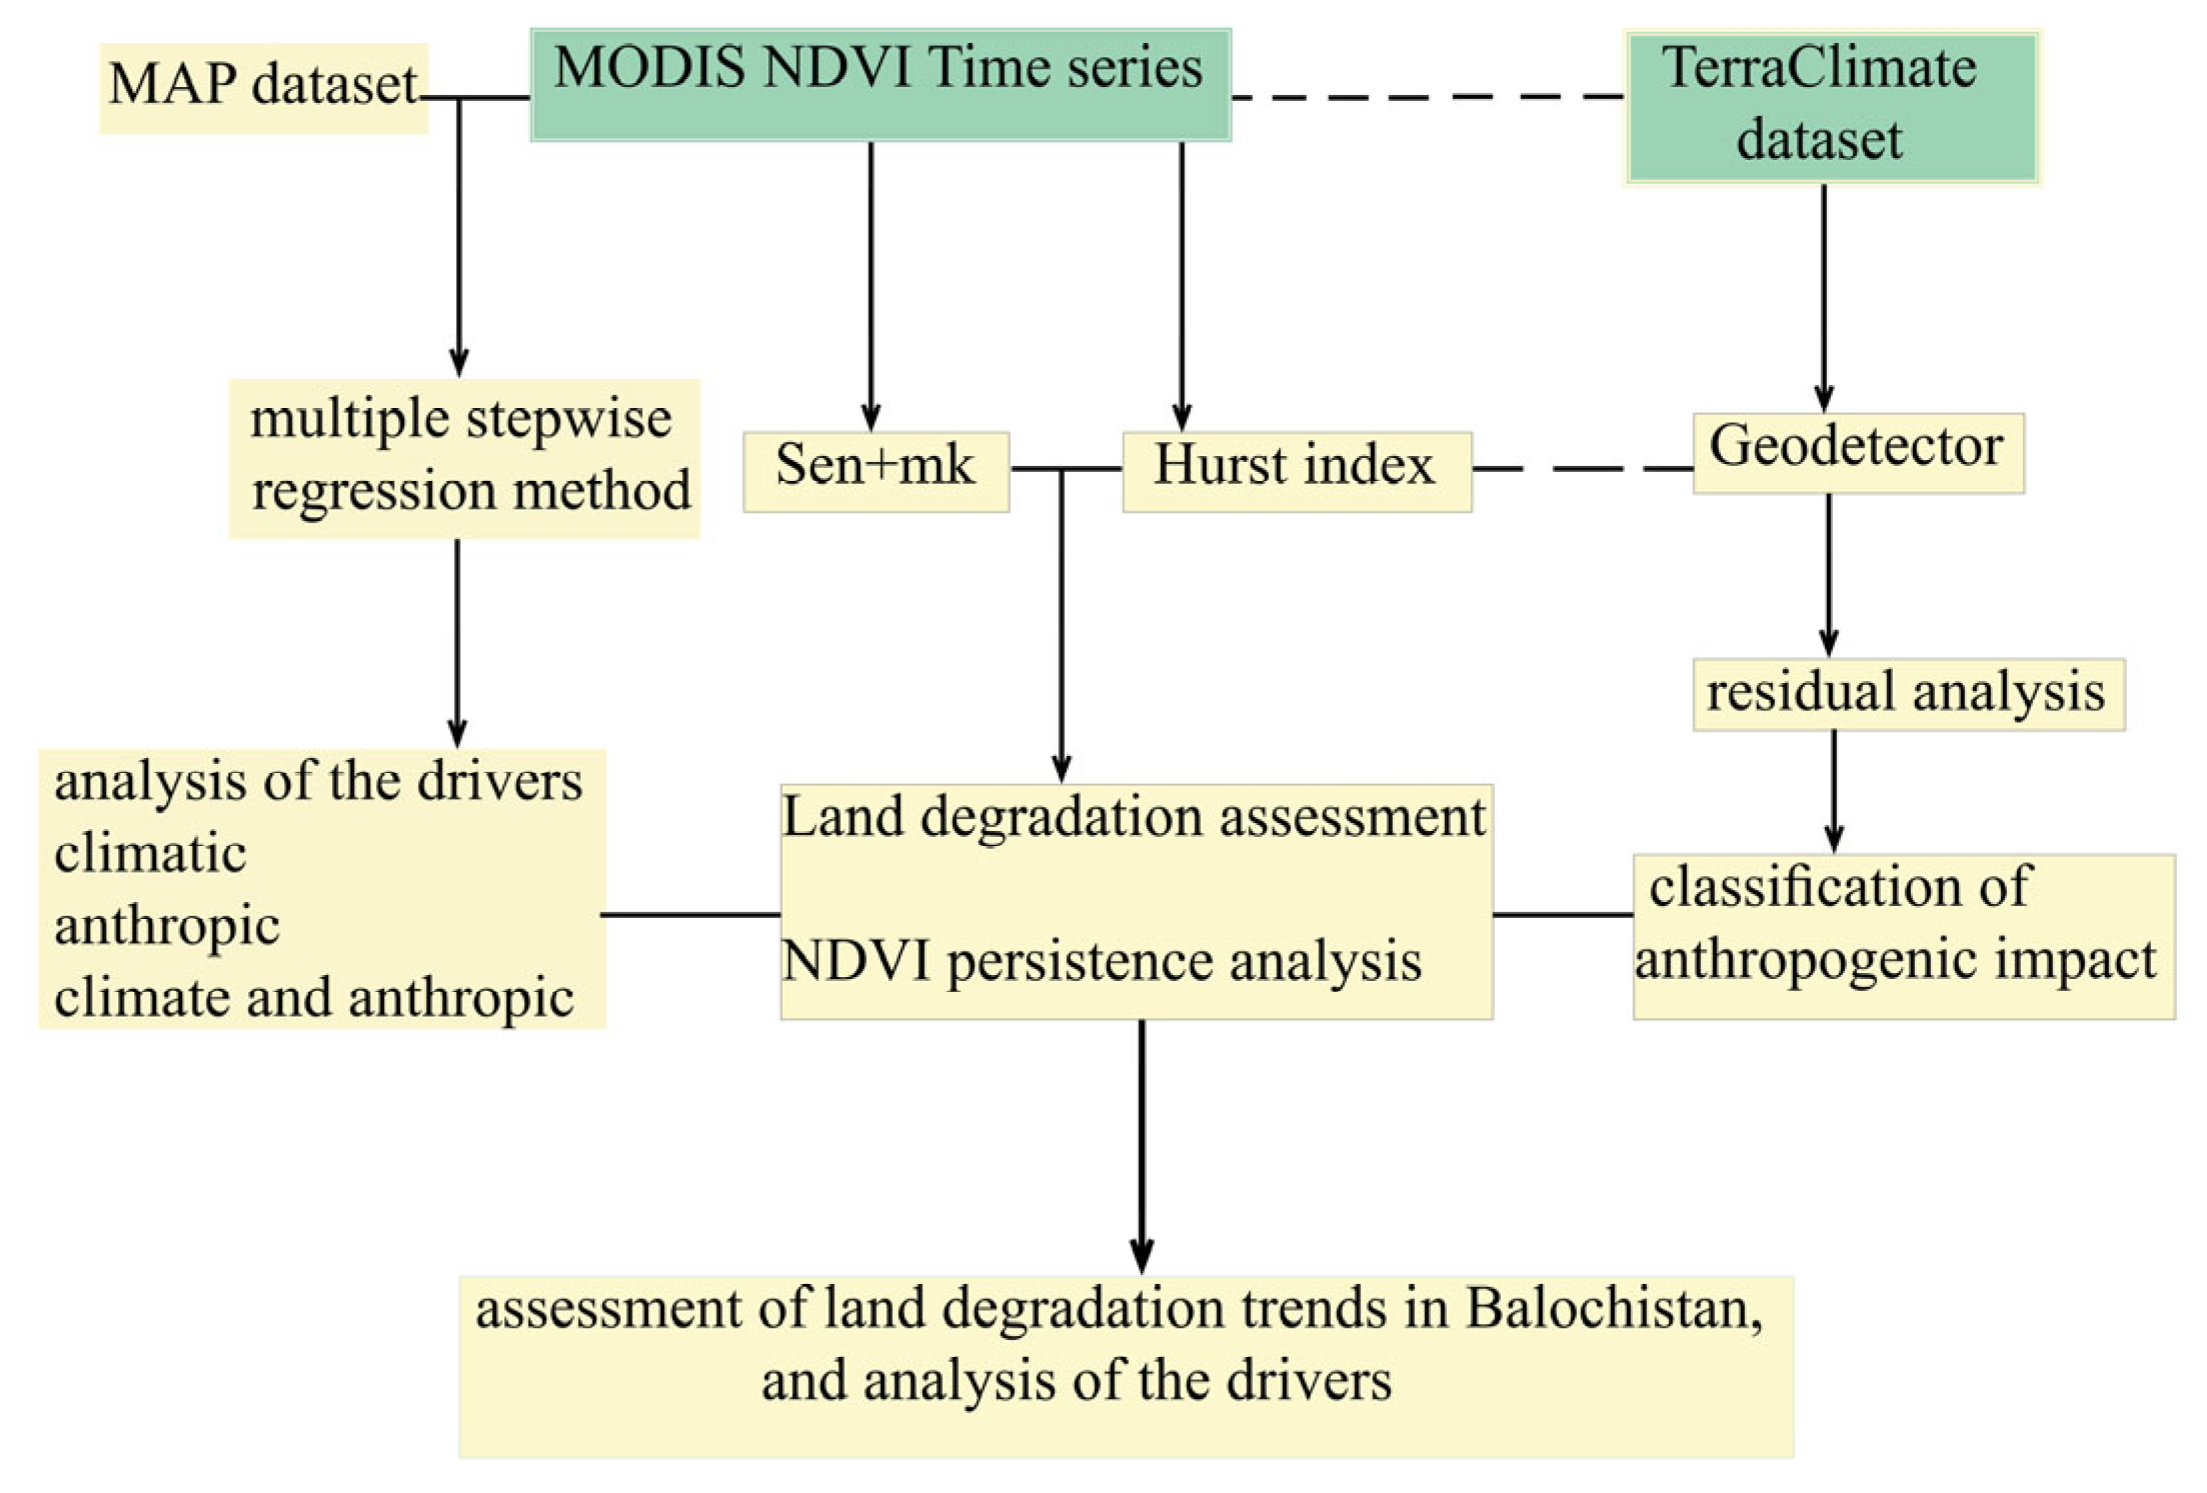
Six types of basic data were selected in this study: average annual temperature (TMP), actual evapotranspiration (AET), potential evapotranspiration (PET), solar radiation (SRAD), mean annual precipitation (MAP), and the normalized difference vegetation index (NDVI). All data were pre-processed by Google Earth Engine (GEE), such as the resampling and projection, and then a data analysis was carried out. The TMP, AET, PET, SRAD and MAP were derived from the TerraClimate dataset. The MODIS MOD13A1 data product was selected for the NDVI. The specific year of use and spatial resolution of data is shown in Table 1. The flowchart of this article is shown in Figure 2.
2.3. Computational Methods
2.3.1. Sen+ Mann–Kendall (MK) Analysis of Trends
The trend analysis method in this paper adopts the Sen trend degree combined with the Mann–Kendall trend significance test [27,28].
The formula for calculating Sen trend degree is
where 1 < j < i < n; when > 0, it means the change trend of the time-series data is rising, and when < 0, it means the change trend is falling. As is a non-normalized parameter, it can only reflect the size of the change trend of the time series itself; however, the significance of the change cannot be judged. Therefore, the trend significance test should be combined with the Mann–Kendall test.
The Mann–Kendall test [27,28], a commonly used time-series trend test, is a nonparametric statistical test with the advantages that it does not require the sample to follow a certain distribution, is not disturbed by a few outliers and is more applicable to type and order variables.
For time-series data (x1, x2, …, xn), construct statistical variables S for testing:
which is
S follows a normal distribution with E(s) = 0 and variance:
where m is the number of recurring datasets in the time series, and ti is the number of repeated data in the ith set of the repeated data.
When n ≥ 10, Z is calculated as
The Mann–Kendall test is usually used to determine the monotonic trends of climate data [29]. Based on Sen’s slope and the Mann–Kendall (MK) test combined with the p-value, it was found that the NDVI increased or decreased significantly, with p < 0.05, rejecting the null hypothesis and indicating that there was a significant change trend in the data. The research time series comprised 21 years. With the passage of time, using the Z-score to perform the trend tests, the Z-score threshold for testing significance is 1.96, and the confidence level is 95%. When is positive, it indicates a positive trend, and when is negative, it indicates a negative trend. If the absolute value of Z is greater than 1.96, it indicates that its trend significance test is passed.
2.3.2. Multiple Stepwise Regression Method
Multiple stepwise regression is a method proposed by Del Barrio et al. [30]. His approach can be used to study the drivers of land degradation and identify the areas affected by single climatic factors, single anthropogenic factors, or both climatic and anthropogenic factors. First, referring to Del et al. [30], this study is based on multiple regression between the NDVI and two dependent variables: time and precipitation. The determination coefficient (R2NDVI_1,2) was calculated, and the statistical significance was tested at the 90% confidence level. Then, for regions with significant changes, the independent variable with a low correlation coefficient (rNDVI_2) with an average annual NDVI in simple correlation analysis, was added to the statistical Fs value. Finally, the Fs and standard values were used to evaluate whether the addition of the determination coefficient was significant.
where n is the number of points in the regression equation. The calculated value of Fs was compared with the value of F, which is the expected distribution of F at the threshold 0.10 for 1 and n − 3 degrees of freedom (), to determine whether it was important. When Fs > Fα = 0.1 [1, n − 3], it means that the test is significant, indicating that the change in the annual average NDVI is influenced by both human activities and climate change. Otherwise, individual human activities or climate change drivers were distinguished by testing the significance of their variable correlation coefficients, which were constructed from the annual average NDVI with time and precipitation. If no significance was found in any of the above tests, it was assumed that the NDVI was not influenced by time or precipitation.
2.3.3. Geodetector
Geographic detectors are a group of statistical methods to detect spatial heterogeneity and reveal the driving force behind it. Spatial heterogeneity is one of the basic characteristics of geographical phenomena [31].
Geographic detectors include four detectors. Divergence and factor detection: detecting the spatial divergence of Y and detecting how much of the spatial divergence of Y is explained by a given factor X. Using the q-value metric [32], the expressions are:
where h = 1, …, L is the stratification of variable Y or factor X; Nh and N are the numbers of cells in layer h and the whole area, respectively; and are the Y-worthy variance of layer h and the whole area, respectively. SSW and SST are the sum of the variances within layers and the total variance of the whole area, respectively. The range of values for q is [0, 1]; higher q-values indicate that climate factor x has a much stronger influence on the high value of q, thus the stronger the explanatory power of climate factor x on the NDVI spatially and vice versa [31]. In this study, a factor detector and interactive detector were used, with the NDVI as the dependent variable and the climate factors as the independent variables. Factor detection in the Geographic detector was used to analyze the interpretation degree of spatial differentiation, reflected by the climate-driving factors of the NDVI in Balochistan Province, which was measured by the q-value. The q-value represents factor x, which explains the spatial differentiation of the 100 × q% climate factors. For the specific process, please refer to [31]. The Geographic detectors require that the independent variable be a categorical variable; therefore, the climate elements were divided into 10 categories according to the natural breakpoint method, turning each factor from a numerical variable to a categorical variable.
2.3.4. Hurst Index Analysis
The Hurst index was first proposed by the hydrologist Hurst [33] and later modified and improved by Mandelbrot et al. [34]. It is an effective method to quantitatively describe the long-term dependence of time-series information; see the reference for the basic principle [33,34]. Combined with the Theil–Sen trend, this paper uses the Hurst index to reflect the sustainability characteristics of future vegetation cover.
The calculation principle is as follows:
For any positive integer , define the sequence of means {}:
- (1)
- Deviation
- (2)
- Range
- (3)
- Standard deviation
Introducing the dimensionless ratio R/S, if there exists H such that R/S = (cτ)H holds, then the Hurst phenomenon is present in and H is the Hurst index. In the double logarithmic coordinate system [lnτ, ln(R/S)], use the least squares fit to obtain the Hurst index [35].
If 0 < H < 0.5, it indicates that the NDVI time series has anti-persistence. The past variable is negatively correlated with the future trend, and the sequence has the characteristics of mutation and jump. The closer the H value is to 0, the stronger the anti-persistence.
If H = 0.5, it indicates that the NDVI time series is an independent random series.
If 0.5 < H < 1, it indicates that the vegetation coverage time series has long-term correlation characteristics, and thus, the process has sustainability. The closer the H value is to 1, the stronger the sustainability.
2.3.5. Residual Analysis
Not all regional NDVIs are significantly correlated with rainfall [10]. Geographical detectors are used to screen out the related driving influences of climate factors MAP, AET, PET and TMP. By eliminating the influence of these factors in the NDVI long-term time series changes, the climatic influence of the NDVI changes can be stripped away so as to obtain the influence of human activities. Regression analyses were performed on the NDVI, MAP, AET, PET and TMP values to calculate the difference between the predicted and real value of the NDVI, which was used as the influence of human factors on vegetation cover change (the residual trend method) [39]. Its expression is as follows:
In the formula, is the NDVI value in a remote sensing image, and is the predicted value. is based on the NDVI and time-series data of temperature, precipitation and evapotranspiration, assuming human activities have no influence. The NDVI is taken as the dependent variable, while MAP, TMP, AET and PET are taken as the independent variables. The predicted value of the NDVI is obtained by building a multiple linear regression model, with a, b, c, d and e as the model parameters [20]. The variation trend of the NDVI residuals can be calculated by the formula. Over time, the areas showing a positive trend therefore improved, and areas showing a negative trend thus degraded.
3. Results
3.1. Spatio-Temporal Characteristics of Land Degradation and Restoration in Balochistan
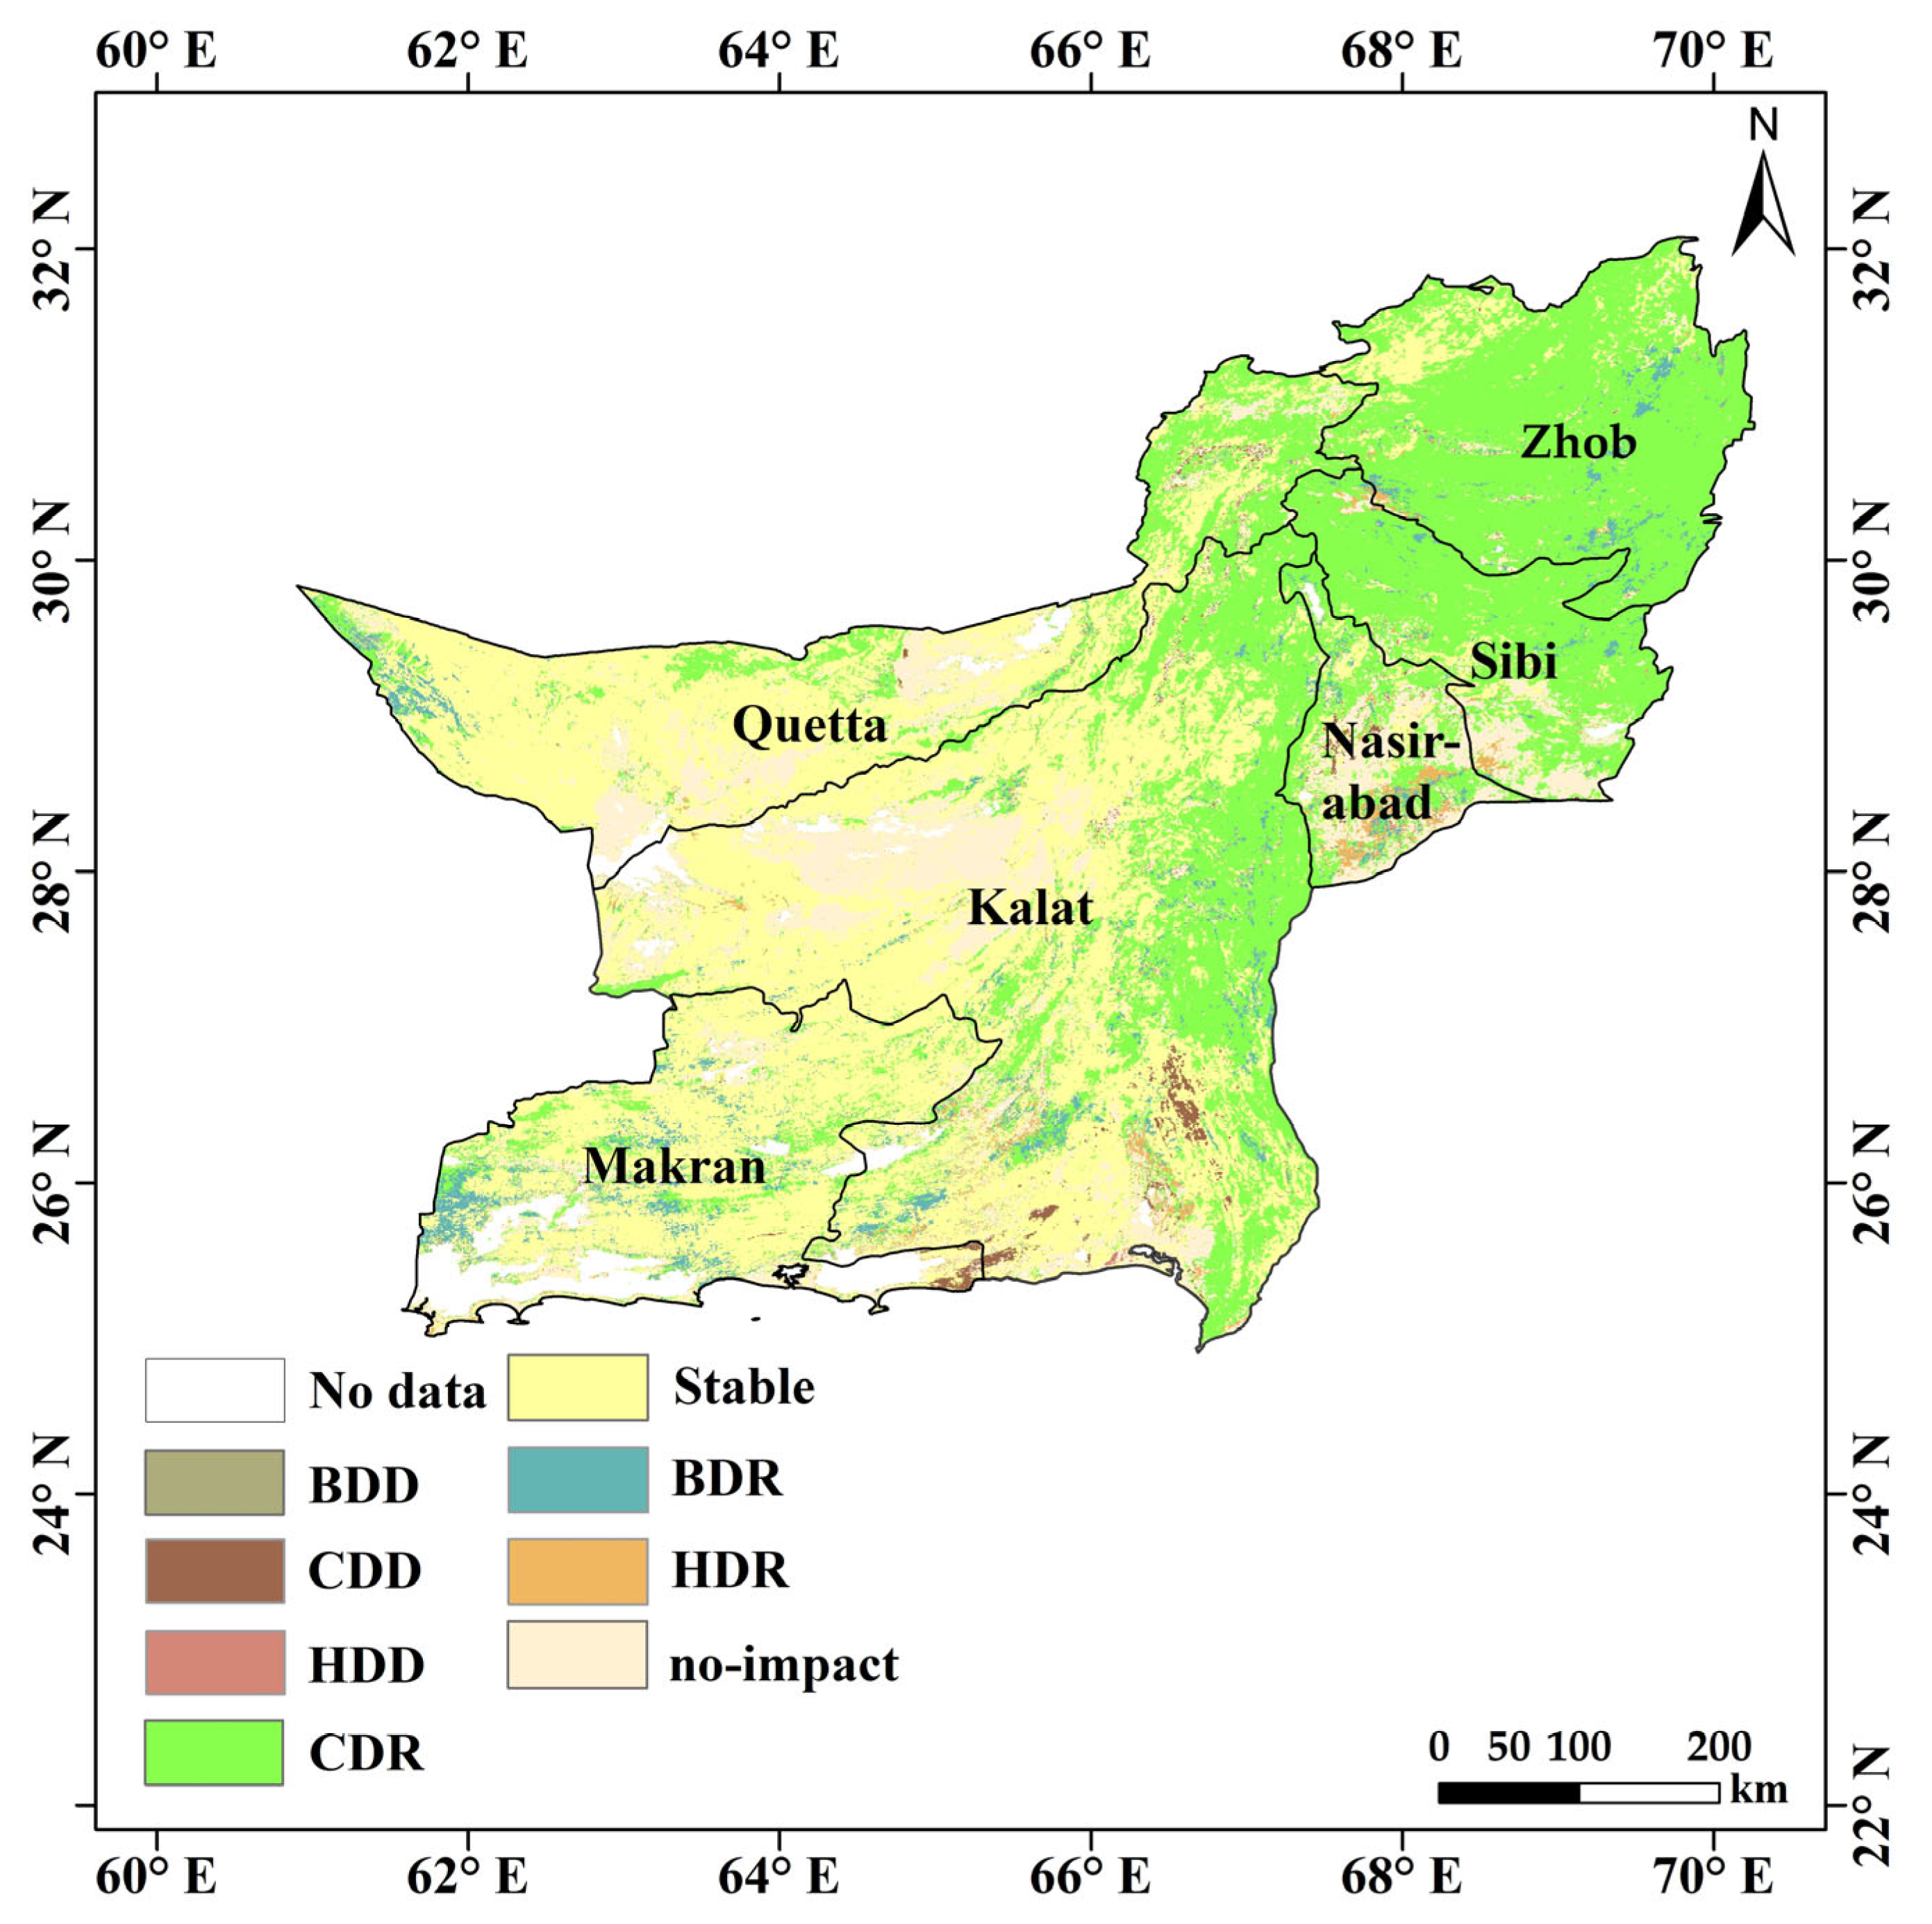
In order to detect the temporal and spatial characteristics, in this article, we analyzed the driving factors of land degradation and restoration based on 21 years of NDVI data in Balochistan, referring to the classification results of the NDVI trends by Yuan et al. [40], coupled with stepwise multiple regression. The percentages of climate-dominated degradation region (CDD), human-dominated degradation region (HDD) and both factors-dominated degradation (BDD) influence are 36.26, 3.34, and 1.56, respectively. The land restoration area is about 1.315 × 10⁵ km2. The percentages of the climate-dominated restoration region (CDR), human-dominated restoration region (HDR) and both factors-dominated restoration (BDR) influence are 0.76, 0.02, and 0.08, respectively (Table 2). The land degradation area is about 2.915 × 10³ km2. The area of land restoration is larger than the area of land degradation in Balochistan (Figure 3).
There were significant spatial differences in the spatial distribution of the drivers of land degradation and restoration in Balochistan. Quetta District is mainly stable, and its land restoration is mainly affected by climate. Zhob District is dominated by restoration, which is mainly influenced by climate. Sibi District is dominated by land restoration, which is mainly influenced by climate. Makran District is mainly stable, which is mainly influenced by climate and a combination of climate and human influence. The land restoration in Kalat District and Nasirabad District is mainly influenced by climate.
3.2. Correlation Analysis of NDVI and Climatic Drivers
3.2.1. Impact of Climatic Factors on NDVI
The spatial distribution of the NDVI was taken as the dependent variable (Y), and the spatial distribution of the five climate-influencing factors was taken as independent variables (X). The natural breakpoint method was applied to discretize the five influencing factors separately. The q-statistic values between the spatial distribution of the year-by-year average annual NDVI and the five climate factors were obtained by Geographic detectors. The q-values were visualized on color scale plots to reflect the temporal variation characteristics of the NDVI under the influence of multiple climatic factors.
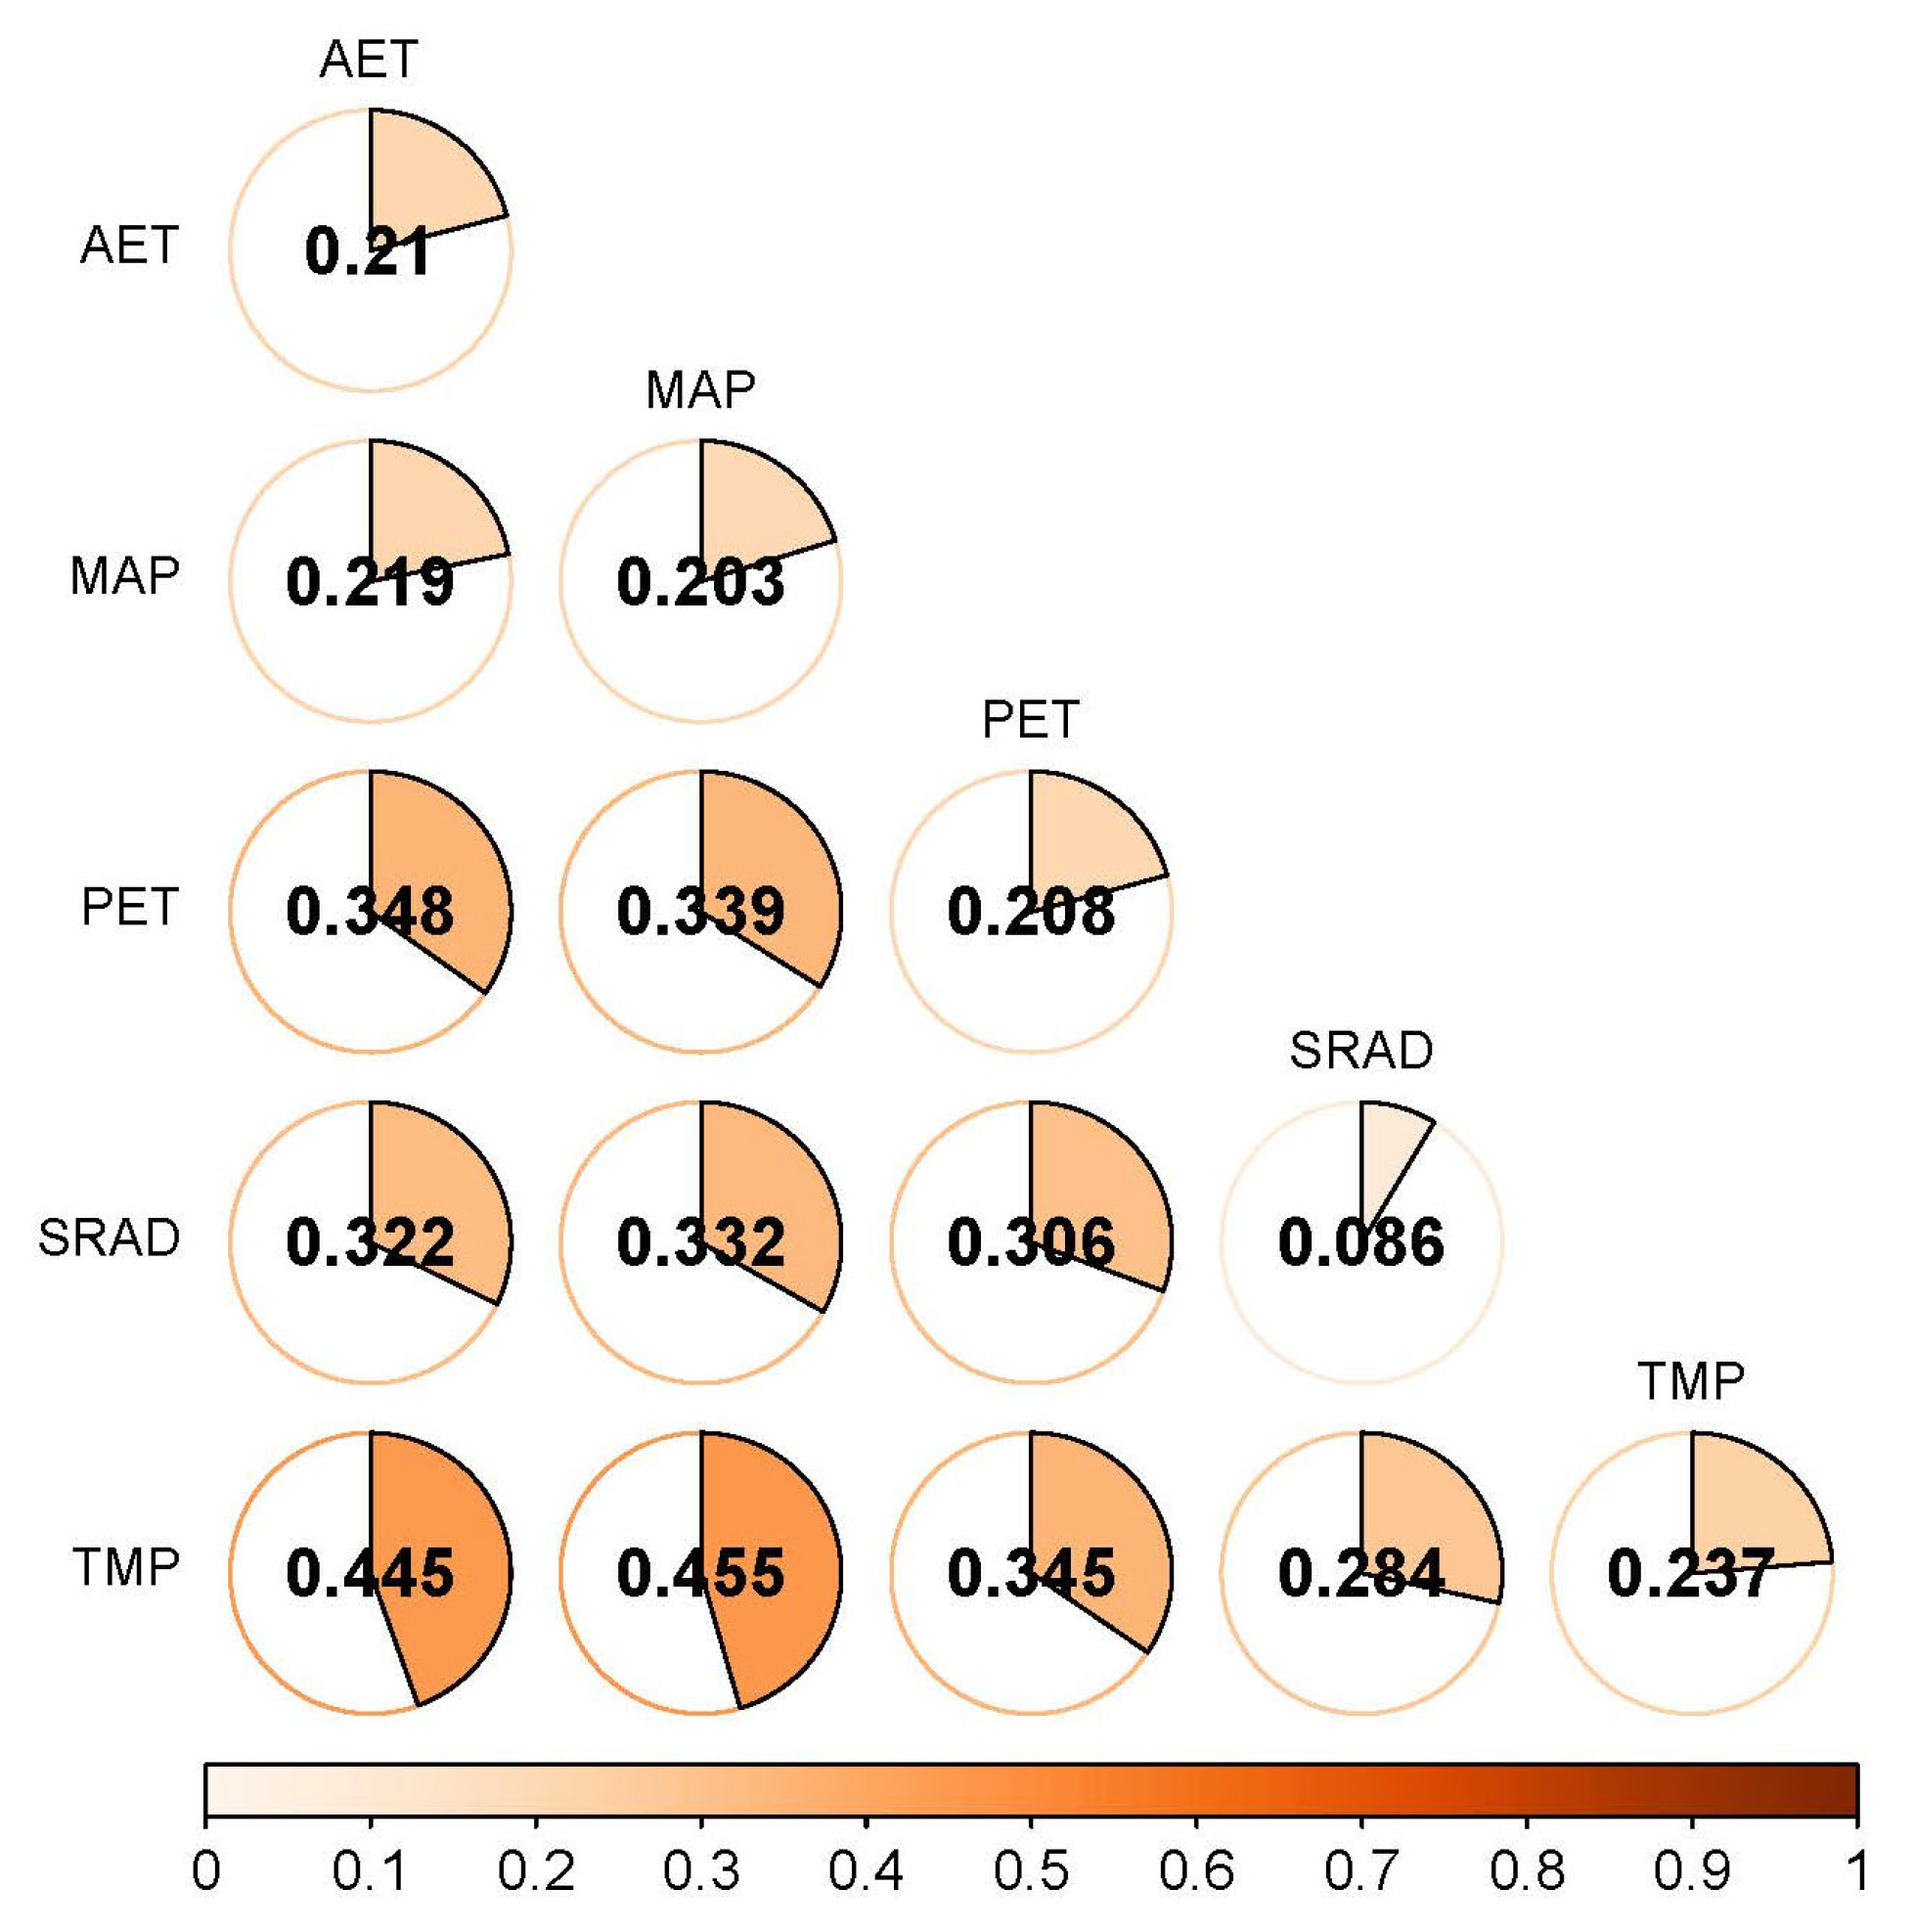
As shown in Table 3, the differences among the q-means of the factors in the extended time series were not significant, ranging from 0.086–0.237 for AET (0.210), MAP (0.203), PET (0.208), SRAD (0.086) and TMP (0.237), indicating the importance of the climatic factors on the NDVI in the long term. TMP, with the highest q-value, was the most dominant climatic driver of NDVI variation, followed by AET, PET and MAP. SRAD had the weakest effect on the NDVI. The temperature was the most dominant driver of the NDVI in Balochistan; a high temperature exacerbates drought and is detrimental to plant growth, which is an important cause of land degradation due to vegetation cover.
In addition, it can be seen from the interaction of the climate factors (Figure 4) that the dominant interaction force q(X1 X2) is TMP interacting with AET and MAP, which have q-values of 0.445 and 0.455, respectively, indicating that the interaction of the annual mean temperature with AET and MAP has the strongest effect on the NDVI.
3.2.2. Analysis of the Influence of Human Factors on NDVI
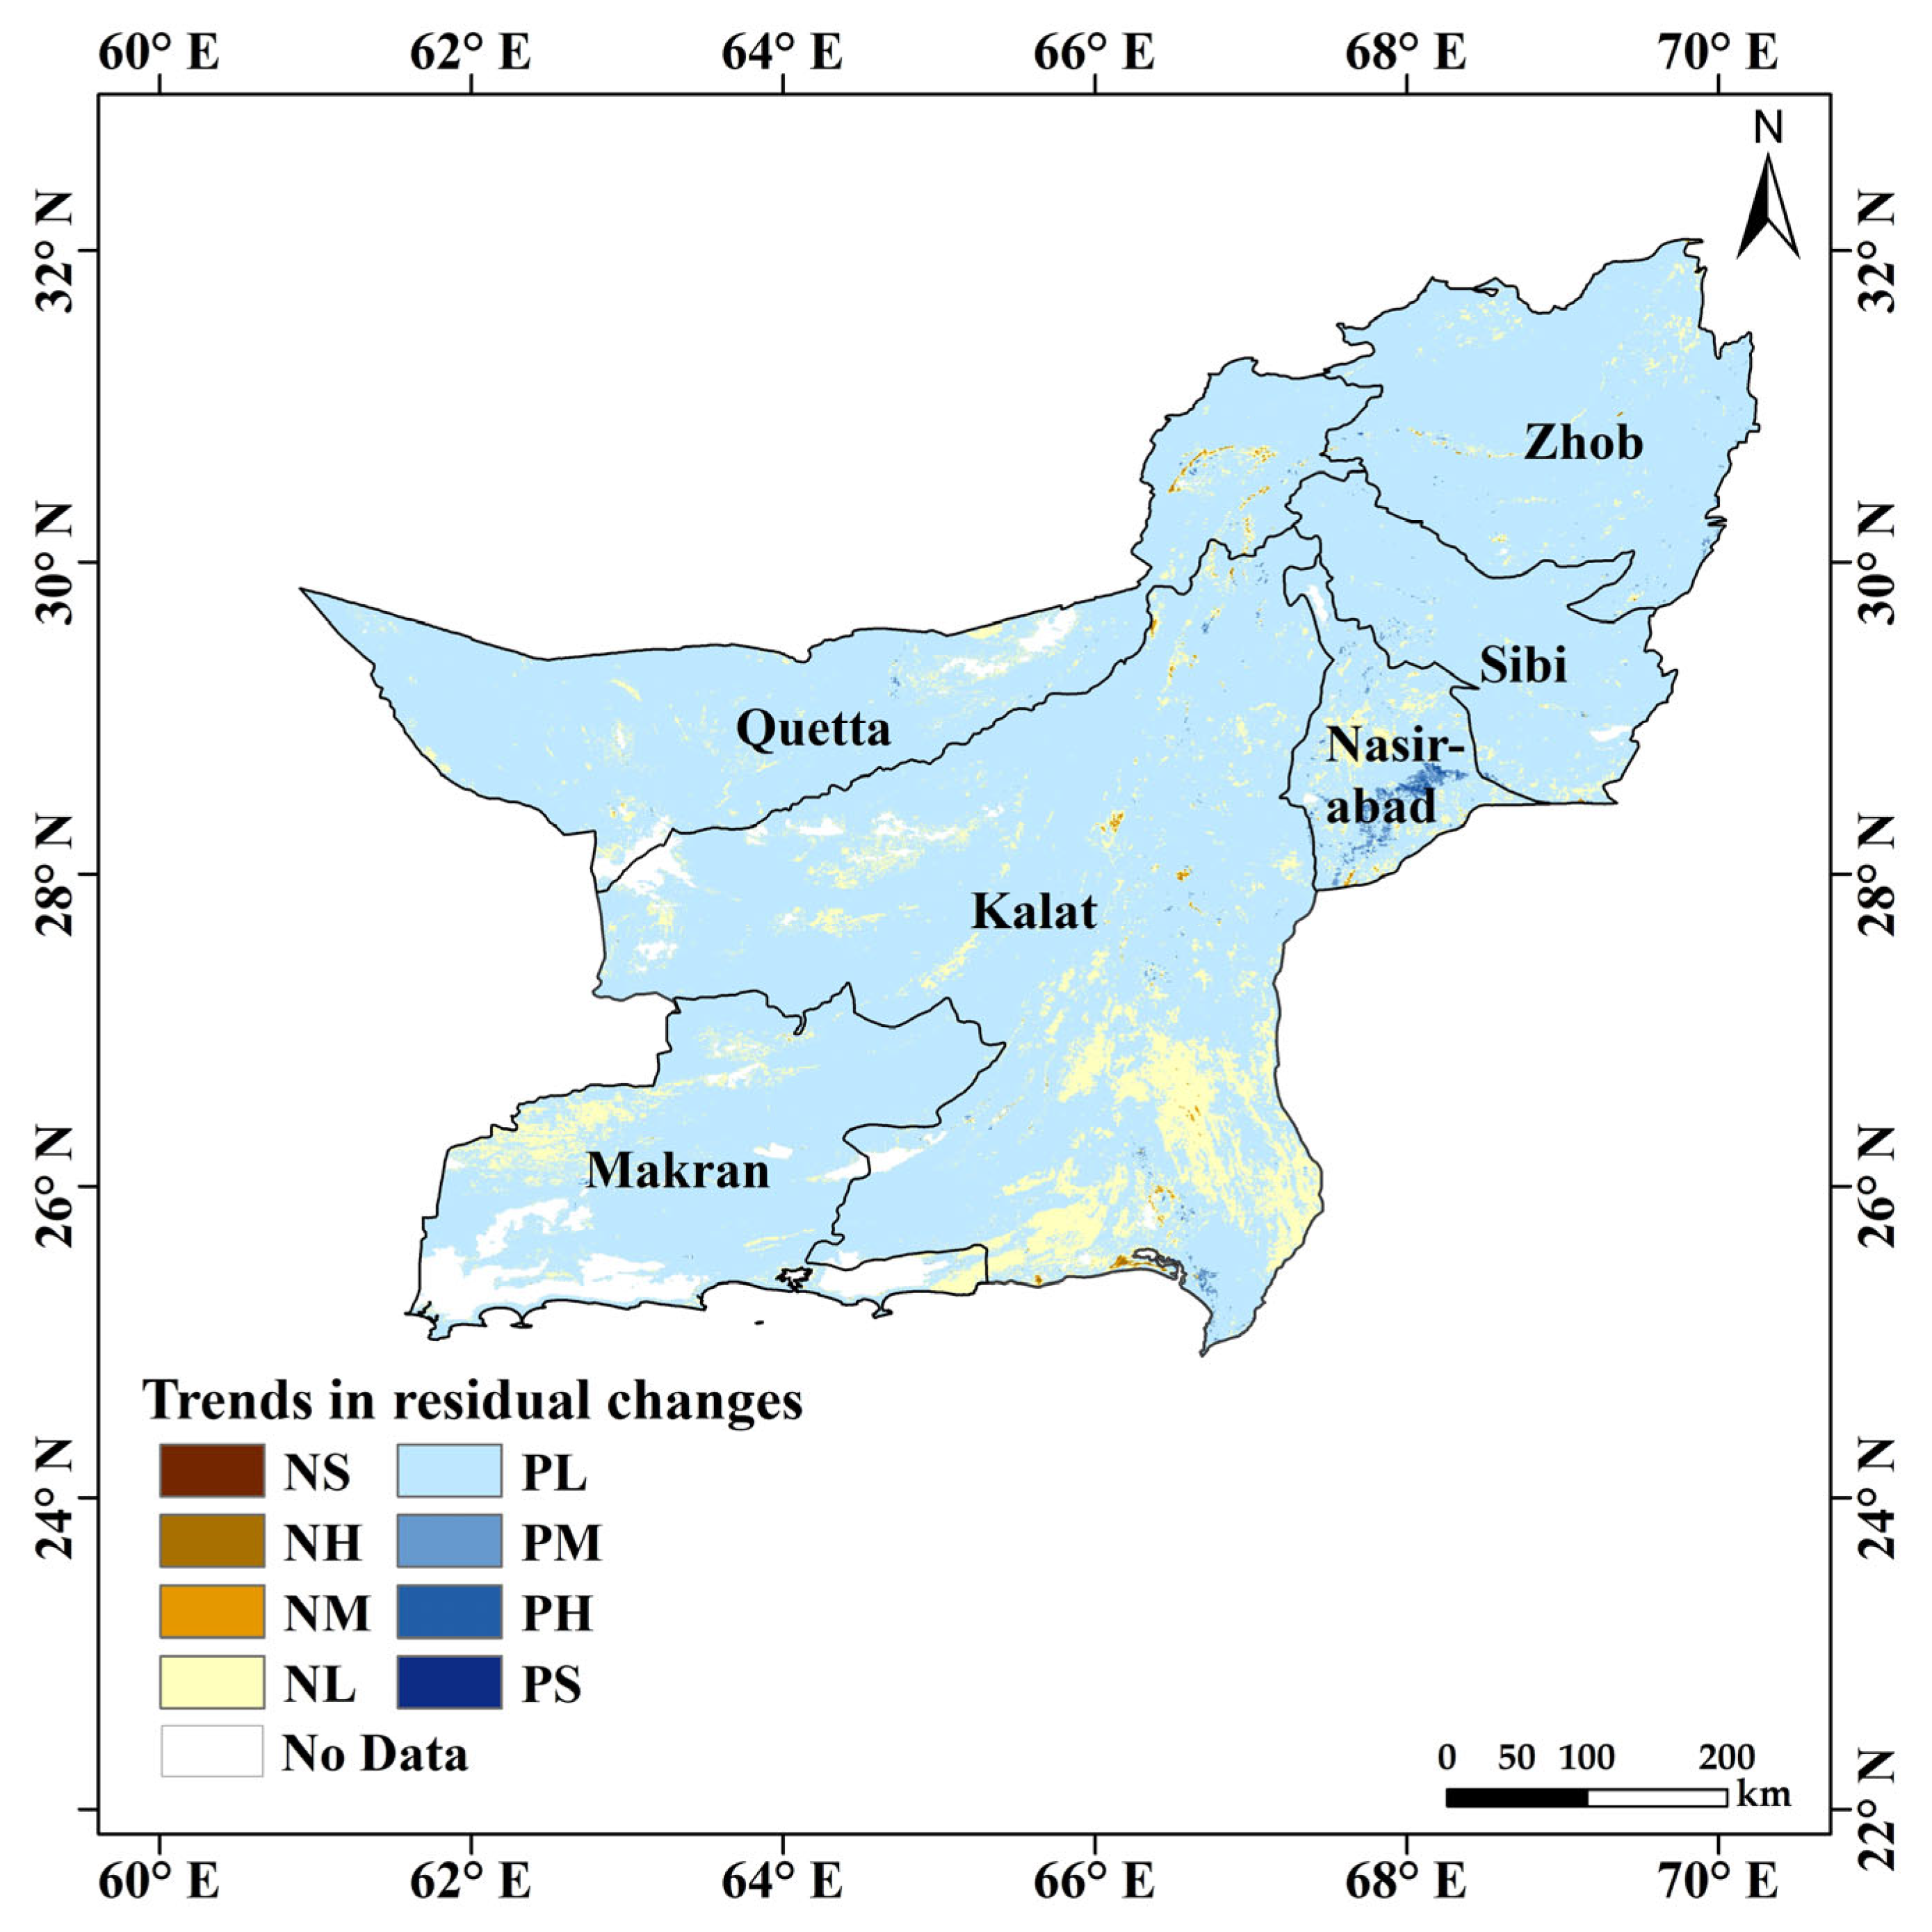
By eliminating the influence of the NDVI long-term trend climate factors, the changes in land degradation caused by human activities can be identified. By calculating the trend change characteristics through residual analysis, we find that the anthropogenic influence is twofold: (i) the areas that show positive trends over time are improved states, and (ii) the areas that show a negative trend over time are degraded states that have an increased degree of vegetation degradation.
In quantifying the details of the spatial distribution of the anthropogenic contribution to the NDVI change, it was found that there was significant heterogeneity in the trend and significant anthropogenic influence on the NDVI in Balochistan. In general, this shows the characteristics of local inhibition in the middle and promotion in the periphery (Figure 5). The areas where human activities positively influenced the NDVI accounted for 91.02%, and the areas where there was a negative influence were about 8.98% (Table 4). Among them, human activities in Nasirabad District showed a significant positive influence on the NDVI changes, while the negative influence was scattered sporadically in Quetta District, the southern part of Kalat District and the northern part of Makran District.
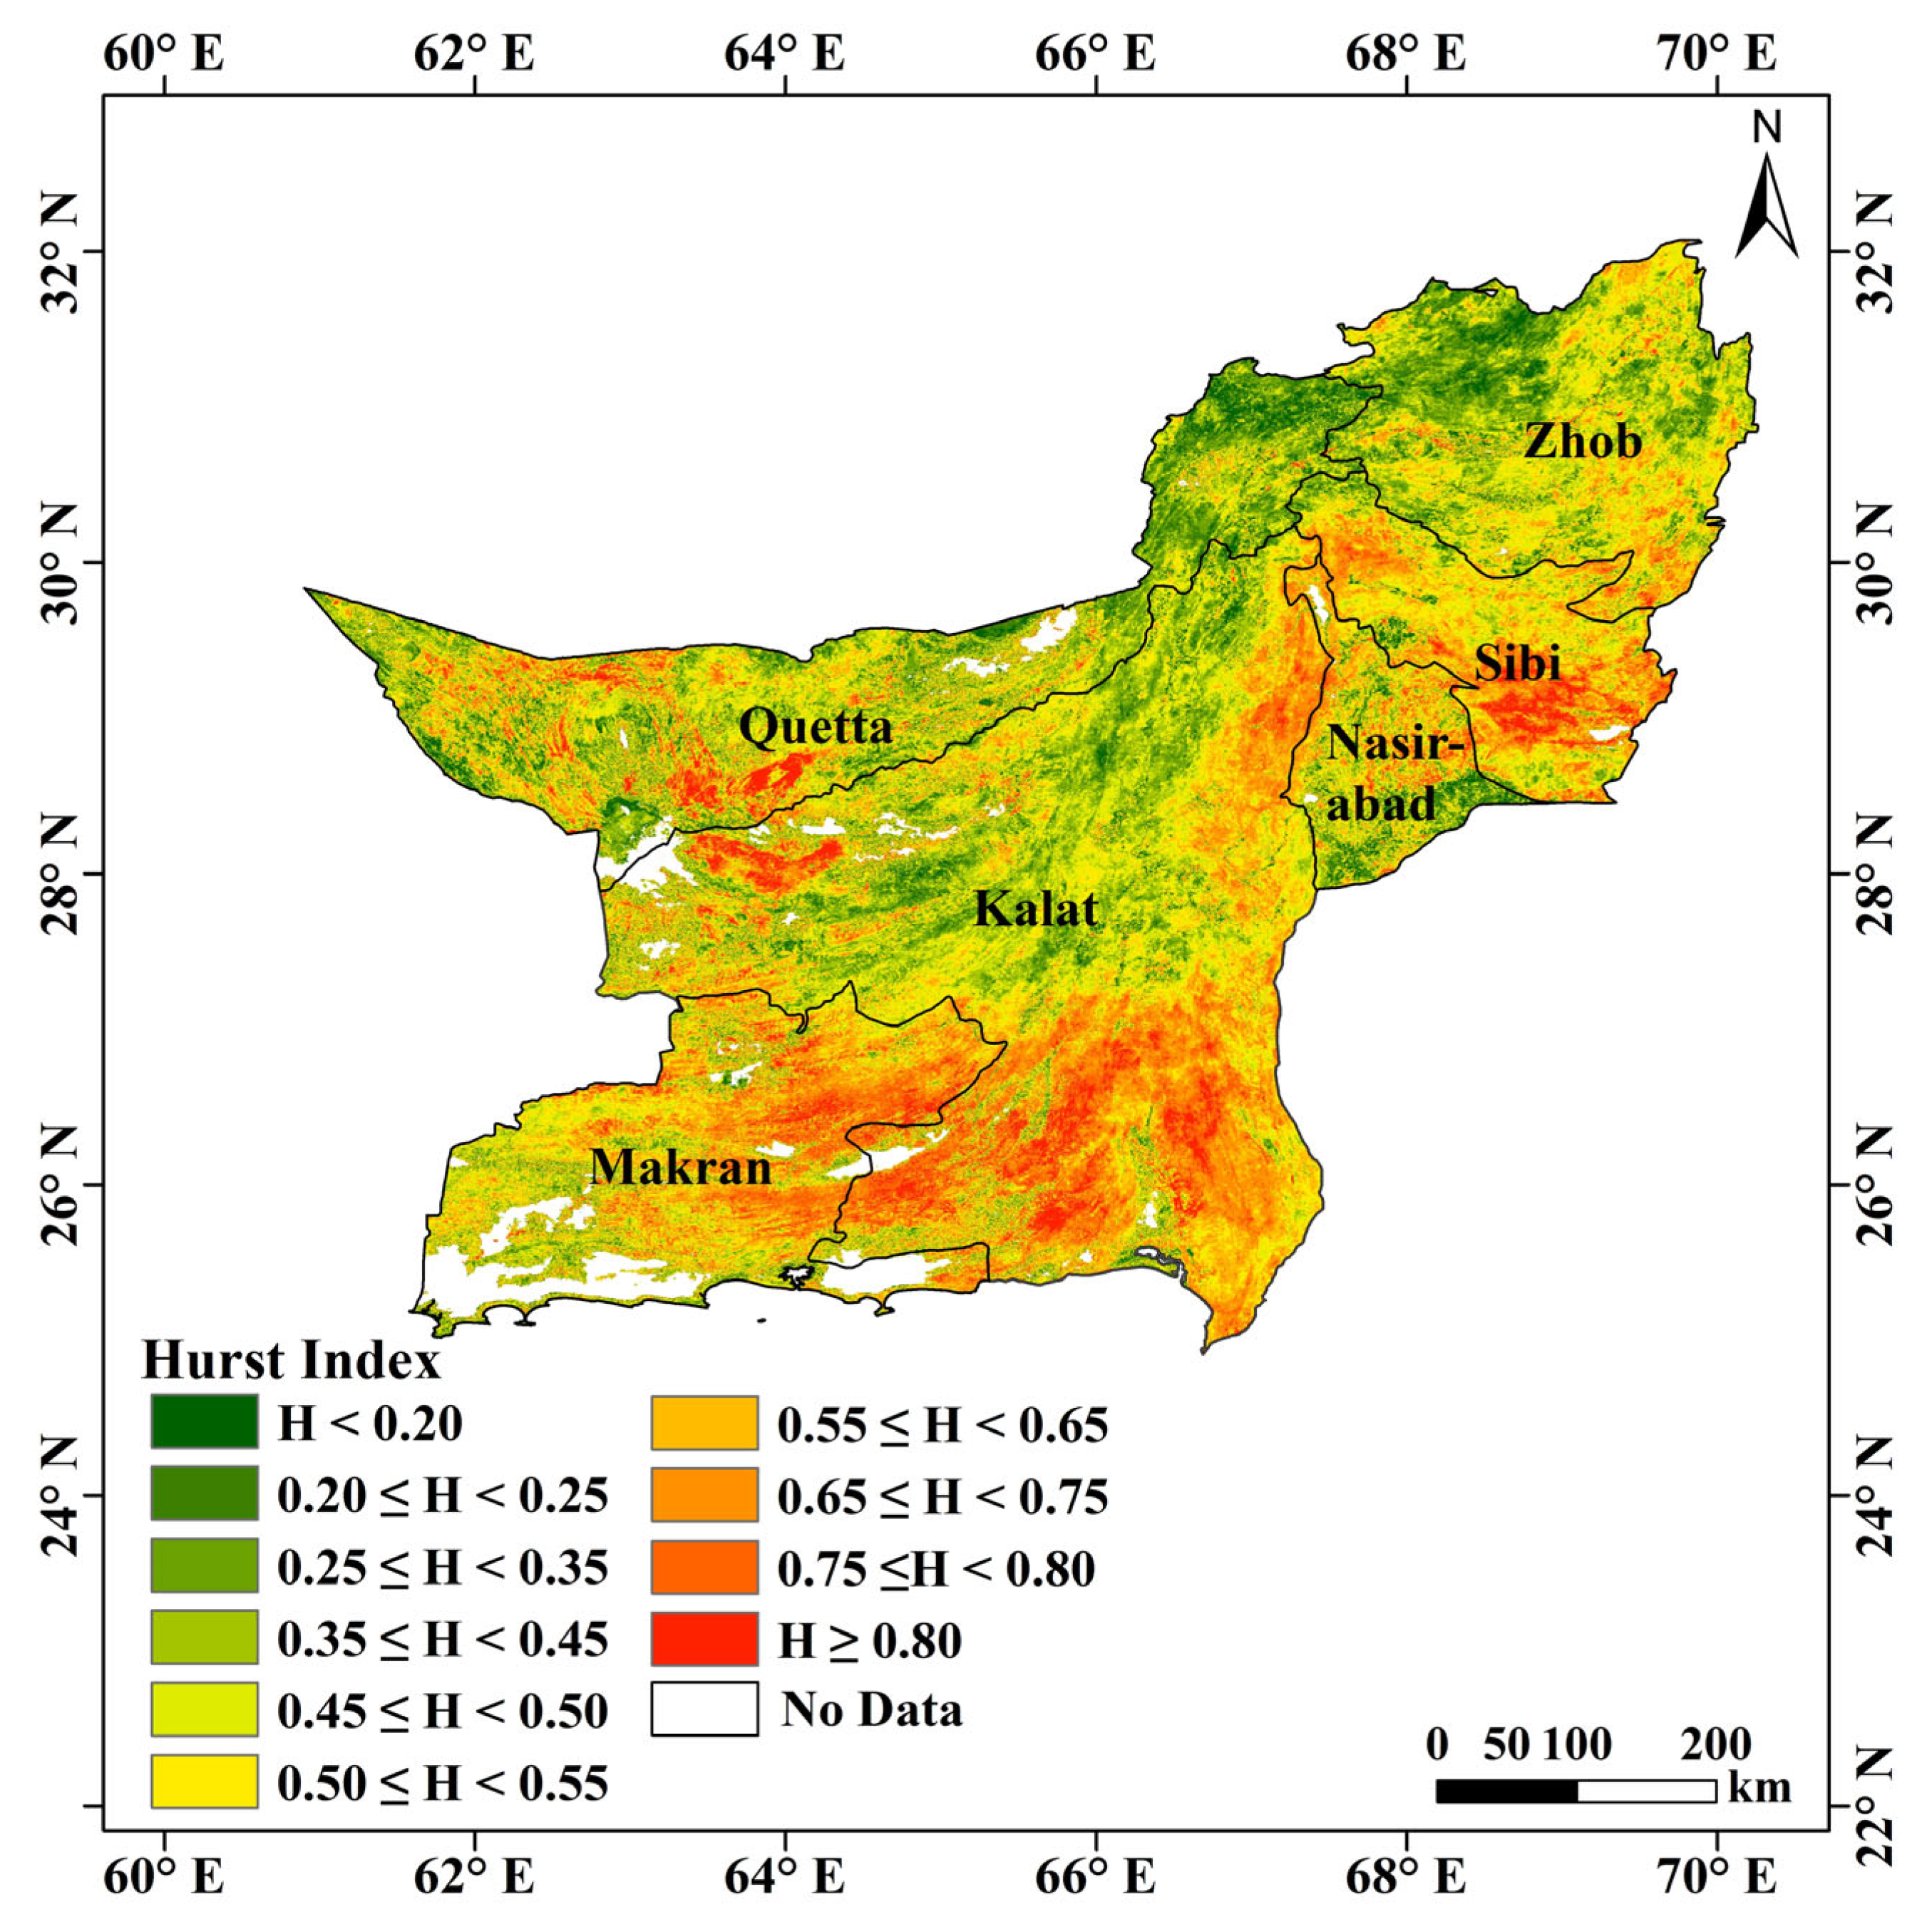
Based on the details of the spatial distribution of the Hurst index by Zhang et al. [35], the Hurst index was classified into eight levels. Persistence analysis of the NDVI over 21 years showed (Figure 6) that the Hurst index ranged from 0.119 to 0.989, with a mean value of 0.51. Among the regions, 27.12% had a Hurst index of less than 0.5, and 72.88% had a Hurst index of more than 0.5 (Table 5); therefore, the persistence of the NDVI changes in Balochistan was greater than the inverse persistence. The Hurst index was graded, and it was statistically derived that weak and less persistent series (0.35–0.65) accounted for 75.11%, and their recovery series showed weak persistence.
The spatial distribution shows that the Hurst index was low in the north of Balochistan and high in the east, west and south of the province. The anti-persistence sequences were mostly distributed in the eastern part of Quetta District, the north-central part of Kalat District, the northern part of Zhob District and the southern part of Nasirabad District, while the sustained sequences were concentrated in the southern part of the Kalat, Sibi and Makran districts.
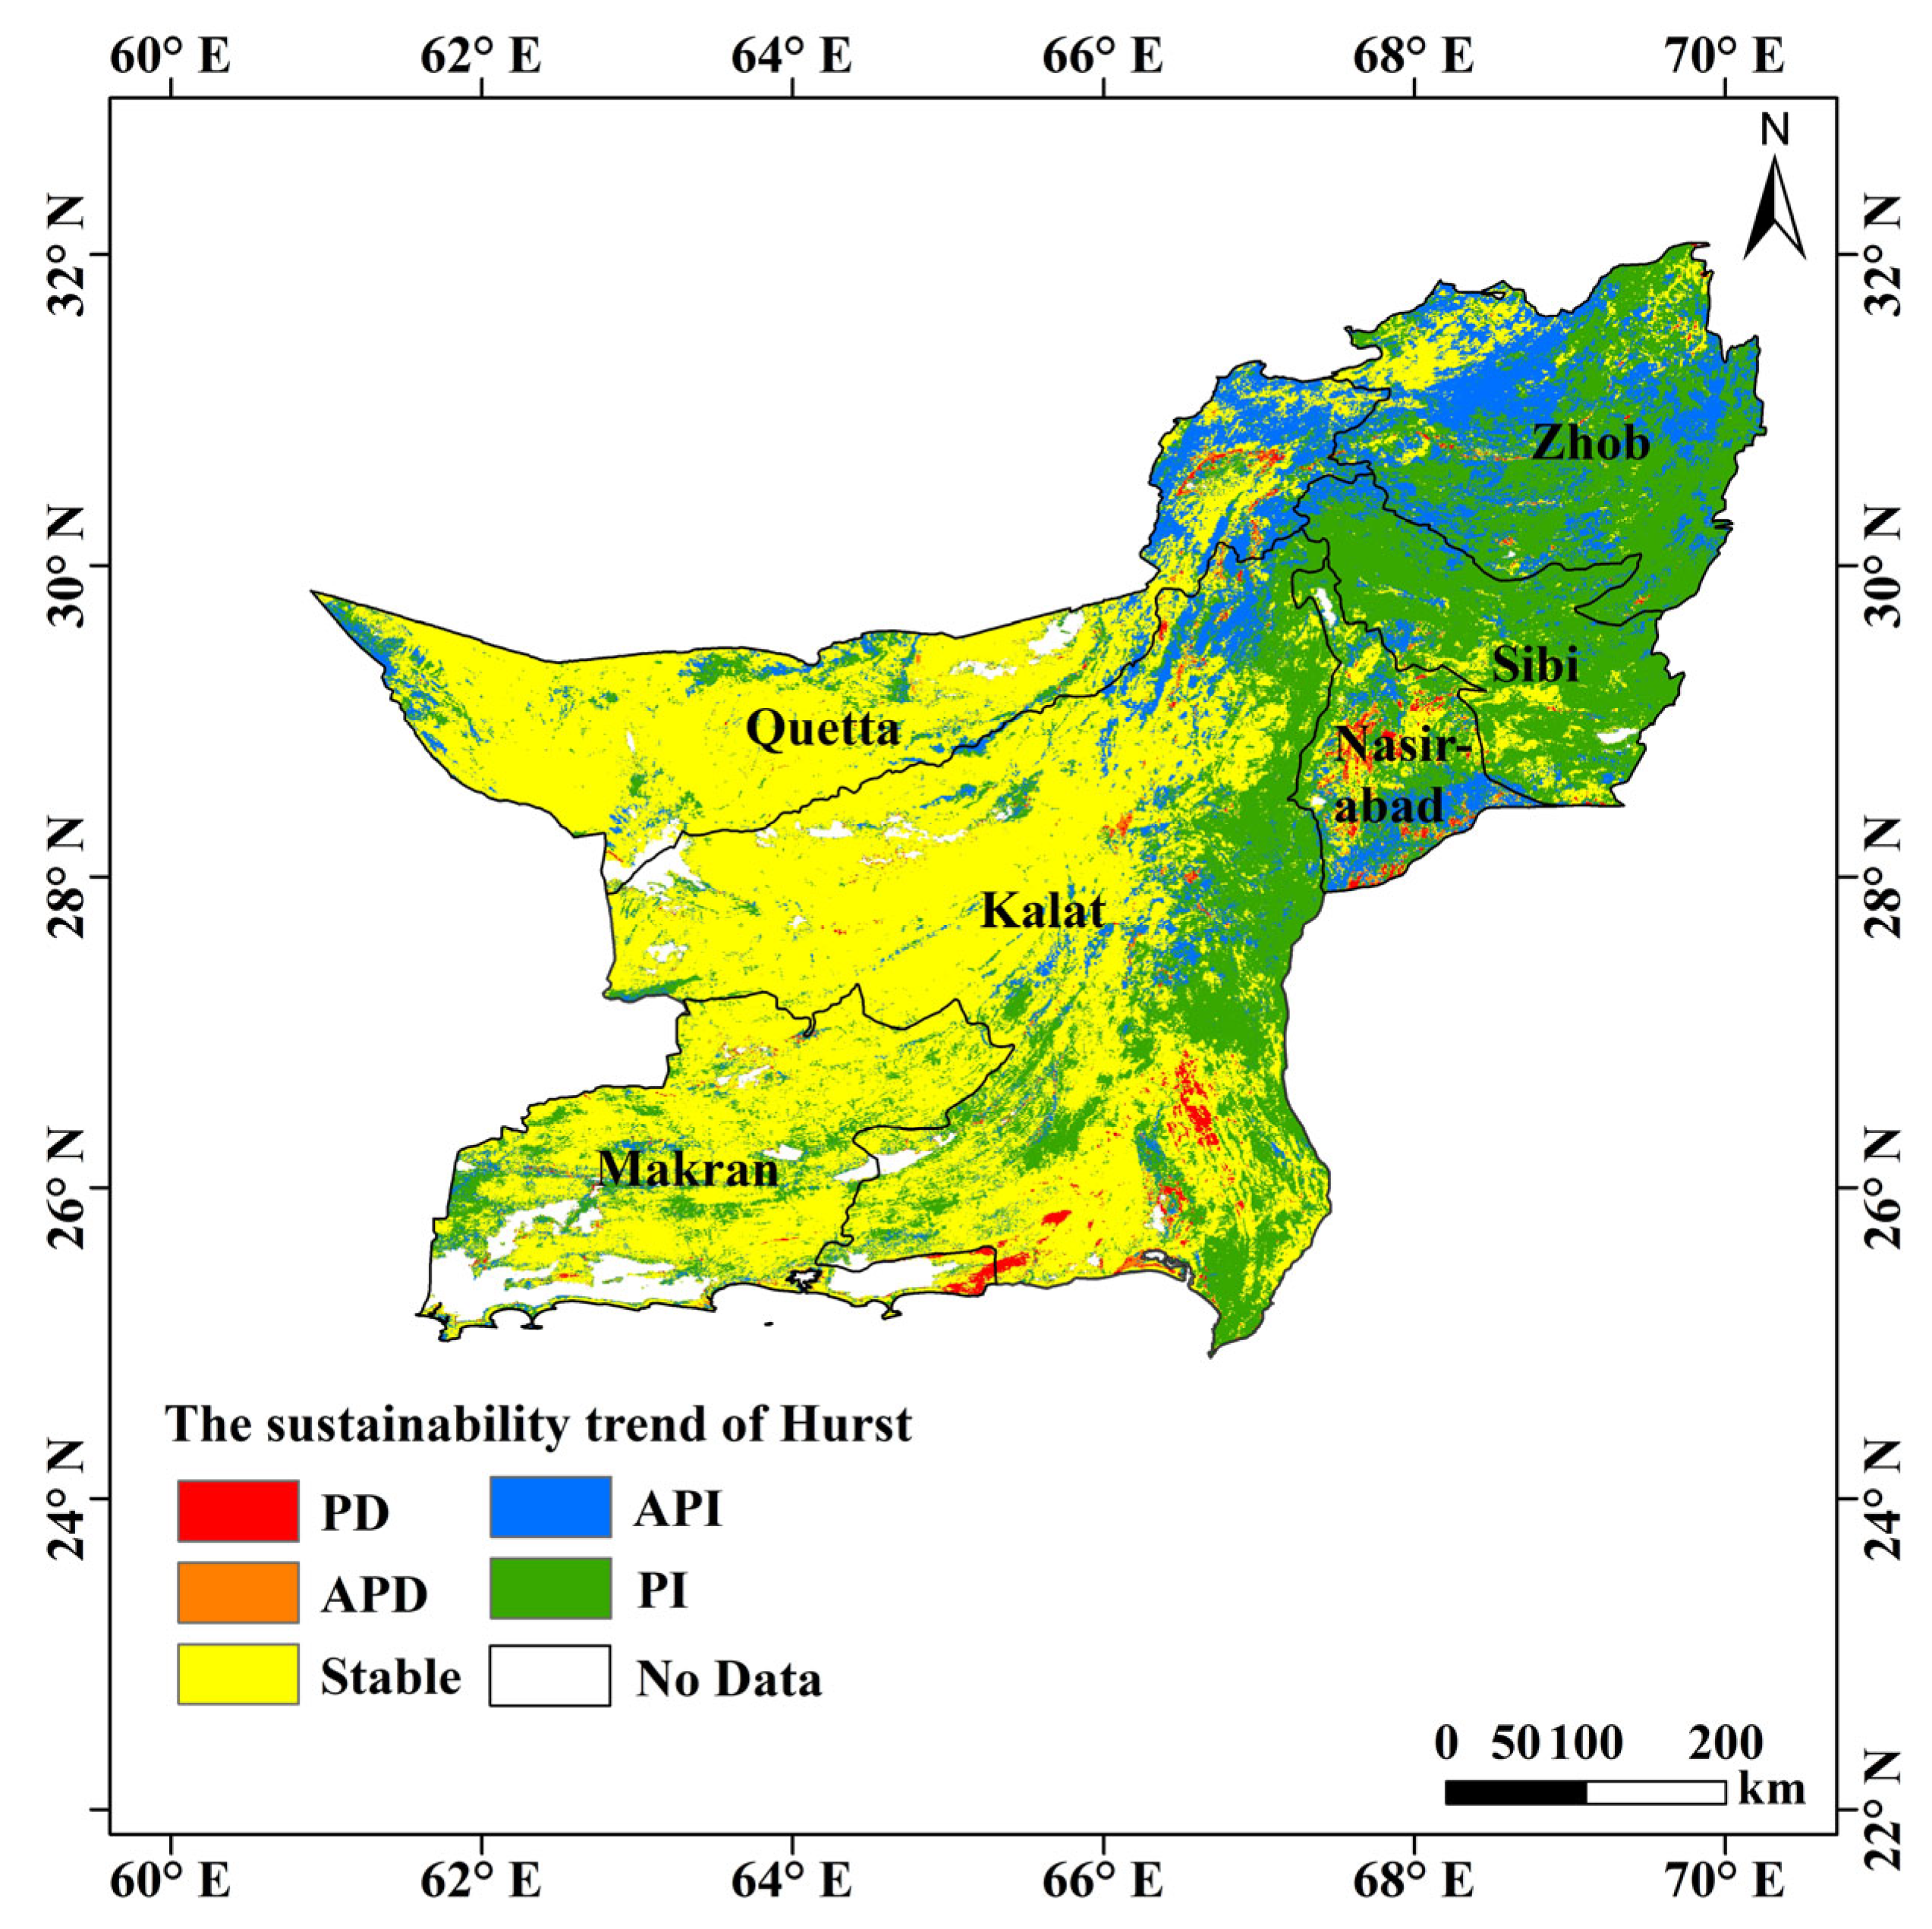
To explore the sustainability of future trends, the results of the trend analysis were coupled and overlaid with the Hurst index of sustainability analysis by referring to the trend classification of Yuan et al. [40]. From Table 6, it is found that the overall trend of the NDVI was mainly stable, with stronger improvement than degradation, showing strong persistence. A total of 31.70% of the areas continued to improve, and 1.33% continued to degrade; 12.64% of the areas will change from improvement to degradation, and 0.48% will change from degradation to improvement. Persistent degradation (PD) and anti-persistent degradation (APD) showed patchy and scattered characteristics, while persistent improvement (PI) and anti-persistent improvement (API) showed concentrated and contiguous characteristics (Figure 7).
The Makran, Kalat, Zhob, Sibi and Nasirabad districts are mainly sustainable and dominated by continuous improvement, and the vegetation is likely to continue to improve in the future. The lowest percentage of continuous improvement was in Quetta District, where a larger proportion of anti-sustainable improvement was accompanied by the occurrence of continuous degradation and where the vegetation is likely to be degraded in the future.
4. Discussion
This article analyzes the drivers of land degradation and restoration based on stepwise multiple regression using climatic and anthropogenic factors, and significant differences were found in the spatial distribution of the drivers of land degradation and restoration in Balochistan. Balochistan is located in an arid and semi-arid region with significant climate heterogeneity, with low precipitation and high temperature, which are not conducive to vegetation activity and result in severe forms of land degradation. With the increased elevation in the central and northeastern parts of the province, there is increased rainfall and decreased temperature, moderating the severe climatic constraints, and thus it is important to conduct land degradation studies based on the NDVI changes.
Balochistan is located in the southwestern part of Pakistan, and its southern region has a tropical climate with higher temperatures than other regions outside Pakistan. The administrative areas are mainly located in the arid and semi-arid zones and locally in the extreme arid zone. December to March (winter) and the end of June to the end of September(monsoon season) are the two major rainy seasons in Balochistan. The MAP in Balochistan ranged from 54.78 to 329.67 mm during 2000–2020, with a general trend of decreasing precipitation from northeast to west and southwest. The climate of Balochistan is dry, and rainfall is scarce and unevenly distributed, making the land susceptible to erosion [26]. There is a large regional temperature difference, with the TMP decreasing from higher than 29 °C in the southwest to lower than 21 °C in the northeast. The rate of the annual mean temperature change in Pakistan shows a spatially decreasing trend from the southwest to the north and east, with an overall fluctuating upward trend from 1979 to 2018, as well as significant warming in most regions, except the northern mountains [41]. As a result, vegetation growth in Balochistan is limited by the lack of moisture, while the increased temperature causes enhanced evapotranspiration and intensifies drought trends [42,43]. Ashraf reported that due to the high variability in precipitation, the eastern-central, southwestern, southern and some isolated southern coastal areas of Balochistan would be more vulnerable to severe droughts in the future, especially during winter and alternating wet and dry periods [44]. This is the main reason for the changes in land degradation due to the NDVI changes in Balochistan.
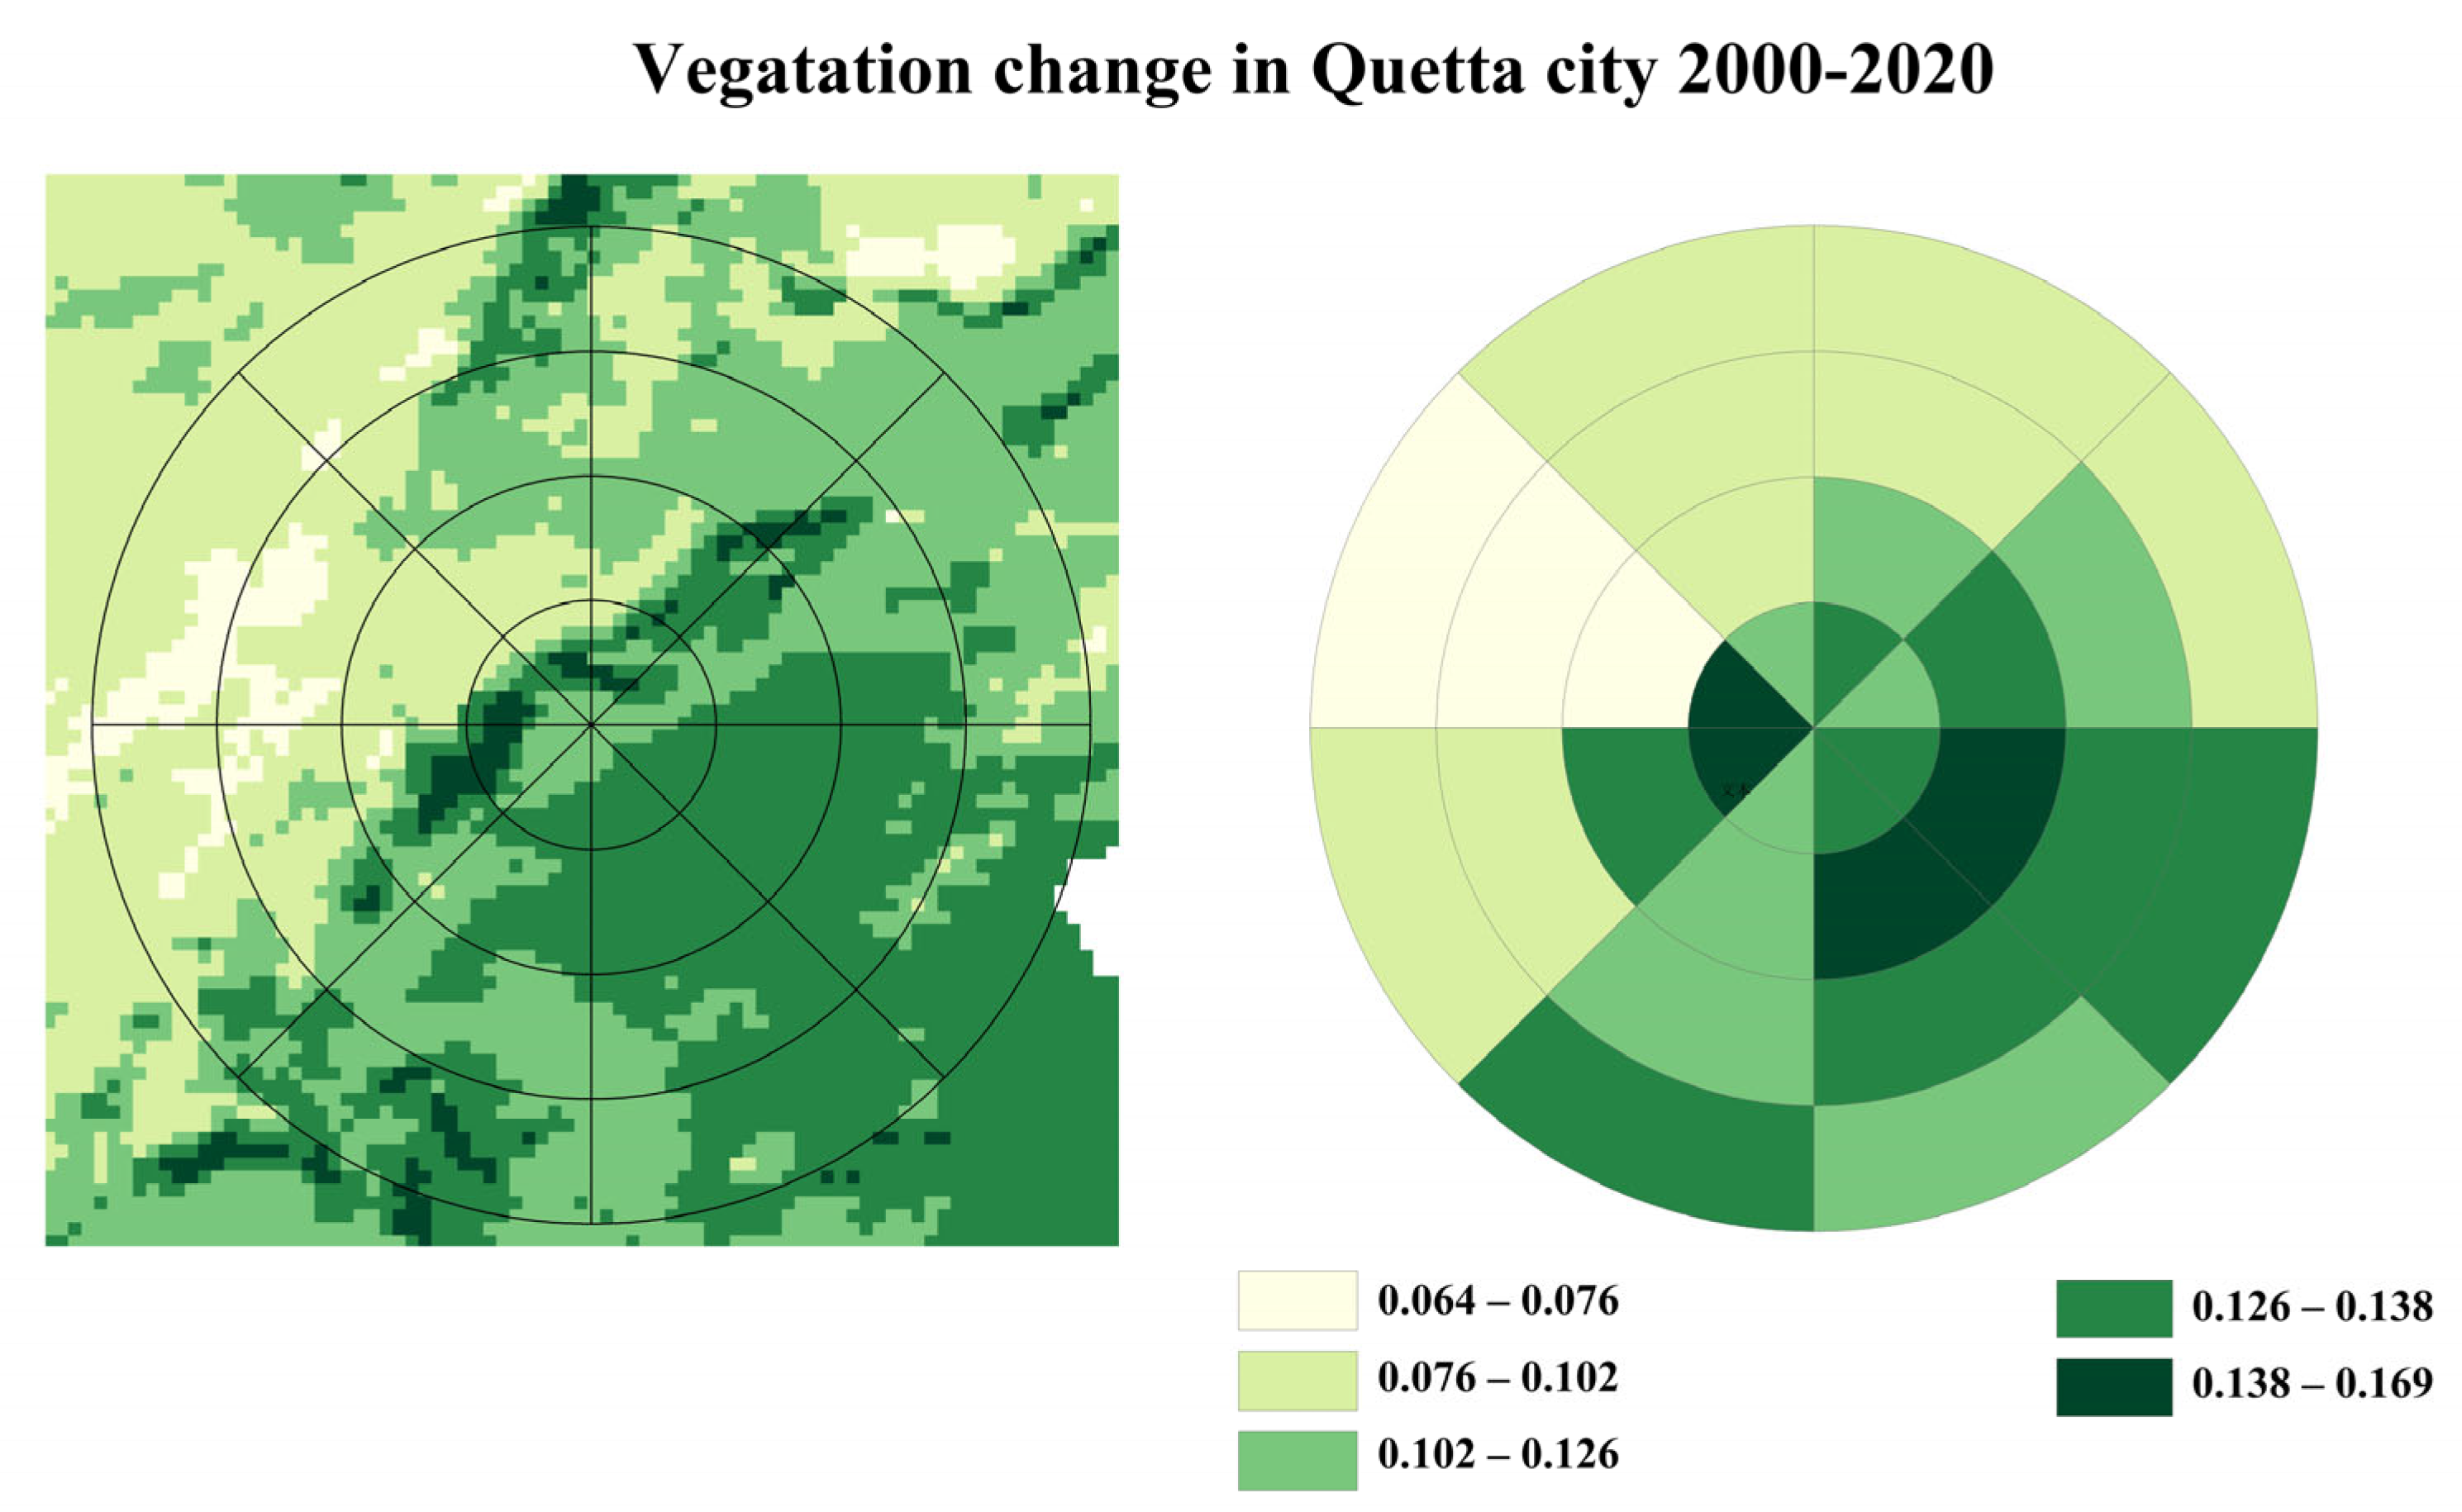
Relevant studies found that land degradation reflected by vegetation was a commonly used practice. Barjeece et al. [45] found that the vegetation conditions had improved, with significant vegetation recovery, with a similar trend for the future in Sindh, Pakistan, from 2000 to 2017. Balochistan Province borders Sindh Province to the east. The topography of Balochistan is diverse, and there are significant differences in the natural environment, climatic conditions, socioeconomic development and the intensity and manner of ecological engineering. Therefore, the direction and intensity of the impact of human activities on the NDVI changes show significant spatial and temporal differences. The results of this study show that changes in the NDVI caused by human activities are mainly positive, accompanied by fluctuation and increasing influence. The comparison revealed a strong consistency between the trends of the NDVI in Balochistan under the influence of human activities (Figure 5) and the trends of land degradation and restoration based on the NDVI (Figure 3). This indicates that the growth of the NDVI is not entirely dependent on natural conditions, while various human activities play an important role in the growth of vegetation in Balochistan [35]. Quetta, in Quetta District, is the capital of Balochistan. Taking Quetta City as an example for illustration, first, the average NDVI values from 2000 to 2020 were calculated. Then, eight radiating buffer zones at 5 km intervals were drawn, with the city as the center of the circle for quantitative analysis of the impact of urban expansion on vegetation change (Figure 8). Finally, the average NDVI values within the rings were counted. The results show that the overall vegetation cover in the urban periphery had a decreasing trend, and the direction of urban expansion was mainly to the north and west, indicating that urban expansion was another driving factor of a decreased NDVI due to anthropogenic activities.
Makran, Kalat, Zhob, Sibi and Nasirabad districts are mainly sustainable, with persistent improvement as the norm, and the vegetation is likely to continue to improve in the future. Quetta, as the capital of Balochistan, has the lowest percentage of persistent improvement due to urbanization, population development, economic structure and mining exploitation. In contrast, Quetta District has a higher percentage of anti-persistent improvement (Table 7), accompanied by persistent degradation, which may continue to degrade vegetation in the future.
5. Conclusions
In this article, we found that not only were precipitation and the NDVI significant but evapotranspiration (AEP and PET), MAP and TMP were also significant. The discoveries and limitations of this article are shown below.
- In terms of restoration and degradation, land restoration in Balochistan is mainly influenced by climate and combined anthropogenic and climate factors, with shares of 36.26 and 3.34%, respectively, while land degradation is mainly influenced by climate and anthropogenic factors, with shares of 0.76 and 0.08%, respectively.
- TMP, AET, PET and MAP are the dominant climatic factors affecting the spatial distribution of the NDVI; TMP with MAP and TMP with AET are the main interactive factors affecting the spatial distribution of the NDVI.
- The trend of the anthropogenic impact on the NDVI has obvious spatial heterogeneity, which generally shows the characteristics of intermediate local inhibition and peripheral promotion. In Balochistan, 91.02% of the area showed a positive influence of human activities on the NDVI, while about 8.98% of the area showed a negative influence.
- The continuity study shows that 31.70% of the areas in Balochistan persistently improved, while 1.33% persistently degraded; 12.64% of the areas will change from improvement to degradation, while 0.48% will change from degradation to improvement. Persistent degradation and anti-persistent degradation appear to be patchy and scattered, while persistent improvement and anti-persistent improvement appear to be concentrated and contiguous. Balochistan is in an arid zone comprising mostly desert vegetation; hence, future changes in vegetation cover and land degradation are still a concern.
The limitation is using inter-annual data for the analysis, which inevitably is subject to error. A more detailed analysis will take into account seasonal factors in the future. The influence of climate factors on the NDVI had a certain lag [46,47], which may bring certain errors to the results of residual analysis. The trend towards degradation requires closer examination to determine its causes. Future studies should consider field visits (e.g., vegetation species’ changes and soil erosion) to validate the remote sensing data. At the same time, more accurate remote sensing data is necessary to discuss the impact of the NDVI on land degradation in the future.
Author Contributions
X.C. was the main contributor to this work; X.C.: writing—original draft, conceptualization, supervision and formal analysis; Y.W.: funding acquisition; Y.C.: investigation; S.F.: software; Y.W. and N.Z.: writing—review and editing. All authors commented on the previous versions of the manuscript. All authors have read and agreed to the published version of the manuscript.
Funding
This research was funded by the Xinjiang Uygur Autonomous Region Regional Collaborative Innovation Project: Development and demonstration of green land rehabilitation technology in Gwadar Port of Pakistan (No. 2021E01021) and The Key Technical Talent Project of Chinese Academy of Sciences (Research on desertification technology along the “Belt and Road”).
Data Availability Statement
The meteorological data were obtained from the Terra Climate dataset, published by the University of Iowa (https://doi.org/10.1038/sdata.2017.191, accessed on 8 July 2022), which includes climate data, such as Srad, PET, AET, MAP and TMP. NDVI data come from the USGS official website (https://lpdaac.usgs.gov/products/mod13a1v006/, accessed on 8 July 2022). Other relevant data are listed in Table 1.
Conflicts of Interest
The authors declare no conflict of interest.
References
- McCammon, A.L. United nations conference on environment and development, held in Rio de Janeiro, Brazil, during 3–14 June 1992, and the’92 Global Forum, Rio de Janeiro, Brazil, 1–14 June 1992. Environ. Conserv. 1992, 19, 372–373. [Google Scholar] [CrossRef]
- Sims, N.; Green, C.; Newnham, G.; England, J.; Held, A.; Wulder, M.; Herold, M.; Cox, S.; Huete, A.; Kumar, L. Good practice guidance. SDG Indic. 2021, 15, 115. [Google Scholar]
- Nkonya, E.; Mirzabaev, A.; Von Braun, J. Economics of Land Degradation and Improvement—A Global Assessment for Sustainable Development; Springer Nature: Berlin/Heidelberg, Germany, 2016. [Google Scholar]
- Alexander, S. Good Practice Guidance-SDG Indicator 15.3.1; United Nations Convention to Combat Desertification: Bonn, Germany; New York, NY, USA, 2017. [Google Scholar]
- Li, A.; Wu, J.; Huang, J. Distinguishing between human-induced and climate-driven vegetation changes: A critical application of RESTREND in inner Mongolia. Landsc. Ecol. 2012, 27, 969–982. [Google Scholar] [CrossRef]
- Li, B.; Yu, W.; Wang, J. An analysis of vegetation change trends and their causes in Inner Mongolia, China from 1982 to 2006. Adv. Meteorol. 2011, 2011, 367854. [Google Scholar] [CrossRef]
- Jamali, S.; Jönsson, P.; Eklundh, L.; Ardö, J.; Seaquist, J. Detecting changes in vegetation trends using time series segmentation. Remote Sens. Environ. 2015, 156, 182–195. [Google Scholar] [CrossRef]
- Chang, Q.; Zhang, J.; Jiao, W.; Yao, F. A comparative analysis of the NDVIg and NDVI3g in monitoring vegetation phenology changes in the Northern Hemisphere. Geocarto Int. 2018, 33, 1–20. [Google Scholar] [CrossRef]
- Xiaona, G.; Ruishan, C.; Qiang, L. Processes, mechanisms, and impacts of land degradation in the IPBES Thematic Assessment. Acta Ecol. Sin. 2019, 39, 6567–6575. [Google Scholar]
- Huang, S.; Kong, J. Assessing land degradation dynamics and distinguishing human-induced changes from climate factors in the Three-North Shelter forest region of China. ISPRS Int. J. Geo-Inf. 2016, 5, 158. [Google Scholar] [CrossRef]
- Eckert, S.; Hüsler, F.; Liniger, H.; Hodel, E. Trend analysis of MODIS NDVI time series for detecting land degradation and regeneration in Mongolia. J. Arid. Environ. 2015, 113, 16–28. [Google Scholar] [CrossRef]
- Chen, X.; Wang, H. Spatial and temporal variations of vegetation belts and vegetation cover degrees in Inner Mongolia from 1982 to 2003. Acta Geogr. Sin. 2009, 64, 84–94. [Google Scholar]
- Meng, D.; Li, X.; Gong, H.; Qu, Y. Analysis of spatial-temporal change of NDVI and its climatic driving factors in Beijing-Tianjin-Hebei metropolis circle from 2001 to 2013. J. Geo-Inf. Sci. 2015, 17, 1001–1007. [Google Scholar]
- Yi, Y.; Wang, B.; Shi, M.; Meng, Z.; Zhang, C. Variation in vegetation and its driving force in the middle reaches of the Yangtze River in China. Water 2021, 13, 2036. [Google Scholar] [CrossRef]
- Guan, Q.; Yang, L.; Guan, W.; Wang, F.; Liu, Z.; Xu, C. Assessing vegetation response to climatic variations and human activities: Spatiotemporal NDVI variations in the Hexi Corridor and surrounding areas from 2000 to 2010. Theor. Appl. Climatol. 2019, 135, 1179–1193. [Google Scholar] [CrossRef]
- He, C.; Tian, J.; Gao, B.; Zhao, Y. Differentiating climate-and human-induced drivers of grassland degradation in the Liao River Basin, China. Environ. Monit. Assess. 2015, 187, 4199. [Google Scholar] [CrossRef] [PubMed]
- Ning, T.; Liu, W.; Lin, W.; Song, X. NDVI variation and its responses to climate change on the northern Loess Plateau of China from 1998 to 2012. Adv. Meteorol. 2015, 2015, 725427. [Google Scholar] [CrossRef]
- Liu, X.; Pan, Y.; Zhu, X.; Li, S. Spatiotemporal variation of vegetation coverage in Qinling-Daba Mountains in relation to environmental factors. Acta Geogr. Sin. 2015, 70, 705–716. [Google Scholar]
- Wang, J.; Zhao, J.; Li, C.; Zhu, Y.; Kang, C.; Gao, C. The spatial-temporal patterns of the impact of human activities on vegetation coverage in China from 2001 to 2015. Acta Geogr. Sin. 2019, 74, 504–519. [Google Scholar]
- Jin, K.; Wang, F.; Han, J.; Shi, S.; Ding, W. Contribution of climatic change and human activities to vegetation NDVI change over China during 1982–2015. Acta Geogr. Sin. 2020, 75, 961–974. [Google Scholar]
- Higginbottom, T.P.; Symeonakis, E. Assessing land degradation and desertification using vegetation index data: Current frameworks and future directions. Remote Sens. 2014, 6, 9552–9575. [Google Scholar] [CrossRef]
- Wessels, K.J.; Prince, S.D.; Malherbe, J.; Small, J.; Frost, P.E.; VanZyl, D. Can human-induced land degradation be distinguished from the effects of rainfall variability? A case study in South Africa. J. Arid. Environ. 2007, 68, 271–297. [Google Scholar] [CrossRef]
- Vu, Q.M.; Le, Q.B.; Vlek, P.L. Hotspots of human-induced biomass productivity decline and their social–ecological types toward supporting national policy and local studies on combating land degradation. Glob. Planet. Change 2014, 121, 64–77. [Google Scholar] [CrossRef]
- Evans, J.; Geerken, R. Discrimination between climate and human-induced dryland degradation. J. Arid. Environ. 2004, 57, 535–554. [Google Scholar] [CrossRef]
- Khetran, M.S.B.; Saeed, M.A. The CPEC and China-Pakistan relations: A case study on Balochistan. China Q. Int. Strateg. Stud. 2017, 3, 447–461. [Google Scholar] [CrossRef]
- Shafiq, M.; Kakar, M. Effects of drought on livestock sector in Balochistan Province of Pakistan. Int. J. Agric. Biol. 2007, 9, 657–665. [Google Scholar]
- Mann, H.B. Nonparametric tests against trend. Econom. J. Econom. Soc. 1945, 13, 245–259. [Google Scholar] [CrossRef]
- Kendall, M.G. Rank Correlation Methods. 1948. Available online: https://psycnet.apa.org/record/1948-15040-000 (accessed on 5 March 2023).
- Yue, S.; Pilon, P.; Cavadias, G. Power of the Mann–Kendall and Spearman’s rho tests for detecting monotonic trends in hydrological series. J. Hydrol. 2002, 259, 254–271. [Google Scholar] [CrossRef]
- Del Barrio, G.; Puigdefabregas, J.; Sanjuan, M.E.; Stellmes, M.; Ruiz, A. Assessment and monitoring of land condition in the Iberian Peninsula, 1989–2000. Remote Sens. Environ. 2010, 114, 1817–1832. [Google Scholar] [CrossRef]
- Wang, J.; Xu, C. Geodetector: Principle and prospective. Acta Geogr. Sin. 2017, 72, 116–134. [Google Scholar]
- Wang, J.F.; Li, X.H.; Christakos, G.; Liao, Y.L.; Zhang, T.; Gu, X.; Zheng, X.Y. Geographical detectors-based health risk assessment and its application in the neural tube defects study of the Heshun Region, China. Int. J. Geogr. Inf. Sci. 2010, 24, 107–127. [Google Scholar] [CrossRef]
- Hurst, H.E. Long-term storage capacity of reservoirs. Trans. Am. Soc. Civ. Eng. 1951, 116, 770–799. [Google Scholar] [CrossRef]
- Mandelbrot, B.B.; Wallis, J.R. Robustness of the rescaled range R/S in the measurement of noncyclic long run statistical dependence. Water Resour. Res. 1969, 5, 967–988. [Google Scholar] [CrossRef]
- Zhang, L.; Li, X.; Feng, J.; Rao, R.; He, T.; Chen, Y. Spatial-temporal changes of NDVI in yellow river basin and its dual response to climate change and human activities. Bull. Soil Water Conserv. 2021, 41, 1–11. [Google Scholar]
- Chandrasekaran, S.; Poomalai, S.; Saminathan, B.; Suthanthiravel, S.; Sundaram, K.; Abdul Hakkim, F.F. An investigation on the relationship between the Hurst exponent and the predictability of a rainfall time series. Meteorol. Appl. 2019, 26, 511–519. [Google Scholar] [CrossRef]
- Balkissoon, S.; Fox, N.; Lupo, A. Fractal characteristics of tall tower wind speeds in Missouri. Renew. Energy 2020, 154, 1346–1356. [Google Scholar] [CrossRef]
- Salomao, L.; Campanha, J.; Gupta, H. Rescaled range analysis of pluviometric records in Sao Paulo State, Brazil. Theor. Appl. Climatol. 2009, 95, 83–89. [Google Scholar] [CrossRef]
- Geerken, R.; Ilaiwi, M. Assessment of rangeland degradation and development of a strategy for rehabilitation. Remote Sens. Environ. 2004, 90, 490–504. [Google Scholar] [CrossRef]
- Yuan, L.; Jiang, W.; Shen, W.; Liu, Y.; Wang, W.; Tao, L.; Zheng, H.; Liu, X. The spatio-temporal variations of vegetation cover in the Yellow River Basin from 2000 to 2010. Acta Ecol. Sin. 2013, 33, 7798–7806. [Google Scholar]
- Zeng, D.; Wu, J.; Mu, Y.; Deng, M.; Wei, Y.; Sun, W. Spatial-temporal pattern changes of UTCI in the China-Pakistan economic corridor in recent 40 years. Atmosphere 2020, 11, 858. [Google Scholar] [CrossRef]
- Feng, X.; Fu, B.; Piao, S.; Wang, S.; Ciais, P.; Zeng, Z.; Lü, Y.; Zeng, Y.; Li, Y.; Jiang, X. Revegetation in China’s Loess Plateau is approaching sustainable water resource limits. Nat. Clim. Change 2016, 6, 1019–1022. [Google Scholar] [CrossRef]
- Gao, J.; Jiao, K.; Wu, S. Revealing the climatic impacts on spatial heterogeneity of NDVI in China during 1982–2013. Acta Geogr. Sin. 2019, 74, 534–543. [Google Scholar]
- Ashraf, M.; Routray, J.K. Spatio-temporal characteristics of precipitation and drought in Balochistan Province, Pakistan. Nat. Hazards 2015, 77, 229–254. [Google Scholar] [CrossRef]
- Bashir, B.; Cao, C.; Naeem, S.; Zamani Joharestani, M.; Bo, X.; Afzal, H.; Jamal, K.; Mumtaz, F. Spatio-temporal vegetation dynamic and persistence under climatic and anthropogenic factors. Remote Sens. 2020, 12, 2612. [Google Scholar] [CrossRef]
- Ma, B.; Wang, S.; Mupenzi, C.; Li, H.; Ma, J.; Li, Z. Quantitative contributions of climate change and human activities to vegetation changes in the Upper White Nile River. Remote Sens. 2021, 13, 3648. [Google Scholar] [CrossRef]
- Zhao, Y.; Feng, Q.; Lu, A. Spatiotemporal variation in vegetation coverage and its driving factors in the Guanzhong Basin, NW China. Ecol. Inform. 2021, 64, 101371. [Google Scholar] [CrossRef]
Figure 1.
Schematic diagram of the study area.

Figure 2.
Flowchart of study technique chart.

Figure 3.
Spatial distribution of driving factors of land degradation and restoration in Balochistan. CDD: climate-dominated degradation region; HDD: human-dominated degradation region; BDD: both factors-dominated degradation; CDR: climate-dominated restoration region; HDR: human-dominated restoration region; BDR: both factors-dominated restoration.

Figure 4.
Interactive effects of climate factors on NDVI in Balochistan, 2000–2020.

Figure 5.
Trends and significance analyses of anthropogenic impacts on NDVI. NS: Negative-Severe; NH: Negative-Heavy; NM: Negative-Medium; NL: Negative-Less; PL: Positive-Less; PM: Positive-Medium; PH: Positive-Heavy; PS: Positive-Severe.
Figure 5.
Trends and significance analyses of anthropogenic impacts on NDVI. NS: Negative-Severe; NH: Negative-Heavy; NM: Negative-Medium; NL: Negative-Less; PL: Positive-Less; PM: Positive-Medium; PH: Positive-Heavy; PS: Positive-Severe.

Figure 6.
Spatial distribution of Hurst index of NDVI in Balochistan, 2000–2020.

Figure 7.
Hurst index sustainability trends of NDVI in Balochistan, 2000–2020. PD: persistent degradation; APD: anti-persistent degradation; PI: persistent improvement; API: anti-persistent improvement.
Figure 7.
Hurst index sustainability trends of NDVI in Balochistan, 2000–2020. PD: persistent degradation; APD: anti-persistent degradation; PI: persistent improvement; API: anti-persistent improvement.

Figure 8.
Influence of human activities on vegetation coverage.


Table 1.
Data sources and basic characteristics.
| Data | Data Source | Spatial Resolution | Time Period |
|---|---|---|---|
| NDVI | MODIS (MOD13A1) | 500 m | 2000–2020 |
| SRAD | TerraClimate | 4638.3 m | 2000–2020 |
| PET | TerraClimate | 4638.3 m | 2000–2020 |
| AET | TerraClimate | 4638.3 m | 2000–2020 |
| TMP | TerraClimate | 4638.3 m | 2000–2020 |
| MAP | TerraClimate | 4638.3 m | 2000–2020 |
Note: All abbreviations in this manuscript are consistent.
Table 2.
Spatial distribution of drivers of land degradation and restoration in Balochistan.
| Slope | Trend of Factor | Percentage (%) |
|---|---|---|
| <−0.0005 | CDD | 0.76 |
| <−0.0005 | BDD | 0.02 |
| <−0.0005 | HDD | 0.08 |
| ≥0.0005 | CDR | 36.26 |
| ≥0.0005 | BDR | 3.34 |
| ≥0.0005 | HDR | 1.56 |
| −0.0005–0.0005 | Stable | 44.19 |
| No impact | 13.79 |
Note: All abbreviations in this manuscript are consistent.
Table 3.
Statistical q-value of climate influence factors in Balochistan, 2000–2020.
| Year | AET | MAP | PET | SRAD | TMP |
|---|---|---|---|---|---|
| 2000 | 0.139 | 0.140 | 0.145 | 0.056 | 0.227 |
| 2001 | 0.152 | 0.156 | 0.156 | 0.041 | 0.204 |
| 2002 | 0.112 | 0.101 | 0.150 | 0.069 | 0.199 |
| 2003 | 0.255 | 0.227 | 0.184 | 0.060 | 0.226 |
| 2004 | 0.111 | 0.099 | 0.115 | 0.052 | 0.196 |
| 2005 | 0.126 | 0.184 | 0.184 | 0.137 | 0.230 |
| 2006 | 0.142 | 0.140 | 0.159 | 0.219 | 0.220 |
| 2007 | 0.182 | 0.170 | 0.172 | 0.130 | 0.165 |
| 2008 | 0.206 | 0.213 | 0.145 | 0.080 | 0.207 |
| 2009 | 0.148 | 0.154 | 0.197 | 0.049 | 0.223 |
| 2010 | 0.389 | 0.378 | 0.188 | 0.240 | 0.206 |
| 2011 | 0.224 | 0.177 | 0.210 | 0.196 | 0.191 |
| 2012 | 0.145 | 0.146 | 0.223 | 0.090 | 0.202 |
| 2013 | 0.207 | 0.176 | 0.195 | 0.188 | 0.208 |
| 2014 | 0.148 | 0.148 | 0.202 | 0.121 | 0.219 |
| 2015 | 0.257 | 0.238 | 0.208 | 0.126 | 0.207 |
| 2016 | 0.260 | 0.244 | 0.208 | 0.177 | 0.224 |
| 2017 | 0.189 | 0.184 | 0.210 | 0.065 | 0.225 |
| 2018 | 0.175 | 0.173 | 0.153 | 0.078 | 0.165 |
| 2019 | 0.109 | 0.117 | 0.214 | 0.106 | 0.195 |
| 2020 | 0.241 | 0.214 | 0.262 | 0.102 | 0.223 |
| Average | 0.210 | 0.203 | 0.208 | 0.086 | 0.237 |
Note: The p-test values of q-values for each factor 2000–2020 are less than 0.01.
Table 4.
Classification of anthropogenic impact on NDVI.
| Impact | Effect | Slope | Area Proportion (%) | Average |
|---|---|---|---|---|
| Positive | Severe | >0.0120 | 0.0010 | 0.0130 |
| Heavy | 0.0070 to 0.0120 | 0.0640 | 0.0082 | |
| Medium | 0.0040 to 0.0070 | 0.4175 | 0.0050 | |
| Less | 0 to 0.0040 | 90.5416 | 0.0005 | |
| Negative | Less | −0.0020 to 0.0040 | 8.7764 | −0.0003 |
| Medium | −0.0040 to −0.0020 | 0.1488 | −0.0027 | |
| Heavy | −0.0160 to 0.0040 | 0.0506 | −0.0059 | |
| Severe | <−0.0160 | 0.0001 | −0.0192 |
Table 5.
Hurst index statistics for NDVI in Balochistan, Pakistan, 2000–2020.
| Impact Level | Effect | Area Proportion (%) | Average |
|---|---|---|---|
| H < 0.25 | Strong | 0.07 | 0.23 |
| 0.25 ≤ H < 0.35 | Stronger | 1.67 | 0.32 |
| 0.35 ≤ H < 0.45 | Weaker | 12.09 | 0.41 |
| 0.45 ≤ H < 0.50 | Weak | 13.30 | 0.48 |
| 0.50 ≤ H < 0.55 | Weak | 17.00 | 0.53 |
| 0.55 ≤ H < 0.65 | Weaker | 32.72 | 0.60 |
| 0.65 ≤ H < 0.75 | Stronger | 18.65 | 0.69 |
| H > 0.75 | Strong | 4.51 | 0.78 |
Table 6.
Persistence of NDVI changes in Balochistan, 2000–2020.
| Slope | Effect | Area Proportion (%) | Average |
|---|---|---|---|
| ≤−0.0005 | >0.5 | PD | 1.33 |
| ≤−0.0005 | <0.5 | APD | 0.48 |
| −0.0005–0.0005 | >0.5 or <0.5 | Stable | 53.85 |
| ≥0.0005 | <0.5 | API | 12.64 |
| ≥0.0005 | >0.5 | PI | 31.70 |
Table 7.
The persistence of NDVI changes for special districts in Balochistan.
| District | PD | APD | Stable | API | PI |
|---|---|---|---|---|---|
| Zhob | 0.41% | 0.17% | 11.06% | 33.27% | 55.08% |
| Sibi | 0.26% | 0.10% | 11.30% | 9.19% | 79.16% |
| Quetta | 0.61% | 0.42% | 73.57% | 16.04% | 9.36% |
| Nasirabad | 5.62% | 2.95% | 24.50% | 21.82% | 45.11% |
| Kalat | 1.55% | 0.40% | 63.35% | 6.56% | 28.14% |
| Makran | 1.56% | 0.38% | 75.40% | 4.47% | 18.19% |
Disclaimer/Publisher’s Note: The statements, opinions and data contained in all publications are solely those of the individual author(s) and contributor(s) and not of MDPI and/or the editor(s). MDPI and/or the editor(s) disclaim responsibility for any injury to people or property resulting from any ideas, methods, instructions or products referred to in the content. |
© 2023 by the authors. Licensee MDPI, Basel, Switzerland. This article is an open access article distributed under the terms and conditions of the Creative Commons Attribution (CC BY) license (https://creativecommons.org/licenses/by/4.0/).
Share and Cite
MDPI and ACS Style
Chen, X.; Wang, Y.; Chen, Y.; Fu, S.; Zhou, N. NDVI-Based Assessment of Land Degradation Trends in Balochistan, Pakistan, and Analysis of the Drivers. Remote Sens. 2023, 15, 2388. https://doi.org/10.3390/rs15092388
AMA Style
Chen X, Wang Y, Chen Y, Fu S, Zhou N. NDVI-Based Assessment of Land Degradation Trends in Balochistan, Pakistan, and Analysis of the Drivers. Remote Sensing. 2023; 15(9):2388. https://doi.org/10.3390/rs15092388
Chicago/Turabian StyleChen, Xiaoxin, Yongdong Wang, Yusen Chen, Shilin Fu, and Na Zhou. 2023. "NDVI-Based Assessment of Land Degradation Trends in Balochistan, Pakistan, and Analysis of the Drivers" Remote Sensing 15, no. 9: 2388. https://doi.org/10.3390/rs15092388
Note that from the first issue of 2016, this journal uses article numbers instead of page numbers. See further details here.