1. Introduction
Precipitation plays a vital role in the water cycle. Accurate and reliable precipitation records are essential to the management of weather, climate, hydrology, and water resources [
1,
2,
3]. Located in the hinterland of the Tibetan Plateau (TP), the Three River Headwaters (TRH) region is known as the ‘Water Tower of China’. It is one of the areas with the highest concentration of biodiversity at high altitudes in the world, and is also an extremely important ecological barrier in China [
4,
5]. Due to its special geographical location and climatic conditions, the ecosystem in the TRH region is extremely vulnerable, and is also a “sensitive area” and “start-up area” for climate change in East Asia and even globally [
6]. Therefore, it is imperative to produce credible datasets to better understand precipitation events for climate change adaptation across the TRH. However, obtaining accurate precipitation data in the TRH is challenging due to its harsh geographical conditions and sparse rain gauge networks [
7].
Currently, there are three types of gridded precipitation datasets available: gauge-based, satellite-derived, and reanalysis [
8,
9,
10]. Gauge-based datasets are interpolated by employing various methods based on lots of gauge observations [
10,
11,
12]. Gauge-based products are widely used to investigate variations in precipitation events and water cycles [
13,
14]. Rain gauge stations can be unevenly distributed in deserts and mountainous regions [
12,
15]. In light of this, satellite-derived datasets are used to make up for the shortage of gauge observation stations, which can provide homogeneous spatial precipitation data from across the globe [
16]. Nevertheless, satellite datasets may contain systematic errors and biases. Accordingly, to obtain more precise precipitation estimates, the results of satellite products are merged with rain gauge observations [
17,
18,
19,
20]. In addition, it is also worth noting that satellite observation data are not readily available for research on climate change since they only record a short period. Analysis datasets are also widely used in the estimation of precipitation variations. The reanalysis system combines irregular observation datasets with models that include many physical and dynamic parameterizations to provide integrated estimates of the weather system. Reanalysis datasets are frequently used in the climatology community [
21,
22].
Studies have been conducted to assess precipitation datasets from around the Tibetan Plateau [
10,
23,
24,
25,
26]. You et al. (2015) evaluated various precipitation datasets against the gridded observation dataset across the TP [
27]. They found that most products can broadly capture spatial and temporal variabilities; however, the amount of precipitation in the southeast regions of the TP is often overestimated. Tan et al. (2020) compared three gridded precipitation products (Asian Precipitation—Highly Resolved Observational Data Integration Towards Evaluation of Water Resources, APHRODITE, Climate Hazards Group InfraRed Precipitation with Station data, CHIRPS, and Precipitation Estimation from Remotely sensed Information using Artificial Neural Networks—Climate Data Record, PERSIANN-CDR) with rain gauge data across the TP, reporting that APHRODITE can outperform CHIRPS and PERSIANN-CDR when applied to the TP for climate change study [
24]. The majority of previous studies only examined mean or extreme precipitation using one or several datasets. Additionally, the results are hard to compare due to different dataset areas, time periods, data processing methods, and assessment metrics. Therefore, there is an urgent need for a comprehensive assessment of climatic characteristics and extreme precipitation across the TRH with the existing gauge-based precipitation, satellite products, and reanalysis datasets using the same observational metrics.
In this paper, a comprehensive comparison of six precipitation datasets (GPCC, CRU, P-CDR, IMERG, ERA5, and CRA40) is presented based on observational datasets (CN05.1). We considered the following questions: (1) How reliable are the six precipitation datasets in reproducing the precipitation features in the TRH in comparison to the gridded observation dataset? (2) Which dataset outperforms the others in capturing the TRH’s annual mean climatology, interannual variability, long-term trends, and annual cycle of precipitation? (3) Which dataset shows higher skill in terms of detecting daily and extreme precipitation? The results of this study are useful for promoting our understanding of precipitation characteristics throughout the TRH region and for further research about hydrometeorological disasters.
2. Data and Methods
2.1. Study Area
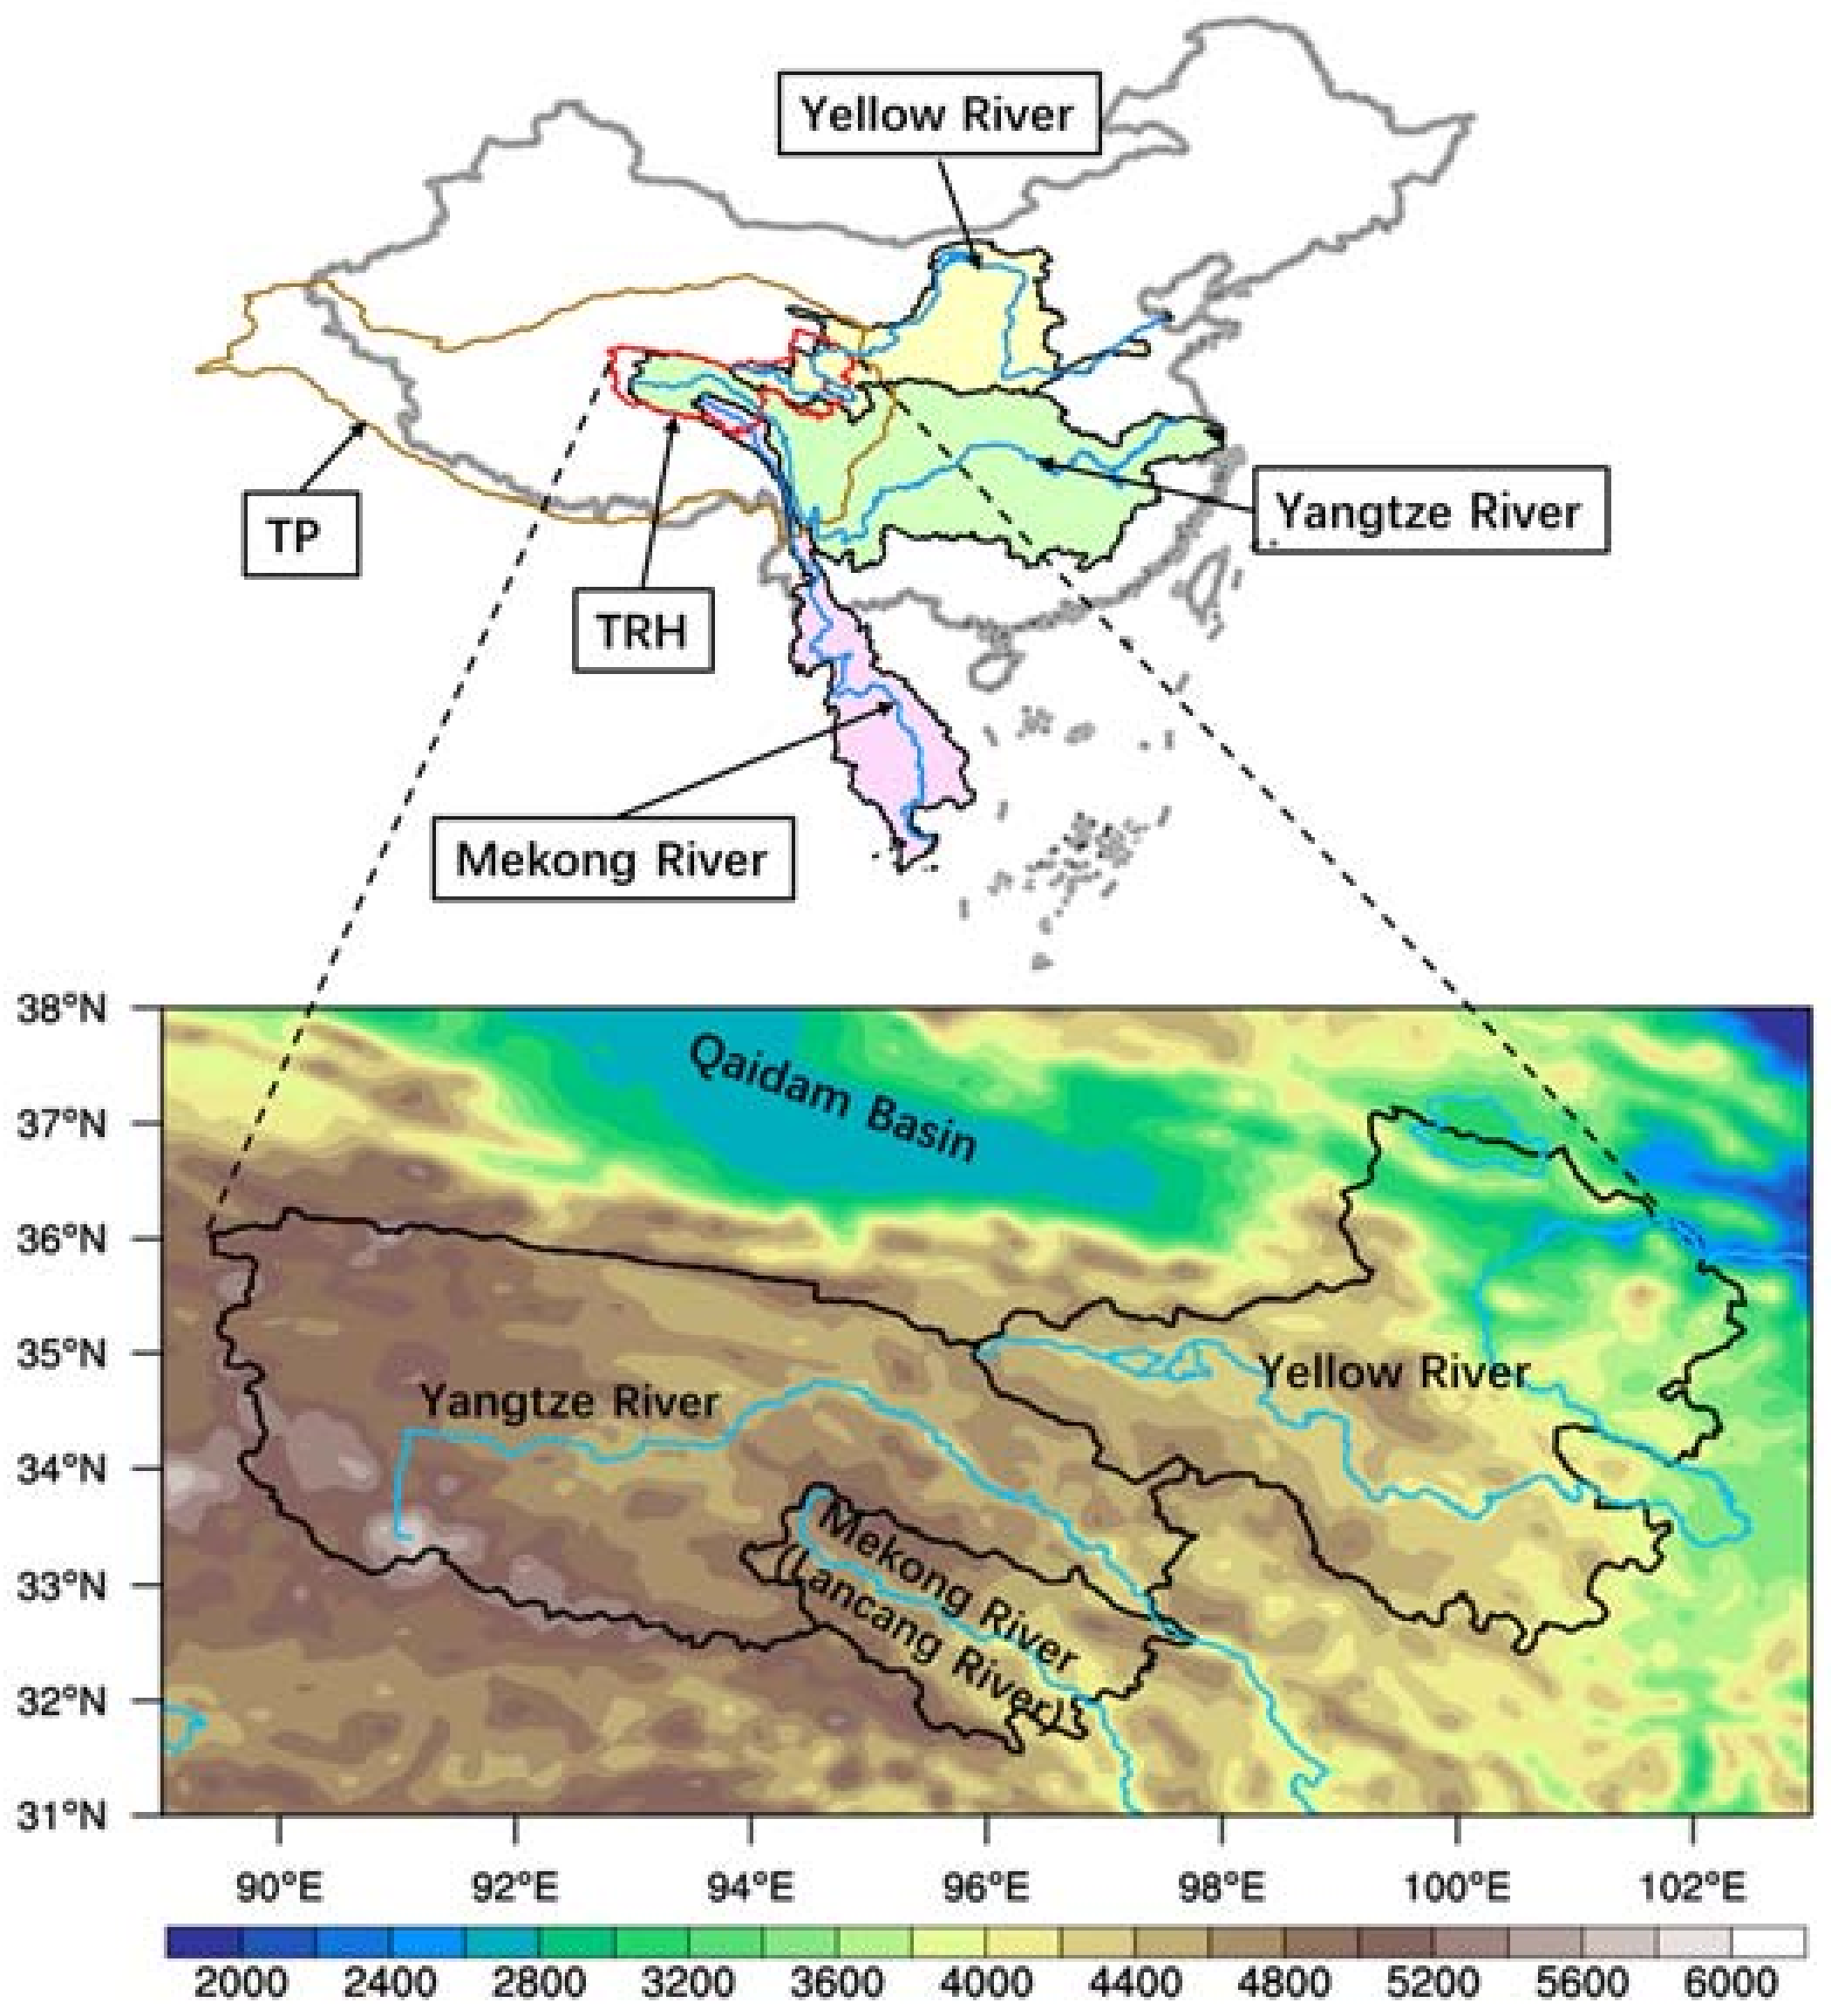
The Three River Headwaters region is located between 31°39′ and 37°10′N and 89°24′ and 102°27′E in the hinterland of the Tibetan Plateau (
Figure 1). Known as the ‘Water Tower of China’, the TRH region is the headwaters of the Yangtze River, Yellow River, and Mekong River (known as the Lancang River in China). The TRH region provides 2%, 38%, and 15% of the total water supply for the Yangtze River, Yellow River, and Mekong River, respectively [
28]. It is also home to the world’s highest, largest, and richest type of wetland ecosystem in the plateau. The entire area occupies 3.95 × 10
5 km
2, with an elevation ranging from 1954 to 6821 m above sea level, and a mean elevation of over 4000 m [
29]. It is a typical highland continental monsoon region with wet and dry seasons [
30]. The average annual precipitation is approximately 262.2 to 772.8 mm. The rainy season runs from May to October and accounts for more than 80% of the annual precipitation [
31,
32].
2.2. Data Description
In this study, we employ three types of precipitation datasets, including two gauge-based gridded precipitation datasets (GPCC and CRU), two satellite-derived precipitation datasets (P-CDR and IMERG), and two reanalysis datasets (CRA40 and ERA5). GPCC, CRU, P-CDR, CRA40, and ERA5 for the period 1983–2014 are employed to analyze climatology and the annual cycle of precipitation; P-CDR and IMERG for the period 2001–2014 are employed to detect the daily precipitation events. The details of the datasets are provided below (
Table 1).
2.2.1. Gauge-Based Gridded Precipitation
CN05.1: The daily gridded dataset CN05.1 supplied by the China Meteorological Administration (CMA) is used for the observed precipitation. The data are interpolated from about 2400 weather stations across China [
33]. This dataset has been extensively employed to evaluate datasets and climate models and to analyze long-term climatic variations [
2,
27,
40,
41,
42].
GPCC: GPCC Full Data Monthly Product V2020 is developed by the Global Precipitation Climatology Center (GPCC) [
34]. The monthly rainfall records are developed from about 80,000 weather stations around the world.
CRU: CRU v4.03 is a long-term monthly climate variable product developed by the University of East Anglia on a global scale [
35]. CRU is based on about 4000 weather stations worldwide (excluding Antarctica and only on land).
2.2.2. Satellite-Derived Precipitation
P-CDR: P-CDR is a quasi-global daily precipitation dataset created by the University of California in Irvine [
36]. The PERSIANN algorithm is used to calculate precipitation estimates from GridSat-B1 IR satellite data. The National Center for Environmental Prediction (NCEP) stage IV hourly precipitation records are trained using an artificial neural network. In addition, the Global Precipitation Climatology Project (GPCP) precipitation data are used to improve P-CDR.
IMERG: As the successor of the Tropical Rainfall Measuring Mission (TRMM), Integrated Multi-satellite Retrievals for Global Precipitation Measurement (IMERG) is a new-generation dataset [
37,
43]. IMERG is generated from various measurements of Global Precipitation Measurement (GPM), including infrared, passive microwave, and radar data. Here, Level 3 daily product V06 is employed.
2.2.3. Reanalysis Datasets
ERA5: ERA5 is the latest-generation atmospheric reanalysis dataset from the European Centre for Medium-Range Weather Forecasts (ECMWF) [
38]. ERA5 is derived from the ECMWF Integrated Forecasting System (IFS) and a 4D-Var data assimilation system [
44].
CRA40: CRA40 is China’s first generation of a global reanalysis dataset produced by the National Meteorological Information Center (NMIC) of the CMA. CRA40 utilizes conventional (surface observation dataset, pilot balloon observation dataset, and radiosonde datasets) as well as satellite data in its assimilation system to incorporate more observations from across China [
39,
45,
46].
2.3. Extreme Precipitation Indices
The extreme precipitation indices are developed by the Expert Team on Climate Change Detection and Indices (ETCCDI) to facilitate the study of extreme precipitation events [
47]. There are four categories of extreme precipitation indices: the intensity, percentile-based threshold, frequency, and duration indices.
Table 2 lists the definitions and units of the nine ETCCDI indices employed in our analysis [
48]. All indices are computed as annual values based on daily time series. To facilitate the inter-comparison of different datasets, the extreme precipitation indices are first calculated on a native grid of observations and products, and then interpolated to a 0.5° resolution grid via iterative improvement objective analysis and bilinear interpolation. This interpolation method is widely used in meteorological studies (available in NCAR Command Language (NCL);
www.ncl.ucar.edu/ (accessed on 23 October 2021)) [
49].
2.4. Comparative Assessment Metrics
In this study, several metrics are employed to assess the performance of precipitation datasets against the gridded observation results. The detailed equations are listed in
Table 3. The correlations and errors between the observations and precipitation products are determined by using correlation coefficients (CC), relative biases (RB), and root mean square errors (RMSE). Detection capability and accuracy are measured by the probability of detection (POD), false alarm rate (FAR), F
score, and precision.
POD measures the likelihood of the product correctly detecting precipitation events among all observed precipitation events. FAR estimates how many rainfall events are falsely detected by a product out of all precipitation events detected. Precision denotes the proportion of all detected rainfall events that are successfully detected. Fscore combines the characteristics of accurate, false, and missing estimations. Moreover, precipitation amounts are divided into five groups (mm/day): 0.1–1 (tiny precipitation), 1–5 (light precipitation), 5–10 (moderate precipitation), 10–20 (heavy precipitation), and >20 (torrential precipitation). Different precipitation intensities are also analyzed for precipitation detection capability.
Furthermore, a Taylor diagram is applied to quantify the performance of various datasets [
50]. A Taylor diagram is a polar plot consisting of the correlation coefficient (CC) and the ratio of the standard deviations (RSD). RSD > 1 (<1) indicates that the dataset features more (less) variability than the observations. The centered normalized root mean square (RMS) difference can be calculated from these two variables and represents the distance between any given point and the reference point. As CC and RSD approach 1 and as centered normalized RMS approaches 0, the product’s results are more accurate.
3. Results
3.1. Climatology, Interannual Variability, and Long-Term Trends of Annual Mean Precipitation
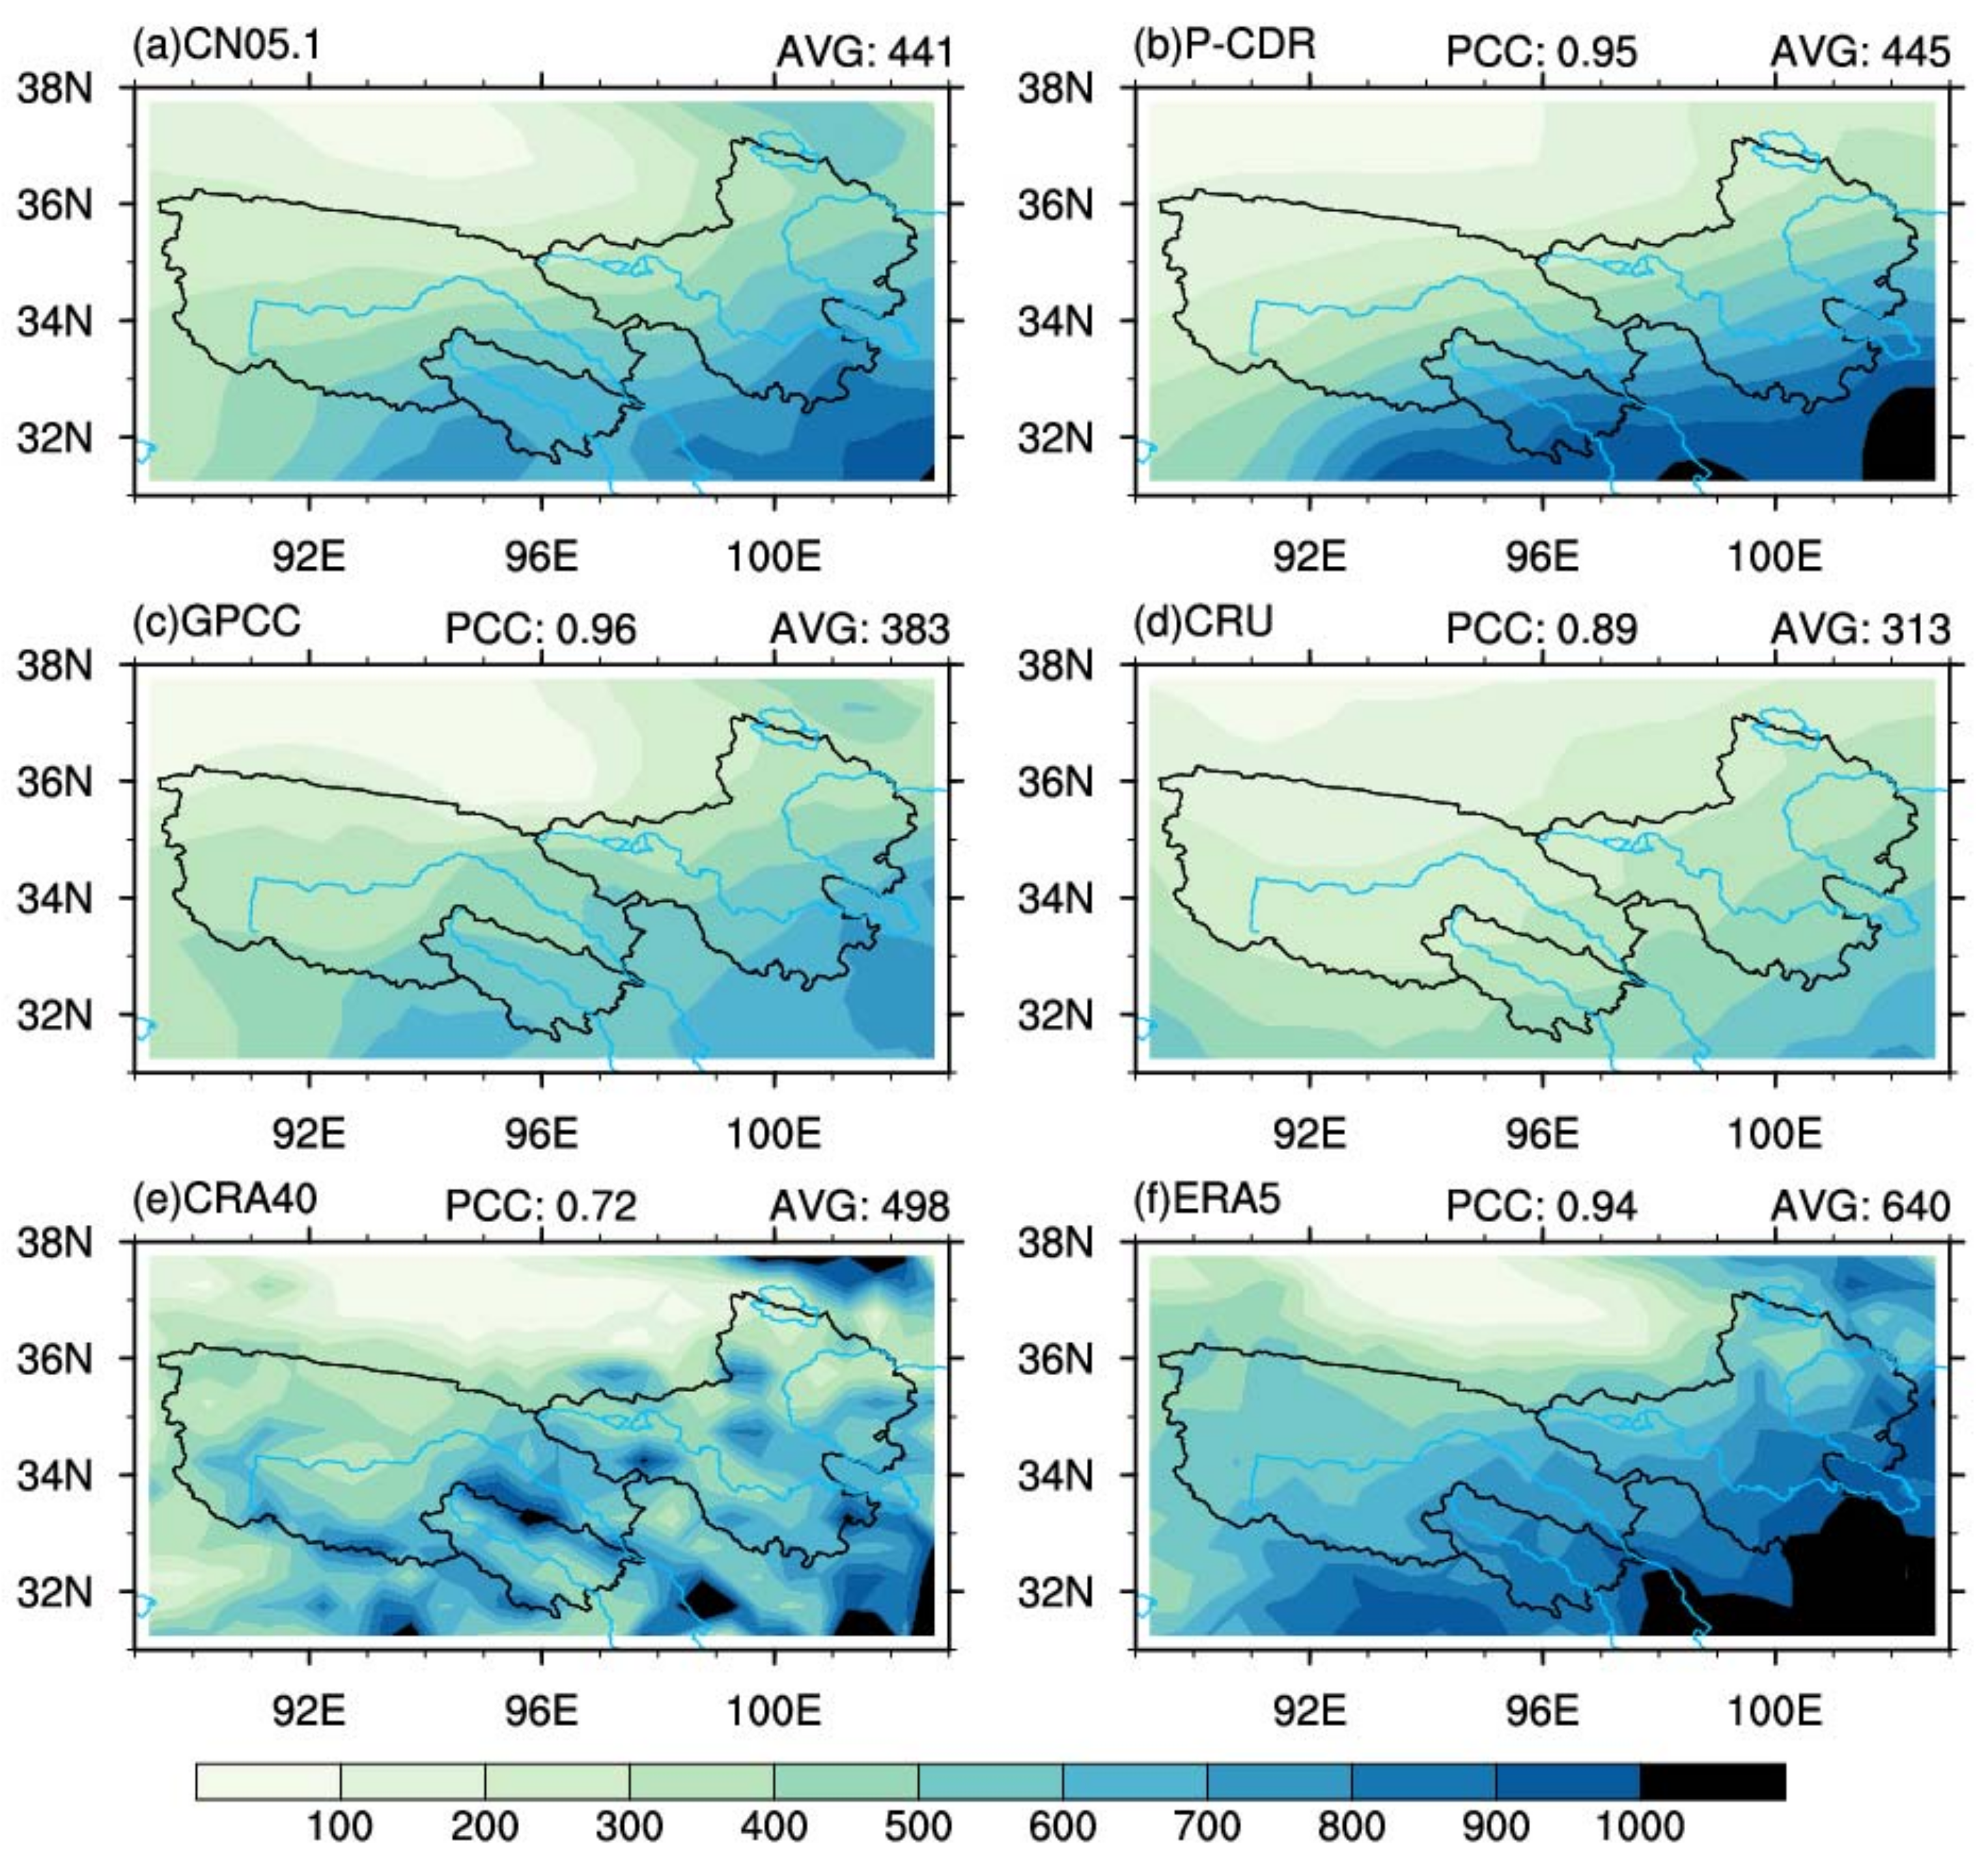
Figure 2 shows the annual mean climatological precipitation across the TRH region based on the observation dataset and five datasets. In the observation dataset CN05.1, there is an increase from the northwest to the southeast. The spatial distributions of annual mean climatology derived from five datasets are generally consistent with the observed values (
Figure 2). In addition, CRA40 exhibits some local precipitation centers. The pattern correlation coefficients (PCCs) of all datasets except CRU (0.89) and CRA40 (0.72) are above 0.94, indicating that the five datasets are highly effective at reproducing the spatial patterns of annual mean precipitation in the TRH region. This implies that the datasets can accurately depict the climatology of the area. The regional averages of annual precipitation across the TRH region are 441, 445, 383, 313, 498, and 640 mm/year for CN05.1, P-CDR, GPCC, CRU, CRA40, and ERA5, respectively. P-CDR exhibits the closest regional average of the annual mean climatology to the observation dataset; however, it overestimates the annual precipitation in the southeast and underestimates it in the northwest. CRU significantly undervalues the annual mean climatology, whereas ERA5 dramatically overvalues the annual mean climatology. GPCC and P-CDR exhibit an adequate performance, with higher PCC and similar AVG to the observed dataset.
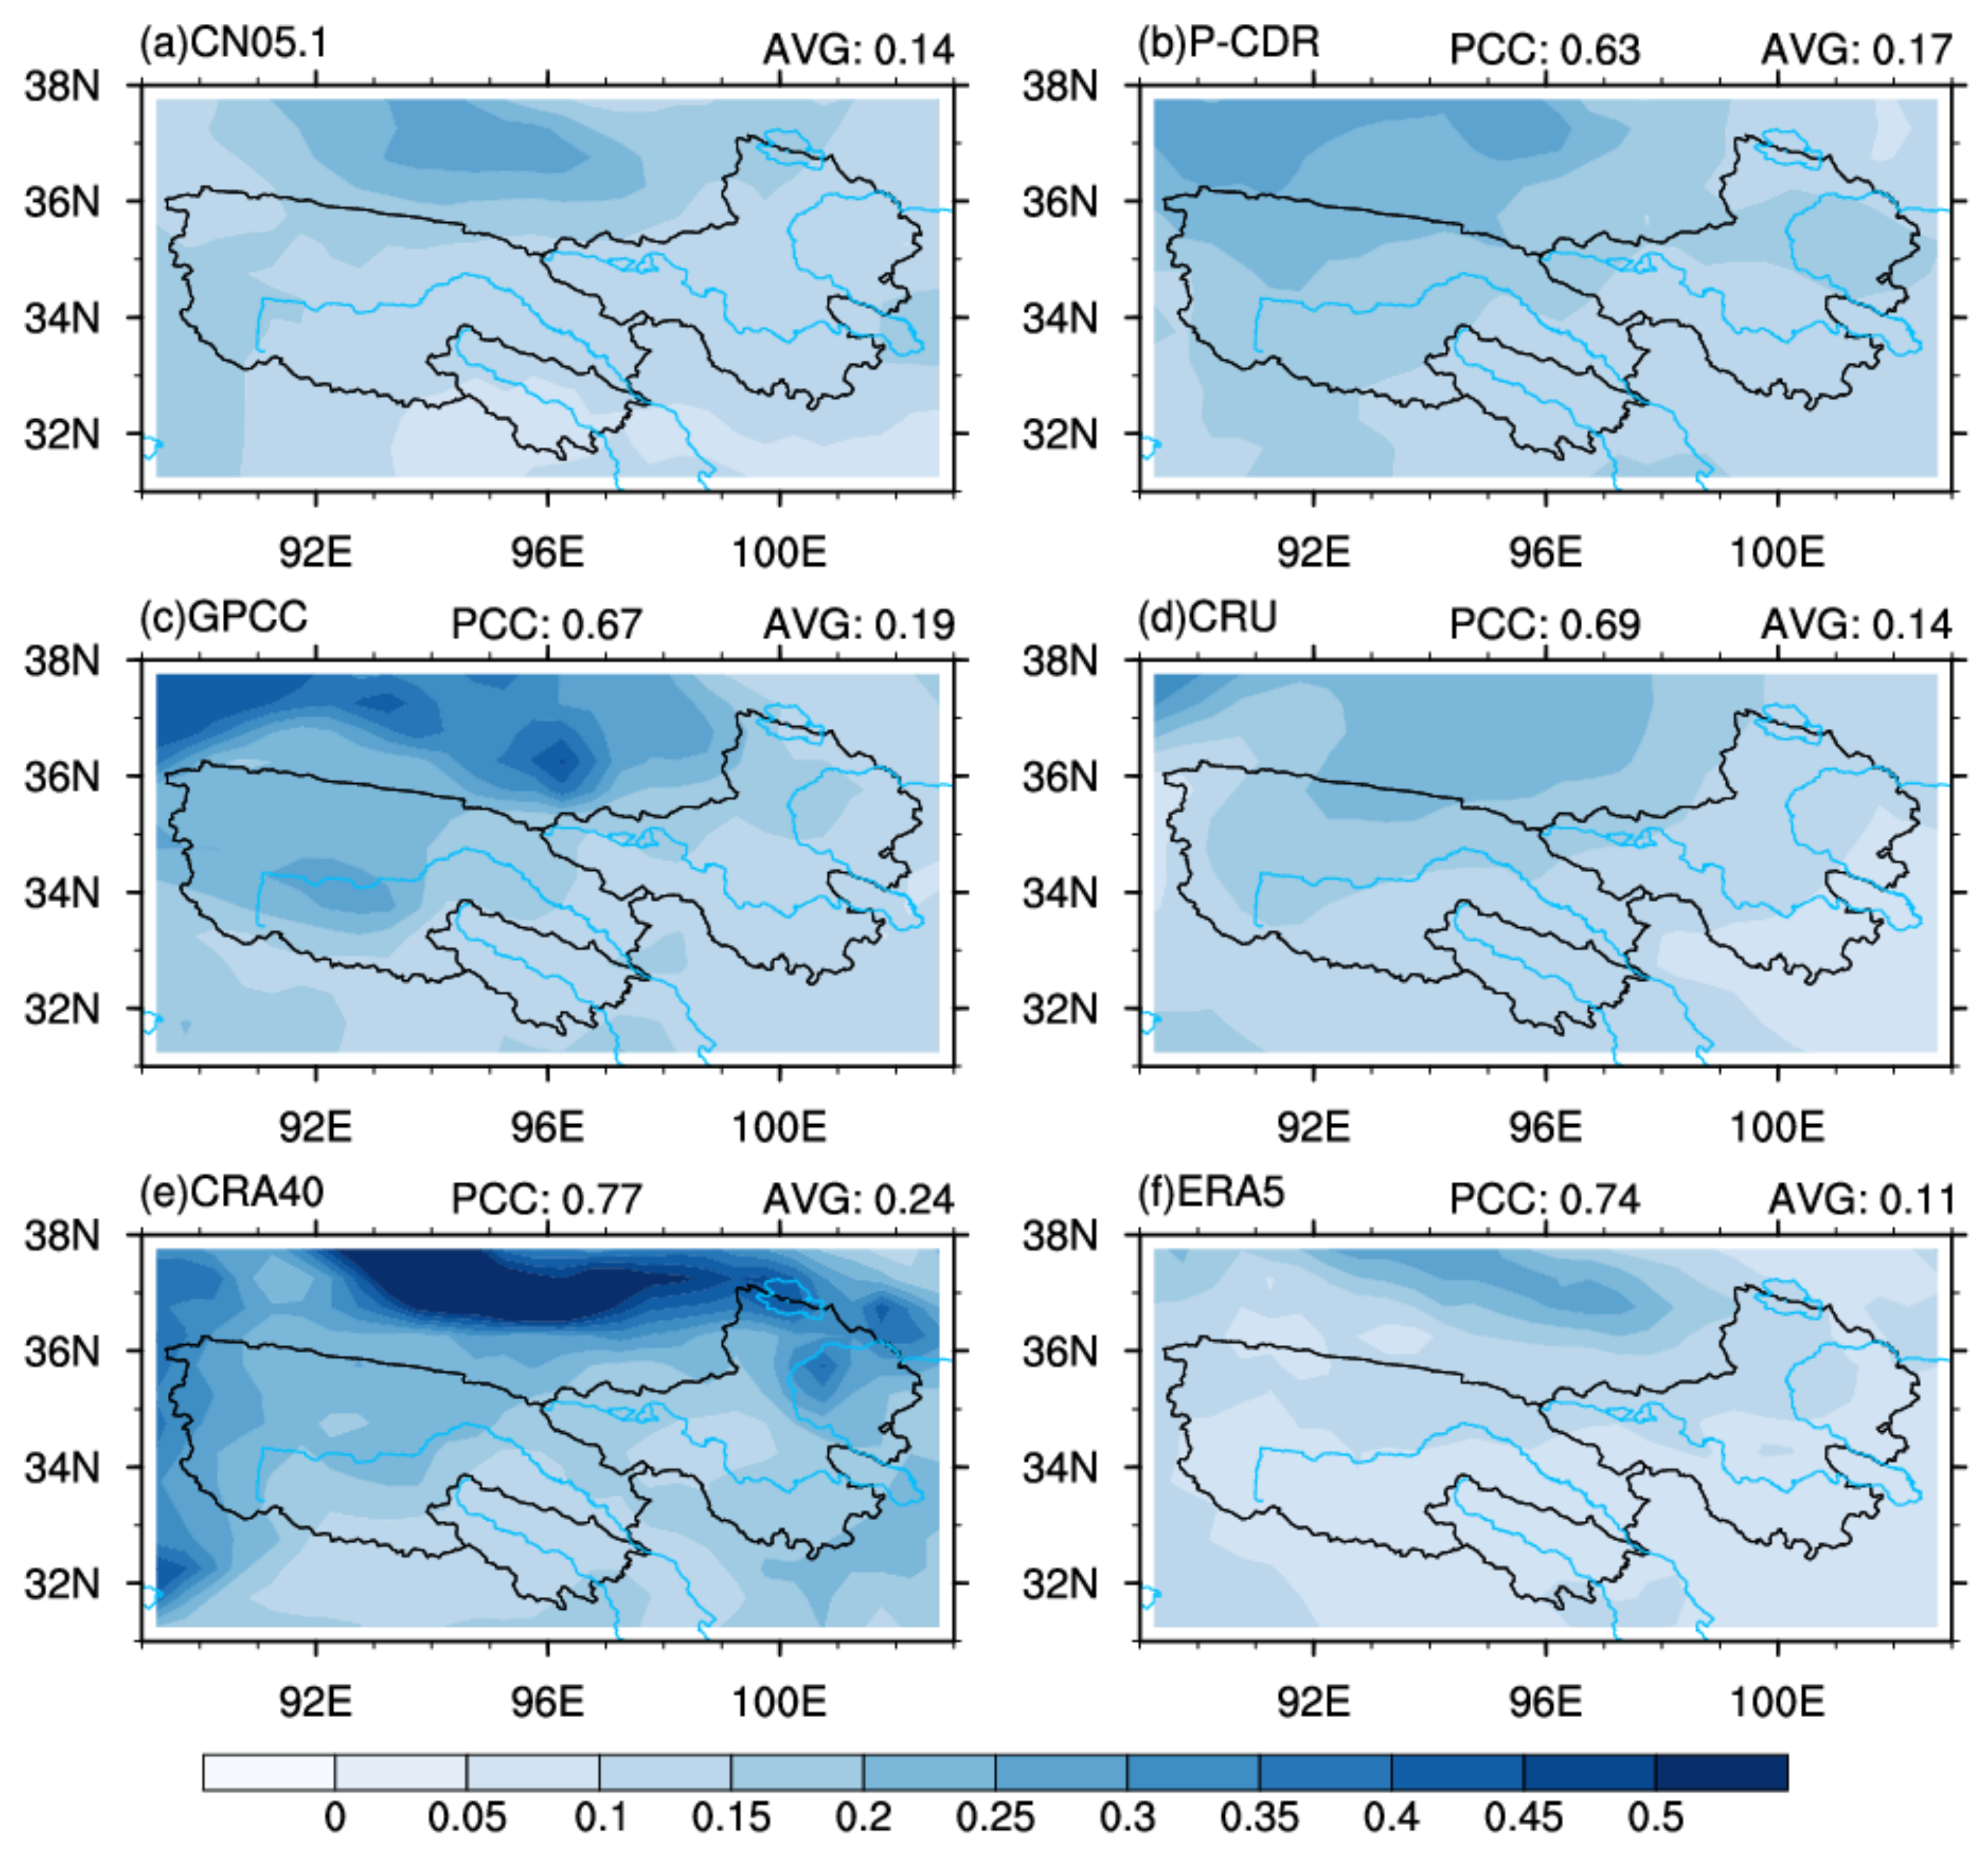
To evaluate the ability of the datasets to reproduce the spatial patterns of interannual variability in precipitation, the relative interannual variability is computed. It is defined as the ratio of the standard deviation of annual precipitation to the climatological average, as shown in
Figure 3. Unlike the climatology, the relative interannual variability increases from the southeast to the northwest of the TRH region. The maximum relative interannual variability occurs in the Qaidam Basin and the northwestern region, corresponding with the lowest amount of precipitation. The datasets can accurately capture the interannual variation in precipitation. P-CDR is less accurate in capturing the spatial pattern of interannual variability, with a minimum correlation coefficient of 0.63. GPCC (0.19) and CRA40 (0.24) feature a higher AVG than the CN05.1 datasets (0.14), which may result from the larger interannual variability than the observation dataset in the Qaidam Basin. ERA5 and CRU show good agreement with precipitation observations in terms of the main characteristics of interannual variability.
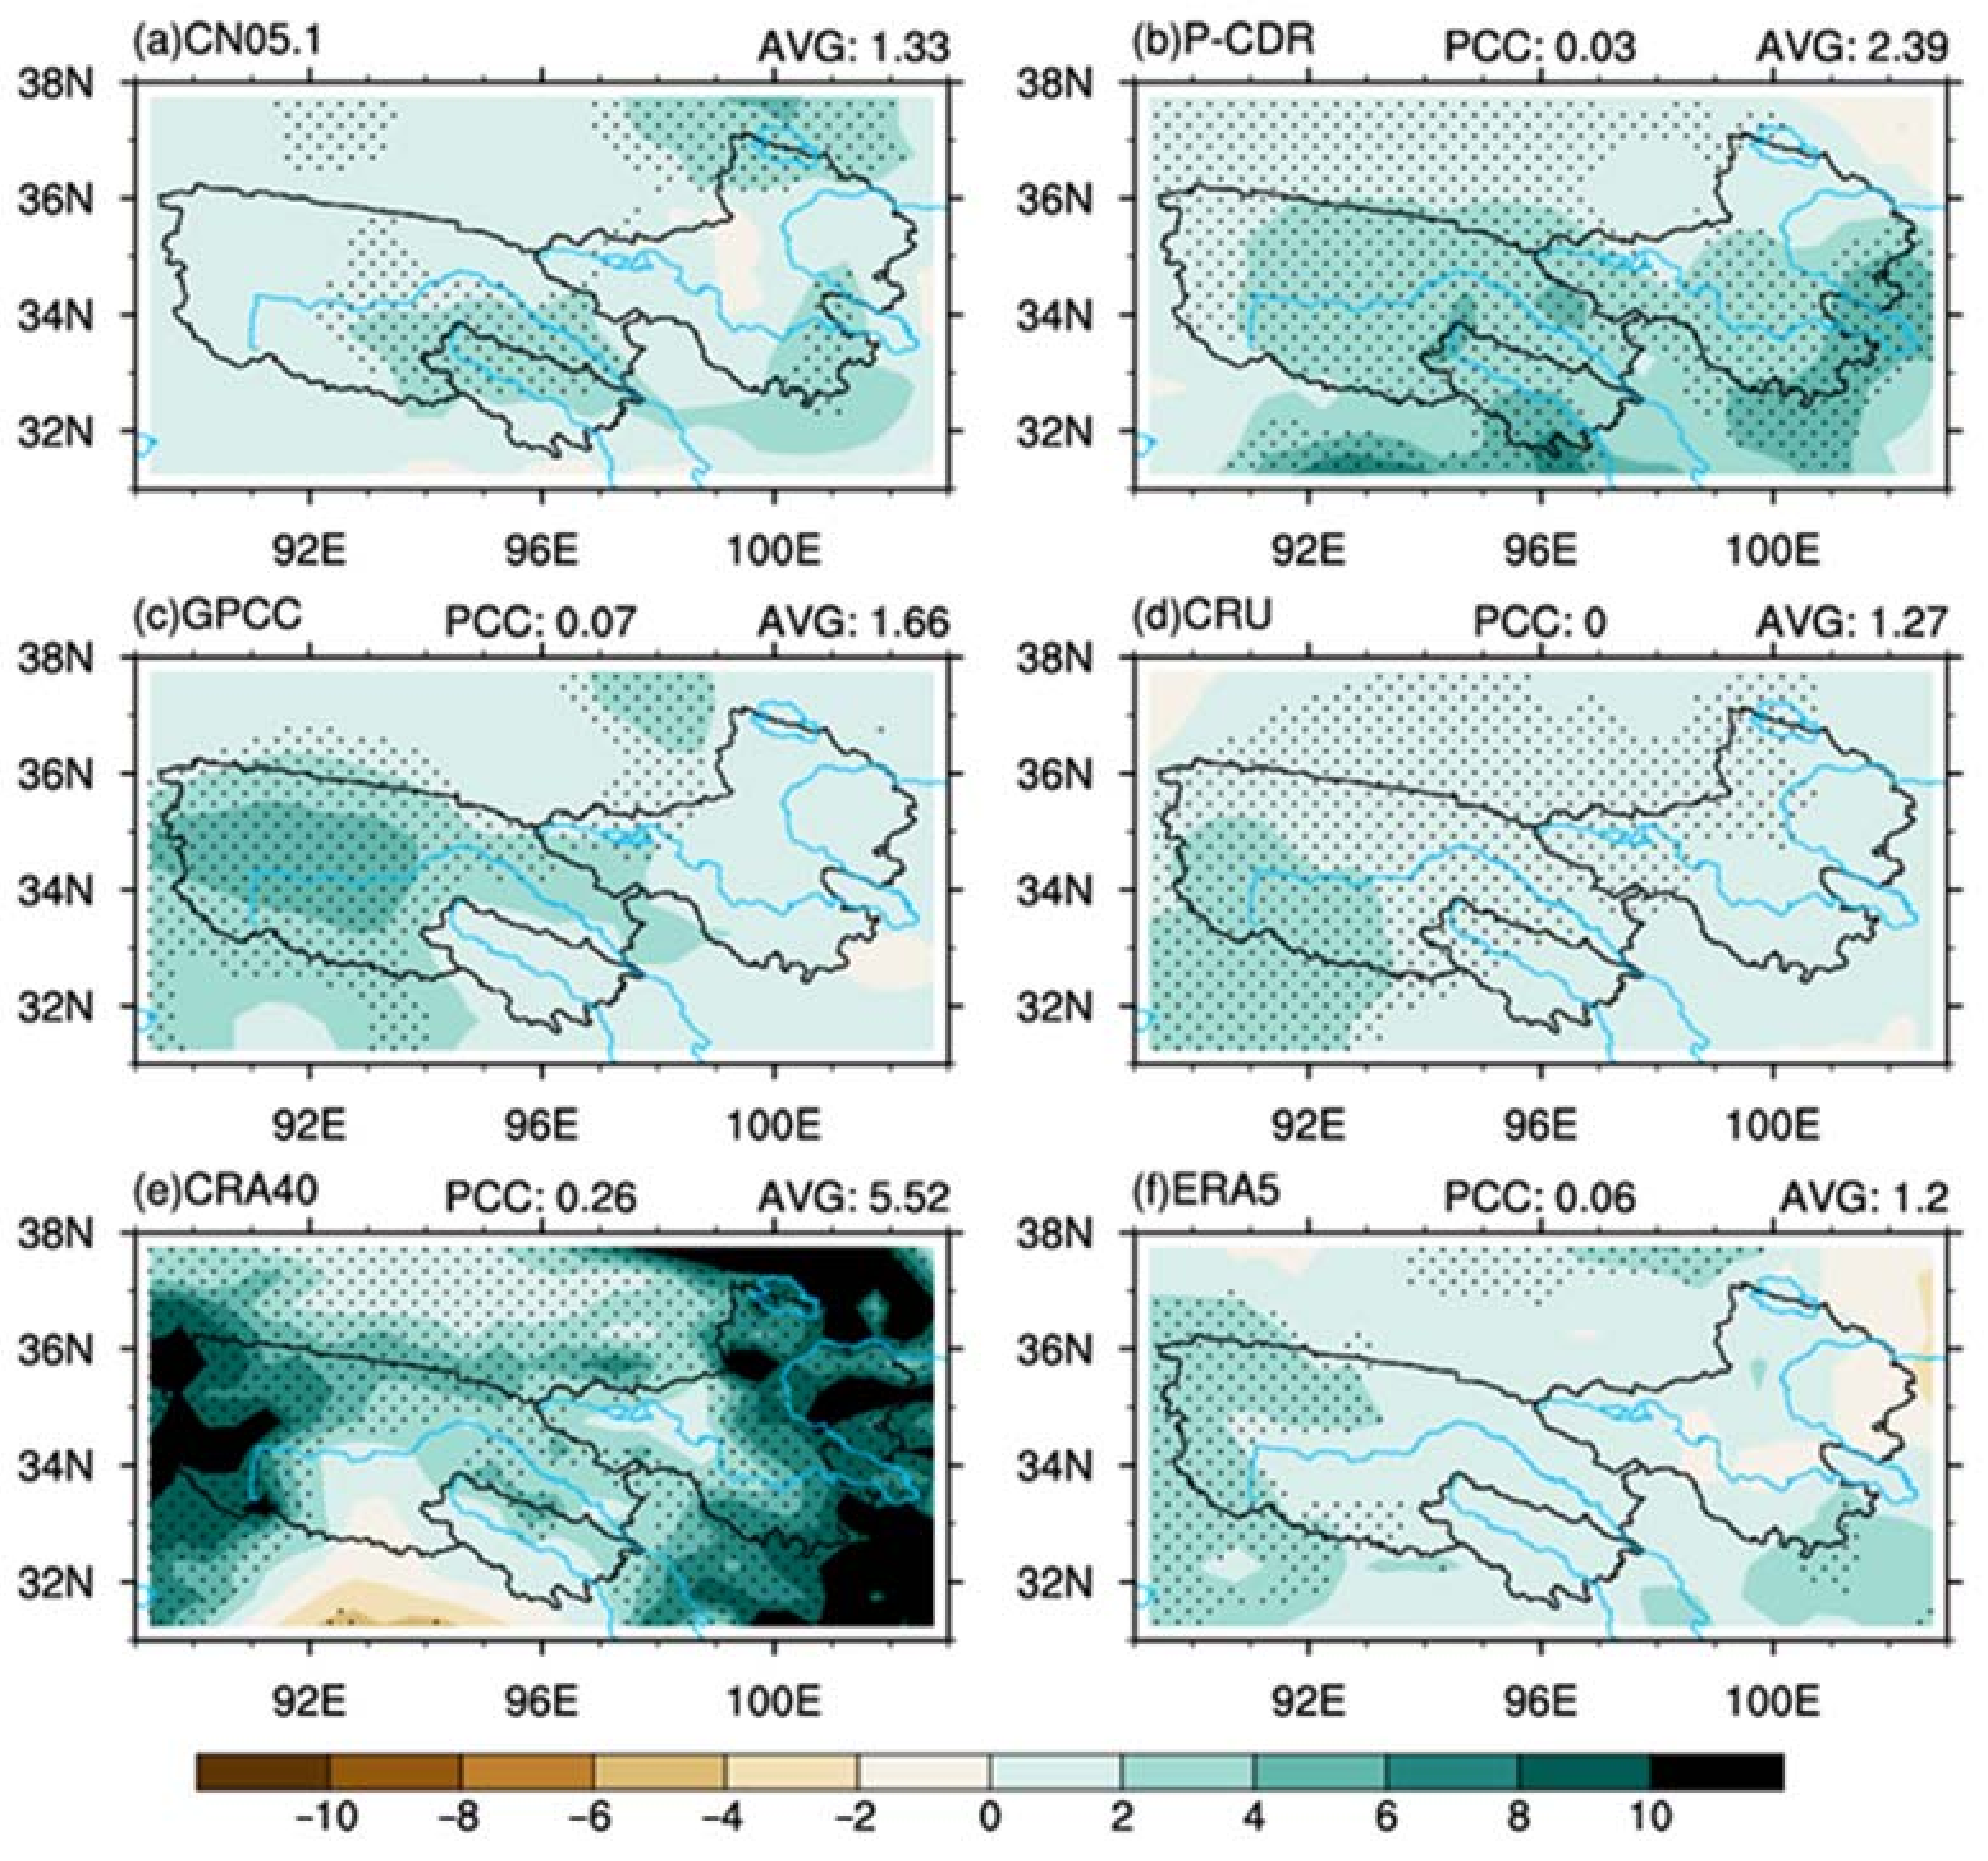
Figure 4 displays the spatial precipitation trends from 1983 to 2014, as obtained from the observation dataset and the five datasets. The observation dataset indicates an increase in precipitation across most of the TRH region, with an increasing trend of 1.33 mm/year as an average of the whole area (
Figure 4a) (only some regions show a significant increase). Although five datasets exhibit comparable annual precipitation trends, they also contain large inconsistencies and are limited in their ability to reproduce long-term precipitation trends with low PCC values. CRU’s regional average trend is closest to the observation, with an average of 1.27 mm/year. P-CDR and CRA40 generally overestimate the trend in annual precipitation, with an increasing trend of 2.39 and 5.52 mm/year, respectively.
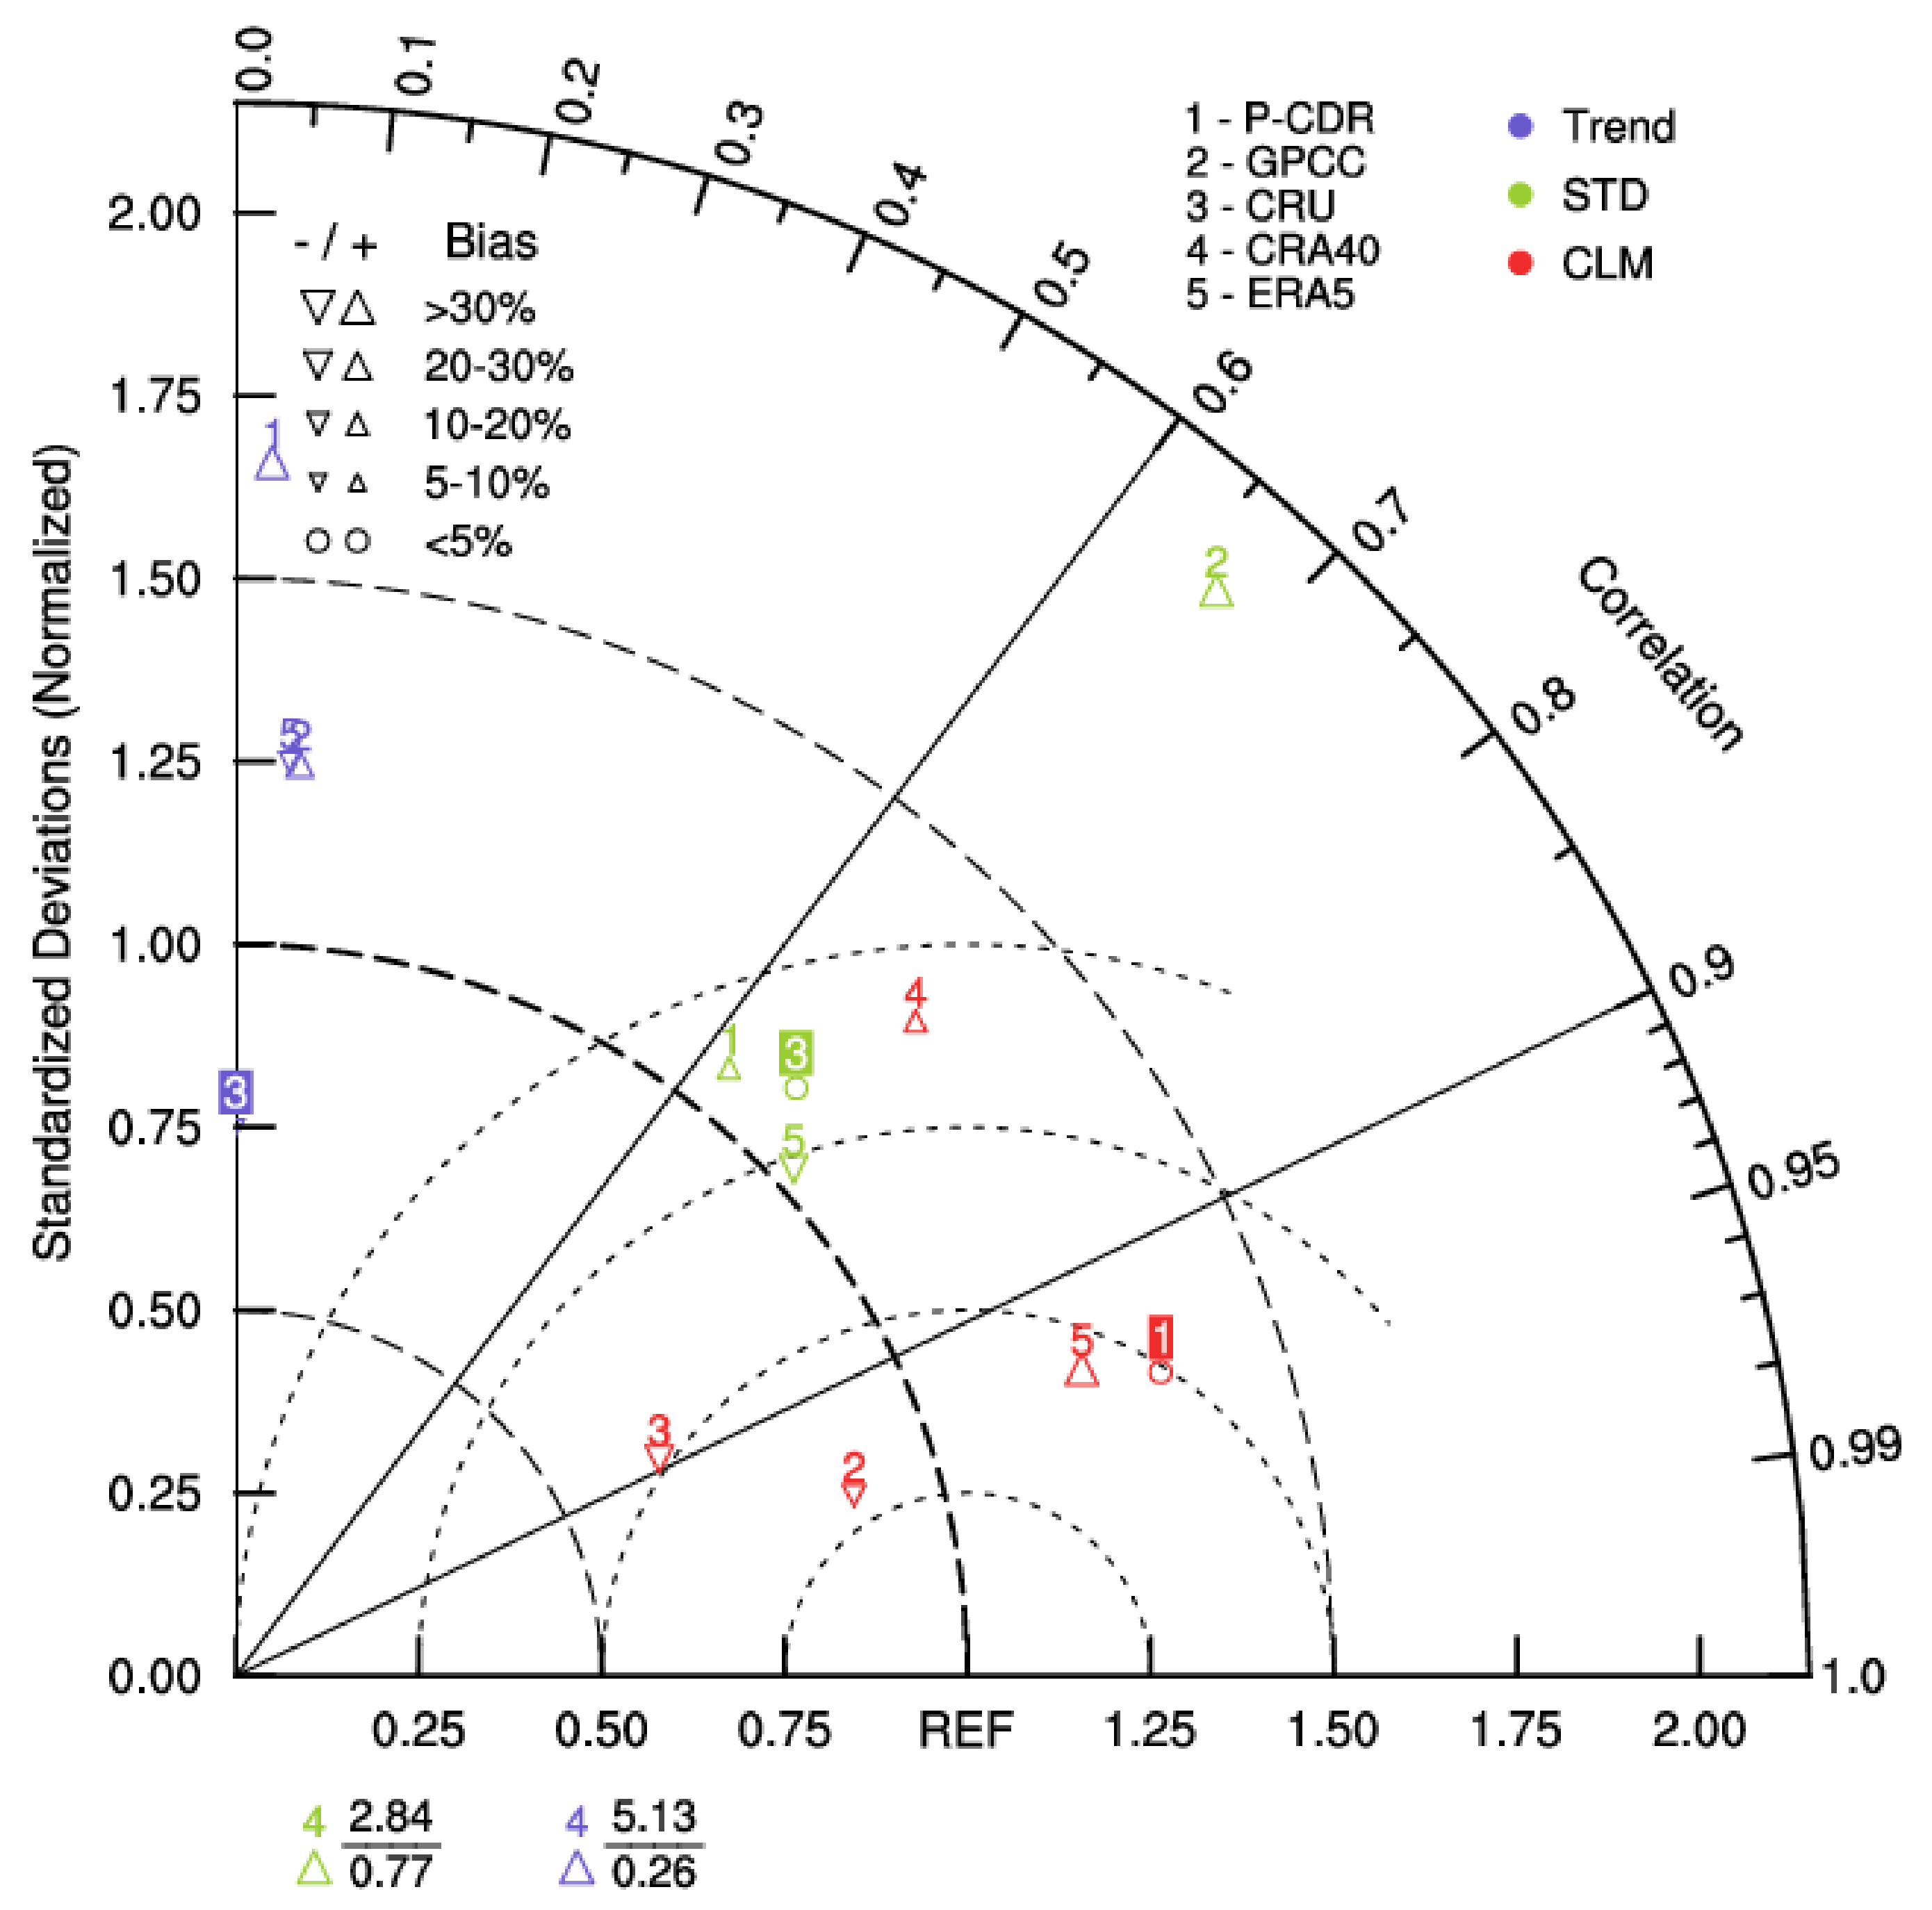
To elucidate the performances of five datasets, we summarize their skill scores in reproducing the climatology (CLM), interannual variability (STD), and long-term trends (trend) using a Taylor diagram (
Figure 5). Of the three metrics, the climatology generally obtains the highest scores, followed by the interannual variability, and the lowest scores are for the long-term trends. In terms of climatology, GPCC exhibits the highest skill, followed by P-CDR. ERA5 overestimates the annual mean climatology by 45.25%. In contrast, the annual mean climatology is underestimated by CRU at about −28.95%. For the interannual variability, GPCC and CRA40 reproduce much more spatial variability. ERA5 is capable of effectively improving the characterization of interannual variability, followed by CRU. The long-term trends can be most closely replicated by employing CRU.
3.2. Annual Cycle of Precipitation
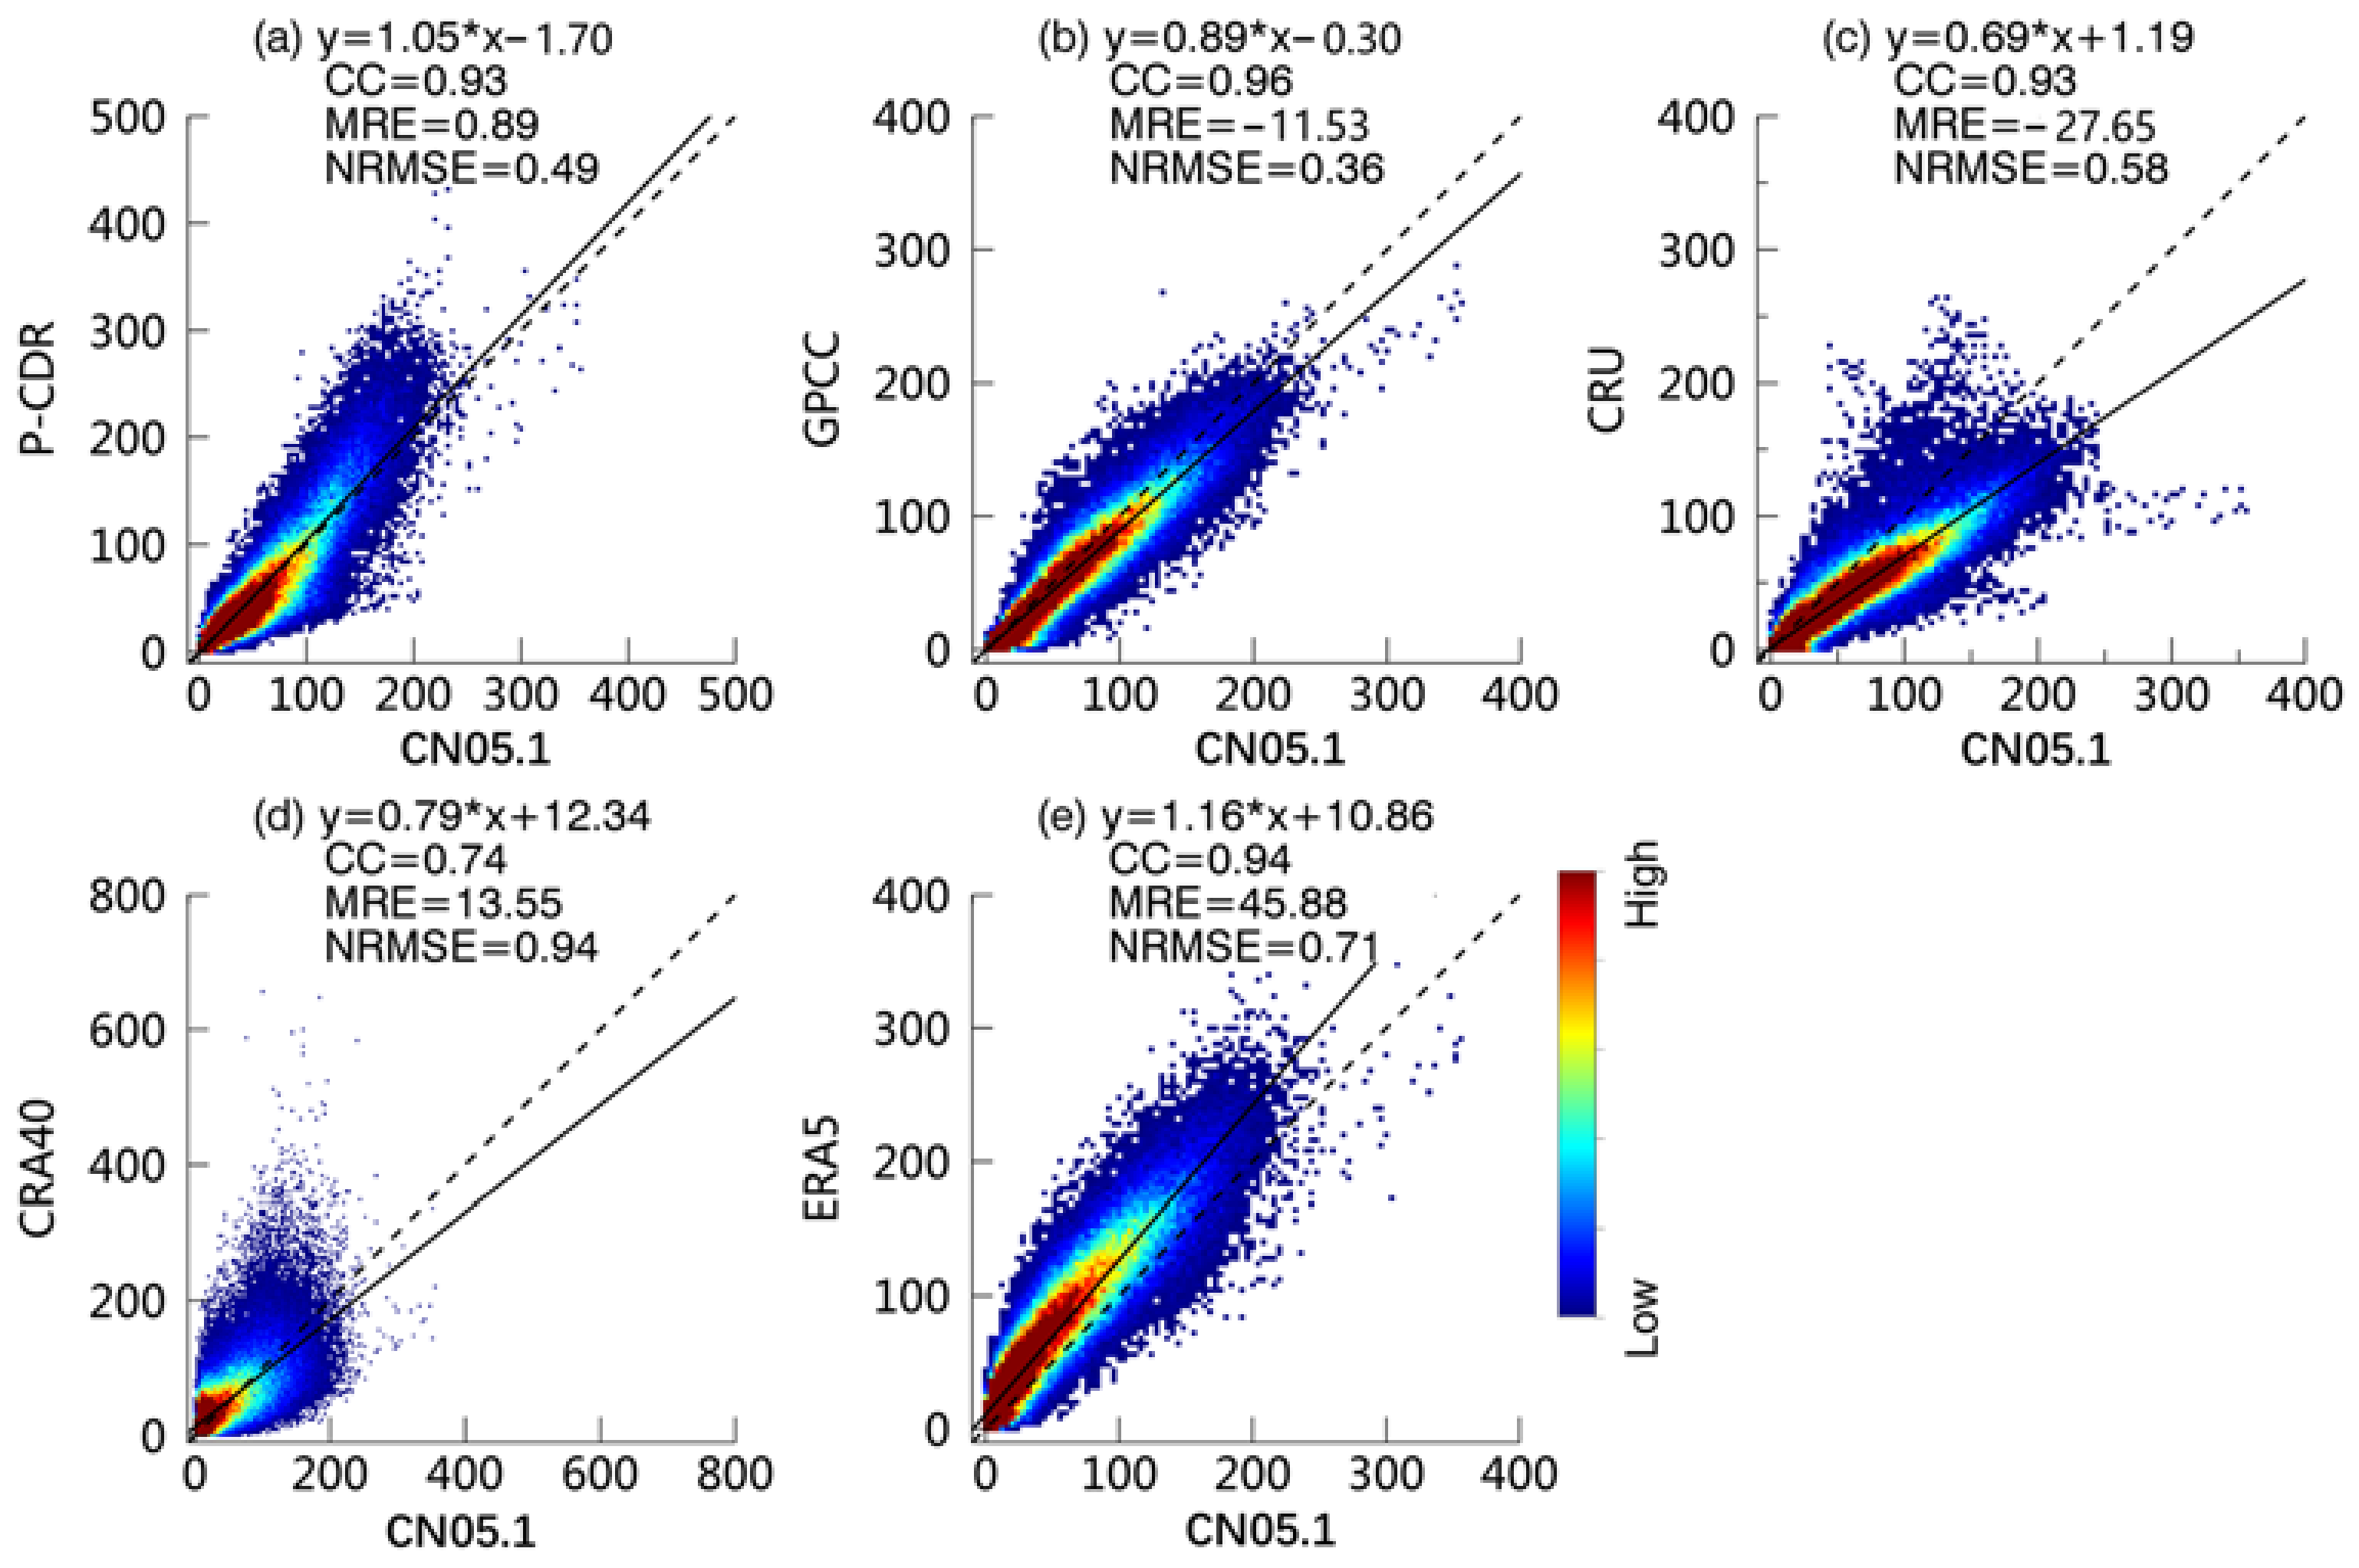
Figure 6 illustrates the monthly performance of five precipitation products compared to the observation dataset. Apart from CRA40 (CC = 0.74), most products have strong correlations with the observation dataset (CC > 0.93). GPCC exhibits the highest CC value (0.96) as well as the smallest RMSE (13 mm/month). High-frequency scatter points of GPCC are more evenly distributed on both sides of the 1:1 line. P-CDR ranks behind GPCC, with a CC value of 0.93, and an RMSE value of 19.22 mm/month. The linear regression line of P-CDR is the closest to the 1:1 line. Similar to the annual performance, ERA5 (CRU) hugely overestimates (underestimates) the monthly precipitation by 45.88% (−27.65%), with RMSE values of 25.71 and 21.08 mm/month, respectively. CRA40 features a low degree of precision with a low CC value (0.74) and a high RMSE (33.77 mm/month), and the scatterplot distributions are dispersed.
To assess the performance of the five datasets in reproducing the annual cycle of precipitation in the TRH region, we computed the root mean square error (RMSE) between the observation dataset and the other datasets, as illustrated in
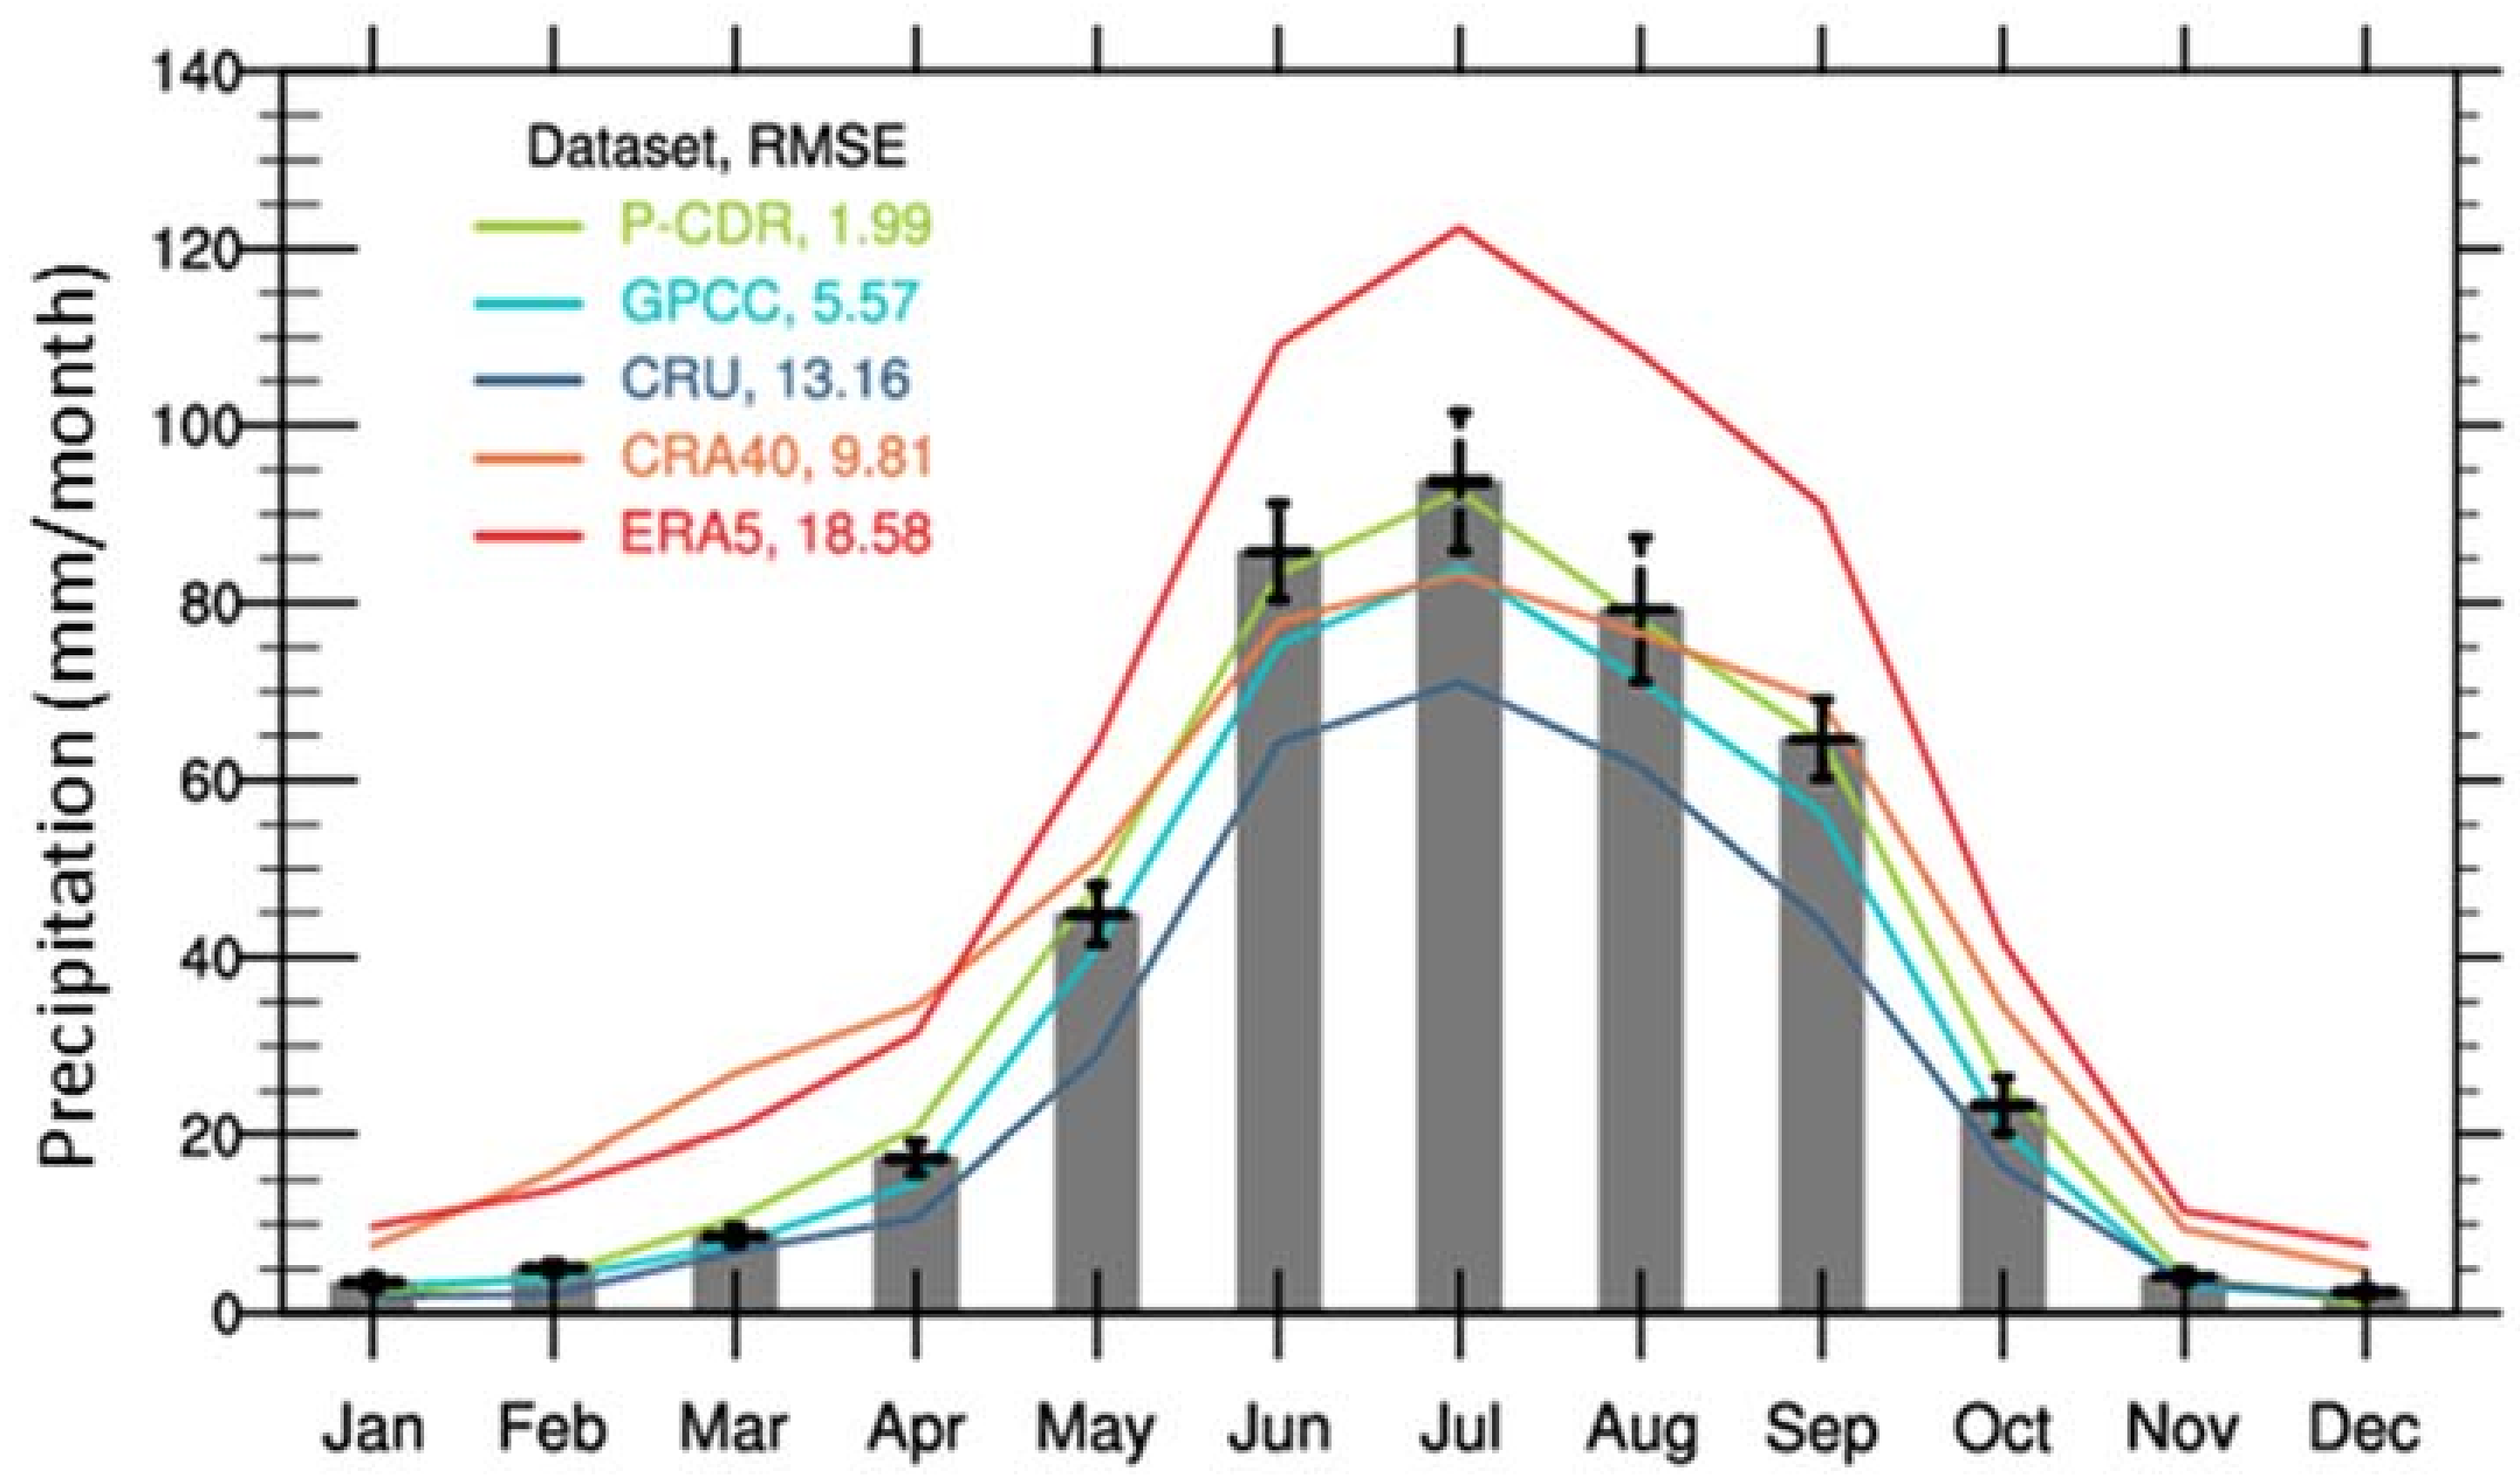
Figure 7. The annual precipitation cycle across the TRH region exhibits a single peak pattern, with the highest precipitation occurring in July. It ranges from 1 to 122 mm/month throughout the year. As compared to the observation dataset, the five datasets are also capable of reproducing the unimodal shape, although with some bias (RMSE:1.99–18.58 mm/month,
Figure 7). All the datasets exhibit a higher degree of bias in summer than in other seasons. The ERA5 dataset tends to overestimate precipitation in all months (RMSE = 18.58), while the CRA40 dataset tends to underestimate precipitation in June, July, and August, and overestimate it in the other months (RMSE = 9.81). CRU grossly underestimates the annual cycle (RMSE = 13.16 mm/month). P-CDR exhibits the most accurate representation of the annual cycle (RMSE = 1.99 mm/month), followed by GPCC (RMSE = 5.57 mm/month). In
Figure 7, each box is accompanied by a dispersion bar showing the interannual variability precipitation for the corresponding month. The interannual variability monthly precipitation is highest in summer. P-CDR and GPCC mainly fall within the standard deviation of the observed monthly precipitation, which means that the monthly precipitation of the P-CDR and GPCC are within the interannual variability for the corresponding month.
3.3. Daily Precipitation
We further evaluate the daily precipitation by employing P-CDR and IMERG for the period 2001–2014.
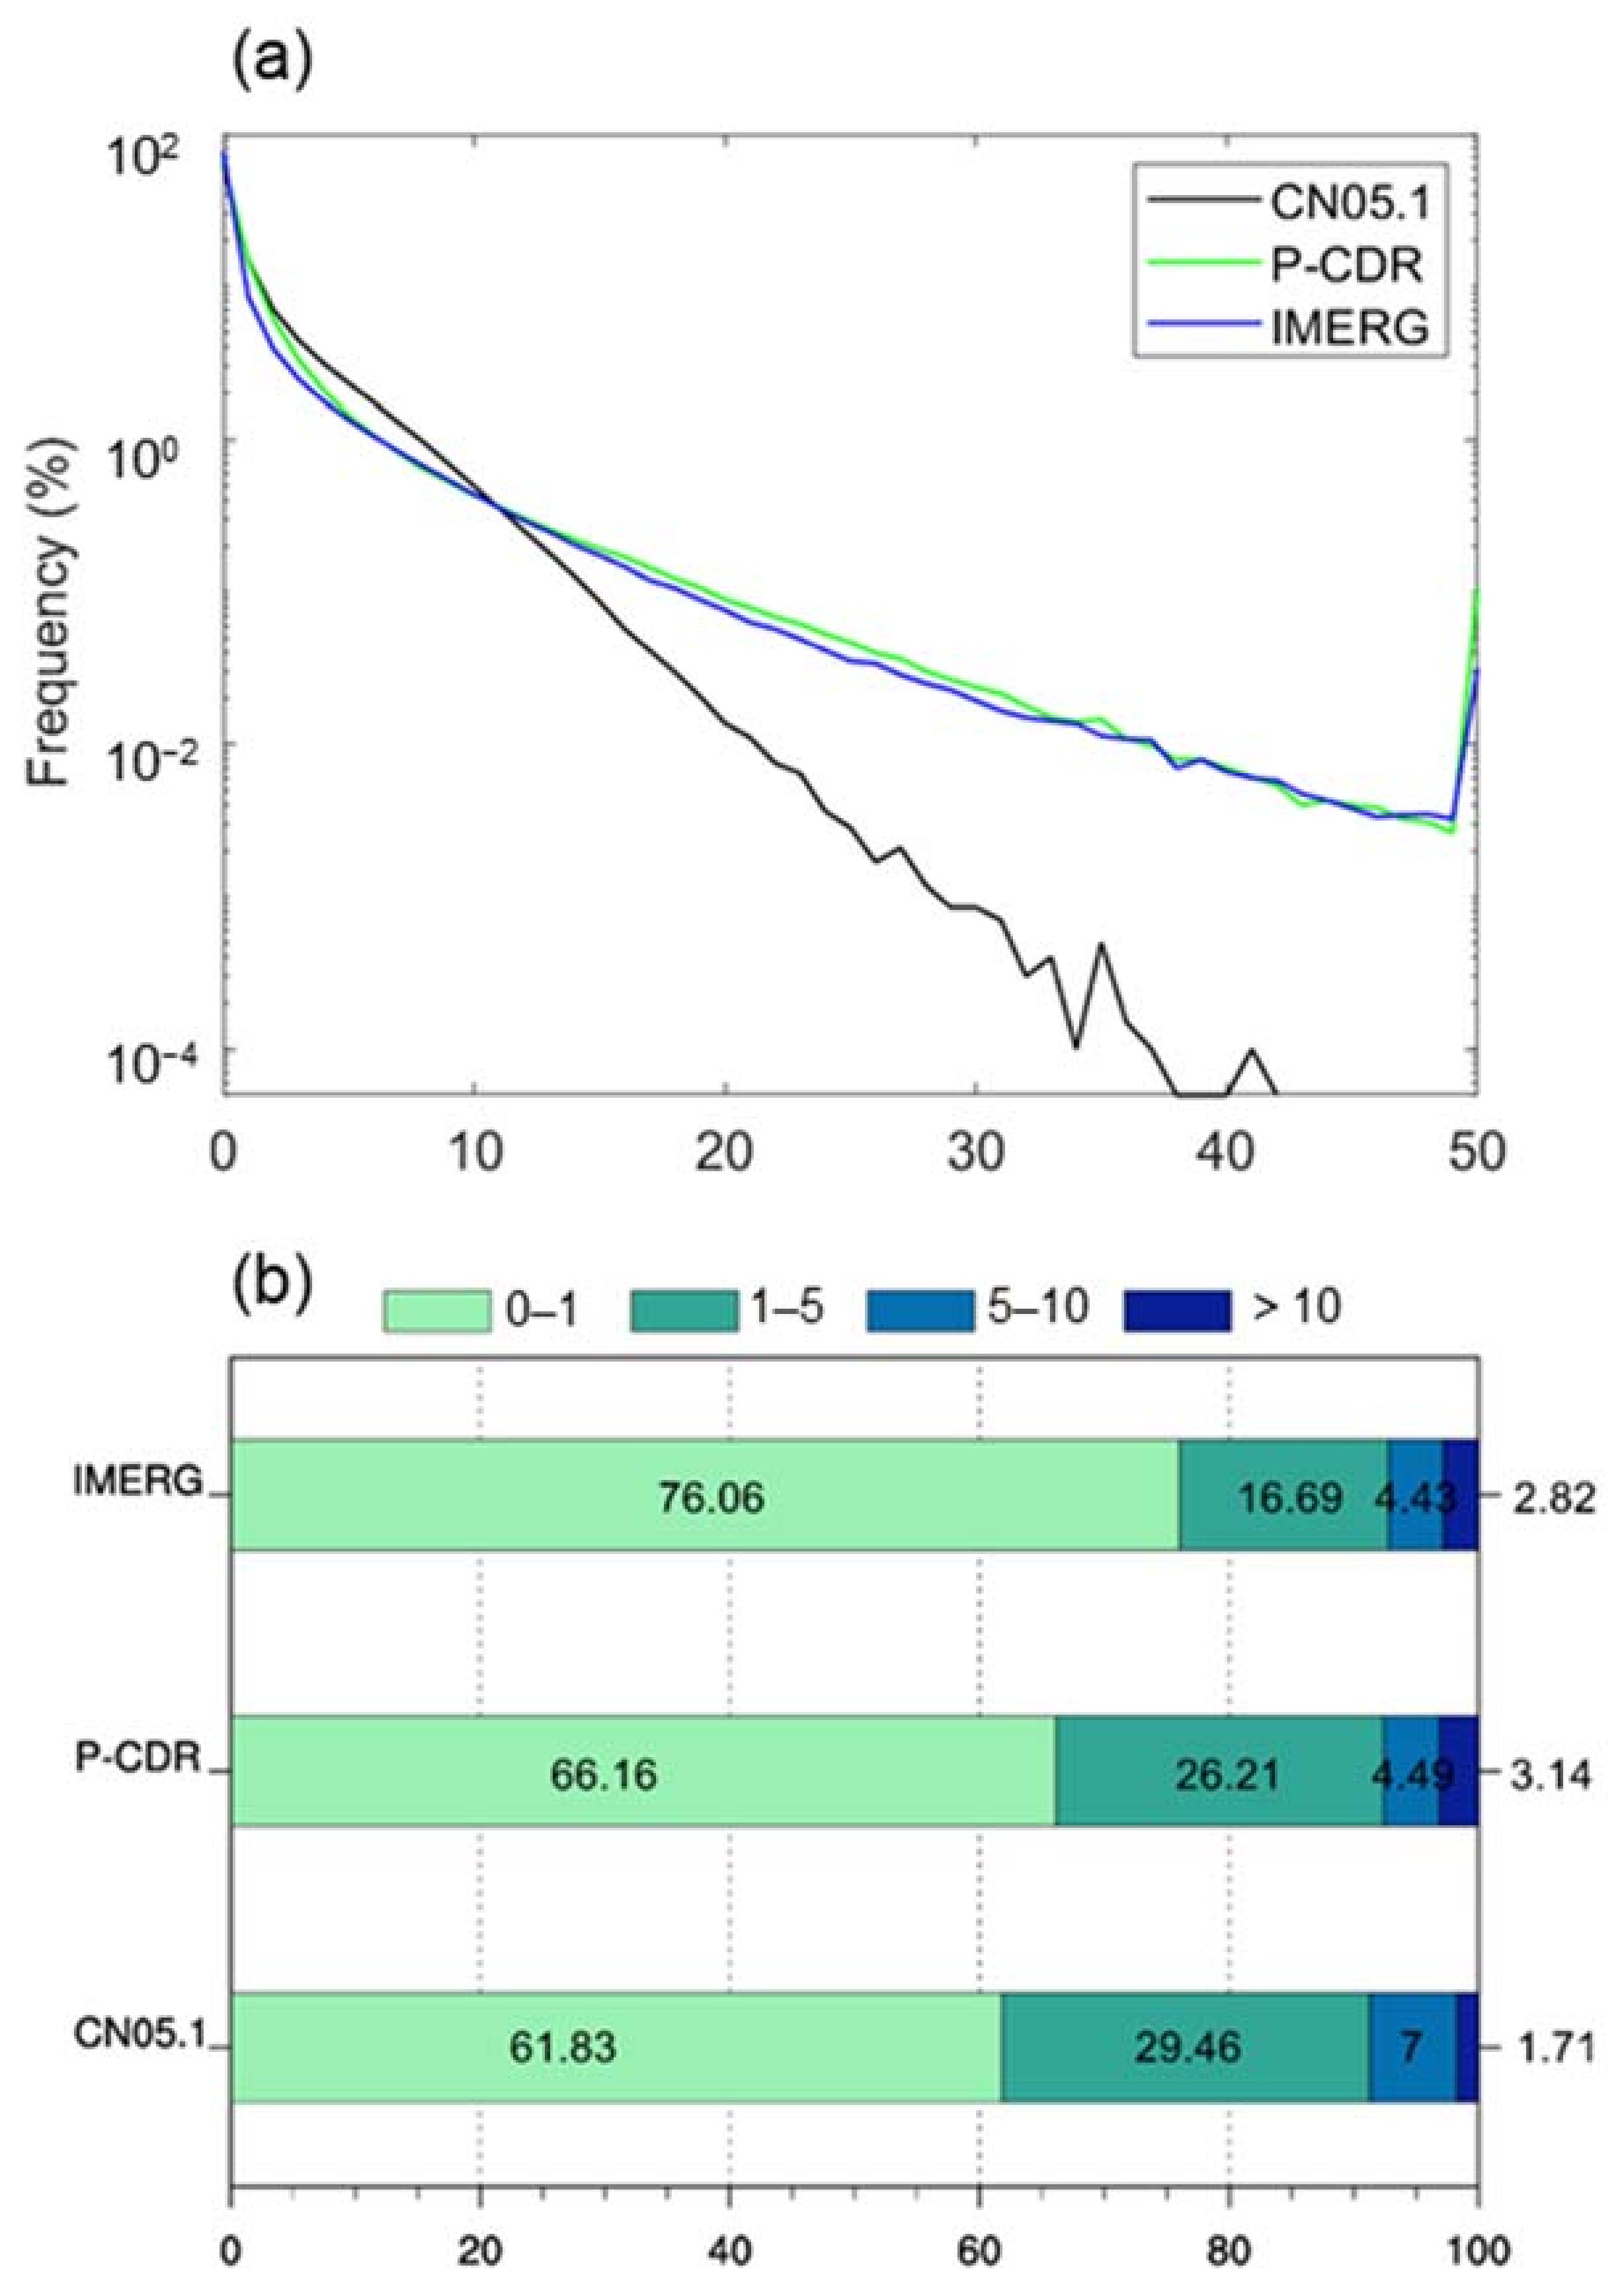
Figure 8 shows the probability distribution function (PDF) of daily precipitation, as derived from the observation dataset and two other datasets. In
Figure 8a, the probability curve of CN05.1 decreases more rapidly, and the probability of precipitation below 10 mm/day is significantly higher than that of P-CDR and IMERG, and the opposite is true for precipitation above 10 mm/day. For P-CDR and IMERG, the values rise near the end because the last value represents the cumulative probability of precipitation greater than or equal to 50 mm/day. Compared with observed dry days (daily precipitation amount is less than 1 mm/day), the two products show a large bias. IMERG (76.06%) and P-CDR (66.16%) overestimate the probability of dry days (CN05.1 = 61.83%). Both of them tend to underestimate the probability of light (1–5 mm/day) and moderate (5–10 mm/day) precipitation. However, when the daily precipitation exceeds 10 mm/day, both datasets tend to overestimate the probability. P-CDR performs well in detecting the probability of light and moderate precipitation, while the IMERG performs even better in detecting the probability of heavy precipitation across the TRH region.
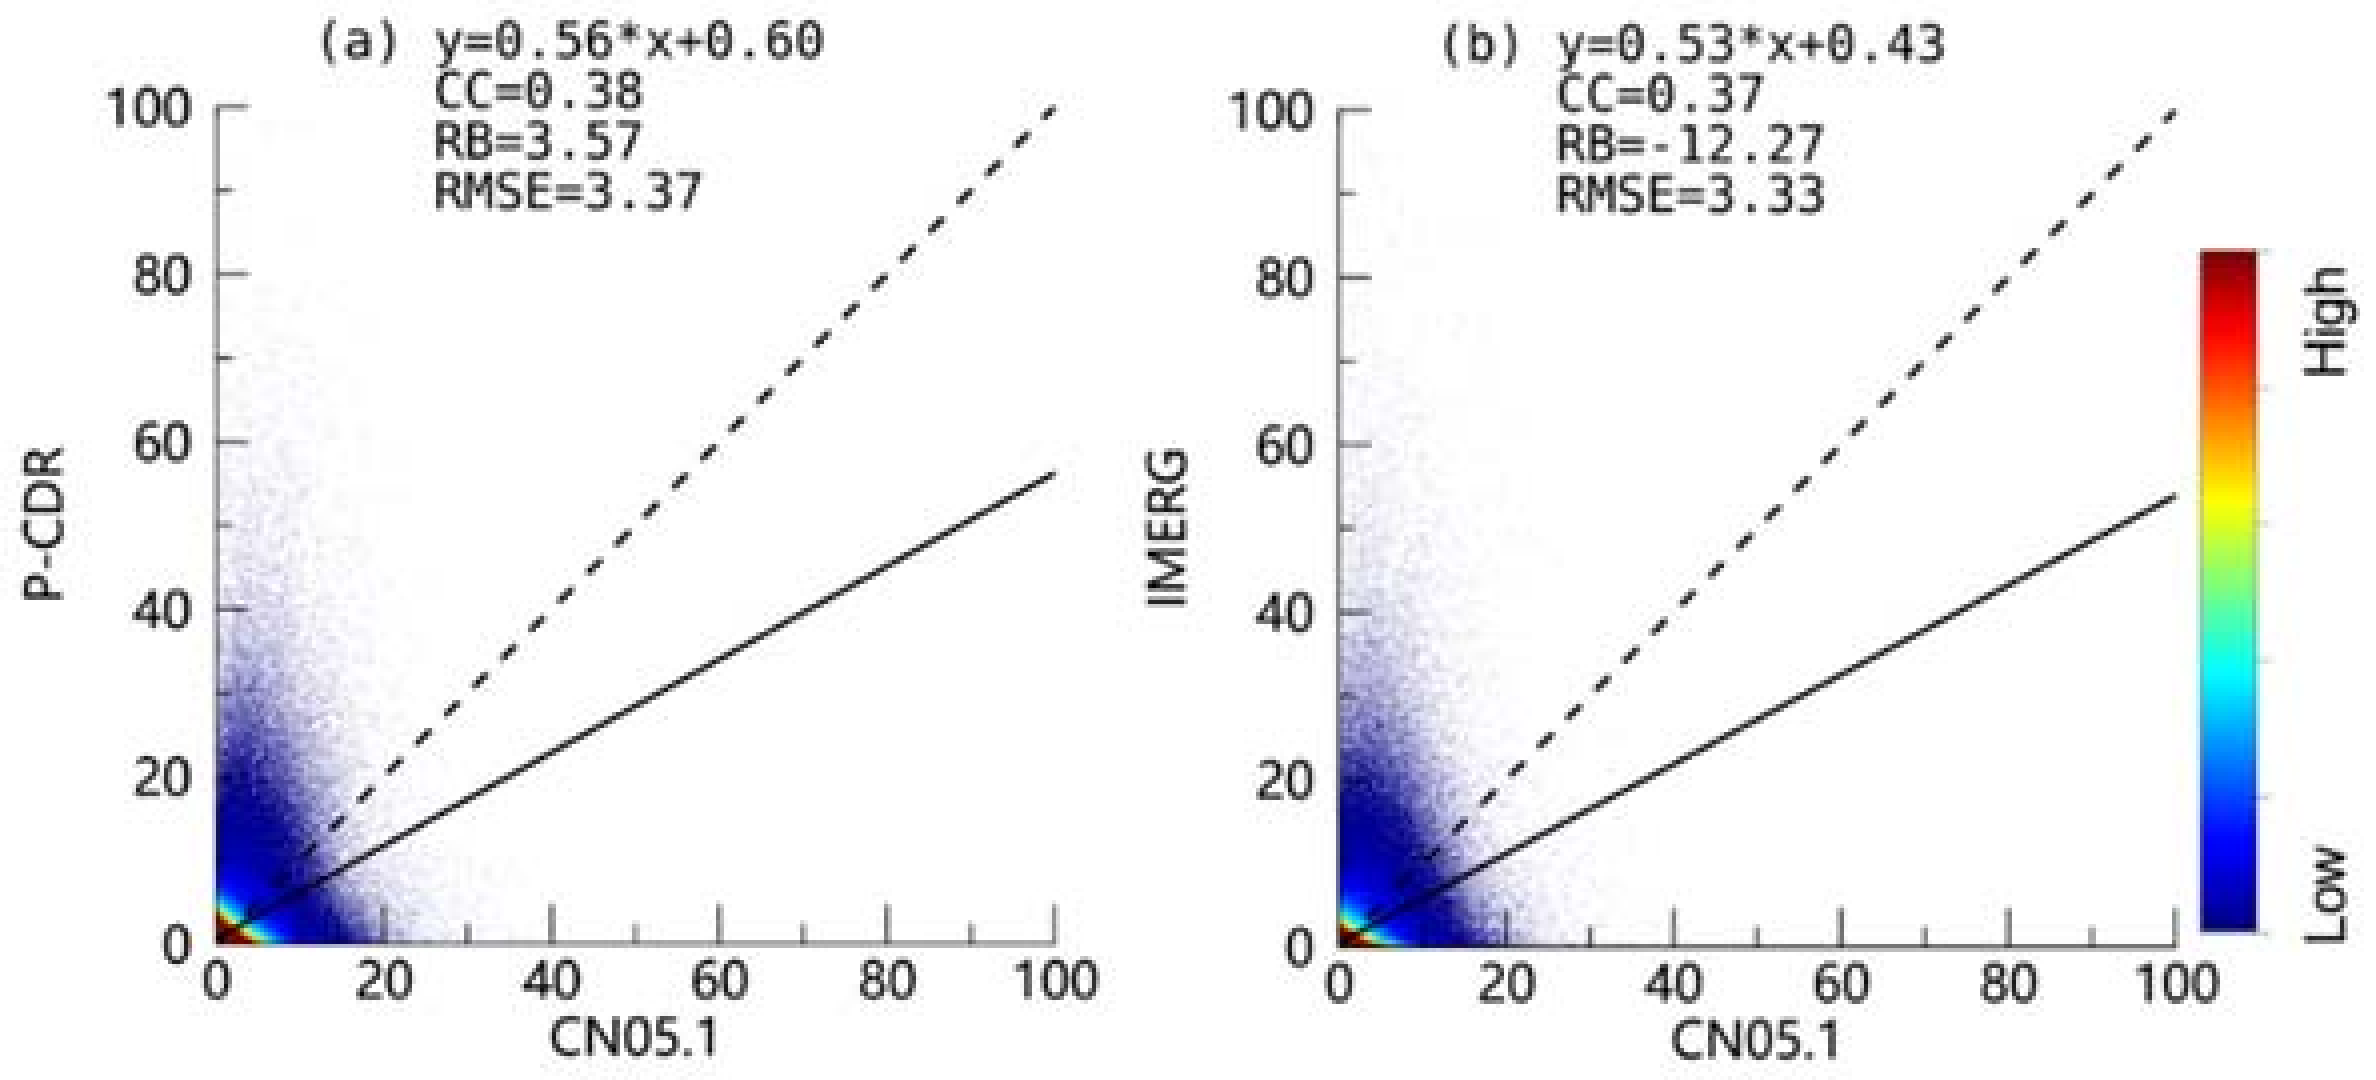
Figure 9 compares the performance of two precipitation products (P-CDR and IMERG) with observations on a daily scale. P-CDR and IMERG have many anomalous overestimation points at observed 0–20 mm/day precipitation, with many anomalous high values distributed between 20 and 100 mm/day. Both P-CDR and IMERG have similar CC and RMSE. In general, P-CDR performs better than IMERG, with a small bias. P-CDR tends to overestimate the daily precipitation amount by 3.57%, while IMERG has a higher degree of underestimation with an RB of −12.27%.
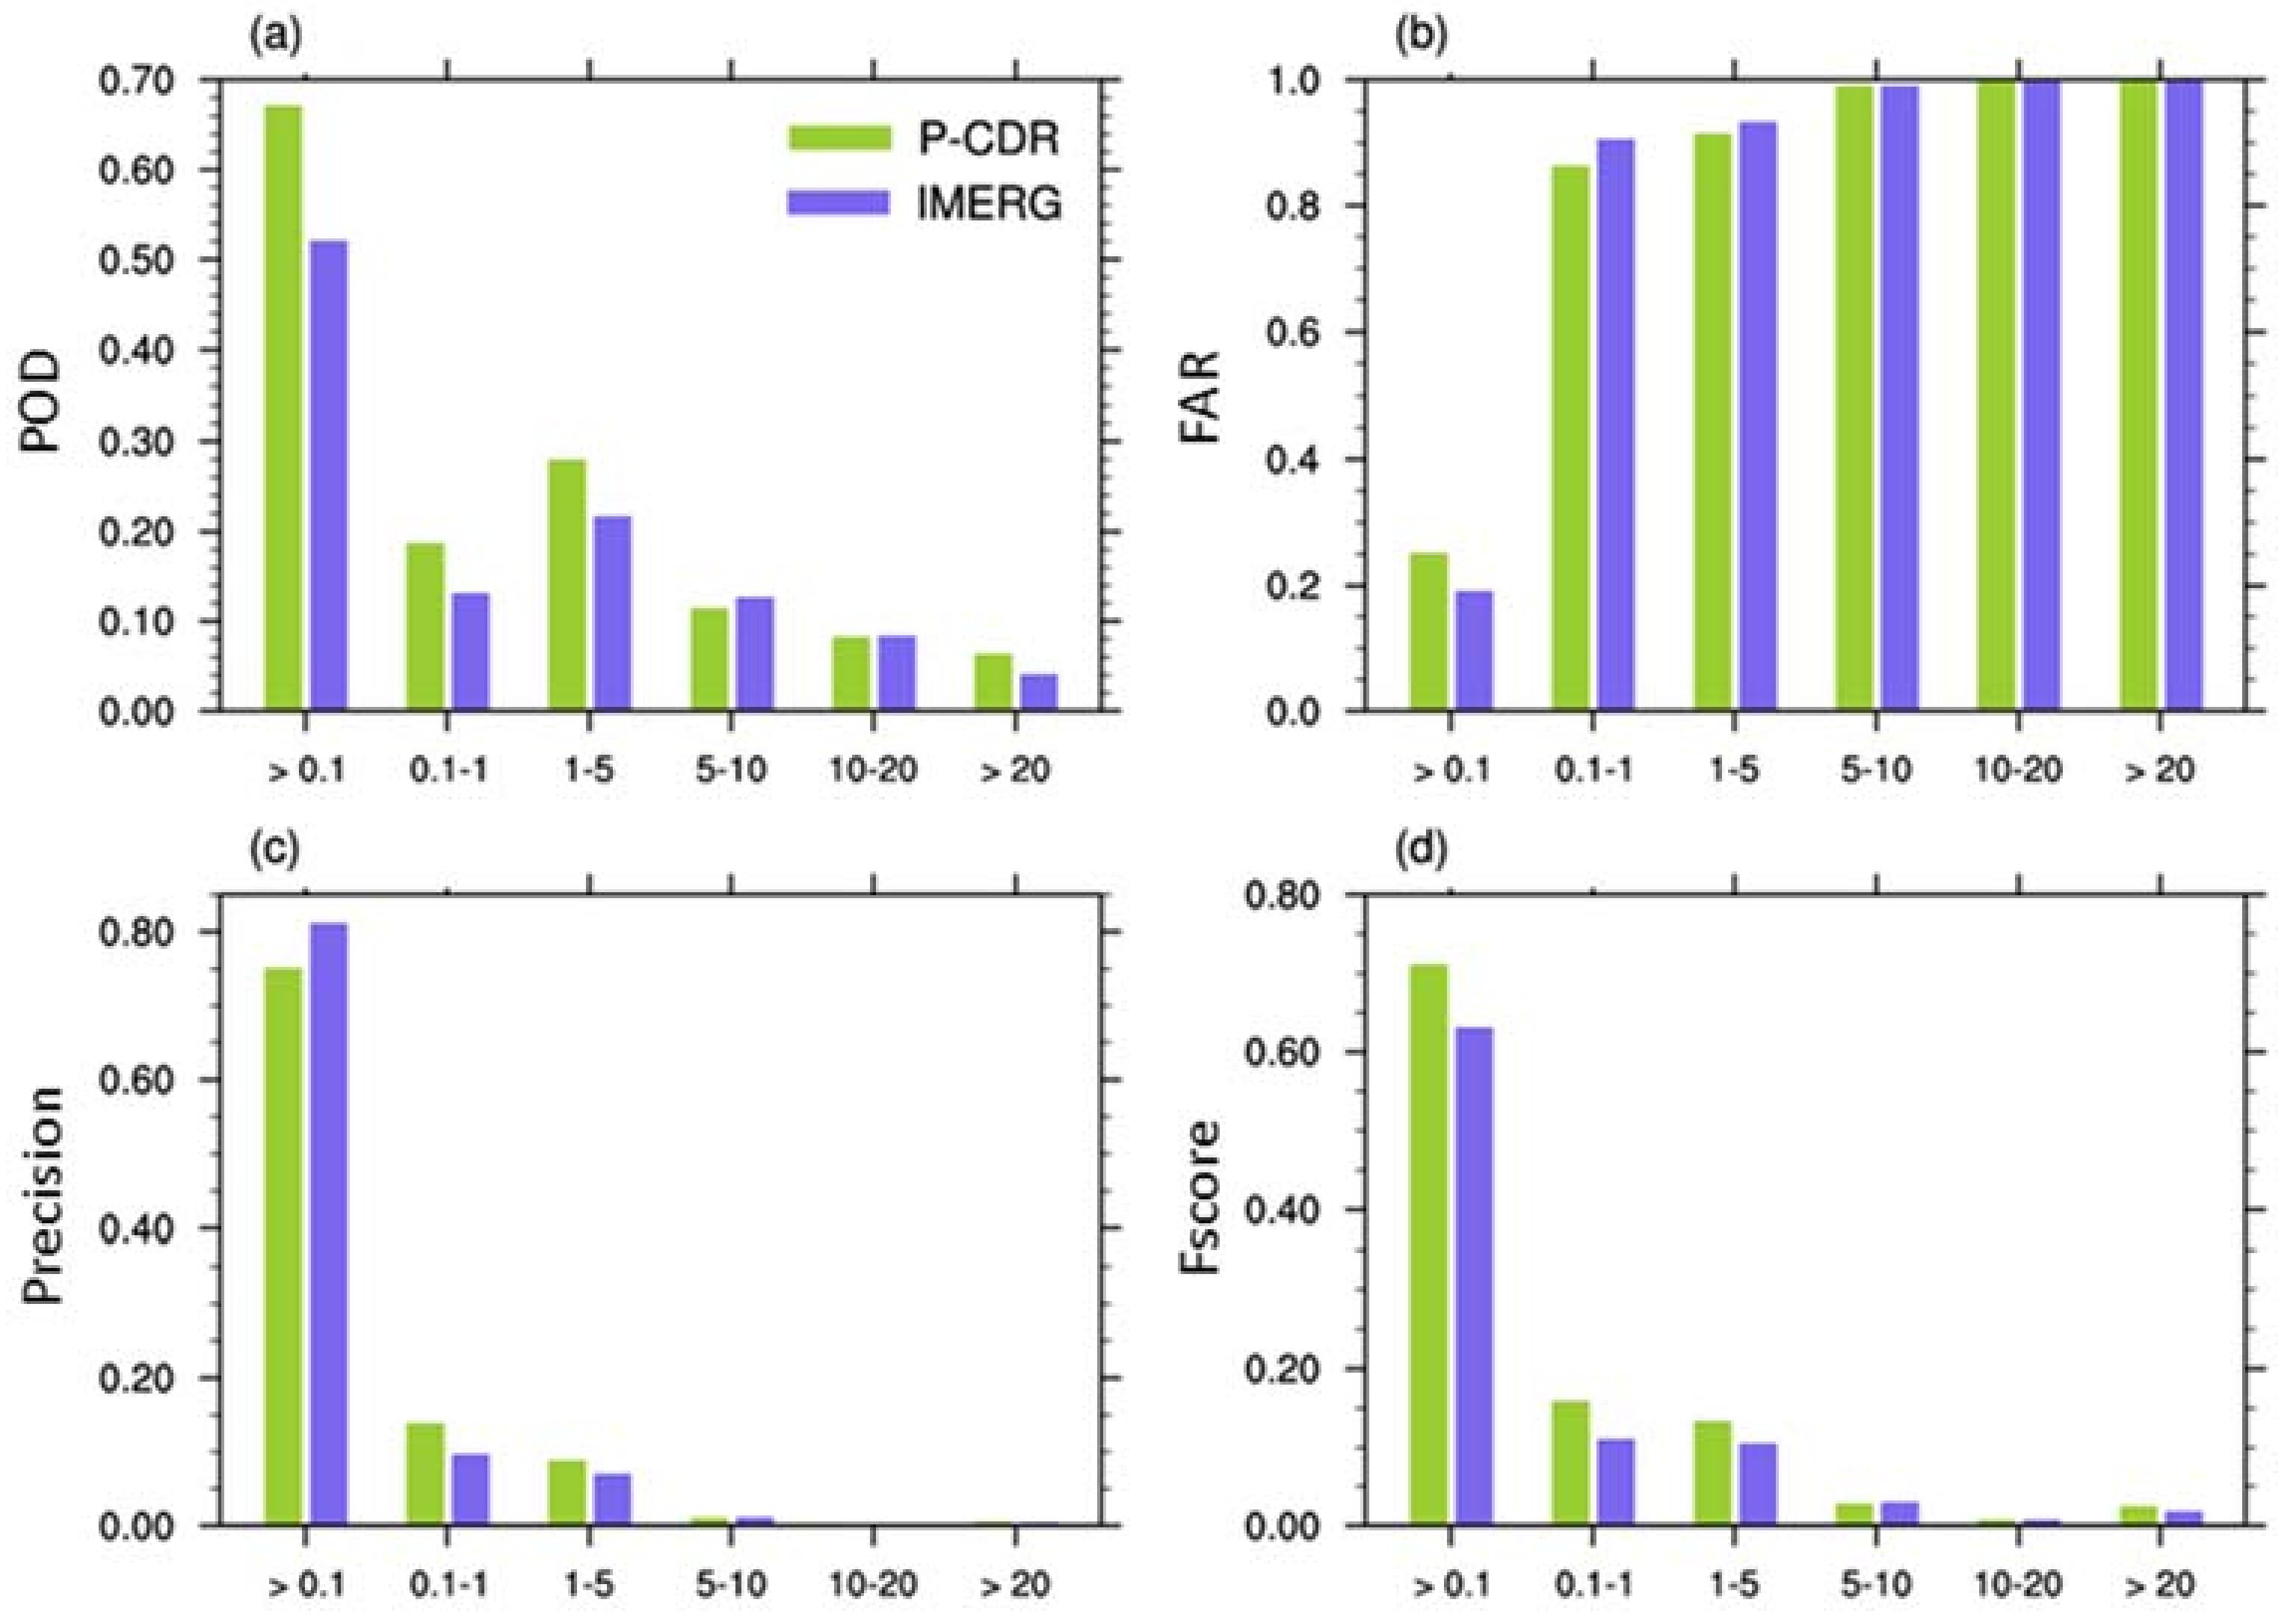
Figure 10 shows the precipitation detection capability under different precipitation intensities. By employing 0.1 mm as a standard for precipitation events, P-CDR more correctly detects the precipitation event, with a POD and Fscore of 0.67 and 0.71, respectively. In contrast, IMERG falsely detects the precipitation event with an FAR of 0.19. However, precipitation products are not able to function properly with varying degrees of precipitation intensity. The detection precision of the precipitation datasets declines overall as the daily precipitation intensity increases. It is evident that the two datasets can accurately represent tiny and light rainfall (0.1–1 and 1–5 mm/day). However, the PODs are mainly less than 0.3 and the FARs are more than 0.8, suggesting that P-CDR and IMERG do not accurately capture the majority of precipitation events. Likewise, the small POD and the large FAR indicate that there is still significant uncertainty associated with the datasets in terms of detecting heavy and torrential rain (10–20 and >20 mm/day). P-CDR features a higher degree of consistency with the observation dataset than IMERG in the case of precipitation events less than 5 mm/day and more than 20 mm/day. The performance is comparable in the case of 10–20 mm/day rainfall. Moreover, IMERG is slightly more accurate when the amount of precipitation is between 5 and 10 mm/day. P-CDR exhibits a higher detection accuracy than IMERG for different precipitation intensities on the whole.
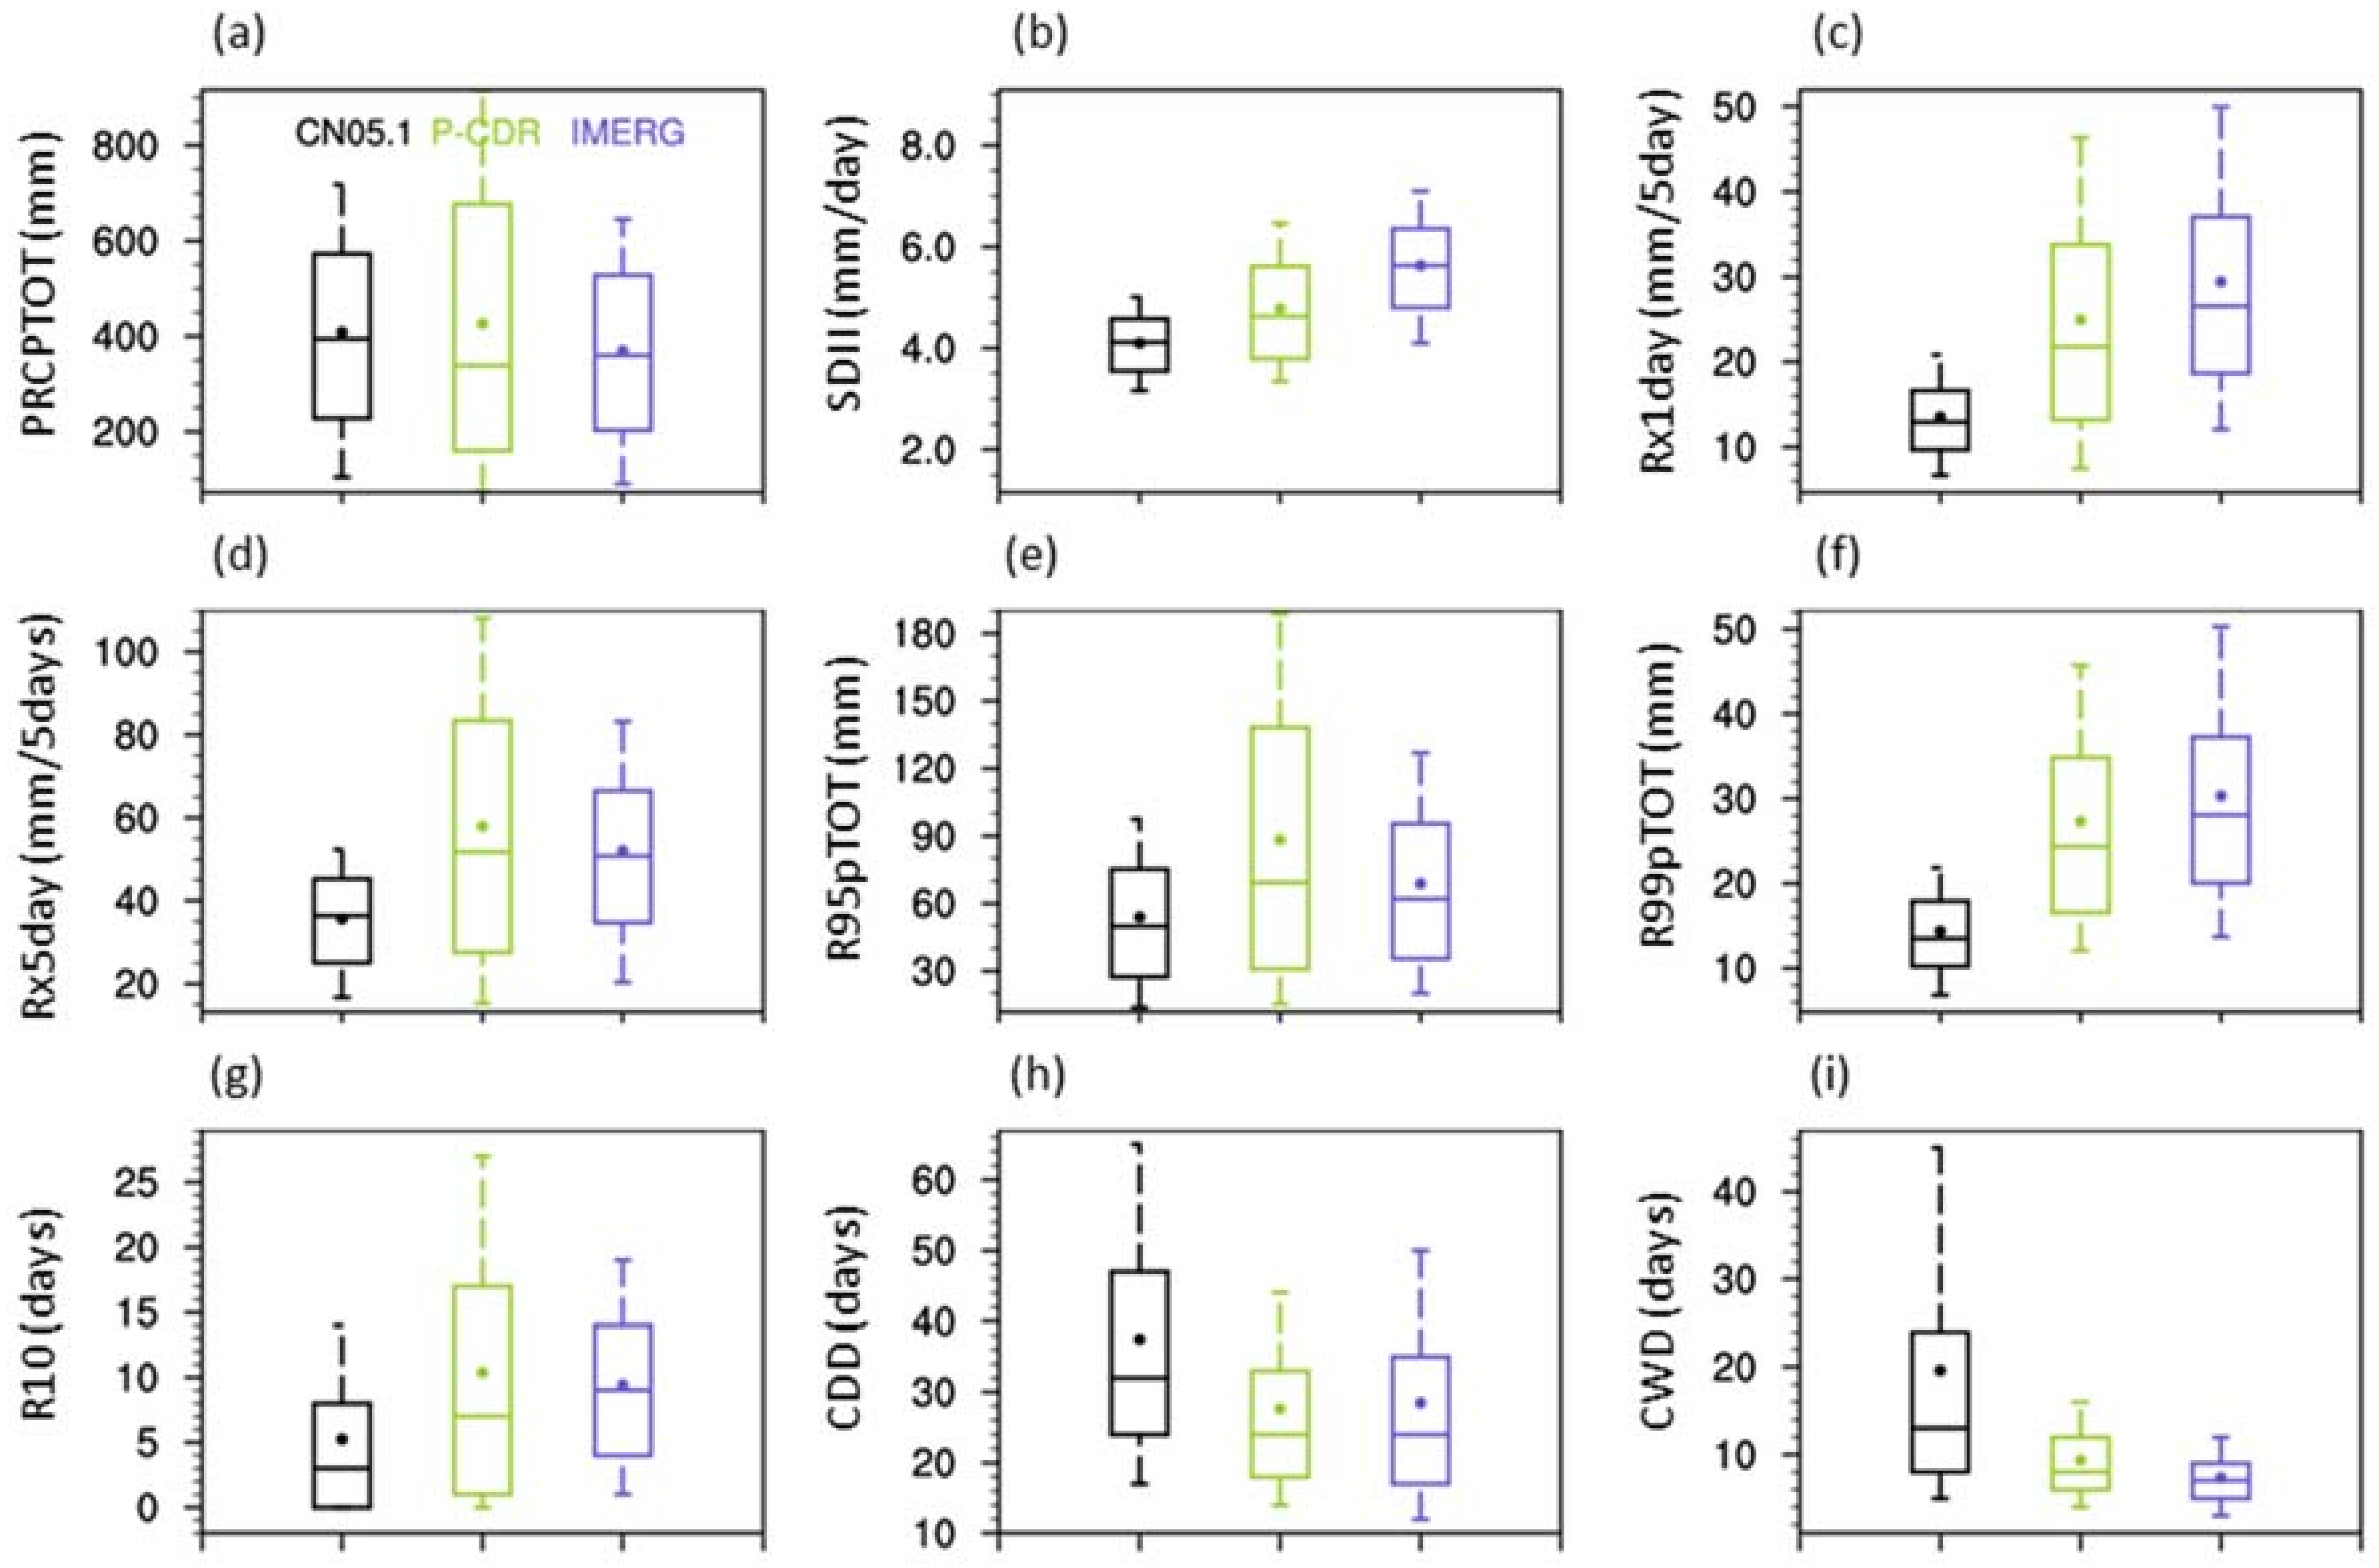
Nine extreme precipitation indices (PRCPTOT, SDII, Rx1 day, Rx5 day, R95pTOT, R99pTOT, R10, CDD, and CWD) are calculated to assess the performance of P-CDR and IMERG in reproducing daily extreme precipitation.
Figure 11 shows the boxplots of these indices for the TRH region from 2000 to 2014. Two satellite datasets are capable of accurately estimating the PRCPTOT with a wider range of PCD-R (
Figure 11a). The median SDII of IMERG is much higher than that of the observations (
Figure 11b). This may be due to the overestimation of dry days by IMERG (
Figure 8). P-CDR and IMERG extend to the higher extreme data and wider range than the observations concerning Rx1 day, Rx5 day, R95pTOT, R99pTOT, and R10 (
Figure 11c–g). With regard to CDD and CWD, P-CDR and IMERG are in a smaller range and have a lower median (
Figure 11h,i). Overall, P-CDR and IMERG underestimate the duration indices and overestimate the intensity indices, percentile-based threshold indices, and frequency indices. In addition, with regard to the medians of SDII, Rx1 day, R99pTOT, R10, CDD, and CWD, P-CDR shows better agreement with the observations than IMERG, whereas IMERG performs better for the medians of PRCPTOT, Rx5 day, and R95pTOT. Overall, P-CDR features a wider range of the 25th and 75th quantiles for extreme precipitation indices, excluding duration indices.
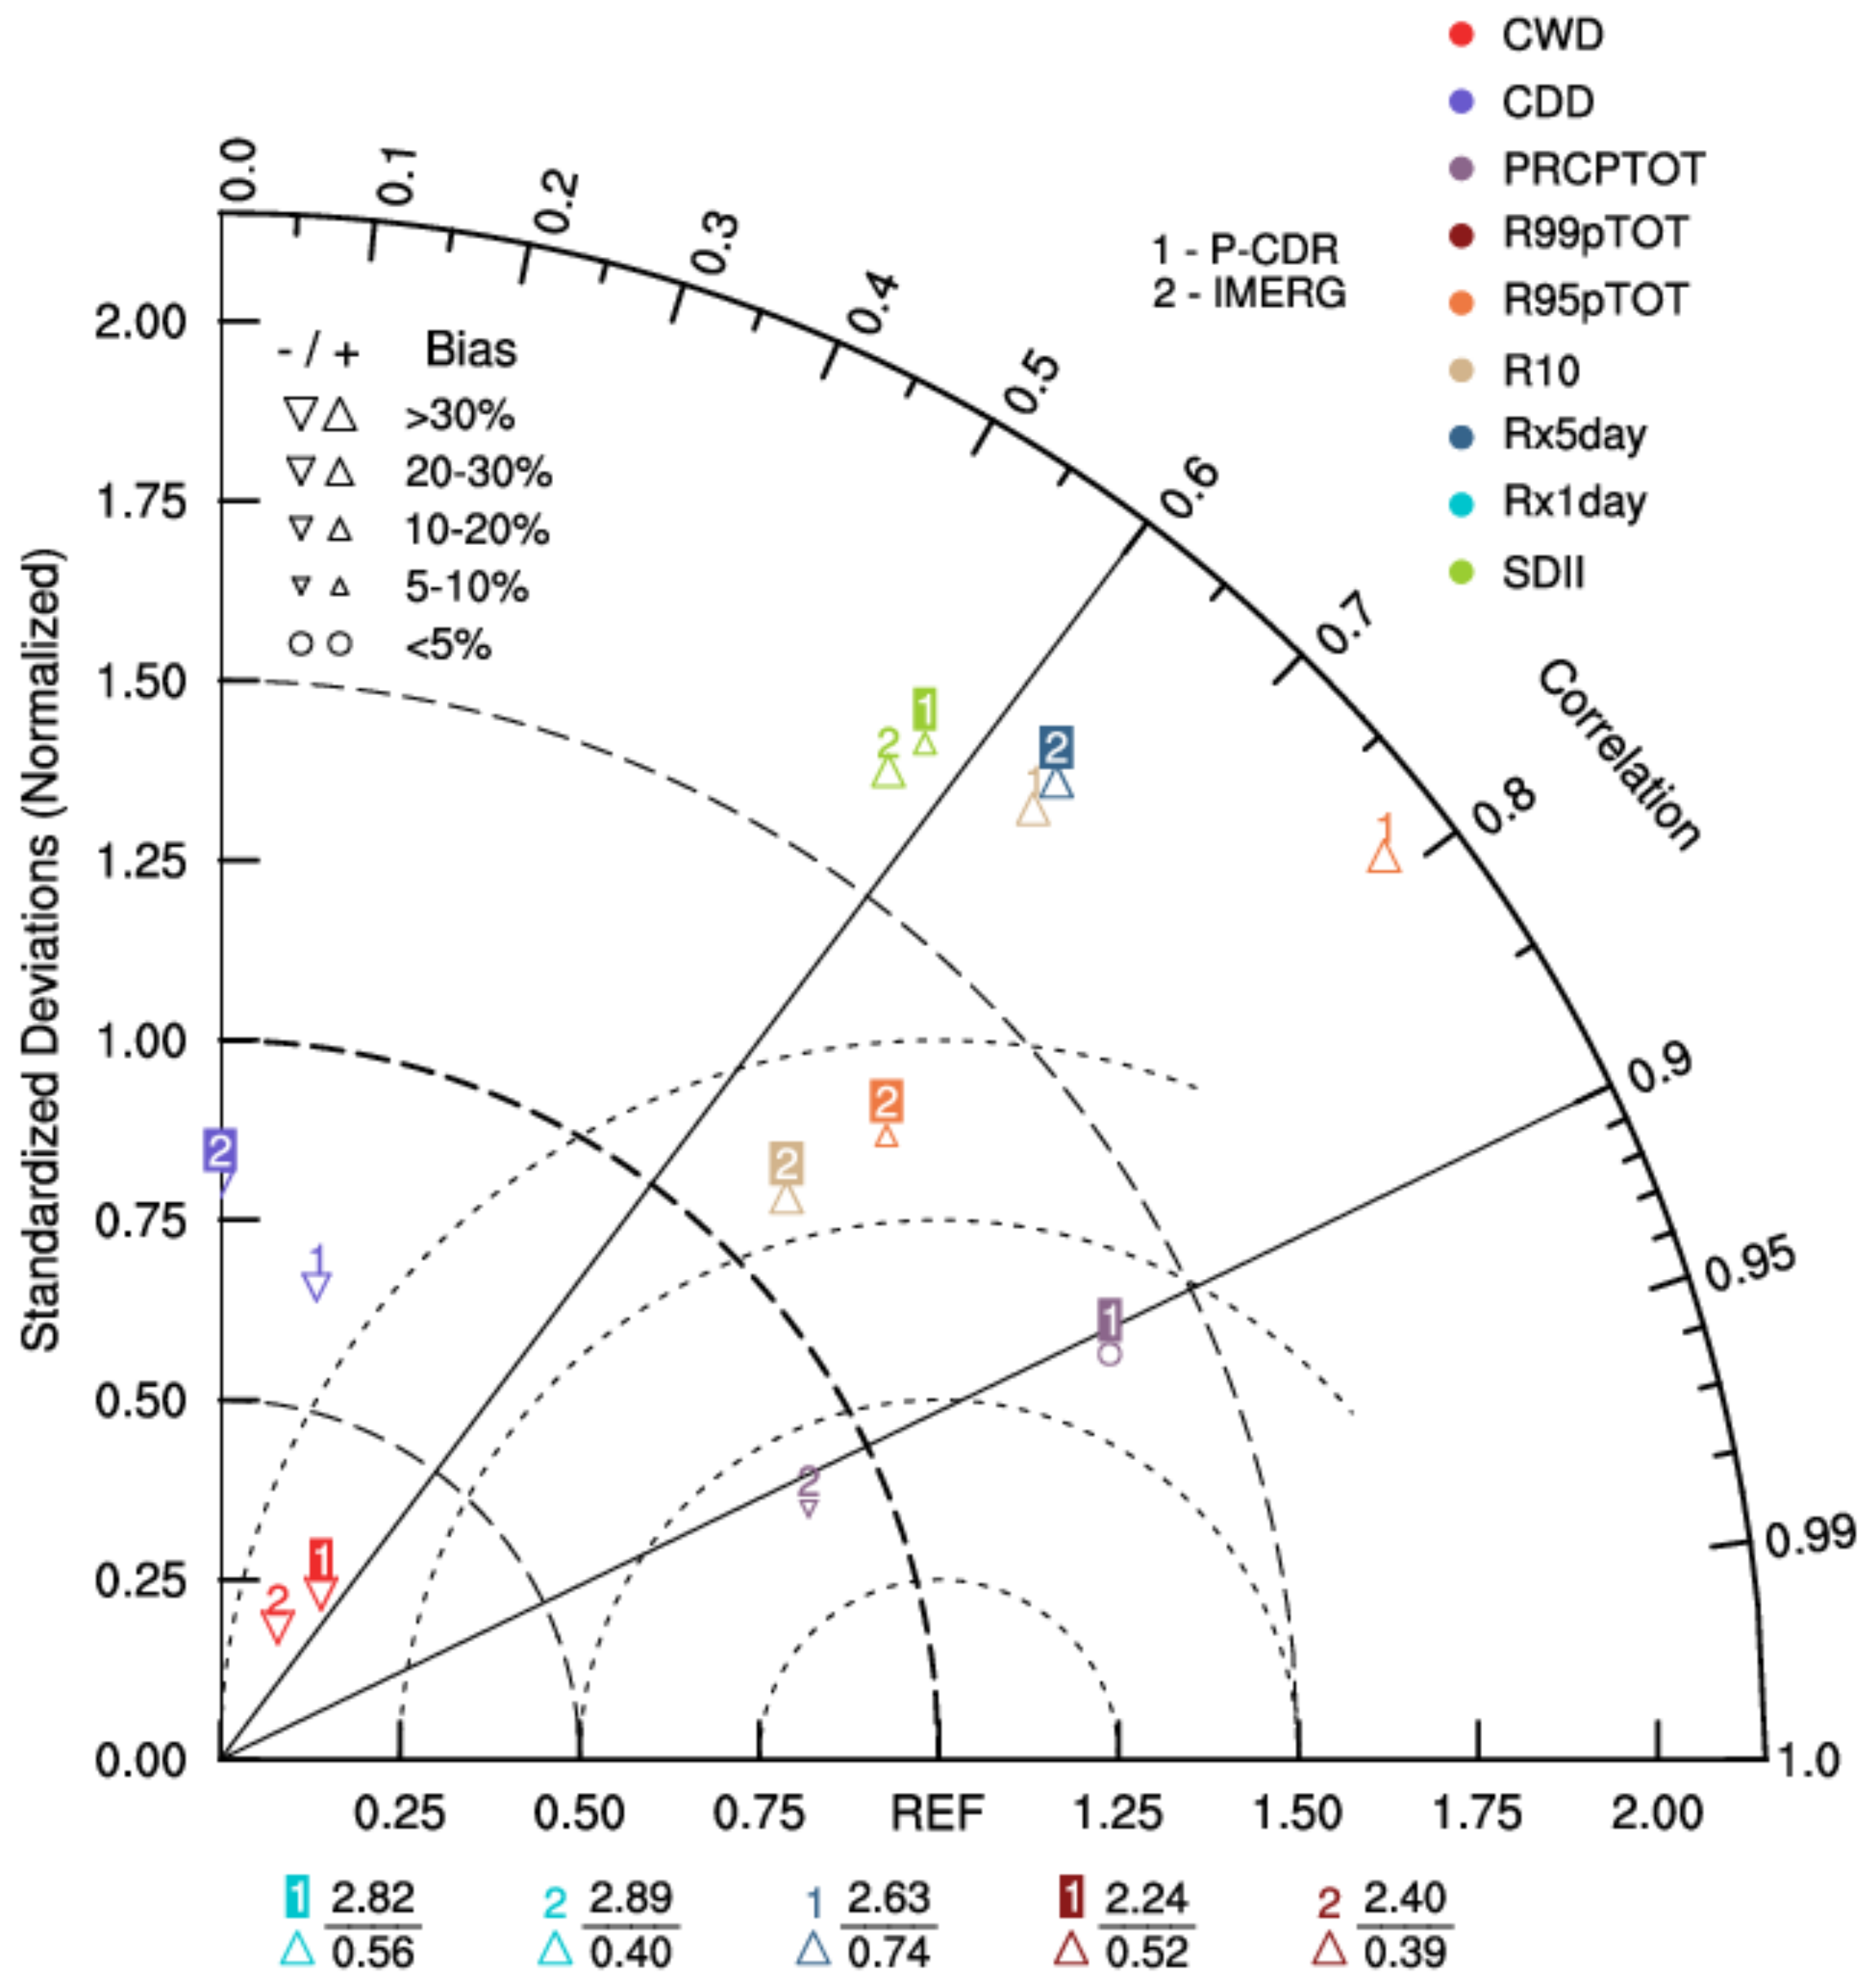
Figure 12 shows Taylor diagrams, which are a concise performance representation of the nine extreme precipitation indices. Two datasets exhibit CC values between 0.6 and 0.9 for PRCPTOT, R95pTOT, Rx5 day, and R10. In this respect, P-CDR and IMERG are capable of displaying these indices. In particular, PRCPTOT features a correlation higher than 0.8 as well as a lower centered normalized RMS. However, two datasets are not suited to accurately reproducing CDD, CWD, Rx1day, R99pTOT, and SDII. In particular, both the CC values of CDD and RSD values of CWD are lower than 0.3. In most situations, P-CDR and IMERG overestimate the RSD, indicating that two satellite products reproduce more variabilities in the extreme precipitations than the observations across the TRH region. Overall, P-CDR can outperform IMERG in capturing SDII, Rx1day, R99pTOT, CDD, and CWD, whereas IMERG is more in agreement with CN05.1 in performing PRCPTOT, Rx5day, R95pTOT, and R10.
4. Discussion
In this study, we conduct a comprehensive evaluation of multiple precipitation datasets in the TRH region from 1983 to 2014. The results show that these datasets can reasonably capture the variability of climatology, interannual variability, and the annual cycle of precipitation. However, some discrepancies are found in the long-term trends and extreme precipitation. Our findings align with those of previous studies such as those of Yao et al. (2020) and Beck et al. (2019) [
2,
51]. Yao et al. also found a significant discrepancy between different precipitation datasets in terms of reproducing the long-term trends of precipitation [
2]. According to Beck et al., daily precipitation is more complex to estimate than climatological characteristics [
51]. Additionally, some previous studies also indicated that daily precipitation estimates are subject to larger uncertainties [
6,
52,
53,
54,
55]. These depend on different data sources, rain gauge densities, quality control methods, and algorithms for processing topographic complexity [
8,
51]. Furthermore, the uncertainty of precipitation products in the TP has also been demonstrated to be greater than elsewhere [
56,
57,
58]. This is partly due to a limited number of stations in the TP that participated in the calibration [
8,
56]. Therefore, a single product can result in a biased estimation of precipitation features. The overall agreements and disagreements in precipitation characteristics can be examined by employing multiple datasets. In addition, according to the evaluation results in this paper, precipitation datasets have different accuracy for various precipitation characteristics across the TRH region. GPCC and P-CDR are preferred when focusing on the climatology and annual cycle of precipitation. ERA5 and CRU are more recommended for conducting interannual variability studies of the TRH. CRU can be selected to investigate the long-term trend of precipitation. P-CDR generally performs better than IMERG on the daily precipitation scale across the TRH. This study can provide options for readers conducting precipitation studies in the TRH and surrounding areas.
Although gauge measurements are frequently regarded as the “ground truth”, they should be corrected in areas with scarce rain gauges (such as instrumental, wind, and evaporation loss corrections) [
59,
60]. Furthermore, the point observations are extended to a gridded precipitation dataset by using complex interpolation methods, which will induce additional uncertainty, especially in data-sparse areas with complex topography [
61]. Therefore, due to the spatial resolution of the grids, elevation, and interpolation methods, as well as gauge concentration and quality, gauge-based gridded precipitation can have uncertainties [
62,
63,
64]. Despite providing global coverage and high temporal–spatial resolution, the satellite-derived datasets do not measure precipitation directly, but rather atmospheric radiation [
65,
66]. Therefore, their precision is dependent on sophisticated algorithms and available rain gauges for calibration [
67]. As a result, the relationship between atmospheric characteristics and precipitation rates results in high levels of uncertainty in satellite datasets [
64]. Reanalysis datasets can display various rainfall patterns and trends based on the observations, data assimilation, and physical parameterization schemes of the numerical model [
68]. Reanalysis datasets are susceptible to the source data and the data assimilation method [
61]. In light of the aforementioned uncertainties, it is impossible to identify the most reliable precipitation dataset.
Although the gridded precipitation datasets have shortcomings and discrepancies, their high spatial and temporal resolution makes them a valuable resource for studying climate variability and changes. In this study, we conduct a comprehensive analysis of precipitation characteristics by examining multiple datasets and critically interpreting the results. A comprehensive assessment of current precipitation datasets with longer time records and relatively high resolution is presented in this paper. However, it is important to note that improved spatial resolution and accuracy are still needed in regional hydrometeorological applications. To improve the spatial and temporal accuracy of precipitation data, multiple precipitation datasets can be downscaled and integrated using advanced techniques, such as machine learning algorithms.
5. Conclusions
A comprehensive assessment of several precipitation datasets (GPCC, CRU, CRA40, ERA5, P-CDR, and IMERG) is presented in this study. Multiple datasets are evaluated in comparison with CN05.1 during the period 1983–2014, including the climatology, interannual variability, long-term trends, and annual cycle. The reliability of P-CDR and IMERG for the daily precipitation is examined and analyzed during the period 2001–2014. The following is a summary of the main conclusions.
(1) All the precipitation datasets are capable of accurately reproducing the overall variability in climatology, interannual variability, and annual cycle of precipitation across the TRH region, but exhibit significant discrepancies in the long-term trends and extreme precipitation.
(2) GPCC and P-CDR have the best ability to capture the spatial variations in annual mean climatology, with high CC and low RMSE. CRU significantly underestimates annual mean climatology by −28.95%, whereas ERA5 dramatically overestimates annual mean climatology by 45.25%. Furthermore, ERA5 and CRU can effectively improve the characterization of interannual variability. The long-term trends of annual precipitation contain large inconsistencies and can be most closely replicated by employing CRU.
(3) The overall accuracy between the products and the observations is adequate on a monthly scale (CC: 0.74–0.96, RMSE: 13.00–25.71 mm/month) as well as an annual cycle (RMSE: 1.99–18.58 mm/month). P-CDR and GPCC exhibit a higher degree of accuracy on an annual cycle, while ERA5 shows the lowest skill (RMSE: 18.58 mm/month).
(4) On a daily scale, the probability of dry days (precipitation < 1 mm/day) is overestimated by P-CDR and IMERG, especially by IMERG. P-CDR and IMERG underestimate the probability of 5–10 mm precipitation and overestimate the precipitation above 10 mm. Overall, P-CDR exhibits a higher accuracy than IMERG in terms of accounting for the probability distribution and other assessment metrics of daily precipitation.
(5) P-CDR and IMERG underestimate the duration indices and overestimate the intensity, percentile-based threshold, and frequency indices. P-CDR is more accurate than IMERG in capturing SDII, Rx1day, R99pTOT, CDD, and CWD, whereas IMERG is more skillful for PRCPTOT, Rx5day, R95pTOT, and R10.
This paper discusses the strengths and weaknesses of major precipitation products across the TRH. These results will improve our understanding of precipitation characteristics in the TRH region and provide a reference for selecting precipitation data to conduct hydrological simulations and hydrometeorological hazard studies.
Author Contributions
Conceptualization, J.D. and L.Z.; Methodology, J.D. and X.Y.; Software, J.D. and X.Y.; Formal analysis, J.D. and Y.R.; Data curation, L.Z. and Y.R.; Validation, J.D.; Writing—original draft, J.D.; Writing—review and editing, J.D., X.Y. and L.Z.; Supervision, T.A.; Funding acquisition, T.A. All authors have read and agreed to the published version of the manuscript.
Funding
This research is financially supported by the Key R&D Project from the Science and Technology Department of Sichuan Province, grant number: 2021YFS0285, Key R&D Project from the Science and Technology Department of Tibet, grant number: XZ202101ZY0007G, and the Regional Innovation Cooperation Program, grant number: 2020YFQ0013.
Data Availability Statement
All the precipitation products in this study can be downloaded for free from the website links attached in the main text.
Acknowledgments
We thank the developers of the precipitation products for making the data available to the public. We are very grateful to the editors and reviewers for their valuable comments and thoughtful suggestions.
Conflicts of Interest
The authors declare no conflict of interest.
References
- Bai, P.; Liu, X.; Liu, C. Improving Hydrological Simulations by Incorporating GRACE Data for Model Calibration. J. Hydrol. 2018, 557, 291–304. [Google Scholar] [CrossRef]
- Yao, J.; Chen, Y.; Yu, X.; Zhao, Y.; Guan, X.; Yang, L. Evaluation of Multiple Gridded Precipitation Datasets for the Arid Region of Northwestern China. Atmos. Res. 2020, 236, 104818. [Google Scholar] [CrossRef]
- Zhou, L.; Rasmy, A.W.M.; Takeuchi, K.; Koike, T.; Hemakanth, S.; Ao, T. Adequacy of Near Real-Time Satellite Precipitation Products in Driving Flood Discharge Simulation in the Fuji River Basin, Japan. Appl. Sci. 2021, 11, 1087. [Google Scholar] [CrossRef]
- Yao, T.; Thompson, L.; Yang, W.; Yu, W.; Gao, Y.; Guo, X.; Yang, X.; Duan, K.; Zhao, H.; Xu, B.; et al. Different Glacier Status with Atmospheric Circulations in Tibetan Plateau and Surroundings. Nature Clim. Change 2012, 2, 663–667. [Google Scholar] [CrossRef]
- Ma, Y.; Han, C.; Zhong, L.; Wang, B.; Zhu, Z.; Wang, Y.; Zh, L.; Meng, C.; Xu, C.; Amatya, P.M. Using MODIS and AVHRR Data to Determine Regional Surface Heating Field and Heat Flux Distributions over the Heterogeneous Landscape of the Tibetan Plateau. Theor. Appl. Climatol. 2013, 117, 643–652. [Google Scholar] [CrossRef]
- Tong, K.; Su, F.; Yang, D.; Hao, Z. Evaluation of Satellite Precipitation Retrievals and Their Potential Utilities in Hydrologic Modeling over the Tibetan Plateau. J. Hydrol. 2014, 519, 423–437. [Google Scholar] [CrossRef]
- Wu, Y.; Guo, L.; Zheng, H.; Zhang, B.; Li, M. Hydroclimate Assessment of Gridded Precipitation Products for the Tibetan Plateau. Sci. Total Environ. 2019, 660, 1555–1564. [Google Scholar] [CrossRef]
- Sun, Q.; Miao, C.; Duan, Q.; Ashouri, H.; Sorooshian, S.; Hsu, K.-L. A Review of Global Precipitation Data Sets: Data Sources, Estimation, and Intercomparisons. Rev. Geophys. 2018, 56, 79–107. [Google Scholar] [CrossRef]
- Zhan, W.; He, X.; Sheffield, J.; Wood, E.F. Projected Seasonal Changes in Large-Scale Global Precipitation and Temperature Extremes Based on the CMIP5 Ensemble. J. Clim. 2020, 33, 5651–5671. [Google Scholar] [CrossRef]
- Lei, H.; Li, H.; Zhao, H.; Ao, T.; Li, X. Comprehensive Evaluation of Satellite and Reanalysis Precipitation Products over the Eastern Tibetan Plateau Characterized by a High Diversity of Topographies. Atmos. Res. 2021, 259, 105661. [Google Scholar] [CrossRef]
- Houghton, J.; Townshend, J.; Dawson, K.; Mason, P.; Zillman, J.; Simmons, A. The GCOS at 20 Years: The Origin, Achievement and Future Development of the Global Climate Observing System. Weather 2012, 67, 227–235. [Google Scholar] [CrossRef]
- Kidd, C.; Becker, A.; Huffman, G.J.; Muller, C.L.; Joe, P.; Skofronick-Jackson, G.; Kirschbaum, D.B. So, How Much of the Earth’s Surface Is Covered by Rain Gauges? Bull. Am. Meteorol. Soc. 2017, 98, 69–78. [Google Scholar] [CrossRef]
- Ouyang, R.; Liu, W.; Fu, G.; Liu, C.; Hu, L.; Wang, H. Linkages between ENSO/PDO Signals and Precipitation, Streamflow in China during the Last 100 Years. Hydrol. Earth Syst. Sci. 2014, 18, 3651–3661. [Google Scholar] [CrossRef]
- Zhang, W.; Zhou, T.; Zhang, L.; Zou, L. Future Intensification of the Water Cycle with an Enhanced Annual Cycle over Global Land Monsoon Regions. J. Clim. 2019, 32, 5437–5452. [Google Scholar] [CrossRef]
- Zhou, L.; Koike, T.; Takeuchi, K.; Rasmy, M.; Onuma, K.; Ito, H.; Selvarajah, H.; Liu, L.; Li, X.; Ao, T. A Study on Availability of Ground Observations and Its Impacts on Bias Correction of Satellite Precipitation Products and Hydrologic Simulation Efficiency. J. Hydrol. 2022, 610, 127595. [Google Scholar] [CrossRef]
- Schulz, J.; Albert, P.; Behr, H.-D.; Caprion, D.; Deneke, H.; Dewitte, S.; Dürr, B.; Fuchs, P.; Gratzki, A.; Hechler, P.; et al. Operational Climate Monitoring from Space: The EUMETSAT Satellite Application Facility on Climate Monitoring (CM-SAF). Atmos. Chem. Phys. 2009, 9, 1687–1709. [Google Scholar] [CrossRef]
- Liu, Z.; Yang, Q.; Shao, J.; Wang, G.; Liu, H.; Tang, X.; Xue, Y.; Bai, L. Improving Daily Precipitation Estimation in the Data Scarce Area by Merging Rain Gauge and TRMM Data with a Transfer Learning Framework. J. Hydrol. 2022, 613, 128455. [Google Scholar] [CrossRef]
- Manz, B.; Buytaert, W.; Zulkafli, Z.; Lavado, W.; Willems, B.; Robles, L.A.; Rodríguez-Sánchez, J.-P. High-Resolution Satellite-Gauge Merged Precipitation Climatologies of the Tropical Andes. J. Geophys. Res. Atmos. 2016, 121, 1190–1207. [Google Scholar] [CrossRef]
- Yang, Z.; Hsu, K.; Sorooshian, S.; Xu, X.; Braithwaite, D.; Zhang, Y.; Verbist, K.M.J. Merging High-Resolution Satellite-Based Precipitation Fields and Point-Scale Rain Gauge Measurements—A Case Study in Chile. J. Geophys. Res. Atmos. 2017, 122, 5267–5284. [Google Scholar] [CrossRef]
- Liu, L.; Zhou, L.; Ao, T.; Liu, X.; Shu, X. Flood Hazard Analysis Based on Rainfall Fusion: A Case Study in Dazhou City, China. Remote Sens. 2022, 14, 4843. [Google Scholar] [CrossRef]
- Huang, X.; Zhou, T.; Zhang, W.; Jiang, J.; Li, P.; Zhao, Y. Northern Hemisphere Land Monsoon Precipitation Changes in the Twentieth Century Revealed by Multiple Reanalysis Datasets. Clim. Dynam. 2019, 53, 7131–7149. [Google Scholar] [CrossRef]
- Ren, Y.; Yu, H.; Liu, C.; He, Y.; Huang, J.; Zhang, L.; Hu, H.; Zhang, Q.; Chen, S.; Liu, X.; et al. Attribution of Dry and Wet Climatic Changes over Central Asia. J. Clim. 2022, 35, 1399–1421. [Google Scholar] [CrossRef]
- Chen, Q.; Ge, F.; Jin, Z.; Lin, Z. How Well Do the CMIP6 HighResMIP Models Simulate Precipitation over the Tibetan Plateau? Atmos. Res. 2022, 279, 106393. [Google Scholar] [CrossRef]
- Tan, X.; Ma, Z.; He, K.; Han, X.; Ji, Q.; He, Y. Evaluations on Gridded Precipitation Products Spanning More than Half a Century over the Tibetan Plateau and Its Surroundings. J. Hydrol. 2020, 582, 124455. [Google Scholar] [CrossRef]
- Yuan, X.; Yang, K.; Lu, H.; He, J.; Sun, J.; Wang, Y. Characterizing the Features of Precipitation for the Tibetan Plateau among Four Gridded Datasets: Detection Accuracy and Spatio-Temporal Variabilities. Atmos. Res. 2021, 264, 105875. [Google Scholar] [CrossRef]
- Zhang, Y.; Ju, Q.; Zhang, L.; Xu, C.-Y.; Lai, X. Evaluation and Hydrological Application of Four Gridded Precipitation Datasets over a Large Southeastern Tibetan Plateau Basin. Remote Sens. 2022, 14, 2936. [Google Scholar] [CrossRef]
- You, Q.; Min, J.; Zhang, W.; Pepin, N.; Kang, S. Comparison of Multiple Datasets with Gridded Precipitation Observations over the Tibetan Plateau. Clim. Dyn. 2015, 45, 791–806. [Google Scholar] [CrossRef]
- Meng, X.; Chen, H.; Li, Z.; Zhao, L.; Lv, S.; Deng, M.; Liu, Y.; Li, G. Review of Climate Change and Its Environmental Influence on the Three-River Regions. Plateau Meteorol. 2020, 39, 1133–1143. [Google Scholar] [CrossRef]
- The Research Group of Ecological Asset Accounting and Value Assessment in Three River Headwaters Region. Ecological Asset Accounting and Value Assessment in Three River Headwaters Region; Series of books on key consulting projects of the Chinese Academy of Engineering; Science Press: Beijing, China, 2018; ISBN 978-7-03-055666-0. [Google Scholar]
- Cao, L.; Pan, S. Changes in Precipitation Extremes over the “Three-River Headwaters” Region, Hinterland of the Tibetan Plateau, during 1960–2012. Quat. Int. 2014, 321, 105–115. [Google Scholar] [CrossRef]
- Ding, Z.; Wang, Y.; Lu, R. An Analysis of Changes in Temperature Extremes in the Three River Headwaters Region of the Tibetan Plateau during 1961–2016. Atmos. Res. 2018, 209, 103–114. [Google Scholar] [CrossRef]
- Liang, L.; Li, L.; Liu, C.; Cuo, L. Climate Change in the Tibetan Plateau Three Rivers Source Region: 1960–2009. Int. J. Climatol. 2013, 33, 2900–2916. [Google Scholar] [CrossRef]
- Wu, J.; Gao, X.-J. A Gridded Daily Observation Dataset over China Region and Comparison with the Other Datasets. Acta Geophys. Sin. 2013, 56, 1102–1111. [Google Scholar] [CrossRef]
- Meyer-Christoffer, A.; Becker, A.; Finger, P.; Schneider, U.; Ziese, M. GPCC Precipitation Climatology Version 2018 at 0.25°: Monthly Land-Surface Precipitation Climatology for Every Month and the Total Year from Rain-Gauges Built on GTS-Based and Historic Data; Global Precipitation Climatology Centre: Namakkal, India, 2018. [Google Scholar]
- Harris, I.; Jones, P.D.; Osborn, T.J.; Lister, D.H. Updated High-resolution Grids of Monthly Climatic Observations—The CRU TS3.10 Dataset. Int. J. Climatol. 2014, 34, 623–642. [Google Scholar] [CrossRef]
- Ashouri, H.; Hsu, K.-L.; Sorooshian, S.; Braithwaite, D.K.; Knapp, K.R.; Cecil, L.D.; Nelson, B.R.; Prat, O.P. PERSIANN-CDR: Daily Precipitation Climate Data Record from Multisatellite Observations for Hydrological and Climate Studies. Bull. Am. Meteorol. Soc. 2015, 96, 69–84. [Google Scholar] [CrossRef]
- Huffman, G.J. Algorithm Theoretical Basis Document (ATBD) Version 4.4 for the NASA Global Precipitation Measurement (GPM) Integrated Multi-SatellitE Retrievals for GPM (I-MERG); NASA: Greenbelt, MD, USA, 2014. [Google Scholar]
- Hersbach, H.; Bell, B.; Berrisford, P.; Hirahara, S.; Horányi, A.; Muñoz-Sabater, J.; Nicolas, J.; Peubey, C.; Radu, R.; Schepers, D.; et al. The ERA5 Global Reanalysis. Q. J. R. Meteorol. Soc. 2020, 146, 1999–2049. [Google Scholar] [CrossRef]
- Li, C.; Zhao, T.; Shi, C.; Liu, Z. Evaluation of Daily Precipitation Product in China from the CMA Global Atmospheric Interim Reanalysis. J. Meteorol. Res. 2020, 34, 117–136. [Google Scholar] [CrossRef]
- Miao, C.; Gou, J.; Fu, B.; Tang, Q.; Duan, Q.; Chen, Z.; Lei, H.; Chen, J.; Guo, J.; Borthwick, A.G.; et al. High-Quality Reconstruction of China’s Natural Streamflow. Sci. Bull. 2022, 67, 547–556. [Google Scholar] [CrossRef]
- Miao, Y.; Wang, A. Evaluation of Routed-Runoff from Land Surface Models and Reanalyses Using Observed Streamflow in Chinese River Basins. J. Meteorol. Res. 2020, 34, 73–87. [Google Scholar] [CrossRef]
- Peng, D.; Zhou, T. Why Was the Arid and Semiarid Northwest China Getting Wetter in the Recent Decades? J. Geophys. Res. Atmos. 2017, 122, 9060–9075. [Google Scholar] [CrossRef]
- Hou, A.Y.; Kakar, R.K.; Neeck, S.; Azarbarzin, A.A.; Kummerow, C.D.; Kojima, M.; Oki, R.; Nakamura, K.; Iguchi, T. The Global Precipitation Measurement Mission. Bull. Am. Meteorol. Soc. 2014, 95, 701–722. [Google Scholar] [CrossRef]
- Bonavita, M.; Holm, E.; Isaksen, L.; Fisher, M. The Evolution of the ECMWF Hybrid Data Assimilation System. Q. J. R. Meteorol. Soc. 2016, 142, 287–303. [Google Scholar] [CrossRef]
- Liang, X.; Jiang, L.; Pan, Y.; Shi, C.; Liu, Z.; Zhou, Z. A 10-Yr Global Land Surface Reanalysis Interim Dataset (CRA-Interim/Land): Implementation and Preliminary Evaluation. J. Meteorol. Res. 2020, 34, 101–116. [Google Scholar] [CrossRef]
- Zhao, B.; Zhang, B.; Shi, C.; Liu, J.; Jiang, L. Comparison of the Global Energy Cycle between Chinese Reanalysis Interim and ECMWF Reanalysis. J. Meteorol. Res. 2019, 33, 563–575. [Google Scholar] [CrossRef]
- Karl, T.R.; Nicholls, N.; Ghazi, A. CLIVAR/GCOS/WMO Workshop on Indices and Indicators for Climate Extremes—Workshop Summary. Clim. Change 1999, 42, 3–7. [Google Scholar] [CrossRef]
- Alexander, L.V.; Fowler, H.J.; Bador, M.; Behrangi, A.; Donat, M.G.; Dunn, R.; Funk, C.; Goldie, J.; Lewis, E.; Rogé, M.; et al. On the Use of Indices to Study Extreme Precipitation on Sub-Daily and Daily Timescales. Environ. Res. Lett. 2019, 14, 125008. [Google Scholar] [CrossRef]
- Yu, H.; Yu, X.; Zhou, Z.; Wang, Y.; Li, Y.; Nanding, N.; Freychet, N.; Dong, B.; Wang, D.; Lott, F.C.; et al. Attribution of April 2020 Exceptional Cold Spell over Northeast China. Bull. Am. Meteorol. Soc. 2022, 103, S61–S67. [Google Scholar] [CrossRef]
- Taylor, K.E. Summarizing Multiple Aspects of Model Performance in a Single Diagram. J. Geophys. Res. Atmos. 2001, 106, 7183–7192. [Google Scholar] [CrossRef]
- Beck, H.E.; Pan, M.; Roy, T.; Weedon, G.P.; Pappenberger, F.; van Dijk, A.I.J.M.; Huffman, G.J.; Adler, R.F.; Wood, E.F. Daily Evaluation of 26 Precipitation Datasets Using Stage-IV Gauge-Radar Data for the CONUS. Hydrol. Earth Syst. Soc. 2019, 23, 207–224. [Google Scholar] [CrossRef]
- Miao, C.; Ashouri, H.; Hsu, K.-L.; Sorooshian, S.; Duan, Q. Evaluation of the PERSIANN-CDR Daily Rainfall Estimates in Capturing the Behavior of Extreme Precipitation Events over China. J. Hydrometeorol. 2015, 16, 1387–1396. [Google Scholar] [CrossRef]
- Wang, S.; Liu, S.; Mo, X.; Peng, B.; Qiu, J.; Li, M.; Liu, C.; Wang, Z.; Bauer-Gottwein, P. Evaluation of Remotely Sensed Precipitation and Its Performance for Streamflow Simulations in Basins of the Southeast Tibetan Plateau. J. Hydrometeorol. 2015, 16, 2577–2594. [Google Scholar] [CrossRef]
- Gao, Y.C.; Liu, M.F. Evaluation of High-Resolution Satellite Precipitation Products Using Rain Gauge Observations over the Tibetan Plateau. Hydrol. Earth Syst. Sci. 2013, 17, 837–849. [Google Scholar] [CrossRef]
- Bai, P.; Liu, X. Evaluation of Five Satellite-Based Precipitation Products in Two Gauge-Scarce Basins on the Tibetan Plateau. Remote Sens. 2018, 10, 1316. [Google Scholar] [CrossRef]
- Yong, B.; Liu, D.; Gourley, J.J.; Tian, Y.; Huffman, G.J.; Ren, L.; Hong, Y. Global View of Real-Time TRMM Multisatellite Precipitation Analysis: Implications for Its Successor Global Precipitation Measurement Mission. Bull. Am. Meteorol. Soc. 2015, 96, 283–296. [Google Scholar] [CrossRef]
- Beck, H.E.; Vergopolan, N.; Pan, M.; Levizzani, V.; van Dijk, A.I.J.M.; Weedon, G.P.; Brocca, L.; Pappenberger, F.; Huffman, G.J.; Wood, E.F. Global-Scale Evaluation of 22 Precipitation Datasets Using Gauge Observations and Hydrological Modeling. Hydrol. Earth Syst. Sci. 2017, 21, 6201–6217. [Google Scholar] [CrossRef]
- Shen, Y.; Xiong, A.; Wang, Y.; Xie, P. Performance of High-Resolution Satellite Precipitation Products over China. J. Geophys. Res. Atmos. 2010, 115, D02114. [Google Scholar] [CrossRef]
- Mcmillan, H.; Krueger, T.; Freer, J. Benchmarking Observational Uncertainties for Hydrology: Rainfall, River Discharge and Water Quality. Hydrol. Process. 2012, 26, 4078–4111. [Google Scholar] [CrossRef]
- Newman, A.J.; Clark, M.P.; Craig, J.; Nijssen, B.; Wood, A.; Gutmann, E.; Mizukami, N.; Brekke, L.; Arnold, J.R. Gridded Ensemble Precipitation and Temperature Estimates for the Contiguous United States. J. Hydrometeorol. 2015, 16, 2481–2500. [Google Scholar] [CrossRef]
- Timmermans, B.; Wehner, M.; Cooley, D.; O’Brien, T.; Krishnan, H. An Evaluation of the Consistency of Extremes in Gridded Precipitation Data Sets. Clim. Dyn. 2019, 52, 6651–6670. [Google Scholar] [CrossRef]
- Sevruk, B.; Ondras, M.; Chvila, B. The WMO Precipitation Measurement Intercomparisons. Atmos. Res. 2009, 92, 376–3807. [Google Scholar] [CrossRef]
- Durre, I.; Menne, M.J.; Gleason, B.E.; Houston, T.G.; Vose, R.S. Comprehensive Automated Quality Assurance of Daily Surface Observations. J. Appl. Meteorol. Climatol. 2009, 49, 1615–1633. [Google Scholar] [CrossRef]
- Mallakpour, I.; Sadeghi, M.; Mosaffa, H.; Asanjan, A.A.; Sadegh, M.; Nguyen, P.; Sorooshian, S.; AghaKouchak, A. Discrepancies in Changes in Precipitation Characteristics over the Contiguous United States Based on Six Daily Gridded Precipitation Datasets. Weather. Clim Extrem. 2022, 36, 100433. [Google Scholar] [CrossRef]
- Sadeghi, M.; Nguyen, P.; Hsu, K.; Sorooshian, S. Improving near Real-Time Precipitation Estimation Using a U-Net Convolutional Neural Network and Geographical Information. Environ. Model. Softw. Environ. Data News 2020, 134, 104856. [Google Scholar] [CrossRef]
- Sadeghi, M.; Nguyen, P.; Naeini, M.R.; Hsu, K.; Braithwaite, D.; Sorooshian, S. PERSIANN-CCS-CDR, a 3-Hourly 0.04° Global Precipitation Climate Data Record for Heavy Precipitation Studies. Sci. Data 2021, 8, 157. [Google Scholar] [CrossRef] [PubMed]
- Villarini, G.; Krajewski, W.F. Evaluation of the Research Version TMPA Three-Hourly 0.25° × 0.25° Rainfall Estimates over Oklahoma. Geophys. Res. Lett. 2007, 34, L05402. [Google Scholar] [CrossRef]
- de Leeuw, J.; Methven, J.; Blackburn, M. Evaluation of ERA-Interim Reanalysis Precipitation Products Using England and Wales Observations. Q. J. R. Meteorol. Soc. 2015, 141, 798–806. [Google Scholar] [CrossRef]
Figure 1.
The geographical and topographical location of the Three River Headwaters region (red boundary) in the Tibetan Plateau (brown boundary). The yellow, green, and pink colored areas are the Yellow River Basin, Yangtze River Basin, and Mekong River Basin, respectively.
Figure 1.
The geographical and topographical location of the Three River Headwaters region (red boundary) in the Tibetan Plateau (brown boundary). The yellow, green, and pink colored areas are the Yellow River Basin, Yangtze River Basin, and Mekong River Basin, respectively.
Figure 2.
The climatological annual mean climatology in the TRH region for the period 1983–2014 (units: mm/year): from observations (a) CN05.1 and five datasets (b) P-CDR; (c) GPCC; (d) CRU; (e) CRA40; and (f) ERA5. The pattern correlation coefficient (PCC) and the regional average annual mean climatology (AVG) of each dataset are shown.
Figure 3.
The relative interannual variability in the TRH region for the period 1983–2014. The markings are the same as in
Figure 2.
Figure 3.
The relative interannual variability in the TRH region for the period 1983–2014. The markings are the same as in
Figure 2.
Figure 4.
The linear trend of annual precipitation across the TRH region for the period 1983–2014 (units: mm/year). The dots represent a significance level higher than 0.05 using Student’s t-test. The markings are the same as in
Figure 2.
Figure 4.
The linear trend of annual precipitation across the TRH region for the period 1983–2014 (units: mm/year). The dots represent a significance level higher than 0.05 using Student’s t-test. The markings are the same as in
Figure 2.
Figure 5.
Taylor diagrams of climatology (CLM), interannual variability (STD), and long-term trends (trend) for each dataset across the TRH region during the period 1983–2014. Angular axes show correlation coefficients between the datasets and the observations, the ratio of the standard deviations is denoted as the radial distance from the origin, and the centered normalized root mean square (RMS) difference is expressed as the distance between any given point and the reference point. The positive and negative percent bias of each dataset is described by different sizes in the upper triangle and lower triangle. Furthermore, standard deviations > 2.15 are plotted as text at the bottom of the figure.
Figure 6.
Density-colored scatterplots of monthly precipitation for (a) P-CDR, (b) GPCC, (c) CRU, (d) CRA40, and (e) ERA5 against the observation dataset across the TRH region during the period 1983–2014 (units: mm/month). The color indicates the frequency of occurrence. The dark oblique solid line denotes the 1:1 line. The dotted line denotes the linear regression line. The linear regression equation, CC, RB, and RMSE of each dataset are shown.
Figure 7.
Annual cycle of the precipitation in the TRH region for the period 1983–2014 (units: mm/month). The grey boxes and the lines are the annual cycle from the observed dataset and five datasets. A box’s dispersion represents its interannual variability for the corresponding month. RMSEs of the multiple datasets compared to the observation dataset are printed.
Figure 8.
The probability distribution function of daily precipitation in the TRH region from the observation dataset and other two datasets for the period 2001–2014 (units: %). (a) The probability distribution function and (b) the cumulative probability distribution.
Figure 8.
The probability distribution function of daily precipitation in the TRH region from the observation dataset and other two datasets for the period 2001–2014 (units: %). (a) The probability distribution function and (b) the cumulative probability distribution.
Figure 9.
Density-colored scatterplots of daily precipitation for (
a) P-CDR and (
b) IMERG against the observation dataset across the TRH region during the period 2001–2014 (units: mm/day). The markings are the same as in
Figure 6.
Figure 9.
Density-colored scatterplots of daily precipitation for (
a) P-CDR and (
b) IMERG against the observation dataset across the TRH region during the period 2001–2014 (units: mm/day). The markings are the same as in
Figure 6.
Figure 10.
The (a) POD, (b) FAR, (c) Fscore, and (d) precision based on two precipitation datasets versus the observation dataset during the period 2001–2014 with varying degrees of precipitation intensity.
Figure 10.
The (a) POD, (b) FAR, (c) Fscore, and (d) precision based on two precipitation datasets versus the observation dataset during the period 2001–2014 with varying degrees of precipitation intensity.
Figure 11.
Box plots of (a) PRCPTOT, (b) SDII, (c) Rx1 day, (d) Rx5 day, (e) R95pTOT, (f) R99pTOT, (g) R10, (h) CDD, and (i) CWD of the TRH region from 2000 to 2014 derived from CN05.1, P-CDR, and IMERG.
Figure 11.
Box plots of (a) PRCPTOT, (b) SDII, (c) Rx1 day, (d) Rx5 day, (e) R95pTOT, (f) R99pTOT, (g) R10, (h) CDD, and (i) CWD of the TRH region from 2000 to 2014 derived from CN05.1, P-CDR, and IMERG.
Figure 12.
Taylor diagrams of nine extreme precipitation indices during the period 2000–2014 across the TRH region. The markings are the same as in
Figure 5.
Figure 12.
Taylor diagrams of nine extreme precipitation indices during the period 2000–2014 across the TRH region. The markings are the same as in
Figure 5.
Table 1.
The information of precipitation products applied in this study.
Table 1.
The information of precipitation products applied in this study.
Table 2.
The extreme precipitation indices applied in this study.
Table 2.
The extreme precipitation indices applied in this study.
| Indices | Indicator Name | Definition | Units |
|---|
| Intensity indices |
| PRCPTOT | Annual total wet day precipitation | Annual total precipitation from days ≥ 1 mm | mm |
| SDII | Simple daily intensity index | The ratio of annual total precipitation to the number of wet days (≥1 mm) | mm/day |
| Rx1 day | Max 1-day precipitation amount | Annual maximum 1-day precipitation | mm/day |
| Rx5 day | Max 5-day precipitation amount | Annual maximum consecutive 5-day precipitation | mm/5 days |
| Percentile-based threshold indices |
| R95pTOT | Annual total precipitation of heavy precipitation | Annual total precipitation with precipitation >95th percentile | mm |
| R99pTOT | Annual total precipitation of extremely heavy precipitation | Annual total precipitation with precipitation >99th percentile | mm |
| Frequency indices |
| R10 | Number of heavy precipitation days | Annual days with precipitation ≥10 mm | days |
| Duration indices |
| CDD | Consecutive dry days | Maximum number of consecutive days when precipitation <1 mm | days |
| CWD | Consecutive wet days | Maximum number of consecutive days when precipitation ≥1 mm | days |
Table 3.
The assessment metrics applied in this study.
Table 3.
The assessment metrics applied in this study.
| Statistical Metrics | Formula | Optimal Value |
|---|
| Correlation coefficient (CC) | | 1 |
| Relative bias (RB) | | 0 |
| Root mean square error (RMSE) | | 0 |
| Probability of detection (POD) | | 1 |
| False alarm rate (FAR) | | 0 |
| Precision rate (precision) | | 1 |
| Fscore (Fscore) | | 1 |
| Disclaimer/Publisher’s Note: The statements, opinions and data contained in all publications are solely those of the individual author(s) and contributor(s) and not of MDPI and/or the editor(s). MDPI and/or the editor(s) disclaim responsibility for any injury to people or property resulting from any ideas, methods, instructions or products referred to in the content. |
© 2023 by the authors. Licensee MDPI, Basel, Switzerland. This article is an open access article distributed under the terms and conditions of the Creative Commons Attribution (CC BY) license (https://creativecommons.org/licenses/by/4.0/).


