

A Target Imaging and Recognition Method Based on Raptor Vision


College of Microelectronics and Communication Engineering, Chongqing University, Chongqing 400044, China
*
Author to whom correspondence should be addressed.
Remote Sens. 2023, 15(8), 2106; https://doi.org/10.3390/rs15082106
Submission received: 23 February 2023
/
Revised: 29 March 2023
/
Accepted: 14 April 2023
/
Published: 17 April 2023
(This article belongs to the Special Issue Machine Learning for Multi-Source Remote Sensing Images Analysis)
Abstract
:It is a big challenge to quickly and accurately recognize targets in a complex background. The mutual constraints between a wide field of vision (FOV) and high resolution affect the optical tracking and imaging ability in a wide area. In nature, raptors possess unique imaging structures and optic nerve systems that can accurately recognize prey. This paper proposes an imaging system combined with a deep learning algorithm based on the visual characteristics of raptors, aiming to achieve wide FOV, high spatial resolution, and accurate recognition ability. As for the imaging system, two sub-optical systems with different focal lengths and various-size photoreceptor cells jointly simulate the deep fovea of a raptor’s eye. The one simulating the peripheral region has a wide FOV and high sensitivity for capturing the target quickly by means of short focal length and large-size photoreceptor cells, and the other imitating the central region has high resolution for recognizing the target accurately through the long focal length and small-size photoreceptor cells. Furthermore, the proposed algorithm with an attention and feedback network based on octave convolution (AOCNet) simulates the mechanism of the optic nerve pathway by adding it into the convolutional neural network (CNN), thereby enhancing the ability of feature extraction and target recognition. Experimental results show that the target imaging and recognition system eliminates the limitation between wide FOV and high spatial resolution, and effectively improves the accuracy of target recognition in complex backgrounds.
1. Introduction
Currently, various electro-optical tracking systems are applied to detect and track targets because they can provide abundant and detailed information [1,2,3,4]. Lin et al. designed a real-time embedded vision system on an unmanned rotorcraft using an onboard color camera for ground target tracking [5]. Ferone et al. proposed a background subtraction approach based on pan-tilt-zoom cameras to detect moving targets [6]. Minaeian et al. designed a vision-based target recognition and localization method through the mobile camera of the UAV [7]. It is well known that FOV and spatial resolution are both important to electro-optical tracking systems, which, respectively, determine the speed and accuracy of target recognition. A wide FOV is conducive to capture prey quickly, and the higher the resolution, the more characteristic information could be obtained, which is more conducive to target recognition. So, a wide FOV and high spatial resolution are always desired in automatic target recognition. Taking the airborne electro-optical tracking system as an example, it usually requires a wide FOV to quickly obtain battlefield information and high spatial resolution to accurately recognize targets. However, the FOV and spatial resolution of electro-optical tracking systems are mutually restricted, that is, the wider the FOV, the lower the spatial resolution.
Many optical imaging devices have been proposed to overcome the limitation between FOV and spatial resolution [8,9]. An electro-optical tracking system integrating various spatial resolutions with different lens is proposed to solve the problem of mutual influence between imaging resolution and FOV [10]. In addition to heavy weights and low integration, this non-co-aperture integration mode requires it to calibrate its spatial coordinates for calculating position information. Inspired by biology, an artificial compound eye for optical imaging is proposed, which is a lightweight imaging device composed of 630 artificial ommatidia (visual sensors) with panoramic and undistorted FOV [11]. Inspired by studies on animals, a biomimetic control strategy is proposed for visually-guided micro-aerial vehicles, which uses a micro lens as the robot’s eye [12]. A multi-scale monocentric spherical lens imaging system is investigated to compensate for geometric aberrations without additional assistance [13]. However, the spherical lens imaging structure requires more variables, which increases the calculation and reduces the accuracy to some extent. Thus, it is necessary to develop a novel imaging equipment with wide FOVs and high spatial resolutions.
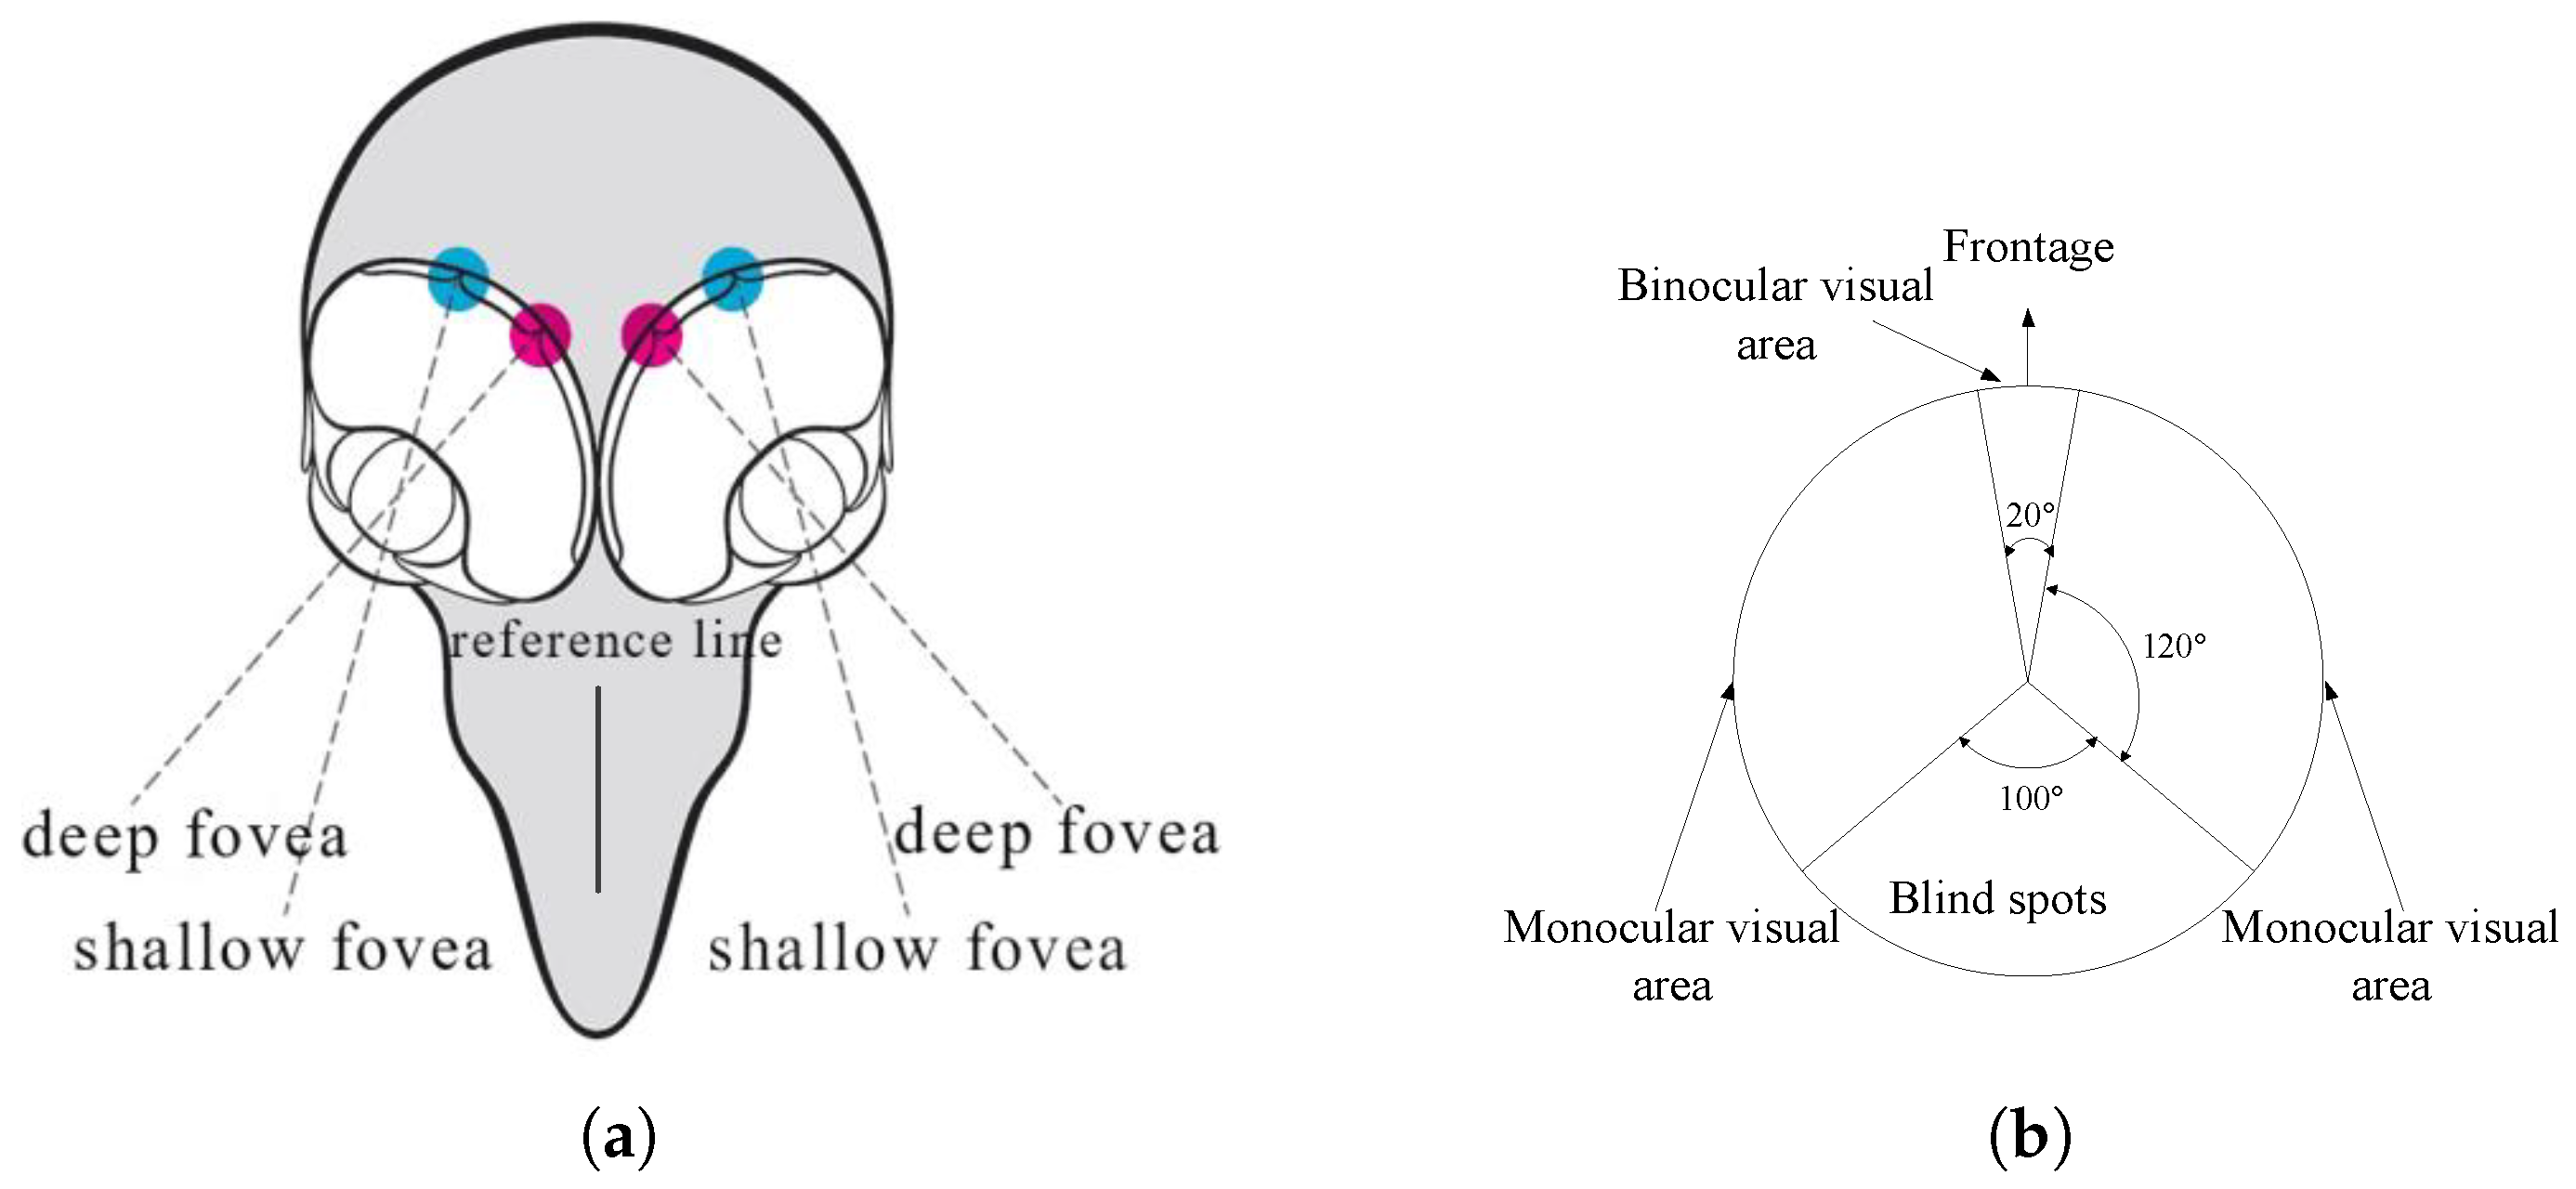
Diverse raptors such as eagles are known to capture prey from miles away through complex visual perception and processing strategies [14]. Each of their eyes has two distinct foveae, namely, deep fovea and shallow fovea [15]. The shallow fovea has a narrow FOV of around 20 degrees for tracking nearby targets by means of binocular vision. The deep fovea is responsible for target capture and recognition due to its wide FOV of approximately 120 degrees and high-density photoreceptor cells [16]. The closer to the central area of the fovea, the higher the density and smaller the volume of photoreceptor cells. In addition, the concave spherical surface of the deep fovea has the function of partially enlarging the image of the central region [17]. Inspired by the biologically visual strategies of a raptor’s eye, many optical imaging devices are proposed to enhance the performance of target recognition. The visual imaging guidance platform is proposed based on the characteristics of eagle eye image stitching, side suppression and visual attention [18]. To expand FOV, Deng et al. proposed an eagle-eye-based optical imaging platform by mounting several optical imaging systems with different FOV and resolutions at multiple orientations [19]. The images of the sub-optical system needs to be spliced into a whole image after complex coordinate transformation due to its inconsistent line of sight. A raptor-eye-based combination of traditional target recognition and a convolutional neural network is an innovative method [20], which has improved the algorithm but does not consider the impact of FOV.
There are many methods to recognize targets. Template matching is a traditional method [21,22], as it calculates the correlation between the reference template and the target template to seek the maximum peak. Visual saliency is the ability of fast focusing in the human visual system. According to the salient feature information of the target, the salient region is extracted and then the target is further recognized [23]. Machine learning has a strong ability of feature representation and target classification, and it transforms the target detection problem into a classification problem by means of a trained classifier. The training methods include support vector machine [24], AdaBoost [25], k-nearest neighbor [26], conditional random field [27] and so on. Gong et al. [28] introduced a rotation invariant layer in the region extraction stage, and added regularization constraints to optimize the function to improve the performance of multi-class target recognition. The learning-based RPN [29] effectively integrates the network structure by means of sharing the extracted features. Based on the perspective of the amplification of the deep fovea center region, the DeepFoveaNet algorithm proposed by Guzman-Pando et al. [30] divides the input image into four quadrants for locally enlarging the target. A system composed of two subsystems is proposed to recognize targets [31] without the consideration of the raptor’s optic nerve.
The raptor’s visual cortex has two pathways, i.e., the optic tectum and thalamus pathway [32]. The thalamus pathway perceives spatial information for navigation, and the optic tectum pathway is responsible for understanding the scene, and capturing and recognizing targets. The tectum pathway has a feedback mechanism to selectively enhance the stimulation of related characteristics while inhibiting the irrelevant stimuli.
Inspired by the imaging structure and optic nerve pathway of raptors, a novel biological visual device combined with convolutional neural network (CNN) is proposed in this paper to achieve wide FOV, high resolution and accurate recognition ability simultaneously. Two sub-optical imaging systems with different focal lengths and various-size photoreceptor cells jointly simulate the deep fovea. The one with short-focus and large-size photoreceptor cells has wide FOV and high sensitivity, which simulates the peripheral region. The other one with long-focus and small-size photoreceptor cells has high resolution, which simulates the central region. Moreover, the system has the same sight line by means of a co-aperture lens and a splitter prism, which divides the incident light into two parts and passes them to the different sub-optical imaging systems. In addition, by means of simulating the raptor’s optic nerve pathway, this paper proposes an AOCNet module with feedback to enhance the performance of target recognition. Through the feedback mechanism, the bottom layer of the network can effectively suppress or enhance the irrelevant or related information. The proposed system integrating the imaging device and the target recognition algorithm is verified.
2. Optical Imaging Equipment and Target Recognition Method
Raptors can see prey from a long distance, and it provides a good biological model for target recognition technology in complex backgrounds. This paper proposes a co-aperture optical imaging system to overcome the limitation between imaging resolution and field angle, as well as improve the capability of target monitoring and recognition.
2.1. Optical Imaging Equipment Based on Raptor Vision
The raptor’s eye contains two parts: deep fovea and shallow fovea, which are also known as central fovea and lateral fovea, respectively. As shown in Figure 1 [33], the deep fovea is close to the reference line (in front of the head) with a FOV of 120 c/deg (cycles/degree). The shallow fovea is close to the lateral of eye with a FOV of 20 c/deg. The maximum measured visual acuity of the eagle is about 140 c/deg, which is obtained at the luminance of 2000 cd/m2 [19]. When measured under the same psychophysical method and laboratory conditions, the maximum visual acuity of eagles is about twice that of humans [34]. The deep fovea is mainly responsible for target recognition in wide FOV, and the shallow fovea from two eyes could track nearby target by means of binocular vision.
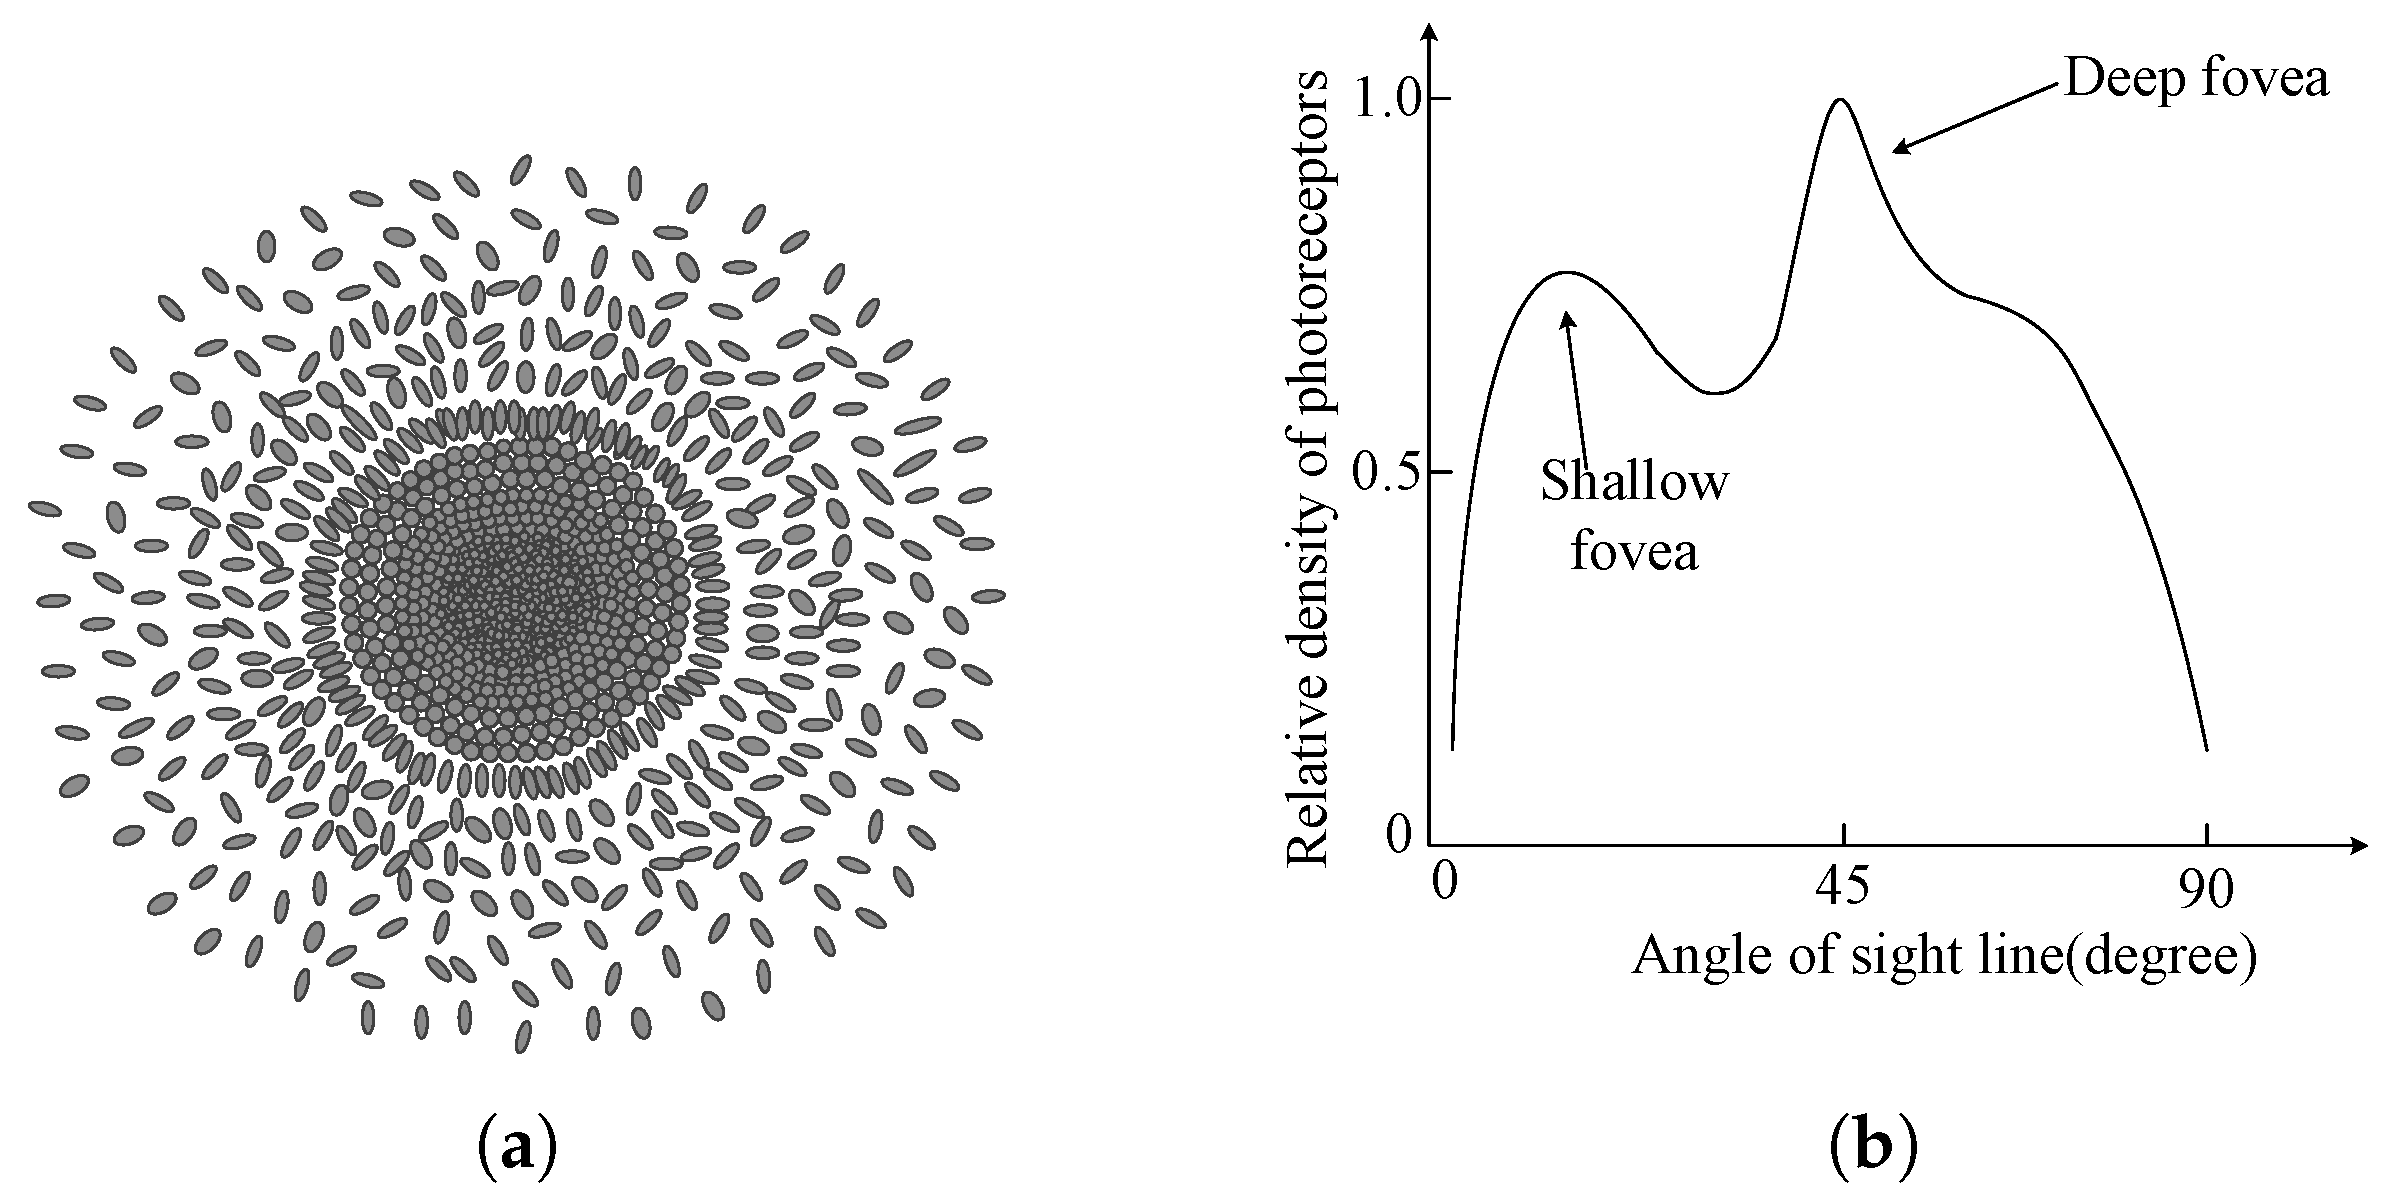
Moreover, the photoreceptor cells of fovea include rod cells and cone cells. Rod cells have high brightness sensitivity, while cone cells could provide color vision information. The density of an eagle’s fovea photoreceptor cells is 65,000/mm2, while that of the human eye is 38,000/mm2 [35]. Furthermore, as shown in Figure 2a, the cone cells located closer to the center of the fovea have a smaller volume and higher density [34]. The density of the photoreceptor cells is highest at the deep fovea as shown in Figure 2b [15].
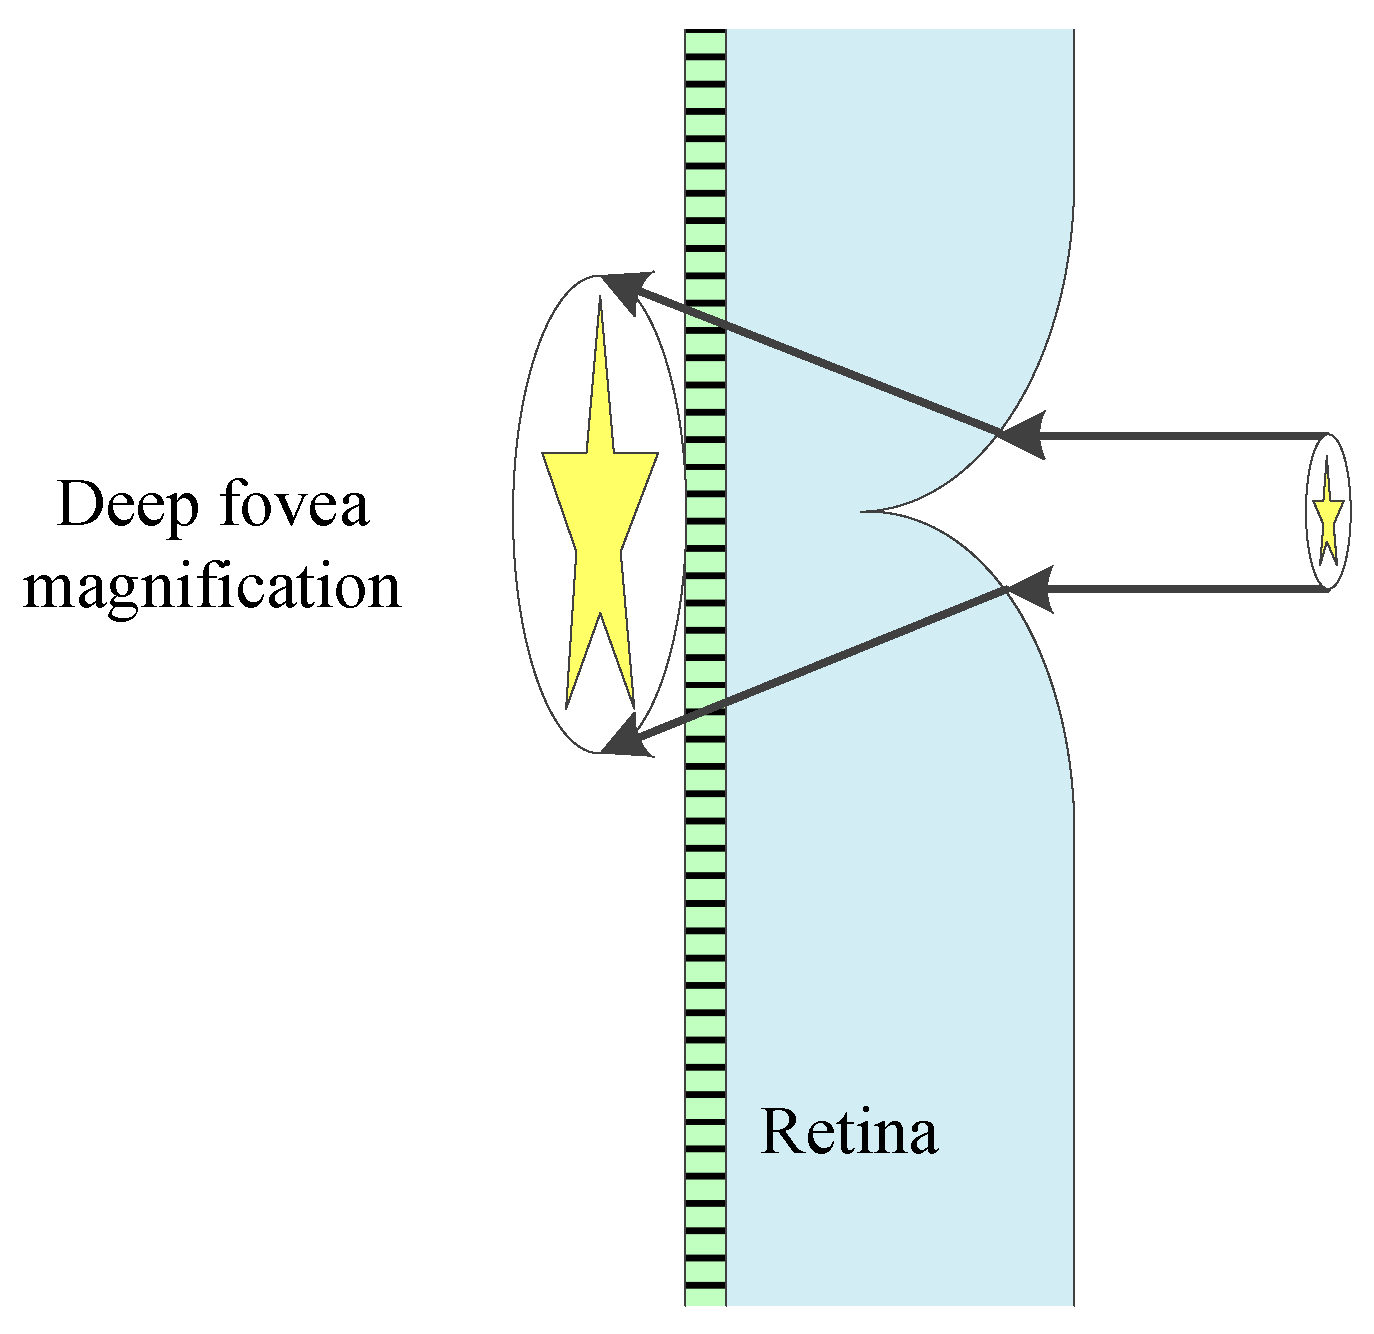
Meanwhile, there is a concave spherical structure at the bottom of deep central fovea, which acts as a negative lens to partially magnify the center area of the sight line. The anatomical structure of a raptor’s deep fovea is shown in Figure 3 [17]. It means that the target in the center of the sight line would be seen more clearly with abundant details.
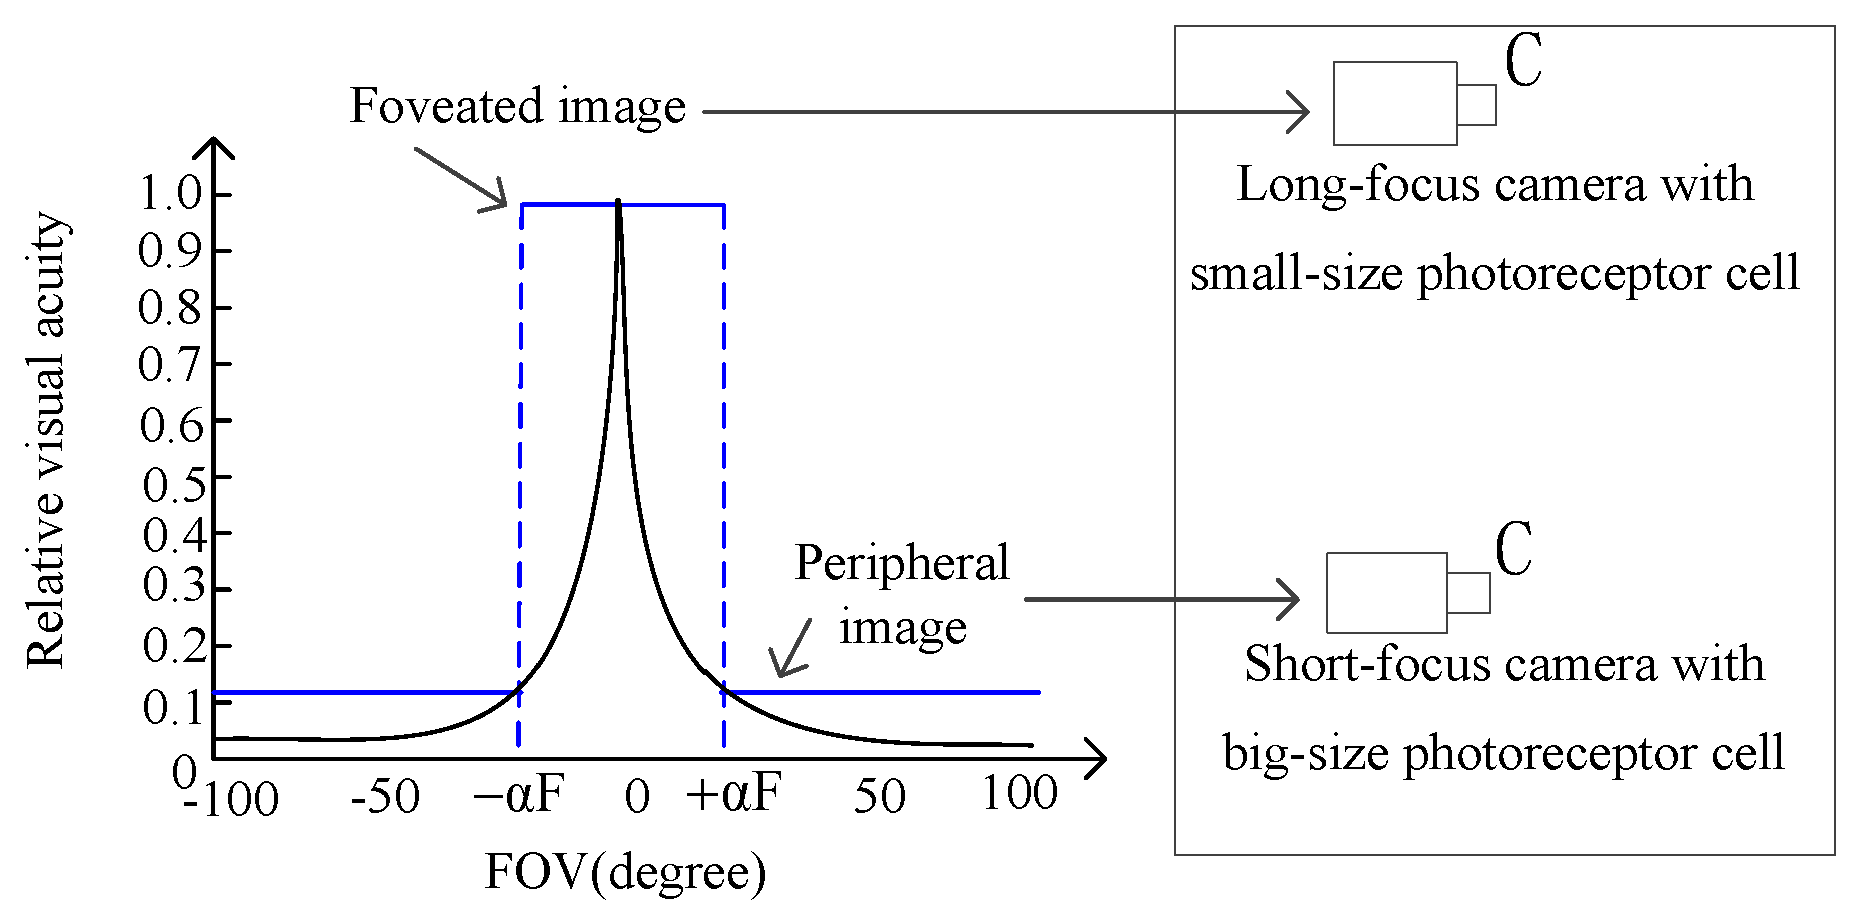
According to the deep fovea structure, an optical imaging system is proposed in this paper. As shown in Figure 4, there are two sub-optical systems with different focal lengths and various-size photoreceptor cells, which jointly simulate the deep fovea structure to achieve wide FOV and high resolution. The black solid line and blue dotted line in the designed diagram represent the photoreceptor cells density of the raptor’s eye and the proposed simulation method, respectively. A CMOS sensor with high density and small-size photoreceptor cells is adopted to simulate the central region of the deep fovea, and the other CMOS sensor with low density and large-size photoreceptor cells is used to simulate the peripheral region of the deep fovea. The imaging system utilizes a piecewise constant function to fit the relationship curve between the photoreceptor density and the FOV of raptor’s eye.
The concave spherical structure acts as a negative lens that could partially magnify targets at the center of the sight line. Therefore, the central region of the deep fovea should be stimulated by a sub-optical system with long focal length and small-size photoreceptor cells, and the peripheral region of the deep fovea is simulated by a short focal length sub-optical system with large-size photoreceptor cells. The one with a short focal length and large-size photoreceptor cells has a wide FOV, while the one with a long focal length and small-size photoreceptor cells has high resolution.
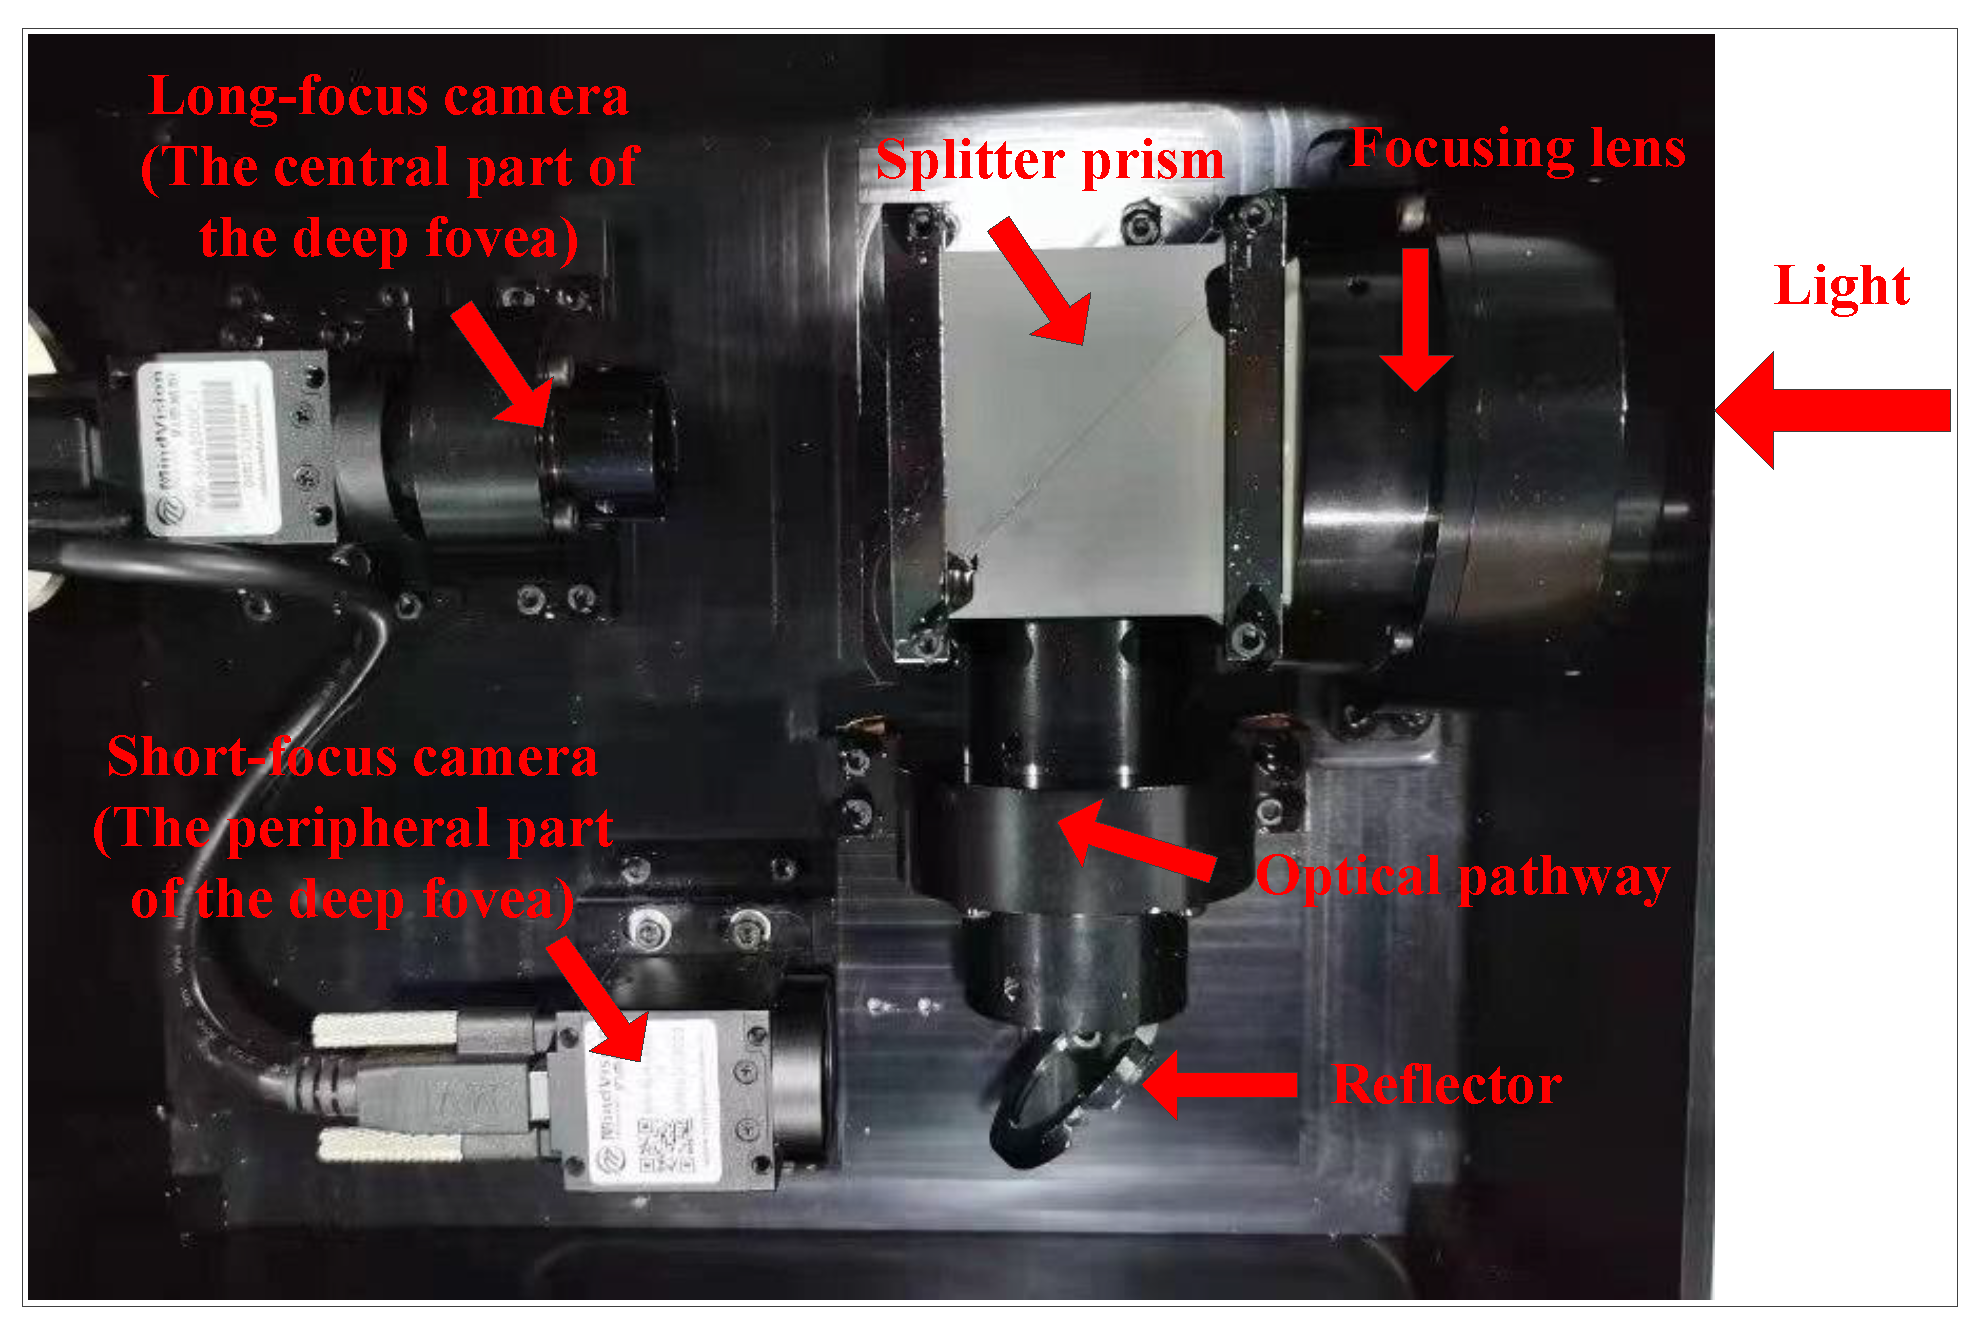
The schematic diagram of the designed optical imaging device is shown in Figure 5. The incident beam focused by the focusing lens is divided into two parts by a beam splitter prism with the same reflectivity and transmittance. After beam splitting, the reflected light and the transmitted light are focused on two different sub-optical systems, respectively. It is worth noting that the central part of the reflected beam is further expanded in order to fill the FOV of the imaging system with a long focal length. Through the above methods, the two sub-optical systems integrated in the proposed system not only own the same aperture, i.e., co-aperture, but also have the same center coordinate, which overcomes the coordinates conversion between the two sub-systems. Therefore, this optical imaging system could obtain a wide FOV with high resolution. The physical picture of this imaging system is shown in Figure 6.
2.2. AOCNet Based on Biological Vision
The special structure between the eyes and brain of a raptor makes it visually sensitive. There are two major visual pathways in the visual cortex of the raptor, i.e., the optic tectum pathway and thalamus pathway [36]. The sketch is shown in Figure 7, where Cere, Ec, OPT, Rt, TeO and Wulst represent the cerebellum, ectostriatum, thalamus’s main visual nucleu, nucleus rotundus, optic tectum and visual cortex, respectively, and Ep is the peripheral layer of Ec.
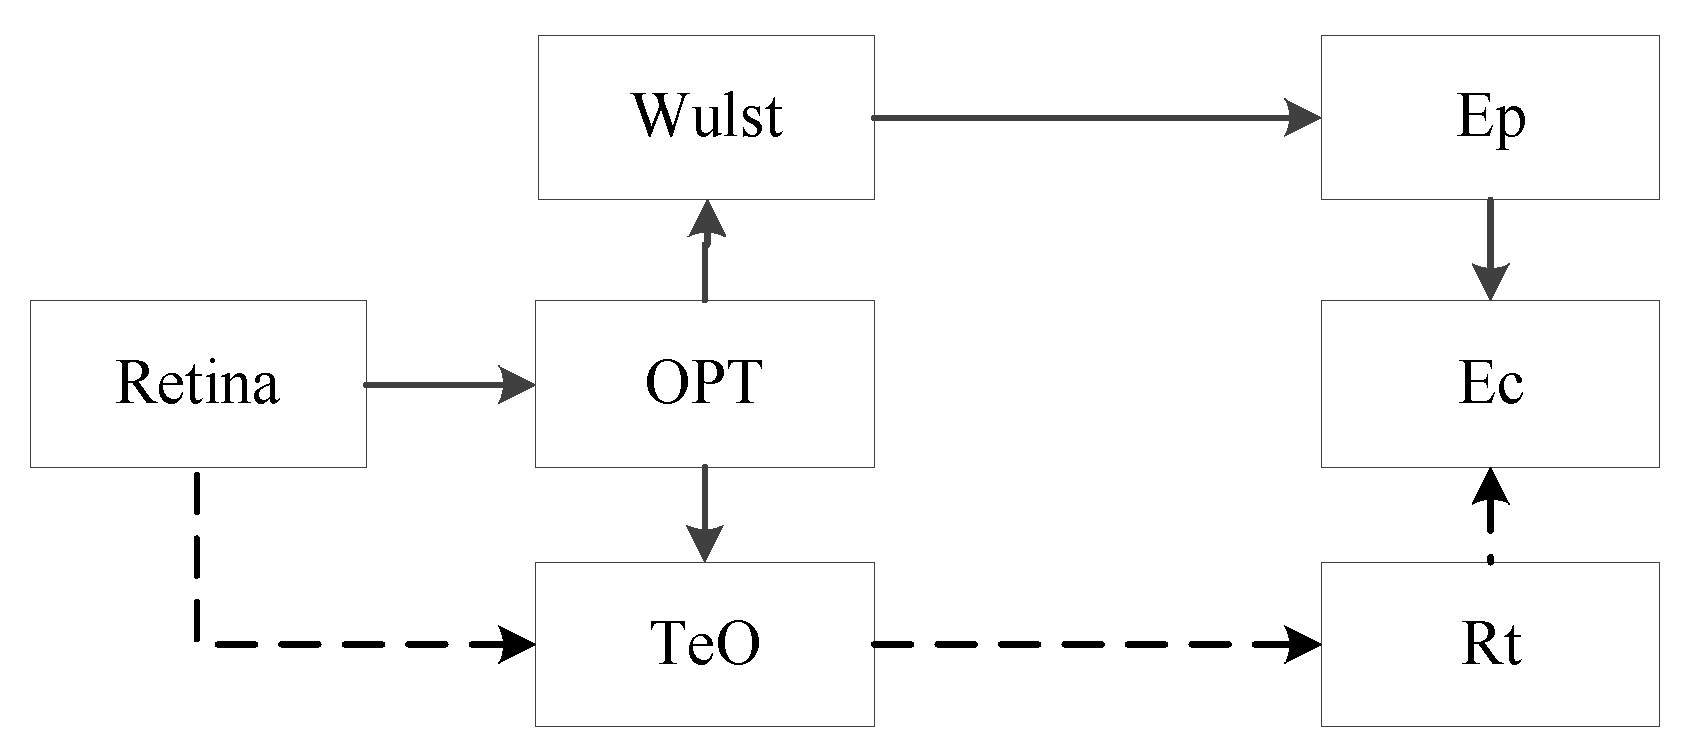
The thalamic pathway and optic tectum pathway are responsible for perceiving motion information and recognizing targets of interest. The schematic diagram is shown in Figure 8. The pathway from Retina to Ec could be used to analyze and recognize the target, and nucleus isthmus feedback controls Teo’s visual response. The nucleus isthmus includes two sub-nuclei, i.e., the large cells and small cells. TeO transmits information to the large cells, and its output is projected to the 12th to 14th deep layer of TeO, which has an incentive on the tectum cells. The small cells part of the nucleus isthmus receives the input of neurons in the 10th layer of TeO and forms inhibitory information projected to the 2th to 5th layers of TeO. The positive and negative feedback could enable tectum cells to selectively enhance the stimulation of related characteristics and inhibit the response to other irrelevant stimuli in the visual field. Therefore, the raptor could selectively pay attention to the targets of interest.
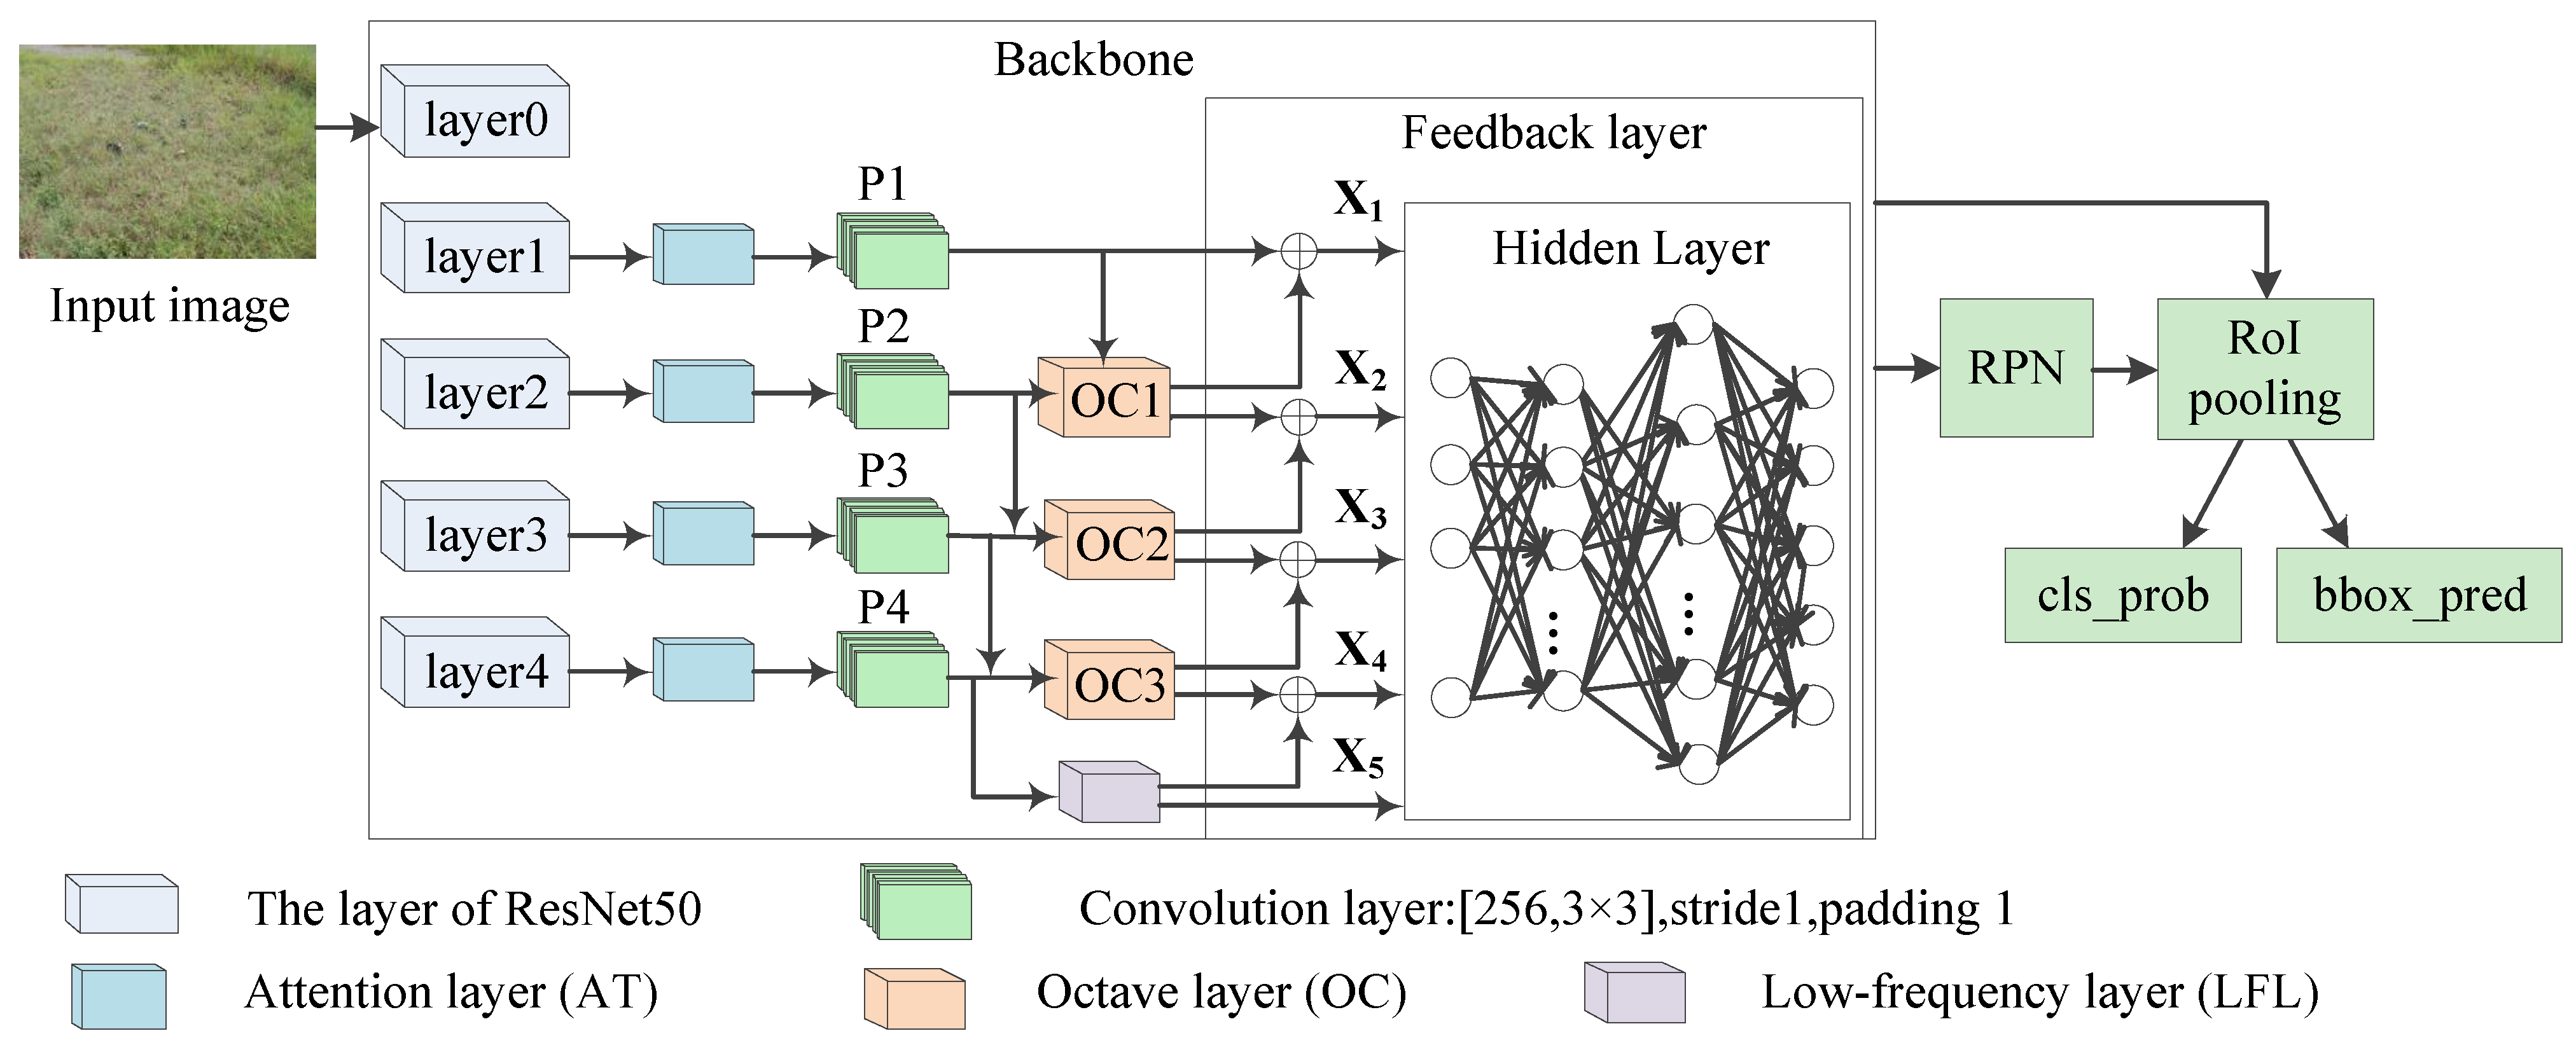
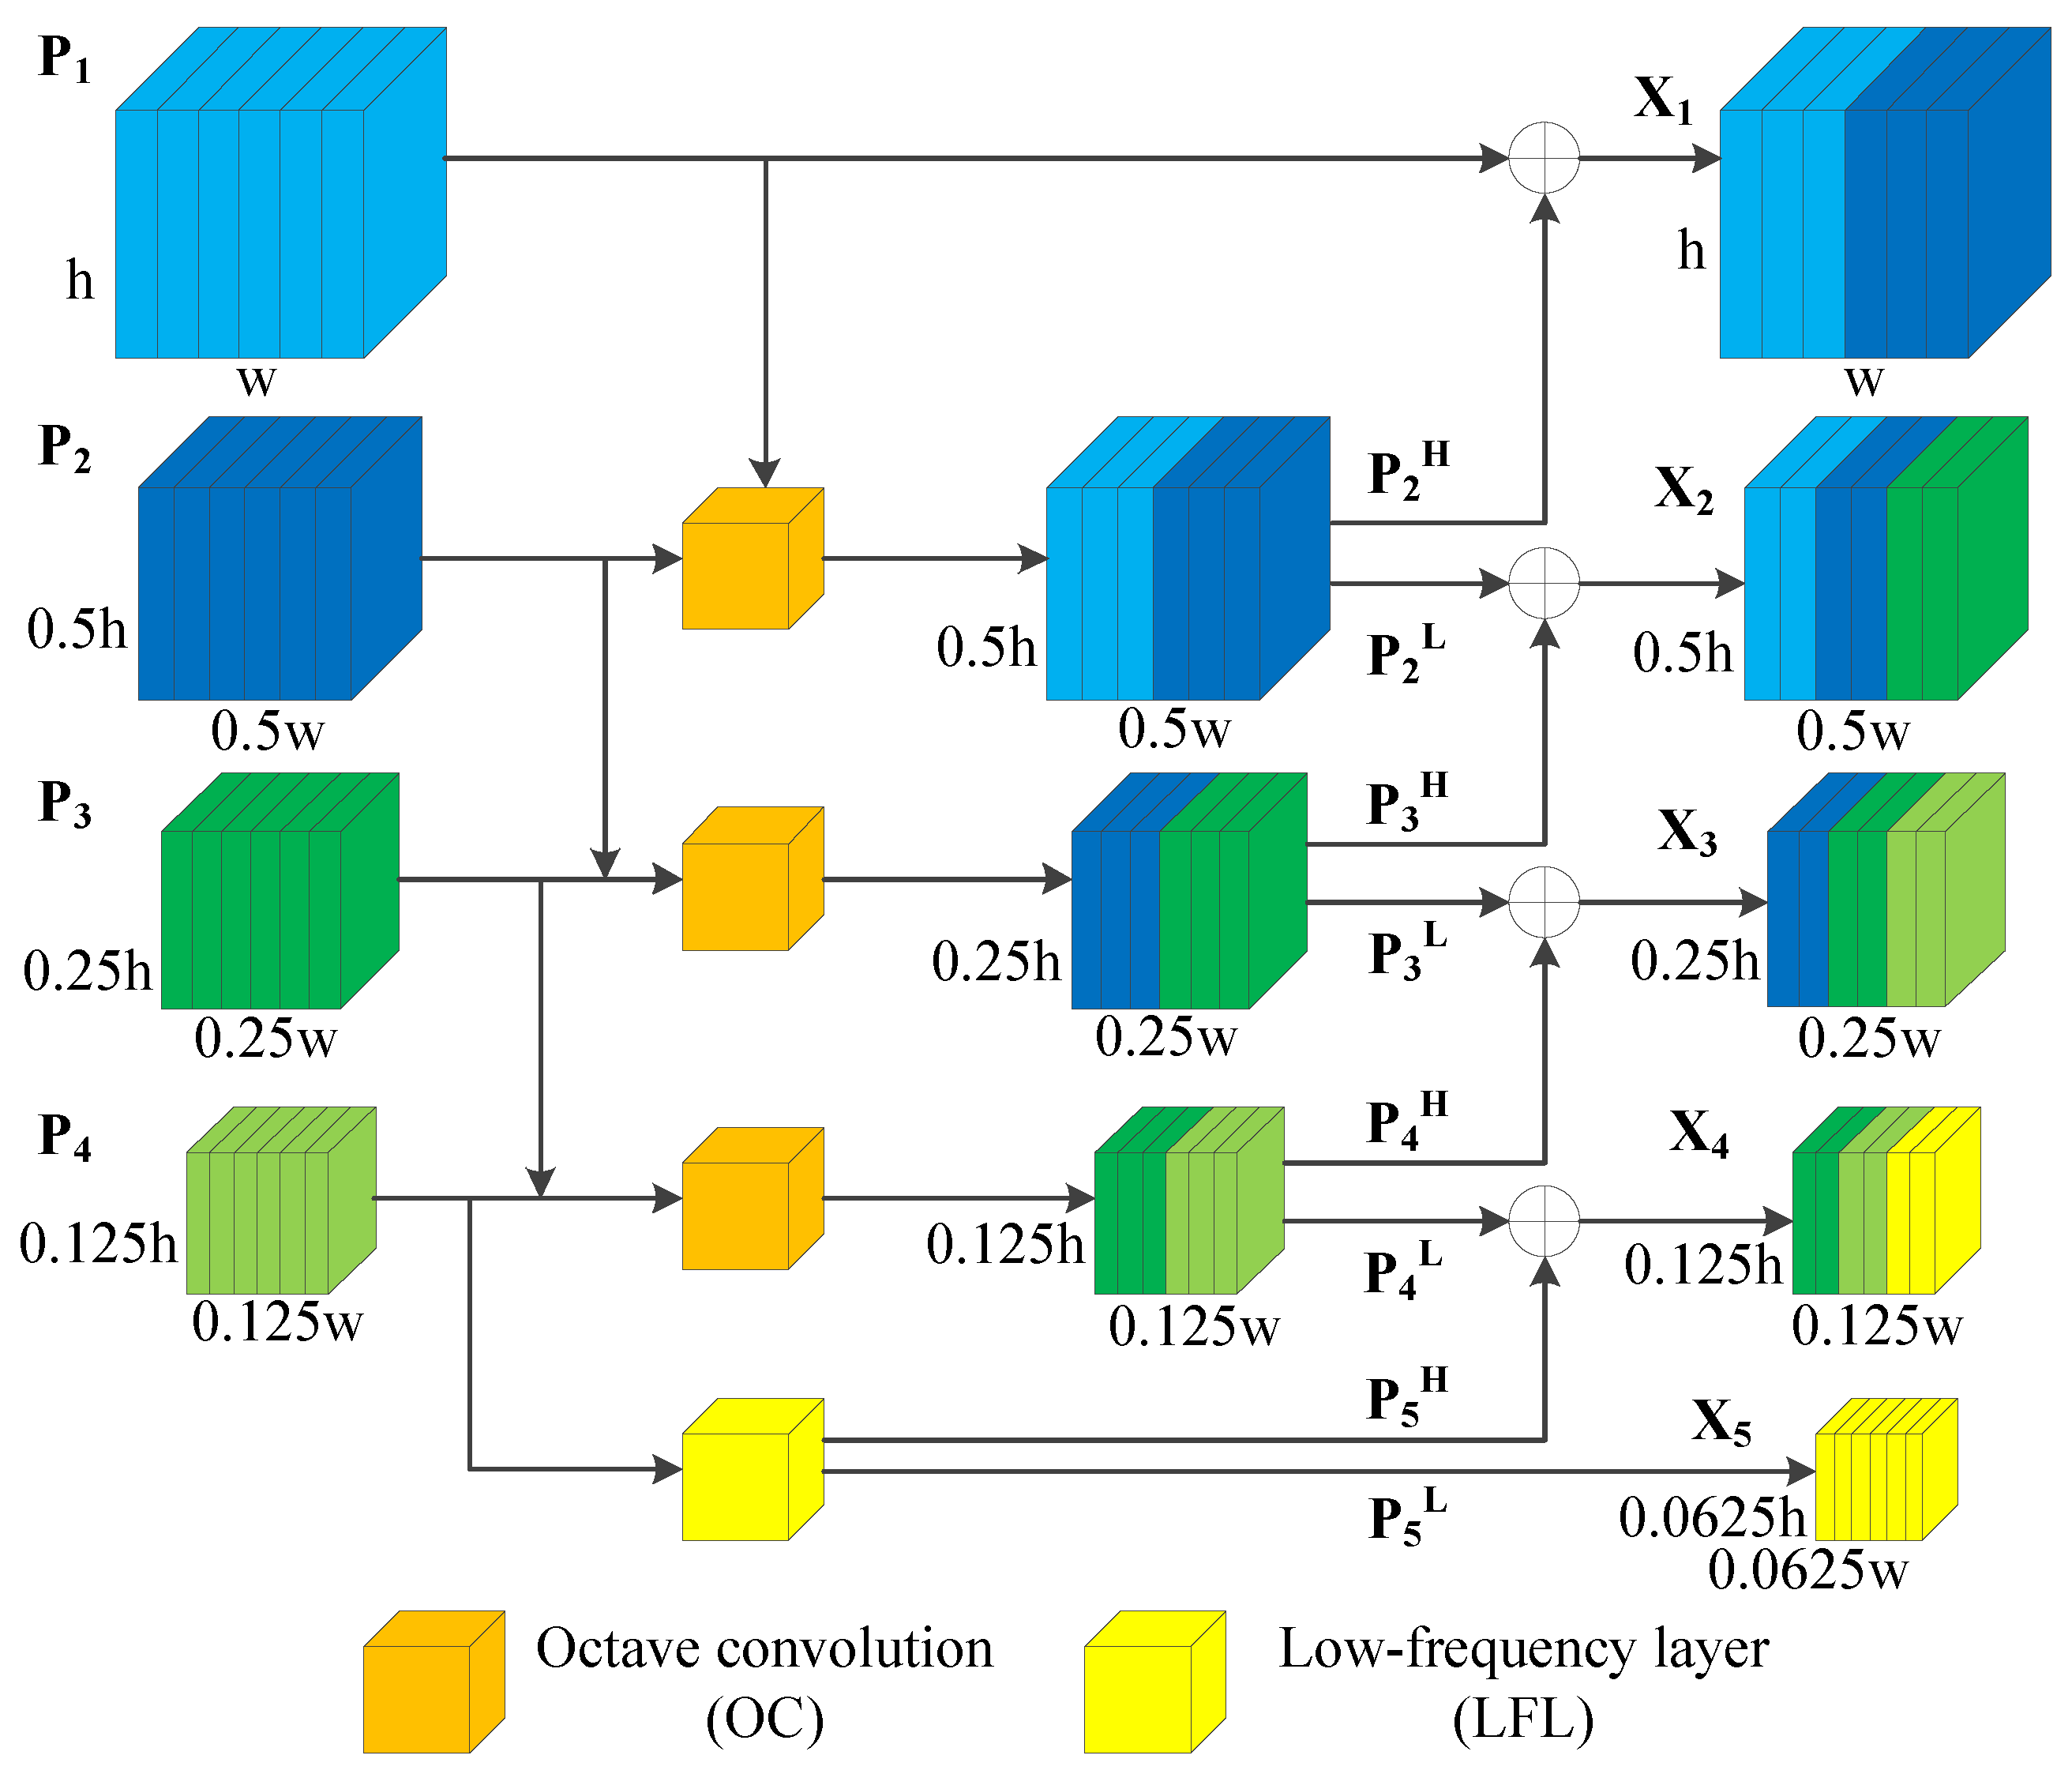
Inspired by the structure of a raptor’s visual information processing, the proposed AOCNet method with a feedback mechanism is shown in Figure 9. In this CNN algorithm, a top-down module is used to simulate the feedback control mechanism of the optic tectum pathway. Firstly, the four different feature maps of ResNet50 are obtained through forward transmission. The channel and spatial information are extracted by the attention module (AT). Then, the octave convolution (OC) [37] divides the features of each layer into high-frequency and low-frequency features, and performs feature fusion in the feedback layers. The top-level output is integrated with the underlying feature map, which is similar to the reverse transmission of the raptor’s eye vision. Finally, the low-frequency layer (LFL) is added to the proposed AOCNet, which expands the receptive field of the network and enhances the feature extraction ability.
The classical Faster R-CNN algorithm [38] with ResNet50 backbone is the baseline in this paper. The network of the classical algorithm consists of many convolution layers and Relu layers. The feature map is calculated from the input image through ResNet50. Then, the regional proposal network (RPN) and RoI pooling module are used to obtain the classification probability and prediction coordinates.
The structure of original ResNet50 is shown in Table 1. Taking an image with as an example, four feature maps could be obtained from different layers of ResNet50. The sizes of feature map in () layer are [256, 144, 256], [512, 72, 128], [1024, 36, 64] and [2048, 18, 32], respectively.
The calculation of is shown in Equation (1), and it consists of and [39]. is the channel attention function and denotes the spatial attention function. The feature map () as the input tensor is transmitted to and , respectively. and are calculated as shown in Equations (2) and (3). A sequential module composed of a convolution and rectified linear unit (CR) works after average-pooling (AvgPool) and max-pooling (MaxPool) operations.
where denotes the sigmoid function, is the convolution layer with kernel 7 by 7. The output of is , and the output of is .
The calculation of is shown in Equation (4), where is the input of . represents the high-frequency feature, and is the low-frequency feature. As can be seen from Figure 9, the channels of the feature map become 256 after the convolutional layer. Hence, the channel of input and is 256. The formulae of and are shown in Equations (5) and (6), respectively.
where the is a convolution layer with parameters , is an average pooling operation with kernel size 2 by 2. is the upsample function of the torch and its factor is set to 2, and the mode of interpolation is nearest. Assuming that the output channel of the convolution operation is x, and the is set as 0.5 in this paper, the details of different are shown in Table 2.
In addition, the LFL is added after the OC3 layer, which produces a lower frequency feature map than the input tensor, so that the system could obtain more global information. The formula of low-frequency feature map is denoted as Equation (7).
where the is the input data, and the denotes the parameters of the convolution mentioned in Equation (5).
The designed feature fusion module with feedback layers is shown in Figure 10. The and represent the high-frequency and low-frequency feature maps obtained by the OC layer, respectively. In this way, the top features are transferred to the bottom in reverse. The bottom layer will comprehensively consider the extracted features of the top layer, so as to improve the ability of selectively enhancing relevant neurons. Taking an image with as an example, the output feature dimension information of AOCNet is as follows: , the output channel C of is 256, and the sizes of the feature maps are [256, 144, 256], [256, 72, 128], [256, 36, 64], [256, 18, 32] and [256,9,16], respectively. The output after this module will be transmitted to the RPN module, which is similar to the traditional Faster R-CNN algorithm.
3. Results and Discussion
3.1. Datasets and Evaluation Metrics
In the simulation environment, grass is considered as background interference, while targets include trunk gun, UAV, ball, plane, tank, car, carrier, and “person”. Meanwhile, the images are captured from different angles in the simulation environment as our dataset. This dataset comprises 3643 images, encompassing 10 categories of targets. Additionally, the proposed method’s effectiveness is evaluated on the NWPU VHR-10 dataset [40,41], consisting of a total of 650 images. There are ten categories of targets in the public dataset: airplane, ship, storage tank, baseball diamond, tennis court, basketball court, ground track field, harbor, bridge and vehicle. For all model training experiments, the ratio of training dataset to test dataset is 1:1.
To evaluate the capability of the proposed method, the precision and recall rate are employed as performance indicators [42]. The calculation formulae of recall and precision are as shown in Equations (8) and (9), respectively.
where , and are true positives, false negatives, and false positives, respectively.
3.2. Implementation
In the proposed optical imaging system, the two sub-optical systems capture images simultaneously. The images obtained from the wide FOV and narrow FOV are not subjected to additional processing, such as image combination. The images from the two sub-optical systems are fed into the same target recognition algorithm to extract targets. The system performs image capture and target recognition simultaneously.
Taking Faster R-CNN and Dynamic R-CNN algorithms as the baseline, the proposed AOCNet is trained to evaluate its performance. During training of the proposed method, the learning rate is set to 0.02, the momentum is 0.9, the weight decay is 0.0003, and the maximum epoch is 30. In the contrast experiment, five different models were used to train, respectively. The learning rate (lr) of SSD and yolov3 is 0.0002 and 0.003 according to the need of the algorithms. Additionally, to verify the effectiveness of the proposed system, the ablation experiments in terms of equipment and algorithm are designed, respectively.
All the experiments are implemented on a PC with an Intel single Core i7 CPU and NVIDIA GTX-1060 GPU. The RAM is 8 GB and the operating system is Ubuntu 18.04. The environment of the software is pytorch 1.10. and cuda 10.2.
3.3. Optical Imaging System
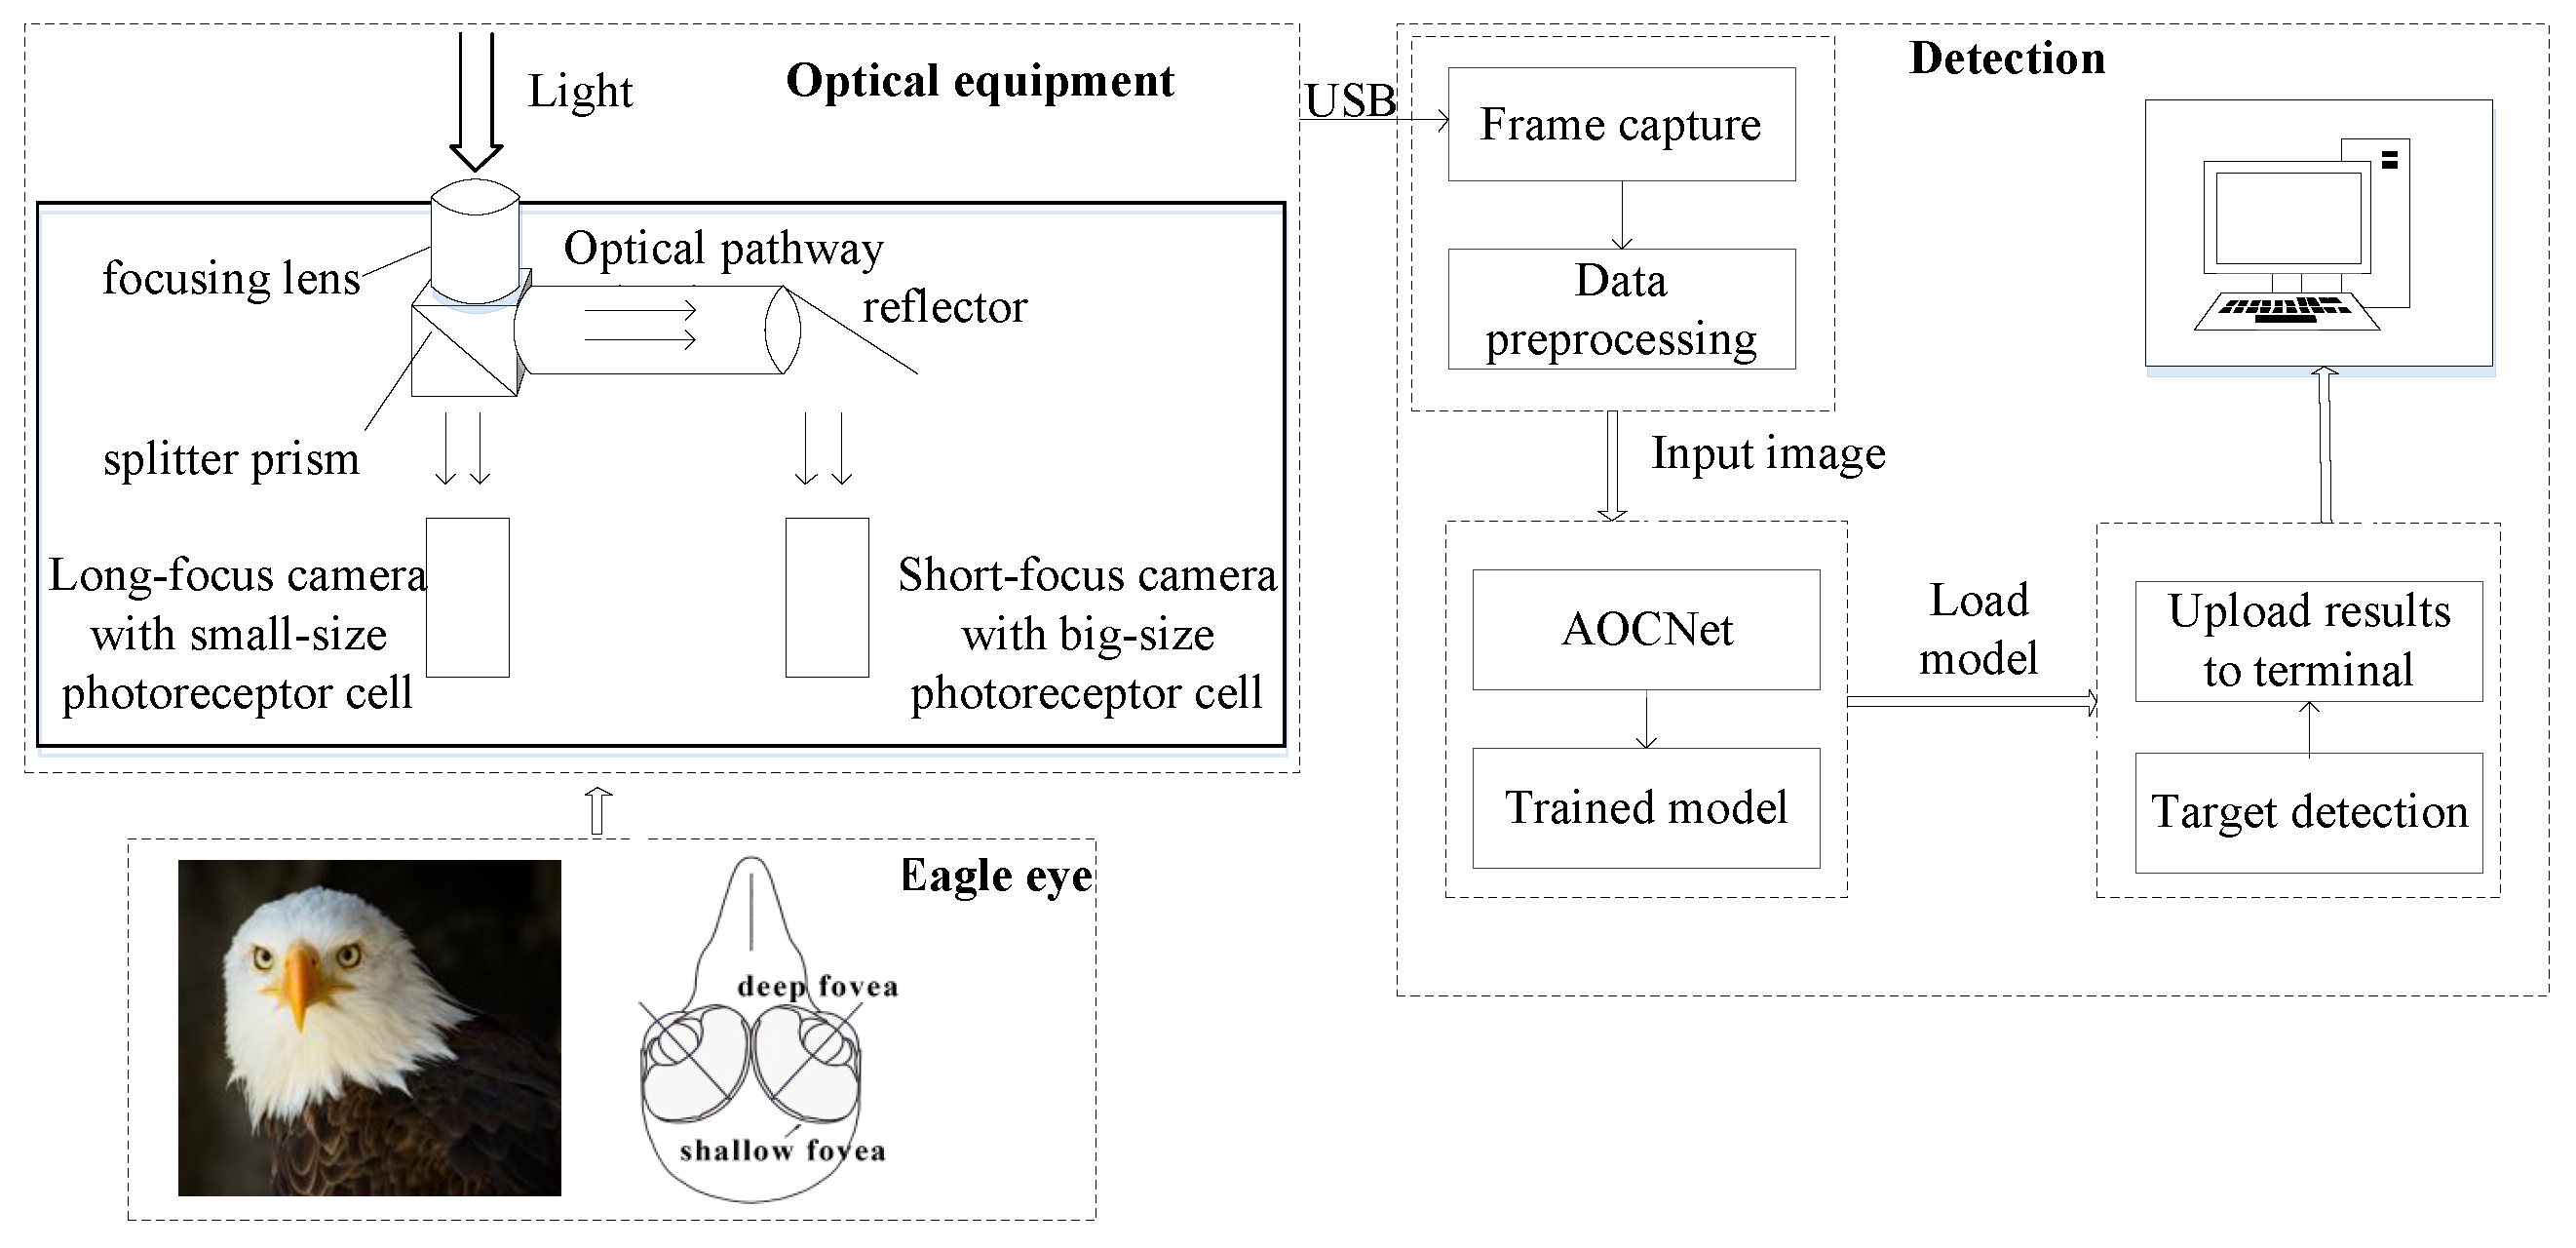
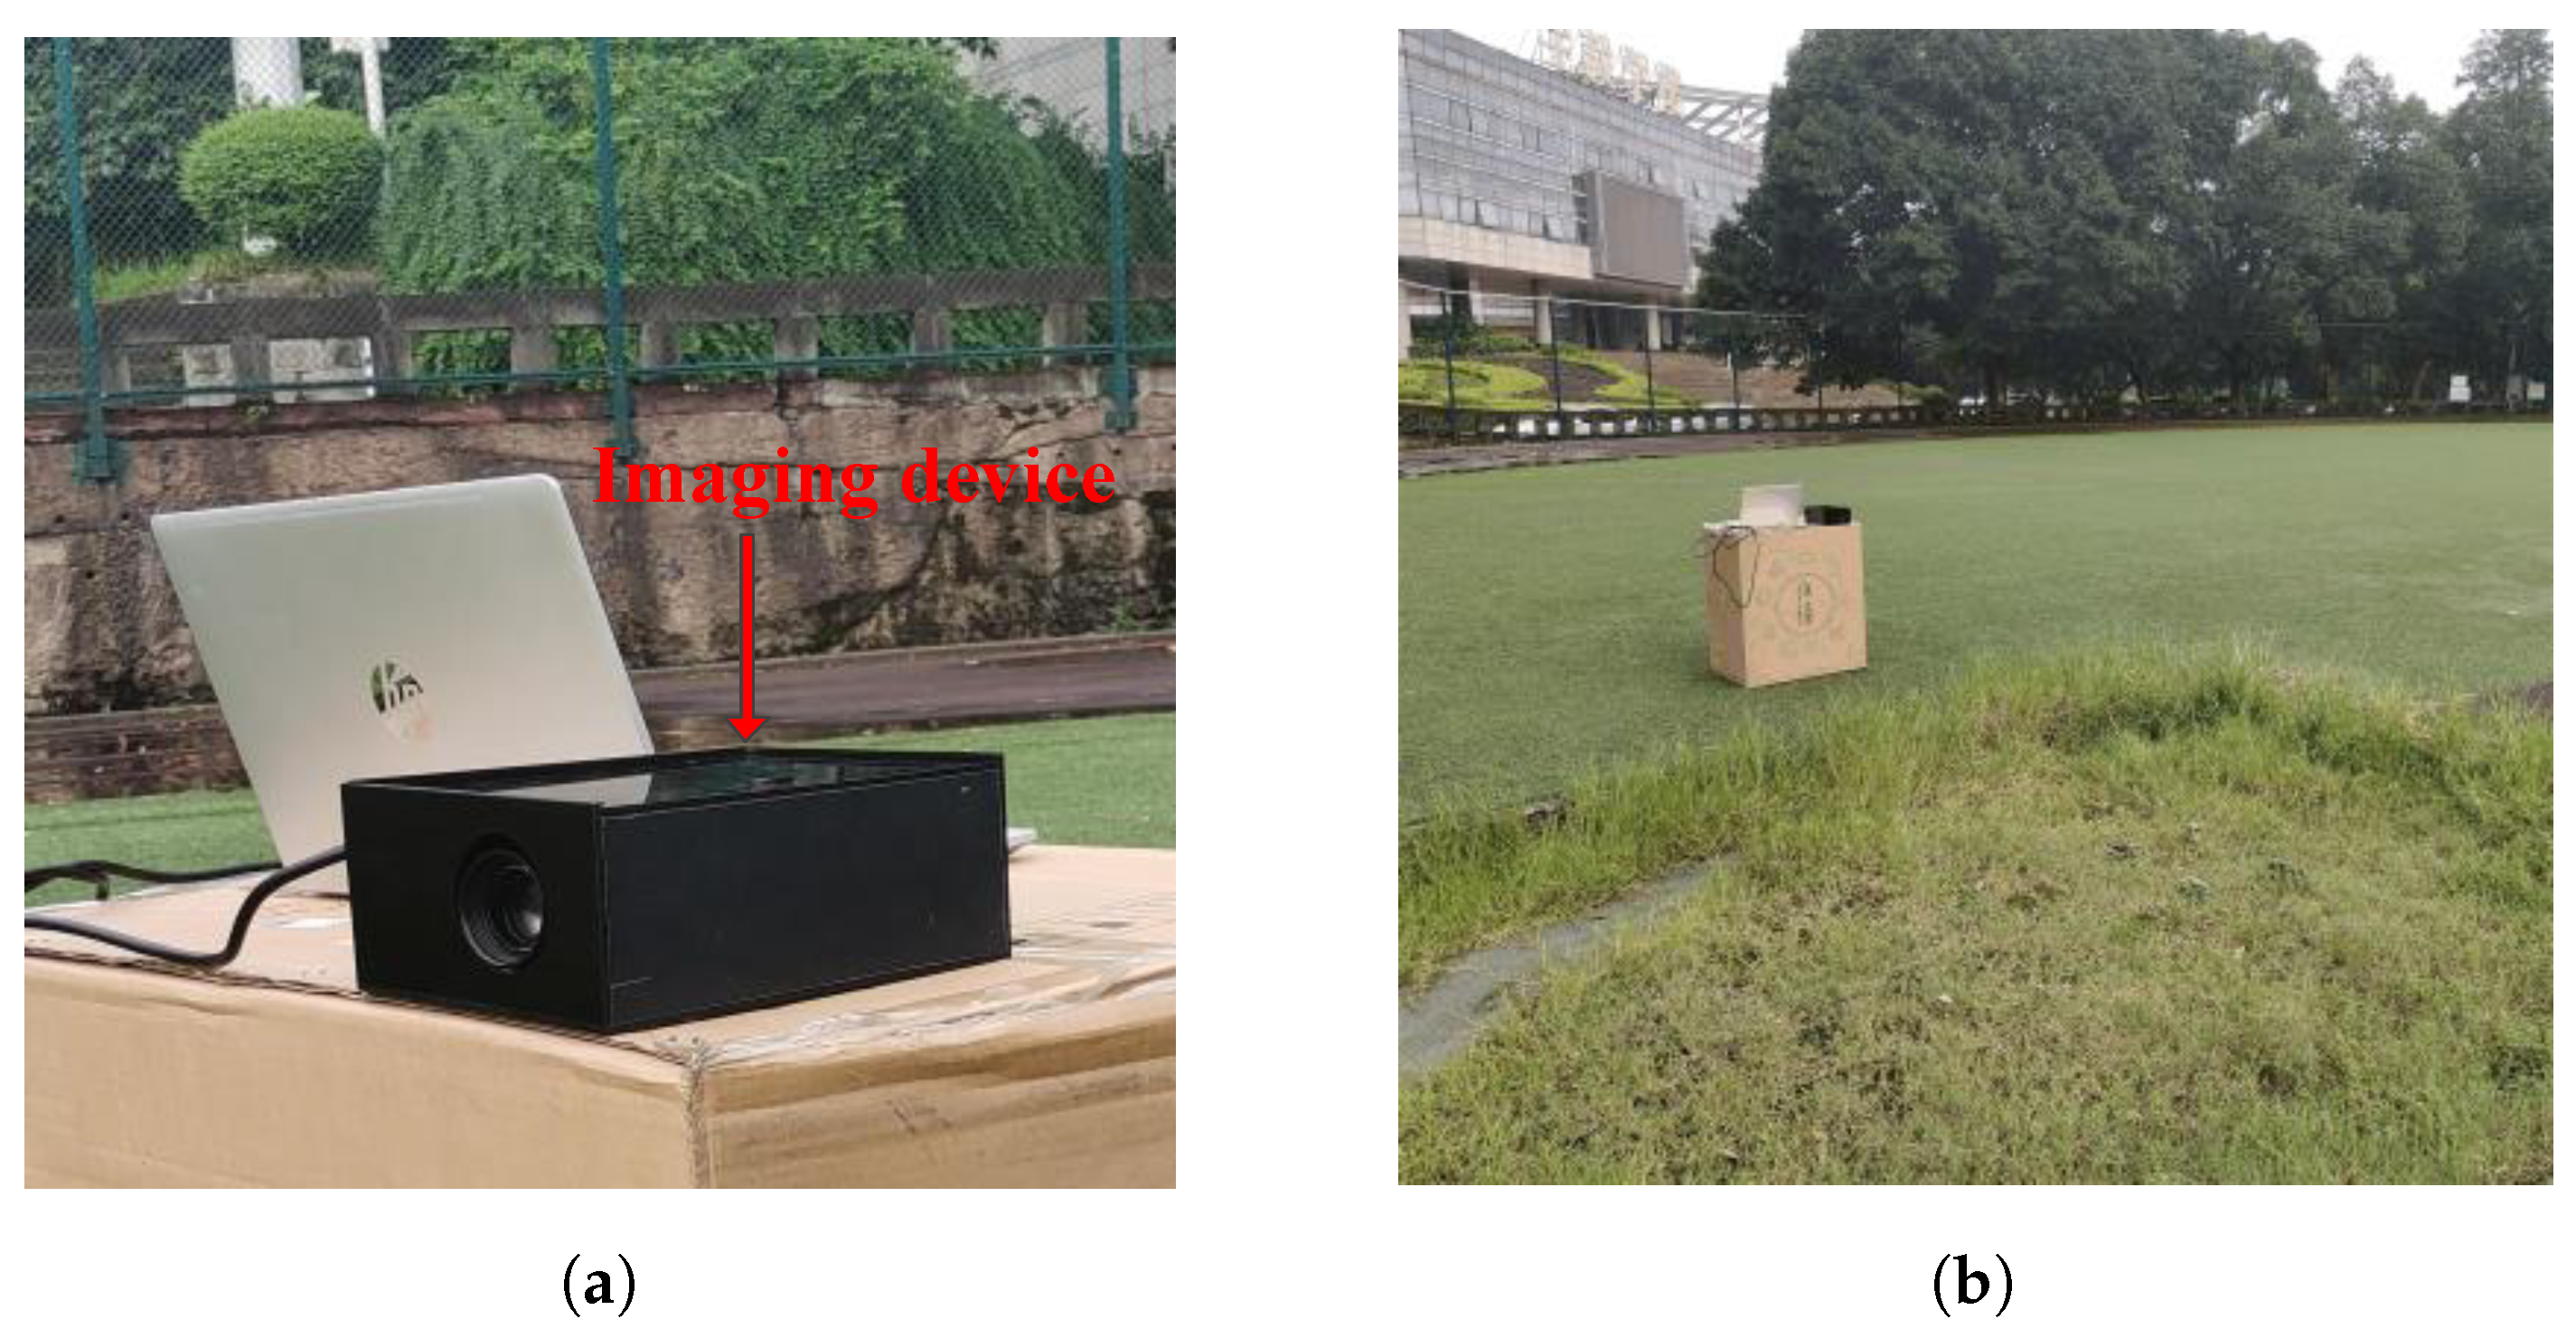
This optical imaging system and its target recognition performance are tested in a simulation environment. The imaging device based on the biological raptor’s eye is shown in Figure 11. The images captured by the imaging equipment are transferred to the computer via a USB interface. The novel optical imaging device could obtain a wide FOV and high resolution simultaneously.
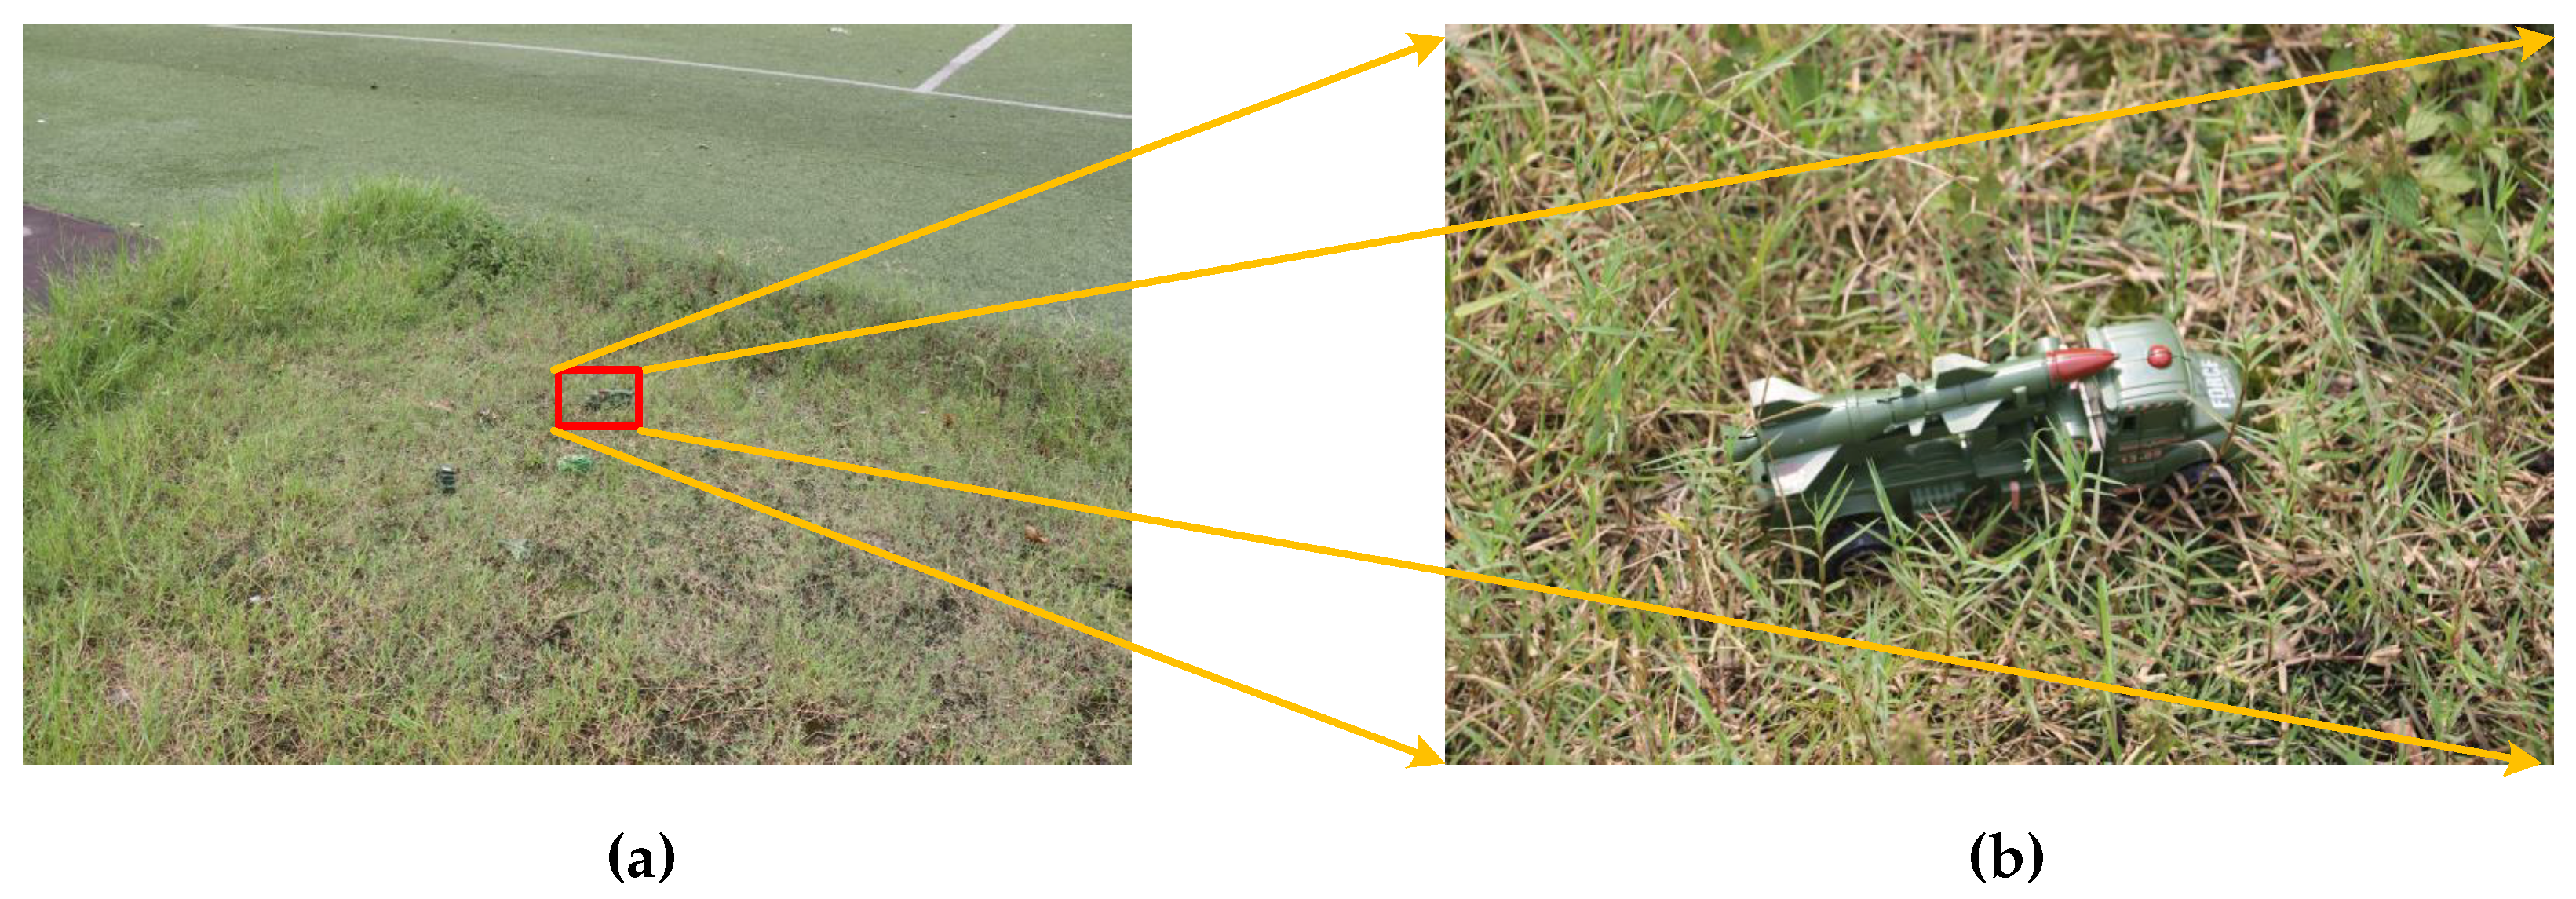
Through testing and calibrating of the optical imaging system, the FOV and angular resolution of the sub-optical system simulating the peripheral region of the deep fovea are degrees and 145.45 rad, respectively. The FOV and angular resolution of the imaging system imitating the central region of the deep fovea are degrees and 18.25 rad, respectively. Figure 12a,b are the images obtained from the two sub-optical systems, respectively. The small truck located at the center of Figure 12a is optically magnified in Figure 12b, where its details can be seen more clearly for feature extraction and target recognition.
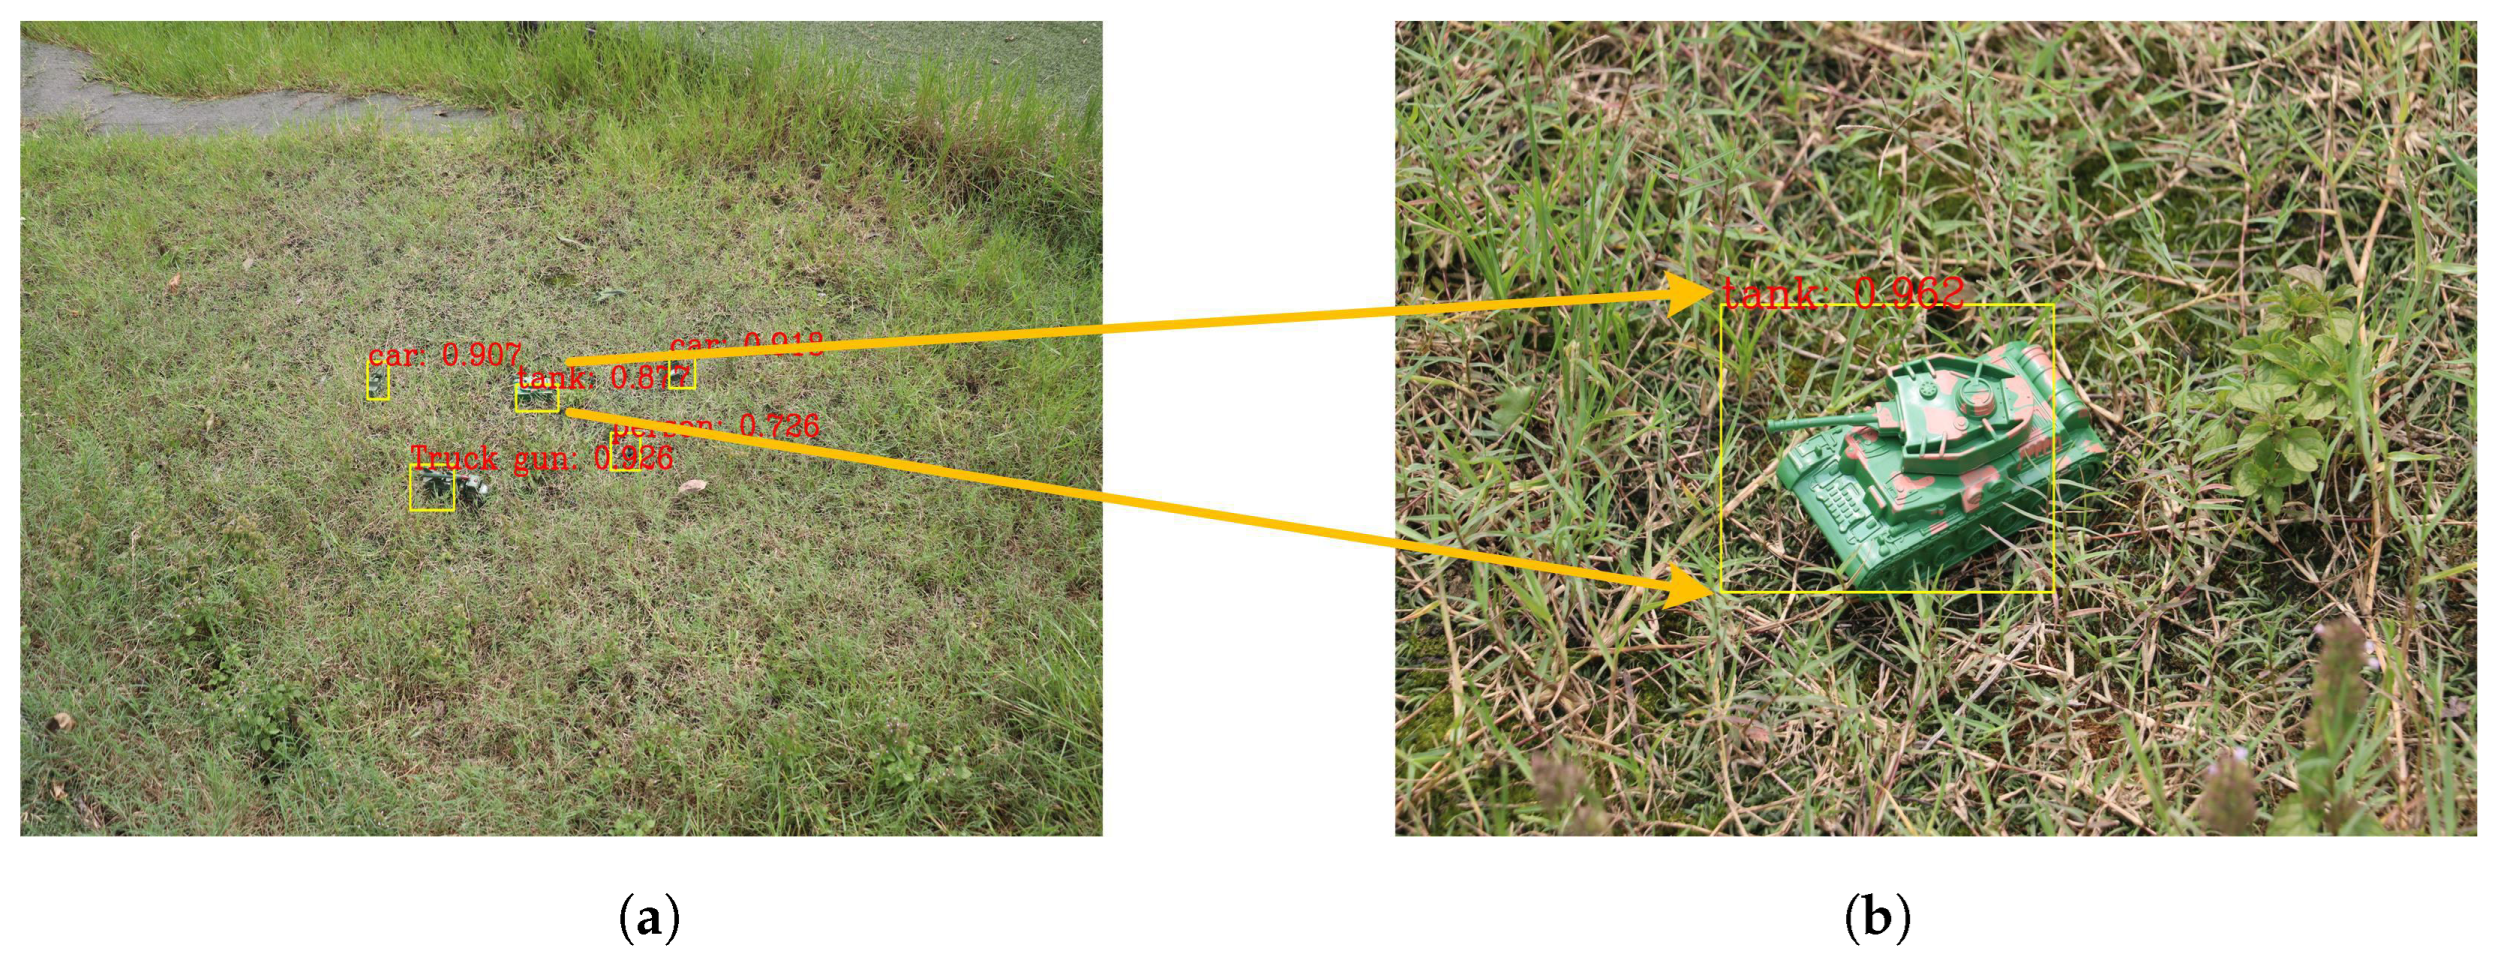
In the simulation environment, the targets’ color and texture resemble that of the background, making them difficult to distinguish. The partial masking of the background interferes with the target recognition process in the scene. It is commonly known that the target recognition rate will decline when the target is hidden. However, in this equipment, if the target is in the center of the FOV, the long-focus subsystem could recognize it synchronously, improving the recognition ability of the system under background interference. The image of the sub-optical system simulating the peripheral region of deep fovea is shown in Figure 13a, and the recognition probability of the tank (marked with yellow lines) is 0.877. Additionally, the bounding box deviates from the real location due to the strong nearby background interference. At the same time, the target recognition results of the sub-optics simulating the deep foveal central region is shown in Figure 13b. The recognition probability of the tank is 0.962 and the location of the bounding box is also more accurate. This situation benefits from the wide FOV and high resolution of the proposed imaging system.
3.4. Target Recognition Results
The effectiveness of the proposed algorithm is verified on the NWPU VHR-10 dataset and our dataset captured in the simulation environment mentioned above. The proposed network is applied to Faster R-CNN and Dynamic R-CNN [43], respectively. The performance of the CNN model both with and without AOCNet is shown in Table 3. By means of the proposed AOCNet with a feedback mechanism, the mean average precisions (mAP) of Faster R-CNN algorithm and Dynamic R-CNN algorithm rise from 0.809 to 0.855, and from 0.804 to 0.833, respectively. Meanwhile, the AP values of some targets, such as storage tank, tennis court, bridges and vehicles have been significantly improved.
Moreover, five algorithms are introduced to verify the performance of the proposed algorithm on the NWPU VHR-10 dataset, and they are SSD300 [44], YOLOV3 [45], Dynamic R-CNN, Faster R-CNN with FPN [46] and Faster R-CNN. The results of these algorithms and the proposed methods are shown in Table 4. The mAP of the proposed method is significantly higher than that of other algorithms, as evidenced by the results. In fact, the AOCNet requires more time than the baseline algorithm. Nevertheless, the inference speed of AOCNet is only two images per second slower than that of the baseline algorithm.
In addition, the comparison experiment with baseline on our dataset is shown in Table 5. Compared to the baseline, the mAP of Faster R-CNN with AOCNet is promoted from 0.935 to 0.952, the mAP of Dynamic R-CNN with AOCNet is increased from 0.931 to 0.950. The comparison experiment with different algorithms on our dataset is shown in Table 6, and the performance of the proposed algorithm is better.
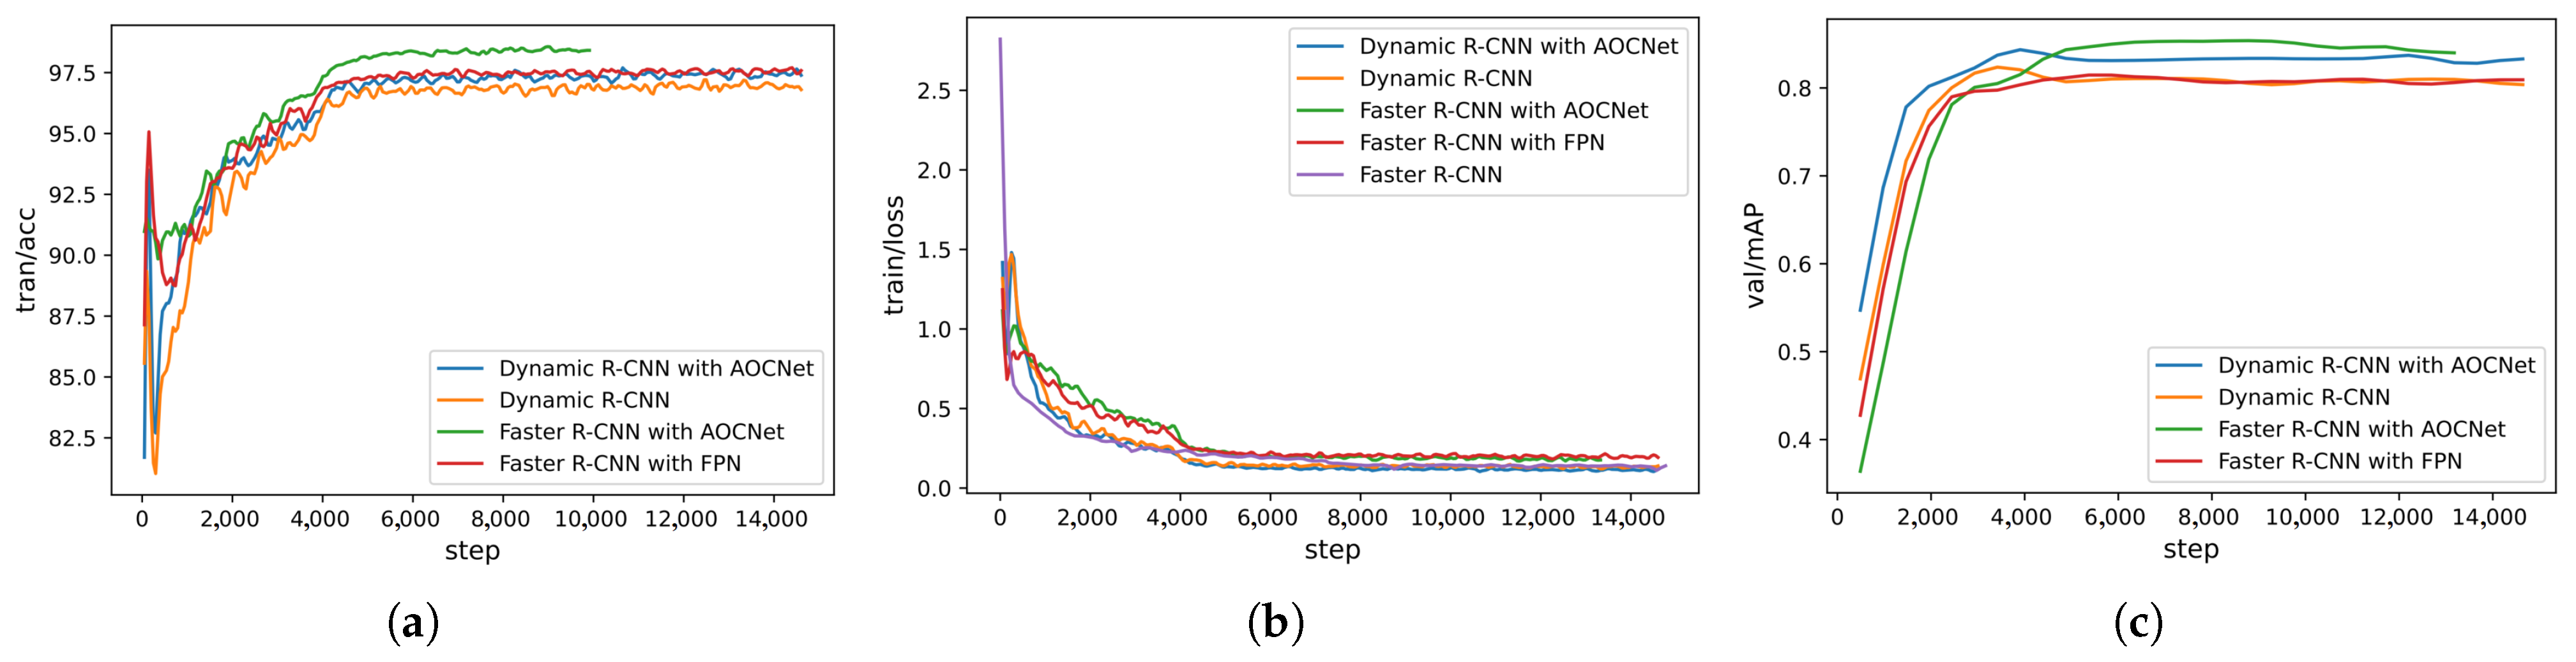
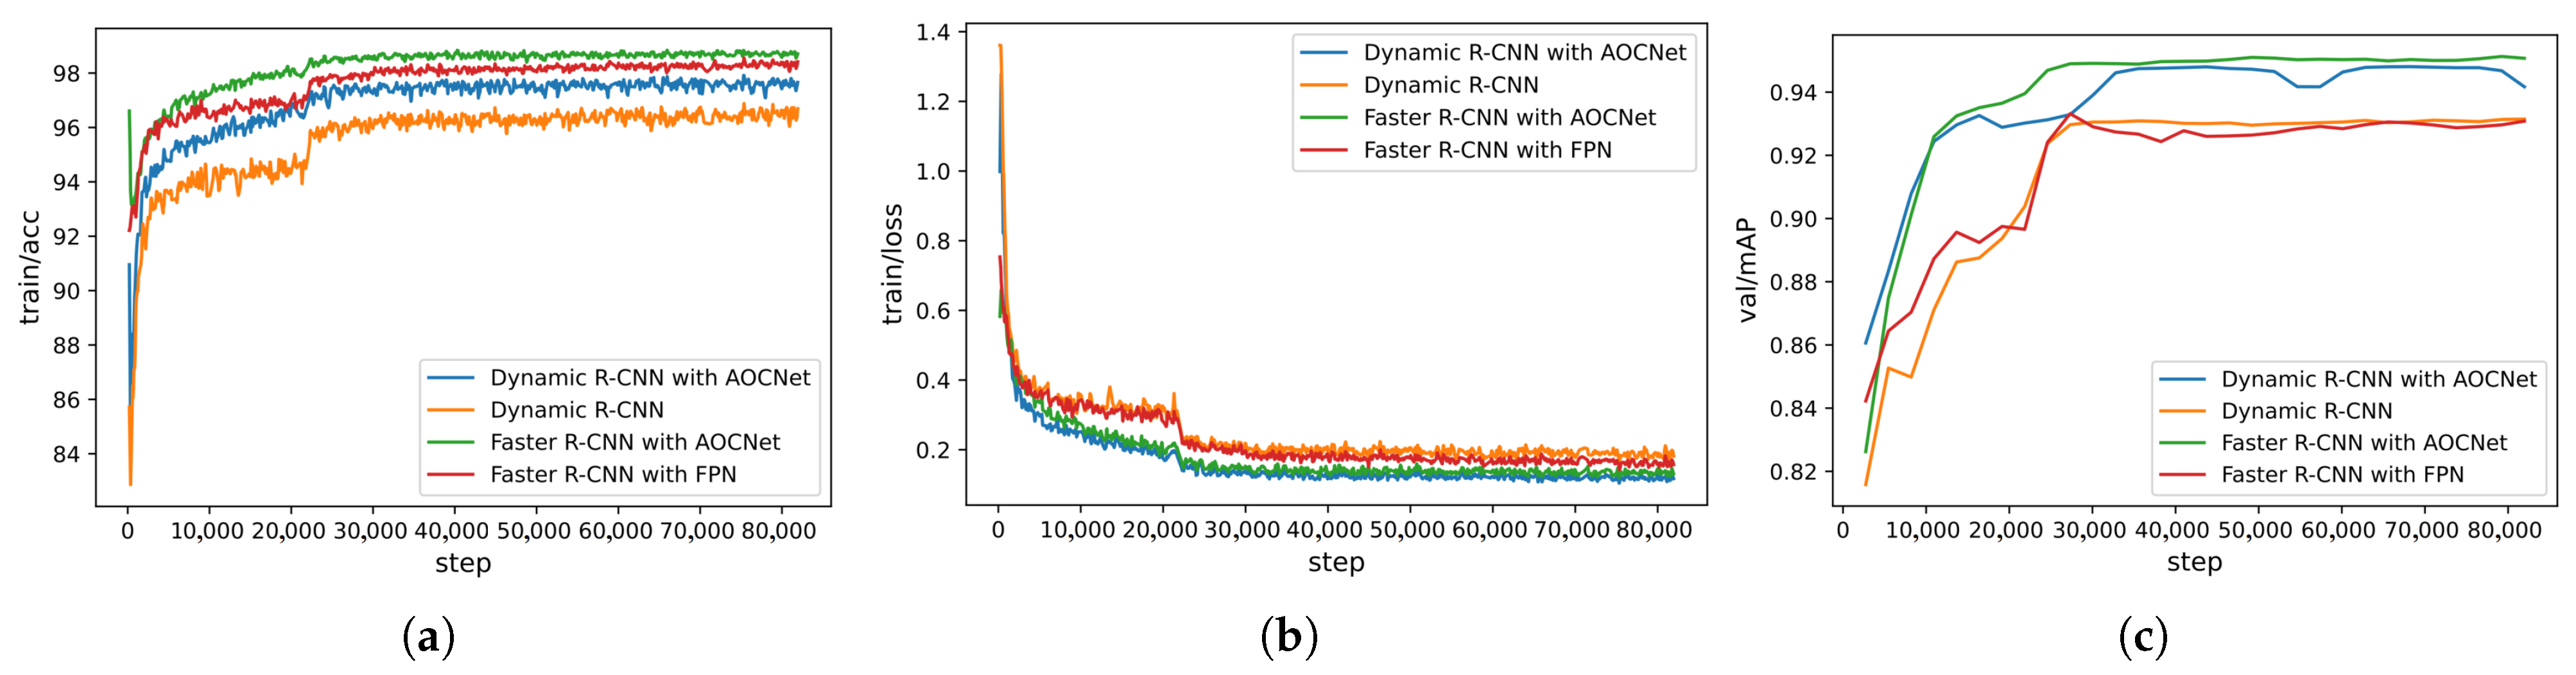
During the training period, the accuracy and loss curve of different algorithms on the NWPU VHR-10 dataset and our dataset are shown in Figure 14 and Figure 15, respectively. As can be seen from the figures, the loss value of the proposed method is reduced better than the baselines, and the accuracy and mAP are significantly improved. This indicates that the proposed network enhances the ability of feature extraction.
3.5. Ablation Experiments
Several ablation studies of the proposed method have been conducted on the NWPU VHR-10 data set. The performance of Faster R-CNN without any additional network is figured out at first. The output of Resnet50 passed directly to the RPN and subsequent operations. The mAP of Faster R-CNN is 78.8% (Faster R-CNN, Table 7). Afterwards, the experiments on Faster R-CNN with AT, Faster R-CNN with OC and Faster R-CNN with AOCNet are performed in order to explore the influence of each part of the network on target recognition, respectively. The mAP of Faster R-CNN with AT is 82.5%, while the mAP of Faster R-CNN with OC is 84.9%. The mAP of Faster R-CNN with AOCNet is 85.6%. In the experiment, other factors are consistent: the epoch is 30, the lr is 0.02, and the optimizer is SGD. The results are shown in Table 7.
Furthermore, Faster R-CNN with AOCNet is investigated on our dataset, which is captured by the optical imaging system in the simulation scene. Table 8 shows the average precision and recall results of the algorithm that has been embedded with the designed device. The narrow FOV effectively improves the recognition probability of some targets. The results confirm that the optical imaging and target recognition system, which imitates the unique imaging structure and optic nerve system of the raptor’s deep fovea, could effectively search for targets in a wide FOV and achieve high target recognition performance. Therefore, this method has the ability to track and recognize the target with high accuracy in a wide FOV.
4. Conclusions
The imaging structure and optic nerve pathway of the raptor’s deep fovea provide advantages for rapid target detection and precise recognition in a wide FOV. A target imaging and recognition system based on the deep fovea of raptor’s eye has been proposed and implemented in this paper. The incident light beam from a co-aperture is divided and focused on two sub-optical imaging systems, which has different focal lengths and various-size photoreceptor cells. The sub-optical system that imitates the peripheral region of the deep fovea by means of short focal length and large-size photoreceptors has wide FOV and high sensitivity, while the other one that simulates the central area has high resolution. Inspired by the feedback mechanism of optic nerve pathway, the AT and feedback module based on octave convolution is designed to improve the ability of feature extraction. The AT module could extract information from both the spatial and channel dimensions of the input data. The OC module and LFL layer extract the high-frequency components in the top feature map to expand the receptive field of the original pixel space. The feedback layers in AOCNet transmit the top feature map back to the bottom layer, and they further improve the feature extraction ability of the high-frequency feature map. The target imaging and recognition system based on a biological raptor’s eye cannot only achieve wide FOV and high spatial resolution imaging, but also effectively improve the accuracy of target recognition under complex background interference.
Author Contributions
Conceptualization, Z.L.; data curation, B.X.; formal analysis, B.X. and Y.Y.; funding acquisition, Z.L.; investigation, A.S.; methodology, B.X. and Z.L.; project administration, Z.L.; resources, Y.Y.; software, B.X. and B.C.; supervision, Z.L.; validation, B.X. and B.C.; visualization, B.X.; writing—original draft, B.X.; writing—review and editing, Z.L. and A.S. All authors have read and agreed to the published version of the manuscript.
Funding
This work is partially supported by the National Natural Science Foundation of China under Grant No. 61675036.
Data Availability Statement
Not applicable.
Conflicts of Interest
The authors declare no conflict of interest.
Abbreviations
The following abbreviations are used in this manuscript:
| FOV | Field of view |
| CNN | Convolutional neural network |
| AOCNet | The proposed attention and feedback module based on octave convolution network |
| AT | The attention module |
| OC | The octave convolution |
| LFL | Low-frequency layer |
References
- Hu, W.; Tan, T.; Wang, L.; Maybank, S.J. A Survey on Visual Surveillance of Object Motion and Behaviors. IEEE Trans. Syst. Man, Cybern. Part C (Appl. Rev.) 2004, 34, 334–352. [Google Scholar] [CrossRef]
- Desouza, G.N.; Kak, A.C. Vision for Mobile Robot Navigation: A Survey. IEEE Trans. Pattern Anal. Mach. Intell. 2002, 24, 237–267. [Google Scholar] [CrossRef]
- Liu, H.; Huang, Y.; Jiang, H. Artificial Eye for Scotopic Vision with Bioinspired All-Optical Photosensitivity Enhancer. Proc. Natl. Acad. Sci. USA 2016, 113, 3982–3985. [Google Scholar] [CrossRef] [PubMed]
- Duan, H.; Zhang, Q. Visual Measurement in Simulation Environment for Vision-Based UAV Autonomous Aerial Refueling. IEEE Trans. Instrum. Meas. 2015, 64, 2468–2480. [Google Scholar] [CrossRef]
- Lin, F.; Dong, X.; Chen, B.M.; Lum, K.-Y.; Lee, T. A Robust Real-Time Embedded Vision System on an Unmanned Rotorcraft for Ground Target Following. IEEE Trans. Ind. Electron. 2012, 59, 1038–1049. [Google Scholar] [CrossRef]
- Ferone, A.; Maddalena, L. Neural Background Subtraction for Pan-Tilt-Zoom Cameras. IEEE Trans. Syst. Man, Cybern. Syst. 2014, 44, 571–579. [Google Scholar] [CrossRef]
- Minaeian, S.; Liu, J.; Son, Y.-J. Vision-Based Target Detection and Localization via a Team of Cooperative UAV and UGVs. IEEE Trans. Syst. Man Cybern. Syst. 2016, 46, 1005–1016. [Google Scholar] [CrossRef]
- Ben-Aderet, Y.; Granot, E.; Sternklar, S.; Tal, T.; Kopeika, N.S. Optical Imaging of Hidden Objects behind Clothing. Appl. Opt. 2010, 49 20, 3926–3929. [Google Scholar] [CrossRef]
- Karangwa, J.; Kong, L.; Yi, D.; Zheng, J. Automatic Optical Inspection Platform for Real-Time Surface Defects Detection on Plane Optical Components Based on Semantic Segmentation. Appl. Opt. 2021, 60 Pt 19, 5496–5506. [Google Scholar] [CrossRef]
- Huang, F.; Wang, Y.; Shen, X.; Li, G.; Yan, S. Analysis of Space Target Detection Range Based on Space-Borne Fisheye Imaging System in Deep Space Background. Infrared Phys. Technol. 2012, 55, 475–480. [Google Scholar] [CrossRef]
- Floreano, D.; Pericet-Camara, R.; Viollet, S.; Ruffier, F.; Brückner, A.; Leitel, R.; Buss, W.; Menouni, M.; Expert, F.; Juston, R.; et al. Miniature Curved Artificial Compound Eyes. Proc. Natl. Acad. Sci. USA 2013, 110, 9267–9272. [Google Scholar] [CrossRef] [PubMed]
- Kerhuel, L.; Viollet, S.; Franceschini, N. Steering by Gazing: An Efficient Biomimetic Control Strategy for Visually Guided Micro Aerial Vehicles. IEEE Trans. Robot. 2010, 26, 307–319. [Google Scholar] [CrossRef]
- Lu, W.; Chen, S.; Xiong, Y.; Liu, J. A Single Ball Lens-Based Hybrid Biomimetic Fish Eye/Compound Eye Imaging System. Opt. Commun. 2021, 480, 126458. [Google Scholar] [CrossRef]
- Jones, M.P.; Pierce, K.E.; Ward, D. Avian Vision: A Review of Form and Function with Special Consideration to Birds of Prey. J. Exot. Pet Med. 2007, 16, 69–87. [Google Scholar] [CrossRef]
- Liu, K.; Huang, J.; Li, X. Eagle-Eye-Inspired Attention for Object Detection in Remote Sensing. Remote Sens. 2022, 14, 1743. [Google Scholar] [CrossRef]
- Victory, N.; Segovia, Y.; García, M. Foveal Shape, Ultrastructure and Photoreceptor Composition in Yellow-Legged Gull, Larus Michahellis (Naumann, 1840). Zoomorphology 2021, 140, 151–167. [Google Scholar] [CrossRef]
- Snyder, A.W.; Miller, W.H. Telephoto Lens System of Falconiform Eyes. Nature 1978, 275, 127–129. [Google Scholar] [CrossRef]
- Duan, H.; Deng, Y.; Wang, X.; Liu, F. Biological Eagle-Eye - Based Visual Imaging Guidance Simulation Platform for Unmanned Flying Vehicles. IEEE Aerosp. Electron. Syst. Mag. 2013, 28, 36–45. [Google Scholar] [CrossRef]
- Deng, Y.; Duan, H. Biological Eagle-Eye-Based Visual Platform for Target Detection. IEEE Trans. Aerosp. Electron. Syst. 2018, 54, 3125–3136. [Google Scholar] [CrossRef]
- Prathiba, T.; Kumari, R.S.S. Eagle Eye CBVR Based on Unique Key Frame Extraction and Deep Belief Neural Network. Wirel. Pers. Commun. 2021, 116, 411–441. [Google Scholar] [CrossRef]
- Matthews, I.; Baker, S. Active Appearance Models Revisited. Int. J. Comput. Vis. 2004, 2, 135–164. [Google Scholar] [CrossRef]
- Zhang, J.; Lin, X.; Liu, Z.; Shen, J. Semi-Automatic Road Tracking by Template Matching and Distance Transformation in Urban Areas. Remote Sens. 2011, 32, 8331–8347. [Google Scholar] [CrossRef]
- Han, J.; Zhou, P.; Zhang, D.; Cheng, G.; Guo, L.; Liu, Z.; Bu, S.; Wu, J. Efficient, Simultaneous Detection of Multi-Class Geospatial Targets Based on Visual Saliency Modeling and Discriminative Learning of Sparse Coding. ISPRS J. Photogramm. Remote Sens. 2014, 89, 37–48. [Google Scholar] [CrossRef]
- Bai, X.; Zhang, H.; Zhou, J. VHR Object Detection Based on Structural Feature Extraction and Query Expansion. IEEE Trans. Geosci. Remote Sens. 2014, 52, 6508–6520. [Google Scholar]
- Shi, Z.; Yu, X.; Jiang, Z.; Li, B. Ship Detection in High-Resolution Optical Imagery Based on Anomaly Detector and Local Shape Feature. IEEE Trans. Geosci. Remote Sens. 2014, 52, 4511–4523. [Google Scholar]
- Hu, Y.; Li, X.; Zhou, N.; Yang, L.; Peng, L.; Xiao, S. A Sample Update-Based Convolutional Neural Network Framework for Object Detection in Large-Area Remote Sensing Images. IEEE Geosci. Remote Sens. Lett. 2019, 16, 947–951. [Google Scholar] [CrossRef]
- Li, E.; Femiani, J.; Xu, S.; Zhang, X.; Wonka, P. Robust Rooftop Extraction From Visible Band Images Using Higher Order CRF. IEEE Trans. Geosci. Remote Sens. 2015, 53, 4483–4495. [Google Scholar] [CrossRef]
- Cheng, G.; Zhou, P.; Han, J. Learning Rotation-Invariant Convolutional Neural Networks for Object Detection in VHR Optical Remote Sensing Images. IEEE Trans. Geosci. Remote Sens. 2016, 54, 7405–7415. [Google Scholar] [CrossRef]
- Han, X.; Zhong, Y.; Zhang, L. An Efficient and Robust Integrated Geospatial Object Detection Framework for High Spatial Resolution Remote Sensing Imagery. Remote Sens. 2017, 9, 666. [Google Scholar] [CrossRef]
- Guzmán-Pando, A.; Chacon-Murguia, M.I. DeepFoveaNet: Deep Fovea Eagle-Eye Bioinspired Model to Detect Moving Objects. IEEE Trans. Image Process. 2021, 30, 7090–7100. [Google Scholar] [CrossRef]
- Wang, S.; Fu, Q.; Hu, Y.; Zhang, C.; He, W. A Miniature Biological Eagle-Eye Vision System for Small Target Detection. In Proceedings of the 2021 China Automation Congress (CAC), Beijing, China, 22–24 October 2021. [Google Scholar]
- Benowitz, L.I.; Karten, H.J. Organization of the Tectofugal Visual Pathway in the Pigeon: A Retrograde Transport Study. J. Comp. Neurol. 1976, 167, 503–520. [Google Scholar] [CrossRef] [PubMed]
- Duan, H.; Xu, X.; Deng, Y.; Zeng, Z. Unmanned Aerial Vehicle Recognition of Maritime Small-Target Based on Biological Eagle-Eye Vision Adaptation Mechanism. IEEE Trans. Aerosp. Electron. Syst. 2021, 57, 3368–3382. [Google Scholar] [CrossRef]
- Reymond, L. Spatial Visual Acuity of the Eagle Aquila Audax: A Behavioural, Optical and Anatomical Investigation. Vis. Res. 1985, 25, 1477–1491. [Google Scholar] [CrossRef] [PubMed]
- Gaffney, M.F.; Hodos, W. The Visual Acuity and Refractive State of the American Kestrel (Falco Sparverius). Vis. Res. 2003, 43, 2053–2059. [Google Scholar] [CrossRef]
- Deng, C. Relative Contributions of the Two Visual Pathways to Avian Behaviour. Acta Zoo. 2006, 52, 379–383. [Google Scholar]
- Chen, Y.; Fan, H.; Xu, B.; Yan, Z.; Kalantidis, Y.; Rohrbach, M.; Shuicheng, Y.; Feng, J. Drop an Octave: Reducing Spatial Redundancy in Convolutional Neural Networks With Octave Convolution. In Proceedings of the 2019 IEEE/CVF International Conference on Computer Vision (ICCV), Seoul, Republic of Korea, 27 October–2 November 2019. [Google Scholar]
- Ren, S.; He, K.; Girshick, R.; Sun, J. Faster R-CNN: Towards Real-Time Object Detection with Region Proposal Networks. IEEE Trans. Pattern Anal. Mach. Intell. 2017, 39, 1137–1149. [Google Scholar] [CrossRef]
- Woo, S.; Park, J.; Lee, J.-Y.; Kweon, I.S. CBAM: Convolutional Block Attention Module. In Proceedings of the European Conference on Computer Vision, Munich, Germany, 8–14 September 2018. [Google Scholar]
- Su, H.; Wei, S.; Yan, M.; Wang, C.; Shi, J.; Zhang, X. Object Detection and Instance Segmentation in Remote Sensing Imagery Based on Precise Mask R-CNN. In Proceedings of the IGARSS 2019—2019 IEEE International Geoscience and Remote Sensing Symposium, Yokohama, Japan, 28 July–2 August 2019; pp. 1454–1457. [Google Scholar]
- Su, H.; Wei, S.; Liu, S.; Liang, J.; Wang, C.; Shi, J.; Zhang, X. HQ-ISNet: High-Quality Instance Segmentation for Remote Sensing Imagery. Remote Sens. 2020, 12, 989. [Google Scholar] [CrossRef]
- Xiao, Y.; Tian, Z.; Yu, J.; Zhang, Y.; Liu, S.; Du, S.; Lan, X. A Review of Object Detection Based on Deep Learning. Multimed. Tools Appl. 2020, 79, 23729–23791. [Google Scholar] [CrossRef]
- Zhang, H.; Chang, H.; Ma, B.; Wang, N.; Chen, X. Dynamic R-CNN: Towards High Quality Object Detection via Dynamic Training. In Proceedings of the ECCV, Glasgow, UK, 23–28 August 2020; pp. 260–275. [Google Scholar]
- Liu, W.; Anguelov, D.; Erhan, D.; Szegedy, C.; Reed, S.; Fu, C.Y.; Berg, A.C. SSD: Single shot multibox detector. In Proceedings of the 14th ECCV, Amsterdam, The Netherlands, 11–14 October 2016; pp. 21–37. [Google Scholar]
- Redmon, J.; Farhadi, A. YOLOv3: An Incremental Improvement. In Proceedings of the IEEE Conference on Computer Vision and Pattern Recognition, Salt Lake City, UT, USA, 18–22 June 2018; pp. 1–6. [Google Scholar]
- Lin, T.-Y.; Dollár, P.; Girshick, R.; He, K.; Hariharan, B.; Belongie, S. Feature Pyramid Networks for Object Detection. In Proceedings of the 2017 IEEE Conference on Computer Vision and Pattern Recognition (CVPR), Honolulu, HI, USA, 21–26 July 2017; pp. 936–944. [Google Scholar]
Figure 1.
The structure of raptor’s eye. (a) Deep fovea and shallow fovea. (b) Horizontally-orientated visual area.
Figure 1.
The structure of raptor’s eye. (a) Deep fovea and shallow fovea. (b) Horizontally-orientated visual area.

Figure 2.
Distribution of cone cells in the deep fovea. (a) The distribution of foveal cone cells. (b) The relative receptor density.
Figure 2.
Distribution of cone cells in the deep fovea. (a) The distribution of foveal cone cells. (b) The relative receptor density.

Figure 3.
Anatomy of the deep fovea.

Figure 4.
The designed two sub-optical systems.

Figure 5.
The schematic diagram of optical imaging.

Figure 6.
The designed optical imaging device.

Figure 7.
The sketch of the optic tectum pathway (dotted line) and thalamic pathway (solid line) in a raptor’s brain [36].
Figure 7.
The sketch of the optic tectum pathway (dotted line) and thalamic pathway (solid line) in a raptor’s brain [36].

Figure 8.
The schematic diagram of the optic tectum pathway.

Figure 9.
The designed AOCNet.

Figure 10.
The designed feedback layers.

Figure 11.
The imaging device based on raptor vision. (a) Optical imaging equipment. (b) Experimental environment.
Figure 11.
The imaging device based on raptor vision. (a) Optical imaging equipment. (b) Experimental environment.

Figure 12.
Images captured by the optical imaging system. (a) Imaging from the peripheral region. (b) Imaging from the central region.
Figure 12.
Images captured by the optical imaging system. (a) Imaging from the peripheral region. (b) Imaging from the central region.

Figure 13.
Target recognition in the imaging system. (a) Target recognition results of wide FOV. (b) Target recognition results of narrow FOV.
Figure 13.
Target recognition in the imaging system. (a) Target recognition results of wide FOV. (b) Target recognition results of narrow FOV.

Figure 14.
The results on the NWPU VHR-10 dataset. (a) Accuracy. (b) Loss. (c) mAP.

Figure 15.
The results on our dataset. (a) Accuracy. (b) Loss. (c) mAP.


Table 1.
The structure and output sizes of ResNet50 layers.
| Layer I | Convolution Operation | Output Size | Strides |
|---|---|---|---|
| layer 0 | 4 | ||
| layer 1 | 8 | ||
| layer 2 | 16 | ||
| layer 3 | 32 | ||
| layer 4 | 64 |
Table 2.
The details of different .
| Convolution | Channel | Kernel | Stride | Padding |
|---|---|---|---|---|
| 3 | 1 | 1 | ||
| 3 | 1 | 1 | ||
| 3 | 1 | 1 | ||
| 3 | 1 | 1 |
Table 3.
The comparative experiments of different methods on the NWPU VHR-10 dataset.
| Method | Faster R-CNN | Faster R-CNN with FPN | Faster R-CNN with AOCNet | Dynamic R-CNN | Dynamic R-CNN with AOCNet |
|---|---|---|---|---|---|
| Airplane | 0.909 | 0.909 | 0.909 | 0.909 | 0.909 |
| Ship | 0.813 | 0.814 | 0.877 | 0.816 | 0.816 |
| Storage tank | 0.762 | 0.843 | 0.902 | 0.861 | 0.884 |
| Baseball diamond | 0.900 | 0.903 | 0.970 | 0.908 | 0.909 |
| Tennis court | 0.697 | 0.789 | 0.817 | 0.724 | 0.727 |
| Basketball court | 0.810 | 0.814 | 0.896 | 0.810 | 0.883 |
| Ground track field | 0.996 | 0.907 | 0.993 | 0.907 | 0.908 |
| Harbor | 0.673 | 0.751 | 0.737 | 0.773 | 0.788 |
| Bridge | 0.535 | 0.556 | 0.644 | 0.527 | 0.626 |
| Vehicle | 0.782 | 0.806 | 0.801 | 0.803 | 0.884 |
| mAP | 0.788 | 0.809 | 0.855 | 0.804 | 0.833 |
Table 4.
The performance of various methods on the NWPU VHR-10 dataset.
| Method | Backbone | mAP | FPS |
|---|---|---|---|
| SSD300 | VGG16 | 0.786 | 33.4 |
| YOLOV3 | MobileNetV2 | 0.832 | 68.4 |
| Dynamic R-CNN | Resnet50 | 0.804 | 9.6 |
| Faster R-CNN | Resnet50 | 0.788 | 9.6 |
| Faster R-CNN with FPN | Resnet50 | 0.809 | 9.5 |
| Faster R-CNN with AOCNet | Resnet50 | 0.855 | 7.4 |
Table 5.
The comparative experiments of different methods on our dataset.
| Method | Dynamic R-CNN | Dynamic R-CNN with AOCNet | Faster R-CNN with FPN | Faster R-CNN with AOCNet |
|---|---|---|---|---|
| Truck gun | 0.909 | 0.995 | 0.909 | 0.997 |
| UAV | 0.999 | 1.000 | 1.000 | 1.000 |
| Ball | 0.906 | 0.907 | 0.904 | 0.907 |
| Plane | 0.908 | 0.991 | 0.909 | 0.993 |
| Person | 0.999 | 1.000 | 1.000 | 1.000 |
| Tank | 0.909 | 0.909 | 0.909 | 0.909 |
| Carrier | 0.962 | 0.971 | 1.000 | 0.987 |
| Car | 0.909 | 0.909 | 0.909 | 0.909 |
| Airplane | 0.908 | 0.909 | 0.909 | 0.908 |
| Ship | 0.906 | 0.907 | 0.904 | 0.906 |
| mAP | 0.931 | 0.950 | 0.935 | 0.952 |
Table 6.
The performance of various methods on our dataset.
| Method | Backbone | mAP | FPS |
|---|---|---|---|
| SSD300 | VGG16 | 0.930 | 31.8 |
| YOLOV3 | MobileNetV2 | 0.921 | 67.5 |
| Dynamic R-CNN | Resnet50 | 0.931 | 9.5 |
| Faster R-CNN | Resnet50 | 0.932 | 9.5 |
| Faster R-CNN with FPN | Resnet50 | 0.935 | 9.4 |
| Faster R-CNN with AOCNet | Resnet50 | 0.953 | 7.3 |
Table 7.
The ablation experiment of the designed network.
| Method | Faster R-CNN | Faster R-CNN with AT (Ours) | Faster R-CNN with OC (Ours) | Faster R-CNN with AOCNet (Ours) |
|---|---|---|---|---|
| Airplane | 0.909 | 0.906 | 0.996 | 0.996 |
| Ship | 0.813 | 0.803 | 0.810 | 0.808 |
| Storage tank | 0.762 | 0.885 | 0.895 | 0.888 |
| Baseball diamond | 0.900 | 0.957 | 0.909 | 0.975 |
| Tennis court | 0.697 | 0.798 | 0.815 | 0.814 |
| Basketball court | 0.810 | 0.869 | 0.893 | 0.882 |
| Ground track field | 0.996 | 0.970 | 0.992 | 0.984 |
| Harbor | 0.673 | 0.612 | 0.730 | 0.740 |
| Bridge | 0.535 | 0.613 | 0.653 | 0.673 |
| Vehicle | 0.782 | 0.836 | 0.793 | 0.797 |
| mAP | 0.788 | 0.825 | 0.849 | 0.856 |
Table 8.
Target recognition results of AOCNet in different FOVs.
| Targets | Precision | Recall | ||
|---|---|---|---|---|
| Wide FOV | Narrow FOV | Wide FOV | Narrow FOV | |
| Car | 0.908 | 1.000 | 0.974 | 1.000 |
| Carrier | 0.963 | 1.000 | 0.976 | 1.000 |
| Truck gun | 0.802 | 0.839 | 0.604 | 0.867 |
| UAV | 0.939 | 1.000 | 0.969 | 1.000 |
| Ball | 0.932 | 0.904 | 0.976 | 0.977 |
| Plane | 0.934 | 1.000 | 0.843 | 1.000 |
| Person | 0.922 | 0.944 | 0.913 | 0.895 |
| Tank | 0.911 | 1.000 | 0.952 | 1.000 |
| mean | 0.913 | 0.961 | 0.901 | 0.967 |
Disclaimer/Publisher’s Note: The statements, opinions and data contained in all publications are solely those of the individual author(s) and contributor(s) and not of MDPI and/or the editor(s). MDPI and/or the editor(s) disclaim responsibility for any injury to people or property resulting from any ideas, methods, instructions or products referred to in the content. |
© 2023 by the authors. Licensee MDPI, Basel, Switzerland. This article is an open access article distributed under the terms and conditions of the Creative Commons Attribution (CC BY) license (https://creativecommons.org/licenses/by/4.0/).
Share and Cite
MDPI and ACS Style
Xu, B.; Li, Z.; Cheng, B.; Yang, Y.; Siddique, A. A Target Imaging and Recognition Method Based on Raptor Vision. Remote Sens. 2023, 15, 2106. https://doi.org/10.3390/rs15082106
AMA Style
Xu B, Li Z, Cheng B, Yang Y, Siddique A. A Target Imaging and Recognition Method Based on Raptor Vision. Remote Sensing. 2023; 15(8):2106. https://doi.org/10.3390/rs15082106
Chicago/Turabian StyleXu, Bitong, Zhengzhou Li, Bei Cheng, Yuxin Yang, and Abubakar Siddique. 2023. "A Target Imaging and Recognition Method Based on Raptor Vision" Remote Sensing 15, no. 8: 2106. https://doi.org/10.3390/rs15082106
Note that from the first issue of 2016, this journal uses article numbers instead of page numbers. See further details here.