Article

A Preliminary Assessment of the GSMaP Version 08 Products over Indonesian Maritime Continent against Gauge Data

1
Department of Physics, Universitas Andalas, Padang 25163, Indonesia
2
Agency for Meteorology, Climatology and Geophysics of Republic Indonesia, Jakarta 10610, Indonesia
3
Department of Earth Sciences and Environment, Faculty of Science and Technology, Universiti Kebangsaan Malaysia, Bangi 43600, Malaysia
*
Author to whom correspondence should be addressed.
Remote Sens. 2023, 15(4), 1115; https://doi.org/10.3390/rs15041115
Submission received: 1 January 2023 / Revised: 7 February 2023 / Accepted: 14 February 2023 / Published: 18 February 2023
(This article belongs to the Special Issue Remote Sensing of Precipitation: Part III)

Abstract

:
This study is a preliminary assessment of the latest version of the Global Satellite Measurement of Precipitation (GSMaP version 08) data, which were released in December 2021, for the Indonesian Maritime Continent (IMC), using rain gauge (RG) observations from December 2021 to June 2022. Assessments were carried out with 586 rain gauge (RG) stations using a point-to-pixel approach through continuous statistical and contingency table metrics. It was found that the coefficient correlation (CC) of GSMaP version 08 products against RG observations varied between low (CC = 0.14–0.29), moderate (CC = 0.33–0.45), and good correlation (CC = 0.72–0.75), for the hourly, daily, and monthly scales with a tendency to overestimate, indicated by a positive relative bias (RB). Even though the correlation of hourly data is still low, GSMaP can still capture diurnal patterns in the IMC, as indicated by the compatibility of the estimated peak times for the precipitation amount and frequency. GSMaP data also manage to observe heavy rainfall, as indicated by the good of detection (POD) values for daily data ranging from probability 0.71 to 0.81. Such a good POD value of daily data is followed by a relatively low false alarm ratio (FAR) (FAR < 0.5). However, the GSMaP overestimates light rainfall (R < 1 mm/day); as a consequence, it overestimates the consecutive wet days (CWD) and number of days with rainfall ≥ 1 mm (R1mm) indices, and underestimates the consecutive dry days (CDD) extreme rain index. GSMaP daily data accuracy depends on IMC’s topographic conditions, especially for GSMaP real-time data. Of all GSMaP version 08 products evaluated, outperformed post-real-time non-gauge-calibrated (GSMaP_MVK), and followed by post-real-time gauge-calibrated (GSMaP_Gauge), near-real-time gauge-calibrated (GSMaP_NRT_G), near-real-time non-gauge-calibrated (GSMaP_NRT), real-time gauge-calibrated (GSMaP_Now_G), and real-time non-gauge-calibrated (GSMaP_Now). Thus, GSMaP near-real-time data have the potential for observing rainfall in IMC with faster latency.

1. Introduction

For the last two decades, satellite precipitation products (SPPs) have played a significant role in meteorology, climatology, and hydrology analysis [1]. The development of remote sensing techniques on satellites, the accuracy of SPPs is increasingly reliable [2,3]. In addition to their improved accuracy, currently, SPPs data are available in high spatial and temporal resolution and cover almost the entire world (quasi-global) [4]. This condition allows SPPs to be complementary to the lack of surface rainfall data from rain gauges and weather radar on a regional and global scales.
Various SPPs data are available with different resolutions and coverage areas depending on the data sources and techniques used. For example, Precipitation Estimation from Remotely Sensed Information Using Artificial Neural Networks (PERSIANN) data using artificial intelligence techniques produces precipitation data with a resolution of 0.25°-hourly and covers 60°S–60°N [5]. With the same coverage area, the Data Climate Prediction Center Morphing Algorithm (CMORPH) produces precipitation data with a 0.25°-daily resolution based on morphing techniques [6]. Furthermore, there are data with a resolution of 0.05°-daily with a smart interpolation technique known as Climate Hazards Group Infrared Precipitation with Stations (CHIRPS) [7]. In addition to the SPPs data already mentioned, there are also various other SPPs data with different resolutions and techniques. Although the technique used from SPPs has advanced, the rainfall value obtained is still an estimate with errors and uncertainties [8,9,10]. Thus, SPPs data must be calibrated and validated before use.
In early 2014, a rainfall observation satellite called Global Satellite Measurement (GPM) was launched under collaboration between NASA and JAXA. GPM replaces the role of the Tropical Rainfall Measurement Mission (TRMM). The rainfall satellite (GPM or TRMM) is essential in merging IR and PMW data into rainfall data [11,12]. GPM-based SPPs data include Integrated Multi-satellite Retrievals for GPM (IMERG) and Global Satellite Measurement of Precipitation (GSMaP) data. NASA operates IMERG data, while JAXA operates GSMaP data [13,14]. IMERG and GSMaP provide rainfall data with a spatial resolution of 0.1 degrees with a temporal resolution of 0.5 h and 1 h, respectively. The validation of these data against surface observations has been carried out in several locations, and the accuracy varies by location [15,16,17,18,19,20,21,22,23]. In the mountainous region of Nepal, at high latitude, and the central plateau of Brazil, IMERG performance is better [16,19,21], while in China, Iran, and Yellow River regions, the GSMaP is better [15,17,22,23]. Therefore, the performance of the two data still needs to be evaluated for other regions to determine the error and uncertainty values of the GPM-based SPPs data specifically.
Based on the latency, the GPM-based SPPs data are classified into three data: real-time, near-real-time, and post-real-time. The selection of data will depend on the latency of the application from the user. Real-time SPPs GPM-based data is only available on GSMaP data known as GSMaP_Now. Furthermore, near-real-time data on IMERG are called IMERG Early (IMERG-E) and IMERG Late (IMERG-L), while on GSMaP, it is called GSMaP Near-Real Time (GSMaP-NRT). IMERG-E and GSMaP-NRT have a latency of 4 h, while IMERG-L has a latency of 12 h [13,14]. Real-time and near-real-time data from GPM-based SPPs can be used for monitoring extreme rainfall so to be used in the early warning of hydrometeorological disasters [24,25] such as floods, landslides, drought, and typhoons. Thus, the near-real-time SPPs GPM-based data can be used as a complement in areas with high potential for extreme rainfall, while surface measurement data is still minimal [26]. Although real-time and near-real-time SPPs data have many usages, they are still associated with higher error and uncertainty than post-real-time SPPs data [15,16,20]. The post real time data has a better accuracy because it has been corrected using surface measurement data and more complete multi-satellite data. The disadvantage of real-time post data is the very long latency. Post-real-time data from IMERG called IMERG Final (IMERG-F) has a latency of ~3.5 months. In GSMaP, the post-real-time data are called Microwave-IR Combined Product (GSMaP_MVK) and Gauge-calibrated Rainfall Product (GSMaP_Gauge) with a latency of 3 days [13,14]. Post-real-time GPM-based SPPs data with better accuracy have the potential to be used as input for weather and climate models [27,28,29].
Although most post-real-time data have better accuracy than real-time and near-real-time, previous research has shown that post-real-time data from GPM-based SPPs still has error and uncertainty values. Assessment of IMERG-F data in several locations show that there are still errors related to timescales, precipitation type, season, structure, intensity, and topography [30]. The assessment has been carried out in various ways around the world, with most studies conducted in Asia, especially in China. In addition, the version of IMERG-F data that has been evaluated includes all versions, starting from the oldest version (version 03) to the latest version (version 06). On the other hand, although evaluation of GSMaP data is not as extensive as the evaluation conducted on IMERG, the GSMaP-MVK and GSMaP-Gauge data have also been evaluated for various regions worldwide including Asia [15,21,23,31,32], Australia [33,34,35], and globally [16,36]. Like IMERG, GSMaP data validation is also widely carried out for the Asian region. Generally, the most dominant factors affecting the error value of GPM-based SPPs post-real-time data are the location, timescales, intensity, and topography. Thus, GPM-based SPPs data, near- and post-real-time, need to be validated before the data are applied to various needs.
One area that has the potential to utilize GPM-based SPPs data is the Indonesian Maritime Continent (IMC). IMC is the area with the most active convection in the world because of its location between the two warmest oceans, the Indian Ocean and the Pacific Ocean [37,38]. Very high rainfall throughout the year is observed in the IMC. High rainfall in IMC is often characterized by high intensity, long duration, and recurring frequency [37,39]. Such rain often triggers hydrometeorological disasters in the IMC [40,41]. About 1921 hydrometeorological disasters occurred in Indonesia throughout 2021 [42]. Thus, continuous rainfall data is needed with high resolution and good accuracy. Lack of surface rainfall gauge observation at IMC causes the GPM-based SPPs data to be very potential as complementary data. Near-real-time data from GPM-based SPPs has the potential to be used in the early warning system of hydrometeorological disasters at IMC. In addition, post-real-time data from GPM-based SPPs can also be used in the long-term analysis of weather and climate.
Several researchers have evaluated the performance of near-real-time and post-real-time data from GPM-based SPPs in the IMC. The latest version data from IMERG (Version 06) was validated using rain gauge data for near-real-time (IMERG-E and IMERG-L) and post-real-time (IMERG-F) data for the entire IMC [43]. This study shows that IMERG-F is better than IMERG-E and IMERG-L. The accuracy of the IMERG data varies greatly depending on the timescales, season, and elevation. In addition, the three IMERG datum types can also observe extreme precipitation well in the IMC [44]. On the other hand, GSMaP data validation in Indonesia has been carried out in the IMC for GSMaP_MVK version 07 [45,46], GSMaP_MVK version 05 [47], GSMaP_NRT version 06 [45], and the GSMaP reanalysis product [48]. Furthermore, GSMaP’s ability to observe extreme events related to flooding in Indonesia has been evaluated in several areas of the IMC [49,50,51]. GSMaP data validation in the IMC is still limited to the old version of GSMaP, while the latest version of GSMaP data released in December 2021 (version 08) has not been validated [52]. In addition, previous validation activities have not validated all GSMaP products, including now, near-real-time, and post-real-time. Thus, previous studies have not fully described the accuracy of GSMaP data for the IMC region. If we summarize, there are some limitations in existing studies, which include: (i) the number of rain gauge stations used being very limited; (ii) the GSMaP data type used still being very minimal; (iii) does not identify GSMaP capabilities in extreme rain observations. For this reason, we thoroughly tested the accuracy of GSMaP data in different timescales more comprehensively and for the latest version. Validation of SPPs data for each timescale is very important because of its utility for different applications. Heretofore, the validation of estimated rainfall from SPPs data for the hourly scale is still a challenge that related to the availability of high resolution of gauge observations. This case also found in IMC that has minimum study to validate GSMaP products on an hourly scale. Evaluation GSMaP data in IMC on an hourly scale carried on the Jakarta City area for several extreme events [51]. Thus, comprehensive information on the accuracy of the latest GSMaP hourly data for the entire IMC is still needed.
This study aims to evaluate the performance of the latest version of GSMaP data (version 08) over the IMC, including near-real-time and post-real-time data. The accuracy of the latest version of GSMaP data is compared to GSMaP’s real-time data (GSMaP_Now). The results of this study are expected to provide information on the accuracy level of GSMaP version 08 data in IMC before being widely used in several applications. The accuracy of GSMaP version 08 is evaluated in terms of timescales, variations in intensity and extreme events, and the effect of elevation. In addition, this research also examines the ability of GSMaP data to capture diurnal patterns over IMC. The IMC region, which is an archipelago, causes land–sea interactions due to daily variations in solar intensity to become very dominant. This land–sea interaction affects the diurnal distribution of amount, frequency, and intensity of rainfall on the IMC mainland [53,54]. Thus, the ability of GSMaP data to analyze the peak time of these parameters over IMC is very important to evaluate.

2. Data and Methodology

2.1. Study Area and Rain Gauge Data

IMC is a term for an archipelago that includes more than 17,000 islands. Administratively, the IMC covers Indonesia, New Guinea, East Timor, and Malaysia. This study focuses on Indonesia only, where most of the IMC area is Indonesian territory. Indonesia represents the IMC region with more than 17,000 islands, the largest being Kalimantan, New Guinea, Sumatra, Sulawesi, and Java.
Rainfall in IMC is influenced by inter-annual, intra-seasonal, seasonal, diurnal, and topography variations. Inter-annual variations in IMC are modulated by El Niño-Southern Oscillation (ENSO) and Indian Ocean Dipole (IOD) [25,55,56], while intra-seasonal variation is influenced by Madden-Julian Oscillation (MJO) which carries Mesoscale Convective Clouds (MCC) [57,58,59]. Furthermore, monsoonal activity influences IMC seasonal variations [60,61]. Although, in general, there are only two seasons at IMC, namely dry and rainy seasons, the monthly peak of rain varies for each region. Previous research has divided IMC into three rainy zones, namely zone A (monsoon), zone B (semi-monsoon), and zone C (anti-monsoon) [62]. In addition, regional variations of rainfall in the IMC are caused by interactions between land and ocean and complex topography. The dominant interaction between land and sea in the IMC can be observed from a rain migration from the ocean to the land, which induces the emergence of a diurnal pattern of rainfall [31,37,53].
The density of rain gauge observations in Indonesia is still not uniform (Figure 1). Many of the islands in the IMC are unpopulated, and most of the population resides on large islands. This affects the distribution of the rain gauge in the IMC, which is dominant on large islands. In this study, we used a rain gauge operated by the BMKG station. The rain gauge used is a rain gauge (RG) with automatic recording integrated into the Automatic Weather Station (AWS). AWSs that record measurement results automatically minimize human error due to recording errors. AWS records rainfall in 10 min resolution. However, because AWS relies heavily on a power source for its operations, it is prone to data unavailability when there is no power source available. In addition, even though a human error has been minimized, the chance for AWS data errors to occur is still possible due to various factors. For this reason, in this study, quality control of rain gauge data was carried out following several previous studies [43,44]. The quality control includes marking missing observations, excluding outlier values, and checking the homogeneity of the observation station data. After the quality control process, 586 stations were selected to validate GSMaP data. On an hourly timescale, validation was carried out using data with complete observation for one hour (60 min). We also observed the ability of GSMaP data to see the peak time of precipitation amount (PA), precipitation frequency (PF), and precipitation intensity (PI). PA is the mean hourly precipitation amount which is calculated from the cumulative rainfall divided by hours of observation, PF is the ratio of the number of rain events (>0.1 mm/h) to the overall data length, and PI is derived from the cumulative rainfall divided by the number of rainy hours during the study period [53,54]. Units for PA and PI are mm/h, and the PF is in percentage. These three parameters were computed at each hour (0000–2300 h in Local Standard Time/LST unit). A rain event is considered as a single event if there was no interruption during the rain, or at most, only a 1 h interruption occurred. For daily data validation, we used data where the availability of observations was more than 90% in one day (≥22 h). In the monthly data validation, we also use a threshold of 90% of observation data in one month, calculated from the day the observations are complete (24 h).

2.2. GSMaP Precipitation Products

GSMaP is a surface precipitation data with coverage 60°S–60°N that obtained through multi-satellite data. The multi-satellite data used is a combination of satellite constellation data, including GPM satellites and geostationary satellite data equipped with passive microwave (PMW) and infrared radiometers (IR). A total of 20 satellites have been used for GSMaP data since it was initiated in November 2002 by JAXA. Details of satellite names, satellite specifications, and periods of use can be found in the GSMaP user guide [63].
GSMaP estimates rainfall based on brightness temperature (Tb) data of the microwave imager (MWI), otherwise known as the PMW algorithm [64]. The radiative transfer model convert Tb data of MWI to rainfall values. The rainfall estimates are then integrated with infrared radiometer (IR) data using the Kalman filter method known as the PMW–IR algorithm [65]. This method estimates the direction of precipitation propagation based on atmospheric movement vectors to produce gridded rainfall estimation data with high resolution (0.1°—hourly). The GSMaP algorithm produces several products with different latency, namely: GSMaP_Now (real-time—0 h latency), GSMaP_NRT (near-real-time—4 h Latency), and GSMaP_MVK (post-real-time—3-day latency). In addition to the difference in latency, the difference between the three data is the completeness of the PMW–IR algorithm in determining atmospheric movement. The PMW–IR algorithm in GSMaP_MVK uses forward and backward cloud motions, while GSMaP_Now and GSMaP_NRT only temporarily use forward motions. Furthermore, the difference between GSMaP_MVK with GSMaP_Now and GSMaP_NRT is in the additional data used as initial conditions in the atmosphere. GSMaP_MVK uses JMA global analysis (GANAL) data, while GSMaP_Now and GSMaP_NRT use JMA forecast (FCST) data.
The GSMaP_MVK, GSMaP_Now, and GSMaP_NRT data have data gauge adjustment versions with the same latency. The data used in adjusting the GSMaP data are daily precipitation data belonging to the NOAA Climate Prediction Center (CPC). The data are available in the form of a grid box measuring 0.5 degrees for land areas [66] so that the GSMaP data over sea are the same between gauge adjustment and non-gauge-adjustment. Since NOAA CPC data resolution is in daily resolution, the data is only used for gauge adjustment of GSMaP_MVK data. Gauge adjustment data from GSMaP_MVK (hereinafter abbreviated as GSMaP_Gauge) uses an optical estimation scheme where the 24 h GSMaP_Gauge data must be the same as NOAA CPC data. Furthermore, the GSMaP_Now and GSMaP_NRT data are corrected based on the statistical parameters of the model, whose parameters are calculated based on the previous 30 days’ data resulting in gauge adjustment data called GSMaP_Now_G and GSMaP_NRT_G. For convenience, a summary of the names, abbreviations, latency, and resolution of the GSMaP data used in this study can be seen in Table 1.
Since the release of GSMaP data, there have been many improvements to the rainfall estimation algorithm. In January 2017, the GSMaP version 07 algorithm was released with many improvements based on the latest precipitation information of the DPR’s GPM. In addition, in higher latitude regions, GSMaP version 07 can estimate snowfall, while GSMaP version 06 cannot. Furthermore, on the data in the mainland area, there is an algorithm update on the GSMaP version 07 data to detect rain on the surface, including orographic rainfall. The GSMaP version 07 algorithm also considers the amount of CPC gauge data in one grid during the gauge adjustment algorithm process. In the ocean area, the GSMaP version 07 algorithm has also been improved to detect weak precipitation. Along with the increase in the GPM core observation database used for GSMaP data, the GSMaP data version has been updated to the latest version (version 8), which was released in December 2021. Several improvements made to GSMaP version 08 include (i) the use of the frozen precipitation depths method, (ii) algorithm improvement in the estimation of heavy orographic rainfall, (iii) homogenization of rainfall estimates from PMW with the normalization module, (iv) the use of histogram matching method in the IR retrievals algorithm, and (v) minimizing the appearance of artificial patterns for gauge adjustment data [52]. As a primary assessment, GSMaP version 08 data have been confirmed to have better accuracy than GSMaP version 07 data using gauge adjustment ground radar data in Japan [52]. Thus, this research will be necessary for developers to find information on the performance of GSMaP version 08 for the IMC area.

2.3. Validation Methods

GSMaP version 08 data were validated with rain gauge data using a point-to-pixel approach. This approach compares the point gauge data with the GSMaP grid directly. If there is more than one gauge observation within GSMaP grids, the gauge data will be averaged. The point-to-pixel approach has been used by several investigators to validate GPM-based SPPs data [18,43,67]. The number and distribution of pixel and RG can be seen in Table 2.
The GSMaP performance was evaluated using continuous statistical metrics and contingency table metrics. We use three types of continuous statistical metrics that have been widely used in the validation of SPPs data, namely correlation coefficient (CC), root mean square error (RMSE), and relative bias (RB). The following equation calculates these three values of continuous statistical matrices:
C C = 1 N i = 1 N ( S i S ¯ ) ( G i G ¯ ) σ S σ G
R M S E = 1 N i = 1 N ( S i G i ) 2
R B = i = 1 N ( S i G i ) i = 1 N G i
where N is number of data, Si and Gi are rainfall from GSMaP and rain gauge, σS and σG are the standard deviations of the GSMaP and rain gauge data, respectively. The CC value ranges from 0 to 1, with a perfect value equal to 1; the greater the CC value, the higher the GSMaP data uniformity with the gauge. The perfect value of RMSE is 0, so the larger the RMSE value, the greater the average absolute error of GSMaP data. Furthermore, the perfect value of RB is 0, with a negative value indicating an underestimation while a positive value of RB indicates an overestimation of GSMaP data.
The contingency metrics evaluates the suitability of GSMaP data rain event detection compared to gauge observations. We use three contingency metrics tests, namely probability of detection (POD), false alarm ratio (FAR), and critical succession index (CSI). The following equation calculates the three values of these contingency metrics:
POD = H H + M
FAR = F H + F
CSI = H H + M + F
where hit (H), misses (M), and false (F) values are calculated based on the contingency table metrics shown in Table 3. In validating the hourly data, we used a threshold of 0.1 mm/h as the event identified as rain according to the rain classification from the World Meteorological Organization (WMO). In addition, in daily data, we use a threshold of 1 mm/day as a wet day event, which refers to the wet day index issued by the Expert Team on Climate Change Detection and Indices (ETCCDI) [68]. The contingency metrics test value ranges from 0 to 1, with the perfect value of POD and CSI being 1 and the perfect value of FAR being 0. The POD value close to 1 indicates that the best ability of GSMaP to detect rain events. Furthermore, the FAR value close to 0 indicates the probability of non-rain detection error from GSMaP data. Similar to POD, a CSI value close to 1 indicates GSMaP’s best capability in observing actual rain events.
The Student t-test was applied to verify a significant difference between the mean values of statistical matrices, adopting 5% statistical significance. We also used the Student t-test to verify a significant difference in mean statistical matrices due to differences in the number of rain gauge stations in the GSMaP grid.
The GSMaP version 08 data is only available for a few months, so the evaluation of GSMaP data related to extreme indexes has not been carried out. We evaluated the ability of GSMaP’s daily rainfall estimation in its dependence on rainfall intensity using the cumulative distribution function (CDF) and probability density function (PDF). For PDF, we divided the rainfall intensity based on several categories, following several previous studies [1,15,69,70]. The categories of rainfall include trace precipitation (0–0.1 mm/day), tiny precipitation (0.1–1 mm/day), light precipitation (1–2 mm/day), low-moderate precipitation (2–5 mm/day), high-moderate precipitation (5–10 mm/day), low-heavy precipitation (10–20 mm/day), high-heavy precipitation (20–50 mm/day), and violent precipitation (>50 mm/day).
Estimation of rainfall from satellite products on a shorter timescale is still challenging. The accuracy of rainfall data on an hourly scale is crucial in observing dominant diurnal patterns such as in IMC [37]. Furthermore, accurate daily rainfall data is needed for extreme rain monitoring because it is closely related to hydrometeorological disasters [71]. SPPs data, which has a wide range of observations and high resolution, makes it potential for characterization, monitoring, and forecasting of extreme rain. Therefore, there have been many study to evaluate the daily SPPs data, including GSMaP data. Generally, testing the validity of GSMaP version 08 data on multi-timescales constantly tests GSMaP data daily. In addition, the ability of GSMaP data to observe the extreme rain index at IMC because the index was evaluated base on several extreme precipitation indices proposed by the Expert Team on Climate Change Detection and Indices (ETCCDI) (Table 4). Such indices are frequency-based indices (R1mm, R10mm, R20mm, and R50mm), duration-based indices (CWD and CDD), and intensity-based indices (RX1day). Identification of extreme precipitation indices was evaluated only for BMKG’s stations with the data availability more than 90% of the total observation time.
Monthly rainfall data is crucial in water balance analysis [72]. Accurate monthly rainfall data are useful in agricultural planning to minimize crop failure [73,74]. Thus, it is crucial to have accurate monthly rainfall data, where the data will be useful in forecasting rainfall in the future [75,76]. GSMaP data, which have a reasonably high resolution (0.1° × 0.1°), have the potential to be used as input for the forecasting model in IMC. Therefore, in this study, we also evaluated the performance of GSMaP on a monthly timescale.
Previous studies have shown a significant effect of topography and elevation on the accuracy of SPP data [43,46]. To evaluate the effect of topography and elevation, we use daily data of GSMaP because daily data are close to real-time data and perform better than hourly data. We separated the evaluation based on several islands: Sumatra, Java, Bali and Nusa Tenggara, Borneo, Sulawesi, Molucca, and New Guinea. The statistical test is calculated based on the island’s available rain gauge observation.

3. Results

3.1. Hourly Assessment

The assessment matrix of the hourly data of real-time, near-real-time, and post-real-time GSMaP data compared to RG observations is provided in 
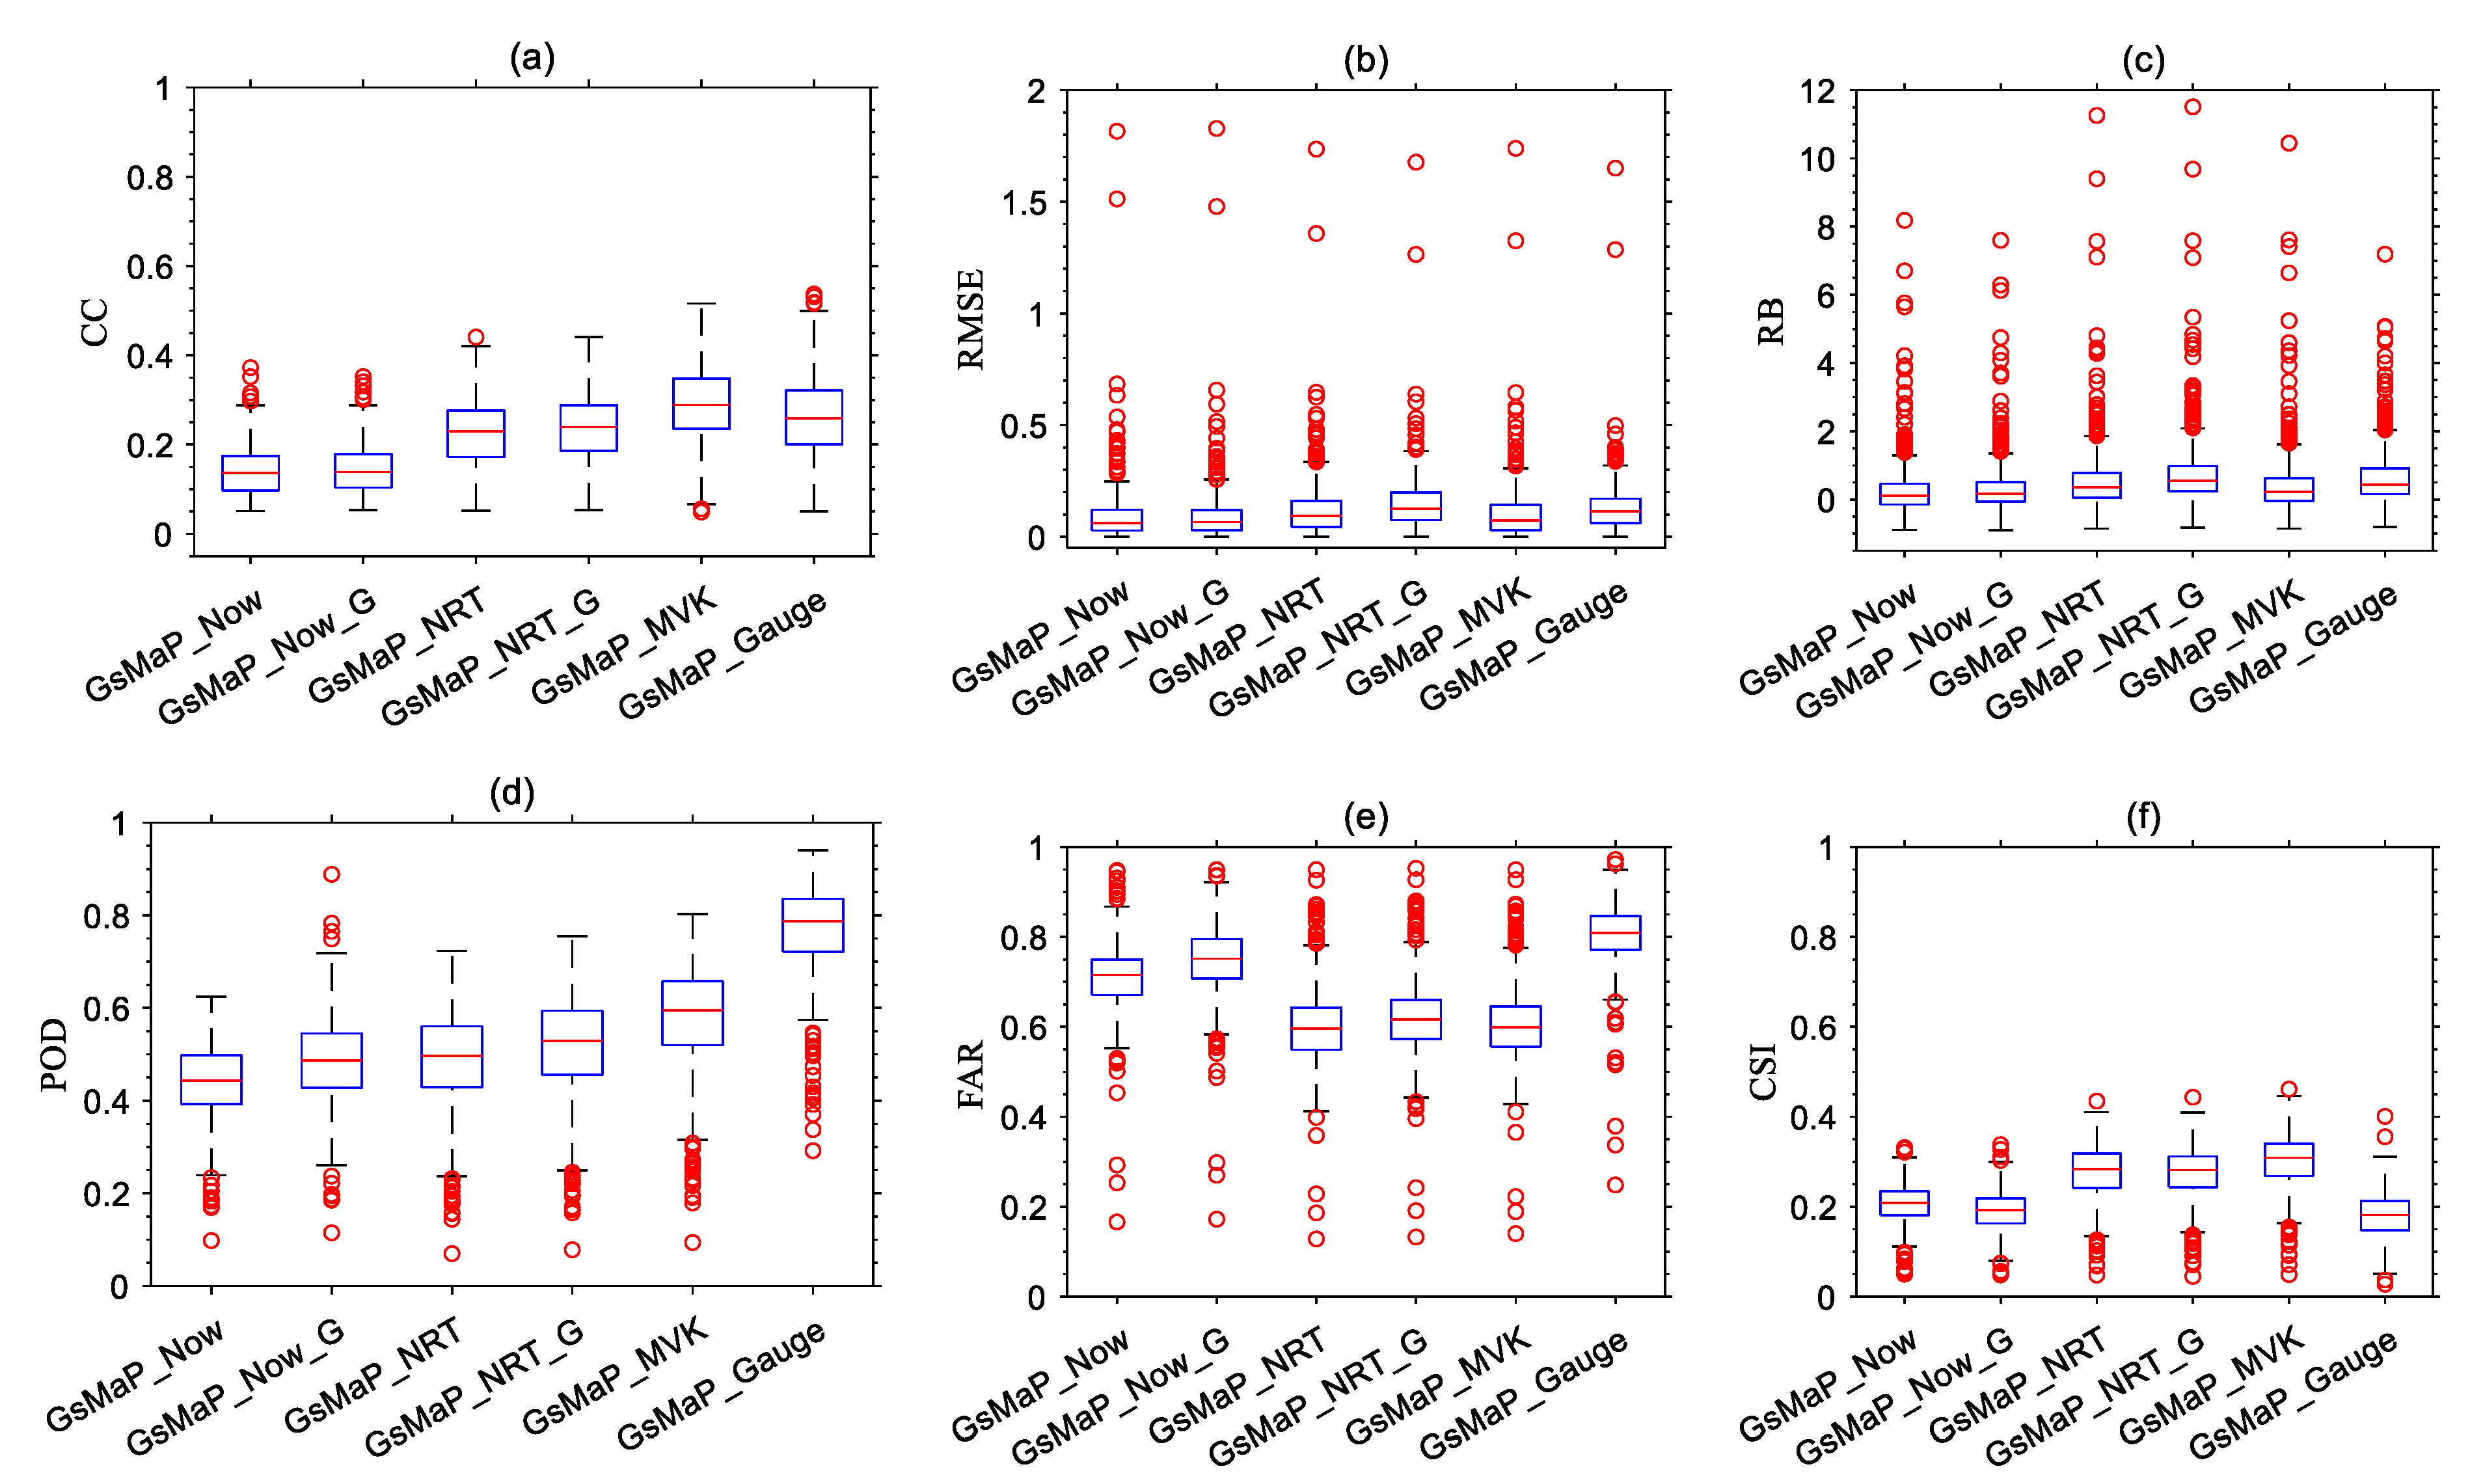
Figure 2. The continuous statistical metrics vary for all GSMaP types and RG’s station (Figure 2a–c). The mean CC of GSMaP hourly data (excluding outliers) were in range 0.14 to 0.29 (Table 5). Although the average correlation of all GSMaP data is still low (CC < 0.3), some stations show a moderate correlation (0.3 < CC ≤ 0.5) (Figure 2a). According to the Student t-test, the averages of CC of GSMaP_Now and GSMaP_Now_G are statistically different (p < 0.05), while for the other types are not. The best correlation is shown by post-real-time data, with a moderate correlation being observed for 44.9% (GSMaP_MVK) and 32.3% (GSMaP_Gauge) of grids. In near-real-time data, the number of grids showing a moderate correlation is 15.54% (GSMaP_NRT) and 18.83% (GSMaP_NRT_G). Meanwhile, for real-time data, the number of grids with CC > 0.3 is less than 5% of the number of grids. The hourly data correlation obtained from GSMaP version 08 in this study is better than that obtained in Jakarta [51], which evaluated GSMaP_NRT and GSMaP_Gauge version 07 data. In addition, the near-real-time and post-real-time GSMaP version 08 data for the hourly scale also shows a better CC value from IMERG-F version 06 data in the IMC [43]. The number of the rain gauge may influence this accuracy in which the sample size data used in this study are much higher than the IMERG data validation. However, the CC value of GSMaP for hourly data is quite good, indicating the capability of GSMaP data to characterize the diurnal pattern of rain in IMC with a shorter latency than IMERG.
Although the CC value of hourly data obtained is quite good, the RMSE and RB values are still large (Figure 2b,c). The average RMSE values (excluding outliers) were in range 0.08 mm/h to 0.14 mm/h (Table 5). The RMSE value shows a larger error of GSMaP calibrated gauge data for the same latency than the non-gauge-calibrated data. This is due to the tendency of a higher overestimation of the GSMaP calibrated gauge data. This can also be seen from the example of time series for hourly data of GSMaP rainfall product and rain gauge data at the station with the ID of 150283 (101.55373°E, 3.09592°S) (Figure 3a). About 66.1% (GSMaP_Now_G), 87.4% (GSMaP_NRT_G), and 84.5% (GSMaP_Gauge) of grids show the overestimated value (RB > 0). On the other hand, only 59.3% (GSMaP_Now), 78.6% (GSMaP_NRT), and 67.8% (GSMaP_MVK) of grids have an RB value > 0 for non-gauge-calibrated data. In addition to the large number of GSMaP grids showing overestimated values, the magnitude of RMSE obtained is still quite high. The average hourly GSMaP gauge-calibrated RB data are greater than GSMaP non-gauge-calibrated data (Table 5). The RB value obtained in the GSMaP version 08 near-real-time and post-real-time data at IMC is much greater than that found for the IMERG data [43].
The POD value increased with increasing GSMaP data latency (Figure 2d). The average POD values are in the range 0.44 to 0.78 (Table 5). The POD values of near-real-time and post-real-time data are very good and comparable to that found for IMERG data in the IMC region [43]. This shows that GSMaP data has a good opportunity to observe rain events at IMC. However, GSMaP still often miss-detects rain events on an hourly scale, as seen from the FAR value, which is still quite high (Figure 2e). A high FAR value is observed in the GSMaP_Now, GSMaP_Now_G, and GSMaP_Gauge data (Table 5). Fairly low FAR values were observed in GSMaP_NRT, GSMaP_NRT_G, and GSMaP_MVK data (Table 5). The FAR value, which is greater than the POD value, indicates that the hourly data of GSMaP still needs to be improved. This is also observed from the CSI value of the overall GSMaP data, which is still low with an average of in range 0.18 to 0.30 (Table 5).
The average contingency matrix data for GSMaP version 08, both near-real-time and post-real-time, show a significant difference with a p-value < 0.05. The best CSI value of GSMaP data, namely for GSMaP_NRT, GSMaP_NRT_G, and GSMaP_MVK data, is comparable to the CSI value of IMERG data obtained for the IMC area [43]. Overall, GSMaP_MVK’s accuracy is better than GSMaP_Gauge’s. The percentage of grid or rain gauge stations with better statistical parameter values of GSMaP_MVK than GSMaP_Gauge are CC (61.6%), RMSE (63.5%), RB (62.5%), POD (2.1%), FAR (99.6%), and CSI (96.9%). Percentages are calculated for the condition when the CC of GSMaP_MVK is larger, RMSE is smaller, RB is smaller, POD is larger, FAR is smaller, and CSI is greater than that of GSMaP_Gauge.
GSMaP V08 data accuracy shows a slightly better value than IMERG in the IMC region. However, hourly GSMaP V08 data tend to overestimate with a relatively large bias. This significant bias of GSMaP data was also found for previous versions of the GSMaP data [77,78]. This significant bias of GSMaP data needs to be identified and adjusted first to obtain more satisfactory hourly data results in the IMC region [79,80]. On the other hand, the average absolute error magnitude is relatively low, which is ~1.0 mm/h. This fairly good RMSE value is followed by the ability to detect rainfall accurately, which is quite good, as seen from the CSI value of ~0.24.
Furthermore, we found that post-real-time GSMaP data has much better accuracy than real-time and near-real-time GSMaP data. This is not surprising and is consistent with several previous versions of GSMaP hourly data validation studies [51,78,80,81]. These studies show that GSMaP version 07 post-real-time data has better quality in some areas. However, we found that post-real-time non-gauge calibrating (GSMaP_MVK) data showed a better accuracy than GSMaP_Gauge data. This may be due to errors in predicting rainfall events that can be observed from POD and FAR, which are high compared to other data. Higher RB is associated with the high values of FAR and POD in GSMaP_Gauge data compared to GSMaP_MVK data. Furthermore, GSMaP real-time hourly data still need significant improvement, while GSMaP near-real-time show satisfactory accuracy and are not much different from post-real-time data. Hourly data from GSMaP near-real-time products are quite satisfactory. Thus, they have the potential for monitoring and forecasting hydrometeorological disasters at the IMC.
One application of SPP data on an hourly scale is observing the diurnal rainfall pattern [82]. Hourly data from SPPs can be used to observe PA, PF, and PI values in the IMC, representing the diurnal cycle of rainfall [54]. The distribution of the peak time values for PA, PF, and PI values for all GSMaP and RG grids can be seen in Figure 4. GSMaP and RG data show a more consistent value in observing PA and PF’s peak time than PI’s. GSMaP and RG show that the peak time of PA and PF tends to occur in the afternoon until the evening. The peak time of rainfall that occurs in the afternoon is a characteristic of diurnal patterns commonly found in mainland Indonesia [37,83]. Although GSMaP can observe the peak time of PA and PF quite well, some grids show significant difference in the peak time. These differences occur in cases with more than one peak of rain. Rainfall in several areas in the IMC region shows more than one peak time of diurnal cycle [53,84]. 
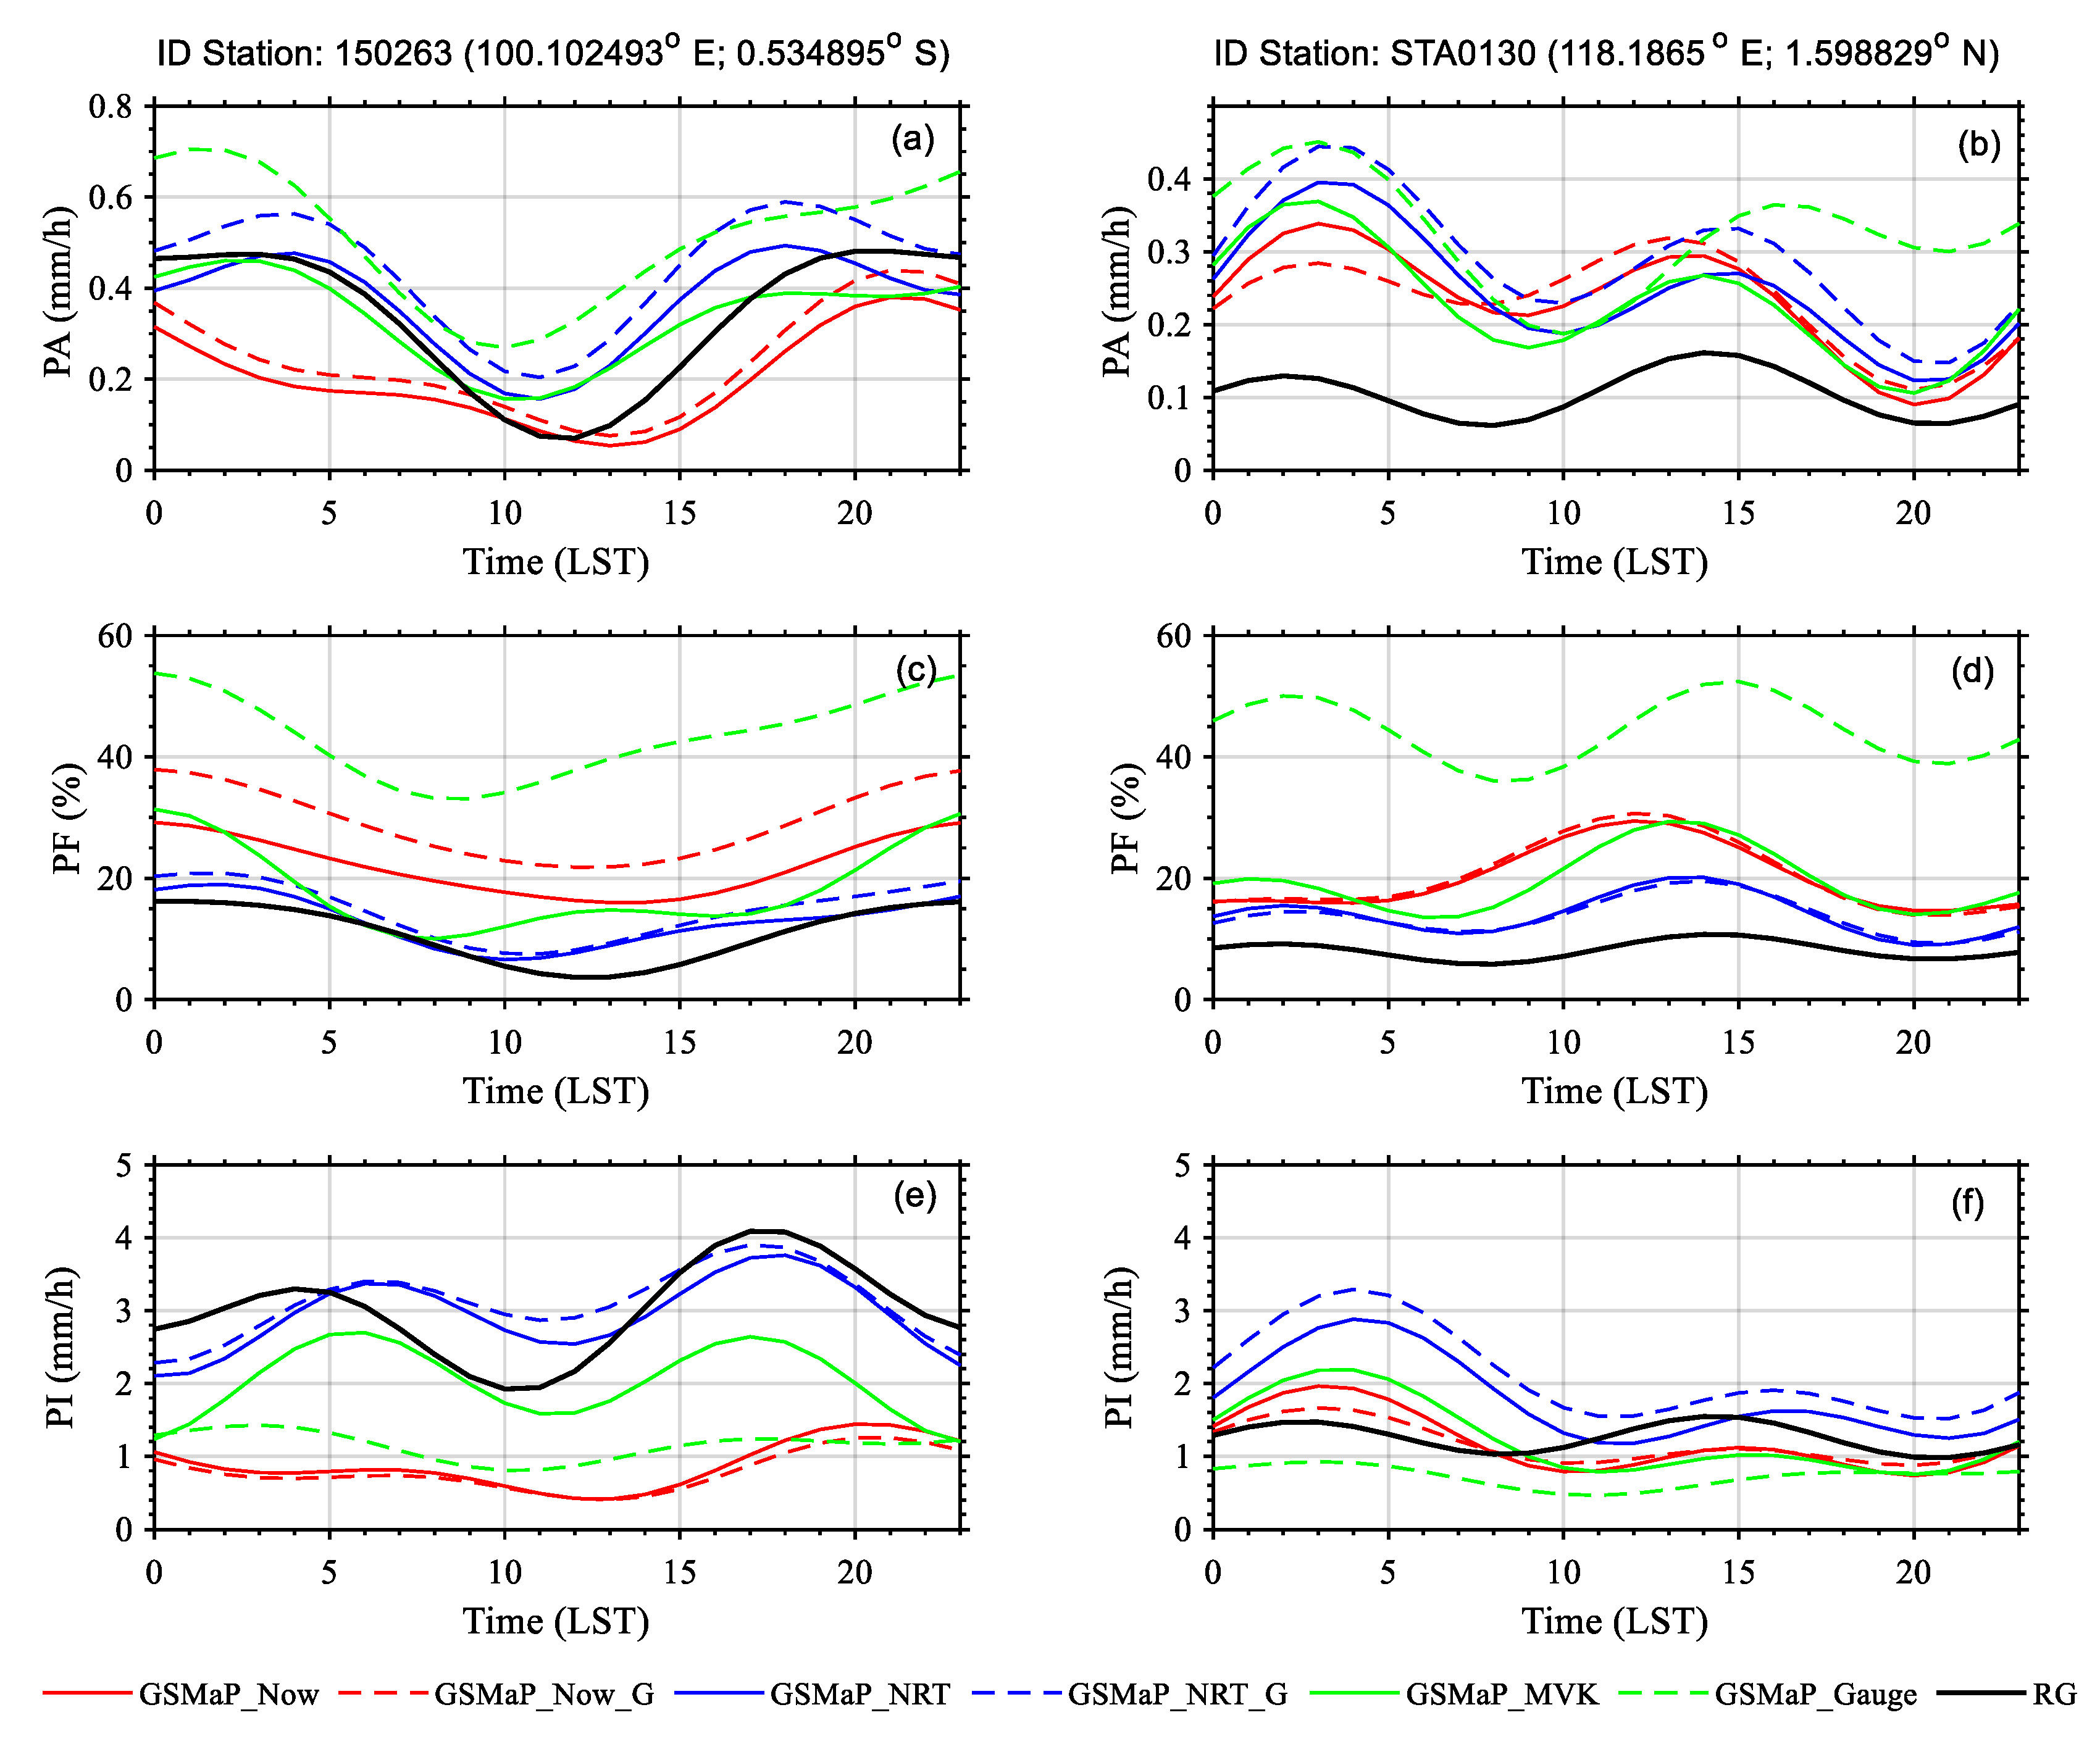
Figure 5 shows an example of a diurnal cycle with two rainfall peaks for two observation stations. If GSMaP and rain gauge show the same dominant peak, no significant peak difference exists. However, suppose the dominant peaks from the two data are different. In that case, two different peaks are observed from the two observations because in Figure 4 only the dominant peak is taken.
Overestimation of rainfall on GSMaP data causes higher PA and PI values than rain gauge. On the other hand, the FAR value of GSMaP hourly data, which is quite high, contributes to the difference in peak PF time between GSMaP and rain gauge. Thus, if the FAR is lowered, the PF peak time match between GSMaP and RG will be better. As the FAR value decreases and the POD increases with increasing timescale, using data with a longer time window (e.g., sub-daily) can also increase the compatibility of the peak time of the PF between the two instruments [67,80,85].
To more quantitatively illustrate the differences in peak times between PA, PF, and PI, we plotted the percentage of station numbers for differences of 0 h, 1 h, 2–3 h, and >3 h (Figure 6). Overall, the number of grids showing the suitability of the diurnal peak time observations is quite satisfactory, especially for PA and PF. The percentages of the number of grids showing the corresponding peak time values (difference 1–3 h) for PA, PF, and PI were 60–80%, 60–80%, and 38–50%. This trend of diurnal peak delay from SPP data was also found in previous studies [53,54,86].

3.2. Daily Assessment

Figure 7 shows the scatterplot of GSMaP version 08 against RG daily data for all IMC areas. Generally, the correlation between GSMaP version 08 and RG data is moderate (0.3 < CC ≤ 0.5). The correlation increased significantly from real-time data to near-real-time and post-real-time GSMaP data outperforming GSMaP_MVK data compared to all other GSMaP datum types. On the other hand, GSMaP_Now shows the worst performance among all GSMaP version 08 datum types. The correlation of GSMaP version 08 data in IMC is difficult to compare with previous studies due to the limited number of studies that have evaluated the performance of hourly GSMaP data involving all major islands in IMC. Fatkhuroyan and Wati [45] used 152 RG data for one year (January–December 2016) for GSMaP_NRT version 06 data. Although they evaluated the accuracy of GSMaP daily data, this study only focused on the average daily accumulation data between GSMaP and RG. They did not compare daily data of all GSMaP products and RG. The study that looked at all daily data on GSMaP and RG observations in IMC was carried out in several studies for a very limited area [46,51]. Liu et al. [46] found a low correlation of GSMaP_MVK version 07 daily data for the Bali region (CC = 0.28). Furthermore, Priyambodoho et al. [51] found that the performance of daily data GSMaP_NRT and GSMaP_Gauge version 07 varies significantly for each flood event in Jakarta. Thus, our results represent new information for daily GSMaP data quantification in the IMC region.
The correlation of GSMaP version 08 data the entire IMC is better than that found on Bali island, even for the real-time type [46]. This indicates an increase in the quality of daily GSMaP data in the IMC area. On the other hand, this also indicates variations in the accuracy of GSMaP daily data for each region in the IMC, as also found by previous researchers [45]. Therefore, we evaluated the accuracy of GSMaP version 08 data for the entire observation grid. The distribution of statistical test values of the daily data is shown in a boxplot (Figure 8). From all tested GSMaP data grids, the percentage of stations showing good correlation (0.5 < CC ≤ 0.8) were 11.03% (GSMaP_Now), 12.71% (GSMaP_Now_G), 36.92% (GSMaP_NRT), 37.38% (GSMaP_NRT_G), 47.19 % (GSMaP_MVK), and 21.88% (GSMaP_Gauge). For GSMaP_MVK and GSMaP_Gauge data, 2.57% and 3.76% of the number grids showed an excellent correlation (CC ≥ 0.8). The correlation of GSMaP data obtained in the IMC is better than the daily IMERG data tested in the IMC [43]. This better GSMaP CC value than IMERG was also found in previous studies for the China region [3]. The averages of CC of GSMaP_Now vs. GSMaP_Now_G and GSMaP_NRT vs. GSMaP_NRT_G are statistically not different (p > 0.05), while for the other types, they are significantly different.
The good correlation value of GSMaP daily data is also accompanied by relatively low RMSE values with an average RMSE of in range 1.86 mm/day to 3.14 mm/day (Table 6). GSMaP daily data tends to overestimate daily rainfall where 60.15% (GSMaP_Now), 70.30% (GSMaP_Now_G), 79.51% (GSMaP_NRT), 88.34% (GSMaP_NRT_G), 70.01% (GSMaP_MVK), and 86.40% (GSMaP_Gauge) of the total grids show RB values > 0. The tendency of GSMaP to overestimate the rainfall is consistent with the overestimation of the hourly data of GSMaP, and this can also be seen from the example from the time series of daily data of GSMaP rainfall product and rain gauge data at the station with the ID of 150283 (101.55373E, 3.09592S) (Figure 3). This is also found in the daily IMERG data for the IMC region [43].
The GSMaP daily contingency matrix data test showed a significant performance improvement compared to the hourly GSMaP data (Figure 8d–f). The average daily GSMaP data POD values were in the range 0.71 to 0.81 (Table 6). This value is much higher than the hourly GSMaP data. The best values were observed for GSMaP_NRT_G, GSMaP_MVK, and GSMaP_Gauge, and the differences were not significant between the three (p-value > 0.05). On the other hand, the average daily GSMaP data FAR values are between 0.33 to 0.41 (Table 6). Compared with the increase in POD, the decrease in the daily data FAR value is not too remarkable compared to the hourly data. However, the increase in POD and the decrease in FAR of GSMaP data from an hourly to a daily scale impact the CSI value of GSMaP data. The average daily GSMaP data CSI values are in range 0.49 to 0.57 (Table 6) that is better than hourly data (Table 5). Daily CSI insignificant differences (p-value > 0.05) were found for GSMaP_Now vs. GSMaP_Now_G and GSMaP_NRT vs. GSMaP_NRT_G. The good value of the GSMaP daily contingency matrix data indicates that this data has the potential to be used to identify wet and dry days, which are the main basis for calculating the extreme rain index [68]. Overall, GSMaP_MVK’s accuracy is better than GSMaP_Gauge’s, as observed in the hourly data. The percentage of grid or rain gauge stations with better statistical parameter values of GSMaP_MVK than GSMaP_Gauge are CC (74.9%), RMSE (61.3%), RB (61.3%), POD (45.4%), FAR (72.0%), and CSI (67.7%).
The overall results of the daily GSMaP version 08 statistical test show not too satisfactory results in the IMC area. Although we achieved better results from previous studies, the accuracy of GSMaP version 08 in the IMC is still not good compared to other regions. The correlations obtained in this study ranged from moderate to good correlation, with the best correlation shown by GSMaP_MVK. This correlation value is still inferior to that obtained in all of China [3,87], which may be due to the density of the CPC data used as gauge calibration in the IMC being less than that of the area. In addition, the correlation of daily GSMaP data and RG points is also very dependent on the number of gauges in grids used in validation [2]. Several studies in China that compared GSMaP Grid data with RG points also found a moderate correlation [15,22,88,89]. In addition, moderate correlation values were also found in Vietnam [90] and Thailand [91]. Furthermore, the ability to detect daily rain events shows a reasonably reliable value with a CSI of ~0.54. All the GSMaP daily statistical tests show a significant increase from hourly GSMaP data, especially for GSMaP_Gauge data. Furthermore, all these tests found that the daily GSMaP version 08 data showed slightly better performance than the daily IMERG version 06 data in the IMC region [43].
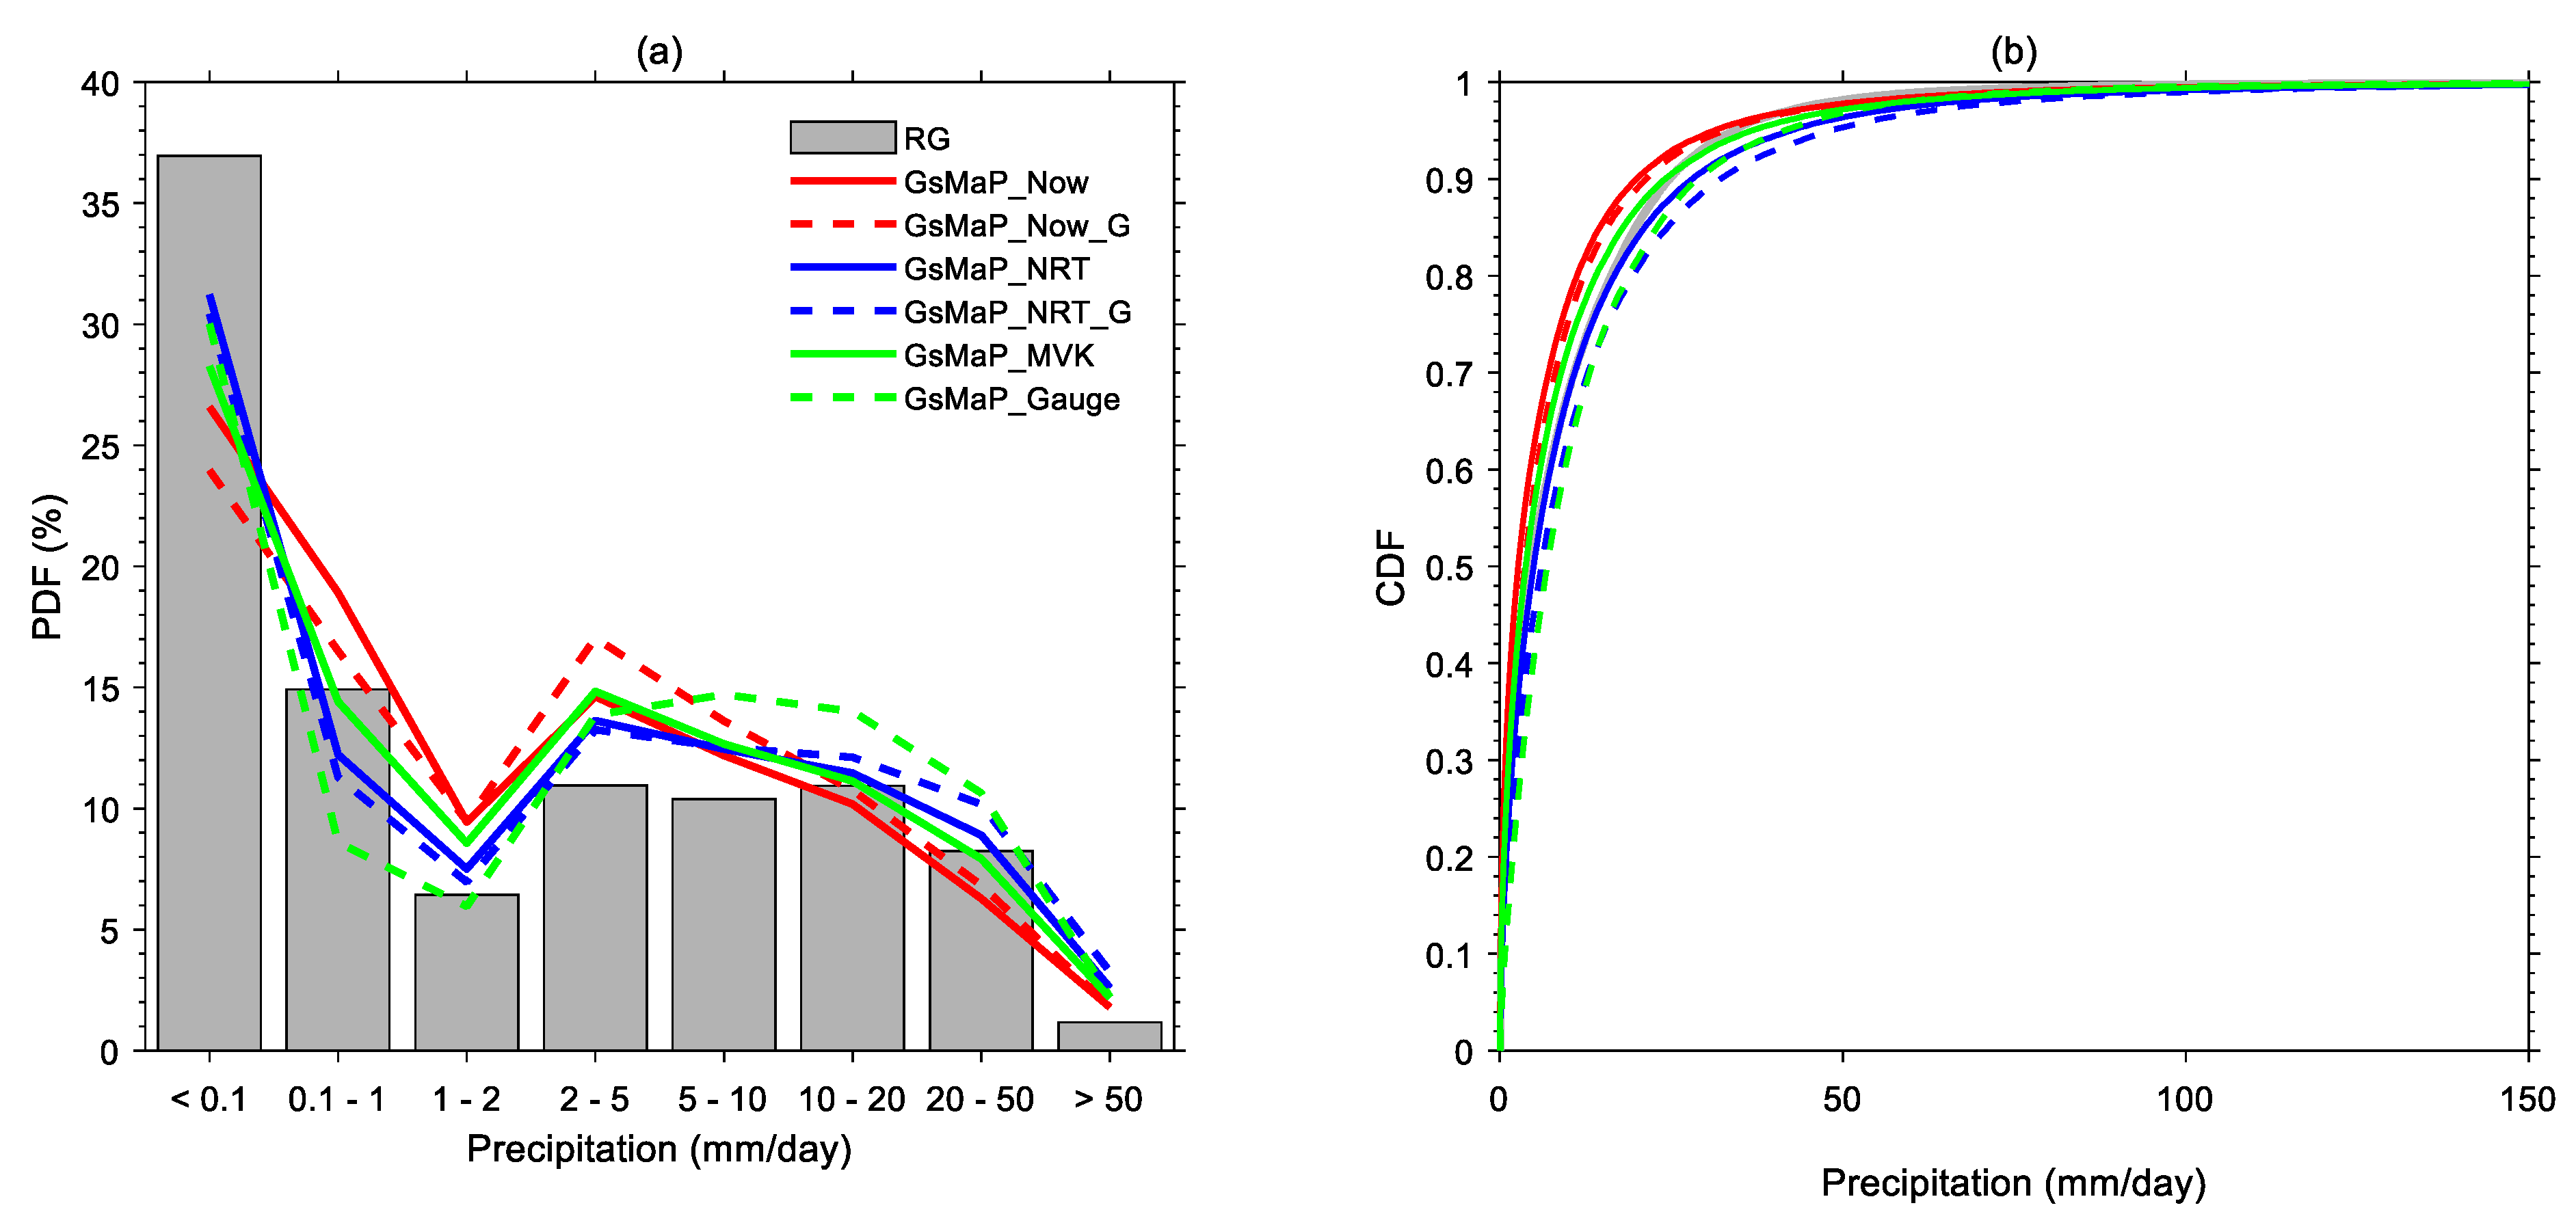
To evaluate the capability of GSMaP data to observe extreme rain events, we used CDF and PDF charts (Figure 9). The frequency of occurrence of wet days (>1 mm/day) was observed quite a lot, namely 48.12% (Figure 8a). The relatively high number of wet days is due to the dominant data period in the rainy season. The lowest frequency of wet days is GSMaP_Now (54.50%), and the highest is GSMaP_Gauge (61.38%). The PDF value clearly shows that GSMaP overestimates the precipitation event. On the other hand, for the frequency of dry days (<1 mm/day), GSMaP underestimates its occurrence. This underestimation (overestimation) of the frequency of dry (wet) days of SPPs was also found in Singapore for IMERG data [70]. Although the PDF values of GSMaP and RG data are different, all GSMaP data show the same pattern as RG. For trace precipitation (<0.1 mm/day), all GSMaP data show a relatively large underestimation value, which contributes to the high FAR value for rainfall using a threshold of 0.1 mm/h (Figure 2e).
In general, the GSMaP has the tendency to either overestimate or underestimate the RG depending on the rainfall intensity. Both real-time GSMaP data show overestimated values for tiny precipitation (0.1–1 mm/day) and light precipitation (1–2 mm/day). GSMaP real-time data (GSMaP_Now and GSMaP_Now_G) tend to underestimate rainfall at very low rainfall (trace precipitation (<0.1 mm/day)). This increases the FAR value of real-time rainfall data with a threshold of 1 mm/day on daily timescales (Figure 8e). On the other hand, GSMaP real-time data show an underestimated value for rainfall of 10–50 mm/day. In contrast, all types of data show an overestimation for rainfall of 1–10 mm/day. The GSMaP_Gauge data shows an overestimated rainfall of 5–50 mm/day. This indicates that the GSMaP_Gauge data overestimates moderate rains, considering them as rain with higher intensity. Similar pattern can be seen in CDF plot (Figure 9b). The GSMaP_MVK data shows the best compatibility of CDF with RG data at the 80th percentile and above. On the other hand, GSMaP_NRT, GSMaP_NRT_G, and GSMaP_Gauge data show overestimated values, while GSMaP_Now and GSMaP_Now_G data show underestimated values. The CDF observation for this high percentile is important in determining extreme events in the IMC, where extreme rain events are expressed as those whose probability of occurrence is above the 90th percentile. Thus, the daily GSMaP_MVK data have advantages for observing extreme rain at IMC compared to other GSMaP datum types.
Evaluation of the capability of the GSMaP version 08 data in determining the extreme rain index is shown in Table 7. The statistical parameter values were obtained from 205 GSMaP grids with gauge data availability data of more than 90%. In general, frequency-based indices (R1mm, R10mm, R20mm, and R50mm) show a good correlation (0.5 < CC ≤ 0.8). A good correlation in estimating frequency-based indices tends to overestimate (RB > 0), except for GSMaP real-time data. The best CC values for frequency-based indices are shown at the R20mm and R50mm indexes. Good CC values on the R20mm and R50mm indexes were followed by relatively low RMSE, namely 0.11 to 8.96 and 1.22 to 4.59 (Table 7). The lowest RMSE values for the R20mm and R50mm indexes are observed in real-time GSMaP data with small RB (RB~0). This shows the potential of GSMaP nowcasting data in determining days with very heavy rain intensity (>20 mm/day). This real-time observation can potentially develop an early warning system for IMC hydrometeorological disasters such as floods and landslides. On the other hand, the lowest CC on frequency-based indices is shown by the frequency of wet days (R1mm) with a tendency to overestimate (RB > 0). This is related to underestimating GSMaP data for rain with an intensity of <1 mm/day (Figure 9). In addition, this can also be seen from the high FAR value in the daily data (Figure 8).
Low CC values (CC ≤ 0.3) from GSMaP data are shown in the determination of duration-based indices (CWD and CDD). This is consistent with IMERG’s evaluation of extreme rainfall at IMC [43,44]. The low ability of SPP data to estimate duration-based indices at IMC is related to the overestimation of rain with an intensity of 0.1–1 mm/day (Figure 9). This overestimation will cause a mistake in identifying dry days (<1 mm/day) as wet days. Therefore, the GSMaP data overestimate the CWD value (RB > 0) and underestimate the CDD value (RB < 0), as shown in Table 7. In addition, this also causes an overestimation of the R1mm index.
GSMaP data show a moderate correlation (0.3 < CC ≤ 0.5) in intensity-based indices estimates (RX1day). The CC value of the RX1day value indicates that the calibrated gauge GSMaP data (CC ≥ 0.4) has a better correlation than the calibrated non-gauge data (CC ≤ 0.4). The best correlation for the estimated RX1day index is shown in the GSMaP_NRT_G data. Furthermore, the RMSE value shows a relatively large value from all GSMaP data (32.24–71.42 mm/day) with a tendency to overestimate (RB > 0). Besides the relatively large RMSE value, the RB value in the RX1day estimation also shows a large bias (RB~1). The lowest RMSE and RB values were observed in the GSMaP_Gauge data (Table 7). This shows that the bias correction of the CPC data from GSMaP_Gauge is quite effective in rainy events with very high intensity.

3.3. Monthly Assessment

The scatterplot of monthly GSMaP data against RG is shown in Figure 10. Monthly data are an aggregate of daily data. In general, all GSMaP types showed compatibility with RG (CC > 0.7). The CC value of all GSMaP data is almost the same, with only a slight difference for GSMaP_NRT, which has a better CC value. The CC value obtained is better than that found in Bali [46]. However, the CC value obtained in this study is slightly lower than that found by Setiyoko et al. [47]. This is probably due to the limited data used in the study, not covering all months, dominant in the wet month only. Previous research at IMC showed that the accuracy of SPP data in the wet month (DJF-MAM) was lower than in the dry month (JJA-SON) [43]. On the other hand, the CC value of GSMaP monthly data shows a better value than the CC of IMERG V06 data at IMC compared to AWS [43]. However, the difference in the accuracy between the two data is not very significant. Thus, the GSMaP data shows its capability to input the forecasting model for monthly rainfall in IMC.
Although the correlation of monthly GSMaP data is quite good, the RMSE value is still relatively large. GSMaP monthly data RMSE values at IMC range from 140.45 mm/month to 184.06 mm/month. Although this value is still consistent with the results found in previous studies, this RMSE value is an error and increases the uncertainty of forecasting results [92,93,94]. GSMaP monthly data tend to be overestimated, as indicated by the positive value of RB (Figure 10). We found that the RB value from real-time data showed a lower value than near-real-time and post-real-time data. This smaller RB value is caused by the lower overestimated value of the real-time data for rain with an intensity greater than 5 mm/s (Figure 9a). On the other hand, GSMaP_Gauge data show the largest RB due to the highest overestimation for rain with an intensity greater than 5 mm/s (Figure 9a). The overestimation impacts the high value of the monthly RB data because heavy rainfall plays a crucial role in determining the accumulation of monthly rainfall. Thus, GSMaP real-time data with a smaller RB can be used as an input for monthly rainfall models.

3.4. Topography and Elevation Dependence

Table 8 shows the results of statistical tests for several islands in Indonesia. The best scores from each category are marked in bold. The best correlation value of all GSMaP data is found in Borneo (0.46), while the lowest correlation is found in Sulawesi (0.28). Rain gauge stations in Borneo are located in the lowlands (<300 ASL) (Figure 10). In contrast, in Sulawesi, they are located in plains with complex topography, reducing the SPP data’s correlation value. The best values of RMSE (0.82 mm/day) and RB (0.01) were found in Bali and Nusa Tenggara. This is likely due to the low annual rainfall in this area compared to other areas in the IMC [43]. Furthermore, the high value of POD is obtained for the Java (0.82) and Borneo (0.81) regions. Such high POD value in Java is related to the high density of BMKG stations on the island (Figure 1). However, Molucca and New Guinea found the best FAR values (0.29). The location of the rain gauge station in this area is dominated by lowlands (Figure 11). However, the density of GM stations in Molucca and New Guinea is lower than in Borneo, so the POD value in Molucca and New Guinea is lower than in Borneo. A high POD value and a reasonably low FAR in some areas cause a good CSI value. Three regions show the same average CSI value (0.57): Java, Borneo, Molucca, and New Guinea. The good CSI values in the region are consistent with the POD and FAR values.
To evaluate the effect of elevation on the accuracy of GSMaP data, we fit each statistical test parameter to altitude. Statistical parameters were averaged for every 50 m ASL elevation. The results of linear fitting of each statistical parameter can be seen in Figure 12. The largest correlation value was observed in real-time GSMaP data, with a negative value (Table 9). This indicates a more significant elevation dependence of real-time GSMaP data compared to near-real-time and post-real-time GSMaP types. A decrease in CC values with increasing altitude was also found for IMERG data at IMC [43].
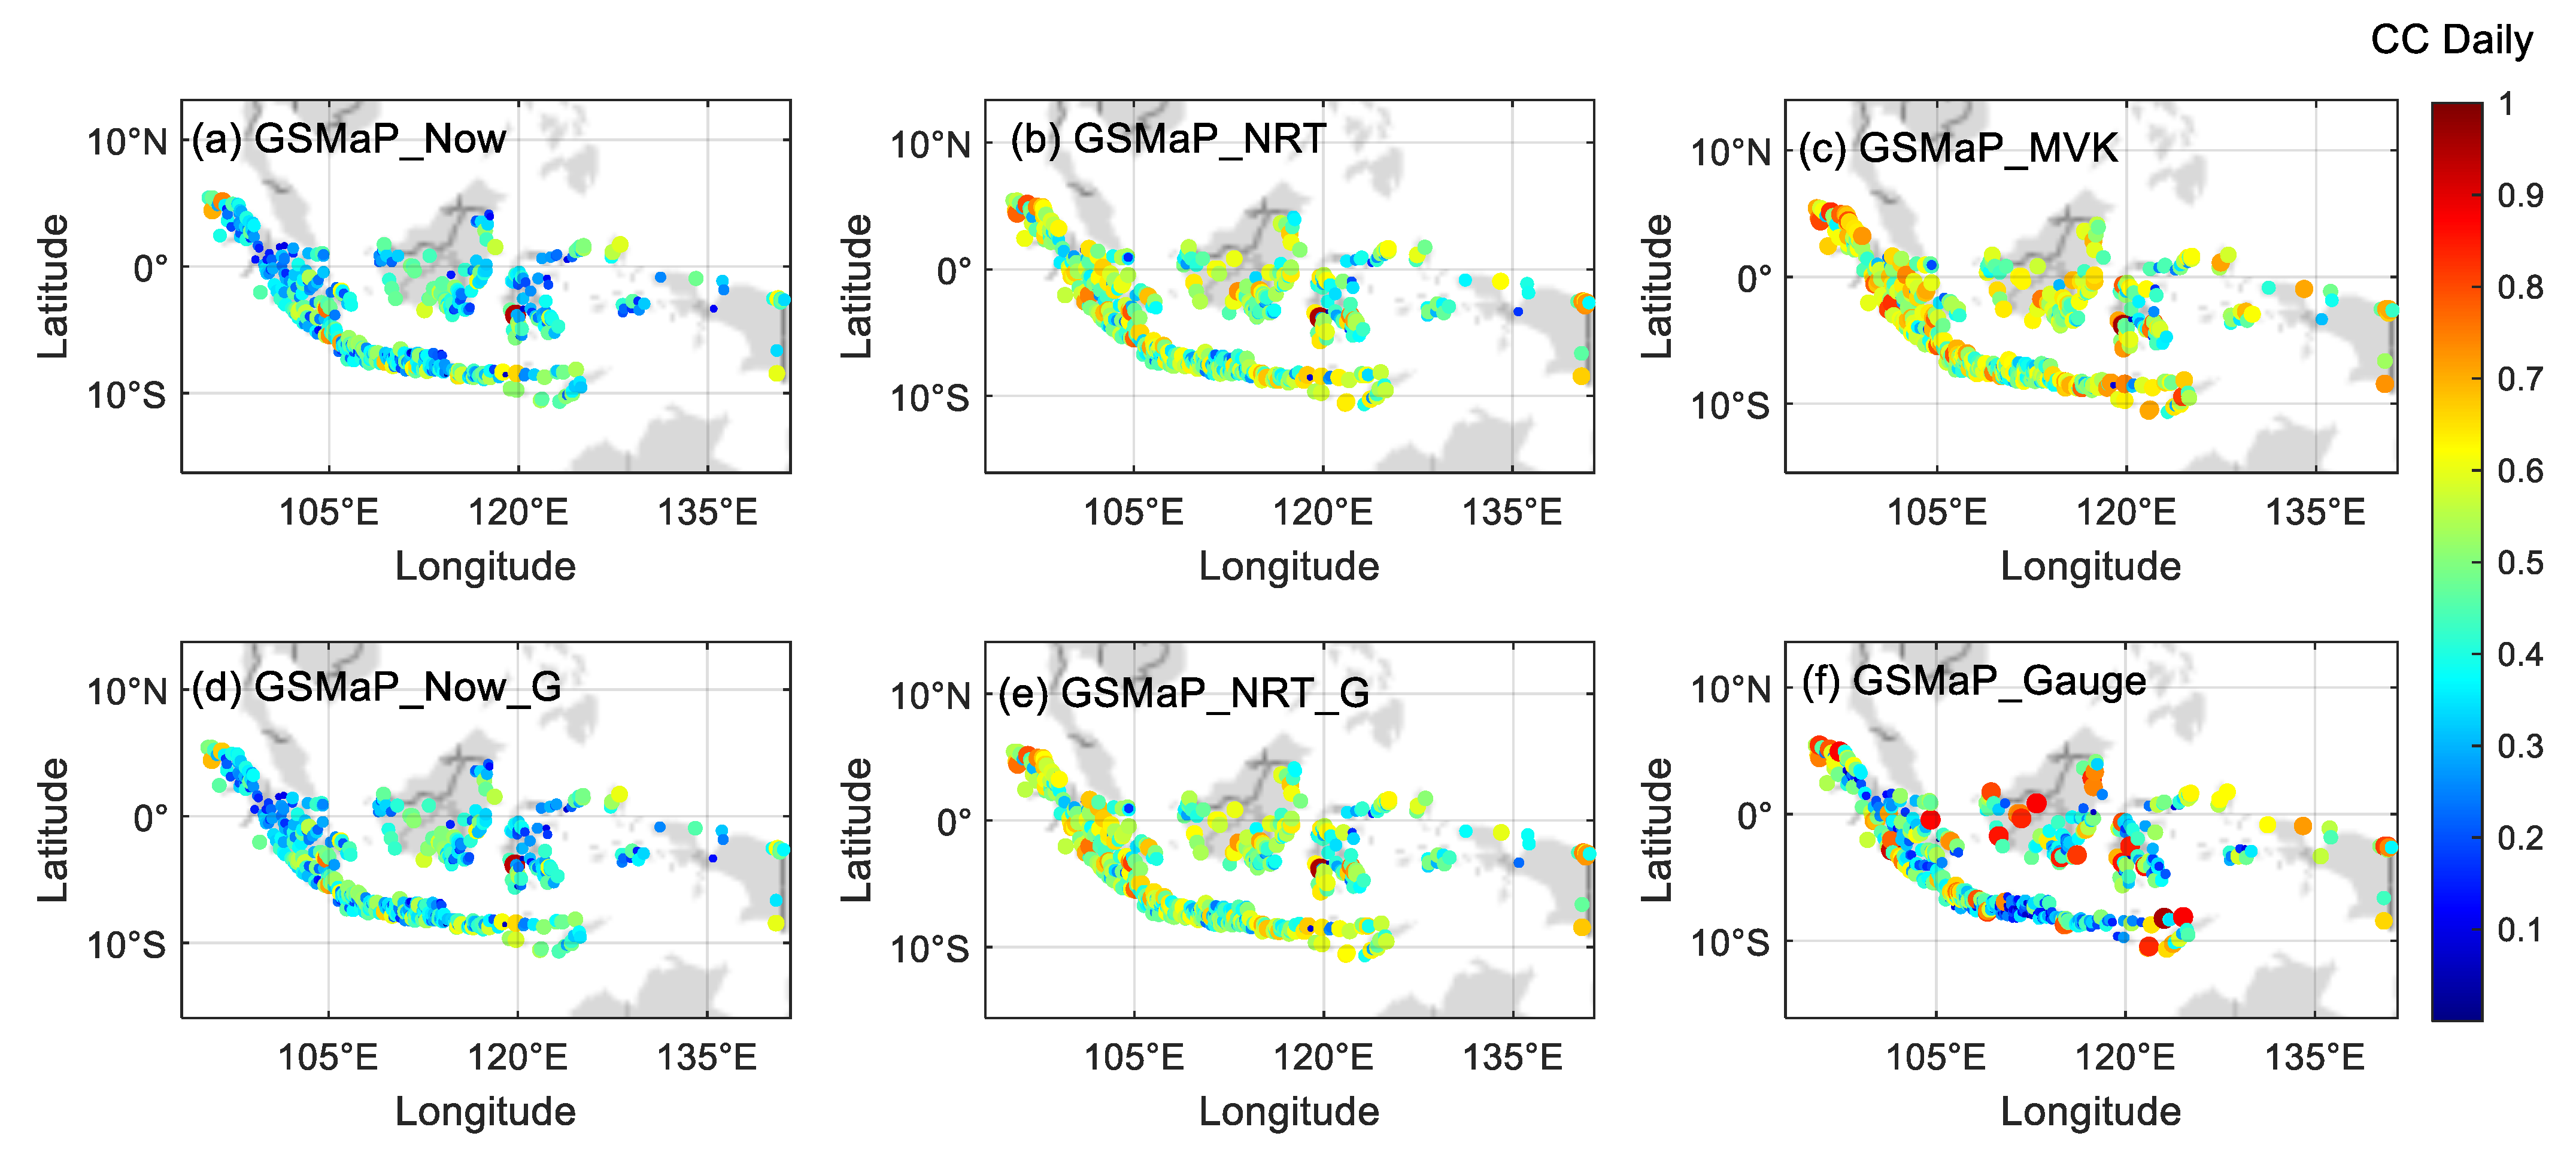
Figure 12 shows the spatial distribution of the CC values of the daily GSMaP against gauge data for the entire IMC region. The spatial distribution of CC values confirms the low CC values in the Sulawesi region, especially at stations located around mountainous areas (Figure 1). The low CC values in the mountains of Sulawesi are observed in GSMaP real-time data (Figure 12a,d) and near-real-time GSMaP (Figure 12b,e). Good CC values were observed in the northwestern part of Kalimantan. This is probably because the location is a flat surface area (Figure 1). In addition, the area was also not at the peak of the rainy season in this study period [62], so the contribution of extreme rain to the validation process was not dominant. The spatial distribution of CC values also shows low GSMaP_Gauge values concentrated in areas with complex topography, such as Sumatra, Sulawesi, and Java. Thus, there may be an overcorrection process in the GSMaP_Gauge data for the mountain area.
Several studies related to GSMaP data also found altitude dependence on the CC value [16,17,31]. On the other hand, GSMaP_Gauge data shows a slightly increased CC with increasing altitude. However, the increase in CC value from GSMaP_Gauge was followed by the largest increase in RMSE compared to other datum types. For RB values, all GSMaP data show a positive gradient (Figure 13). This shows that the higher the altitude, the GSMaP data increasingly overestimate the daily rainfall. Thus, it is highly recommended to perform bias correction of the daily GSMaP data before use, especially for mountainous areas [95,96,97,98]. Furthermore, the contrast was also observed in the POD. GSMaP real-time data show a negative gradient with a reasonably significant correlation (Table 9). The decrease in POD of real-time GSMaP data likely causes a decrease in the CC value of GSMaP real-time data concerning altitude. However, the FAR values of all GSMaP datum types show a negative gradient (Figure 13). The decrease in the FAR value, which is more dominant than the decrease in POD, causes a positive gradient of CSI for all GSMaP datum types (Figure 13). The highest correlation value of GSMaP data to altitude is observed in GSMaP_Gauge, which indicates a more stringent correction of the algorithm for determining orographic rainfall.

4. Discussion

In December 2021, GSMaP version 08, the latest version of GSMaP data, was released due to the GSMaP algorithm update. As a follow-up to this latest data release, preliminary assessments of GSMaP data have been conducted in the Indonesian Maritime Continent (IMC) region. The data accuracy of GSMaP version 08 (near-real-time and post-real-time) is also compared to GSMaP real-time products. The assessment results between GSMaP version 08 data and rain gauge showed a significant increase in the accuracy of GSMaP data with an increase in the time resolution used. CC values showed low correlation (0.23 < CC < 0.29) on the hourly scale, moderate correlation (0.39 < CC < 0.45) on the daily scale, and good correlation (0.73 < CC < 0.75) on the monthly scale. Increased accuracy with an increased time resolution of satellite data is commonly found in previous studies on evaluating precipitation data from satellite products [21,46,77,81,99,100,101,102]. This is associated with more complete reference data and less variability at longer temporal resolutions. Although the accuracy of GSMaP data at hourly and daily resolutions still needs to be improved, the accuracy of GSMaP version 08 data in the IMC region has shown an increase in CC values compared to previous versions [46,47,48,49,50,51,103]. In addition, GSMaP version 08 data show a significant increase in CC compared to GSMaP real-time data.
The CC value from GSMaP version 08 shows a stable value concerning elevation changes, although it is still slightly affected by complex topography. The effect of elevation is observed to be more pronounced on the value of the contingency statistical matrices (POD, FAR, and CSI) than the continuous statistical matrices (CC, RMSE, and RB). The strongest correlation between elevation and FAR values was observed, which showed a negative correlation. This shows a decrease in rain detection errors with increasing altitude. This is consistent with previous studies, which show that satellite rainfall data have the highest detectability and lowest errors at an altitude of 1000–3000 m ASL [104]. The effect of the altitude tested follows the location of the gauge used, namely <2.5 km, causing the FAR value of the GSMaP data to decrease with elevation. The same thing is also found in Bali, which shows the best performance of GSMaP at an altitude of 800–1200 m ASL [46]. On the other hand, topography conditions also affect the performance of GSMaP data. Complex topography conditions will cause a decrease in the performance of GSMaP data due to the weakness of the microwave sensor in estimating surface rainfall in complex topography [105]. Thus, the use of GSMaP data in complex topographical areas in the IMC, such as in mountainous areas on the large islands of the IMC, must be evaluated prior to use.
A significant increase in CC values is observed, especially in the GSMaP post-real-time data for hourly resolution, where ~38.6% of the grid shows moderate correlation. In the daily resolution data, an increase in the CC value is observed in the near-real-time and post-real-time data, where ~35.84% shows a good correlation. The good correlation value of the GSMaP version 08 data is followed by a tendency to overestimate precipitation (RB > 0) for all datum types. Such overestimation is caused by overestimating GSMaP data for rainfall of 1–10 mm/day. The overestimation tends to increase the error magnitude of the GSMaP data, as indicated by the high RMSE value, especially on an hourly scale. The high RMSE value is also caused by the tendency of GSMaP to overestimate rain with extreme intensities and frequencies, namely for intensities > 50 mm/day and greater than the 90th percentile. This overestimation is due to satellite observations’ limitations in spatial and temporal coverage [106,107]. GSMaP data derived from PMW sensor observations from the GPM constellation satellite and IR sensors on geostationary satellites are limited to various spatial resolutions and quite long temporal resolution, around 2–4 h [108]. Thus, the interpolation method from more coarse observation data into GSMaP hourly data often has errors, especially for nonuniform rain. Thus, rainfall estimation errors are often found in satellite data on light rain with a short duration or extreme rain with narrow coverage. Interestingly, we found that GSMaP version 08 data that were gauge-calibrated had a higher tendency to be overestimated compared to non-gauge-calibrated. The high overestimation of GSMaP calibrated gauge data indicates the need to evaluate the gauge adjustment algorithm for data interpolating and merged PMW–IR from satellites with CPC daily data from NOAA. One factor that needs to be considered is merging rainfall data at high elevations, where the dependence of the correlation value between RB and RMSE on elevation is more dominant for calibrated GSMaP gauge data (Table 5).
The ability of GSMaP version 08 to detect rain precisely still needs to be improved, as seen from the contingency matrix test. In general, the POD value of the GSMaP version 08 data is relatively good, ranging from 0.44–0.48 for hourly data and 0.71–0.81 for daily data. The POD value increases with the increase in GSMaP data latency and is better on calibrated gauges (GSMaP_Gauge > GSMaP_MVK > GSMaP_NRT_G > GSMaP_NRT > GSMaP_Now_G > GSMaP_Now). Significant differences were observed in GSMaP near-real-time and post-real-time data compared to GSMaP real-time data (p-value > 0.05). In addition, the difference between types of GSMaP version 08 is more significant in hourly GSMaP data than daily GSMaP data. However, it should be noted that the FAR value of calibrated gauge data is very high compared to non-gauge-calibrated GSMaP. The high FAR value in the calibrated gauge data is probably caused by the overcorrection of GSMaP data using CPC daily data with a coarser resolution (0.5° × 0.5°) than GSMaP resolution (0.1° × 0.1°). This can also be observed by comparing the daily CC values of the GSMaP grid data with different numbers of rain gauge stations (Figure 14). A significant difference in daily CC values (p-value < 0.05) between the grid with one gauge and more than one gauge was only observed in the GSMaP_Gague data. The CC values for other types are not significantly different (p-value > 0.05). This causes GSMaP_MVK data to be the best choice with the highest CSI value due to the best POD and low FAR. In addition, the GSMaP_MVK data also shows relatively stable parameter values for areas with high elevations and complex topographical conditions.
The use of GSMaP daily data in analyzing extreme rain has been compared with gauge observations at IMC. Good accuracy is obtained from observing frequency-based indices, especially for the R20mm and R50mm indices (0.69 < CC < 0.73). The highest CC values, followed by the lowest RMSE and RB values, were observed in GSMaP real-time data. Therefore, GSMaP nowcasting data show great potential for the early warning of hydrometeorological disasters caused by high-intensity rains such as floods and landslides. On the other hand, GSMaP data still need to be improved in terms of observing duration-based indices (CWD and CDD), as shown by the low CC value (0.14 < CC < 0.31). GSMaP data tend to overestimate the CWD value (RB > 0) and underestimate the CDD value (RB < 0). The limitations of SPP data in observing duration-based indices were also found in IMERG data at IMC [43,44]. In addition, low CC values on CWD and CDD observations by SPPs were also observed globally [109]. The low ability of SPP data in CWD and CDD observations is due to the high satellite error in estimating low-intensity rainfall (0.1–1 mm/day). GSMaP data shows an overestimated tendency for rain with an intensity of 0.1–1 mm/day at IMC, as shown in the PDF graph. The same was also found in the GSMaP data validation for the Malaysian region [110]. This condition causes GSMaP data to often incorrectly identify dry days as wet days and has an impact on overestimating (underestimating) the CWD (CDD) value. Furthermore, the GSMaP data show a moderate correlation in observing the RX1day index (0.34 < CC < 0.47). The best intensity-based index (RX1day) value estimation (high CC; low RMSE and RB) was observed in gauge-calibrated GSMaP compared to non-gauge-calibrated. This shows that bias correction is needed from satellite data with surface gauges for rain observations with very extreme intensities (>99 percentile).
GSMaP version 08 data are GPM-era satellite precipitation product (SPP) data, similar to IMERG data. Testing the accuracy of these two data has been conducted in various regions to compare the performance of the two data. This comparison can only be made if the two data have the same reference instrument and validation method. For this reason, we compared the performance of GSMaP data on IMC with IMERG data in our previous studies using the same instrument and method [43,44,69,111,112]. We found that the GSMaP version 08 data showed slightly better statistical test results with RG than IMERG version 06 data for the IMC region. Better CC values were obtained for both near-real-time data and post-real-time data between GSMaP and IMERG. A clear difference can be observed for GSMaP daily data, which is better than IMERG. This is because the GSMaP data calibration uses daily data from NOAA’s CPC daily while IMERG data uses monthly data from the GPCC [15,18,20]. Although the CC values from the GSMaP data are better, the RB and RMSE values from the GSMaP data tend to be higher than the IMERG data. Therefore, a correction bias is needed to minimize the RB and RMSE values from the GSMaP version 08 data before the data are used in IMC. In addition, the ability to identify rain shows that the difference is insignificant between the two data with POD, FAR, and CSI values that are almost the same. Thus, GSMaP version 08 data can be relied upon in various applications in hydrology and meteorology with a shorter latency than IMERG.
The correlation and ability of GSMaP, which is reliable enough to identify GSMaP hourly data, has the potential to be utilized in diurnal cycle analysis in IMC. A comparison of the peak times of PA, PF, and PI from each BMKG station and the nearest GSMaP grid show satisfactory results. The number of GSMaP grids showing conformity of the peak time (0–3 h) for PA and PF reaches 80%, while for PI, it reaches 50%. The number of grids with a corresponding peak time (0–3 h) increases with increasing GSMaP data latency. A significant increase in the number of grids with corresponding peak times was observed from real-time to near-real-time GSMaP data. On the other hand, post-real-time data are only slightly better in observing the peak time of PA, PF, and PI than near-real-time GSMaP data. This is consistent with the continuous and contingency matrix values of hourly near-real-time and post-real-time GSMap data, which are not significantly different. Thus, GSMaP near-real-time data can be an option in observing diurnal cycles with shorter latency than post-real-time data.
In addition to diurnal cycle observations, GSMaP data have the potential to be used in a variety of hydrological, meteorological, and climatological applications. In general, the performance of GSMaP data increases with increasing latency (post-real-time > near-real-time > real-time), which is associated with more complete satellite observation data in interpolation and merging. In addition, GSMaP ancillary data are also more complete for longer data latency. Thus, the GSMaP data type selection must be adjusted to the intended use of the data. GSMaP real-time and near-real-time data can be useful in monitoring and nowcasting water-related disasters such as flash floods, hurricanes, and landslides [113,114,115,116]. The error and uncertainty values of GSMaP real-time data are still very high. They need to be updated with near-real-time GSMaP data, which have better accuracy and detection capabilities in monitoring and nowcasting. Furthermore, near-real-time daily data of GSMaP, which are quite powerful, can be utilized in monitoring, forecasting, and mitigating extreme weather that triggers water-related disasters. Identifying extreme rain indexes can be used for indicators of floods, river overflows, bad weather, drought monitoring, and landslide potential [117,118,119,120]. In addition to disaster, near-real-time data from GSMaP version 08 can also be used in agriculture forecasting [121]. These near-real-time data can be updated with GSMaP post-real-time data, which have a latency of 3 days, to obtain more accurate forecasting results. Furthermore, post-real-time GSMaP version data are highly recommended in climatology and hydrology modeling studies [12].

5. Conclusions

The results show that the accuracy of GSMaP version 08 is adequate, especially for daily and monthly scales. On a daily scale, GSMaP version 08 data show a moderate coefficient correlation (CC), while on a monthly scale, they show a good correlation when evaluated using RG data. The CC value is quite good, followed by a fair RMSE value. GSMaP version 08 overestimated rainfall, which is indicated by the dominant positive RB value. In addition, on a daily scale, GSMaP’s can detect rain events well, as suggested by a high POD. However, sometimes there are false rain detection events indicated by the FAR value, which still has to be considered. On the other hand, the accuracy and precision of rain event detection for the hourly scale still need to be improved. The CC and CSI values of GSMaP version 08 data for the hourly scale are still relatively low. However, hourly GSMaP version 08 data can observe the diurnal rain pattern in the IMC, which is indicated by matching the peak times of precipitation accumulation (PA) and precipitation frequency (PF) with RG. The accuracy of GSMaP version 08 depends on rainfall intensity, topography, and data latency. The high FAR value of GSMaP data is caused by the overestimation of light rainfall (R < 1 mm/day). This condition also decreases the CC value and increases the RB and RMSE values. This impacts overestimating the CWD and R1mm index values and underestimating the CDD index. The dry day indication error has caused GSMaP’s lack of ability to analyze the CWD and CDD indices. However, GSMaP can still capture the distribution pattern of rainfall intensity, which is indicated by the suitability of the PDF and CDF patterns up to the high percentile. The ability of the GSMaP data to indicate high-intensity rain is proven by the success of the GSMaP data in obtaining the R10mm, R20mm, and R50mm indices. Nonetheless, a considerable bias is still observed in the RX1day index. The lower RX1day bias observed in the GSMaP gauge adjustment indicates the importance of bias correction for very extreme rainfall events (>99 percentile). Of all GSMaP version 08 datum types, we found that GSMaP_MVK data outperform other data. In addition, data with faster latency, such as near-real-time GSMaP data (GSMaP_NRT and GSMaP_NRT), also show quite good performance. However, the performance of real-time GSMaP data (GSMaP_Now and GSMaP_Now_G) is less than others. Thus, GSMaP near-real-time data can be used to monitor and forecast short-term rain events, and GSMaP_MVK can analyze rain characteristics. We achieve remarkable results where the performance of GSMaP_Gauge is not better than GSMaP_MVK, GSMaP_NRT, and GSMaP_NRT_G, which is due to the high FAR value of GSMaP_Gauge. Therefore, the GSMaP_Gauge version 08 data algorithm for the IMC region needs to be improved. The evaluation of GSMaP products presented here, although not the first one in the IMC, is the first for the latest version. In addition, this research is the first to involve hundreds of rain gauges spread across almost all islands of the IMC, representing Indonesia’s diverse geographical conditions. This study can be used by other researchers and developers involved in the GSMaP algorithm to introduce improvements in future versions. In addition, the results of this research will provide critical information for users of GSMaP data as a substitute for rain gauge data, which are very sparse in Indonesia. However, these preliminary results are solely based on seven months of data; further studies are needed when long data records are available.

Author Contributions

Conceptualization, R.R. and M.M.; methodology, M.M. and R.R.; software, R.R., H.Y. and M.M.; validation, M.M. and F.T.; formal analysis, R.R. and M.M.; investigation, R.R., M.M. and H.Y.; resources, M.M., R.R., H.Y. and R.M.; data curation, M.M., R.R., H.Y. and R.M.; writing—original draft preparation, R.R.; writing—review and editing, R.R., M.M., R.M., M.V., F.T. and H.H.; visualization, R.R. and H.Y.; supervision, M.M. and F.T.; project administration, H.Y.; funding acquisition, M.M. All authors have read and agreed to the published version of the manuscript.

Funding

This research was supported by Universitas Andalas under 2022 Riset Publikasi Bereputasi (RPB) grant (contract no: T/17/UN.16.17/PT.01.03/IS-RPB/2022) and Universiti Kebangsaan Malaysia Grant GUP-2019-035.

Data Availability Statement

All data used in this study are available upon request.

Acknowledgments

The authors would like to thank the Meteorology, Climatology, and Geophysics Agency (BMKG) for providing the rain gauge data for research purposes. We also thank the Japan Aerospace Exploration Agency (JAXA) for providing GSMaP data. The second author thank Universiti Kebangsaan Malaysia for funding his visit to UKM from 25–30 September 2022 to complete the work on this paper. We would like to express our very great appreciation to Takuji Kubota of Japan Aerospace Exploration Agency for his valuable discussion for this research work.

Conflicts of Interest

The authors declare no conflict of interest.

References

  1. Tan, M.L.; Ibrahim, A.L.; Duan, Z.; Cracknell, A.P.; Chaplot, V. Evaluation of Six High-Resolution Satellite and Ground-Based Precipitation Products over Malaysia. Remote Sens. 2015, 7, 1504–1528. [Google Scholar] [CrossRef] [Green Version]
  2. Satgé, F.; Ruelland, D.; Bonnet, M.P.; Molina, J.; Pillco, R. Consistency of Satellite-Based Precipitation Products in Space and over Time Compared with Gauge Observations and Snow- Hydrological Modelling in the Lake Titicaca Region. Hydrol. Earth Syst. Sci. 2019, 23, 595–619. [Google Scholar] [CrossRef] [Green Version]
  3. Tang, G.; Clark, M.P.; Papalexiou, S.M.; Ma, Z.; Hong, Y. Have Satellite Precipitation Products Improved over Last Two Decades? A Comprehensive Comparison of GPM IMERG with Nine Satellite and Reanalysis Datasets. Remote Sens. Environ. 2020, 240, 111697. [Google Scholar] [CrossRef]
  4. Sadeghi, M.; Nguyen, P.; Naeini, M.R.; Hsu, K.; Braithwaite, D.; Sorooshian, S. PERSIANN-CCS-CDR, a 3-Hourly 0.04° Global Precipitation Climate Data Record for Heavy Precipitation Studies. Sci. Data 2021, 8, 157. [Google Scholar] [CrossRef] [PubMed]
  5. Hsu, K.L.; Gao, X.; Sorooshian, S.; Gupta, H.V. Precipitation Estimation from Remotely Sensed Information Using Artificial Neural Networks. J. Appl. Meteorol. 1997, 36, 1176–1190. [Google Scholar] [CrossRef]
  6. Joyce, R.J.; Janowiak, J.E.; Arkin, P.A.; Xie, P. CMORPH: A Method That Produces Global Precipitation Estimates from Passive Microwave and Infrared Data at High Spatial and Temporal Resolution. J. Hydrometeorol. 2004, 5, 487–503. [Google Scholar] [CrossRef]
  7. Funk, C.; Peterson, P.; Landsfeld, M.; Pedreros, D.; Verdin, J.; Shukla, S.; Husak, G.; Rowland, J.; Harrison, L.; Hoell, A.; et al. The Climate Hazards Infrared Precipitation with Stations—A New Environmental Record for Monitoring Extremes. Sci. Data 2015, 2, 150066. [Google Scholar] [CrossRef] [Green Version]
  8. Massari, C.; Maggioni, V. Error and Uncertainty Characterization. In Advances in Global Change Research; Springer: Berlin/Heidelberg, Germany, 2020; Volume 69. [Google Scholar]
  9. Maggioni, V.; Massari, C. On the Performance of Satellite Precipitation Products in Riverine Flood Modeling: A Review. J. Hydrol. 2018, 558, 214–224. [Google Scholar] [CrossRef]
  10. Hur, J.; Raghavan, S.V.; Nguyen, N.S.; Liong, S.Y. Are Satellite Products Good Proxies for Gauge Precipitation over Singapore? Theor. Appl. Climatol. 2018, 132, 921–932. [Google Scholar] [CrossRef]
  11. Guilloteau, C.; Foufoula-Georgiou, E.; Kummerow, C.D. Global Multiscale Evaluation of Satellite Passive Microwave Retrieval of Precipitation during the TRMM and GPM Eras: Effective Resolution and Regional Diagnostics for Future Algorithm Development. J. Hydrometeorol. 2017, 18, 3051–3070. [Google Scholar] [CrossRef]
  12. Yuan, F.; Zhang, L.; Soe, K.M.W.; Ren, L.; Zhao, C.; Zhu, Y.; Jiang, S.; Liu, Y. Applications of TRMM- and GPM-Era Multiple- Satellite Precipitation Products for Flood Simulations at Sub-Daily Scales in a Sparsely Gauged Watershed in Myanmar. Remote Sens. 2019, 11, 140. [Google Scholar] [CrossRef] [Green Version]
  13. Tan, J.; Huffman, G.J.; Bolvin, D.T.; Nelkin, E.J. IMERG V06: Changes to the Morphing Algorithm. J. Atmos. Ocean. Technol. 2019, 36, 2471–2482. [Google Scholar] [CrossRef]
  14. Kubota, T.; Aonashi, K.; Ushio, T.; Shige, S.; Takayabu, Y.N.; Kachi, M.; Arai, Y.; Tashima, T.; Masaki, T.; Kawamoto, N.; et al. Global Satellite Mapping of Precipitation (GSMaP) Products in the GPM Era. In Advances in Global Change Research; Springer: Berlin/Heidelberg, Germany, 2020; Volume 67. [Google Scholar]
  15. Zhou, Z.; Guo, B.; Xing, W.; Zhou, J.; Xu, F.; Xu, Y. Comprehensive Evaluation of Latest GPM Era IMERG and GSMaP Precipitation Products over Mainland China. Atmos. Res. 2020, 246, 105132. [Google Scholar] [CrossRef]
  16. Wang, H.; Yong, B. Quasi-Global Evaluation of Imerg and Gsmap Precipitation Products over Land Using Gauge Observations. Water 2020, 12, 243. [Google Scholar] [CrossRef] [Green Version]
  17. Shi, J.; Yuan, F.; Shi, C.; Zhao, C.; Zhang, L.; Ren, L.; Zhu, Y.; Jiang, S.; Liu, Y. Statistical Evaluation of the Latest GPM-Era IMERG and GSMaP Satellite Precipitation Products in the Yellow River Source Region. Water 2020, 12, 1006. [Google Scholar] [CrossRef] [Green Version]
  18. Satgé, F.; Hussain, Y.; Bonnet, M.P.; Hussain, B.M.; Martinez-Carvajal, H.; Akhter, G.; Uagoda, R. Benefits of the Successive GPM Based Satellite Precipitation Estimates IMERG-V03, -V04, -V05 and GSMaP-V06, -V07 over Diverse Geomorphic and Meteorological Regions of Pakistan. Remote Sens. 2018, 10, 1373. [Google Scholar] [CrossRef] [Green Version]
  19. Salles, L.; Satgé, F.; Roig, H.; Almeida, T.; Olivetti, D.; Ferreira, W. Seasonal Effect on Spatial and Temporal Consistency of the New GPM-Based IMERG-v5 and GSMaP-v7 Satellite Precipitation Estimates in Brazil’s Central Plateau Region. Water 2019, 11, 668. [Google Scholar] [CrossRef] [Green Version]
  20. Ning, S.; Song, F.; Udmale, P.; Jin, J.; Thapa, B.R.; Ishidaira, H. Error Analysis and Evaluation of the Latest GSMap and IMERG Precipitation Products over Eastern China. Adv. Meteorol. 2017, 2017, 1803492. [Google Scholar] [CrossRef] [Green Version]
  21. Nepal, B.; Shrestha, D.; Sharma, S.; Shrestha, M.S.; Aryal, D.; Shrestha, N. Assessment of GPM-Era Satellite Products’ (IMERG and GSMaP) Ability to Detect Precipitation Extremes over Mountainous Country Nepal. Atmosphere 2021, 12, 254. [Google Scholar] [CrossRef]
  22. Lu, D.; Yong, B. Evaluation and Hydrological Utility of the Latest GPM IMERG V5 and GSMaP V7 Precipitation Products over the Tibetan Plateau. Remote Sens. 2018, 10, 2022. [Google Scholar] [CrossRef] [Green Version]
  23. Aslami, F.; Ghorbani, A.; Sobhani, B.; Esmali, A. Comprehensive Comparison of Daily IMERG and GSMaP Satellite Precipitation Products in Ardabil Province, Iran. Int. J. Remote Sens. 2019, 40, 3139–3153. [Google Scholar] [CrossRef]
  24. Wu, H.; Adler, R.F.; Tian, Y.; Huffman, G.J.; Li, H.; Wang, J. Real-Time Global Flood Estimation Using Satellite-Based Precipitation and a Coupled Land Surface and Routing Model. Water Resour. Res. 2014, 50, 2693–2717. [Google Scholar] [CrossRef] [Green Version]
  25. Yong, B.; Liu, D.; Gourley, J.J.; Tian, Y.; Huffman, G.J.; Ren, L.; Hong, Y. Global View of Real-Time Trmm Multisatellite Precipitation Analysis: Implications for Its Successor Global Precipitation Measurement Mission. Bull. Am. Meteorol. Soc. 2015, 96, 283–296. [Google Scholar] [CrossRef]
  26. Kidd, C.; Becker, A.; Huffman, G.J.; Muller, C.L.; Joe, P.; Skofronick-Jackson, G.; Kirschbaum, D.B. So, How Much of the Earth’s Surface Is Covered by Rain Gauges? Bull. Am. Meteorol. Soc. 2017, 98, 69–78. [Google Scholar] [CrossRef]
  27. Khatakho, R.; Talchabhadel, R.; Thapa, B.R. Evaluation of Different Precipitation Inputs on Streamflow Simulation in Himalayan River Basin. J. Hydrol. 2021, 599, 126390. [Google Scholar] [CrossRef]
  28. Su, J.; Li, X.; Ren, W.; Lü, H.; Zheng, D. How Reliable Are the Satellite-Based Precipitation Estimations in Guiding Hydrological Modelling in South China? J. Hydrol. 2021, 602, 126705. [Google Scholar] [CrossRef]
  29. Wang, Q.; Xia, J.; She, D.; Zhang, X.; Liu, J.; Zhang, Y. Assessment of Four Latest Long-Term Satellite-Based Precipitation Products in Capturing the Extreme Precipitation and Streamflow across a Humid Region of Southern China. Atmos. Res. 2021, 257, 105554. [Google Scholar] [CrossRef]
  30. Pradhan, R.K.; Markonis, Y.; Vargas Godoy, M.R.; Villalba-Pradas, A.; Andreadis, K.M.; Nikolopoulos, E.I.; Papalexiou, S.M.; Rahim, A.; Tapiador, F.J.; Hanel, M. Review of GPM IMERG Performance: A Global Perspective. Remote Sens. Environ. 2022, 268, 112754. [Google Scholar] [CrossRef]
  31. Zhou, Y.; Wang, S.; Fang, J. Diurnal Cycle and Dipolar Pattern of Precipitation over Borneo during an MJO Event: Lee Convergence and Offshore Propagation. J. Atmos. Sci. 2022, 79, 2145–2168. [Google Scholar] [CrossRef]
  32. Darand, M.; Fathi, H. Evaluation of High Resolution Global Satellite Precipitation Mapping during Meteorological Drought over Iran. Theor. Appl. Climatol. 2021, 145, 1421–1436. [Google Scholar] [CrossRef]
  33. Chua, Z.W.; Kuleshov, Y.; Watkins, A. Evaluation of Satellite Precipitation Estimates over Australia. Remote Sens. 2020, 12, 678. [Google Scholar] [CrossRef] [Green Version]
  34. Chua, Z.W.; Kuleshov, Y.; Watkins, A.B.; Choy, S.; Sun, C. A Two-Step Approach to Blending GSMaP Satellite Rainfall Estimates with Gauge Observations over Australia. Remote Sens. 2022, 14, 1903. [Google Scholar] [CrossRef]
  35. Wild, A.; Chua, Z.W.; Kuleshov, Y. Triple Collocation Analysis of Satellite Precipitation Estimates over Australia. Remote Sens. 2022, 14, 2724. [Google Scholar] [CrossRef]
  36. Roy, D.; Banu, S. Comparison of Satellite Derived Rainfall Estimations: CMORPH, IMERG and GSMaP with Observed Precipitation. Am. J. Clim. Chang. 2021, 10, 407–421. [Google Scholar] [CrossRef]
  37. Yamanaka, M.D. Physical Climatology of Indonesian Maritime Continent: An Outline to Comprehend Observational Studies. Atmos. Res. 2016, 178–179, 231–259. [Google Scholar] [CrossRef] [Green Version]
  38. Marzuki; Hashiguchi, H.; Yamamoto, M.K.; Yamamoto, M.; Mori, S.; Yamanaka, M.D.; Carbone, R.E.; Tuttle, J.D. Cloud Episode Propagation over the Indonesian Maritime Continent from 10years of Infrared Brightness Temperature Observations. Atmos. Res. 2013, 120–121, 268–286. [Google Scholar] [CrossRef]
  39. Supari; Tangang, F.; Juneng, L.; Aldrian, E. Observed Changes in Extreme Temperature and Precipitation over Indonesia. Int. J. Climatol. 2017, 37, 1979–1997. [Google Scholar] [CrossRef]
  40. Yoneyama, K.; Zhang, C. Years of the Maritime Continent. Geophys. Res. Lett. 2020, 47, e2020GL087182. [Google Scholar] [CrossRef]
  41. Harjupa, W.; Abdillah, M.R.; Azura, A.; Putranto, M.F.; Marzuki, M.; Nauval, F.; Risyanto; Saufina, E.; Jumianti, N.; Fathrio, I. On the Utilization of RDCA Method for Detecting and Predicting the Occurrence of Heavy Rainfall in Indonesia. Remote Sens. Appl. Soc. Environ. 2022, 25, 100681. [Google Scholar] [CrossRef]
  42. Badan Nasional Penanggulangan Bencana Dibi BNPB. Available online: https://dibi.bnpb.go.id/kbencana/index (accessed on 1 August 2022).
  43. Ramadhan, R.; Yusnaini, H.; Marzuki, M.; Muharsyah, R.; Suryanto, W.; Sholihun, S.; Vonnisa, M.; Harmadi, H.; Ningsih, A.P.; Battaglia, A.; et al. Evaluation of GPM IMERG Performance Using Gauge Data over Indonesian Maritime Continent at Different Time Scales. Remote Sens. 2022, 14, 1172. [Google Scholar] [CrossRef]
  44. Ramadhan, R.; Marzuki, M.; Yusnaini, H.; Muharsyah, R.; Suryanto, W.; Sholihun, S.; Vonnisa, M.; Battaglia, A.; Hashiguchi, H. Capability of GPM IMERG Products for Extreme Precipitation Analysis over the Indonesian Maritime Continent. Remote Sens. 2022, 14, 412. [Google Scholar] [CrossRef]
  45. Fatkhuroyan; TrinahWati. Accuracy Assessment of Global Satellite Mapping of Precipitation (GSMaP) Product over Indonesian Maritime Continent. IOP Conf. Ser. Earth Environ. Sci. 2018, 187, 012060. [Google Scholar] [CrossRef]
  46. Liu, C.-Y.; Aryastana, P.; Liu, G.-R.; Huang, W.-R. Assessment of Satellite Precipitation Product Estimates over Bali Island. Atmos. Res. 2020, 244, 105032. [Google Scholar] [CrossRef]
  47. Setiyoko, A.; Osawa, T.; Nuarsa, W. Evaluation of GSMaP Precipitation Estimates over Indonesia. Int. J. Environ. Geosci. 2019, 3, 26–43. [Google Scholar]
  48. Wati, T.; Hadi, T.W.; Sopaheluwakan, A.; Hutasoit, L.M. Statistics of the Performance of Gridded Precipitation Datasets in Indonesia. Adv. Meteorol. 2022, 2022, 7995761. [Google Scholar] [CrossRef]
  49. Sugiartha, N.; Ogawara, K.; Tanaka, T.; Mahendra, M.S. Application of GSMaP Product and Rain Gauge Data for Monitoring Rainfall Condition of Flood Events in Indonesia. Int. J. Environ. Geosci. 2017, 1, 36–47. [Google Scholar] [CrossRef]
  50. Tashima, T.; Kubota, T.; Mega, T.; Ushio, T.; Oki, R. Precipitation Extremes Monitoring Using the Near-Real-Time GSMaP Product. IEEE J. Sel. Top. Appl. Earth Obs. Remote Sens. 2020, 13, 5640–5651. [Google Scholar] [CrossRef]
  51. Priyambodoho, B.A.; Kure, S.; Yagi, R.; Januriyadi, N.F. Flood Inundation Simulations Based on GSMaP Satellite Rainfall Data in Jakarta, Indonesia. Prog. Earth Planet. Sci. 2021, 8, 34. [Google Scholar] [CrossRef]
  52. Kubota, T.; Aonashi, K.; Ushio, T.; Shige, S.; Yamaji, M. A New Version of Global Satellite Mapping of Precipitation (GSMaP) Product Released in December 2021. In Proceedings of the EGU General Assembly 2022, Vienna, Austria, 23–27 May 2022. [Google Scholar]
  53. Marzuki, M.; Suryanti, K.; Yusnaini, H.; Tangang, F.; Muharsyah, R.; Vonnisa, M.; Devianto, D. Diurnal Variation of Precipitation from the Perspectives of Precipitation Amount, Intensity and Duration over Sumatra from Rain Gauge Observations. Int. J. Climatol. 2021, 41, 4386–4397. [Google Scholar] [CrossRef]
  54. Marzuki, M.; Yusnaini, H.; Tangang, F.; Muharsyah, R.; Vonnisa, M.; Harmadi, H. Land—Sea Contrast of Diurnal Cycle Characteristics and Rain Event Propagations over Sumatra According to Different Rain Duration and Seasons. Atmos. Res. 2022, 270, 106051. [Google Scholar] [CrossRef]
  55. Nur’utami, M.N.; Hidayat, R. Influences of IOD and ENSO to Indonesian Rainfall Variability: Role of Atmosphere-Ocean Interaction in the Indo-Pacific Sector. Procedia Environ. Sci. 2016, 33, 196–203. [Google Scholar] [CrossRef] [Green Version]
  56. Kurniadi, A.; Weller, E.; Min, S.K.; Seong, M.G. Independent ENSO and IOD Impacts on Rainfall Extremes over Indonesia. Int. J. Climatol. 2021, 41, 3640–3656. [Google Scholar] [CrossRef]
  57. Zhang, C.; Ling, J. Barrier Effect of the Indo-Pacific Maritime Continent on the MJO: Perspectives from Tracking MJO Precipitation. J. Clim. 2017, 30, 3439–3459. [Google Scholar] [CrossRef]
  58. Pohl, B.; Camberlin, P. Intraseasonal and Interannual Zonal Circulations over the Equatorial Indian Ocean. Theor. Appl. Climatol. 2011, 104, 175–191. [Google Scholar] [CrossRef]
  59. Arushi, P.V.; Chakraborty, A.; Nanjundiah, R.S. Recent Weakening in MJO-Related Convective Activity over the Equatorial Indian Ocean and Maritime Continent. Theor. Appl. Climatol. 2021, 143, 267–278. [Google Scholar] [CrossRef]
  60. Zhang, T.; Yang, S.; Jiang, X.; Zhao, P. Seasonal-Interannual Variation and Prediction of Wet and Dry Season Rainfall over the Maritime Continent: Roles of ENSO and Monsoon Circulation. J. Clim. 2016, 29, 3675–3695. [Google Scholar] [CrossRef]
  61. Moron, V.; Robertson, A.W.; Boer, R. Spatial Coherence and Seasonal Predictability of Monsoon Onset over Indonesia. J. Clim. 2009, 22, 840–850. [Google Scholar] [CrossRef] [Green Version]
  62. Aldrian, E.; Dwi Susanto, R. Identification of Three Dominant Rainfall Regions within Indonesia and Their Relationship to Sea Surface Temperature. Int. J. Climatol. 2003, 23, 1435–1452. [Google Scholar] [CrossRef]
  63. JAXA GSMaP User Guide. Available online: https://sharaku.eorc.jaxa.jp/GSMaP/guide.html (accessed on 1 August 2022).
  64. Aonashi, K.; Liu, G. Passive Microwave Precipitation Retrievals Using TMI during Baiu Period of 1998. Part I: Algorithm Description and Validation. J. Appl. Meteorol. 2000, 39, 224–234. [Google Scholar] [CrossRef]
  65. Ushio, T.; Sasashige, K.; Kubota, T.; Shige, S.; Okamoto, K.; Aonashi, K.; Inoue, T.; Takahashi, N.; Iguchi, T.; Kachi, M.; et al. A Kalman Filter Approach to the Global Satellite Mapping of Precipitation (GSMaP) from Combined Passive Microwave and Infrared Radiometric Data. J. Meteorol. Soc. Jpn. 2009, 87A, 137–151. [Google Scholar] [CrossRef] [Green Version]
  66. Chen, M.; Shi, W.; Xie, P.; Silva, V.B.S.; Kousky, V.E.; Higgins, R.W.; Janowiak, J.E. Assessing Objective Techniques for Gauge-Based Analyses of Global Daily Precipitation. J. Geophys. Res. Atmos. 2008, 113, D04110. [Google Scholar] [CrossRef]
  67. Shawky, M.; Moussa, A.; Hassan, Q.K.; El-Sheimy, N. Performance Assessment of Sub-Daily and Daily Precipitation Estimates Derived from GPM and GSMaP Products over an Arid Environment. Remote Sens. 2019, 11, 2840. [Google Scholar] [CrossRef] [Green Version]
  68. ETCCDI. ETCCDI Climate Change Indices. Available online: http://etccdi.pacificclimate.org/list_27_indices.shtml (accessed on 1 August 2022).
  69. Ramadhan, R.; Marzuki, M.; Yusnaini, H.; Ningsih, A.P.; Hashiguchi, H.; Shimomai, T.; Vonnisa, M.; Ulfah, S.; Suryanto, W.; Sholihun, S. Ground Validation of GPM IMERG-F Precipitation Products with the Point Rain Gauge Records on the Extreme Rainfall over a Mountainous Area of Sumatra Island. J. Penelit. Pendidik. IPA 2022, 8, 163–170. [Google Scholar] [CrossRef]
  70. Tan, M.L.; Duan, Z. Assessment of GPM and TRMM Precipitation Products over Singapore. Remote Sens. 2017, 9, 720. [Google Scholar] [CrossRef] [Green Version]
  71. Spinoni, J.; Barbosa, P.; Bucchignani, E.; Cassano, J.; Cavazos, T.; Christensen, J.H.; Christensen, O.B.; Coppola, E.; Evans, J.; Geyer, B.; et al. Future Global Meteorological Drought Hot Spots: A Study Based on CORDEX Data. J. Clim. 2020, 33, 3635–3661. [Google Scholar] [CrossRef]
  72. Xu, C.Y.; Singh, V.P. A Review on Monthly Water Balance Models for Water Resources Investigations. Water Resour. Manag. 1998, 12, 20–50. [Google Scholar] [CrossRef]
  73. Hansen, J.W.; Ines, A.V.M. Stochastic Disaggregation of Monthly Rainfall Data for Crop Simulation Studies. Agric. For. Meteorol. 2005, 131, 233–246. [Google Scholar] [CrossRef]
  74. Garbrecht, J.D.; Zhang, X.C.; Schneider, J.M.; Steiner, J.L. Utility of Seasonal Climate Forecasts in Management of Winter-Wheat Grazing. Appl. Eng. Agric. 2010, 26, 855–866. [Google Scholar] [CrossRef]
  75. He, X.; Guan, H.; Zhang, X.; Simmons, C.T. A Wavelet-Based Multiple Linear Regression Model for Forecasting Monthly Rainfall. Int. J. Climatol. 2014, 34, 1898–1912. [Google Scholar] [CrossRef]
  76. Goyal, M.K. Monthly Rainfall Prediction Using Wavelet Regression and Neural Network: An Analysis of 1901–2002 Data, Assam, India. Theor. Appl. Climatol. 2014, 118, 25–34. [Google Scholar] [CrossRef]
  77. Li, D.; Min, X.; Xu, J.; Xue, J.; Shi, Z. Assessment of Three Gridded Satellite-Based Precipitation Products and Their Performance Variabilities during Typhoons over Zhejiang, Southeastern China. J. Hydrol. 2022, 610, 127985. [Google Scholar] [CrossRef]
  78. Shi, J.; Wang, B.; Wang, G.; Yuan, F.; Shi, C.; Zhou, X.; Zhang, L.; Zhao, C. Are the Latest GSMaP Satellite Precipitation Products Feasible for Daily and Hourly Discharge Simulations in the Yellow River Source Region? Remote Sens. 2021, 13, 4199. [Google Scholar] [CrossRef]
  79. Chen, H.; Yong, B.; Gourley, J.J.; Wen, D.; Qi, W.; Yang, K. A Novel Real-Time Error Adjustment Method with Considering Four Factors for Correcting Hourly Multi-Satellite Precipitation Estimates. IEEE Trans. Geosci. Remote Sens. 2022, 60, 4105211. [Google Scholar] [CrossRef]
  80. Tan, X.; Yong, B.; Ren, L. Error Features of the Hourly GSMaP Multi-Satellite Precipitation Estimates over Nine Major Basins of China. Hydrol. Res. 2018, 49, 761–779. [Google Scholar] [CrossRef] [Green Version]
  81. Kobayashi, Y.; Watanabe, F.; Suzuki, S.; Emmanuel, O.; Kanyike, T. Verification of Availability of GSMaP Rainfall Data Based on the Comparison of Observed Rainfall Data in Africa. J. Arid Land Stud. 2018, 28, 85–88. [Google Scholar]
  82. Shirmohammadi-Aliakbarkhani, Z.; Akbari, A. Ground Validation of Diurnal TRMM 3B42 V7 and GPM Precipitation Products over the Northeast of Iran. Theor. Appl. Climatol. 2020, 142, 1413–1423. [Google Scholar] [CrossRef]
  83. Tan, J.; Huffman, G.J.; Bolvin, D.T.; Nelkin, E.J. Diurnal Cycle of IMERG V06 Precipitation. Geophys. Res. Lett. 2019, 46, 13584–13592. [Google Scholar] [CrossRef]
  84. Ramadhan, R.; Marzuki, M.; Suryanto, W.; Sholihun, S.; Yusnaini, H.; Muharsyah, R.; Hanif, M. Trends in Rainfall and Hydrometeorological Disasters in New Capital City of Indonesia from Long-Term Satellite-Based Precipitation Products. Remote Sens. Appl. Soc. Environ. 2022, 28, 100827. [Google Scholar] [CrossRef]
  85. Su, J.; Lü, H.; Zhu, Y.; Wang, X.; Wei, G. Component Analysis of Errors in Four GPM-Based Precipitation Estimations over Mainland China. Remote Sens. 2018, 10, 1420. [Google Scholar] [CrossRef] [Green Version]
  86. Tang, S.; Li, R.; He, J.; Wang, H.; Fan, X.; Yao, S. Comparative Evaluation of the GPM IMERG Early, Late, and Final Hourly Precipitation Products Using the CMPA Data over Sichuan Basin of China. Water 2020, 12, 554. [Google Scholar] [CrossRef] [Green Version]
  87. Zeng, Q.; Wang, Y.; Chen, L.; Wang, Z.; Zhu, H.; Li, B. Inter-Comparison and Evaluation of Remote Sensing Precipitation Products over China from 2005 to 2013. Remote Sens. 2018, 10, 168. [Google Scholar] [CrossRef] [Green Version]
  88. An, Y.; Zhao, W.; Li, C.; Liu, Y. Evaluation of Six Satellite and Reanalysis Precipitation Products Using Gauge Observations over the Yellow River Basin, China. Atmosphere 2020, 11, 1223. [Google Scholar] [CrossRef]
  89. Wang, H.; Yuan, Y.; Zeng, S.; Li, W.; Tang, X. Evaluation of Satellite-Based Precipitation Products from GPM IMERG and GSMaP over the Three-River Headwaters Region, China. Hydrol. Res. 2021, 52, 1328–1343. [Google Scholar] [CrossRef]
  90. Gummadi, S.; Dinku, T.; Shirsath, P.B.; Kadiyala, M.D.M. Evaluation of Multiple Satellite Precipitation Products for Rainfed Maize Production Systems over Vietnam. Sci. Rep. 2022, 12, 485. [Google Scholar] [CrossRef]
  91. Trang, H.T.; Manomaiphiboon, K.; Singhrattna, N.; Assareh, N. Evaluation of Multiple Sub-Daily Satellite Precipitation Products for Thailand. J. Sustain. Energy Environ. 2020, 11, 81–91. [Google Scholar]
  92. Akrami, S.A.; El-Shafie, A.; Jaafar, O. Improving Rainfall Forecasting Efficiency Using Modified Adaptive Neuro-Fuzzy Inference System (MANFIS). Water Resour. Manag. 2013, 27, 3507–3523. [Google Scholar] [CrossRef]
  93. Behrangi, A.; Khakbaz, B.; Jaw, T.C.; AghaKouchak, A.; Hsu, K.; Sorooshian, S. Hydrologic Evaluation of Satellite Precipitation Products over a Mid-Size Basin. J. Hydrol. 2011, 397, 225–237. [Google Scholar] [CrossRef] [Green Version]
  94. Ma, Q.; Xiong, L.; Liu, D.; Xu, C.-Y.; Guo, S. Evaluating the Temporal Dynamics of Uncertainty Contribution from Satellite Precipitation Input in Rainfall-Runoff Modeling Using the Variance Decomposition Method. Remote Sens. 2018, 10, 1876. [Google Scholar] [CrossRef] [Green Version]
  95. Oliazadeh, A.; Bozorg-Haddad, O.; Pakdaman, M.; Baghbani, R.; Loáiciga, H.A. Optimal Merging of Multi-Satellite Precipitation Data in Urban Areas. Theor. Appl. Climatol. 2022, 147, 1697–1712. [Google Scholar] [CrossRef]
  96. Saber, M.; Yilmaz, K.K. Evaluation and Bias Correction of Satellite-Based Rainfall Estimates for Modelling Flash Floods over the Mediterranean Region: Application to Karpuz River Basin, Turkey. Water 2018, 10, 657. [Google Scholar] [CrossRef] [Green Version]
  97. Pereira, R.M.; Bufon, V.B.; Maia, F.C.O. Improving GSMaP V06 Precipitation Products over the Upper Tocantins River Basin in the Brazilian Cerrado, Based on Local Rain-Gauge Network. Theor. Appl. Climatol. 2022, 148, 1249–1260. [Google Scholar] [CrossRef]
  98. Iqbal, Z.; Shahid, S.; Ahmed, K.; Wang, X.; Ismail, T.; Gabriel, H.F. Bias Correction Method of High-Resolution Satellite-Based Precipitation Product for Peninsular Malaysia. Theor. Appl. Climatol. 2022, 148, 1429–1446. [Google Scholar] [CrossRef]
  99. Chen, H.; Yong, B.; Shen, Y.; Liu, J.; Hong, Y.; Zhang, J. Comparison Analysis of Six Purely Satellite-Derived Global Precipitation Estimates. J. Hydrol. 2020, 581, 124376. [Google Scholar] [CrossRef]
  100. Gao, Z.; Huang, B.; Ma, Z.; Chen, X.; Qiu, J.; Liu, D. Comprehensive Comparisons of State-of-the-Art Gridded Precipitation Estimates for Hydrological Applications over Southern China. Remote Sens. 2020, 12, 3997. [Google Scholar] [CrossRef]
  101. Lu, X.; Tang, G.; Wei, M.; Yang, L.; Zhang, Y. Evaluation of Multi-Satellite Precipitation Products in Xinjiang, China. Int. J. Remote Sens. 2018, 39, 7437–7462. [Google Scholar] [CrossRef]
  102. Zhang, L.; Chen, X.; Lai, R.; Zhu, Z. Performance of Satellite-Based and Reanalysis Precipitation Products under Multi-Temporal Scales and Extreme Weather in Mainland China. J. Hydrol. 2022, 605, 127389. [Google Scholar] [CrossRef]
  103. Fatkhuroyan, F.; Wati, T.; Sukmana, A.; Kurniawan, R. Validation of Satellite Daily Rainfall Estimates over Indonesia. Forum Geogr. 2018, 32, 170–180. [Google Scholar] [CrossRef] [Green Version]
  104. Kumar, M.; Hodnebrog, Ø.; Daloz, A.S.; Sen, S.; Badiger, S.; Krishnaswamy, J. Measuring Precipitation in Eastern Himalaya: Ground Validation of Eleven Satellite, Model and Gauge Interpolated Gridded Products. J. Hydrol. 2021, 599, 126252. [Google Scholar] [CrossRef]
  105. El Kenawy, A.M.; Lopez-Moreno, J.I.; McCabe, M.F.; Vicente-Serrano, S.M. Evaluation of the TMPA-3B42 Precipitation Product Using a High-Density Rain Gauge Network over Complex Terrain in Northeastern Iberia. Glob. Planet. Chang. 2015, 133, 188–200. [Google Scholar] [CrossRef] [Green Version]
  106. Watters, D.; Battaglia, A. The NASA-JAXA Global Precipitation Measurement Mission–Part II: New Frontiers in Precipitation Science. Weather 2021, 76, 52–56. [Google Scholar] [CrossRef]
  107. Watters, D.; Battaglia, A. The NASA-JAXA Global Precipitation Measurement Mission–Part I: New Frontiers in Precipitation. Weather 2021, 76, 41–44. [Google Scholar] [CrossRef]
  108. Battaglia, A.; Kollias, P.; Dhillon, R.; Roy, R.; Tanelli, S.; Lamer, K.; Grecu, M.; Lebsock, M.; Watters, D.; Mroz, K. Spaceborne Cloud and Precipitation Radars: Status, Challenges, and Ways Forward. Rev. Geophys. 2020, 58, e2019RG000686. [Google Scholar] [CrossRef]
  109. Alexander, L.V.; Bador, M.; Roca, R.; Contractor, S.; Donat, M.G.; Nguyen, P.L. Intercomparison of Annual Precipitation Indices and Extremes over Global Land Areas from in Situ, Space-Based and Reanalysis Products. Environ. Res. Lett. 2020, 15, 55002. [Google Scholar] [CrossRef]
  110. Ayoub, A.B.; Tangang, F.; Juneng, L.; Tan, M.L.; Chung, J.X. Evaluation of Gridded Precipitation Datasets in Malaysia. Remote Sens. 2020, 12, 613. [Google Scholar] [CrossRef] [Green Version]
  111. Ramadhan, R.; Muharsyah, R.; Yusnaini, H.; Vonnisa, M.; Hashiguchi, H.; Suryanto, W. Evaluation of GPM IMERG Products for Extreme Precipitation over Indonesia. J. Phys. Conf. Ser. 2022, 2309, 12008. [Google Scholar] [CrossRef]
  112. Yusnaini, H.; Ramadhan, R.; Marzuki, M.; Ningsih, A.P.; Hashiguchi, H.; Shimomai, T.; Vonnisa, M.; Harmadi, H.; Suryanto, W.; Sholihun, S. Statistical Comparison of IMERG Precipitation Products with Optical Rain Gauge Observations over Kototabang, Indonesia. J. Ilmu Fiska Univ. Andalas 2022, 14, 10–20. [Google Scholar] [CrossRef]
  113. Ma, M.; Wang, H.; Jia, P.; Tang, G.; Wang, D.; Ma, Z.; Yan, H. Application of the GPM-IMERG Products in Flash Flood Warning: A Case Study in Yunnan, China. Remote Sens. 2020, 12, 1954. [Google Scholar] [CrossRef]
  114. Kim, T.; Yang, T.; Zhang, L.; Hong, Y. Near Real-Time Hurricane Rainfall Forecasting Using Convolutional Neural Network Models with Integrated Multi-SatellitE Retrievals for GPM (IMERG) Product. Atmos. Res. 2022, 270, 106037. [Google Scholar] [CrossRef]
  115. Hong, Y.; Adler, R.E.; Huffman, G.J. Satellite Remote Sensing for Global Landslide Monitoring. Eos Trans. Am. Geophys. Union 2007, 88, 357–358. [Google Scholar] [CrossRef] [Green Version]
  116. Hong, Y.; Adler, R.F.; Negri, A.; Huffman, G.J. Flood and Landslide Applications of near Real-Time Satellite Rainfall Products. Nat. Hazards 2007, 43, 285–294. [Google Scholar] [CrossRef] [Green Version]
  117. Hong, Y.; Adler, R.F.; Huffman, G. An Experimental Global Prediction System for Rainfall-Triggered Landslides Using Satellite Remote Sensing and Geospatial Datasets. IEEE Trans. Geosci. Remote Sens. 2007, 45, 1671–1680. [Google Scholar] [CrossRef]
  118. Yang, H.; Adler, R.F. Predicting Global Landslide Spatiotemporal Distribution: Integrating Landslide Susceptibility Zoning Techniques and Real-Time Satellite Rainfall Estimates. Int. J. Sediment Res. 2008, 23, 249–257. [Google Scholar]
  119. Vernimmen, R.R.E.; Hooijer, A.; Aldrian, E.; Van Dijk, A. Evaluation and Bias Correction of Satellite Rainfall Data for Drought Monitoring in Indonesia. Hydrol. Earth Syst. Sci. 2012, 16, 133–146. [Google Scholar] [CrossRef] [Green Version]
  120. Chen, C.-Y.; Chen, T.-C.; Yu, F.-C.; Yu, W.-H.; Tseng, C.-C. Rainfall Duration and Debris-Flow Initiated Studies for Real-Time Monitoring. Environ. Geol. 2005, 47, 715–724. [Google Scholar] [CrossRef]
  121. Hansen, J.W.; Challinor, A.; Ines, A.; Wheeler, T.; Moron, V. Translating Climate Forecasts into Agricultural Terms: Advances and Challenges. Clim. Res. 2006, 33, 27–41. [Google Scholar] [CrossRef]
Figure 1. Distribution of rain gauge used to evaluate the GSMaP data. The elevation map uses NOAA’s ETOPO1 data.
Remotesensing 15 01115 g001
Figure 2. Boxplot of CC (a), RMSE (b), RB (c), POD (d), FAR (e), and CSI (f) for hourly GSMaP data for all RG’s stations.
Remotesensing 15 01115 g002
Figure 3. Time series of hourly (top) and daily (below) data of GSMaP and RG data for ID station of 150283. The location of station is given in the plot title.
Remotesensing 15 01115 g003
Figure 4. Peak time of PA (left column), PF (Center column), and PI (right column) for GSMaP_Now (ac), GSMaP_Now_G (df), GSMaP_NRT (gi), GSMaP_NRT_G (jl), GSMaP_MVK (mo), and GSMaP_Gauge (pr).
Remotesensing 15 01115 g004
Figure 5. An example of the difference in the observed rainfall peaks from the GSMaP product and the rain gauge for PA (a,b), PF (c,d), and PI (e,f) with two rain peaks, at two observation stations.
Remotesensing 15 01115 g005
Figure 6. The percentage of stations for several categories of difference in peak time of PA (a), PF (b), and PI (c) from GSMaP and RG.
Remotesensing 15 01115 g006
Figure 7. Scatterplot for daily data of GSMaP_Now (a), GSMaP_NRT (b), GSMaP_MVK (c), GSMaP_Now_G (d), GSMaP_NRT_G (e), and GSMaP_Gauge (f) against RG observations.
Remotesensing 15 01115 g007
Figure 8. Boxplot of CC (a), RMSE (b), RB (c), POD (d), FAR (e), and CSI (f) for hourly GSMaP data for all RG’s stations.
Remotesensing 15 01115 g008
Figure 9. CDF (a) and PDF (b) for daily data of GSMaP and RG.
Remotesensing 15 01115 g009
Figure 10. Scatterplot for monthly data of GSMaP_Now (a), GSMaP_NRT (b), GSMaP_MVK (c), GSMaP_Now_G (d), GSMaP_NRT_G (e), and GSMaP_Gauge (f) against RG observations.
Remotesensing 15 01115 g010
Figure 11. Percentage of grid numbers for the five altitude categories for each island.
Remotesensing 15 01115 g011
Figure 12. Spatial distribution of CC values for GSMaP_Now (a), GSMaP_NRT (b), GSMaP_MVK (c), GSMaP_Now_G (d), GSMaP_NRT_G (e), and (f) GSMaP_Gauge daily data against gauge data over IMC.
Remotesensing 15 01115 g012
Figure 13. Linear fitting of daily CC (a), RMSE (b), RB (c), POD (d), FAR (e), and CSI (f) with altitude. Statistical parameters created in data intervals per 50 ASL.
Remotesensing 15 01115 g013
Figure 14. Boxplot of CC for daily data of grid with one (a) and more than one rain gauge (b) in the GSMaP grid.
Remotesensing 15 01115 g014
Table 1. Summary of GSMaP type used in this study.
NameAbbrevationLatencyResolution
GSMaP real-time versionGSMaP_Now0 h0.1° hourly (updated every 30 min)
GSMaP real-time version gauge-calibratedGSMaP_Now_G0 h0.1° hourly (updated every 30 min)
GSMaP near-real time GSMaP_NRT4 h0.1° hourly
GSMaP near-real time gauge-calibratedGSMaP_NRT_G4 h0.1° hourly
GSMaP mapping of precipitation microwave–IR combined productGSMaP_MVK3-day0.1° hourly
GSMaP mapping of precipitation microwave–IR combined product gauge-calibratedGSMaP_Gauge3-day0.1° hourly
Table 2. The number of stations in the GSMaP grid.
Station per GridNumber of Grid
1532
241
311
42
Total 586
Table 3. Contingency table comparing precipitation detection by GSMaP data (Si) and gauge observation (Gi).
Gi ≥ ThresholdGi < Threshold
Si ≥ thresholdHit (H)False (F)
Si < thresholdMisses (M)Correct negatives (Z)
Table 4. List of the selected extreme indices from ETCCDI used in this study.
IndexDefinitionUnit
R1mmNumber of days when precipitation ≥ 1 mmdays
R10mmNumber of days when precipitation ≥ 10 mmdays
R20mmNumber of days when precipitation ≥ 20 mmdays
R50mmNumber of days when precipitation ≥ 50 mmdays
CWDNumber of consecutive wet days (precipitation ≥ 1 mm)days
CDDNumber of consecutive dry days (precipitation ≤ 1 mm)days
RX1dayMaximum of daily rainfallmm/day
Table 5. The mean of validation data matrix for hourly data for all stations.
GSMaP TypeCCRMSERBPODFARCSI
GSMaP_Now0.140.080.120.440.600.21
GSMaP_Now_G0.140.080.200.490.710.19
GSMaP_NRT0.230.110.380.490.620.28
GSMaP_NRT_G0.240.140.550.520.750.28
GSMaP_MVK0.290.090.260.590.600.30
GSMaP_Gauge0.260.120.490.780.810.18
Table 6. The mean of validation data matrix for daily data for all stations.
GSMaP TypeCCRMSERBPODFARCSI
GSMaP_Now0.341.860.140.710.380.49
GSMaP_Now_G0.341.870.200.760.410.50
GSMaP_NRT0.442.420.410.780.330.56
GSMaP_NRT_G0.453.140.570.800.350.56
GSMaP_MVK0.501.870.260.810.330.57
GSMaP_Gauge0.363.120.510.810.370.54
Table 7. The continuous statistical metrics for several extreme indices from GSMaP data.
R1mmR10mmmR20mmR50mmCWDCDDRX1day
CC
GSMaP_Now0.500.640.710.730.180.160.38
GSMaP_Now_G0.540.680.720.710.190.160.41
GSMaP_NRT0.540.660.720.710.310.190.37
GSMaP_NRT_G0.540.670.730.710.310.160.47
GSMaP_MVK0.550.670.720.720.290.200.34
GSMaP_Gauge0.440.640.710.690.200.140.40
RMSE
GSMaP_Now12.602.101.491.220.654.7465.37
GSMaP_Now_G22.150.410.111.355.025.3855.35
GSMaP_NRT16.647.105.183.220.834.9768.77
GSMaP_NRT_G20.0211.968.964.591.415.4171.42
GSMaP_MVK17.943.382.312.431.585.0650.68
GSMaP_Gauge24.7614.558.742.873.216.2132.24
RB
GSMaP_Now0.14−0.05−0.080.450.07−0.341.03
GSMaP_Now_G0.240.01−0.010.500.51−0.390.87
GSMaP_NRT0.180.180.281.200.08−0.361.08
GSMaP_NRT_G0.220.310.481.710.14−0.391.12
GSMaP_MVK0.200.090.120.910.16−0.370.80
GSMaP_Gauge0.270.380.471.070.33−0.450.51
Table 8. Daily data statistical test for several Indonesian regions.
LocationParameterGSMaP_NowGSMaP_Now_GGSMaP_
NRT
GSMaP_
NRT_G
GSMaP_
MVK
GSMaP_GaugeAverage
SumatraCC0.290.310.430.460.470.360.39
(159 grid)RMSE0.410.691.592.370.962.391.4
RB0.080.140.320.470.190.470.28
POD0.690.720.780.790.800.760.76
FAR0.410.430.370.380.360.390.39
CSI0.460.470.540.530.550.510.51
JavaCC0.310.350.410.430.470.400.39
(191 grid)RMSE1.301.213.984.513.103.292.90
RB0.180.170.540.620.420.450.40
POD0.770.800.820.830.840.840.82
FAR0.360.370.330.330.330.380.35
CSI0.540.540.580.580.600.550.57
Bali and CC0.280.310.350.370.420.380.35
Nusa RMSE1.220.120.140.770.761.900.82
TenggaraRB−0.25−0.02−0.030.16−0.150.380.01
(60 grid)POD0.590.710.670.690.680.760.68
FAR0.370.430.340.350.330.400.37
CSI0.440.460.500.500.510.500.49
BorneoCC0.370.400.480.500.510.480.46
(77 grid)RMSE0.631.621.723.740.652.851.87
RB0.110.280.300.650.110.500.33
POD0.740.790.810.830.830.850.81
FAR0.380.400.320.340.310.330.35
CSI0.510.520.590.580.600.600.57
SulawesiCC0.240.240.310.320.330.270.28
(64 grid)RMSE0.060.881.302.821.042.931.51
RB0.010.160.240.510.190.530.27
POD0.680.710.740.760.760.810.74
FAR0.420.430.380.390.370.410.40
CSI0.450.460.510.510.530.520.50
Molucca and CC0.300.310.420.440.480.470.40
New GuineaRMSE2.32.373.854.812.893.463.28
(18 grid)RB0.450.460.750.930.560.670.64
POD0.700.710.740.760.760.770.74
FAR0.300.310.270.280.270.280.29
CSI0.540.540.580.580.600.590.57
Table 9. Statistical parameter correlation value to altitude.
ParameterGSMaP_NowGSMaP_Now_GGSMaP_NRTGSMaP_NRT_GGSMaP_MVKGSMaP_Gauge
CC−0.20−0.200.02−0.03−0.050.14
RMSE−0.06−0.02−0.19−0.21−0.050.28
RB0.180.300.090.140.130.42
POD−0.31−0.290.080.02−0.060.14
FAR−0.35−0.29−0.27−0.24−0.29−0.36
CSI0.160.150.330.260.260.39
Disclaimer/Publisher’s Note: The statements, opinions and data contained in all publications are solely those of the individual author(s) and contributor(s) and not of MDPI and/or the editor(s). MDPI and/or the editor(s) disclaim responsibility for any injury to people or property resulting from any ideas, methods, instructions or products referred to in the content.

