

Estimation of Perceived Temperature of Road Workers Using Radiation and Meteorological Observation Data

Research Center for Atmospheric Environment, Hankuk University of Foreign Studies, Yongin-si 17035, Gyeonggi-do, Republic of Korea
*
Author to whom correspondence should be addressed.
Remote Sens. 2023, 15(4), 1065; https://doi.org/10.3390/rs15041065
Submission received: 25 November 2022
/
Revised: 13 February 2023
/
Accepted: 13 February 2023
/
Published: 15 February 2023
(This article belongs to the Special Issue New Challenges in Solar Radiation, Modeling and Remote Sensing)
Abstract
:During summer heat waves, road workers are easily exposed to heat stress and faced with a high risk of thermal diseases and death, and thus preventive measures are required for their safety at the work site. To prepare response measures, it is necessary to estimate workers’ perceived temperature (PT) according to exposure time, road environment, clothing type, and work intensity. This study aimed to examine radiation (short-wave radiation and long-wave radiation) and other meteorological factors (temperature, humidity, and wind) in an actual highway work environment in summer and to estimate PT using the observation data. Analysis of radiation and meteorological factors on the road according to pavement type and weather revealed that more heat was released from asphalt than from concrete. Regression model analysis indicated that compared with young workers (aged 25–30 years), older workers (aged ≥ 60 years) showed a rapid increase in PT as the temperature increased. The temperatures that people actually feel on concrete and asphalt roads in heat wave conditions can be predicted using the PT values calculated by the regression models. Our findings can serve as a basis for measures to prevent workers from thermal diseases at actual road work sites.
1. Introduction
Disaster risk due to heat waves is rising owing to the intensifying impact of abnormal weather caused by climate change [1]. Among natural disasters, heat waves are meteorological disasters that cause the most damage to human life [2]. They are widespread and long lasting, so their impacts are likely to be compounded with other disasters. A heat wave refers to extreme heat. The meteorological factor most commonly used to define heat waves is the daily maximum temperature; however, numerical standards vary between countries, and most countries include the persistence of high temperatures. The U.S. and Australian meteorological administrations define a heat wave as a situation in which abnormally high temperatures persist [3,4]. The U.K. uses different thresholds for different regions to reflect regional climates [5]. South Korea used the daily maximum temperature as the standard until 2020 when it was changed to the daily maximum heat index, which reflects the temperature and humidity [6].
Heat-related illnesses occur every year due to heat waves [7]. Most outdoor workers spend their working hours in the hot sun in summer owing to the nature of their job. In May 2015, India recorded a heat wave exceeding 50 °C that caused more than 2000 deaths [8], which mostly comprised workers who had to work outdoors for a living and the elderly, with construction workers being the majority [9]. Heat-wave-caused deaths mostly occur outdoors, such as on roads (e.g., driveways and streets) and in paddies, fields, and polytunnels, and exposure to heat waves can threaten health even without underlying diseases [10]. Further, during summer heat waves, as outdoor workers directly receive radiation heat flux from the sun, they are easily exposed to heat stress and show a high risk of thermal diseases and death [11,12]. Therefore, thermal diseases and even deaths occur at the work sites of outdoor workers owing to heat waves [13]. Workers who have to work outdoors during periods of high temperature may be in a more dangerous situation owing to excessive workload along with the need to wear protective clothing [14]. This not only increases the possibility of various diseases but also leads to a decrease in labor productivity and efficiency as well as an increase in occupational accidents, which can cause serious social problems [15,16].
Therefore, measures to prevent heat wave disasters are required so that road workers can work safely. It is necessary to prepare response measures by estimating the temperature perceived (PT) by the workers based on the exposure time, road environment, clothing type, and work intensity. Countries announce heat wave warnings and establish staged risk response systems. Most countries use the daily maximum temperature and various indicators are used as the standard indicators of heat wave warnings including the heat index, Wet-Bulb Globe Temperature (WBGT) Index, PT, and humidex. The U.S. has developed a heat index that quantifies the heat felt by humans considering temperature and humidity and established a four-level heat wave warning system consisting of caution, extreme caution, danger, and extreme danger [17]. Japan has provided WBGT information as a numerical value to determine heat stroke risk [18,19]. WBGT uses temperature, humidity, wind, solar radiation, and other weather parameters, and is known to be a particularly effective heat stress indicator for active people such as outdoor workers and athletes [20]. Every country differs because the adaptability and scope vary with their individual environments, such as regional and social characteristics [21]. In the majority of countries, the daily maximum temperature is most frequently used as the heat wave index in heat wave warning systems. However, thermal comfort is related to not only temperature but also meteorological factors such as wind speed, radiation, and humidity, and is also influenced by physiological responses and interactions with the physical environment [22]. Many researchers have stressed the need for human heat budget models to provide human biometeorological properties, for which they have proposed using WGBT, thermal work limit (TWL), predicted mean vote (PMV), and PT for heat wave indexes.
The German Meteorological Service provides heat wave warnings using PT based on the Klima–Michel model (KMM), a human heat budget model [23,24]. PT indicates the temperature of a standard environment that the body actually feels considering its thermal equilibrium. It is expressed by calculating the heat felt by the body through the thermal comfort equation and considers not only meteorological factors but also the insulation effect of clothing and the body’s standard metabolism. Korea’s National Institute of Meteorological Sciences (NIMS) conducted a study employing a PT model to evaluate summer heat stress on the hot and humid Korean peninsula through Korea–Germany meteorological cooperation [25]. NIMS also analyzed the relationship between PT and heat-related diseases based on the region, and the results were used to identify areas that are vulnerable to thermal stress [26]. In addition, a thermal stress quantification experiment was conducted based on the temperature conditions experienced by Korean adult men to investigate the effect of thermal response and age through heat exposure. Based on this, the Korean standard PT thermal comfort zone was adjusted, and the precautions required for thermal stress work were proposed. The PT model was originally calculated based on the German human body standard and was adjusted to the Korean standard PT thermal comfort zone [27,28]. The NIMS has thus developed a Korean heat wave health effect forecasting support system and is using PT. During summer heat waves, it is necessary to use PT as a preventive measure for heat wave disasters for outdoor workers rather than indoor workers. Particularly for workers in a highway environment, which is covered with concrete and asphalt and has no nearby shade, it is necessary to prepare response measures by estimating their PT according to the exposure time, road environment, and clothing type.
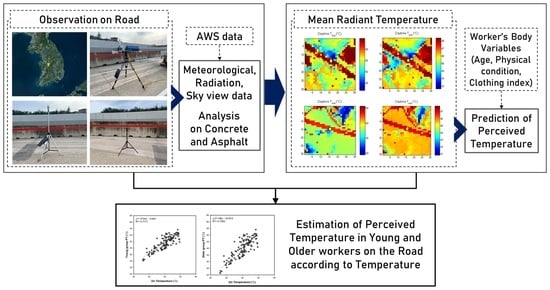
This study aimed to examine radiation (short-wave radiation and long-wave radiation) and other meteorological factors (temperature, humidity, and wind) in an actual highway work environment in summer and to estimate PT using the observation data. For this purpose, the characteristics of the actual radiation and meteorological factors observed at the road sites were analyzed and compared with the actual observation data of a nearby automated weather station (AWS) operated by the Korea Meteorological Administration (KMA). The meteorological environmental variables and mean radiant temperature were then calculated using the observed values. The environment variables in the model were set to match the actual road environment variables, and a PT prediction model was constructed.
2. Materials and Methods
2.1. Overview of Observations
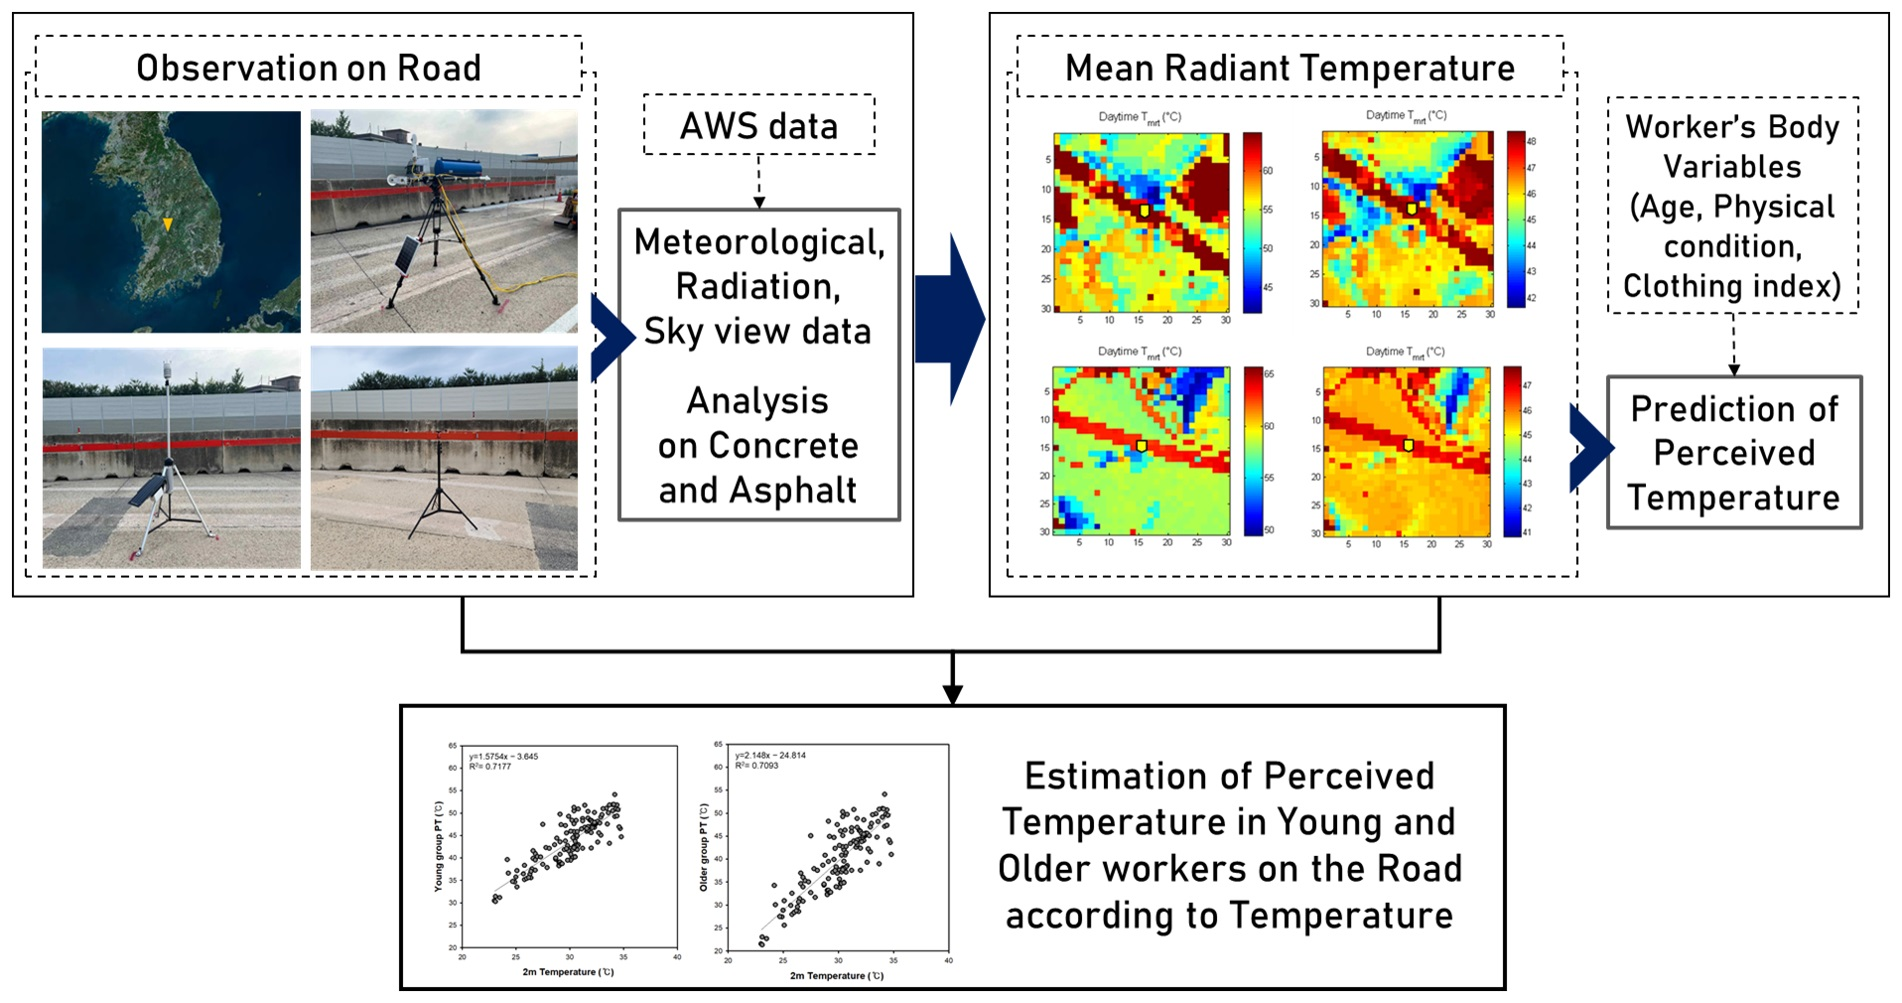
The observation site is a highway located in Okcheon, Chungcheongbuk-do, South Korea. Considering safety during observation, vehicles on the Dongi-Okcheon road were controlled and observed. To compare the characteristics of the road surface pavement types, a concrete road surface site (latitude 36.30580°, longitude 127.58050°) and an asphalt road surface site (latitude 36.29457°, longitude 127.60376°) were selected; at both sites, the vehicles were controlled, and the effect of buildings was eliminated. The distance between the concrete road surface and asphalt road surface observation site is approximately 2 km, and the Okcheon AWS observation site is located at the site in the middle (Figure 1). The altitude of the concrete road surface observation site is 118 m; the asphalt road surface observation site is 136 m; and the Okcheon AWS observation site is 118 m, approximately 18 m higher than the asphalt road surface observation site. The three sites are located within approximately 2 km and are expected to be similarly affected by the weather. Accordingly, the observed values of the two selected observation sites and the AWS Okcheon site of the Korea Meteorological Administration (KMA) were compared and analyzed.
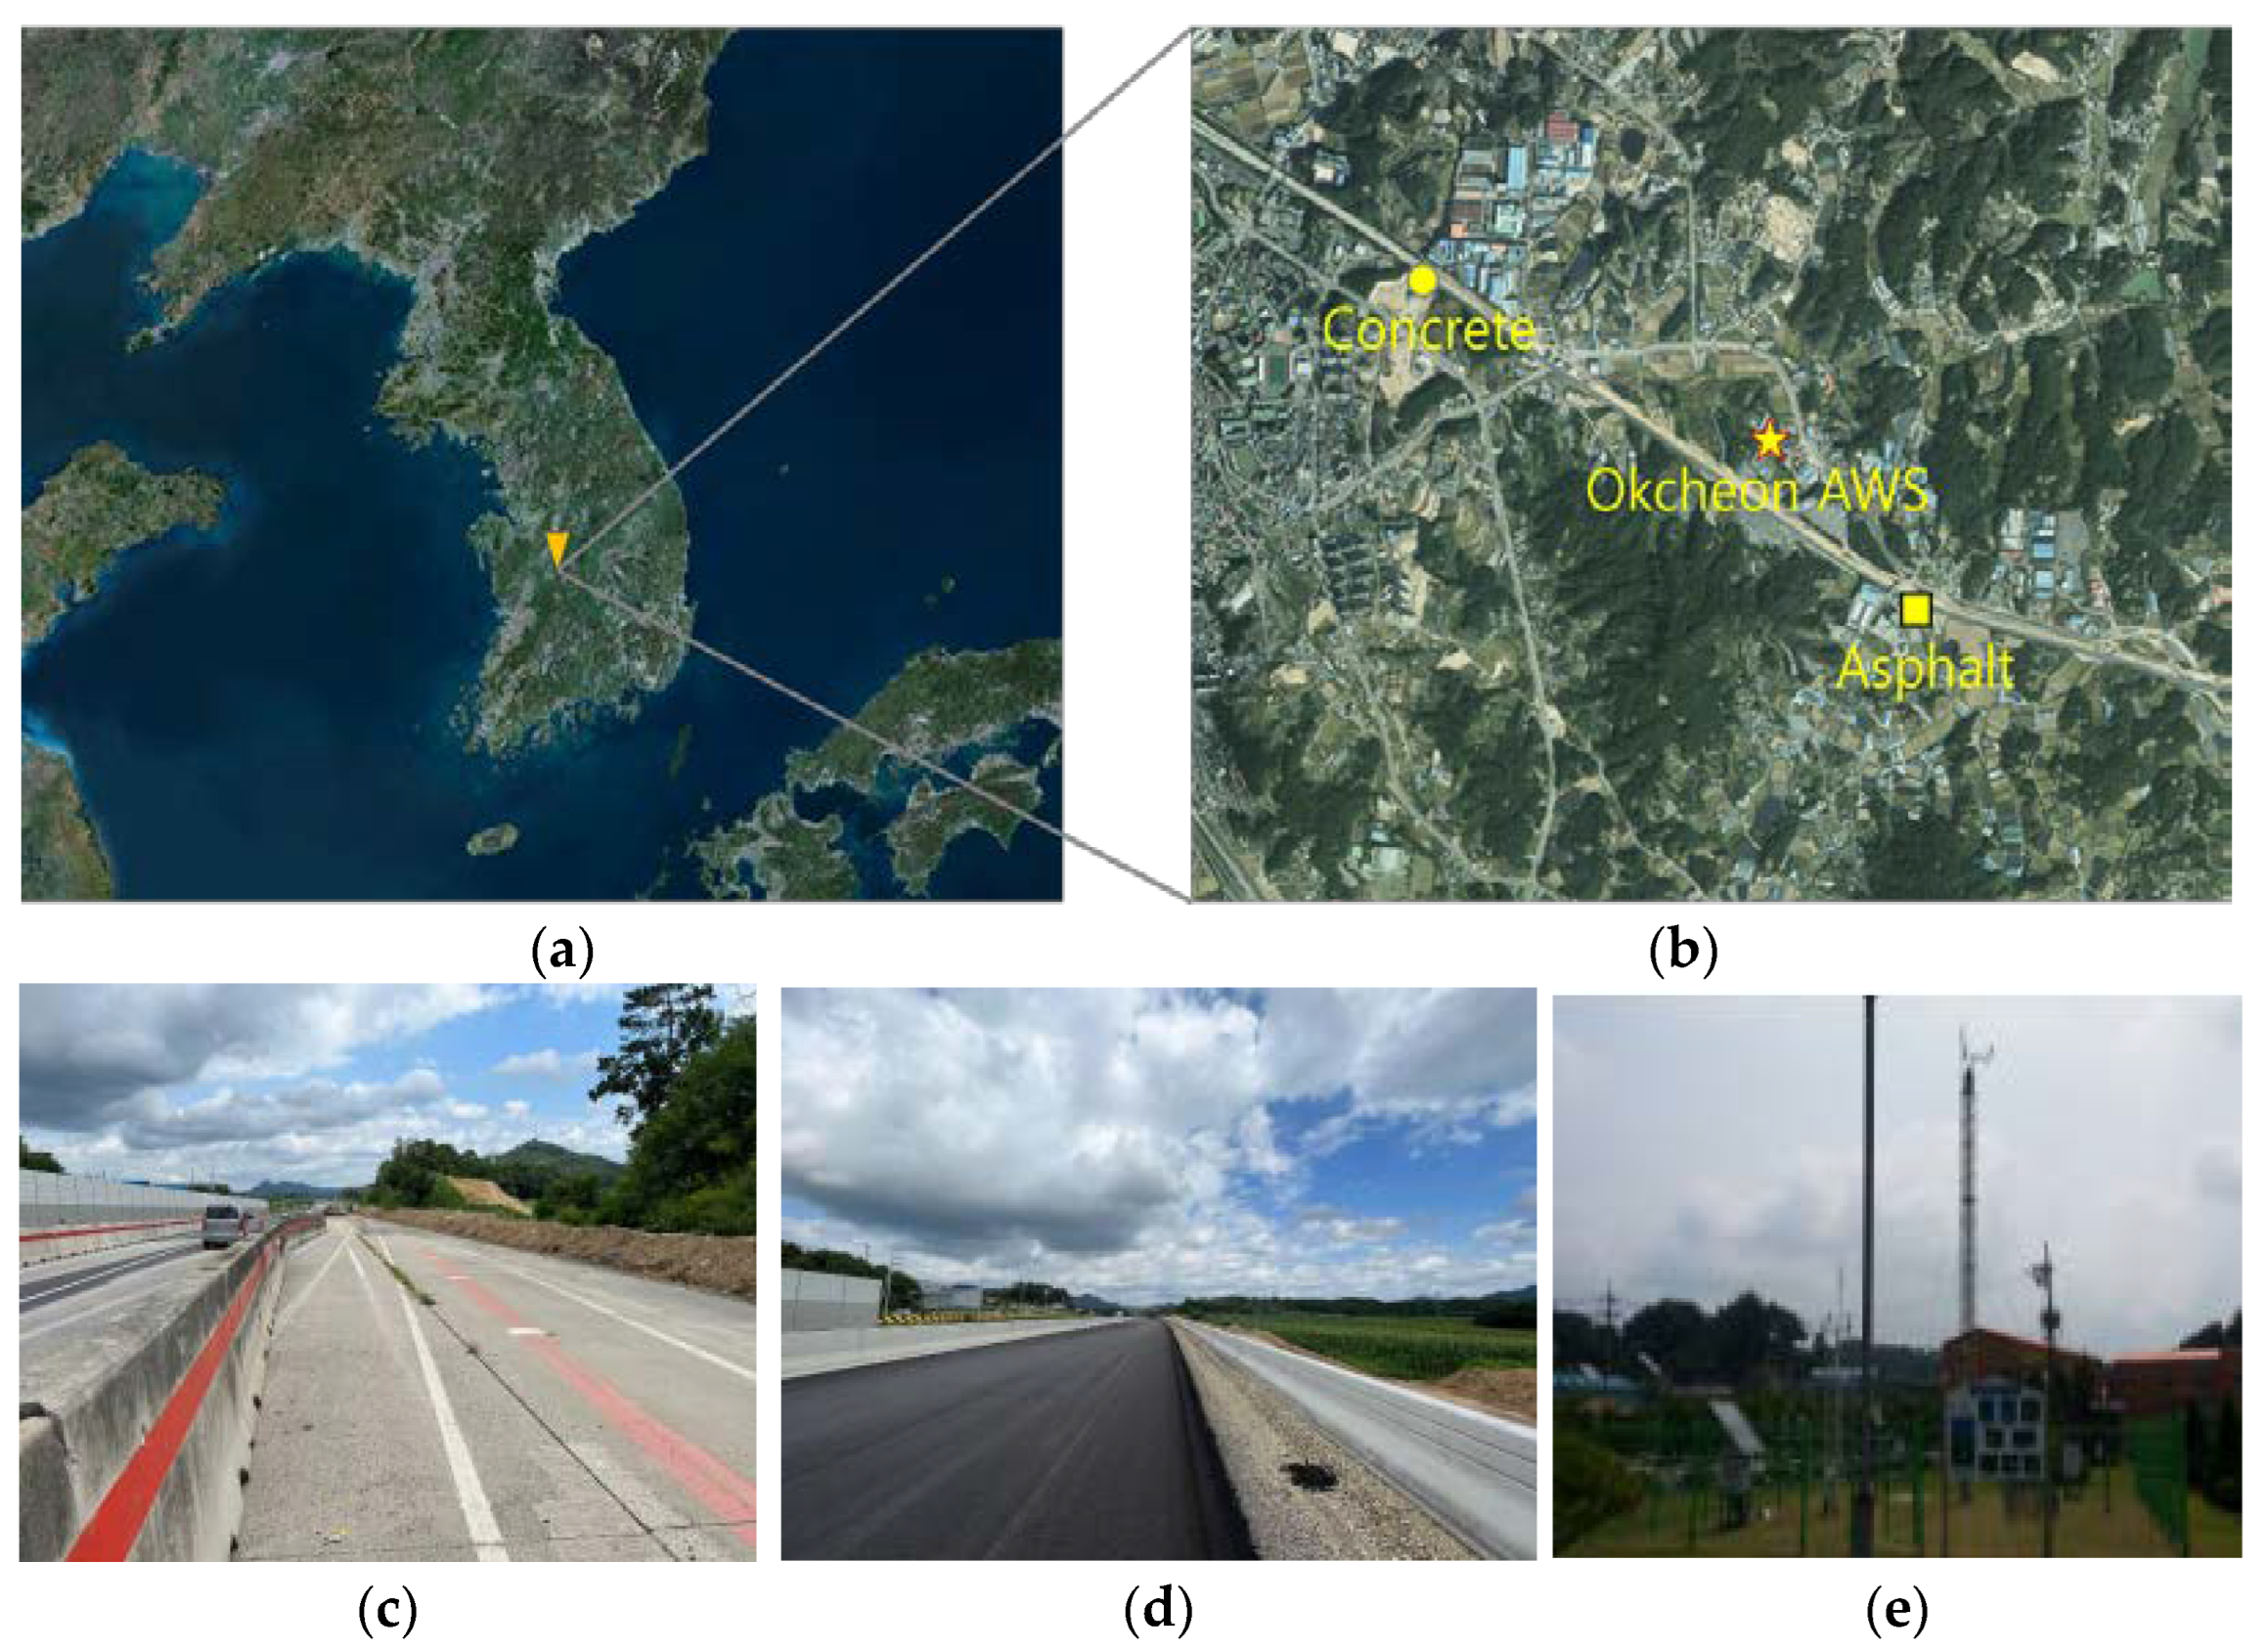
The observation equipment used for road observation consisted of an Omni-NRS and mobile meteorological observation equipment (Figure 2a,b). The Omni-NRS observes solar radiation and infrared solar radiation values in six directions of east, west, south, north, up, and down of the site, and the mobile meteorological observation device observes temperature, humidity, dew point temperature, atmospheric pressure, rainfall detection, wind direction, wind speed, and precipitation through integrated meteorological data at the site. These are reliable equipment with high accuracy that has mainly been used for recording observations in previous studies [29,30]. The sky view or the view of the surrounding environment and sky conditions was also observed. Table 1 shows the specifications of the observation equipment.
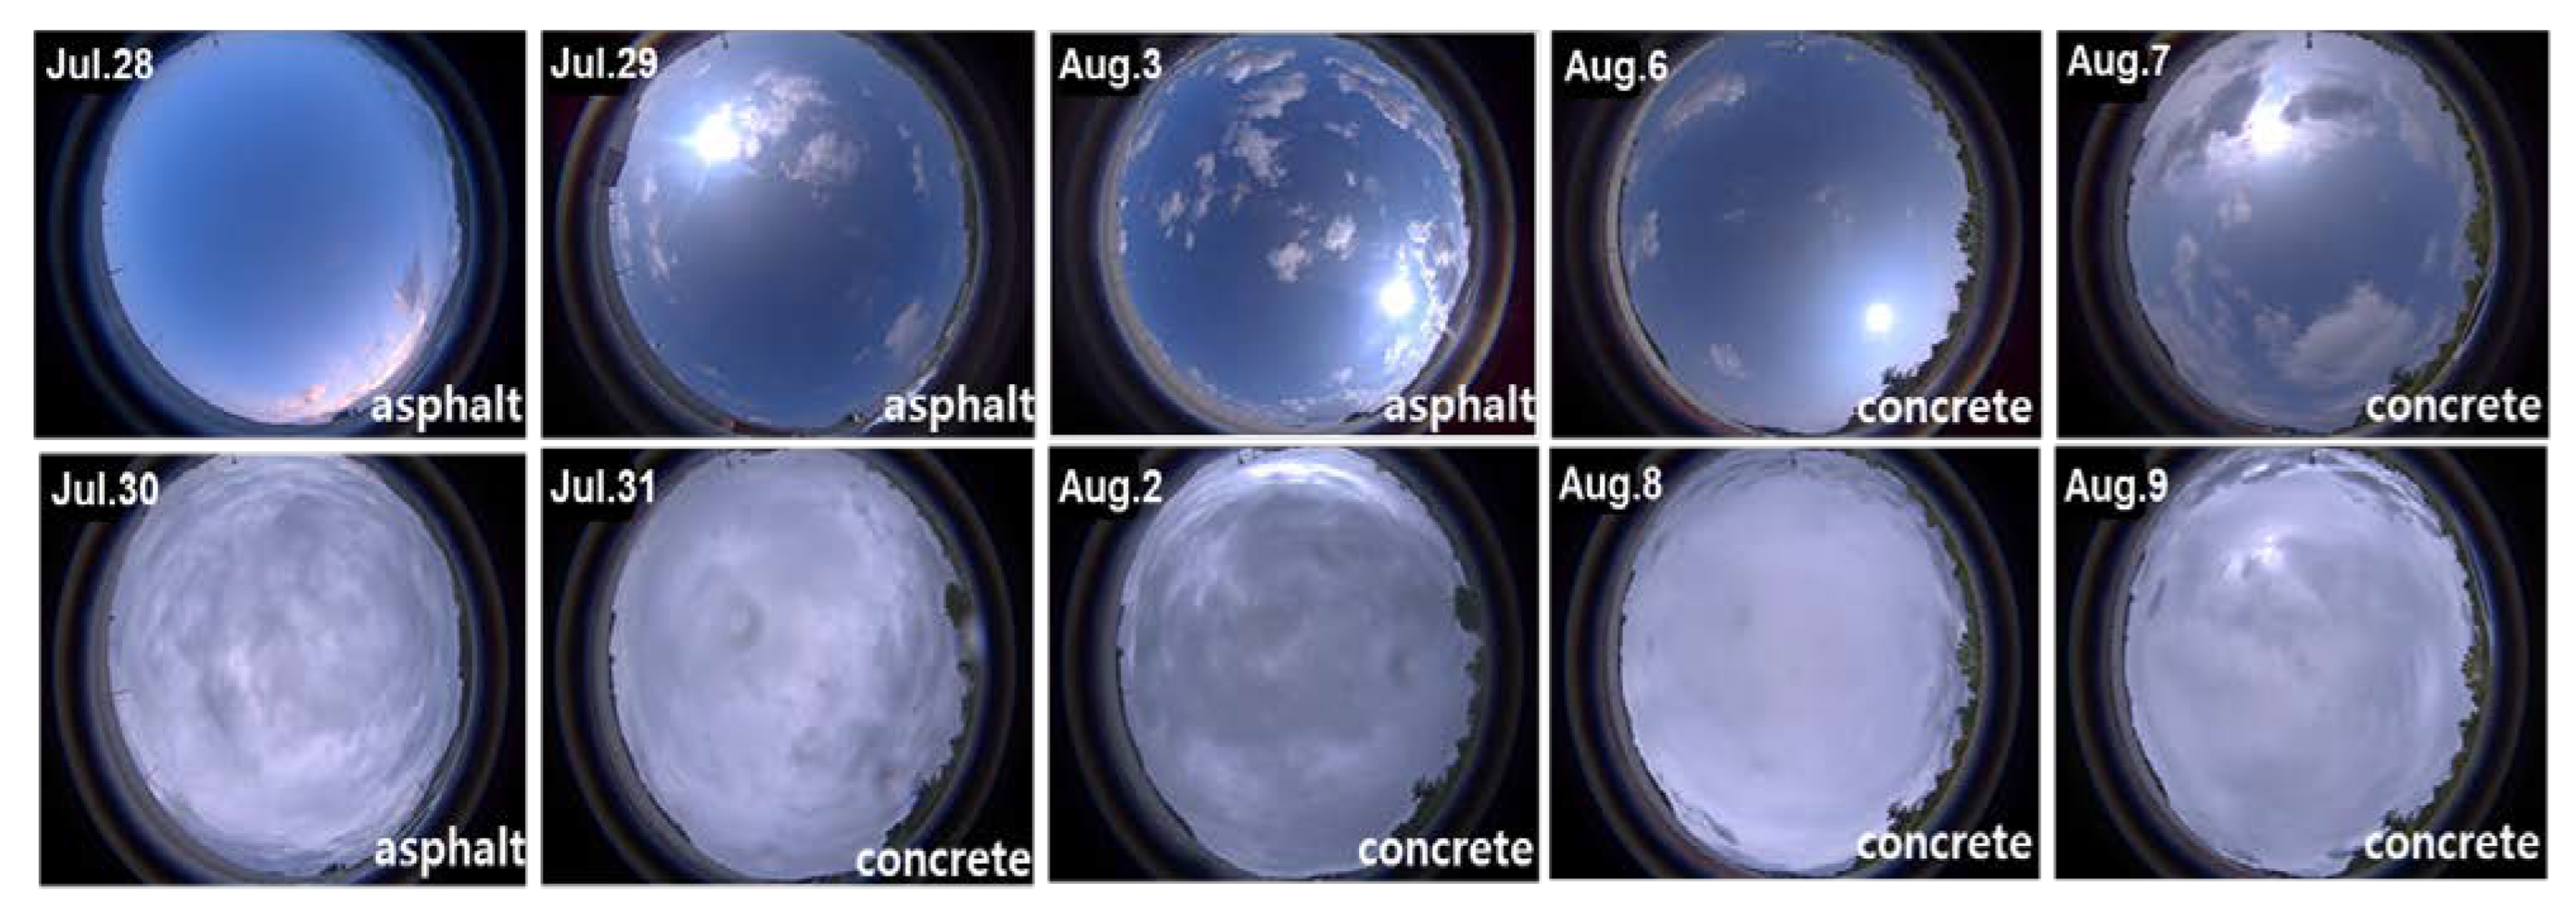
Observations were conducted for a total of 24 days from 19 July 2022 to 11 August 2022. To compare the properties of the road surface pavement type, the observation equipment was installed at alternating concrete and asphalt sites every 3 days; the observation data of each device were collected in minutes and then analyzed in hours. Fisheye photos were also taken to observe the sky viewer (Figure 2c). The sky viewer can be used to quantify the influence of obstructions in the sky. The sky view was observed once a day from July 28 to August 11.
2.2. Classification of Observation Data
Classification of Analysis Date by Site
The total observation period at the observation sites was 24 days from 14:00 on 19 July 2022 to 17:00 on 11 August 2022. The period was classified into sunny days and cloudy days according to weather conditions. To analyze the characteristics of each road surface pavement type, the concrete and asphalt sites were alternately observed for 3 days at a time; 13 days of data were collected for the concrete site and 11 days for the asphalt site. Of this data, the sunny days and cloudy days were selected and analyzed separately. Days with precipitation were excluded from the observation days, and the remaining days were classified based on the daytime (10:00 to 17:00) mean downward short-wave radiation and sky view observation results. This study analyzed data from 10:00 to 17:00, the working hours of road workers. The difference in sky conditions between sunny days and cloudy days was determined based on the sky view observation results (Figure 3). During the actual observation, the sky view was photographed directly by a human observer. Although the cloud conditions were different throughout the day, the manpower was limited and the sky could not be every hour, representative sky conditions for the observation day were collected. Hence, it represents a reference value that shows the representative sky state of a particular date.
On sunny days, we estimated that there were almost no clouds or less than 20% clouds, and the sky is clear. On cloudy days, more than 90% of the sky is covered by clouds. The sunny days and cloudy days selected using the sky view observation results were judged to be clearly distinguished. Indeed, according to the cloud cover observed at the Daejeon ASOS site of KMA on cloudy days, the cloud cover on days selected as cloudy days was all 9–10. The Daejeon ASOS observation site of KMA is the closest Automated Synoptic Observing System to Okcheon.
In total, 9 sunny days and 8 cloudy days were selected. Considering the road surface pavement type, these were divided into 6 sunny days at the concrete site, 3 sunny days at the asphalt site, 6 cloudy days at the concrete site, and 2 cloudy days at the asphalt site (Table 2). As there was mainly precipitation during observation of the asphalt site, there were 7 fewer observation and analysis days for the asphalt site than for the concrete site.
2.3. Model of Workers’ PT
2.3.1. KMM and PT
The German Meteorological Service developed the human heat budget model KMM, created a standard with PT, an index expressing heat stress, and used it to respond to heat waves [23,24]. The NIMS in Korea introduced a PT model and established a Korean PT model in which the PT thermal comfort zone is adjusted for Koreans. This study predicted PT using this Korean model [27,28].
The PT calculated in this study is a heat wave index based on KMM, a human heat budget model. It is defined as the temperature of a standard environment that the body actually feels considering the body’s thermal equilibrium. PT is determined by calculating the heat felt by the body through the thermal comfort equation proposed by Fanger (1970) (Equation (1)) and takes into account not only meteorological factors (temperature, humidity, solar radiation, and wind speed) but also the insulation effect of clothing and the body’s standard metabolism (activity). PMV refers to thermal comfort sensation.
M: metabolic rate (W/m2); W: energy for mechanical work (W/m2);
C: convection; R: radiation; E: evaporation; skin: skin; res: respiration; α: 0.303 exp (−0.036 M) + 0.0275; and L: heat load
To consider the age and work clothes of Korean road workers, we applied the metabolic rates of a young group and an older group of Koreans calculated through chamber experiments in a high-temperature environment [26]. The risk criteria (thermal comfort zone) of the workers’ PT suitable for Koreans were considered (Table 3). PT values outside the experimental range are highlighted using a question mark (?) in Table 3. The PT threshold of the young group developed by the NIMS (2019) for Koreans is categorized as very hot (higher than 43 °C), hot (36–43 °C), warm (28–36 °C), and slightly warm (20–28 °C), and a PT under 20 °C indicates a comfortable state that is neither hot nor cold. The PT threshold of the older group developed by the NIMS (2018) for Koreans is very hot (higher than 40 °C) and hot (24–40 °C), and a PT under 24 °C is warm, slightly warm, or comfortable.
2.3.2. Investigation of Body Variables to Construct a Prediction Model for Worker PT
The age, physical condition, and clothing of workers working on the roads near the observation sites on August 3 and 4, 2022, were investigated. All field workers were male, with 4 aged 25–30 years and 5 aged 60 years or older. The height and weight of the workers were 170–175 cm and 70–75 kg, respectively, which was similar to the standard Korean body type (Standard Korean body type: young group, 174.4 cm/74.22 kg; older group, 168.2 cm/70.5 kg). Based on these results, separate PT prediction models were built for the young group (aged 25–30 years) and the older group (aged 60 years or older), and PT was calculated by applying the heat production (metabolic rate) considering the standard Korean body type. We referred to a Korean body dimension survey (http://sizekorea.kats.go.kr (accessed on 1 August 2022)) for the standard Korean body type. The heat production applied for the young group was 135.0 W/m2, and that for the older group was 85.7 W/m2.
The workers’ clothing was mostly long sleeves, long pants, long socks, vests, neck covers, hard hats, and work shoes. We calculated the thermal insulation of the clothing and applied it to the calculation of PT. The clothing index (clo) was used as a measure of clothing insulation. 1 clo signifies the thermal insulation of clothing (1 clo = 0.155 m2 K/W) that allows a person to maintain a comfortable sensation while sitting on a chair in an environment with a temperature of 21 °C, a relative humidity of less than 50%, and a wind speed of 0.1 m/s. The following values were applied in this study: underwear (0.04), thin long sleeves (0.02), long pants (0.02), long socks (0.2), vest (0.13), work shoes (0.05), light scarf (0.04), gloves (0.08), and hat (0.01). Thus, a total clothing index of 0.95 clo was applied to the PT model.
2.3.3. SOLWEIG Model
This study used SOLWEIG (SOlar and LongWave Environmental Irradiance Geometry model), a solar radiation model, to calculate the mean radiant temperature applied to the workers’ PT. As the mean radiant temperature is a factor that greatly impacts PT and thermal comfort evaluations, accurately calculating the mean radiant temperature is essential for evaluating thermal comfort. Solar radiation must be analyzed to accurately calculate the mean radiant temperature. Solar radiation can be broadly divided into direct solar radiation in which sunlight directly enters the room, diffuse radiation by diffusion from the outside air, and reflected radiation from surrounding buildings or the ground. SOLWEIG calculates shade information and the sky view factor for each grid using detailed topography and land cover information and can numerically simulate temporal and spatial changes in three-dimensional radiation flux and mean radiant temperature, which is important to evaluate thermal comfort [31,32,33].
3. Results and Discussion
3.1. Analysis of Observation Data
3.1.1. Comparison and Validation Analysis with AWS Observation Data
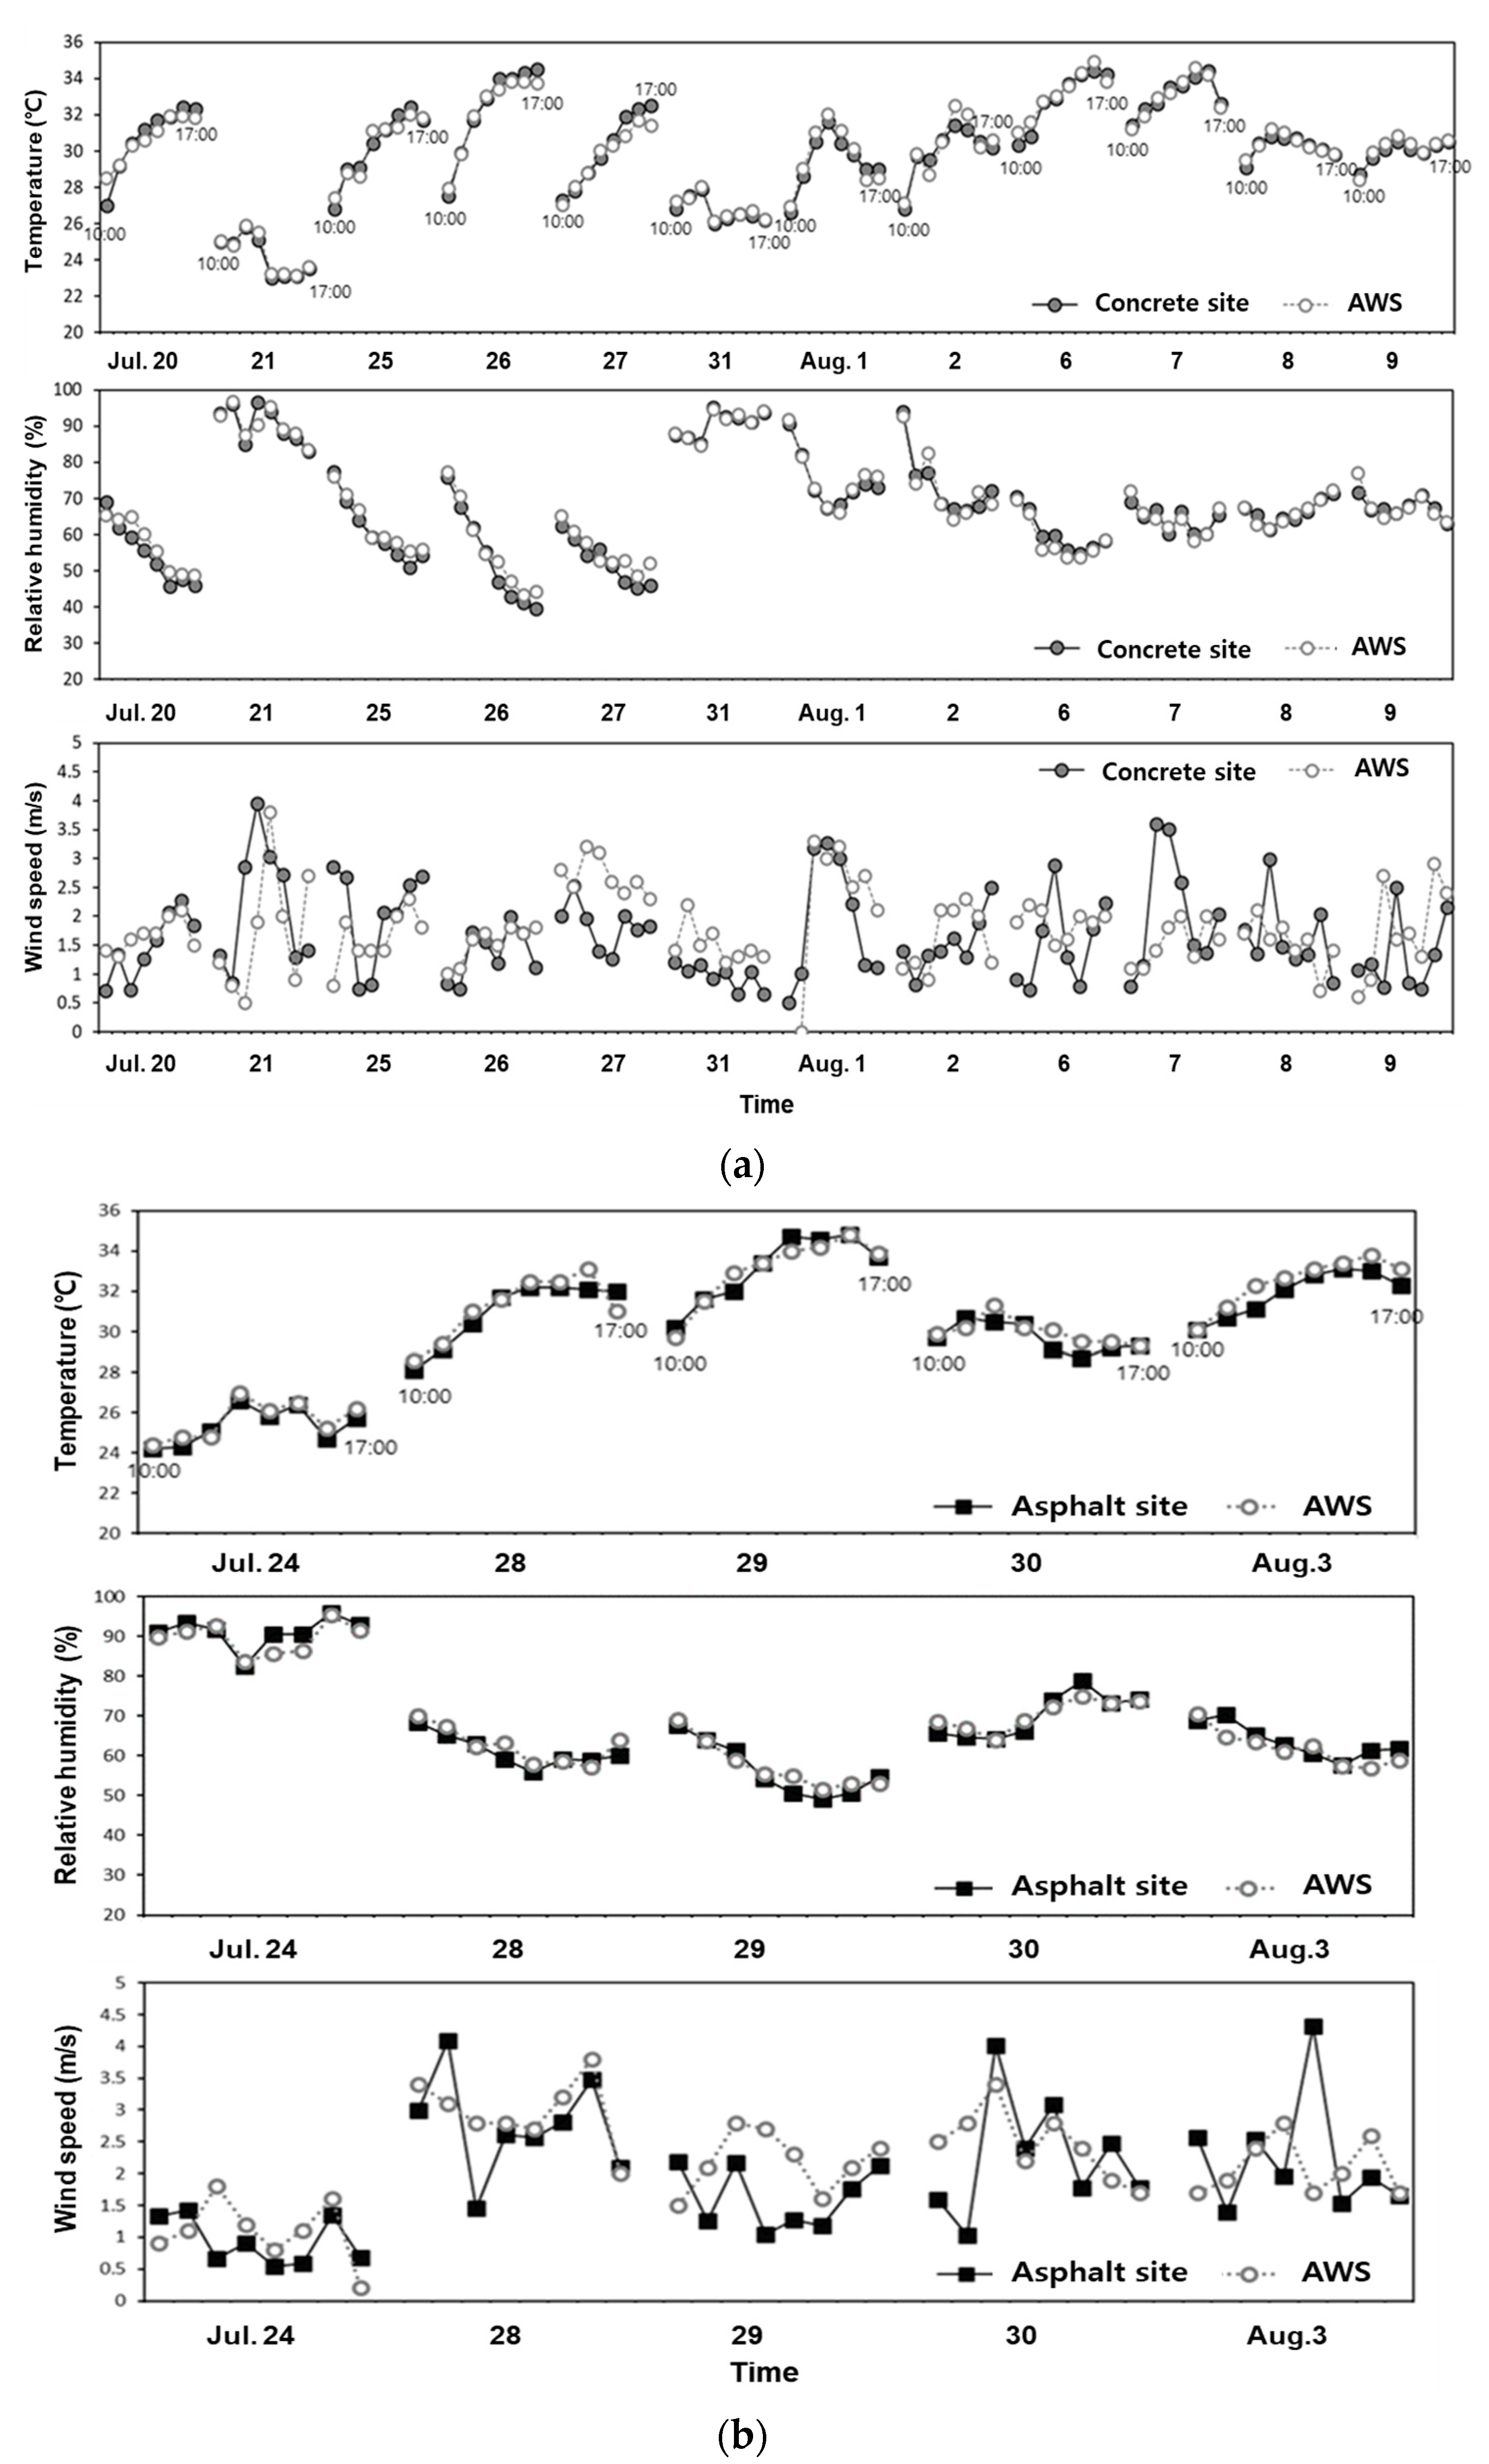
The meteorological observation data at the concrete and asphalt sites were analyzed using data between 10:00 to 17:00, which constitutes the main working time for road workers. To compare the concrete and asphalt observation data with that of the Okcheon AWS site, we analyzed regular observation data of 2 m temperature, relative humidity, and wind speed for a total of 17 days (Figure 4). The 2 m temperature and relative humidity values as well as wind speed trends at the 2 sites were very similar to the AWS values. As the observations were very similar to the AWS data of the Korea Meteorological Administration, we concluded that the road observation data of the present study are very reliable.
The concrete site showed higher temperatures than the Okcheon AWS site on July 20, 25, 26, and 27. Given the continuous rise in temperature at the concrete site, the thermal energy stored in the concrete site was greater than that of the Okcheon AWS site. Moreover, we expected temperatures at the asphalt site, which recorded higher temperatures than the concrete, to be higher than those at the AWS site, but the Okcheon AWS temperatures were slightly higher. These findings likely reflect the environmental impact of the 2 sites; one factor is that the asphalt site has an altitude of 136 m and the Okcheon AWS site has an altitude of 118 m, so the results can be attributed to the difference in altitude between the 2 sites. The concrete and Okcheon AWS site have the same altitude. Despite the difference in altitude, the highest temperature on 29 July was observed at the asphalt site.
3.1.2. Meteorological Data
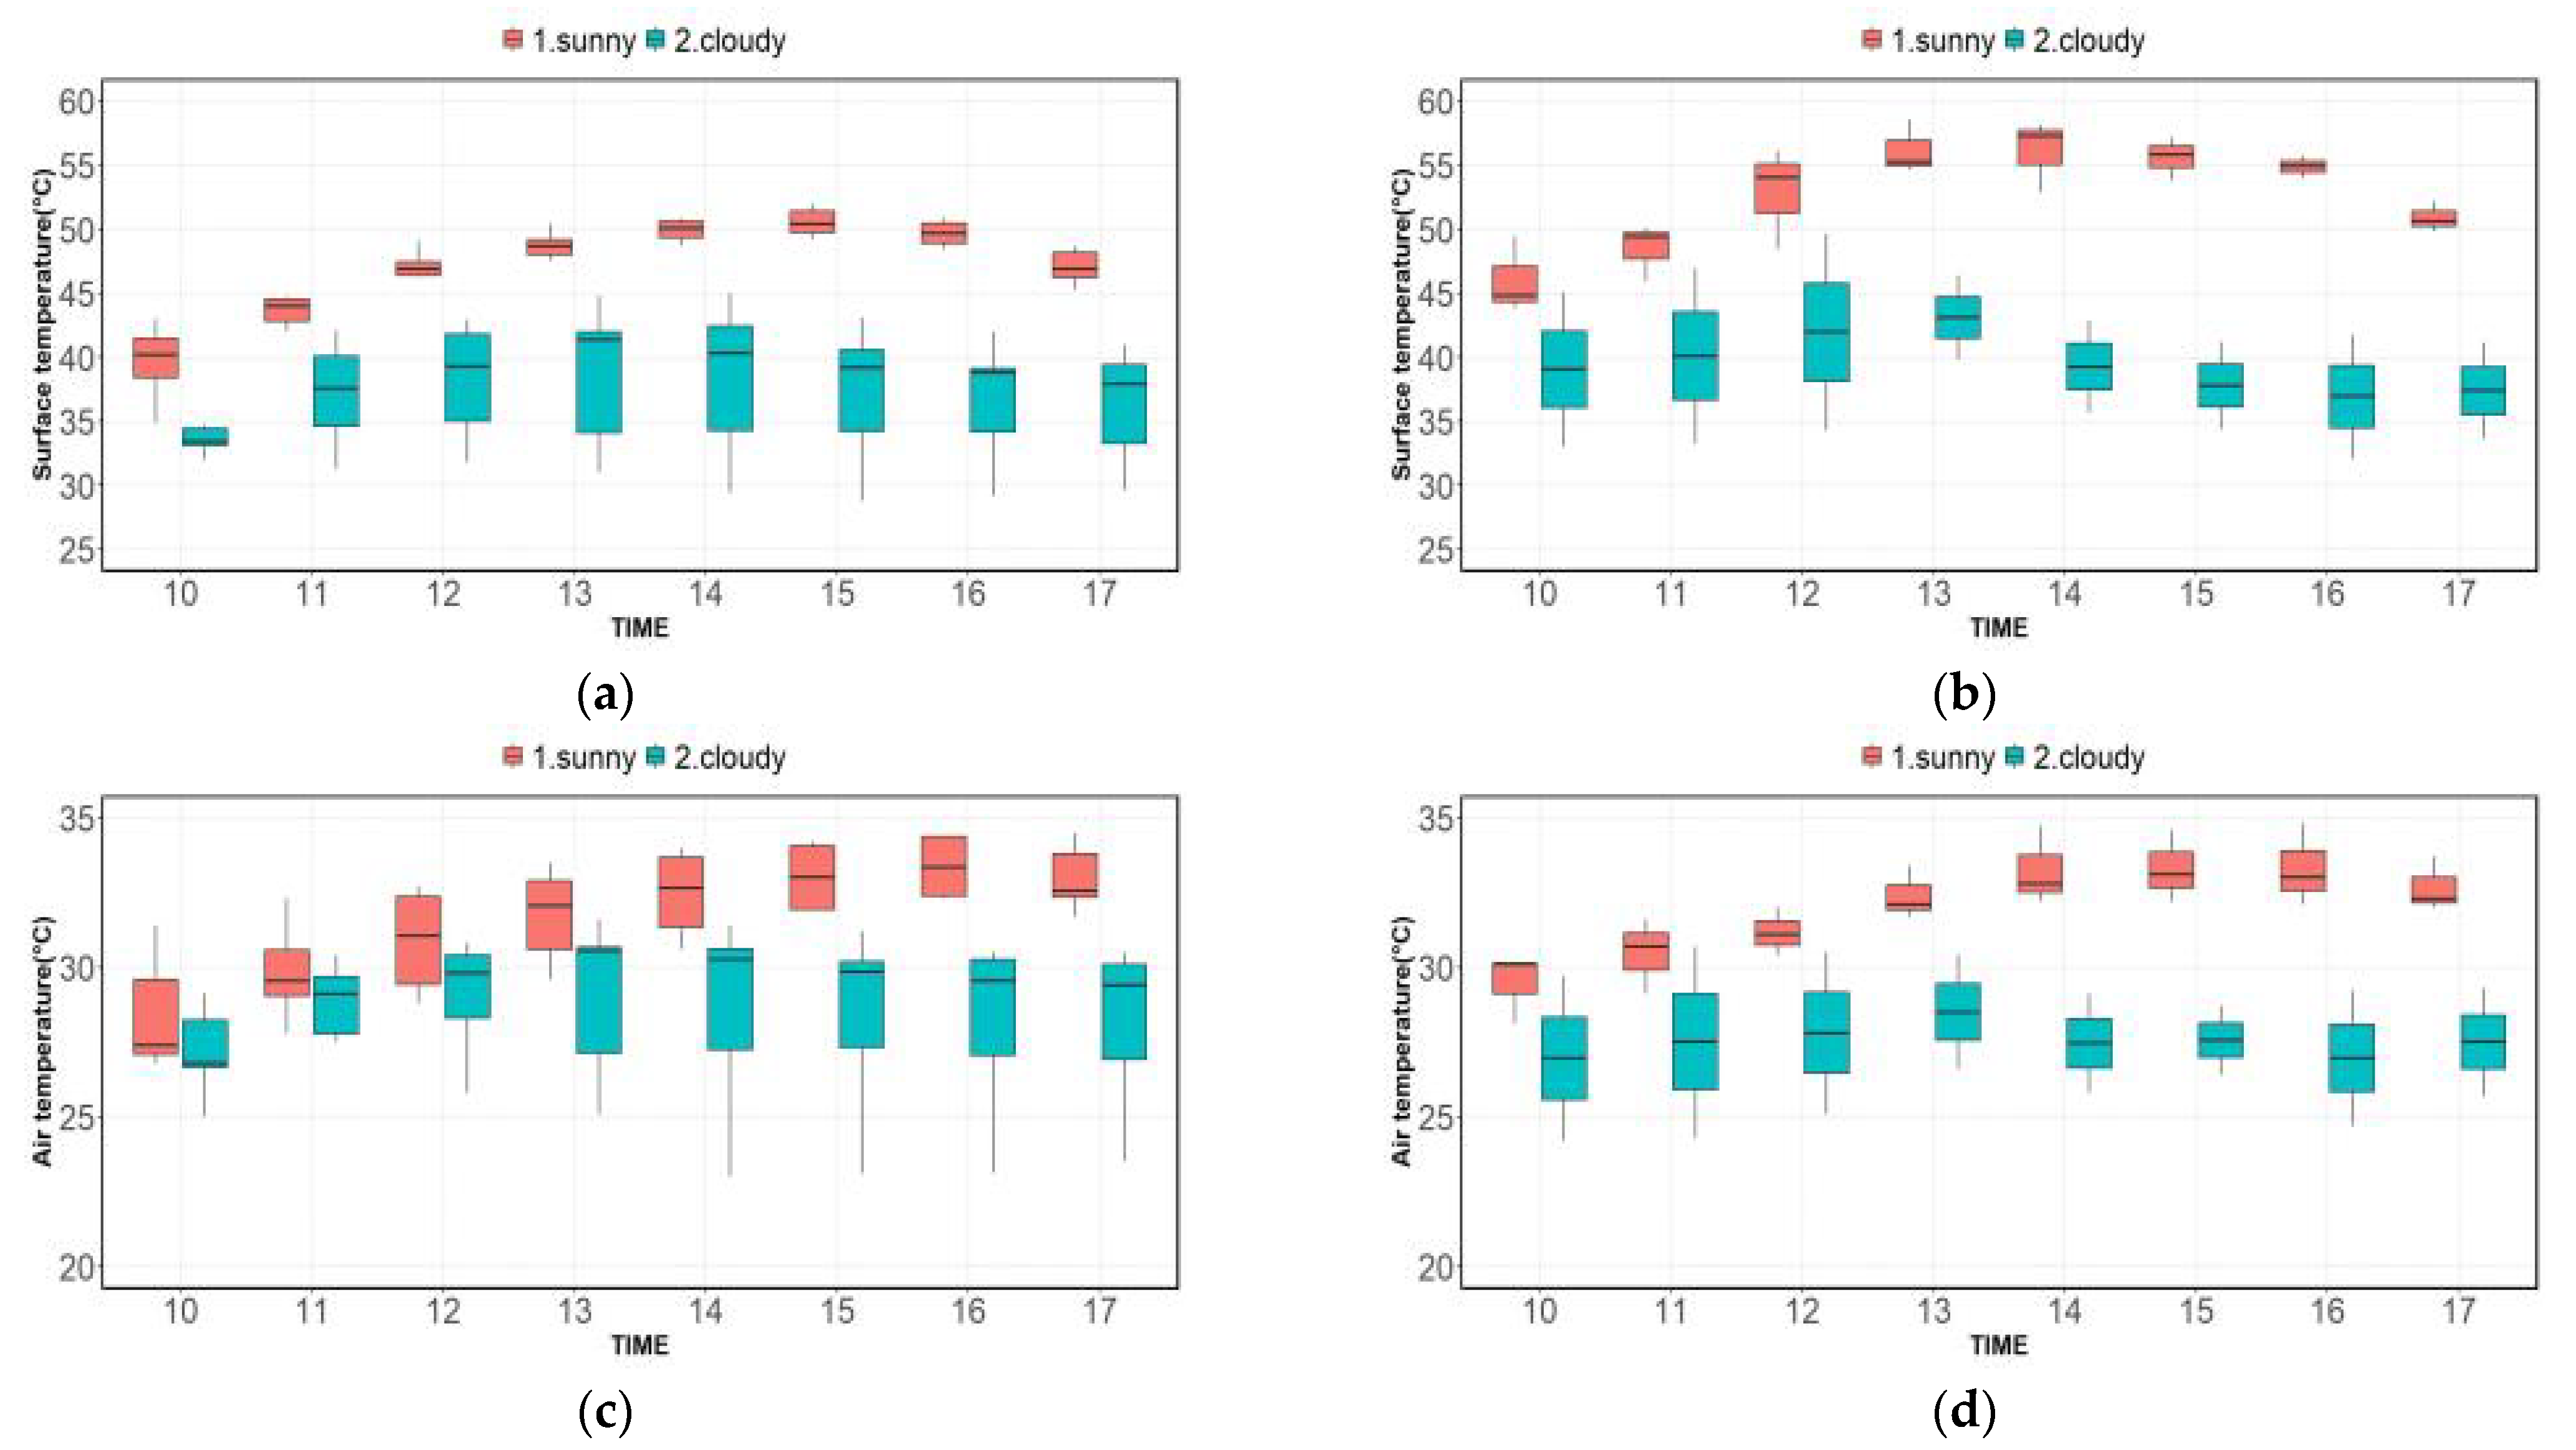
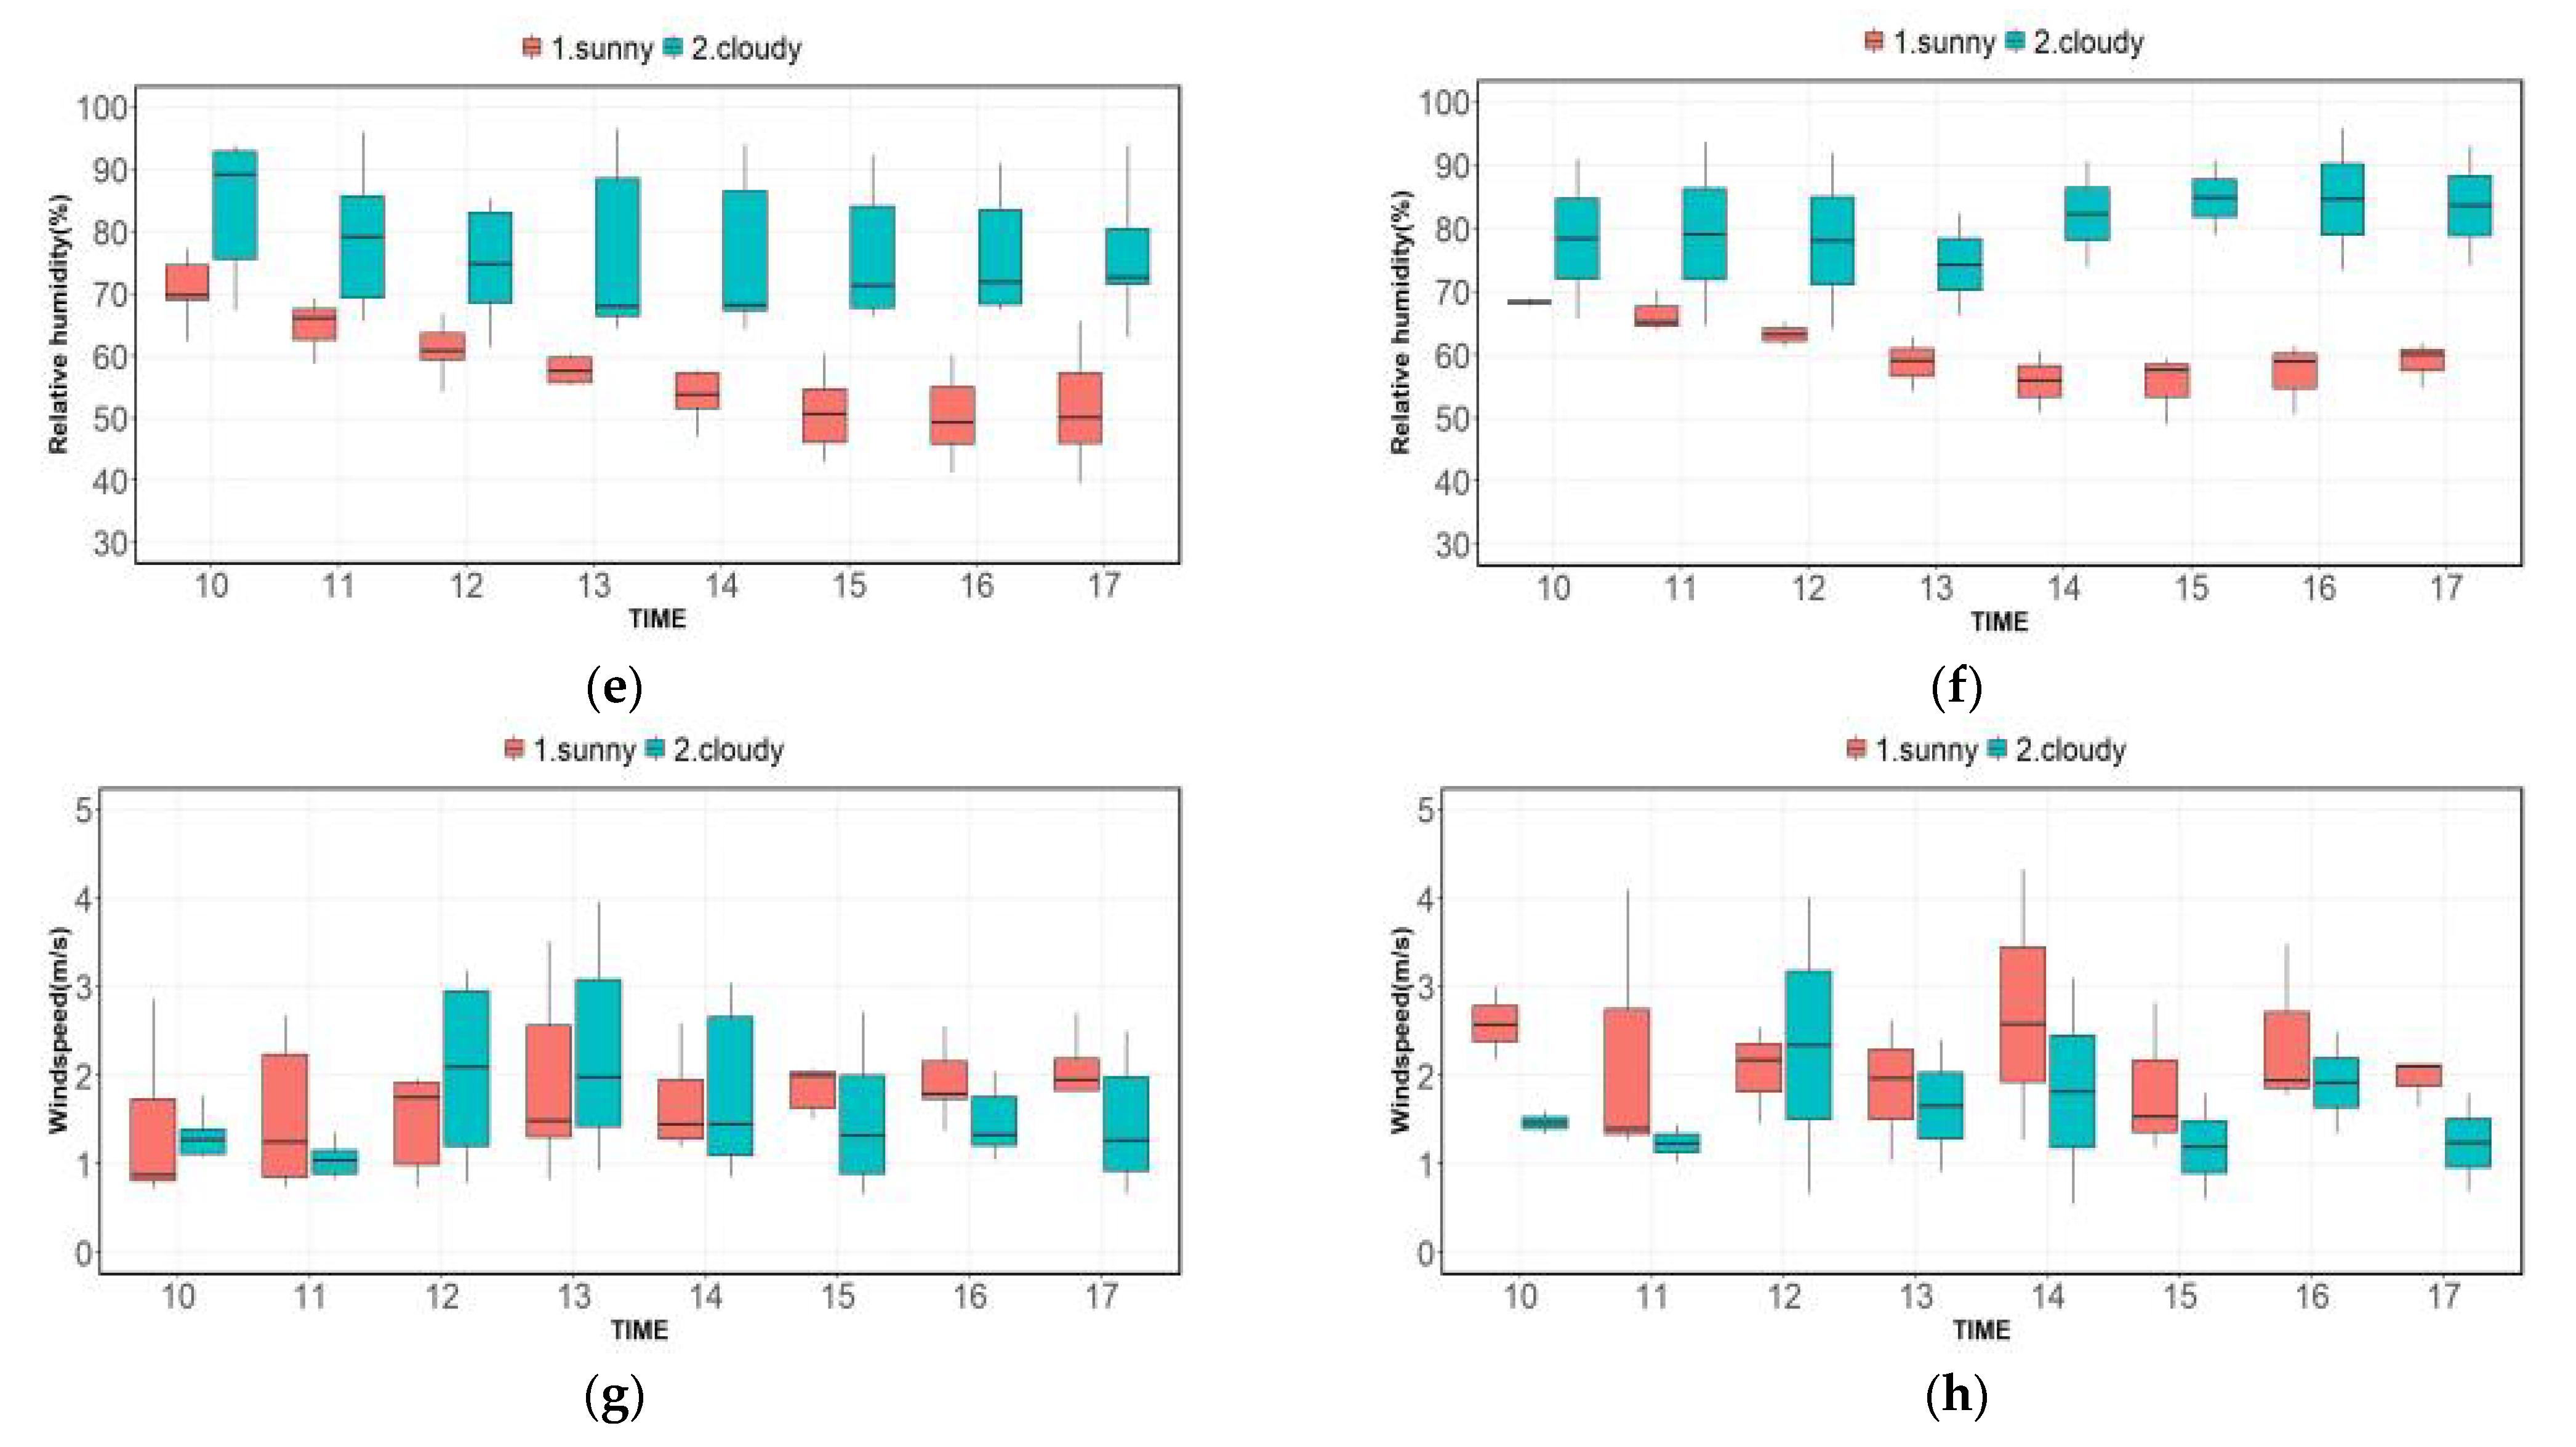
Similar to the radiation flux analysis, we divided the concrete and asphalt sites into four groups and compared the distribution values of road surface temperature, 2 m temperature, relative humidity, and wind speed by time period using a box plot (Figure 5). The road surface temperature (Ts) can be calculated using the observed long-wave radiation values in Equation (3):
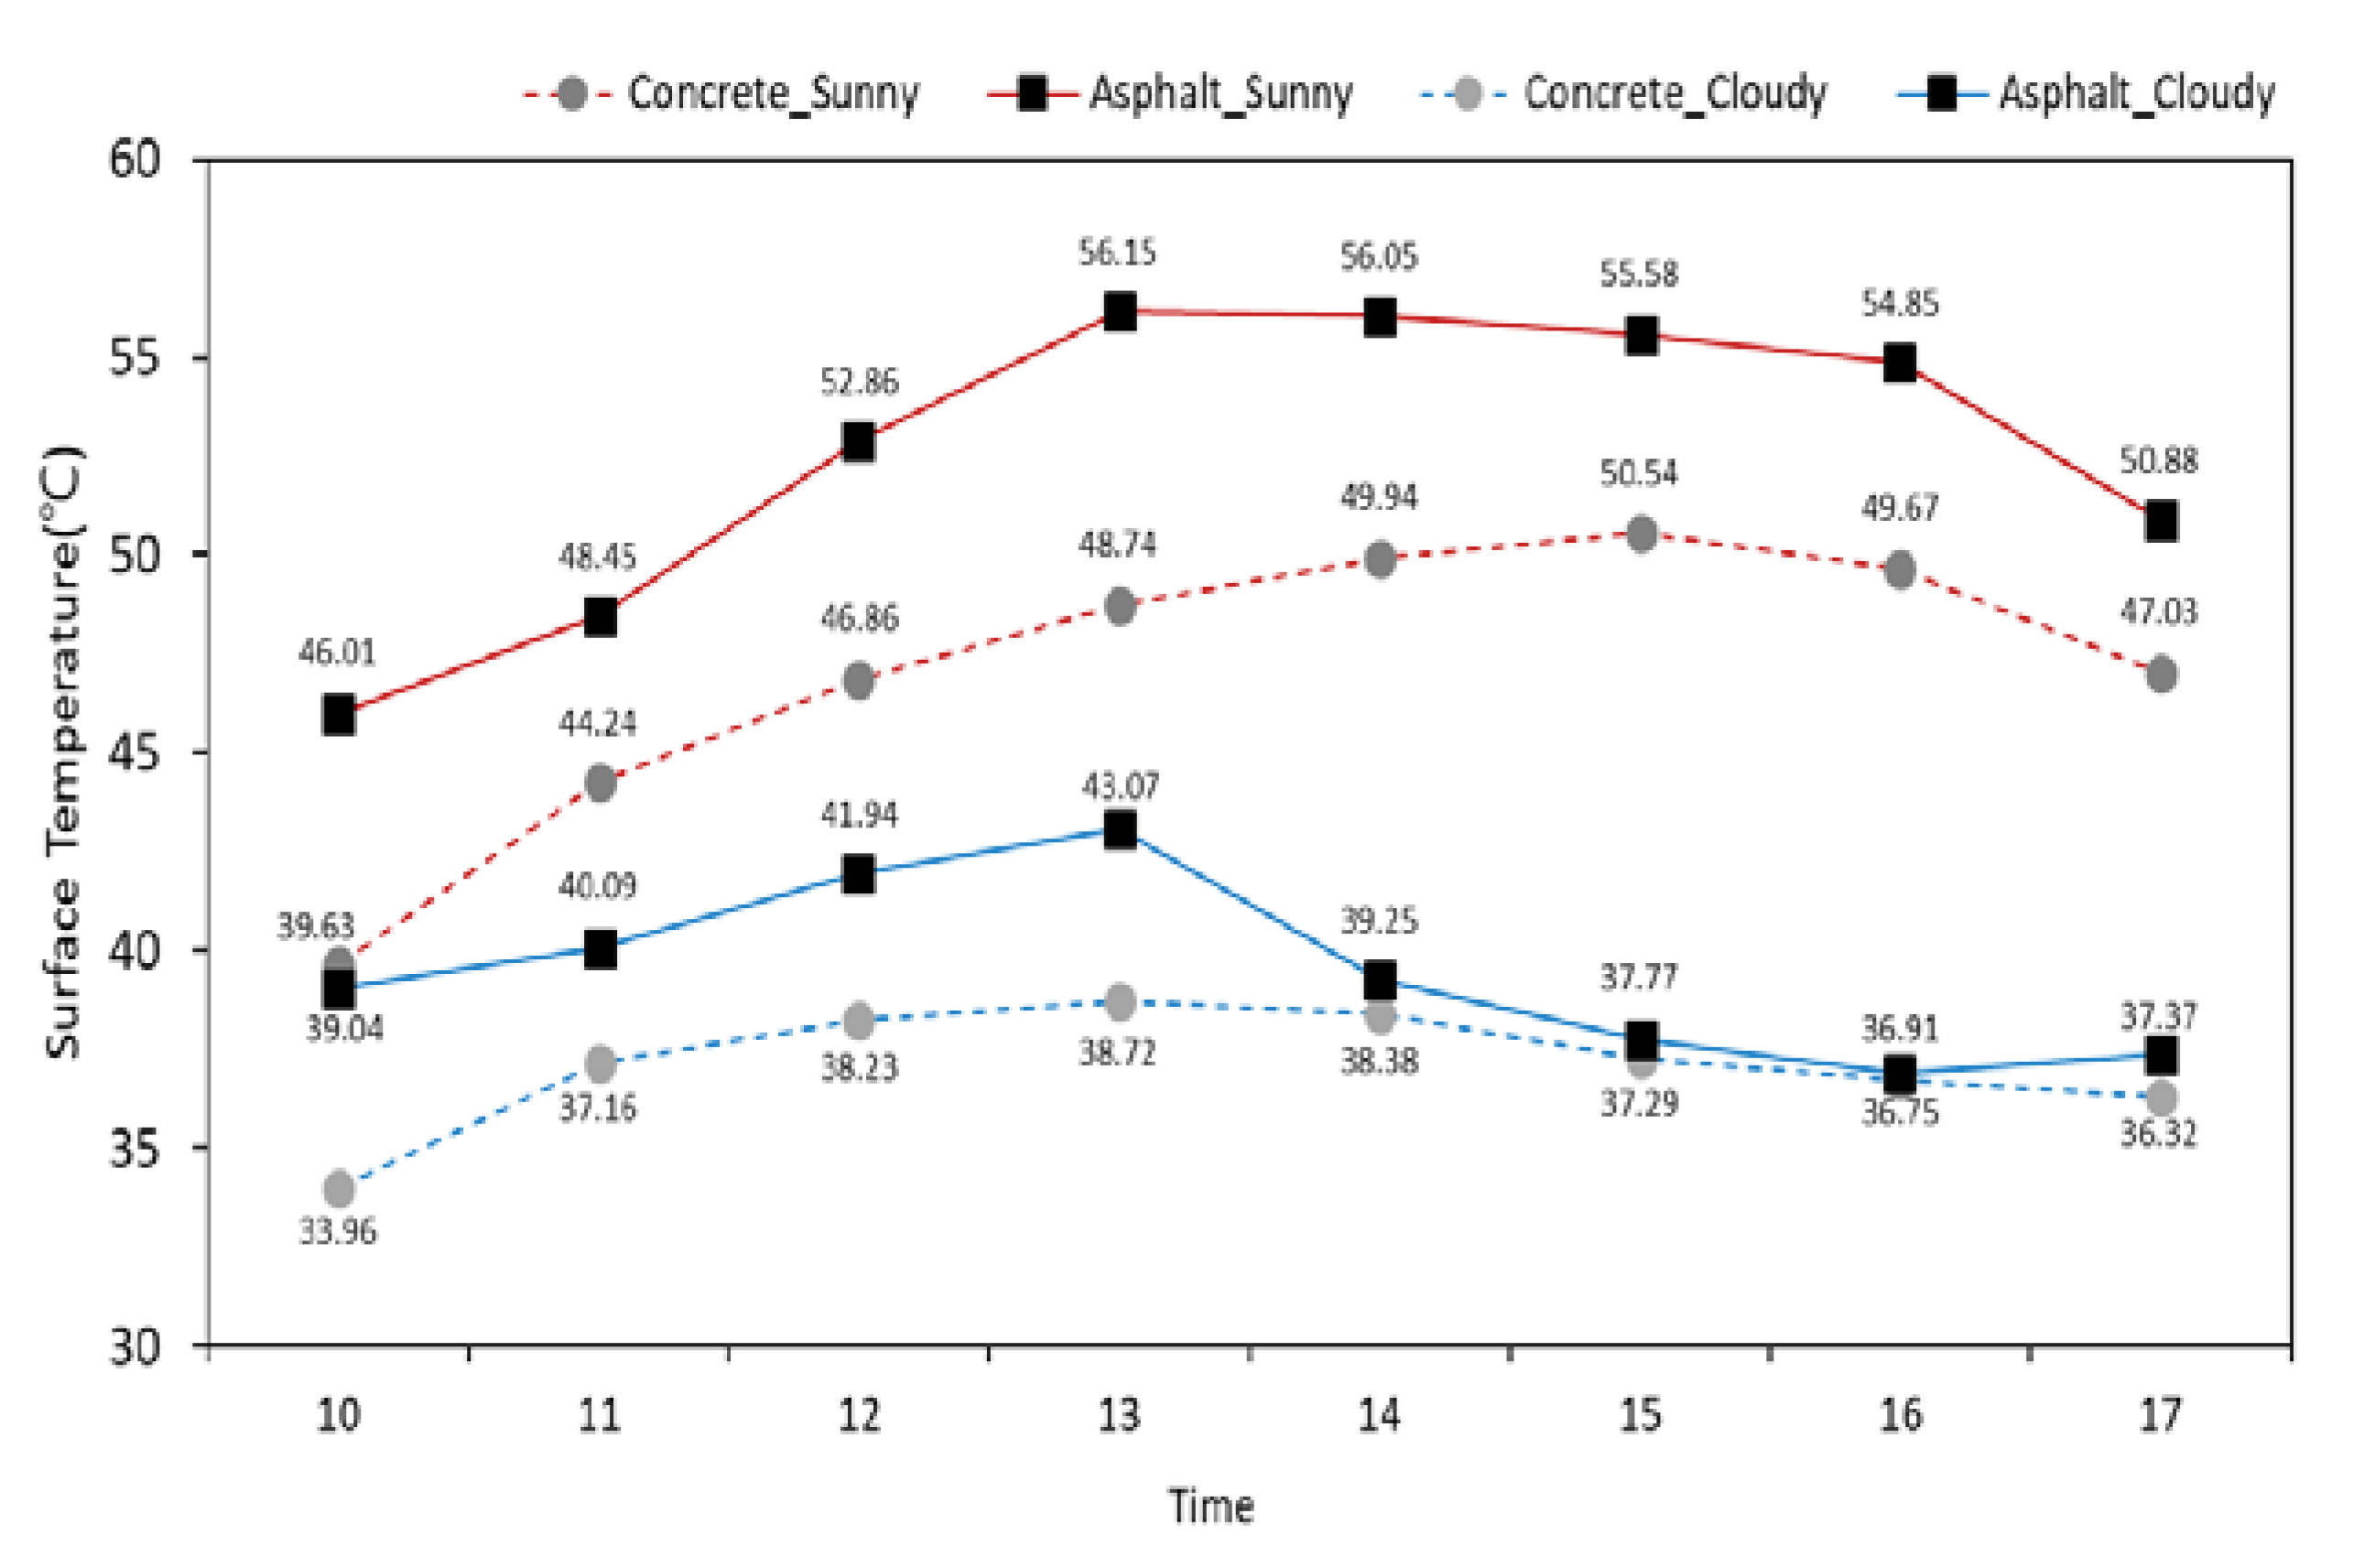
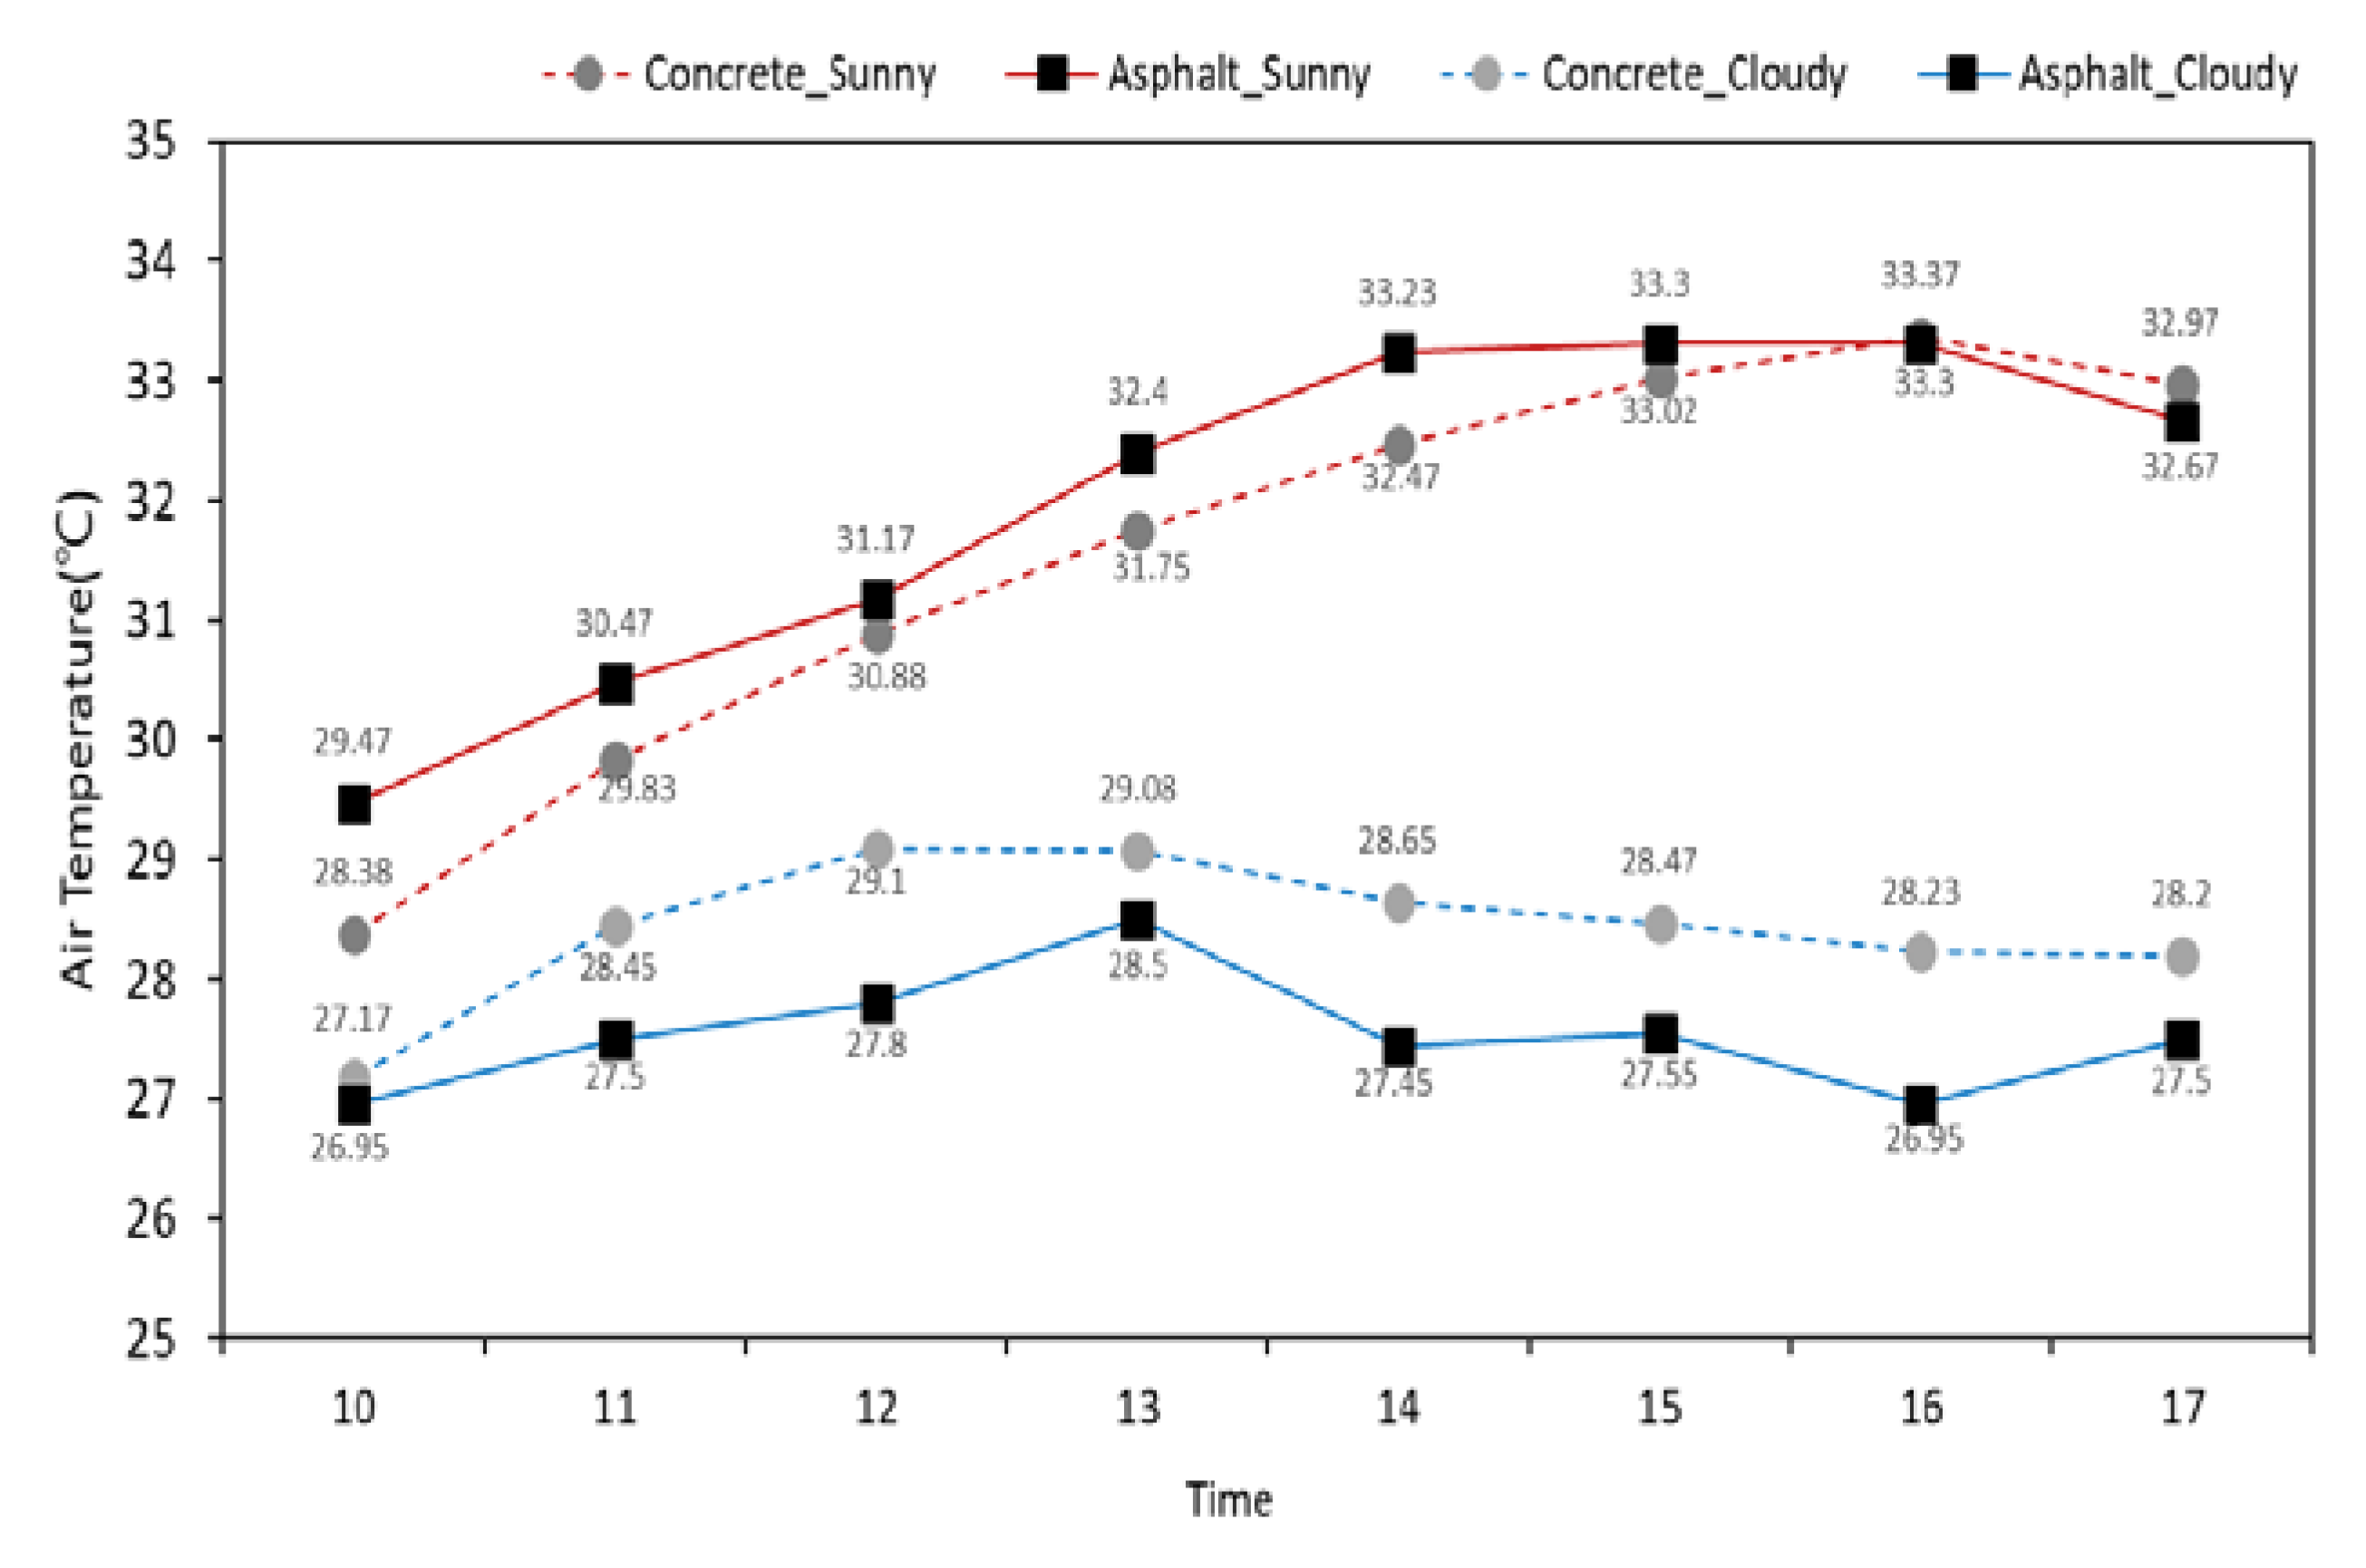
The road surface temperature showed similar trends at the concrete and asphalt sites, but there was a clear difference between sunny and cloudy days. Road surface temperature on sunny days was higher at the asphalt site than at the concrete site by approximately 5 °C on average. The maximum 2 m temperature was also higher at the asphalt site than at the concrete site. The road surface temperature was the highest at around 13:00–14:00 at the asphalt site, where high upward long-wave radiation is emitted. Based on the radiation observation data above, although the mean energy balance of the 2 sites was similar, the road surface temperatures and 2 m temperatures were higher at the asphalt site, where high upward long-wave radiation was observed. There was a clear difference in relative humidity between cloudy days and sunny days, being higher on cloudy days than on sunny days. The concrete and asphalt sites did not show distinct characteristics in the observed relative humidity and wind speed results.
According to the comparative analysis by averaging the time-specific observation data (Figure 6), at 13:00 on sunny days, the difference in road surface temperature between concrete and asphalt was 7.41 °C, and the difference in 2 m temperature was 0.75 °C, showing a large deviation in the road surface temperature. The 2 m temperature on cloudy days was higher at the concrete site than at the asphalt site, and a difference in 2 m temperature between sunny and cloudy days was observed at the concrete site.
3.1.3. Radiation Flux
The radiation observation data were also analyzed using data from 10:00 to 17:00, the main working time on the road. The net radiation was obtained by summing the four types of radiation: radiation incident from the sun, radiation reflected in the atmosphere, radiation absorbed by the Earth’s surface and then emitted, and radiation reflected in the atmosphere and absorbed by the Earth’s surface.
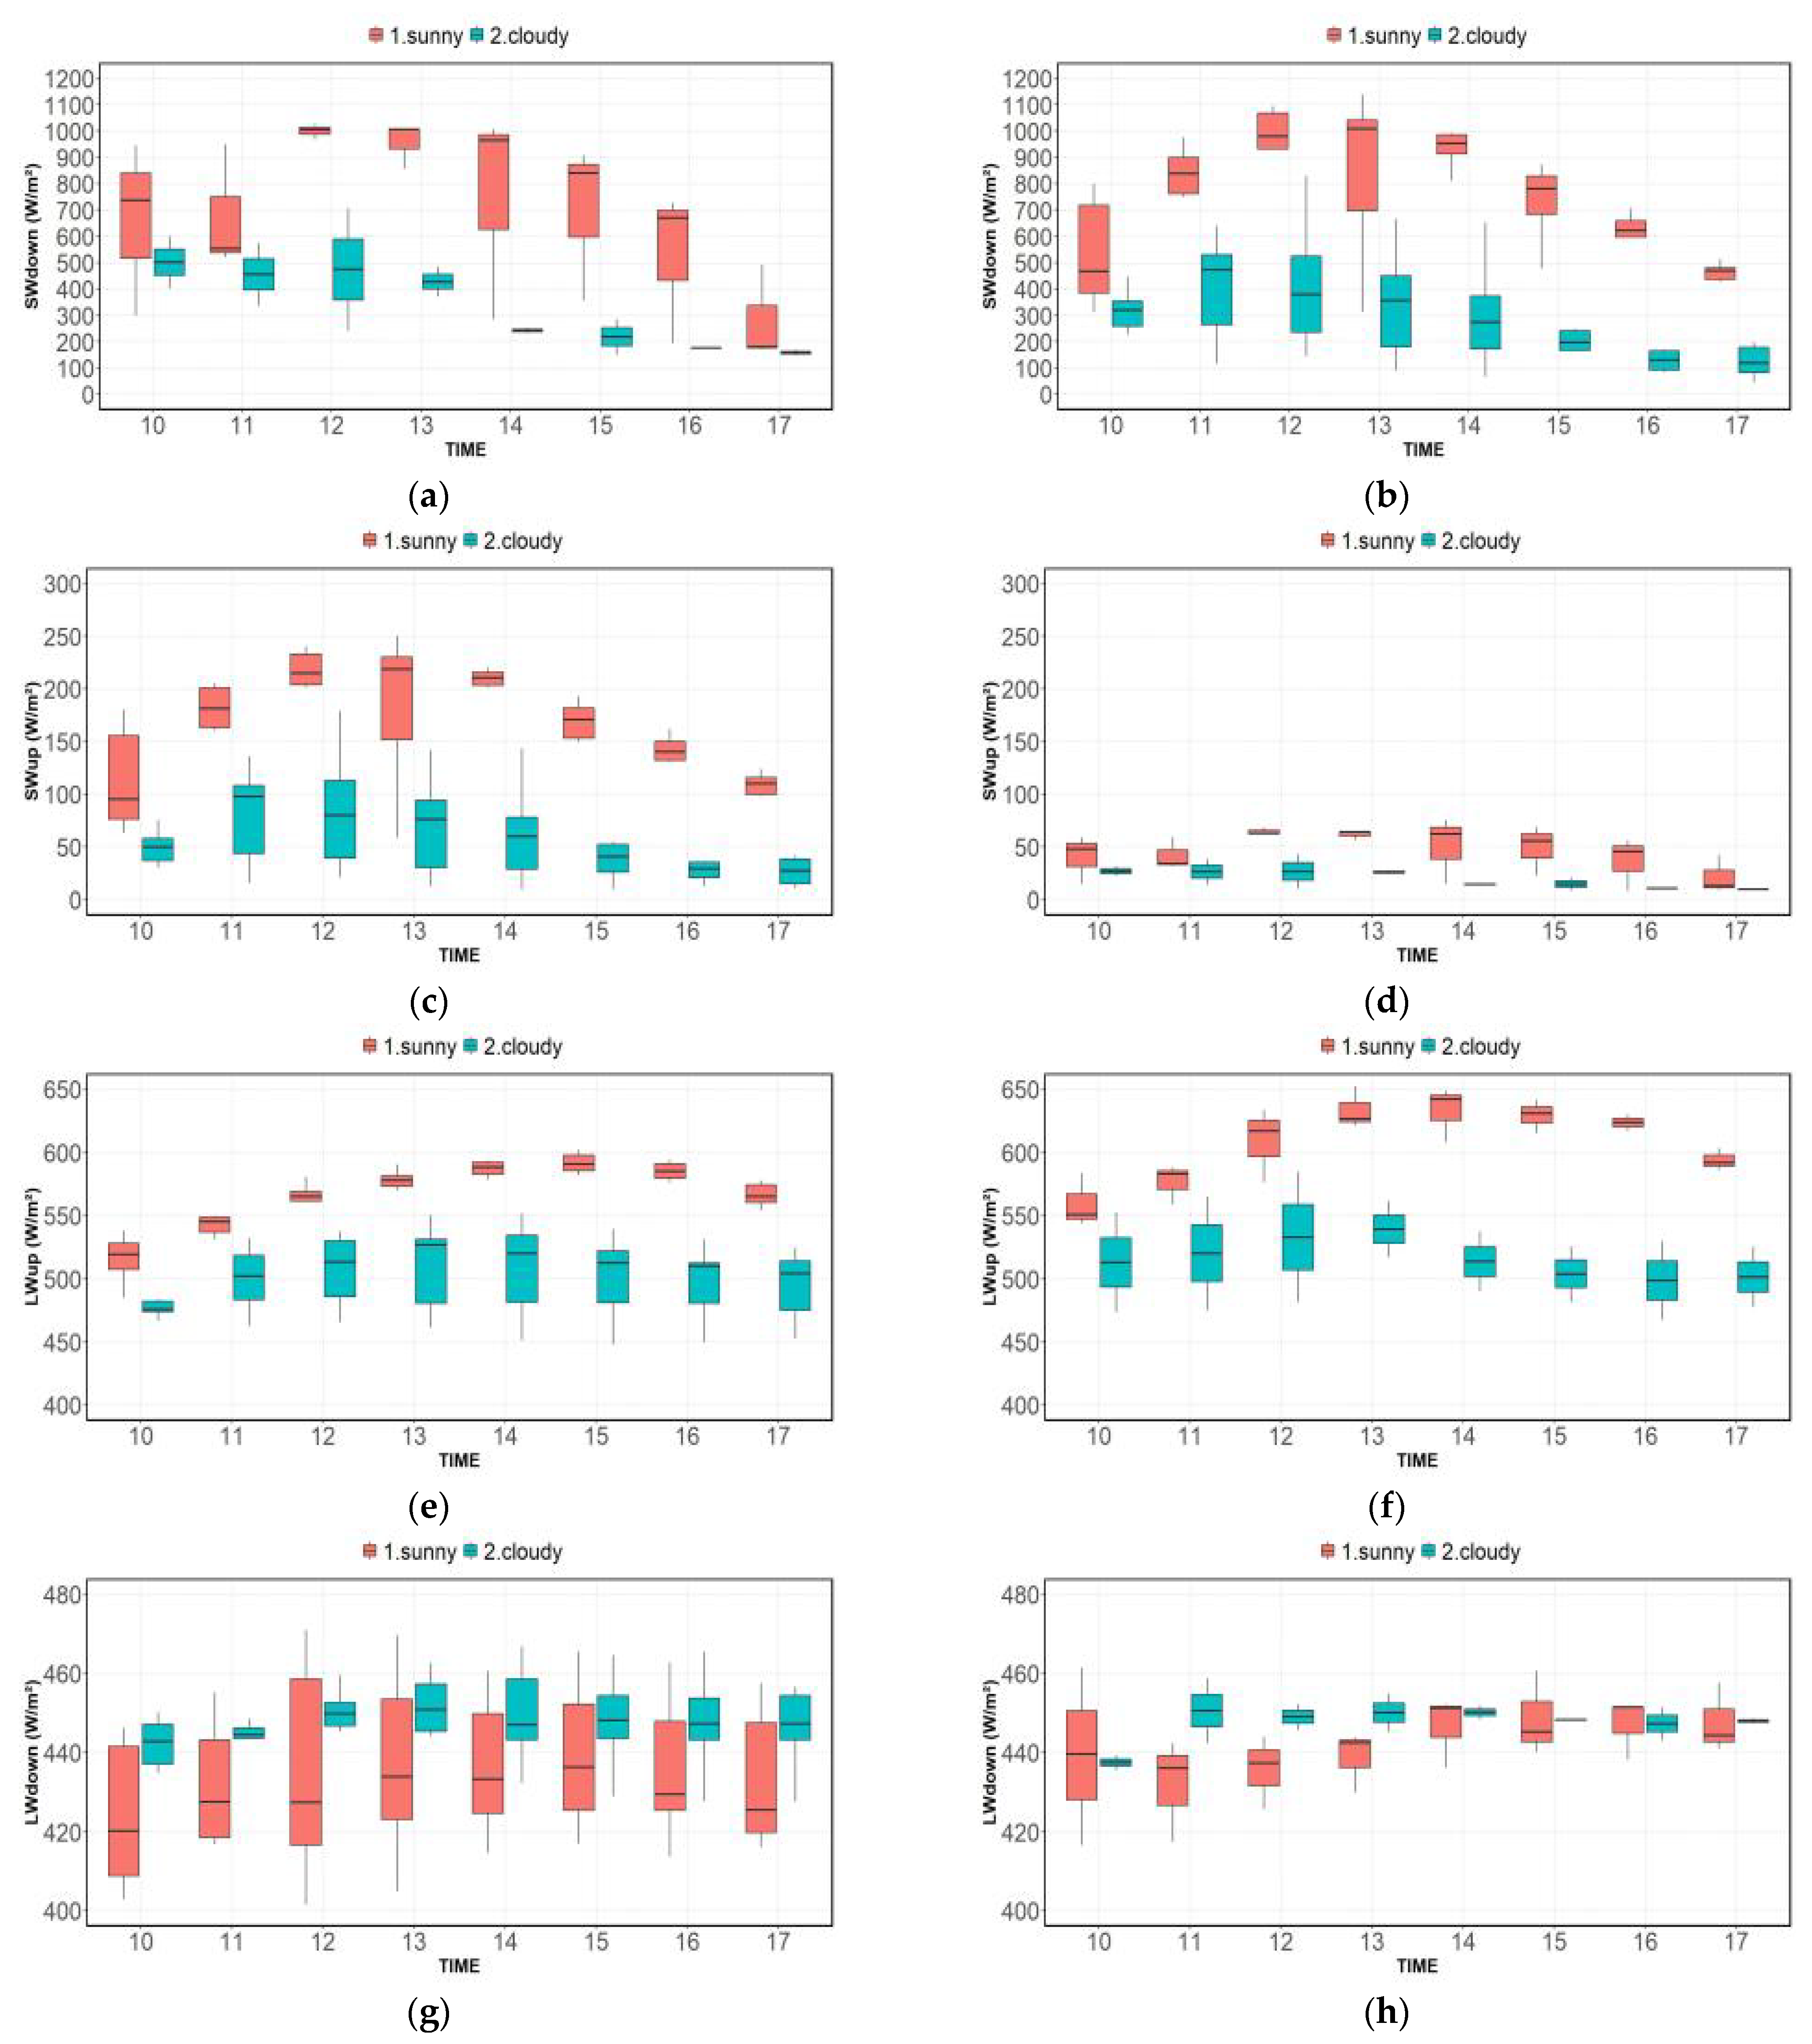
The observed values were classified into four categories: concrete and asphalt on sunny days and concrete and asphalt on cloudy days. The distribution of observed values for each time period was analyzed using a box plot. Radiation flux was analyzed using the values of downward short-wave radiation, upward short-wave radiation, downward long-wave radiation, and upward long-wave radiation (Figure 7). The net radiation and albedo (α) values were calculated and additionally compared and analyzed (Figure 8).
Rnet = SWdown + SWup + LWdown + LWup
α = SWup/SWdown
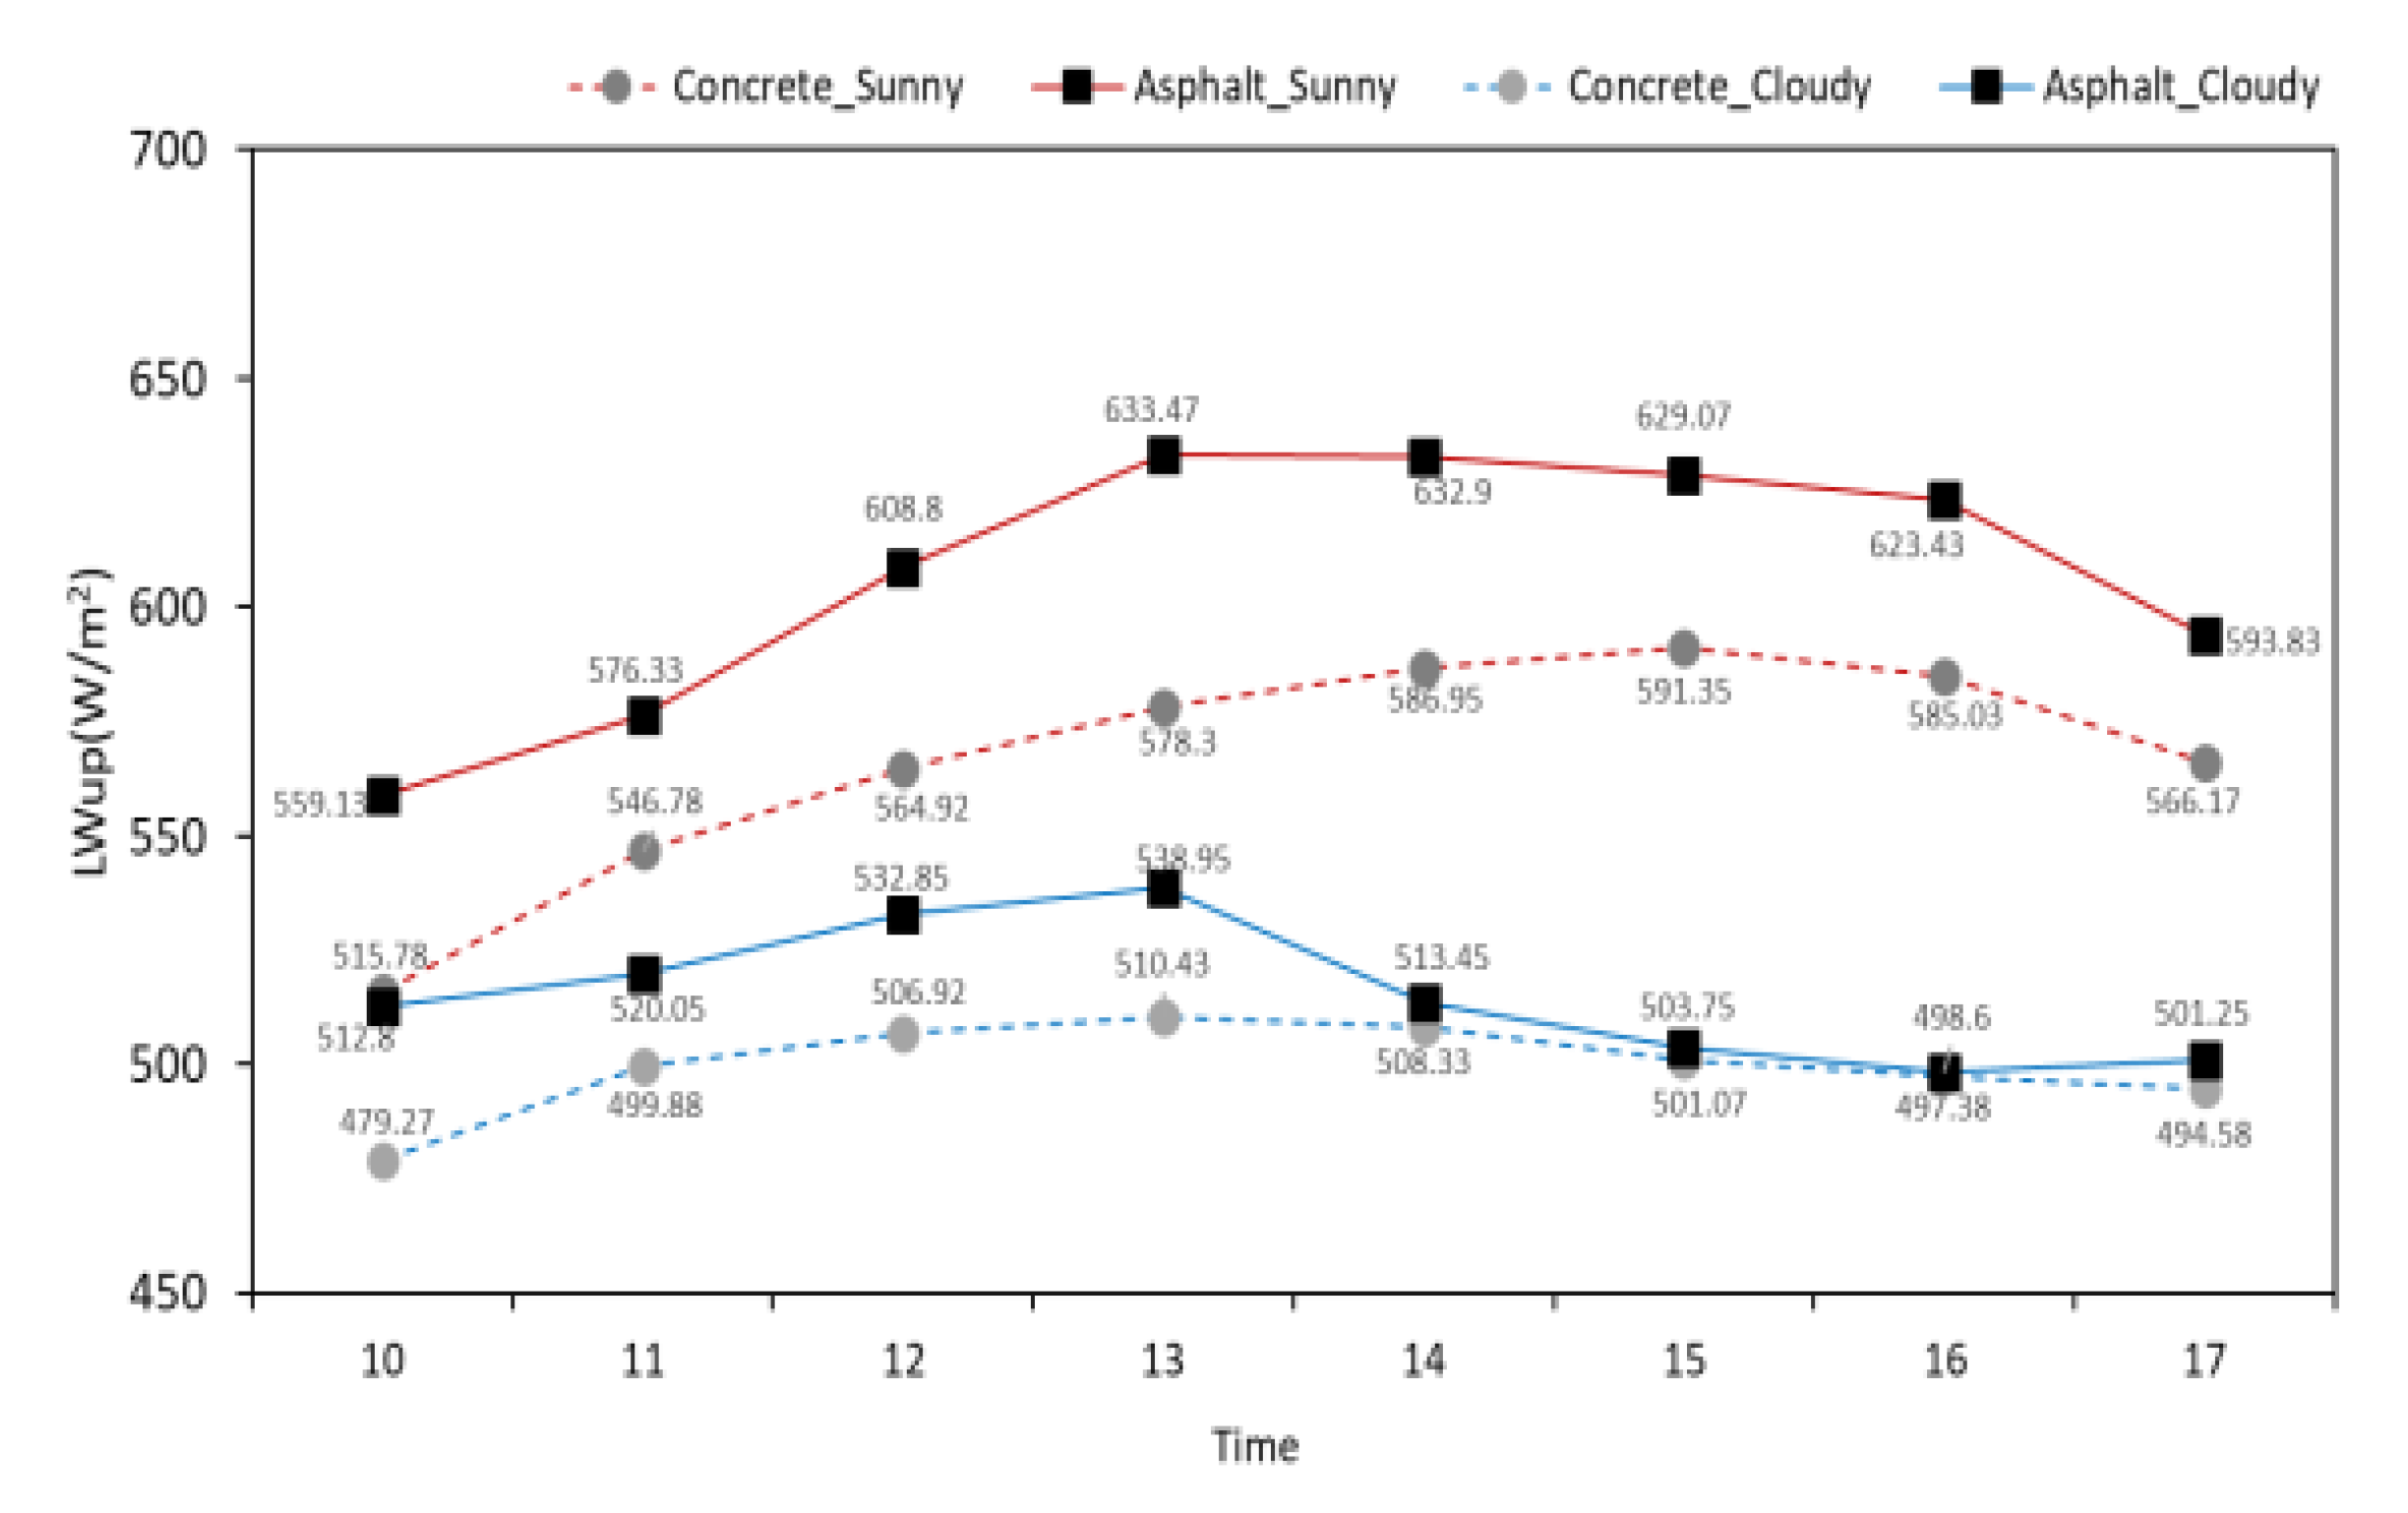
Downward short-wave radiation was higher on sunny days than on cloudy days, and a distinct difference in downward short-wave radiation incidence was observed. Between the concrete and asphalt, the trends of downward short-wave radiation distributed according to time period were similar, though the maximum value was higher at the concrete site. Upward short-wave radiation was substantially lower at the asphalt site than at the concrete site, indicating that little energy is reflected, which can influence the increase in the temperature of the asphalt surface. Upward long-wave radiation showed similar distribution trends according to the time period at the two sites. However, the asphalt site was higher than the concrete site, signifying that more heat is released from the asphalt. Downward long-wave radiation is influenced by clouds, and the large deviation likely occurred because there are more analysis days for the concrete site.
Summarizing the four radiation flux observation results, downward short-wave radiation (solar radiation) was higher at the concrete site, and upward long-wave radiation emitted from the ground was higher at the asphalt site, so the results can be attributed to the difference between the surfaces. The net radiation trends that were calculated for the concrete and asphalt sites based on the time period were similar, although the values at a particular time were different, indicating that the mean energy balance trends for concrete and asphalt are similar. Albedo was substantially lower at the concrete site, which is because the asphalt absorbed short-wave radiation rather than reflected it.
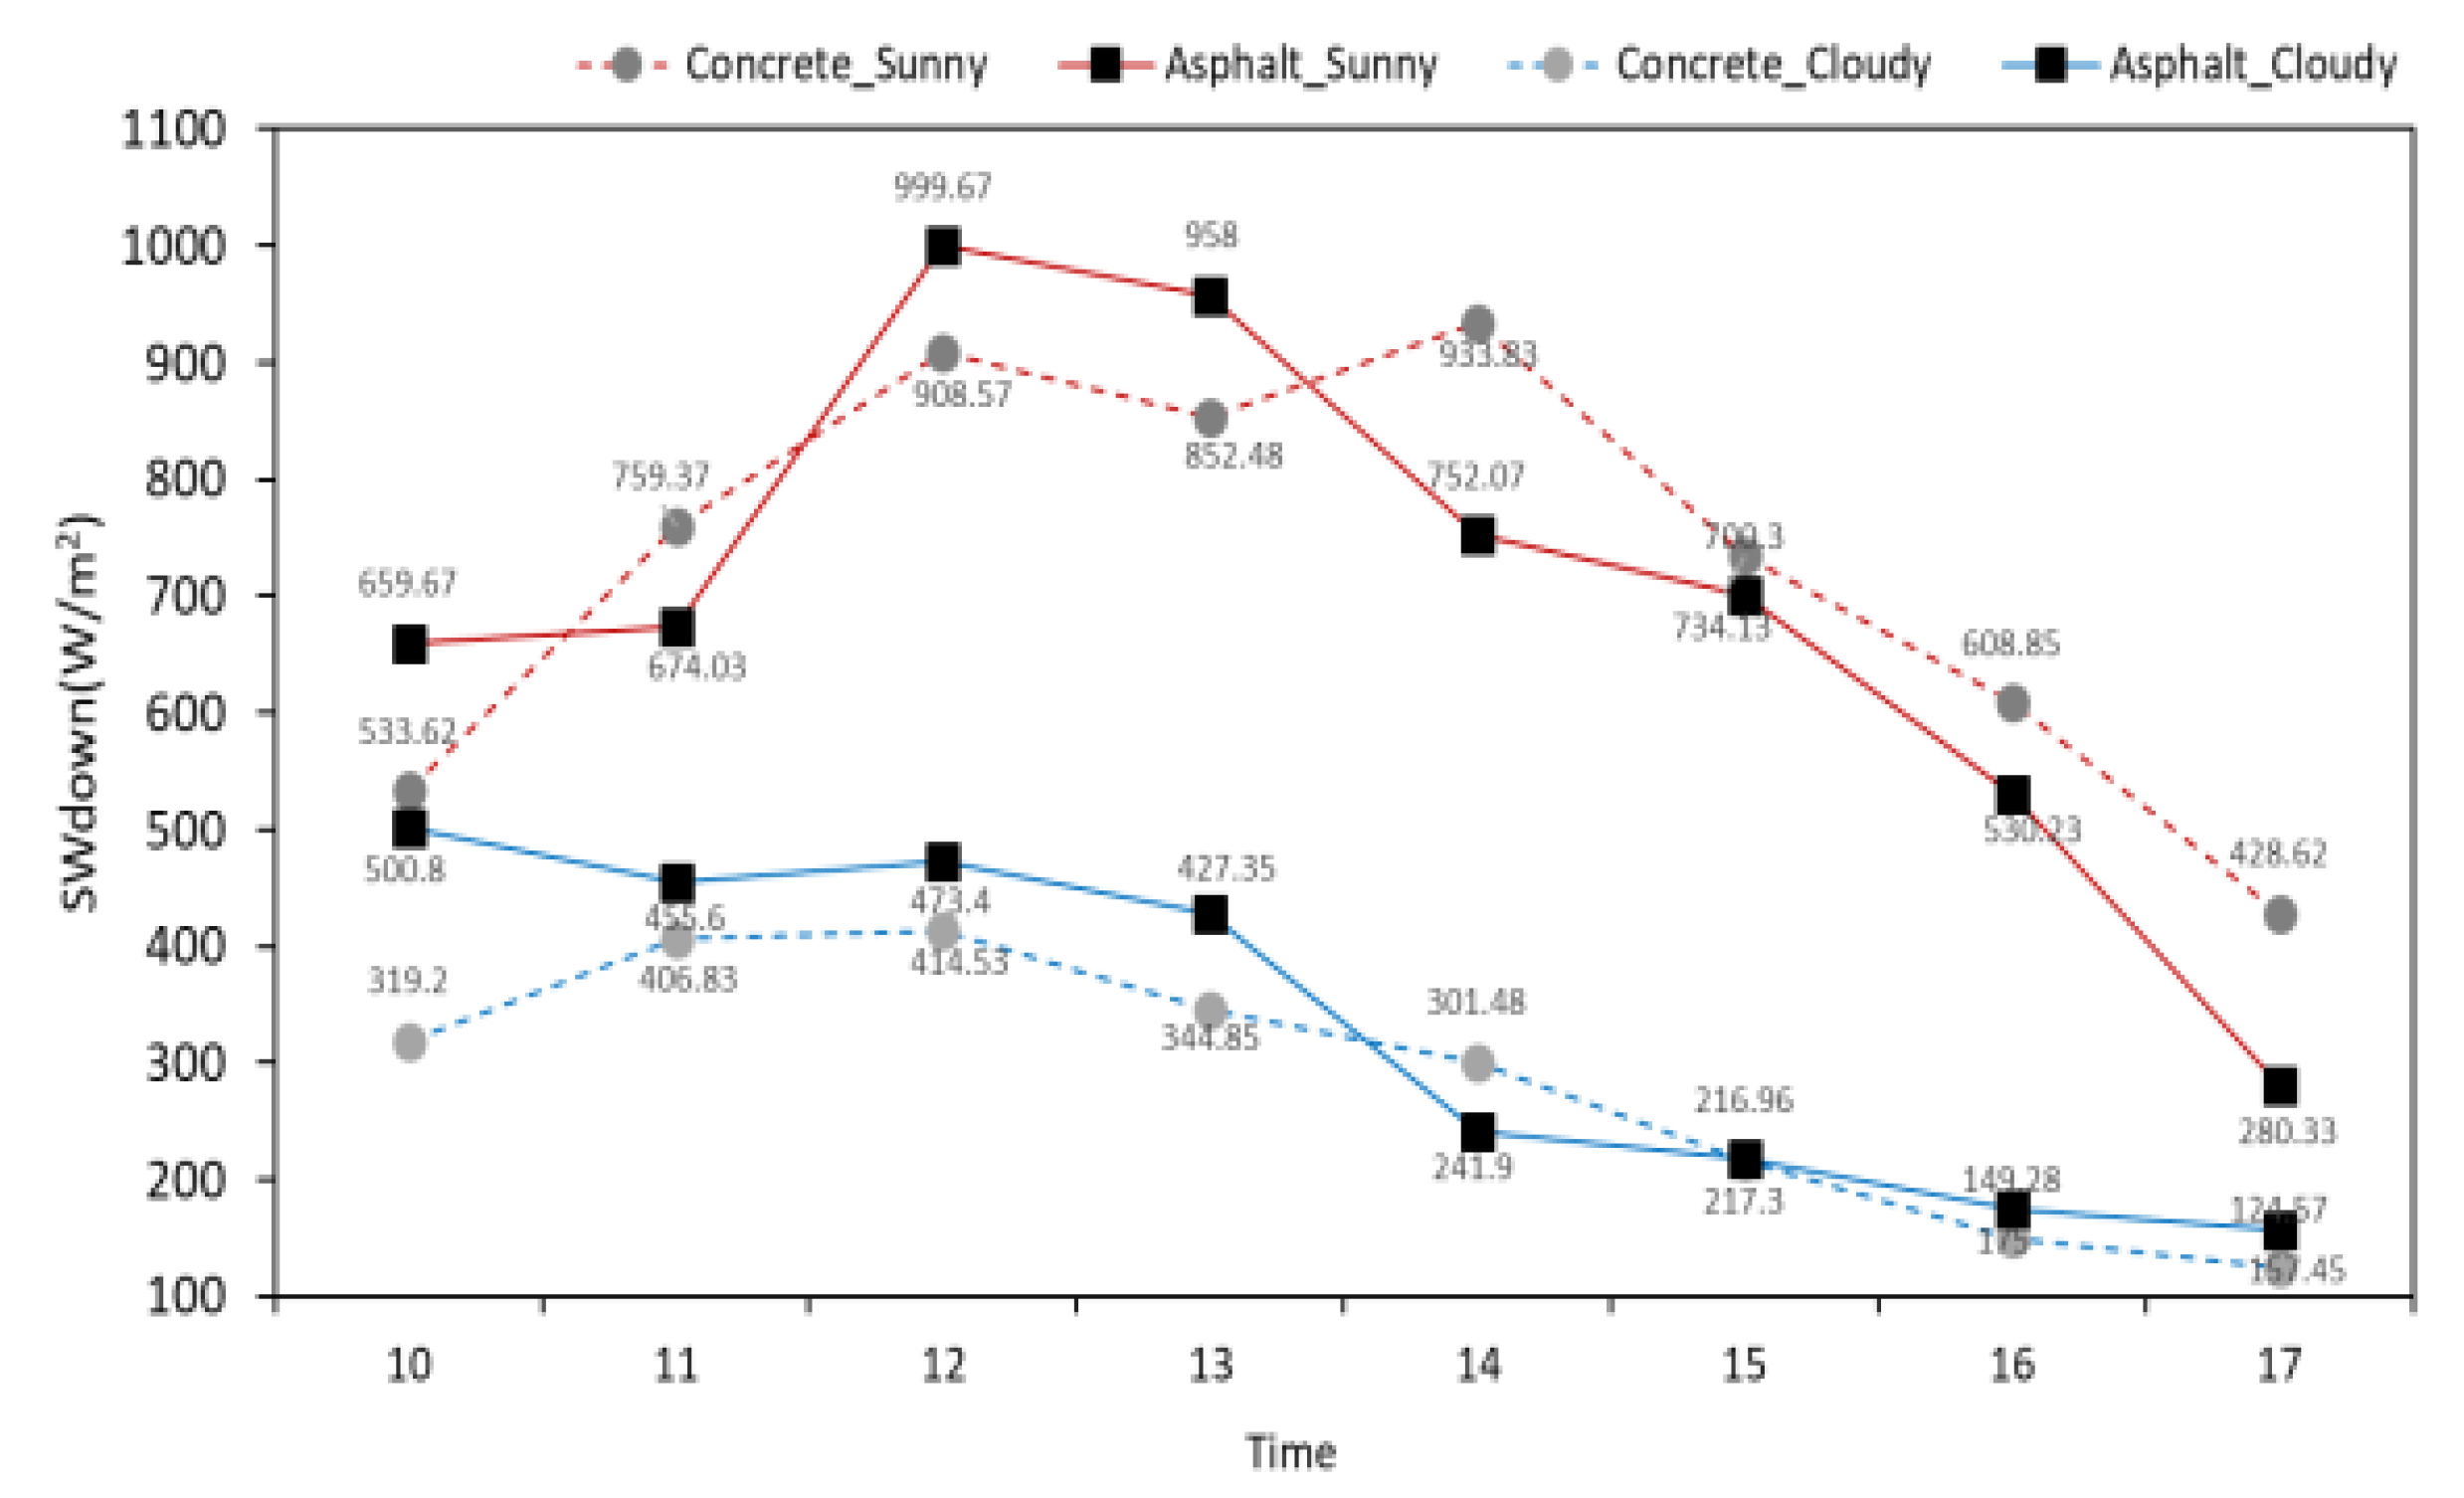
According to a comparative analysis by averaging the observation data by time period (Figure 9), the downward short-wave radiation values at the two sites were nearly identical, but higher at the concrete site than at the asphalt site at 12:00–13:00. The upward short-wave radiation was highest at the concrete site on a sunny day, and we found that large amounts of energy were reflected from the concrete on sunny days. Upward long-wave radiation showed the highest value at the asphalt site on a sunny day, suggesting that the asphalt road surface temperature on sunny days will be the highest. Downward long-wave radiation did not greatly differ according to site or weather.
3.2. Analysis of Worker PT Results
3.2.1. Calculation of Mean Radiant Temperature
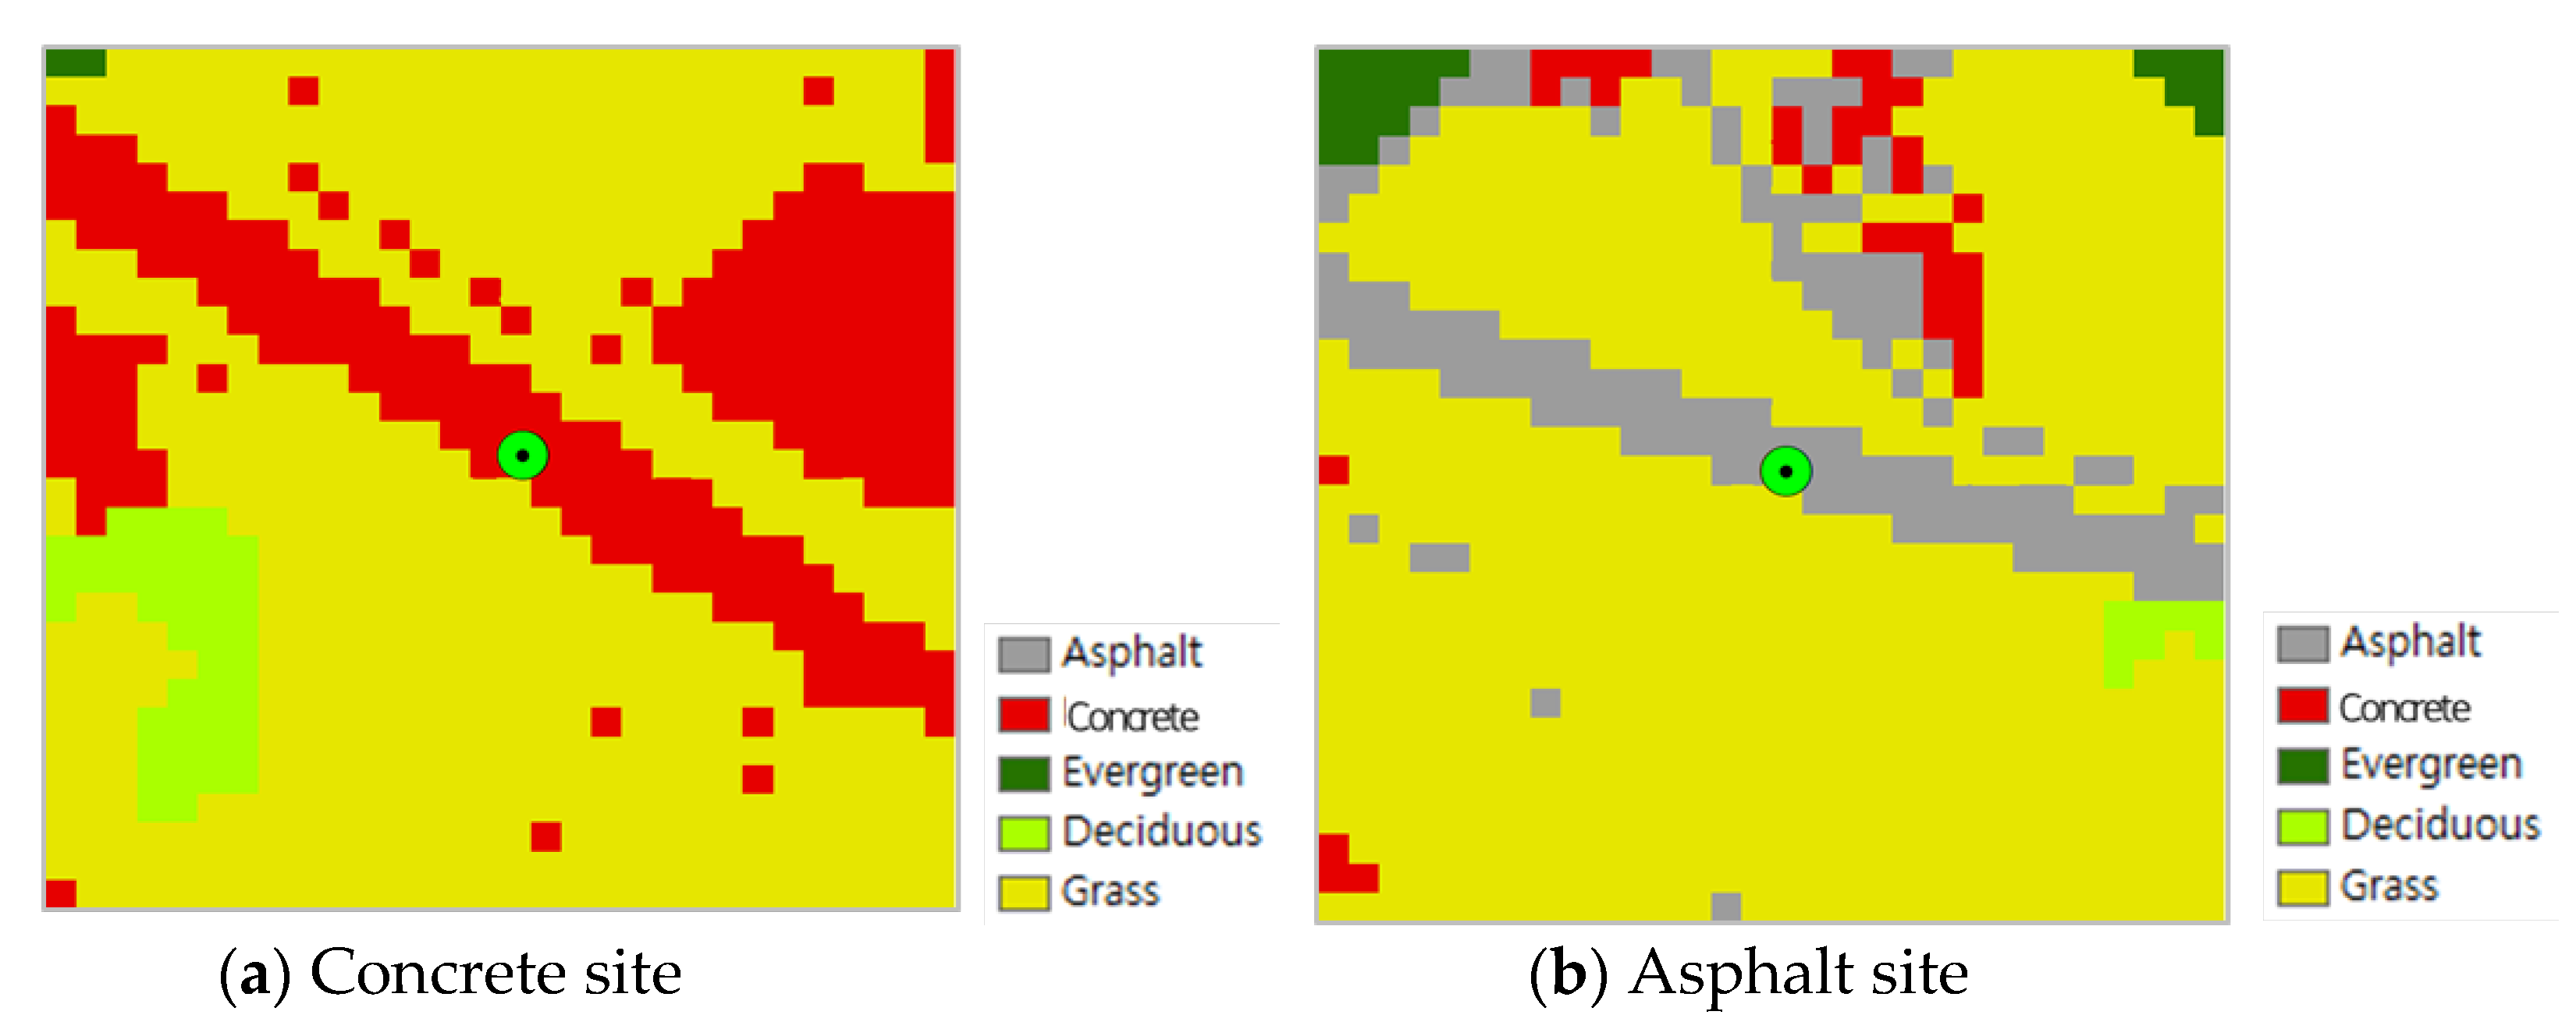
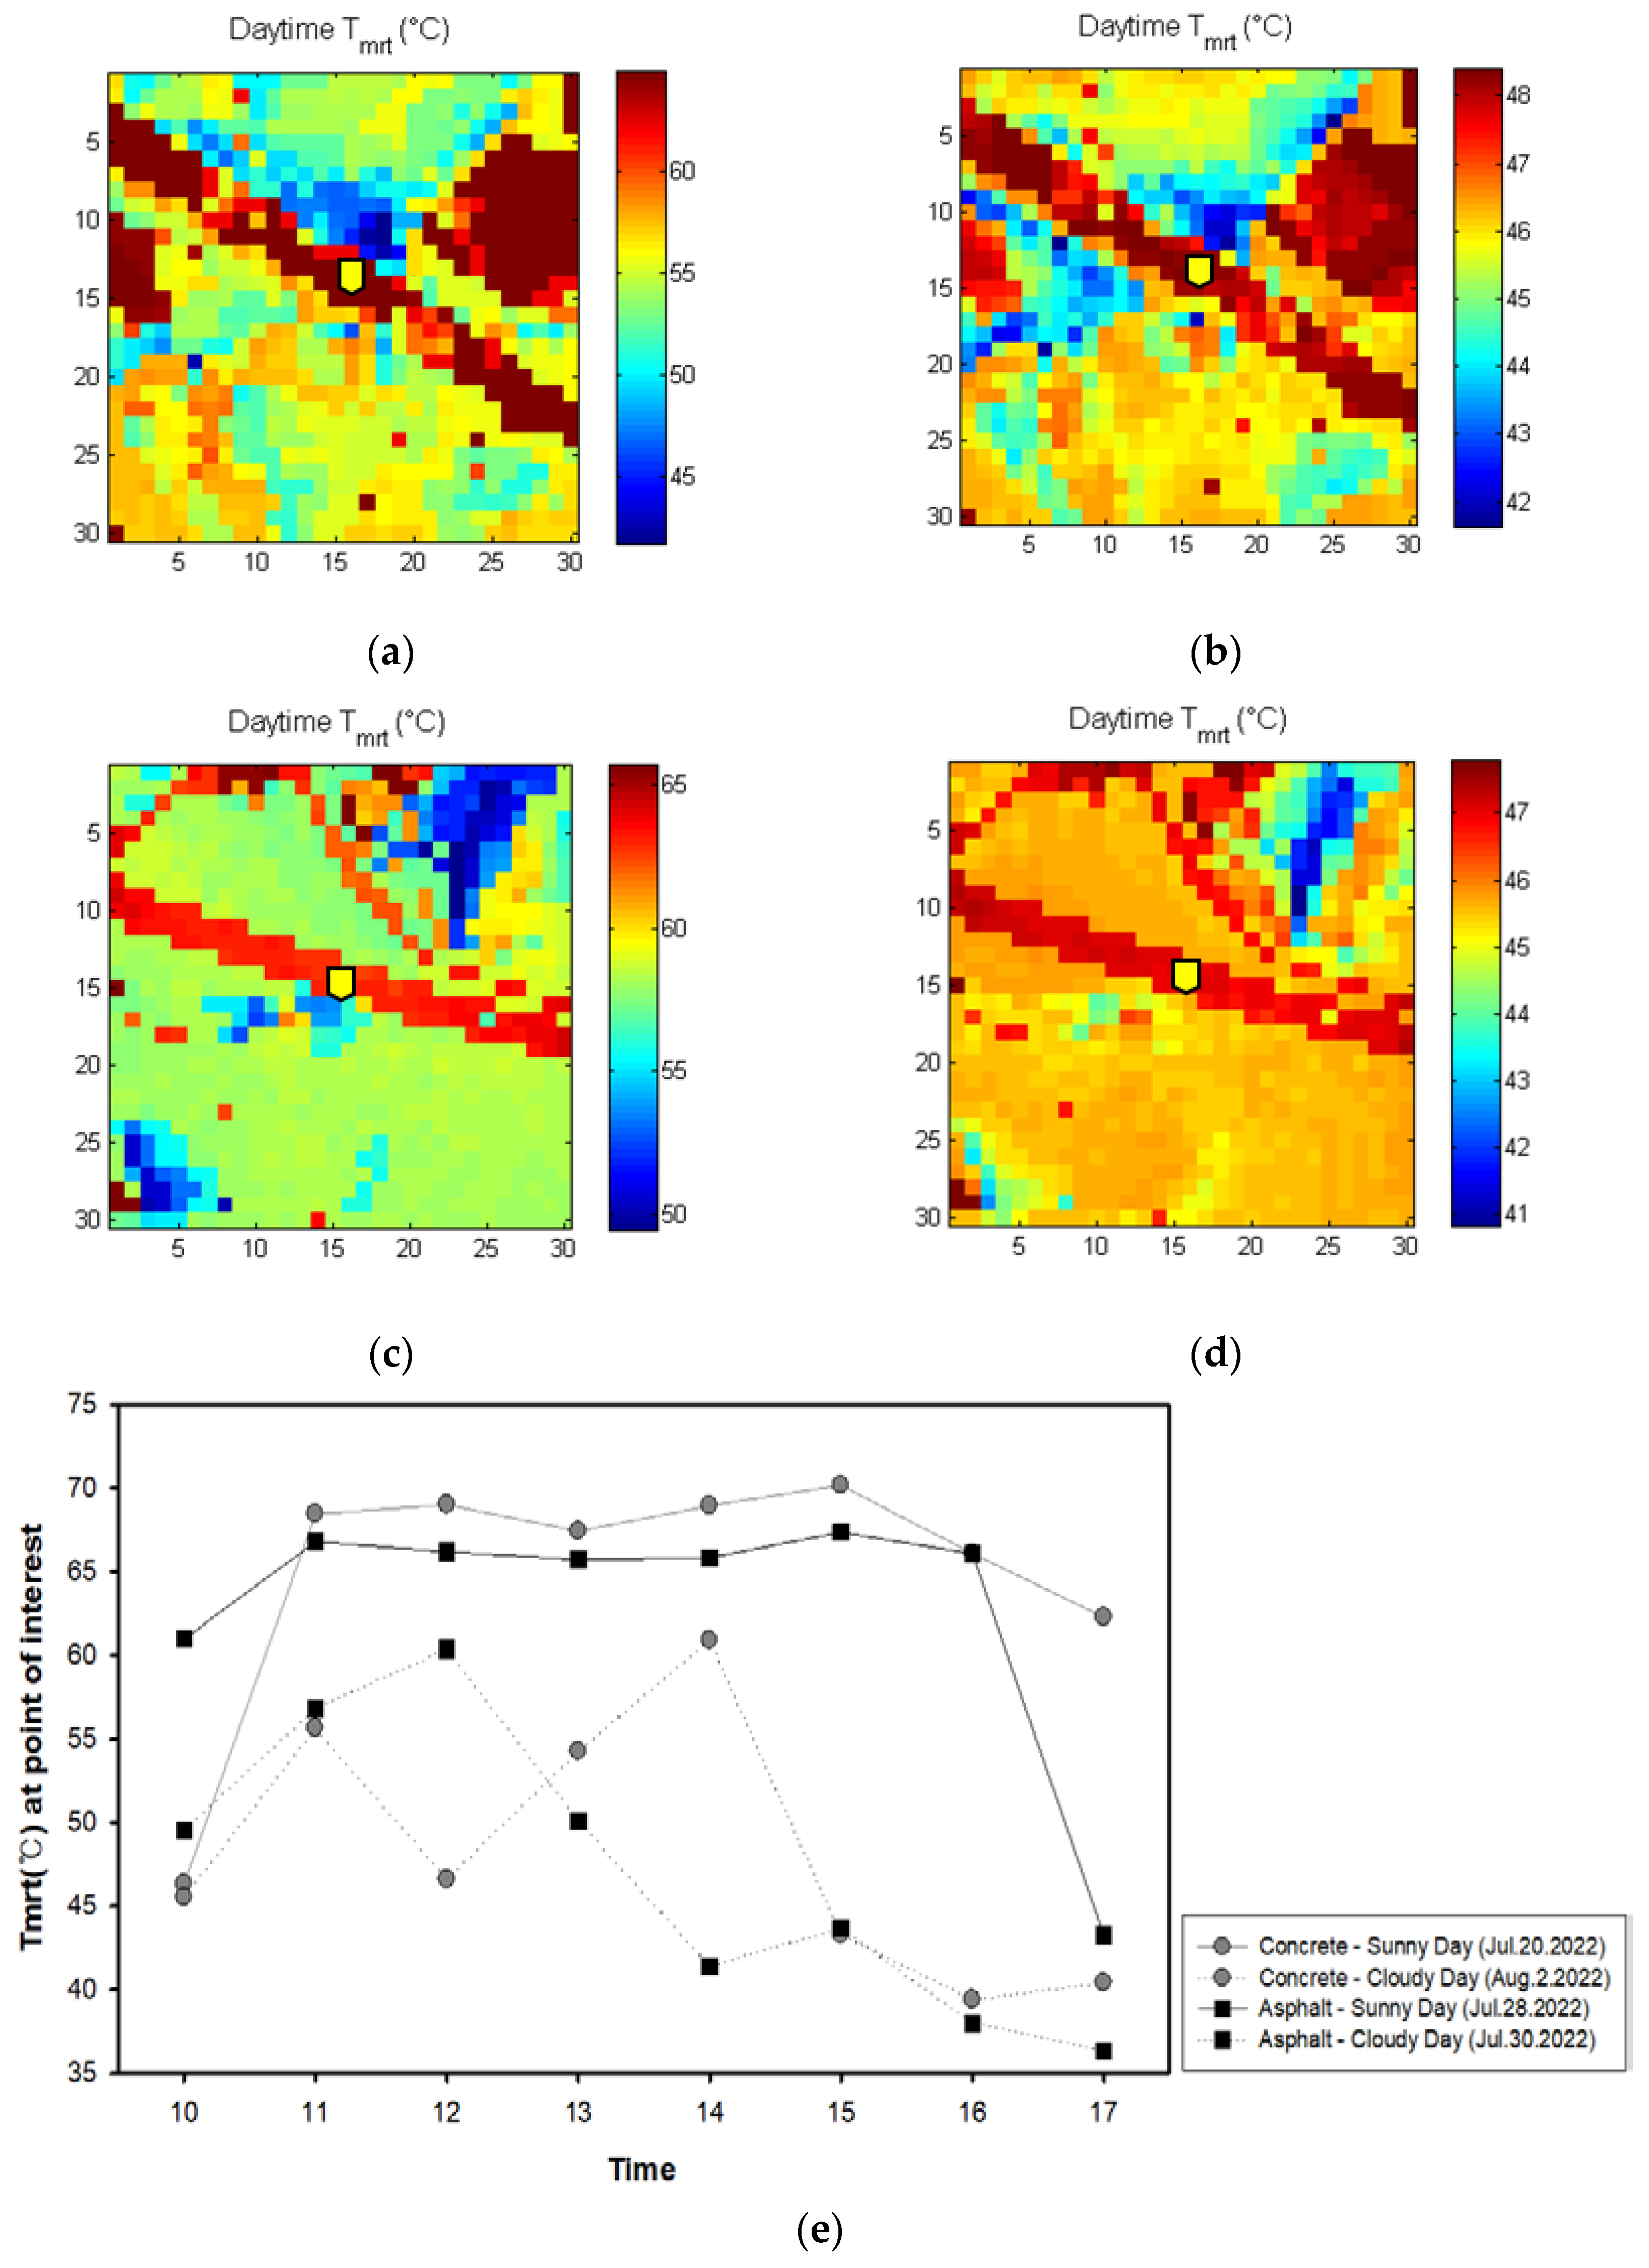
Of the meteorological data observed at the concrete and asphalt sites, temperature, humidity, and radiation were used as input data to calculate the mean radiant temperature used in the PT model. To this end, the solar radiation model SOLWEIG was used. To reflect the ground effect of concrete and asphalt, topography and land cover in a 3 km × 3 km area around the observation sites were constructed at 10 m resolution, and parameters for each land cover classification were applied (Figure 10). The days used to calculate the mean radiant temperature were the same days used in the analysis of radiation flux and meteorological data at the observation sites, and the selected cases of sunny days and cloudy days at each site were the same. Using the observation data, the SOLWEIG model was run to calculate the mean radiant temperature on sunny days and cloudy days at the concrete and asphalt sites (Figure 11).
At the concrete site, the average downward short-wave radiation for 6 sunny days was 719.93 W/m2, and the average downward short-wave radiation for 6 cloudy days was 284.71 W/m2. At the asphalt site, the average for 3 sunny days was 694.29 W/m2, and that for 2 cloudy days was 331.10 W/m2. The temperature, humidity, and radiation data were inputted into the solar radiation model to calculate the hourly mean radiant temperature. The mean radiant temperature of concrete on sunny days increased up to 70 °C (at 15:00), and on cloudy days, the mean radiant temperature was sometimes below 40 °C even during the day. On sunny days, the daily mean downward short-wave radiation was 777.56 W/m2 at the concrete site and 793.73 W/m2 at the asphalt site. Thus, it was slightly higher at the asphalt site. According to the analysis by time at each site, at 10:00, the mean radiant temperature was 46.3 °C at the concrete site and 61.0 °C at the asphalt site, thus approximately 15 °C higher at the asphalt site. In contrast, at 17:00, it was 62.3 °C at the concrete site and 43.3 °C at the asphalt site, thus approximately 19 °C higher at the concrete site. On cloudy days, the radiation flux reaching the ground was reduced owing to the influence of clouds, so the temporal changes in mean radiant temperature also differed. The highest mean radiant temperature at the concrete site was 60.6 °C at 14:00 pm, while that at the asphalt site was 60.4 °C at 12:00.
3.2.2. Prediction of PT
This study constructed a PT prediction model considering meteorological factors, mean radiant temperature, insulation effect of clothing, and metabolism (activity). The mean radiant temperature was calculated using the SOLWEIG model through observed values, and the surveyed metabolic rate and clothing index of the age groups were applied to derive the model results (Figure 12). In the modeling results of the present study, uncertainty may have been amplified because the result of the SOLWEIG model was used as the input value for the PT model. However, the SOLWEIG model is a validated solar radiation model and shows similar values for mean radiant temperature when compared with the observed and calculated mean radiant temperature values [31,34,35]. In previous studies, the comparison between the results of the SOLWEIG model and the observed values showed that R2 was 0.9 or higher. Therefore, it was assumed that mean radiant temperature could be used in the SOLWEIG model. However, it should be recognized that there are some uncertainties owing to conditions such as weather type and surface environment.
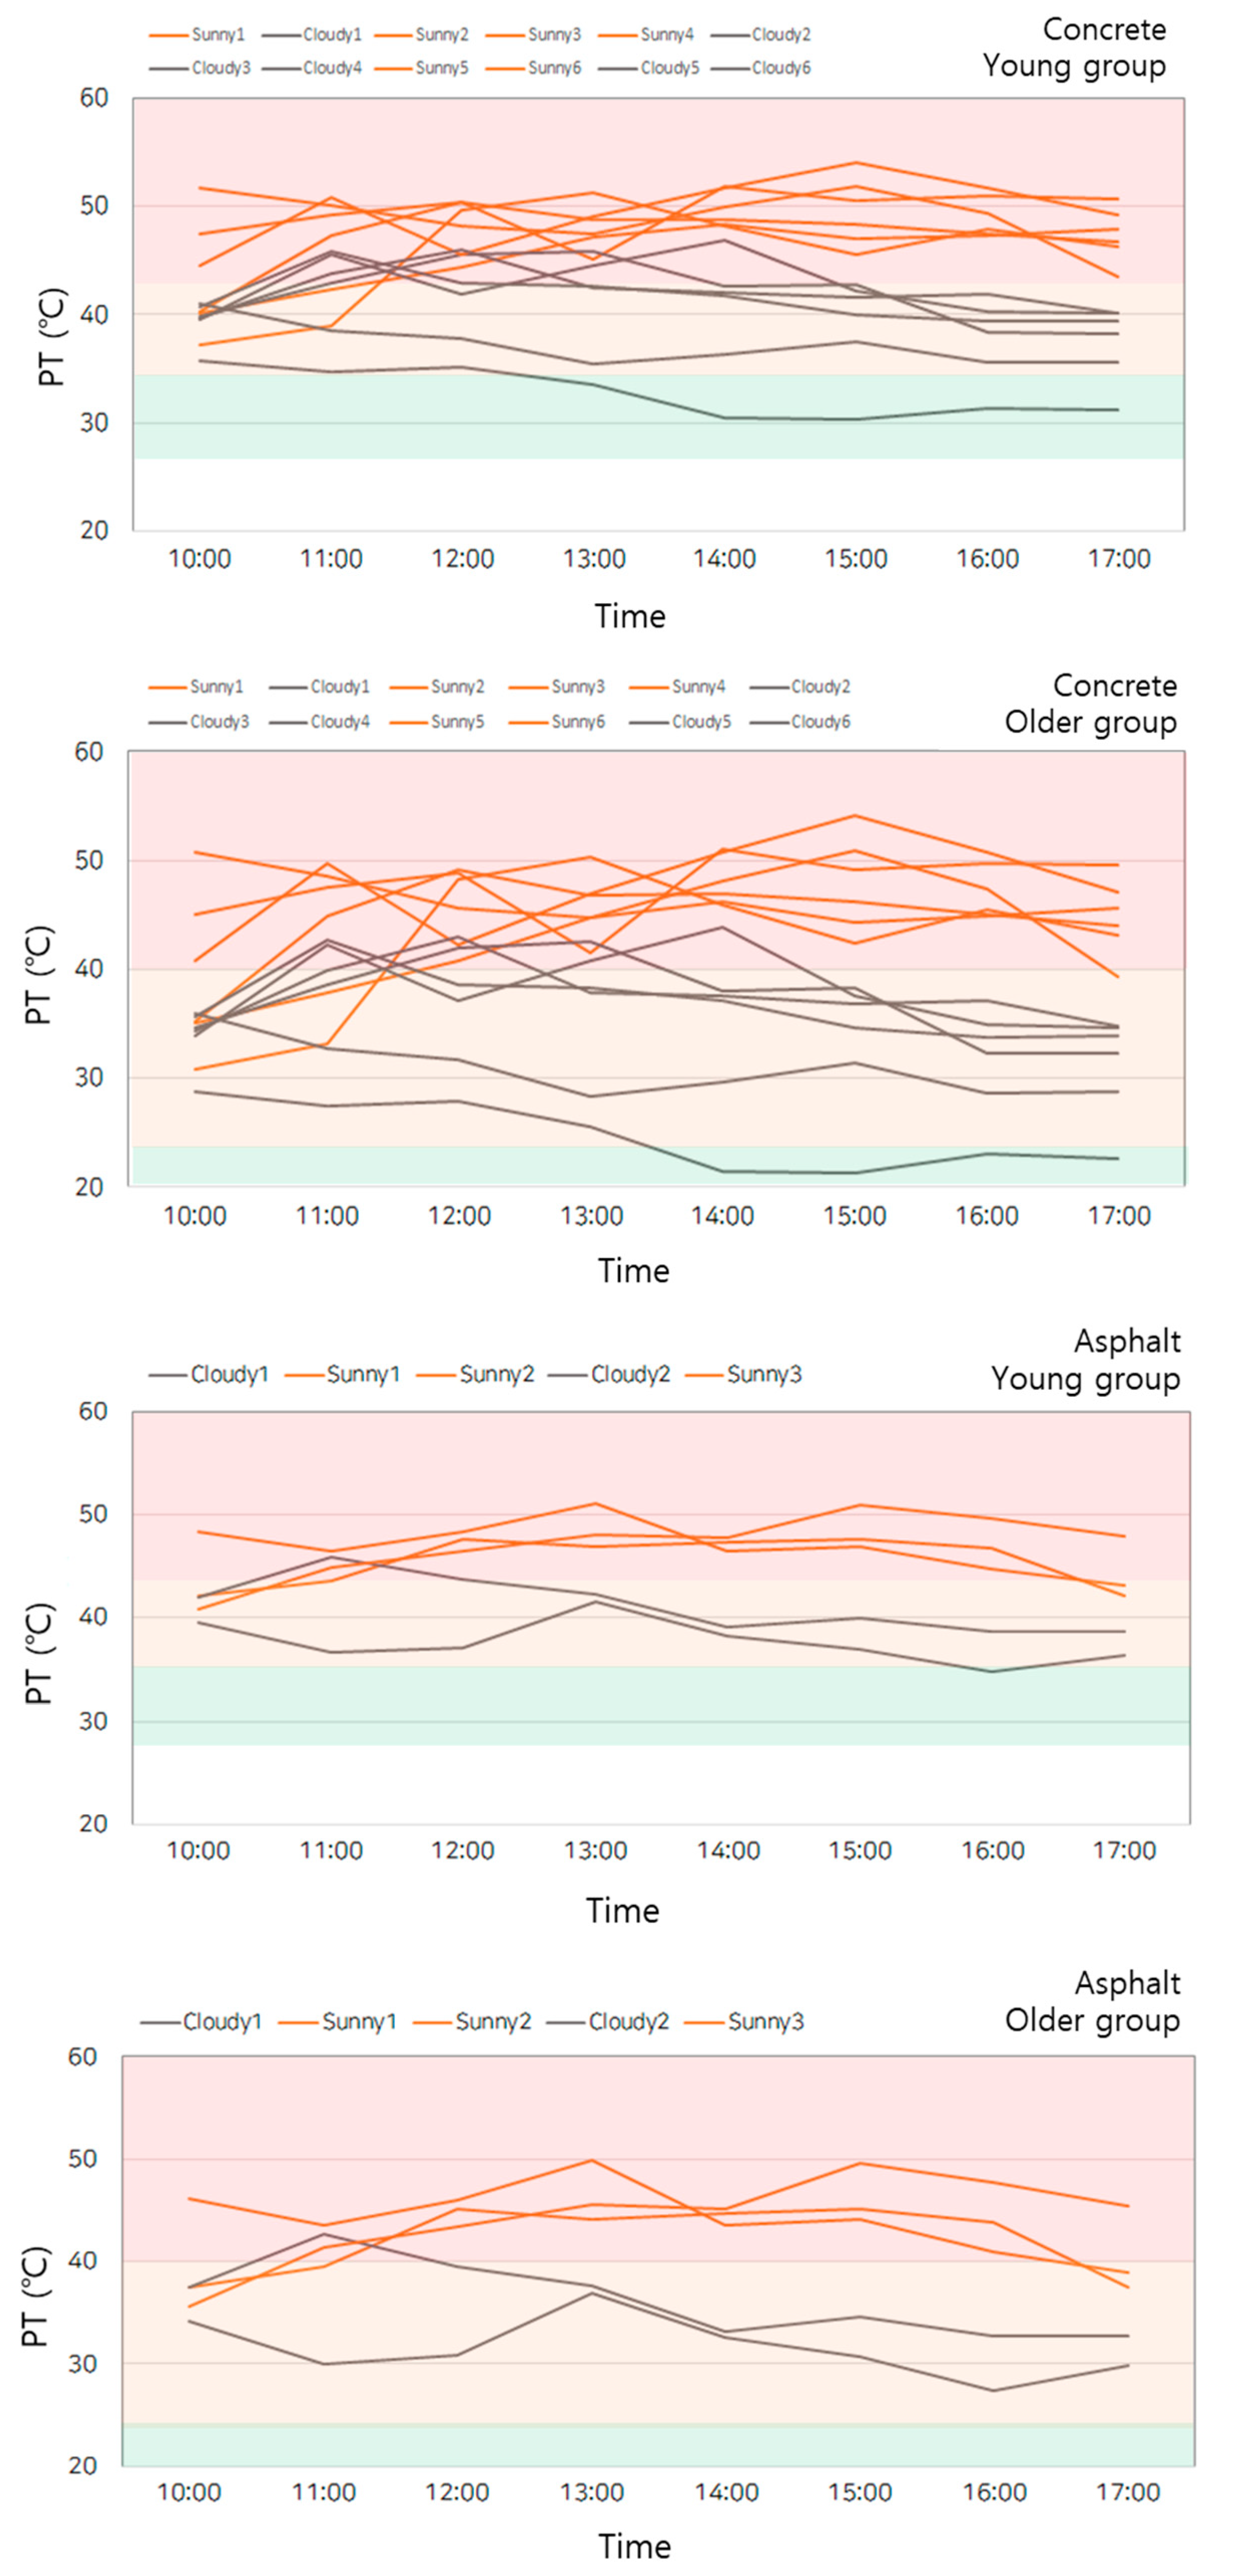
At the concrete site, the heat stress intensity of the young group was generally ‘very hot‘ on sunny days, whereas on cloudy days, the stress intensity was high between 12:00 and 15:00. On cloudy days, the intensity was sometimes ‘warm‘ during the daytime, but it was usually ‘hot’ or higher. Compared with the young group, the older group showed a wide range of workers’ PT according to the heat stress intensity. Overall, ‘hot’ or higher was observed on both sunny and cloudy days.
At the asphalt site, the heat stress intensity of the young group was ‘very hot‘ after 11:00 on sunny days. That on cloudy days was generally ‘hot’, and unlike at the concrete site, it remained ‘hot’ afterward. At the asphalt site, the heat stress intensity of the older group was ‘very hot’ during the daytime on sunny days, particularly high from 13:00–15:00. As in the young group, heat stress was ‘hot’ on cloudy days, and it did not decrease to ‘warm’ in any time period.
We analyzed the hourly mean PT of the workers at the concrete and asphalt sites (Table 4). The results presented in Table 4 can confirm the PT statistics for different weather conditions and different surfaces. Compared with the road surface temperature values analyzed in Section 3.1.2, the PT at the concrete and asphalt surfaces showed results that were proportional to the road surface temperature. Asphalt PT was higher than concrete PT, and the temperature difference between cloudy and sunny days was approximately 10 °C. The results show that PT value increases with an increase in heat exposure. The PT and heat stress of young workers at the concrete site was ‘very hot (43 °C or higher)’ during all hours of the day on sunny days, and ‘hot (36–43 °C)’ on cloudy days. In contrast, PT and heat stress at the asphalt site was ‘very hot’ in all daytime hours on sunny days, and ‘hot’ on cloudy days. The PT and heat stress of older workers at the concrete site was ‘very hot (40 °C or higher)’ in all daytime hours except 10:00 on sunny days, and ‘hot (24–40 °C)’ on cloudy days. In contrast, the PT and heat stress of older workers at the asphalt site was ‘very hot (40 °C or higher)’ in all daytime hours except 10:00 on sunny days, and ‘hot (24–40 °C)’ on cloudy days. Thus, the difference in PT between sunny days and cloudy days was larger in the older group than that in the younger group.
3.3. Construction of Regression Model
3.3.1. Construction of Regression Model for Road Surface Temperature According to Temperature
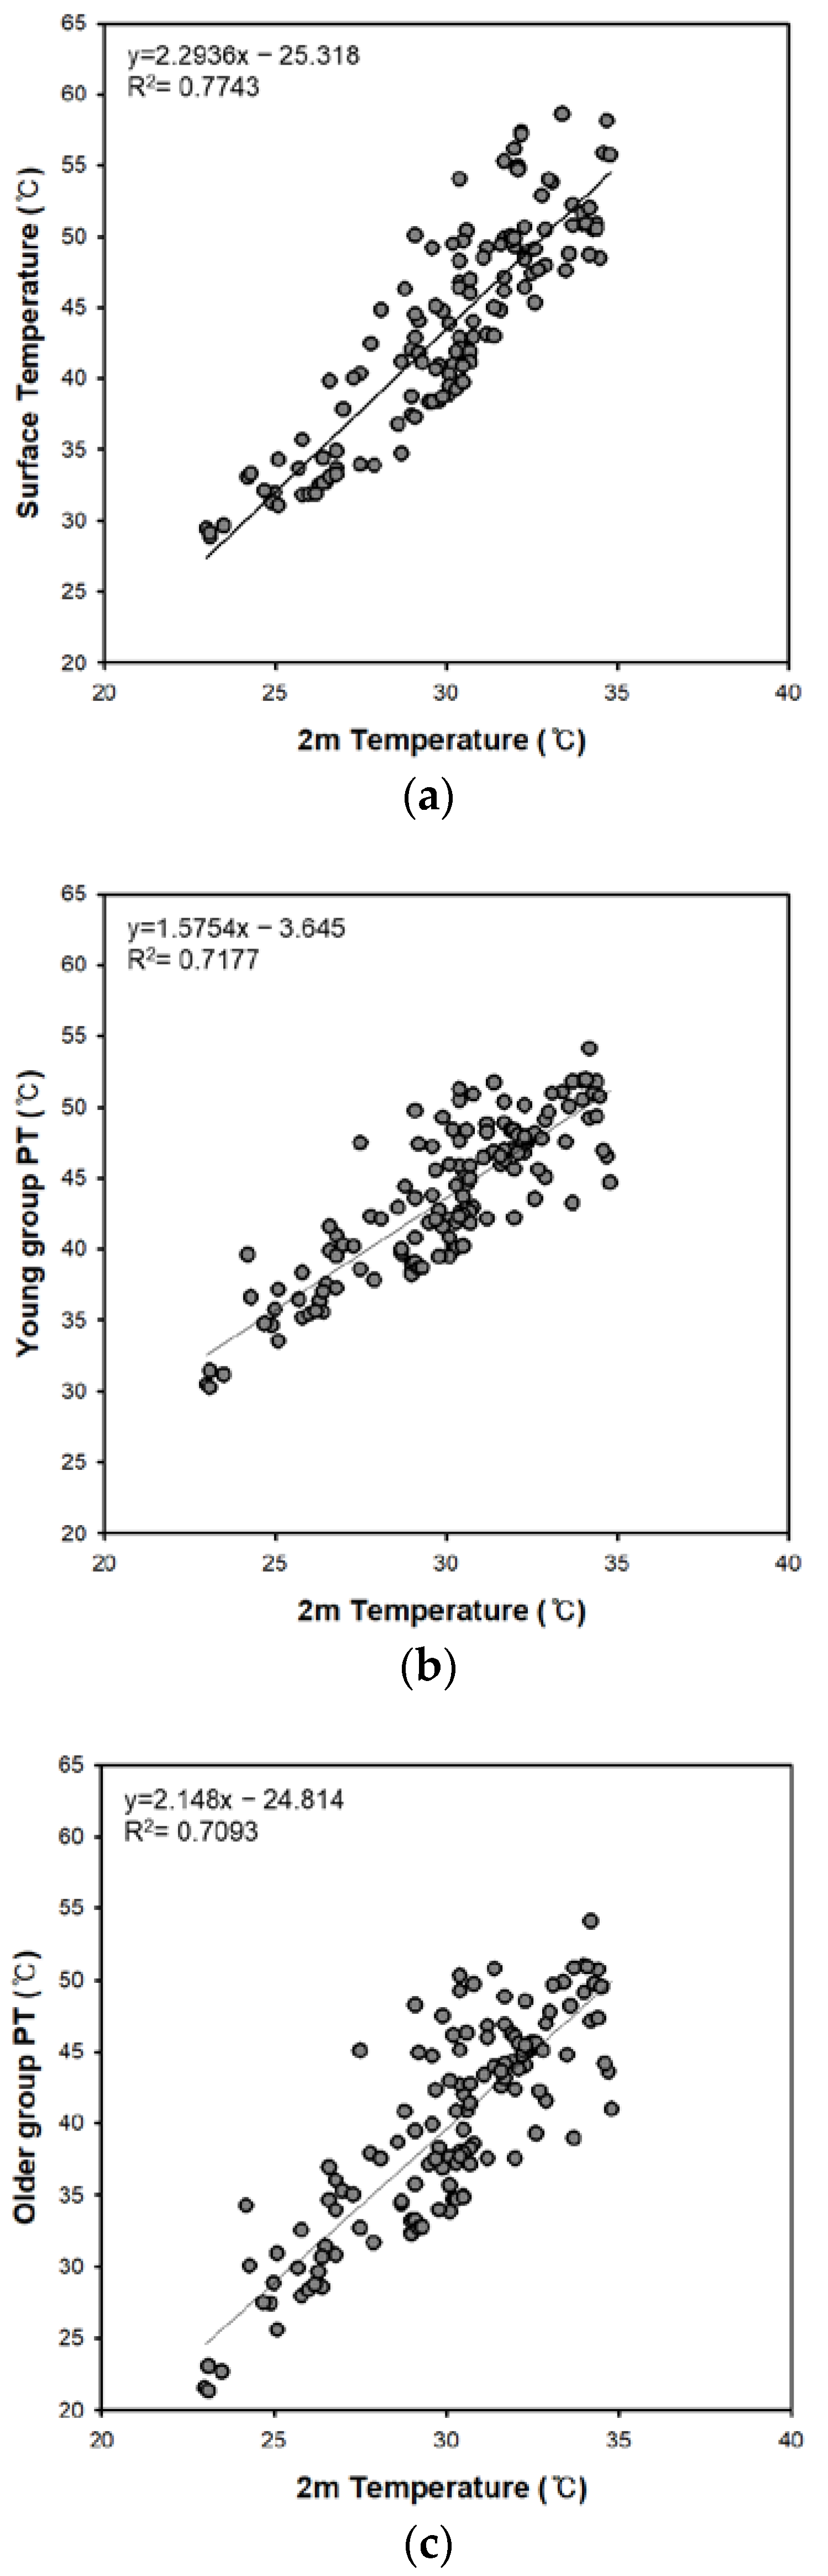
This study built a regression model through the relationship between temperature and road surface temperature using data for a total of 17 days (10:00 to 17:00) on sunny days (9 days) and cloudy days (8 days) at the concrete and asphalt observation sites (Figure 13a). The values calculated from the upward long-wave radiation of the observed road data were used for the road surface temperature. The temperature and road surface temperature show a high correlation at R2 = 0.7743. The regression equation based on the relationship between the observed road temperature and road surface temperature is as follows. The standard error of the estimate is 1.3.
y = 2.2936x − 25.318 (R2 = 0.7743)
3.3.2. Construction of Regression Model for PT According to Temperature
A regression model was built using the observed road values and results of the PT model (Figure 13b,c). Identical to the construction of the road surface temperature regression model, a total of 17 days of data at the concrete and asphalt observation sites were used. As in the road surface temperature prediction model, the observed road temperature data were used, and regression models were built for the young group and older groups.
The regression equations based on the relationship between the observed road temperature and PT of the young group and older group are as follows. The standard error of estimate was 2.8 and 3.9, respectively.
y = 1.5754x − 3.645 (R2 = 0.7177)
y = 2.148x − 24.814 (R2 = 0.7093)
R2 was slightly higher in the regression model for the young group than the older group. As evidenced, the PT distribution of the young group according to temperature is wider than that of the older group. Comparing the slopes of the regression models for the young group and the older group, one can predict that the deviation in PT of the older group will be calculated larger than that of the young group. Through each prediction model, one can predict the road surface temperature according to changes in temperature and the PT of the young group and older group.
3.3.3. Calculation of Road Surface Temperature and Workers’ PT Rating According to Temperature
The three regression models constructed above were used to calculate the road surface temperature and PT of the young and older groups according to the temperature (20–40 °C) during the daytime (10:00–17:00) in the hot season (Table 5). Moreover, the range of workers’ PT was classified according to temperature by applying the risk criteria of NIMS. The road surface temperature can be regarded as the daily maximum road surface temperature calculated by the prediction model based on road observations. The PT of workers in the young and older groups signifies the daily maximum PT applying the workers’ clothing, metabolism, activity intensity, and the road environment (temperature, humidity, radiation, and wind speed). The PT threshold established by the NIMS was applied. Table 5 marks the first digit of the decimal point to define each zone. Since there is a possibility of error in the regression equation, there is a possibility of error in the PT values.
The road surface temperature was predicted to be higher than the temperature in the range of +0.5 to 19 °C. The young group’s PT was predicted to be higher than the temperature in the range of +7 to 16 °C, and the older group’s PT was predicted to be higher than the temperature in the range of –1.8 to 15 °C. Although the young group’s PT was predicted to be higher than the temperature, the older group’s PT was predicted to be lower when the temperature was 20–21 °C. However, from 22 °C or higher, the PT was predicted to be higher than the temperature.
The young group felt ‘warm’ when the temperature was 21–25 °C, and the older group felt ‘warm’ when the temperature was 22 °C or lower. The young group felt ‘hot’ when the temperature was 26–29 °C, and the older group felt ‘hot’ when the temperature was 23–30 °C. Additionally, the young group felt ‘very hot’ when the temperature was 30 °C or higher, and the older group felt ‘very hot’ when the temperature was 31 °C or higher. Compared with that of the young group, the PT of the older group tended to rise more rapidly as the temperature increased. As the daytime observation data at the highway concrete and asphalt sites during the hottest period of summer were used, the PT values were calculated based on the hot season. Therefore, the derived values were somewhat higher than the temperature. Through the PT values of the young and older groups calculated by the regression models built using the observation data and PT results, the temperatures that people actually feel on concrete and asphalt roads in heat wave conditions can be predicted.
4. Discussion
4.1. Observation
Previous studies have observed and analyzed meteorological and radiation energy data based on surface characteristics (such as buildings, grass, and water) [35,36]. In the present study, these data were conducted for concrete and asphalt surfaces, which are representative materials of artificial land cover on roads. Further, the differences in the values between the two surfaces were analyzed. The upward long-wave radiation was higher at the asphalt site than that at the concrete site, indicating that a lot of heat was emitted from the asphalt surface. In addition, the road surface temperature was about 5 °C higher on average at the asphalt surface site than that at the concrete site on a clear day. Based on these results, it can be concluded that concrete materials are cooler packaging materials compared with asphalt. The mean albedo during the period between 10:00~17:00 was calculated and the values for concrete and asphalt were 0.22 and 0.06, respectively. Hence, the albedo was substantially lower at the concrete site. This can be attributed to the fact that asphalt absorbs short-wave radiation rather than reflects it. In addition to albedo, emissivity is another important factor that indicates surface properties. Emissivity can be calculated using the road surface temperature, which was not directly observed in the present study. The surface temperature was calculated using the upward long-wave radiation energy. Hence it is necessary to directly observe the road surface temperature and calculate the emission rate according to the road surface material in the future. A recent study has calculated the albedo of concrete and asphalt [37]. The albedo values of concrete and asphalt presented in the previous study were 0.5 and 0.1, respectively. We averaged the values during 10:00–17:00, and the differences may occur due to differences in material components. Even if the same material is used, the brightness may vary based on the material components. Though the albedo value of the present study was different from those reported by previous studies, the trend was similar and the concrete values were calculated to be higher than the asphalt values. Based on these results, it is assumed that concrete materials can alleviate heat exposure in roads better when compared with asphalt materials.
4.2. Perceived Temperature
Previous studies have evaluated heat stress or heat severity to prevent the risk of exposure to high temperatures in outdoor workers [11,13]. In these studies, heat stress due to heat waves has been investigated using Tmax, WBGT, and TWL. Bonauto et a. [38] studied the heat-related diseases of workers using temperature. Moreover, studies have investigated heat stress and heat-related diseases of outdoor workers using WBGT, a thermal comfort index, and proposed a work plan for them [39,40,41,42,43]. In addition, temperature, humidity, solar radiation, and TWL have also been used to assess the heat stress of outdoor workers [44,45,46,47]. Previous studies have focused on heat stress measures for mainly construction workers and rebar workers using various heat-related indices. In the present study, we calculated the PT index for outdoor workers, especially those who are active on the road. The SOLWEIG model was run using the meteorological factors and radiant energy in six directions for the concrete and asphalt site of the road. PT was predicted using the mean radiant temperature, which is the result of the SOLWEIG model, and PT for temperature change (20–40 °C) was calculated through a regression model. When the temperature was 35 °C, the PT predicted by the young and old groups of workers were 51.49 °C and 50.37 °C, respectively. In addition, the PT of the young group was predicted to be higher than the temperature in the range of +7~+16 °C, and the PT of the older group was predicted to be between –1.8~+15 °C than the actual temperature. In a previous study conducted by NIMS, the range of PT max values by region in South Korea in JJAS 2015–2016 was calculated between 45.14 and 54.30 °C, and in Seoul was 45.49 °C [26]. In this study, the range of PT values were found to be similar to that of the regional PT range of South Korea. Gabriel and Endlicher [48] calculated the PT during the heat wave in Germany. There was an average deviation of about 7 °C between the daytime temperature and PT for 3 weeks in the summer of 1994 and 2006. Compared with the results of Gabriel and Endlicher [48], the PT values in the present study were found to be higher. In the present study, PT values were calculated based on the heat wave because the daytime observation data at the highway concrete and asphalt site during the hottest period of summer were used. Therefore, the value is slightly higher than the actual temperature. The PT values of the young and aged groups calculated by the regression model constructed using the observation data and PT results can predict the temperature that working people actually feel on concrete and asphalt roads in heat waves. As can be seen from these results, more attention will be needed in the case of the older group.
As the local area was observed in the present study, it may be difficult for us to generalize the study findings to other geographical areas and environments. However, since it is a study using observations on roads without buildings or trees, it is thought that it can be generalized in a road environment without obstacles in summer.
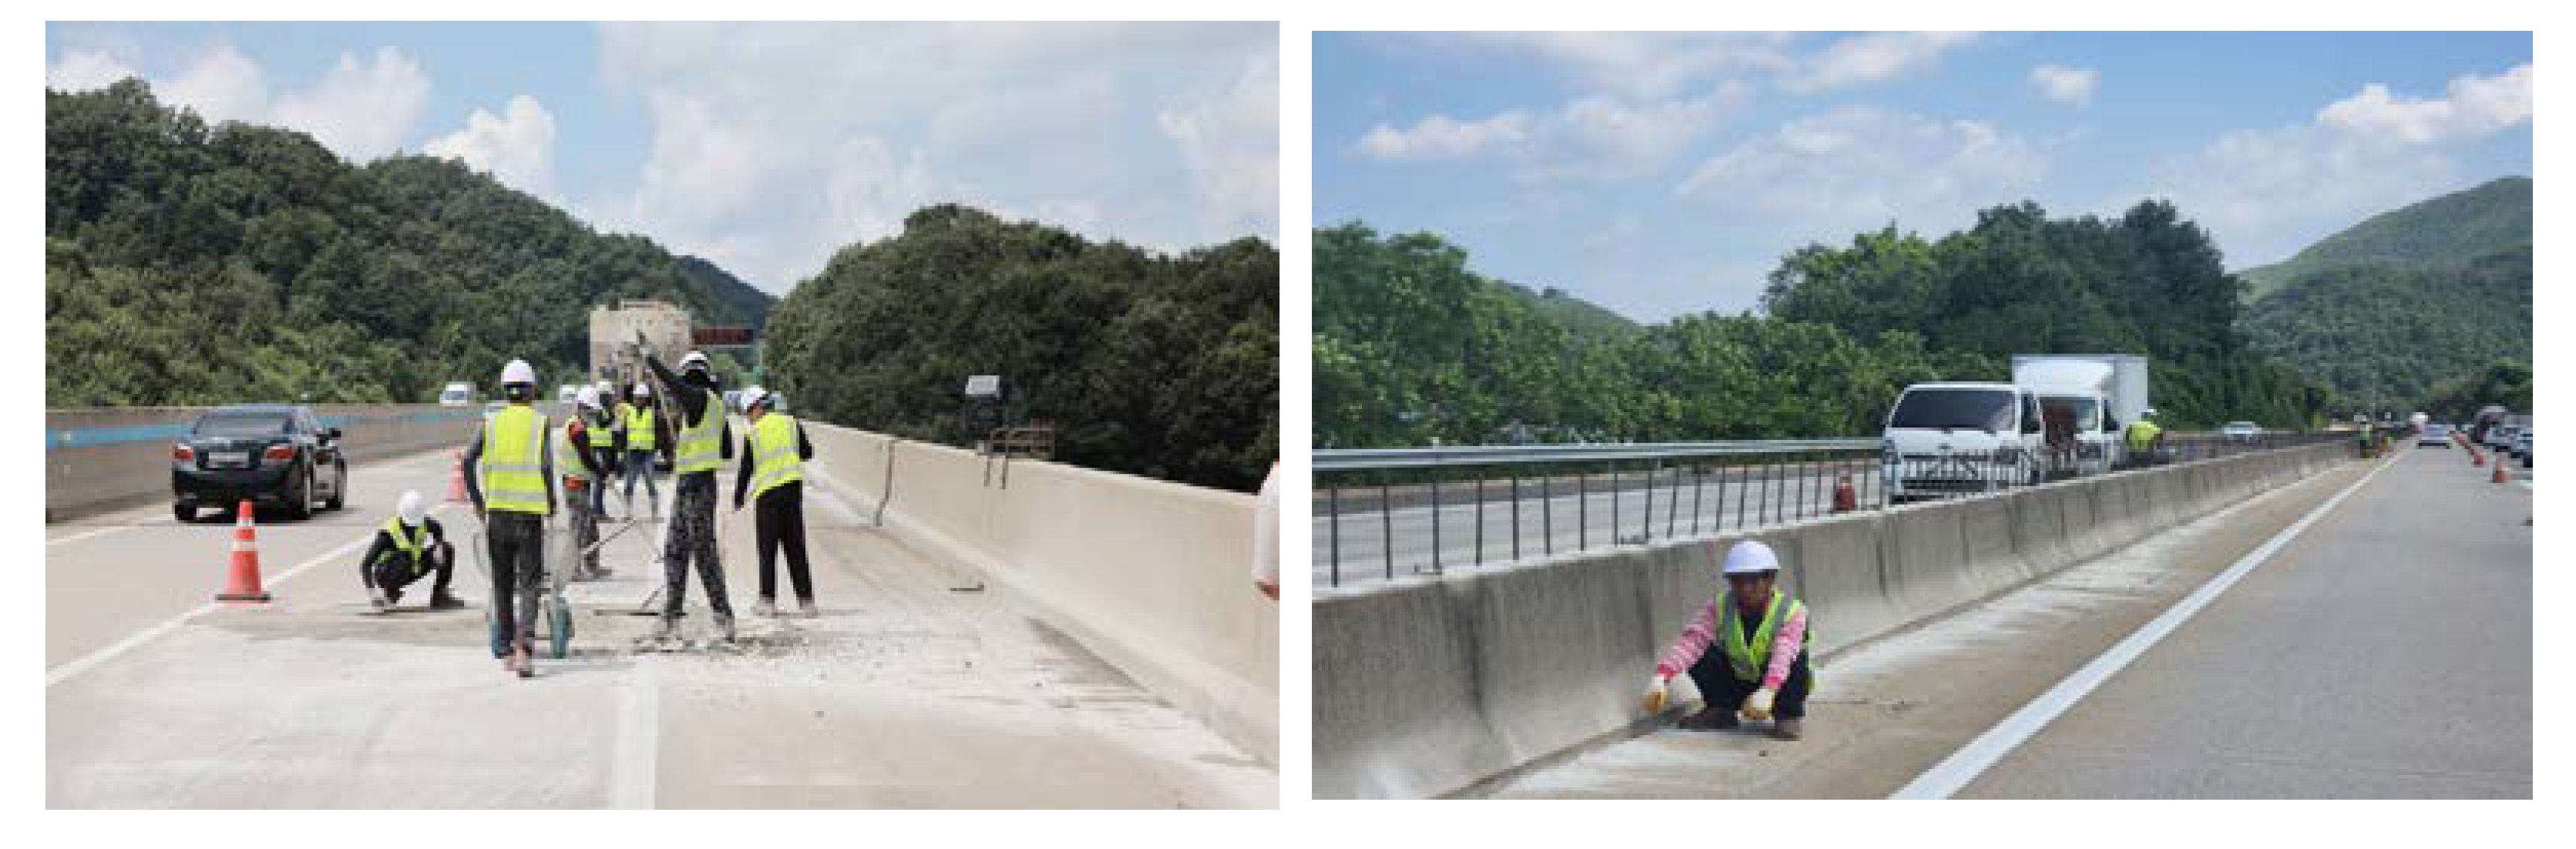
The Serious Disaster Punishment Act was implemented for workers in South Korea. This includes information on heat stress by road workers, and the Korea Expressway Corporation suggested a need for countermeasures. The findings of the present study can help in the preparation of a manual on how to respond to heat stress for road workers. It is possible to present the reference of the perceived temperature of the workers as a preventive action recommendation, which provides preventive measures for each stage of the heat wave. The health care, work clothes, moisture intake, and rest of workers may be classified according to each perceived temperature standard and these data can be applied to the manual. Figure 14 shows the workers on the road when the actual observation of this study was conducted. The results of this study can be the basis for protecting these workers on roads where there is no place to rest during heat waves.
5. Strengths and Limitations
Previous studies have generally not recorded observations for concrete and asphalt materials on actual roads and this type of recorded data were used as input data for the model. In the present study, observations were conducted at real concrete and asphalt sites to clearly distinguish heat exposure in different artificial surface materials. The observations are representative of the heat wave period in summer. The observed values were input into a model to derive the PT values. The findings of the present study can be used to propose a heat wave response plan for workers who are working on the road.
However, the present study has a few limitations; for example, limitations in securing observation equipment prevented the simultaneous observation of two sites. Though it was possible to identify the characteristics of concrete and asphalt based on observation, it was difficult to compare these characteristics for the same date and weather. Future studies must ensure that they can compare the observation values for the same date and weather so that only the road surface pavement type is different. The potential implication of asynchronous observations on the results of this study is a difference in the radiation value. Although a day can be sunny, but the cloud cover varies based on the time of the day, resulting in a difference in the value of downward short-wave radiation. As a difference occurs in the value of downward short-wave radiation, there is also a difference in the value of the other radiation. Furthermore, the differences in radiation also affect the surface temperature. If simultaneous observation was made, differences based on the surface material could have been more pronounced under the same weather conditions. Because there are differences in various weather and environmental conditions (such as the clouds, radiation, role of aerosol, etc.), even between sunny days, there is a possibility that a clear difference can be seen if the same observations were recorded using two devices at the same time. Further, we did not record aerosol observation, and hence, some differences in the results were not analyzed even in clear sky conditions related to aerosols. In order to determine the role of aerosols on sunny days, future studies need to observe aerosols or use aerosol values. Further observation and analysis will help complement the limitations of the present study.
6. Conclusions
This study observed radiation and meteorological factors in a highway where outdoor workers are employed in the summer of 2022 and estimated the PT according to the meteorological environment conditions at different work sites on the roads. Using the observed values, we calculated the meteorological environment variables and mean radiant temperature. Thereafter, the environment variables of the prediction model for worker PT were set to match the actual road environment, and PT prediction models were constructed to estimate PT. The results suggested that asphalt is more vulnerable to heat exposure than concrete. Further, the estimated PT values (using the regression model) suggested that there was a difference in the PT between the younger and older groups. The older group perceived that it was ’hot’ even at lower temperatures compared with the young group. In addition, the PT of the older group tended to rise more rapidly as the temperature increased when compared with the younger group. Based on the results for the PT of young and older groups calculated by the regression models built using the observation data, the temperatures that people feel on concrete and asphalt roads in heat wave conditions can be predicted. Moreover, the response measures to heat waves on the road can be established based on the predicted values and different rating criteria. These findings can help prevent thermal diseases among road workers at actual road work sites. The results can be used to create a manual for preventive measures by categorizing the standards of dress condition, physical activity intensity, water intake, and rest time for workers in the event of a heat wave.
Author Contributions
Conceptualization, C.Y.; Methodology, H.L. and C.Y.; Formal analysis, H.L., H.-G.K. and H.Y.; Investigation, S.A.; Writing—original draft, H.L.; Supervision, C.Y. All authors have read and agreed to the published version of the manuscript.
Funding
This work was funded by the Korea Meteorological Administration Research and Development Program under grant KMI(KMI2021-03312).
Conflicts of Interest
The authors declare no conflict of interest.
References
- Kim, D.; Deo, R.; Chung, J.; Lee, J. Projection of heat wave mortality related to climate change in Korea. Nat. Hazards 2016, 80, 623–637. [Google Scholar] [CrossRef]
- Gong, Y.; Gou, A.; Tang, M. Research Progress of Urban Heat Wave Environment. Earth Environ. Sci. 2021, 634, 012034. [Google Scholar] [CrossRef]
- Heo, S.; Bell, M.L.; Lee, J.T. Comparison of health risks by heat wave definition: Applicability of wet-bulb globe temperature for heat wave criteria. Environ. Res. 2019, 168, 158–170. [Google Scholar] [CrossRef] [PubMed]
- Perkins-Kirkpatrick, S.E.; White, C.J.; Alexander, L.V.; Argüeso, D.; Boschat, G.; Cowan, T.; Evans, J.P.; Ekstrom, M.; Oliver, E.C.J.; Purich, A. Natural hazards in Australia: Heatwaves. Clim. Chang. 2016, 139, 101–114. [Google Scholar]
- Sanderson, M.G.; Economou, T.; Salmon, K.H.; Jones, S.E. Historical trends and variability in heat waves in the United Kingdom. Atmosphere 2017, 8, 191. [Google Scholar] [CrossRef] [Green Version]
- Lee, J.; Kim, D. Projecting the Elderly Population at Heat Wave Risk for Climate Change: A Spatial Approach. Korean. J. Korean Geogr. Soc. 2022, 49, 949–969. [Google Scholar]
- Park, J.; Chae, Y. Analysis of heat-related illness and excess mortality by heat waves in South Korea in 2018. J. Korean Geogr. Soc. 2020, 55, 391–408. [Google Scholar]
- Chandran, S.; Subba Rao, A.V.M.; Sandeep, V.M.; Pramod, V.P.; Pani, P.; Rao, V.U.M.; Kumari, V.; Srinivasa Rao, C. Indian summer heat wave of 2015: A biometeorological analysis using half hourly automatic weather station data with special reference to Andhra Pradesh. Int. J. Biometeorol. 2017, 61, 1063–1072. [Google Scholar]
- Pattanaik, D.R.; Mohapatra, M.; Srivastava, A.K.; Kumar, A. Heat wave over India during summer 2015: An assessment of real time extended range forecast. Meteorol. Atmos. Phys. 2017, 129, 375–393. [Google Scholar] [CrossRef]
- Dutta, P.; Rajiva, A.; Andhare, D.; Azhar, G.S.; Tiwari, A.; Sheffield, P.; Climate Study Group. Perceived heat stress and health effects on construction workers. Indian J. Occup. Environ. Med. 2015, 19, 151. [Google Scholar] [CrossRef] [PubMed] [Green Version]
- Lee, B. Characteristics and Health Status of Outdoor Workers Exposed to High Temperature. Korean J. Occup. Health Nurs. 2022, 31, 95–103. [Google Scholar]
- Foster, J.; Smallcombe, J.W.; Hodder, S.; Jay, O.; Flouris, A.D.; Nybo, L.; Havenith, G. Quantifying the impact of heat on human physical work capacity; part III: The impact of solar radiation varies with air temperature, humidity, and clothing coverage. Int. J. Biometeorol. 2022, 66, 175–188. [Google Scholar] [PubMed]
- Acharya, P.; Boggess, B.; Zhang, K. Assessing heat stress and health among construction workers in a changing climate: A review. Int. J. Environ. Res. Public Health 2018, 15, 247. [Google Scholar] [CrossRef] [Green Version]
- Lucas, R.A.; Epstein, Y.; Kjellstrom, T. Excessive occupa tional heat exposure: A significant ergonomic challenge and health risk for current and future workers. Extrem. Physiol. Med. 2014, 3, 14. [Google Scholar]
- Sett, M.; Sahu, S. Effects of occupational heat exposure on female brick workers in West Bengal, India. Glob. Health Action 2014, 7, 21923. [Google Scholar] [CrossRef] [Green Version]
- Tawatsupa, B.; Yiengprugsawan, V.; Kjellstrom, T.; Berecki-Gisolf, J.; Seubsman, S.; Sleigh, A. The association between heat stress and occupational injury among Thai workers: Finding of the Thai Cohort Study. Ind. Health 2013, 51, 34–46. [Google Scholar] [CrossRef]
- Harlan, S.L.; Brazel, A.J.; Prashad, L.; Stefanov, W.L.; Larsen, L. Neighborhood microclimates and vulnerability to heat stress. Soc. Sci. Med. 2006, 63, 2847–2863. [Google Scholar] [PubMed]
- Masumoto, K. Urban heat island in Osaka city distribution of air temperature and wet bulb globe temperature. In Proceedings of the The seventh International Conference on Urban Climate, Yokohama, Japan, 29 June–3 July 2009. [Google Scholar]
- Tanaka, M. Heat stress standard for hot work environments in Japan. Ind. Health 2007, 45, 85–90. [Google Scholar] [CrossRef] [PubMed] [Green Version]
- Gaspar, A.R.; Quintela, D.A. Physical modelling of globe and natural wet bulb temperatures to predict WBGT heat stress index in outdoor environments. Int. J. Biometeorol. 2009, 53, 221–230. [Google Scholar]
- Kim, J. A Study on the Cooling Center Manual of Facility and Maintenance for Extreme Heat Disaster. Korean Soc. Hazard Mitig. 2008, 8, 17–22. [Google Scholar]
- Fanger, P.O. Thermal comfort. Analysis and applications in environmental engineering. Therm. Comf. Anal. Appl. Environ. Eng. 1970, 244. [Google Scholar]
- Thiele-Eich, I.; Brienen, S.; Kapala, A.; Jendritzky, G.; Simmer, C. Future thermal comfort in Germany; Berichte des Meteorologischen Instituts der Albert-Ludwigs-Universität Freiburg; Meteorologischen Instituts der Albert-Ludwigs-Universität Freiburg: Freiburg, Germany, 2010; p. 189. [Google Scholar]
- Matzarakis, A.; Laschewski, G.; Muthers, S. The heat health warning system in Germany—Application and warnings for 2005 to 2019. Atmosphere 2020, 11, 170. [Google Scholar] [CrossRef] [Green Version]
- Kang, M.; Kim, K.R.; Lee, J.Y.; Shin, J.Y. Determination of thermal sensation levels for Koreans based on perceived temperature and climate chamber experiments with hot and humid settings. Int. J. Biometeorol. 2022, 66, 1095–1107. [Google Scholar] [PubMed]
- Kim, G.; Cho, C.; Kang, M.; Park, J.; Shin, J.; Lee, J.; Han, M.; Miloslav, B. Advanced Research on Biometeorology and Urban Meteorology Development Research of Advanced Applied Meteorological Instrument; National Institute of Meteorological Sciences: Seogwipo-si, South Korea, 2018; p. 9. [Google Scholar]
- Kang, M.; Belorid, M.; Kim, K.R. Development of impact-based heat health warning system based on ensemble forecasts of perceived temperature and its evaluation using heat-related patients in 2019. Atmosphere. Korean Meteorol. Soc. 2020, 30, 195–207. [Google Scholar]
- Shin, J.Y.; Kang, M.; Kim, K.R. Outdoor thermal stress changes in South Korea: Increasing inter-annual variability induced by different trends of heat and cold stresses. Sci. Total Environ. 2022, 805, 150132. [Google Scholar]
- Park, M.S.; Park, S.H.; Chae, J.H.; Choi, M.H.; Song, Y.; Kang, M.; Roh, J.W. High-resolution urban observation network for user-specific meteorological information service in the Seoul Metropolitan Area, South Korea. Atmos. Meas. Tech. 2017, 10, 1575–1594. [Google Scholar]
- Li, Z.; Zhao, Y.; Luo, Y.; Yang, L.; Li, P.; Jin, X.; Gao, X. A comparative study on the surface radiation characteristics of photovoltaic power plant in the Gobi desert. Renew. Energy 2022, 182, 764–771. [Google Scholar] [CrossRef]
- Lindberg, F.; Holmer, B.; Thorsson, S. SOLWEIG 1.0–Modelling spatial variations of 3D radiant fluxes and mean radiant temperature in complex urban settings. Int. J. Biometeorol. 2008, 52, 697–713. [Google Scholar] [CrossRef]
- Lau, K.K.L.; Ren, C.; Ho, J.; Ng, E. Numerical modelling of mean radiant temperature in high-density sub-tropical urban environment. Energy Build. 2016, 114, 80–86. [Google Scholar]
- Chen, L.; Yu, B.; Yang, F.; Mayer, H. Intra-urban differences of mean radiant temperature in different urban settings in Shanghai and implications for heat stress under heat waves: A GIS-based approach. Energy Build. 2016, 130, 829–842. [Google Scholar]
- Yi, C.; Kwon, H.G.; Yang, H. Spatial temperature differences in local climate zones of Seoul metropolitan area during a heatwave. Urban Clim. 2022, 41, 101012. [Google Scholar]
- Yang, H.; Kwon, H.; Yi, C. Analysis of improvement of the solar radiation model using urban surface characteristics parameters. J. Clim. Chang. Res. 2022, 13, 1. [Google Scholar]
- Choi, D.; Lee, B. An experimental study of surface materials for planting of building surface by the radiant heat balance analysis in the summer. J. Korean Sol. Energy Soc. 2010, 30, 3. [Google Scholar]
- Moretti, L.; Cantisani, G.; Carpiceci, M.; D’Andrea, A.; Del Serrone, G.; Di Mascio, P.; Loprencipe, G. Effect of sampietrini pavers on urban heat islands. Int. J. Environ. Res. Public Health 2021, 18, 13108. [Google Scholar] [CrossRef] [PubMed]
- Bonauto, D.; Anderson, R.; Rauser, E.; Burke, B. Occupational heat illness in Washington State, 1995–2005. Am. J. Ind. Med. 2007, 50, 940–950. [Google Scholar] [CrossRef]
- Rowlinson, S.; Jia, Y.A. Application of the predicted heat strain model in development of localized, threshold-based heat stress management guidelines for the construction industry. Ann. Occup. Hyg. 2014, 58, 326–339. [Google Scholar]
- Morioka, I.; Miyai, N.; Miyashita, K. Hot environment and health problems of outdoor workers at a construction site. Ind. Health. 2006, 44, 474–480. [Google Scholar] [CrossRef] [Green Version]
- Inaba, R.; Mirbod, S.M. Comparison of subjective symptoms and hot prevention measures in summer between traffic control workers and construction workers in Japan. Ind. Health 2007, 45, 91–99. [Google Scholar] [CrossRef] [PubMed]
- Yi, W.; Chan, A.P.C. Optimizing work-rest schedule for construction rebar workers in hot and humid environment. Build Environ. 2013, 61, 104–113. [Google Scholar]
- Chan, A.P.C.; Yi, W.; Wong, D.P.; Yam, M.C.H.; Chan, D.W.M. Determining an optimal recovery time for construction rebar workers after working to exhaustion in a hot and humid environment. Build Environ. 2012, 58, 163–171. [Google Scholar] [CrossRef] [Green Version]
- Chan, A.P.; Yi, W.; Chan, D.W.; Wong, D.P. Using the thermal work limit as an environmental determinant of heat stress for construction workers. J. Manag. Eng. 2013, 29, 414–423. [Google Scholar] [CrossRef] [Green Version]
- Montazer, S.; Farshad, A.A.; Monazzam, M.R.; Eyvazlou, M.; Yaraghi, A.A.; Mirkazemi, R. Assessment of construction workers’ hydration status using urine specific gravity. Int. J. Occup. Med. Environ. Health 2013, 26, 762–769. [Google Scholar] [CrossRef] [PubMed]
- Bates, G.P.; Schneider, J. Hydration status and physiological workload of UAE construction workers: A prospective longitudinal observational study. J. Occup. Med. Toxicol. 2008, 3, 21. [Google Scholar] [CrossRef] [Green Version]
- Jia, Y.A.; Rowlinson, S.; Ciccarelli, M. Climatic and psychosocial risks of heat illness incidents on construction site. Appl. Ergon. 2016, 53, 25–35. [Google Scholar] [PubMed]
- Gabriel, K.M.; Endlicher, W.R. Urban and rural mortality rates during heat waves in Berlin and Brandenburg, Germany. Environ. Pollut. 2011, 159, 2044–2050. [Google Scholar] [CrossRef]
Figure 1.
Study sites: (a) Republic of Korea satellite map (http://map.naver.com (accessed on 7 November 2022)); (b) continuous highway observation site and Okcheon AWS site; (c) highway concrete continuous observation site; (d) highway asphalt continuous observation site; and (e) Okcheon AWS observation environment. AWS: automated weather station.

Figure 2.
(a) Omni-NRS; (b) mobile meteorological observation equipment; and (c) sky view observation equipment.
Figure 2.
(a) Omni-NRS; (b) mobile meteorological observation equipment; and (c) sky view observation equipment.

Figure 3.
Sky view observation results of concrete and asphalt sites on sunny days (Top) and cloudy days (Bottom).
Figure 3.
Sky view observation results of concrete and asphalt sites on sunny days (Top) and cloudy days (Bottom).

Figure 4.
(a) Comparison of concrete site observation and AWS observation; (b) comparison of asphalt site observation and AWS observation.
Figure 4.
(a) Comparison of concrete site observation and AWS observation; (b) comparison of asphalt site observation and AWS observation.

Figure 5.
(a) Surface temperature on concrete; (b) surface temperature on asphalt; (c) 2 m temperature on concrete; (d) 2 m temperature on asphalt; (e) relative humidity on concrete; (f) relative humidity on asphalt; (g) wind speed on concrete; and (h) wind speed on asphalt.
Figure 5.
(a) Surface temperature on concrete; (b) surface temperature on asphalt; (c) 2 m temperature on concrete; (d) 2 m temperature on asphalt; (e) relative humidity on concrete; (f) relative humidity on asphalt; (g) wind speed on concrete; and (h) wind speed on asphalt.


Figure 6.
The hourly mean values for road surface temperature and 2 m temperature according to weather and site.
Figure 6.
The hourly mean values for road surface temperature and 2 m temperature according to weather and site.


Figure 7.
(a) Downward short-wave radiation on concrete surface; (b) downward short-wave radiation on asphalt surface; (c) upward short-wave radiation on concrete surface; (d) upward short-wave radiation on asphalt surface; (e) upward long-wave radiation on concrete surface; (f) upward long-wave radiation on asphalt surface; (g) downward long-wave radiation on concrete surface; (h) downward long-wave radiation on asphalt surface.

Figure 8.
(a) Net radiation on concrete surface; (b) net radiation on asphalt surface; (c) albedo on concrete surface; and (d) albedo on asphalt surface.
Figure 8.
(a) Net radiation on concrete surface; (b) net radiation on asphalt surface; (c) albedo on concrete surface; and (d) albedo on asphalt surface.

Figure 9.
The hourly mean values for downward short-wave and upward long-wave radiation according to weather condition and site.
Figure 9.
The hourly mean values for downward short-wave and upward long-wave radiation according to weather condition and site.


Figure 10.
Land cover classification of (a) concrete and (b) asphalt sites to run the SOLWEIG model.
Figure 10.
Land cover classification of (a) concrete and (b) asphalt sites to run the SOLWEIG model.

Figure 11.
(a) Concrete site sunny day—20 July 2022; (b) concrete site cloudy day—2 August 2022; (c) asphalt site sunny day—28 July 2022; (d) asphalt site cloudy day—30 July 2022; and (e) time changes on sunny days and cloudy days at the asphalt site.
Figure 11.
(a) Concrete site sunny day—20 July 2022; (b) concrete site cloudy day—2 August 2022; (c) asphalt site sunny day—28 July 2022; (d) asphalt site cloudy day—30 July 2022; and (e) time changes on sunny days and cloudy days at the asphalt site.

Figure 12.
Changes in PT of young and older workers at the concrete and asphalt sites.

Figure 13.
Relationship between 2 m temperature continuously observed on road and (a) road surface temperature; (b) PT of the young group; and (c) PT of the older group.
Figure 13.
Relationship between 2 m temperature continuously observed on road and (a) road surface temperature; (b) PT of the young group; and (c) PT of the older group.

Figure 14.
Workers working on the road during observations for research.


Table 1.
Specifications of equipment used for recording different factors.
| Omni-NRS (CNR4) | |
|---|---|
| Sensitivity | 5~20 µV/W/m2 |
| Temperature dependence according to sensitivity (range of −10 to +40 degrees) | 4% or less |
| Response speed | 18 s or less |
| Nonlinearity | 1% or less |
| Operating temperature | −40° to 80° |
| International Standard Grade (WMO) | Good Quality WMO |
| Mobile meteorological observation equipment (Vaisala) | |
| Temperature | −52 °C to +60 °C |
| Wind speed | 0 to 60 m/s (134 mps) |
| Humidity | 0 to 100% relative humidity |
| Atmospheric pressure | 600 to 1100 hPa |
| Sky view camera (AXIS M3007-P) | |
| Image sensor | 1/3.2” Progressive Scanning RGB CMOS |
| Lens | M12 mount, F2.8, Fixed iris 1.3 mm Horizontal angle of view: 187° Vertical angle of view: 168° |
| Sensitivity | 0.6~200,000 lux, F2.8 |
| Shutter time | 1/24,000 s~2 s |
| Angle of camera | Rotation ±180° |
Table 2.
Weather classification according to site during the day time.
| Category | Sunny Day | Cloudy Day | ||
|---|---|---|---|---|
| Category | Sunny concrete | Sunny asphalt | Cloudy concrete | Cloudy asphalt |
| Analysis days | 6 days | 3 days | 6 days | 2 days |
Table 3.
PT risk criteria (thermal comfort zone) for Korean workers in a young group and an older group.
Table 3.
PT risk criteria (thermal comfort zone) for Korean workers in a young group and an older group.
| Thermal Perception | Young Group PT (°C) | Older Group PT (°C) |
|---|---|---|
| Very hot | 43 ≤ PT | 40 ≤ PT |
| Hot | 36 ≤ PT < 43 | 24 ≤ PT < 40 |
| Warm | 28 ≤ PT < 36 | ? ≤ PT < 24 |
| Slightly warm | ? ≤ PT < 28 | ? |
Table 4.
Hourly PT of young and older workers on sunny and cloudy days at the concrete and asphalt sites.
Table 4.
Hourly PT of young and older workers on sunny and cloudy days at the concrete and asphalt sites.
| Young Group | Older Group | |||||||
|---|---|---|---|---|---|---|---|---|
| Sunny | Cloudy | Sunny | Cloudy | |||||
| Time | Concrete | Asphalt | Concrete | Asphalt | Concrete | Asphalt | Concrete | Asphalt |
| 10:00 | 43.5 | 43.7 | 39.4 | 40.8 | 39.6 | 39.7 | 33.9 | 35.8 |
| 11:00 | 46.5 | 45 | 41.9 | 41.2 | 43.6 | 41.8 | 37.3 | 36.4 |
| 12:00 | 48.1 | 47.4 | 41.5 | 40.4 | 45.8 | 44.8 | 36.7 | 35.2 |
| 13:00 | 48.1 | 48.6 | 40.7 | 41.9 | 45.8 | 46.5 | 35.6 | 37.3 |
| 14:00 | 49.8 | 47.2 | 40.1 | 38.7 | 48.2 | 44.4 | 34.6 | 32.9 |
| 15:00 | 49.6 | 48.5 | 39 | 38.5 | 47.8 | 46.3 | 33.3 | 32.6 |
| 16:00 | 49.1 | 47 | 37.8 | 36.7 | 47.2 | 44.1 | 31.6 | 30.1 |
| 17:00 | 47.4 | 44.4 | 37.4 | 37.5 | 44.8 | 40.6 | 31.2 | 31.3 |
| AVE | 47.8 | 46.5 | 39.7 | 39.5 | 45.4 | 43.5 | 34.3 | 34.0 |
Table 5.
Criteria for workers’ PT rating calculated by prediction models using continuously observed data.
Table 5.
Criteria for workers’ PT rating calculated by prediction models using continuously observed data.
| 2 m Temperature (°C) | Surface Temperature (°C) | Young Group PT (°C) | Older Group PT (°C) |
|---|---|---|---|
| 20 | 20.6 | 27.9 | 18.1 |
| 21 | 22.9 | 29.4 | 20.3 |
| 22 | 25.1 | 31.0 | 22.4 |
| 23 | 27.4 | 32.6 | 24.6 |
| 24 | 29.7 | 34.2 | 26.7 |
| 25 | 32.0 | 35.7 | 28.9 |
| 26 | 34.3 | 37.3 | 31.0 |
| 27 | 36.6 | 38.9 | 33.2 |
| 28 | 38.9 | 40.5 | 35.3 |
| 29 | 41.2 | 42.0 | 37.5 |
| 30 | 43.5 | 43.6 | 39.6 |
| 31 | 45.8 | 45.2 | 41.8 |
| 32 | 48.1 | 46.8 | 43.9 |
| 33 | 50.4 | 48.3 | 46.1 |
| 34 | 52.7 | 49.9 | 48.2 |
| 35 | 55.0 | 51.5 | 50.4 |
 | |||
Disclaimer/Publisher’s Note: The statements, opinions and data contained in all publications are solely those of the individual author(s) and contributor(s) and not of MDPI and/or the editor(s). MDPI and/or the editor(s) disclaim responsibility for any injury to people or property resulting from any ideas, methods, instructions or products referred to in the content. |
© 2023 by the authors. Licensee MDPI, Basel, Switzerland. This article is an open access article distributed under the terms and conditions of the Creative Commons Attribution (CC BY) license (https://creativecommons.org/licenses/by/4.0/).
Share and Cite
MDPI and ACS Style
Lee, H.; Kwon, H.-G.; Ahn, S.; Yang, H.; Yi, C. Estimation of Perceived Temperature of Road Workers Using Radiation and Meteorological Observation Data. Remote Sens. 2023, 15, 1065. https://doi.org/10.3390/rs15041065
AMA Style
Lee H, Kwon H-G, Ahn S, Yang H, Yi C. Estimation of Perceived Temperature of Road Workers Using Radiation and Meteorological Observation Data. Remote Sensing. 2023; 15(4):1065. https://doi.org/10.3390/rs15041065
Chicago/Turabian StyleLee, Hankyung, Hyuk-Gi Kwon, Sukhee Ahn, Hojin Yang, and Chaeyeon Yi. 2023. "Estimation of Perceived Temperature of Road Workers Using Radiation and Meteorological Observation Data" Remote Sensing 15, no. 4: 1065. https://doi.org/10.3390/rs15041065
Note that from the first issue of 2016, this journal uses article numbers instead of page numbers. See further details here.