

A Review of the Far-Reaching Usage of Low-Light Nighttime Data


Cooperative Institute for Research in the Atmosphere, Colorado State University, Fort Collins, CO 80521, USA
*
Author to whom correspondence should be addressed.
Remote Sens. 2023, 15(3), 623; https://doi.org/10.3390/rs15030623
Submission received: 14 December 2022
/
Revised: 9 January 2023
/
Accepted: 12 January 2023
/
Published: 20 January 2023
(This article belongs to the Special Issue VIIRS 2011–2021: Ten Years of Success in Earth Observations)
Abstract
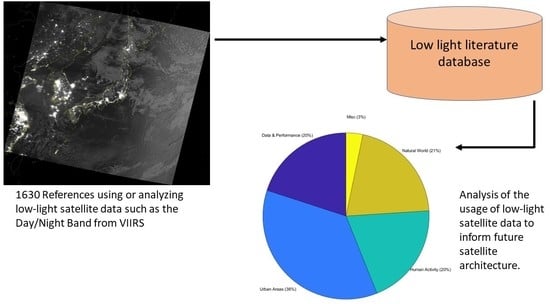
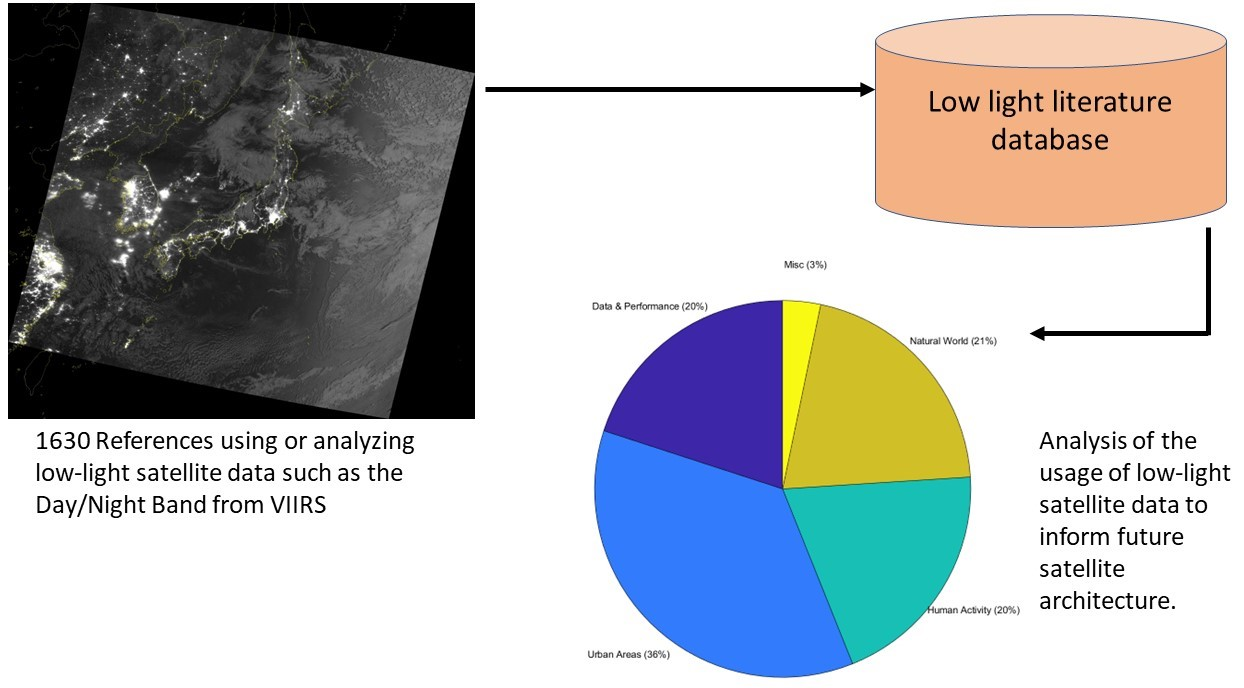
:To assess the current and future utility of low-light satellite data, this paper reviewed 1630 papers, presentations, theses, and dissertations using day/night band (DNB) data from the visible infrared imaging radiometer suite (VIIRS) imager and its precursor, the Defense Meteorological Satellite Program’s Operational Linescan system (DMSP-OLS) series from the 1970s through to the year 2021. By the way of a categorical system, we take inventory of the myriad applications of these data to a wide variety of disciplines, ranging from social to natural science, oceans to atmosphere, and biology to civil engineering. Papers from social science fields dominate this spectrum, pointing to the unique aspect of low-light observations in their ability to observe aspects of human civilization at night. We also look at the stratification between applications using natural vs. artificial light, the use of moonlight, and the context of the key earth climate system elements. In light of these findings, a discussion is provided for the future of low-light measurements. Since the start of the VIIRS series, there has been a rapid increase in interest in the use of these data for numerous fields, pointing towards a nascent field centered on the nocturnal earth system science that is enabled by these novel and newly quantifiable measurements. This study is of significant importance in evaluating current uses of low-light data and possible architecture solutions for next-generation satellites.
1. Introduction
The Cooperative Institute for Research in the Atmosphere (CIRA) at Colorado State University has conducted research under the auspices of a National Oceanic and Atmospheric Administration (NOAA)/National Environmental Satellite, Data, and Information Service (NESDIS)-funded Technical Maturation Program (TMP) to evaluate next-generation satellite architecture solutions. A principal focus of this study was on nocturnal low-light visible observations in support of NESDIS strategic planning for future observing systems, with the possible deployment of future systems in a distributed observing system architecture (e.g., CubeSats or SmallSats). This was compared to observations from the current polar-orbiting systems.
To motivate this effort, we first set out to establish the utility and ascertain the appetite for such measurements in future architecture. Thus, we took an inventory of the historical and contemporary uses of low-light observations, with special attention paid to any changes coinciding with the advent of the new-generation sensor—the visible infrared imaging radiometer suite (VIIRS) day/night band (DNB)—vis-à-vis the legacy system represented by the Defense Meteorological Satellite Program (DMSP) and its Operational Linescan System (OLS).
To this end, we compiled and analyzed a large inventory of the literature on how low-light satellite data were used in the community from the 1970s through to the year 2021, using Google Scholar and the other methods detailed in Section 2.1. This search resulted in a large number of papers in a wide variety of fields leveraging VIIRS data [1], of which we report on the salient findings here. We learned that, historically speaking, low-light nighttime data have been leveraged most often in studies for urban growth as well as socioeconomic activity [2]; this genre of research has outnumbered all other study areas. More recently, these data have been used to study the effects of light pollution on living organisms [3] and even the effects of human conflicts [4].
Our timeline of low-light related publications shows a strong knee-in-the-curve increase in the use of nighttime light data, especially over the past five years [5], pointing to a nascent realization in the research community of the viability of DNB data. It seems that studies using DNB data have become a research hot spot.
Within the database are two other papers focused on low-light nighttime literature. One scientometric analysis of nighttime light studies by Hu et al. [5] concentrated on connections between authors and research groups. They noted stronger connections of these data to the social sciences than the environmental characterization objectives for which these low-light sensors were designed. In another more recent study, Yahong Luo [6] constructed a knowledge map analysis on Chinese academic research surrounding nighttime lights. The current effort complements these previous works.
Our study categorizes the numerous papers and presentations which use low-light data and reports on the many different subcategories these studies are focusing on, with an eye towards understanding the role of these observations in the future.
2. Data and Materials
2.1. Database
Using searches of key words (for example, “Day/Night band”, “VIIRS DNB”, “DMSP Day/Night”) through Google Scholar, any reference for visible low-light was located, reviewed, and saved. We also mined the reference lists of previously collected papers for additional references. As our collection of references grew, we quickly realized that we had to use a reference database in order to track and organize the papers. The Zotero open-source reference management software was chosen for this purpose. Zotero can be downloaded to Macs, Windows, or Linux systems and provides unlimited storage with a subscription. PDFs and other files can be linked to each item, and each item can be assigned multiple tags, allowing for flexible, multivariate database associations and searchability. It can create a bibliography in many different formats, including those used for American Meteorological Society (AMS) or remote sensing papers. Finally, there are various options to set up a group, where the owner can restrict it to only members invited by the owner of the database or loosen the protection to allow anyone on the Internet to view it. This is an easy way to share the DNB literature search with other users in a collaborative environment. More information on Zotero can be found at “https://www.zotero.org/ (accessed on 16 January 2023)”. To connect to this database, you can log into Zotero and search for the DNB literature collection owned by clcombs.
The categorization of the references is of the author’s own design and will be explained in the next sections. The abstract of each reference was read and the rest of the reference skimmed in order to assign manually the various category tags, such as source satellite, application or data, and performance, etc. This is where Zotero’s ability to have multiple tags on one paper was an asset.
The result of our low-light/nightlight reference database is not an exhaustive list. The papers included were references found through Google Scholar, those listed in the bibliographies of those references, and references that these authors were aware of based on close and historical connections with the low-light research community. As such, other references that have not been digitized or exist in the gray literature outside the reach of Google Scholar may have been missed. We also did not include any references which omitted the source of the nightlight data in their abstract. Unfortunately, papers that did not provide an English or English-translated abstract providing a clear association with the source of the nighttime light data were not included; thus, some elements of the international community usage may not be fully captured here. That said, at the time of this writing, over 1630 references had been entered into our low-light database, providing a sufficiently large sample to conduct analyses of thematic usage.
2.2. Satellite-Based Low-Light Observations
The underpinning basis for our reference database is satellite low-light data. The primary contemporary sources for such measurements are the DNB, carried on the Suomi National Polar-orbiting Partnership (S-NPP) satellite and NOAA 20 (designated JPSS-1 prior to launch), the first in a series of satellites in the Joint Polar Satellite System (JPSS). The DNB sensor is a component of VIIRS [1]. Both satellites are polar orbiting, viewing a particular location on Earth at least twice a day with a nighttime pass near 0130 local time. S-NPP started collecting data in late 2011, while NOAA 20 started in 2018.
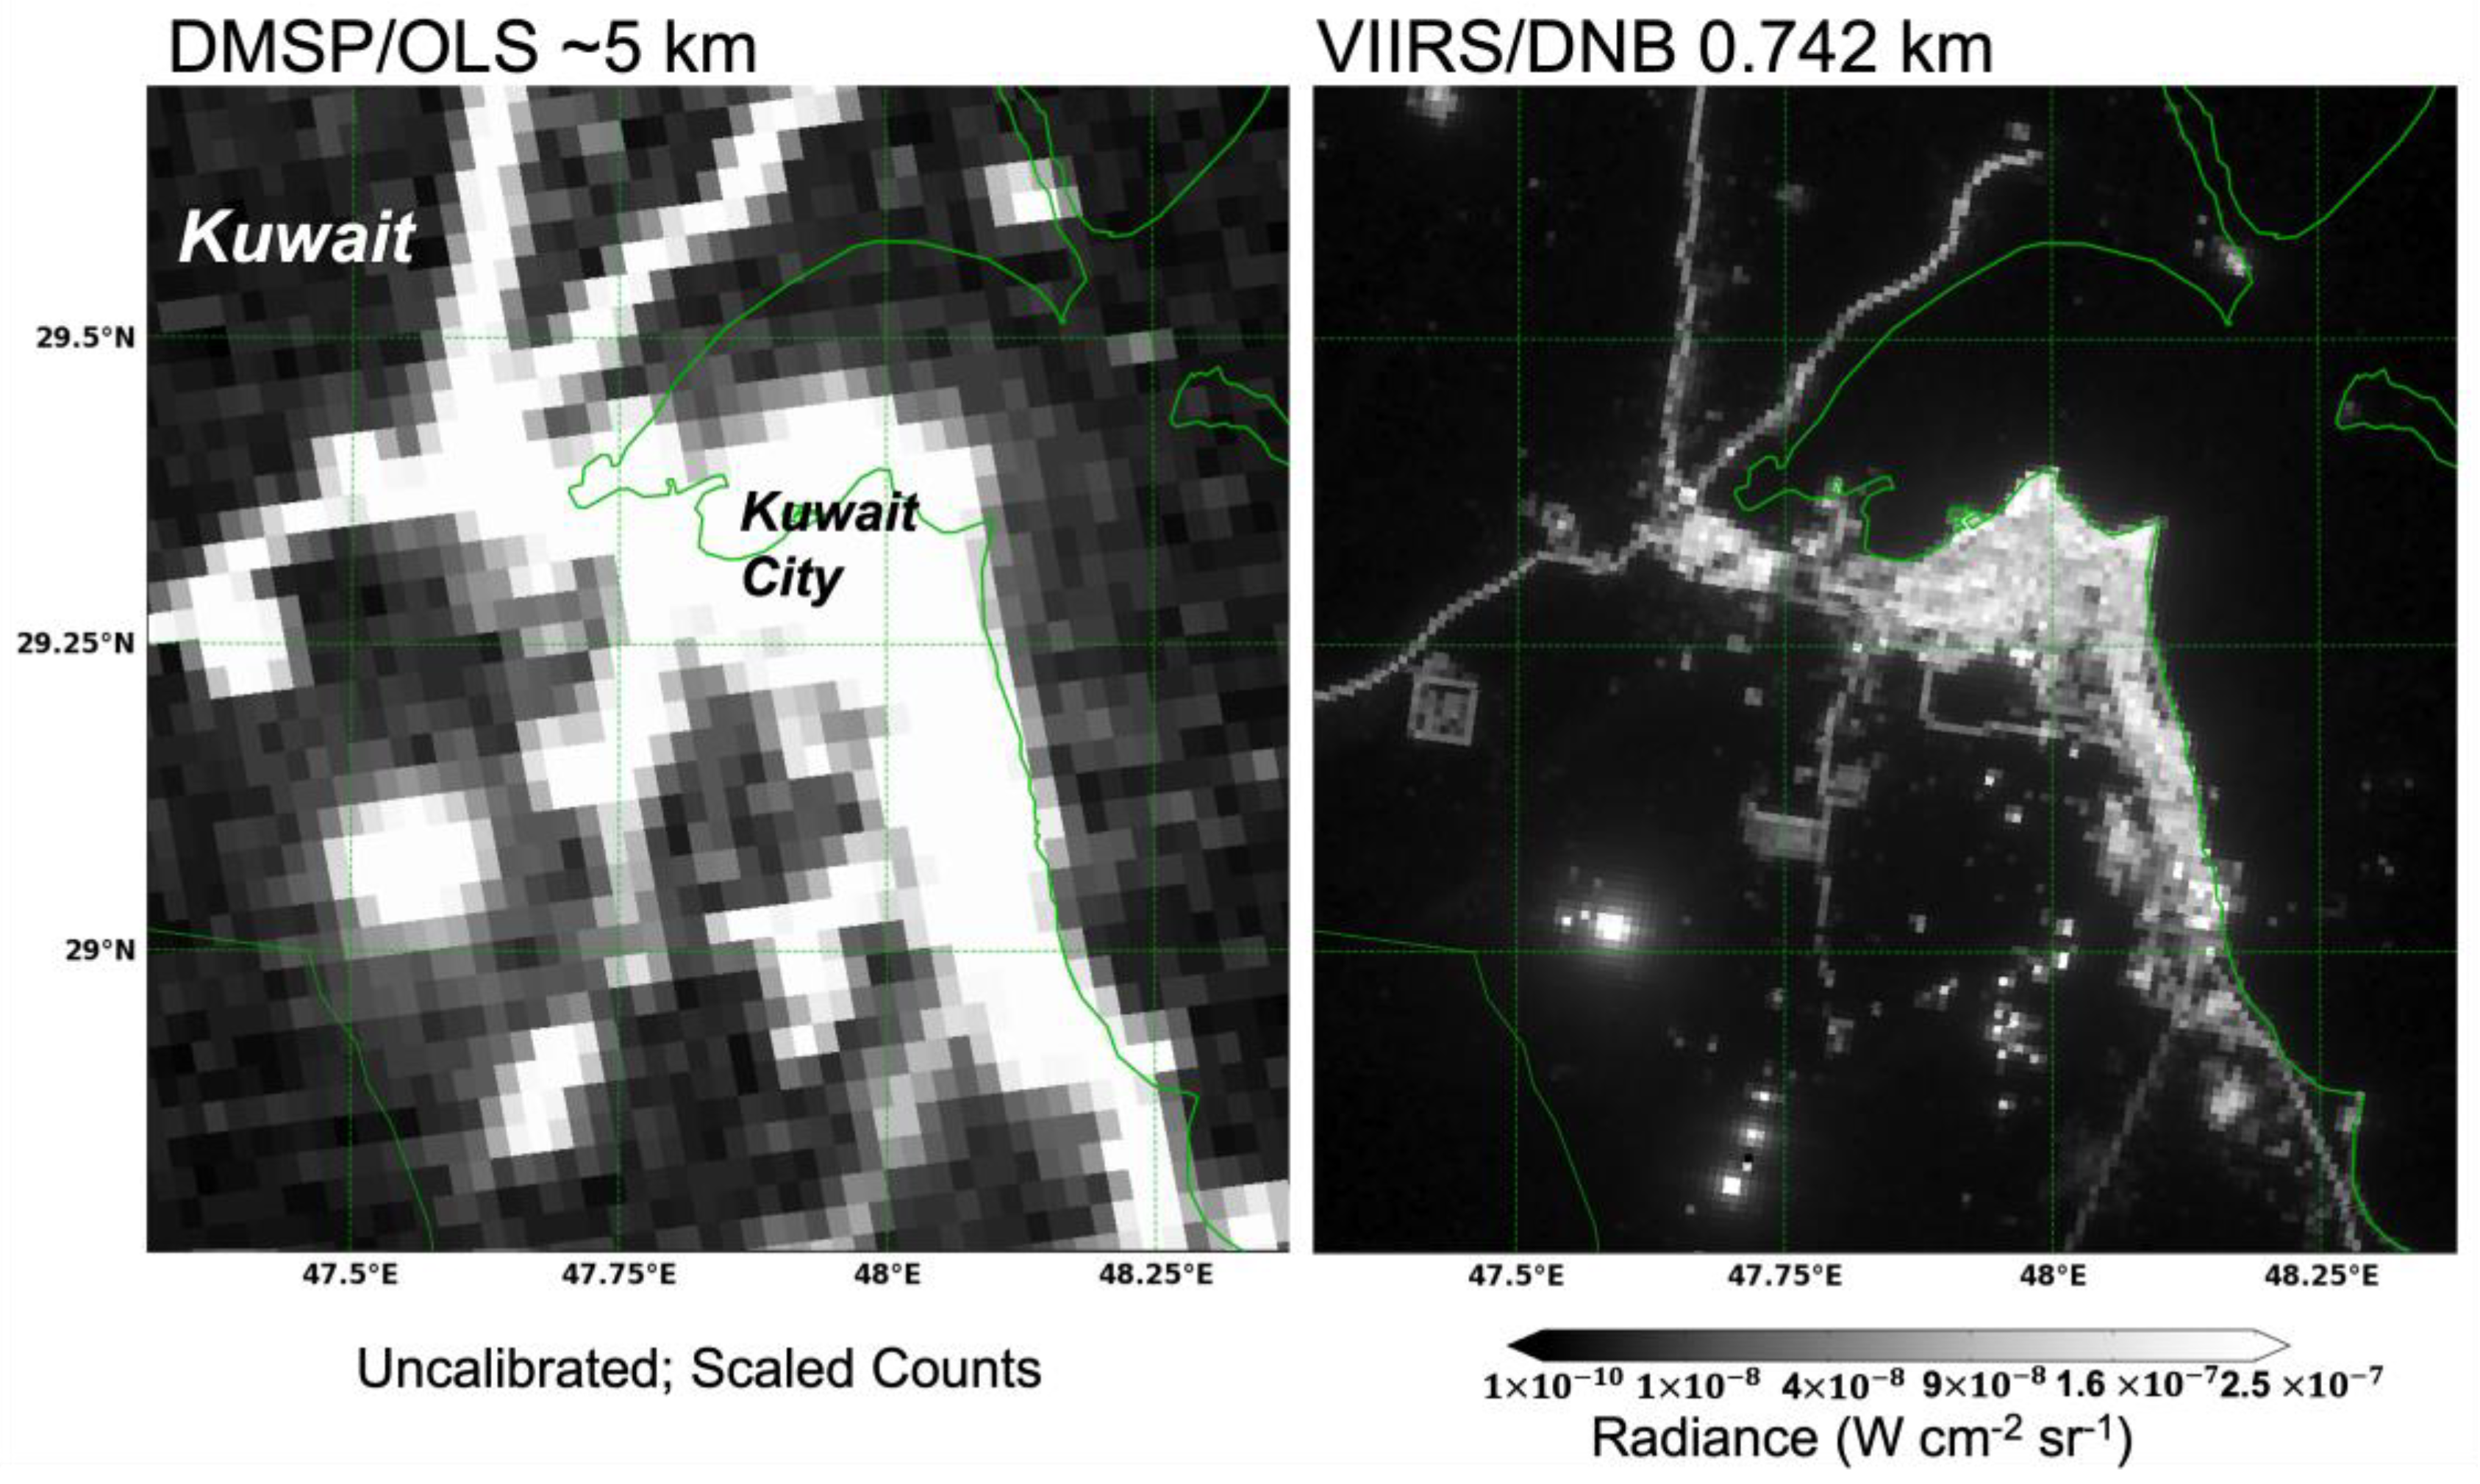
The DNB carries on a legacy of low-light sensors pioneered by the US military satellites at the dawn of the satellite era. The Defense Meteorological Satellite Program’s Operational Linescan system (DMSP-OLS) was declassified in 1972; its purpose was to find clouds in the early morning pre-dawn hours by the way of twilight illumination. In the decades since its declassification, the OLS has been used in numerous applications in a variety of fields [7]. The DNB sensor on VIIRS was designed to be an improvement from the DMSP (Figure 1). From the standpoint of understanding the impact of the new DNB, it was important to capture the OLS usage in our reference database as well.
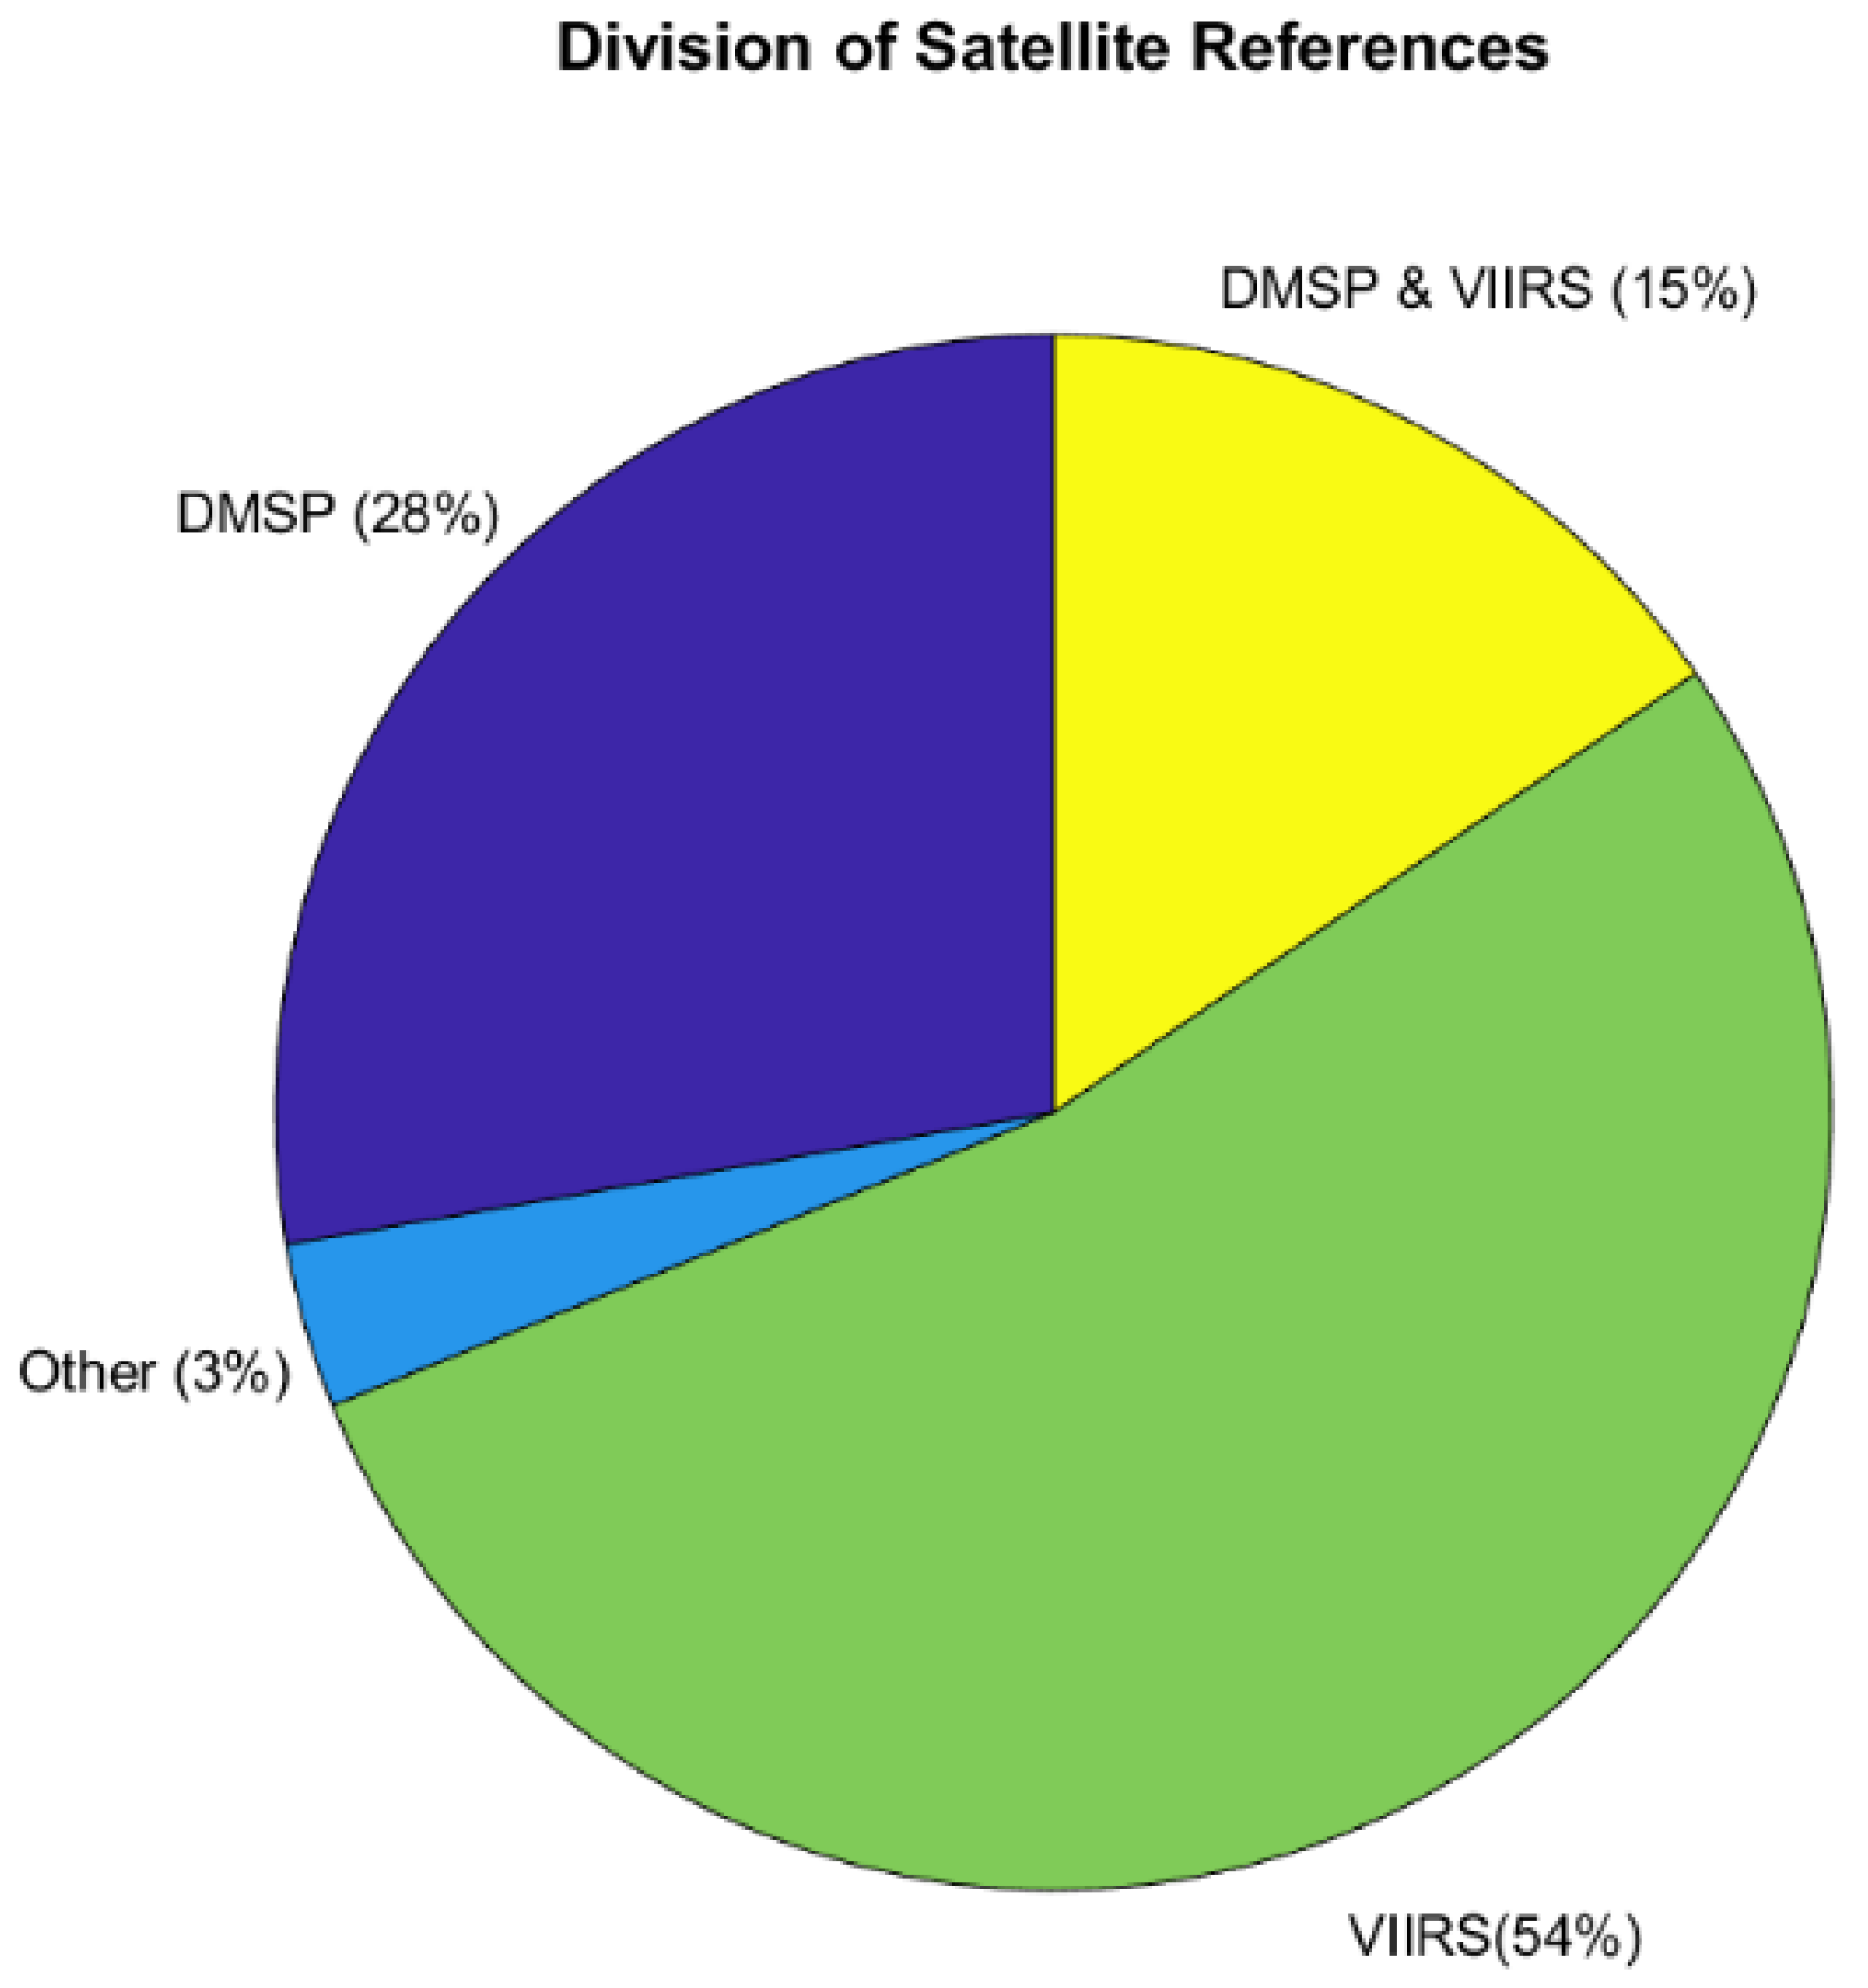
Nearly 97% of the database is tagged with either DMSP-OLS or S-NPP/JPSS VIIRS DNB. The breakdown of the percentages is shown in Figure 2. Some references for DMSP-OLS may have been missed as the DMSP-OLS program predates the Internet, and some references have not yet been digitized. However, the dominance of the DNB literature despite being in orbit for a decade vs. the ~50 years of OLS remains remarkable. The “Other” 3% category covers instruments, such as CubeSat Multispectral Observing System (CUMULOS), which flew on the National Aeronautics and Space Administration (NASA) Integrated Solar Array and Reflectarray Antenna CubeSat mission (ISARA) [8], China’s Luojia-1-01 [9], and the International Space Station [7,10].
2.3. Categories and Tagging
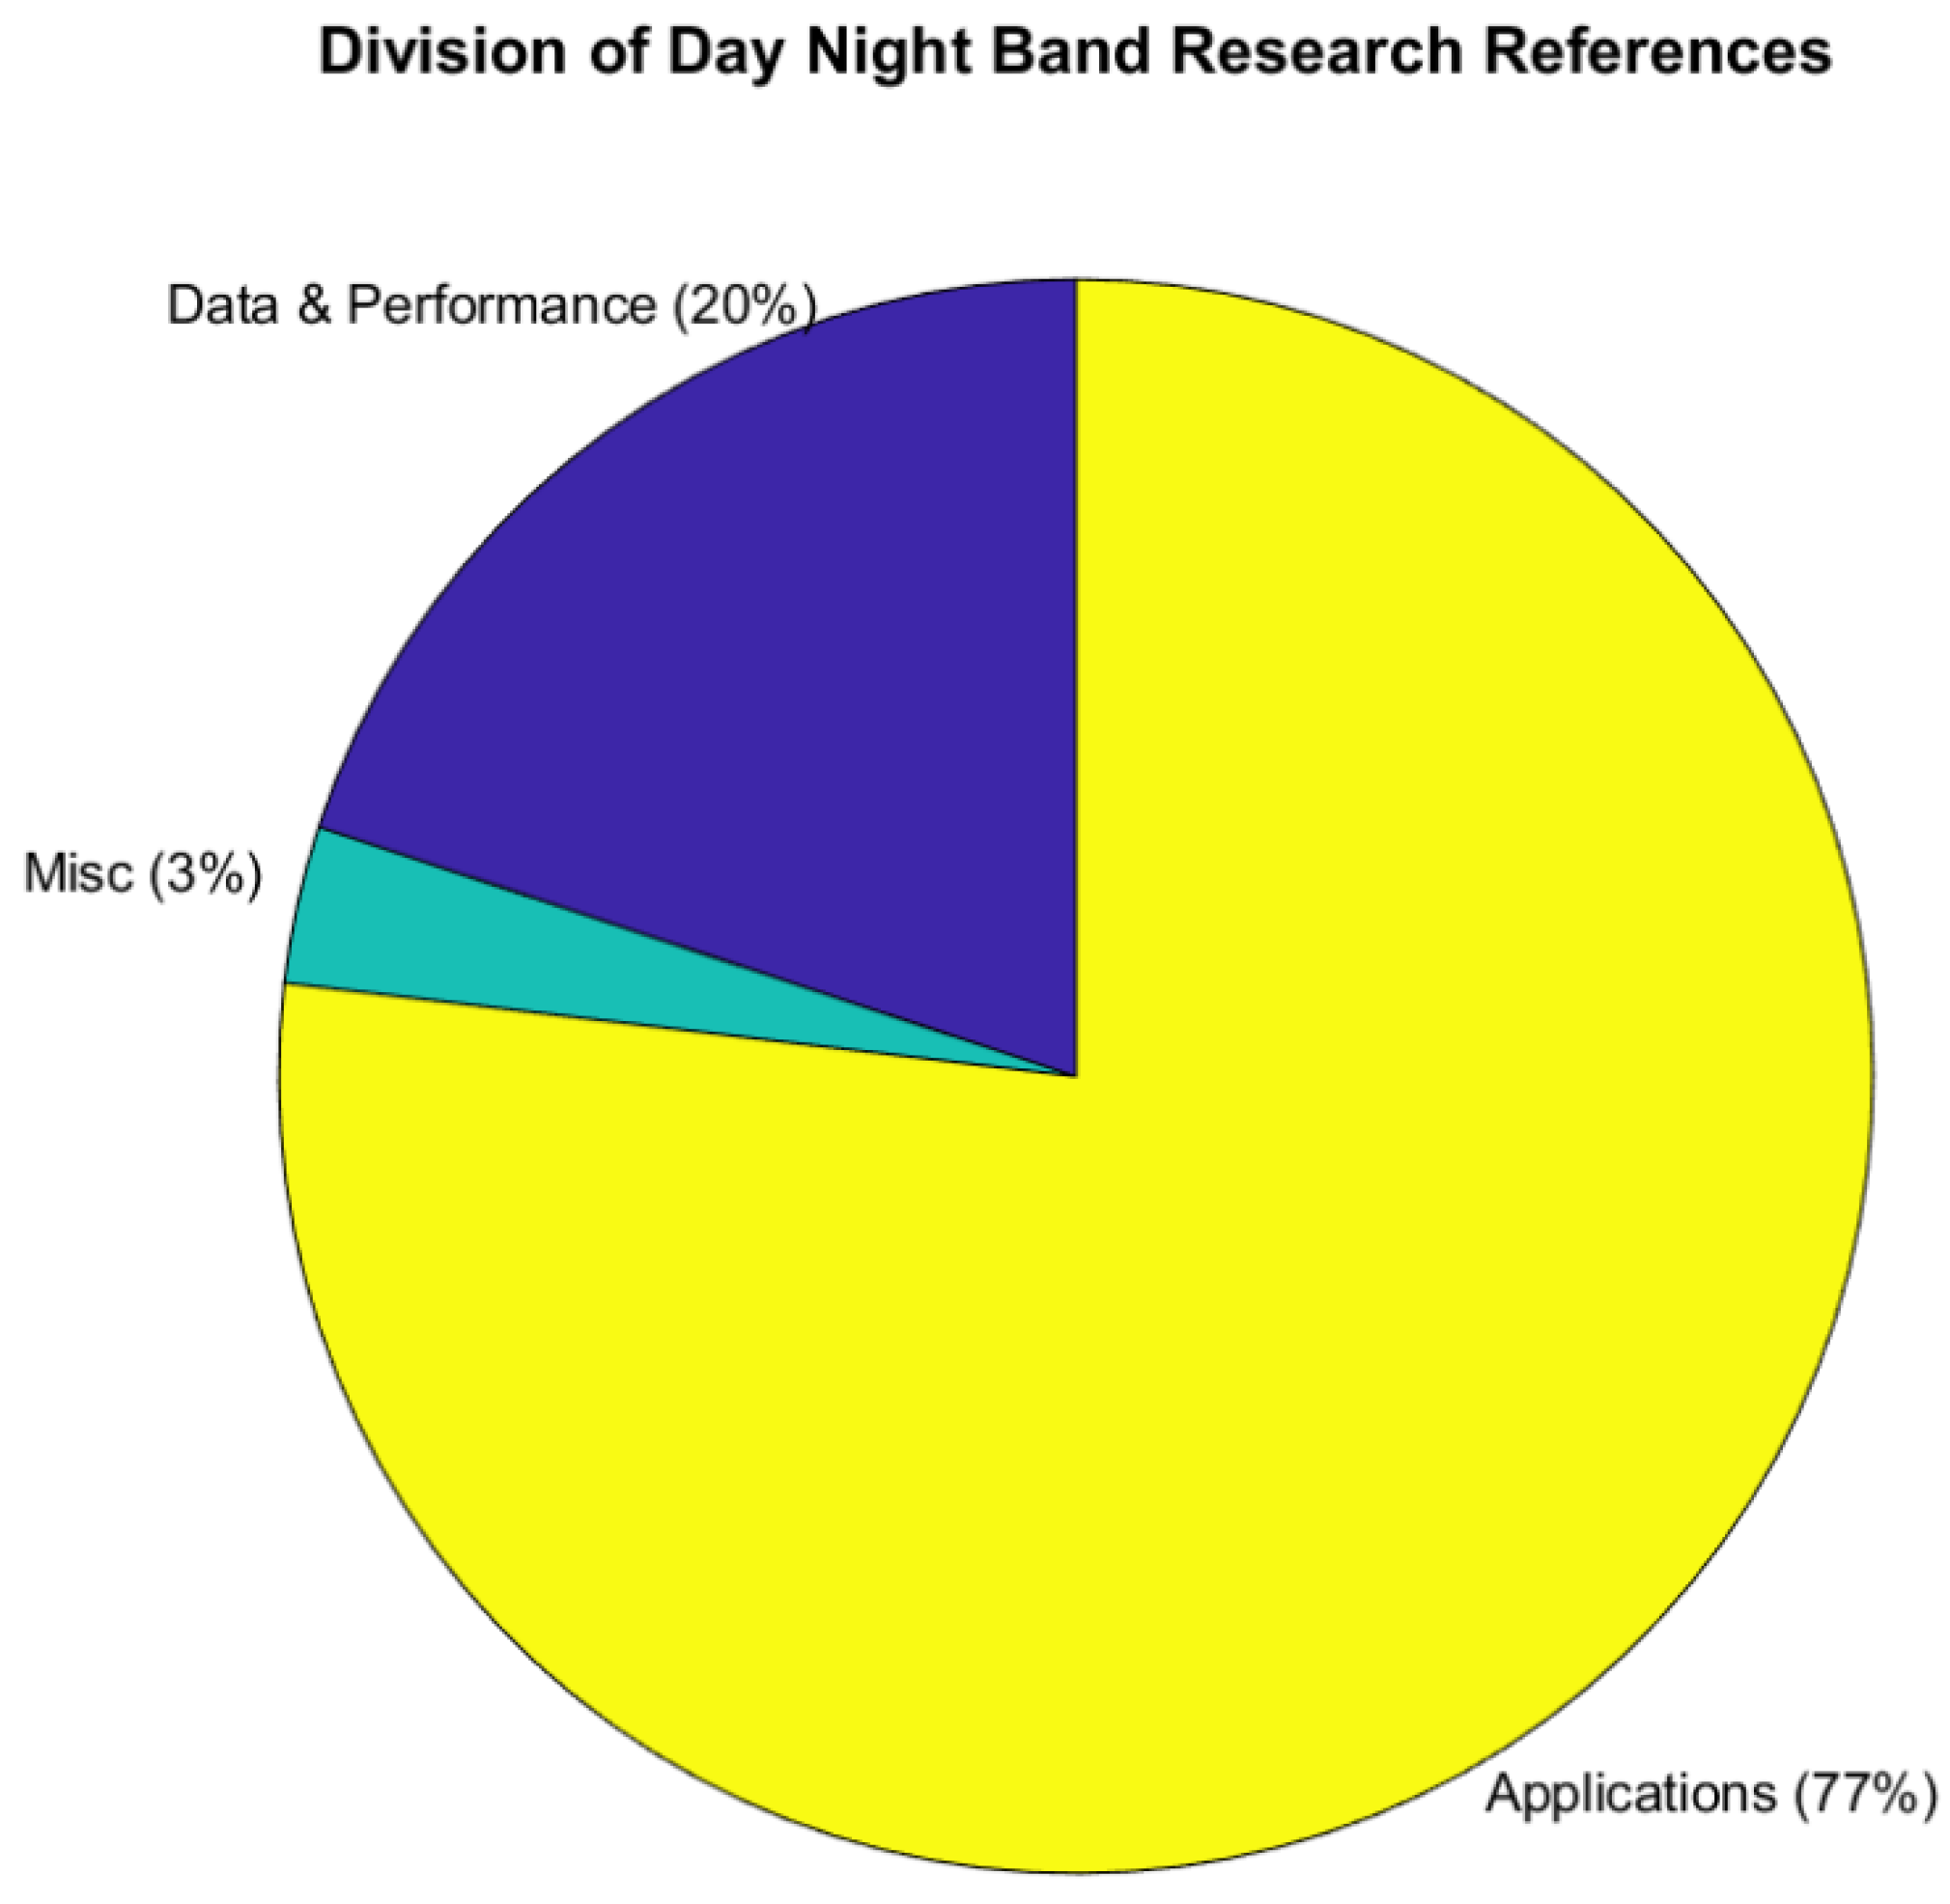
With so many references to manage, tagging and categorizing this database is a necessity. The top layer of categories, determined by general inspection, is Data and Performance, Applications, and Miscellaneous. (Figure 3). Data and Performance are references focused on the data itself, such as data products, geolocation, calibration, and the mitigation of quality control issues (e.g., imagery striping, blooming, etc.). The Applications category is comprised of references that refer to the data being used for a specific purpose. With 77%, this category dominates our database and naturally warrants further subpartitioning. The Miscellaneous (Misc.) is a catch-all for references that do not fit the first two categories. These citations discuss low-light sensing on proposed future satellites, CubeSats, general commentary, and introductions of these data for a given community.
Table 1 shows these three categories and their subcategories. Section 3.1 will discuss the Data and Performance tags, Section 3.2 will discuss Applications, and Section 3.3 will discuss Miscellaneous. It is acknowledged here that the partitioning of papers into these categories may not be optimal in all cases, especially for papers that straddle categories or span multiple aspects. Here, the Zotero database’s ability to allow one reference to be given multiple tags is useful to provide the best description possible.
3. Categories
3.1. Data and Performance
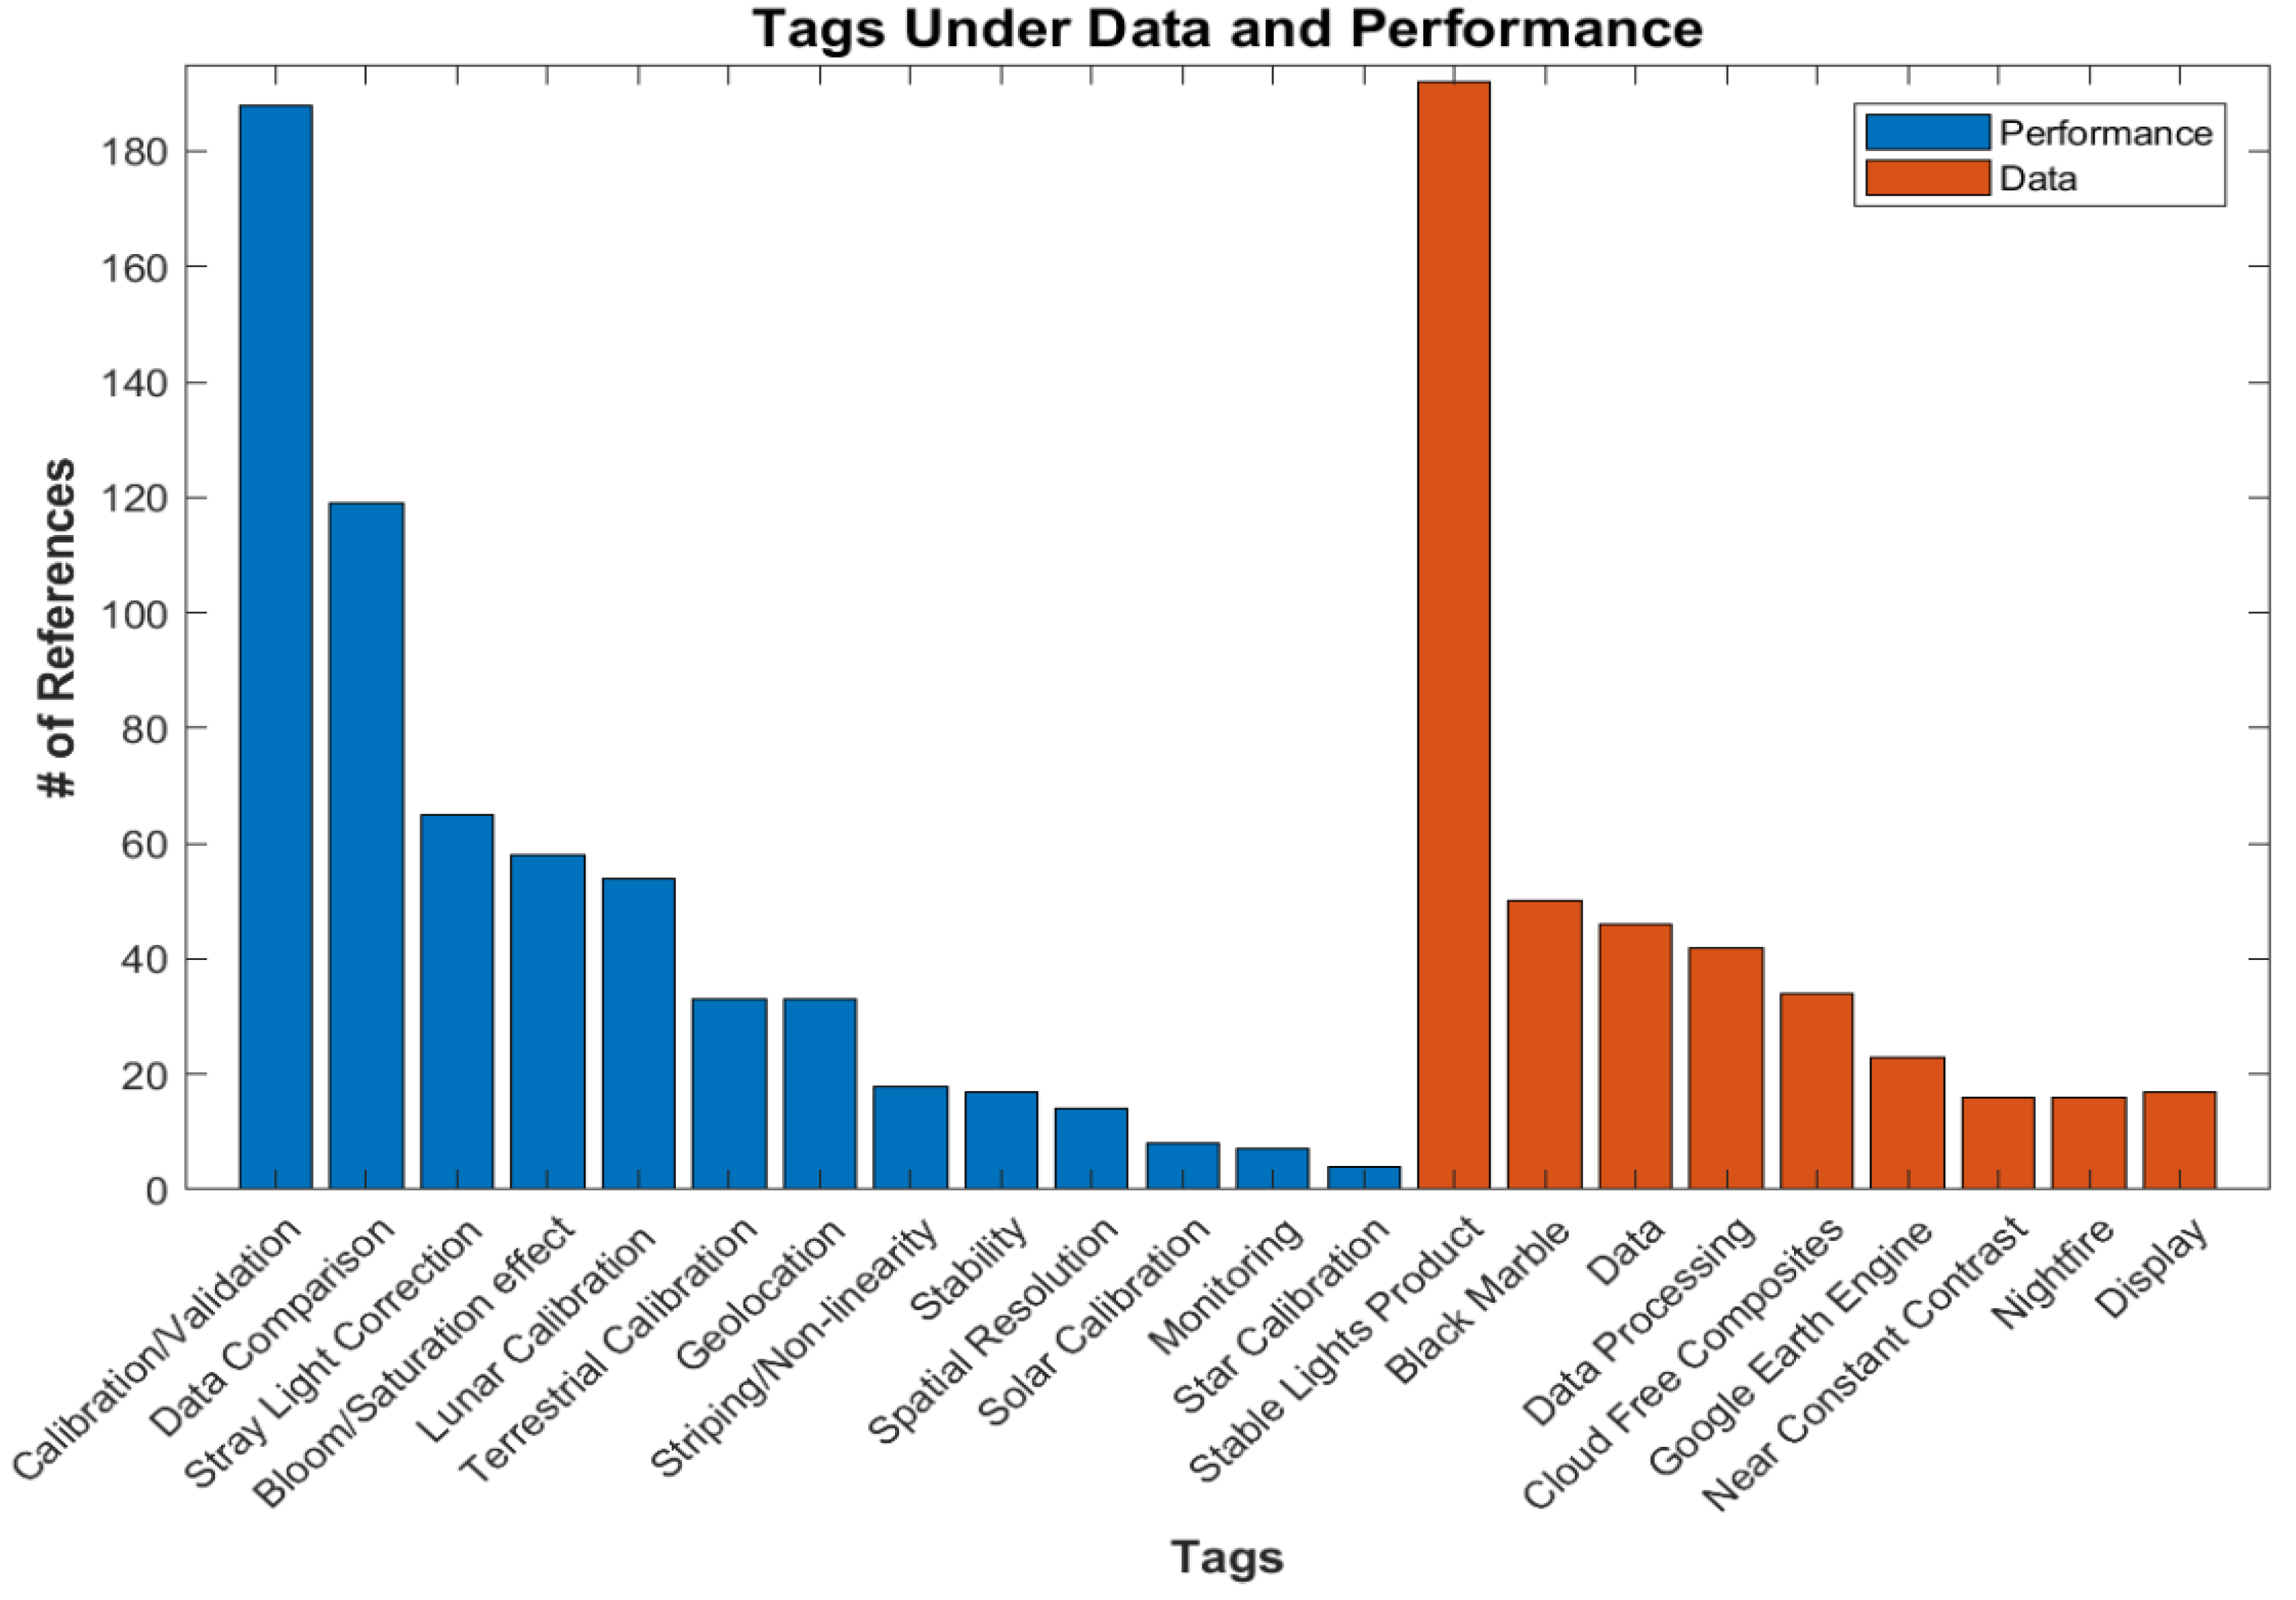
The Data and Performance category focused on assessments of the DNB-derived data sets and data quality/calibration, with its principle tags accounting for about 20% (326) of the total references up to and including 2021. A number of subtags stratify each of the principal tags into refined subcategories. The number of references for each tag is shown in Figure 4. One reference will often have more than one of these subcategory tags, and an application paper will often have a data product tag while not being tagged under Data and Performance. One such tag is the Stable Lights product [11], which contains DMSP data showing only stable lights on new moon nights. Many social science applications used this data set. Another example is monthly averages [12] or Black Marble [13] using DNB data. On the performance side, calibration/validation is the most used tag [14,15,16], reflecting the community’s efforts to calibrate and validate the DNB data. The second most used are papers comparing VIIRS DNB data with DMSP [17,18] and other sources [19,20]. Corrections for stray light [21,22] and blooming/saturated pixels [23,24] are also common.
A new source gaining popularity is Google Earth Engine [25], which provides multiple large data sets for use with machine learning. This site provides two VIIRS monthly averaged radiances (the second using a stray light correction) and two monthly DMSP (global radiance-calibrated and a time series) data sets, along with data sets from Landsat, MODIS, Sentinel, and others.
3.2. Applications
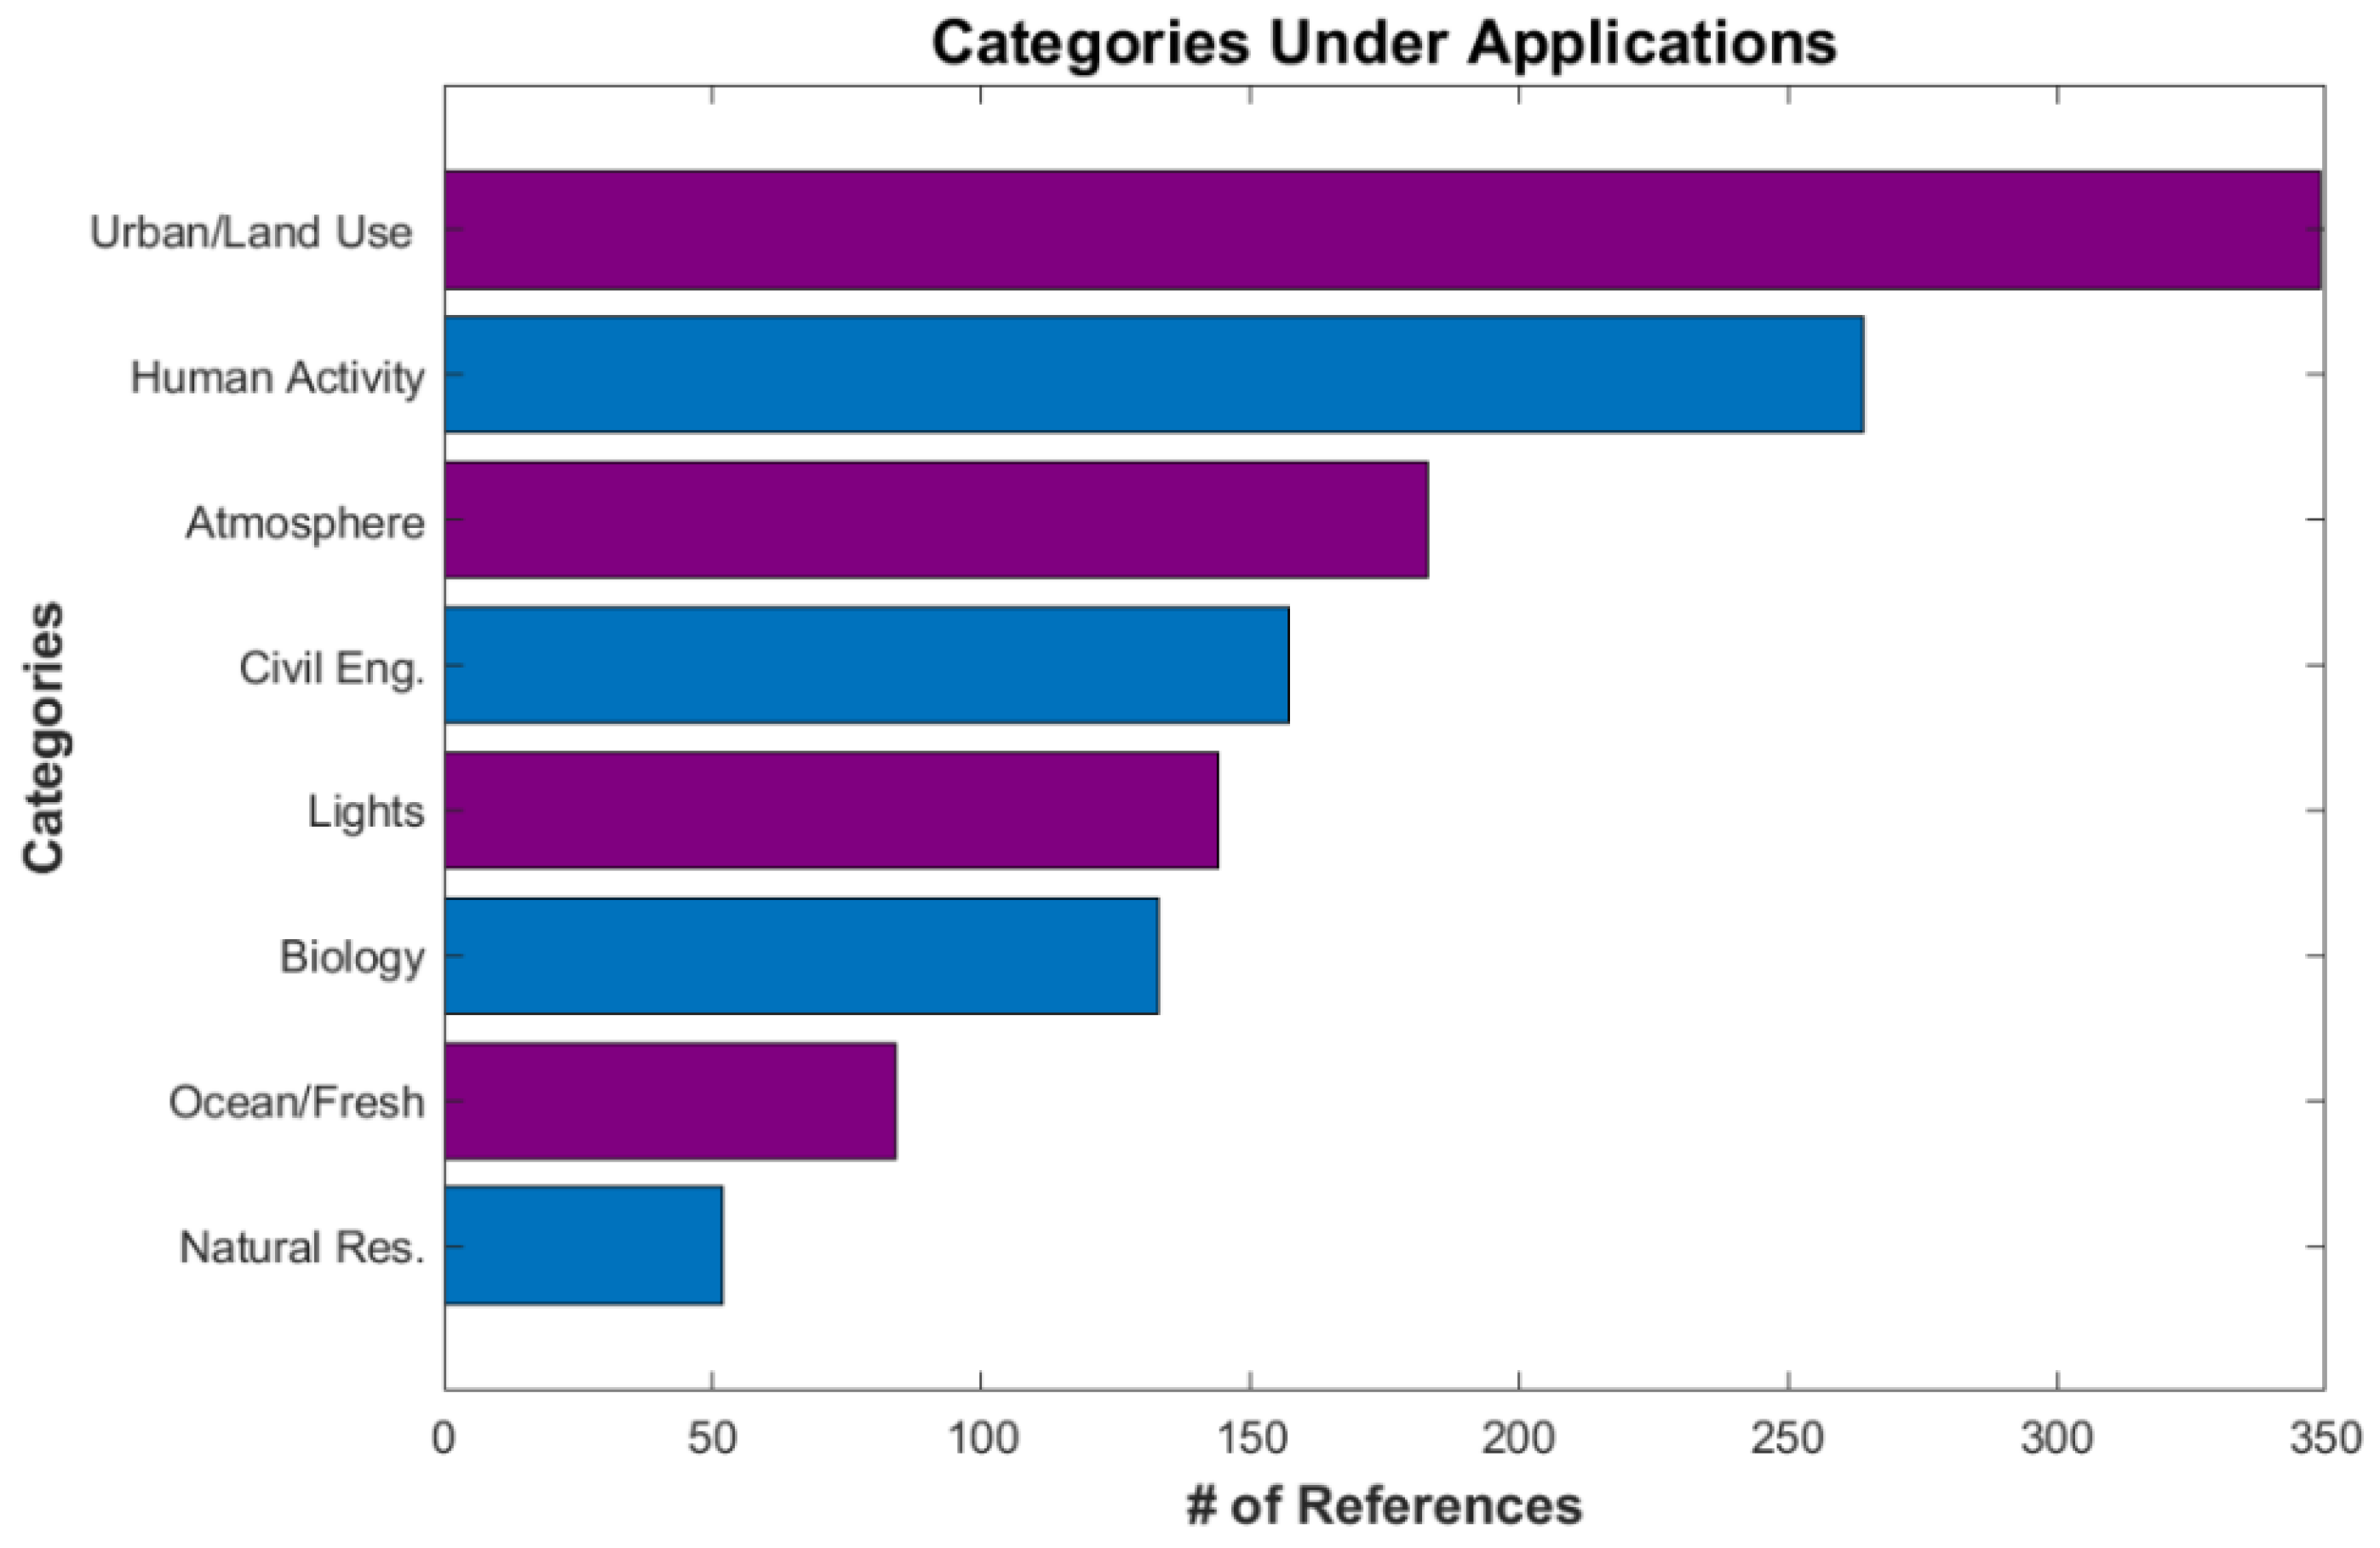
As seen in Figure 3, over 77% (1290) of the references in the database are under the main Applications category. Due to the large number of papers, Applications is broken down into eight subcategories: Atmosphere, Biology, Civil Engineering and Structure, Lights, Human Activity, Natural Resources, Oceans and Freshwater, and Urban and Land Use. Figure 5 shows the number of references in each subcategory. A key finding is that the Urban and Land Use and Human Activity references, both social science topics, outnumbered all the other Application categories, even the Atmosphere references. This shows the high relevancy of low-light information to understanding human dimensions of the earth system (as part of the biosphere).
3.2.1. Urban and Land Use
The two largest Application subcategories are Urban and Land Use and Human Activity. Both use artificial lights for social science studies. Urban and Land Use covers the aggregate of cities and land regions, while Human Activity concentrates more on human interactions.
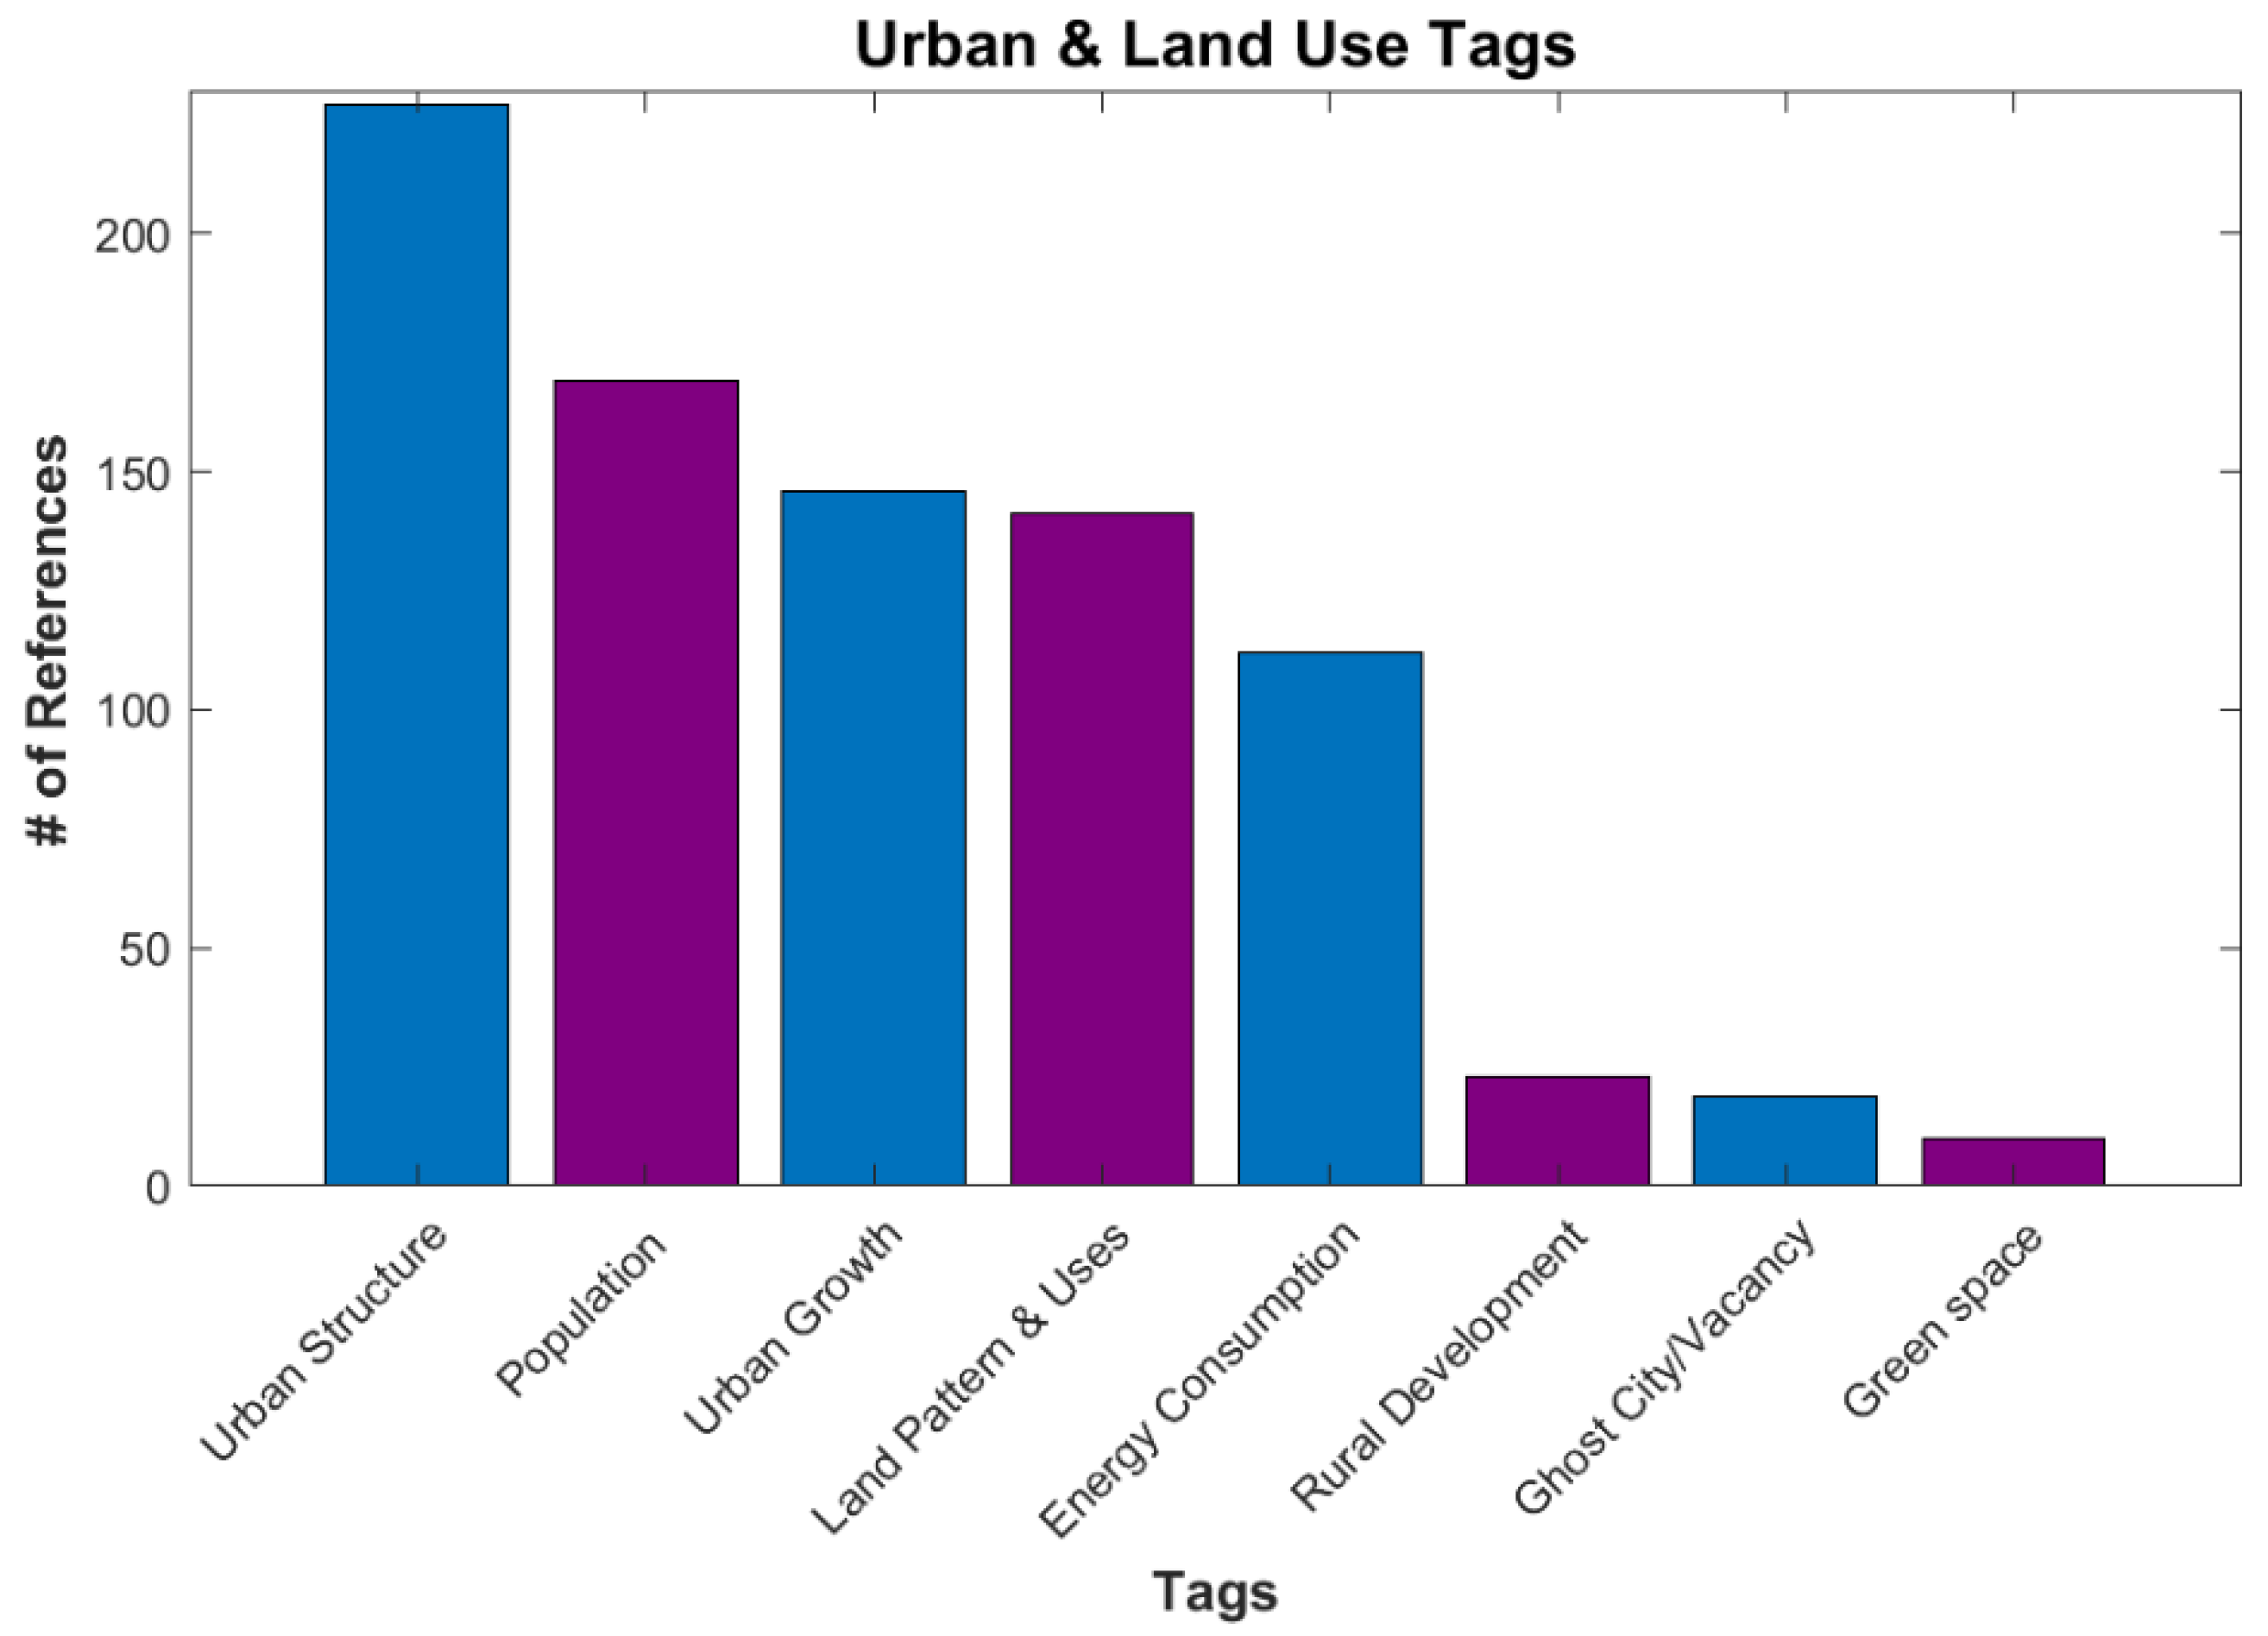
The largest is Urban and Land Use (Figure 5), with 349 references. In this category, artificial lights are used to show the growth and extent of urban areas [26,27], as well as estimate the overall parameters, such as energy consumption and population [28]. Land use and rural development are also in this category, often developing a new index for generating land-use maps or for quality checks on new indexes [29,30] (Figure 6).
3.2.2. Human Activity
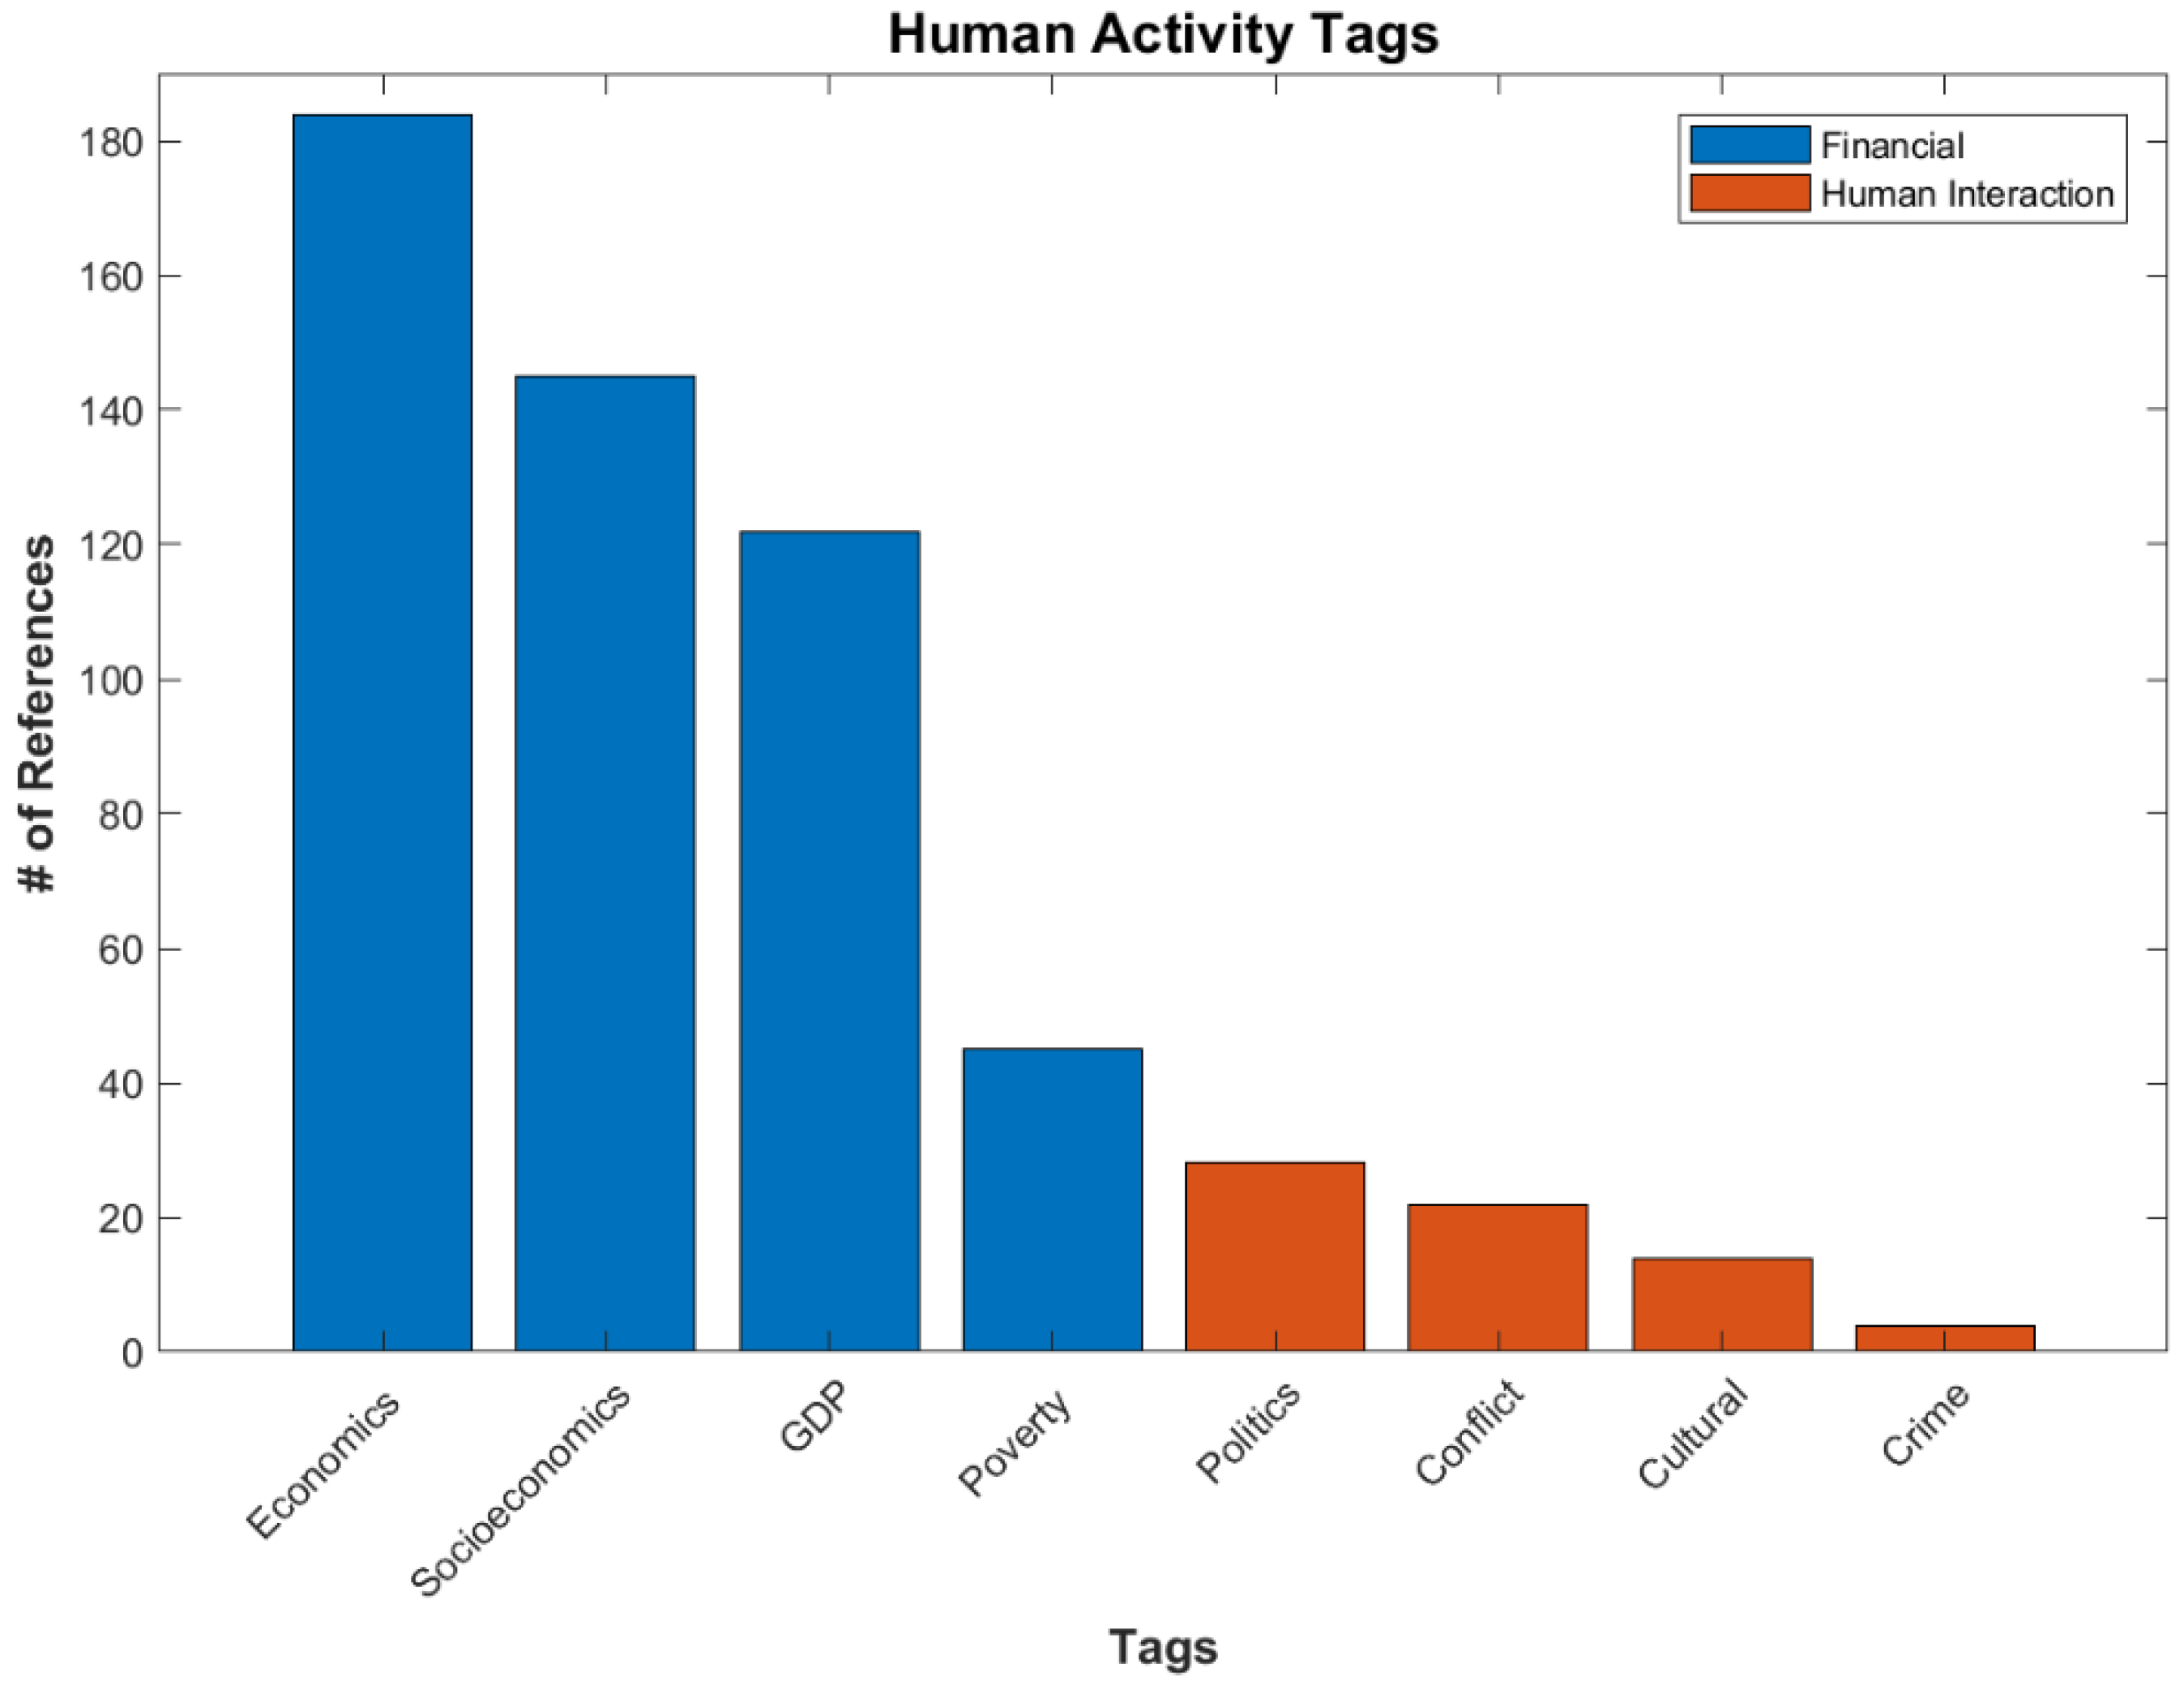
Human Activity is the second largest Applications subcategory, with 264 references, and is also considered a social science. As mentioned before, this subcategory focuses on studying humans themselves, either in the financial realm of economics and socioeconomics [2,7] or interpersonal interactions, including conflicts (war) [4], politics, culture [31], and crime. These estimates of various human activity metrics are used by numerous governments and agencies, such as the World Bank [32] and insurance companies. Due to the variety of topics in this subcategory, it has been split into two further subcategories: Financial and Human Interaction (Figure 7).
3.2.3. Atmosphere
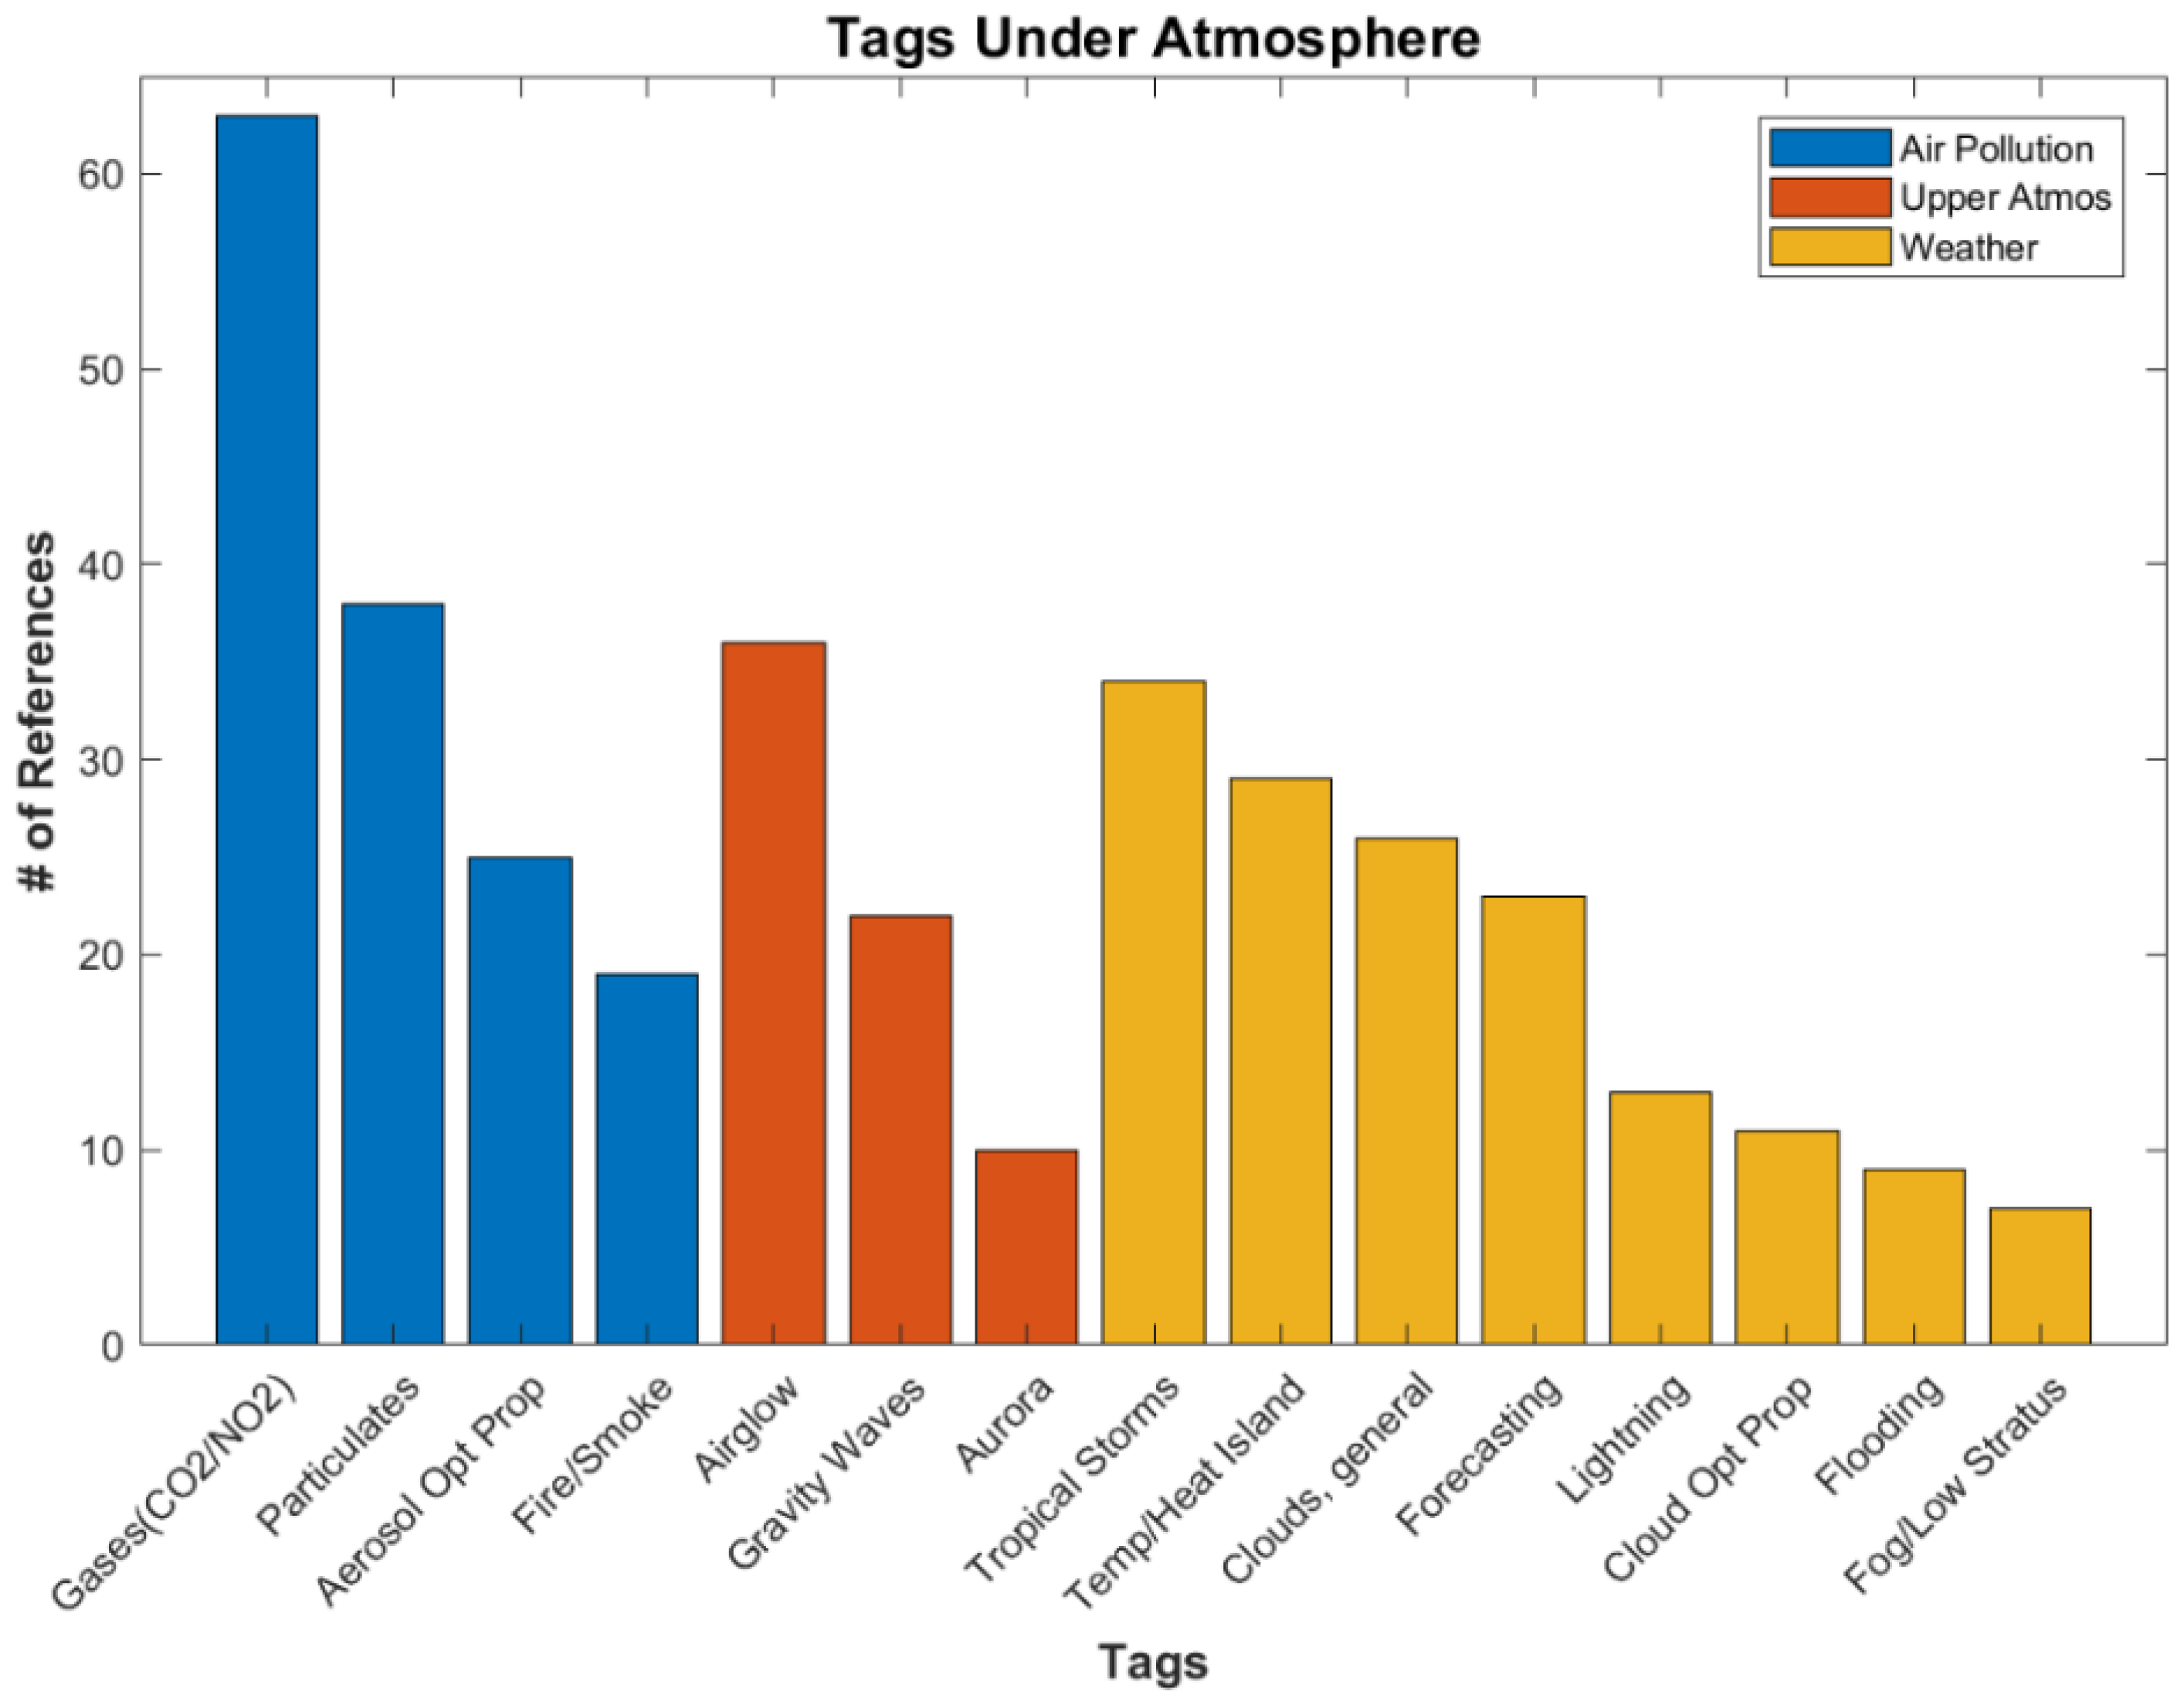
The next largest Applications category is Atmosphere (see Figure 5), which contains a total of 183 references. This is the category we expected to have the most references as this was the original purpose for DNB data. However, to our surprise, it has come in third to the social science categories of Urban and Land Use and Human Activity. Figure 8 shows a breakdown of the different tags under Atmosphere, which is divided further into the subcategories Air Pollution, Upper Atmosphere, and Weather. The Air Pollution tag of “Gases (CO2/NO2)” leads with the most references at 63. This category contains references quantifying the amount of carbon dioxide in given locations (important for climate change studies) [33] and nitrogen dioxide (important for air quality). Particulates is another common tag [34]. The subcategory with the second most references is “Airglow”, under Upper Atmosphere. This tag is gaining popularity as it is being used to detect features in the upper atmosphere, including gravity waves [35]. Tropical storms has a slight edge in Weather, due to several recent studies on the use of DNB data for hurricanes [36] and older Human Activity papers investigating the economic impacts of tropical storms [37]. Next is temperature/urban heat island studies, where DNB is used to determine the urban/rural divide [38]. Ironically, considering the original purpose of DMSP nightlights, general cloud references landed third in Weather.
3.2.4. Civil Engineering and Structure
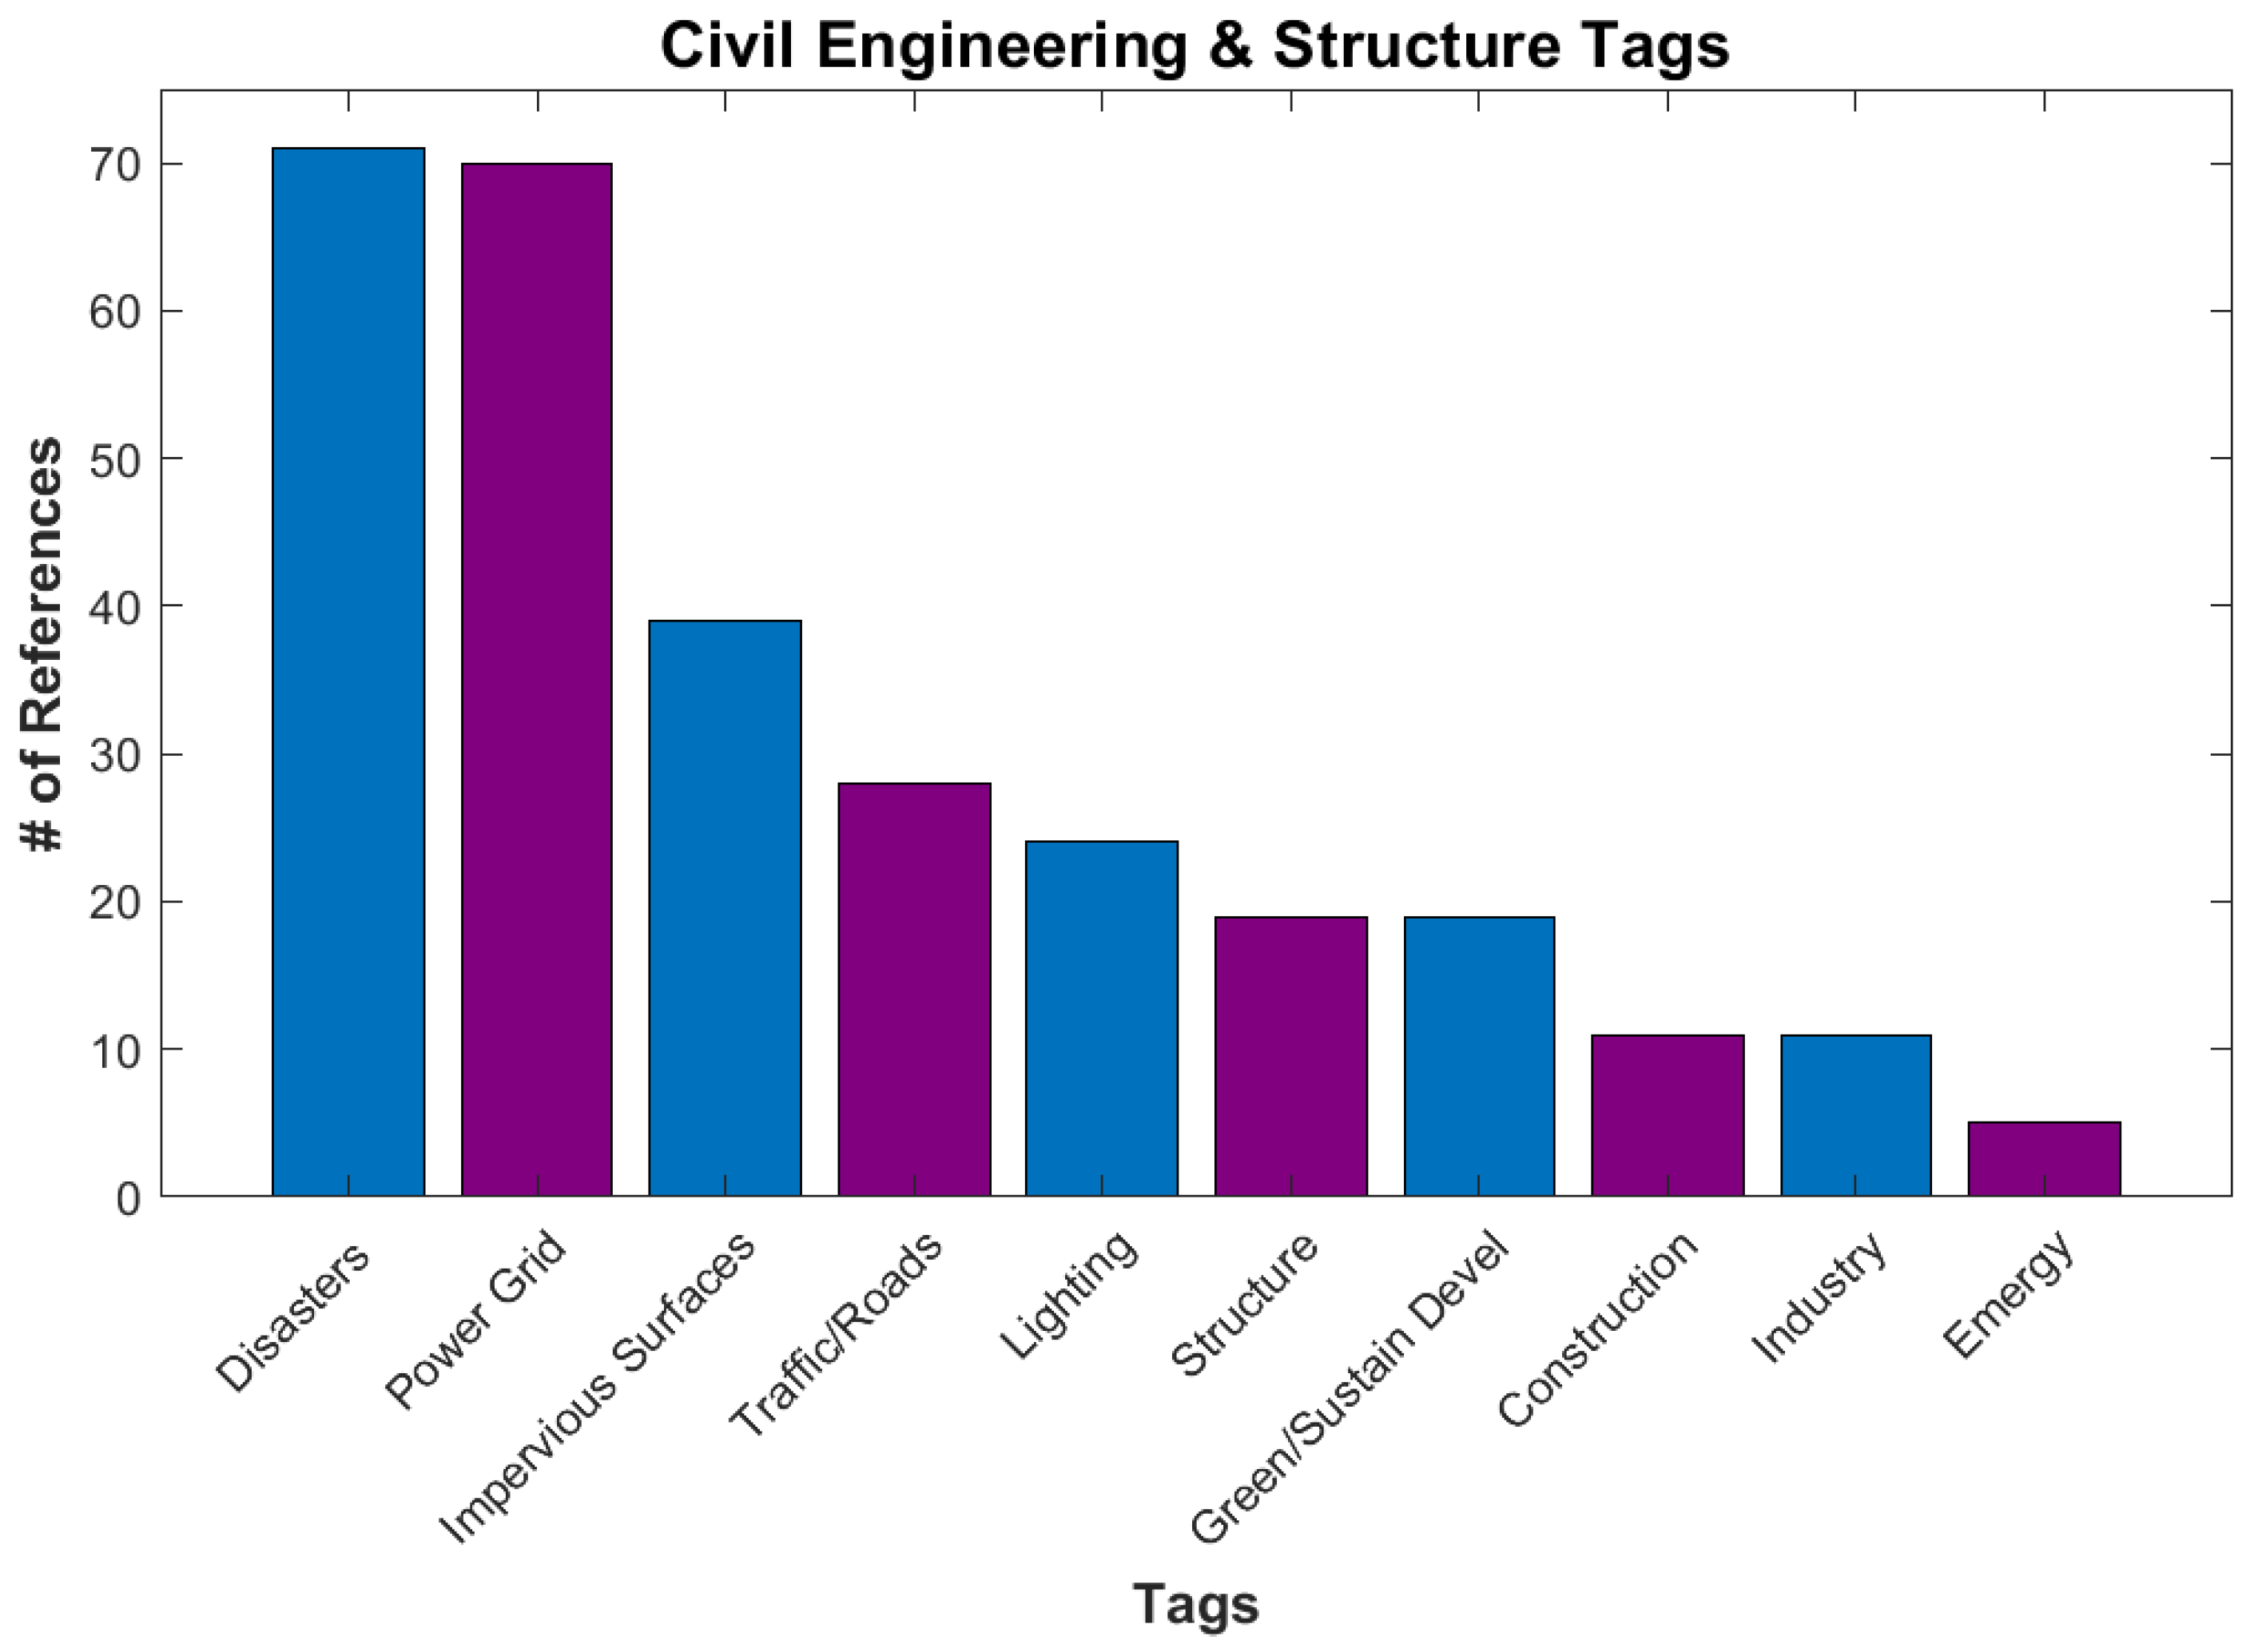
The Civil Engineering and Structure category (Figure 9), with 157 references, contains applications dealing with topics including the power grid, traffic, imperious surfaces, building structure, and industry. Power grids and associated lighting is one of the easiest details to see in the DNB data. The disasters tag was placed in this category as it identifies areas of missing lights that are used to estimate damage to buildings and the power grid in disaster zones [39]. Another main subcategory is Impervious Surfaces, which are land surfaces that repel rainwater and increase stormwater flow. These are usually artificial surfaces, though some natural surfaces, such as compact clay, fit the definition. Estimates of imperious surfaces are often used to estimate urbanization [40].
3.2.5. Lights
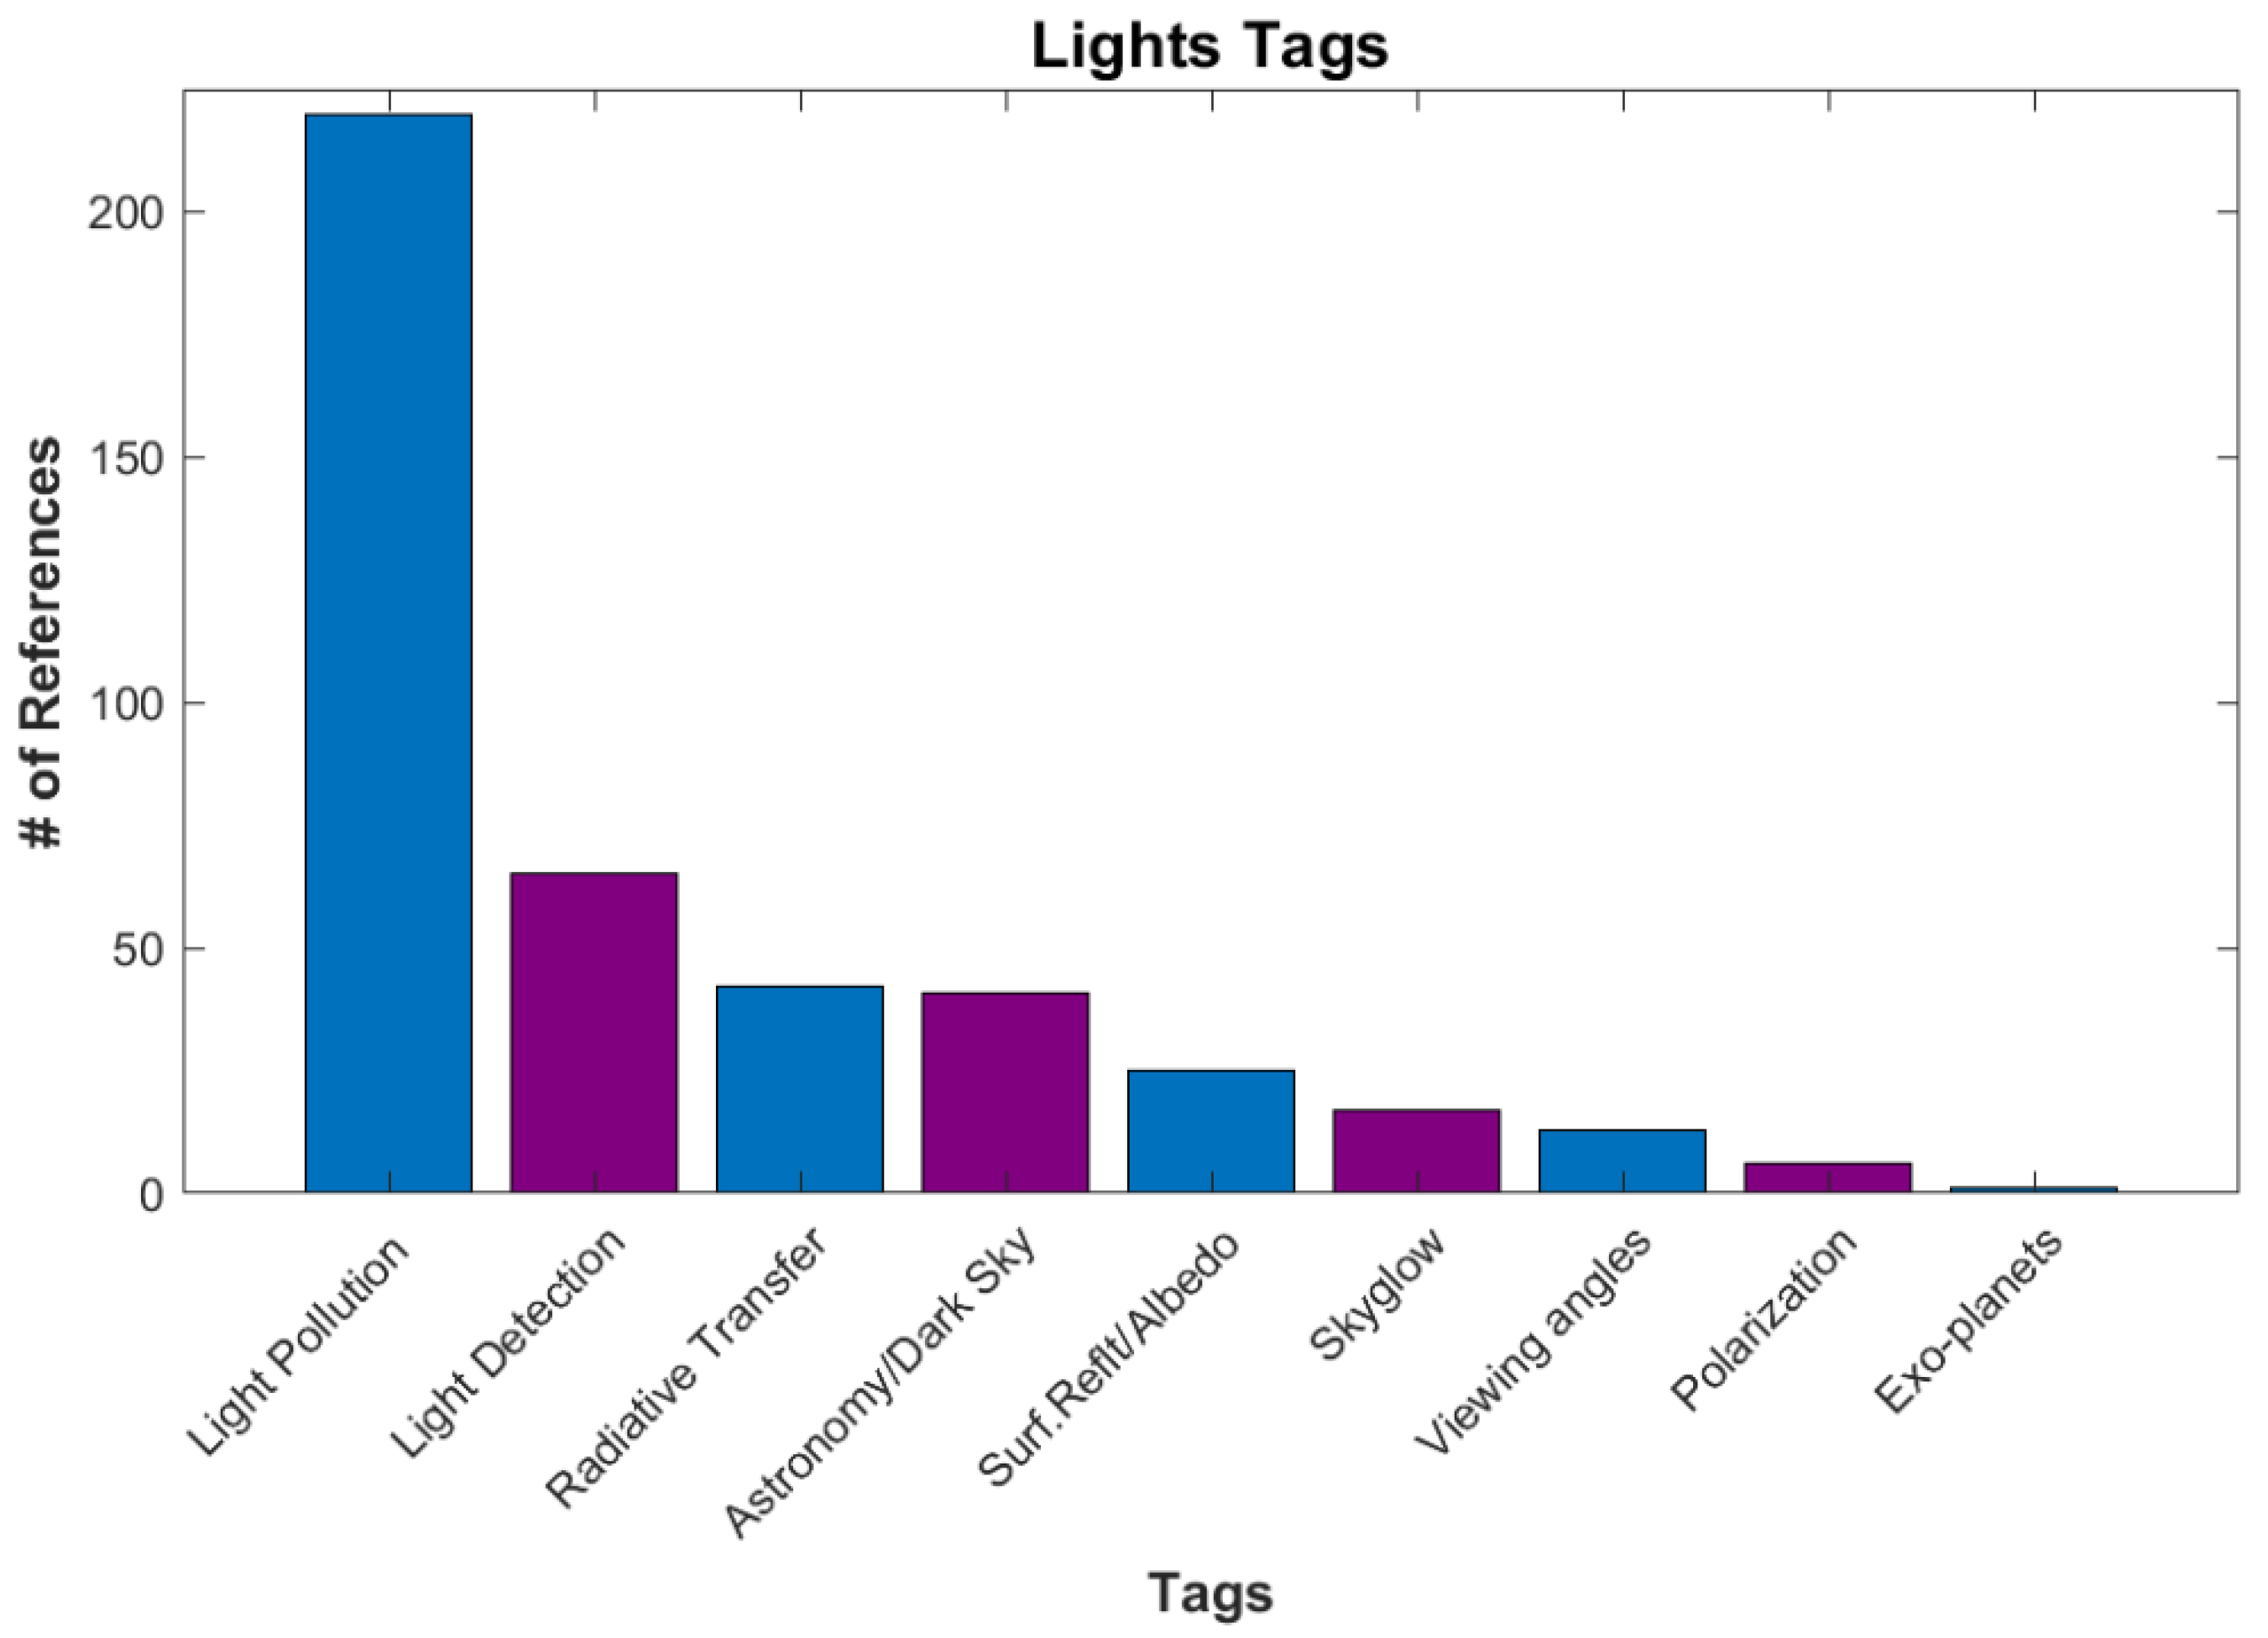
The next category is Lights (Figure 10), with 144 references. These references focused on the detection of light, light pollution, and light modeling. Light pollution is the largest because it is often found under another application category. This includes Social Science and Biology due to the impacts of “Artificial Light At Night” (ALAN) on humans and wildlife [41]. Light pollution near astronomy observation sites and dark sky reserves are also a major concern [42]. Many tags in this category are used in modeling artificial lighting and skyglow. Perhaps the strangest use of DNB data in this category was in a study titled “The Detectability of Nightside City Lights on Exoplanets” [43].
3.2.6. Biology
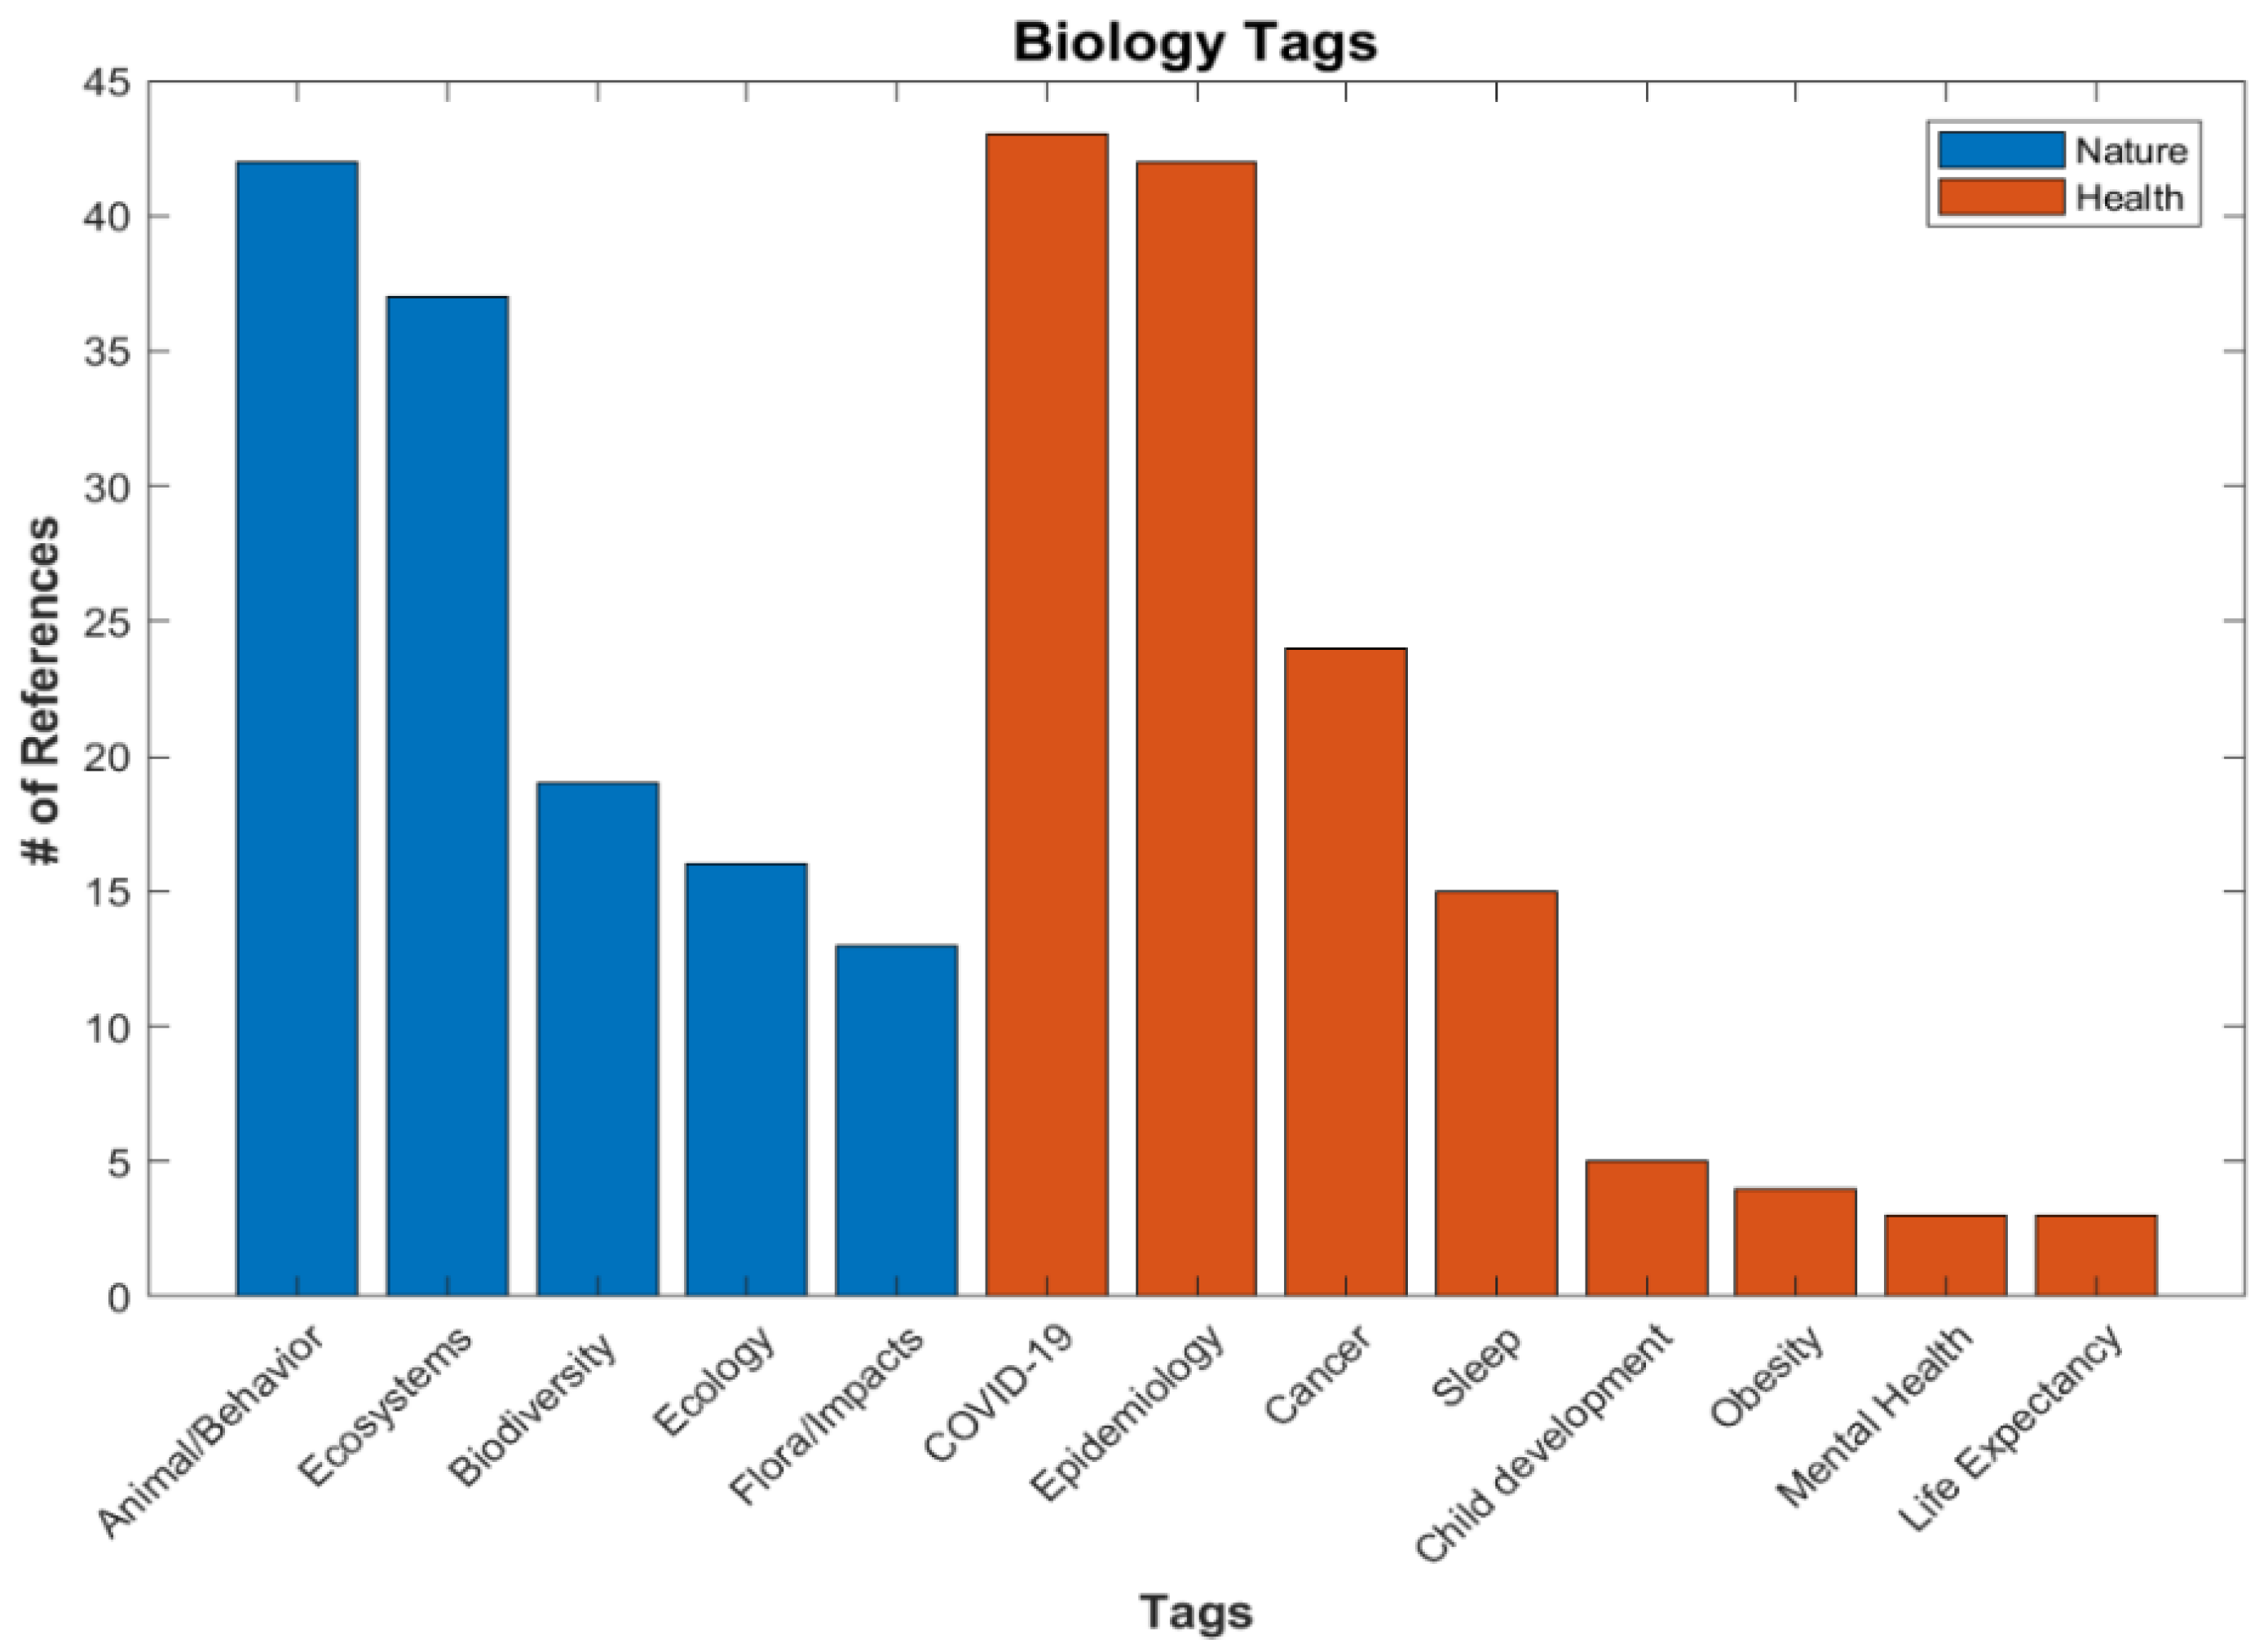
The next category is Biology (Figure 11), with 133 references. This application seems to fall into two subcategories of Nature or Human Health, but both are concerned with the impacts of ALAN. This appears to be a large and growing topic. Researchers are finding links between ALAN and turtle nesting [44], bat and bird behavior [45,46], and cancer in humans [47]. The rate of publication in this area had been fairly steady, then exploded with the recent pandemic. The COVID-19 tag is seen in a lot of other application categories, especially Human Activity papers [48].
3.2.7. Oceans and Freshwater
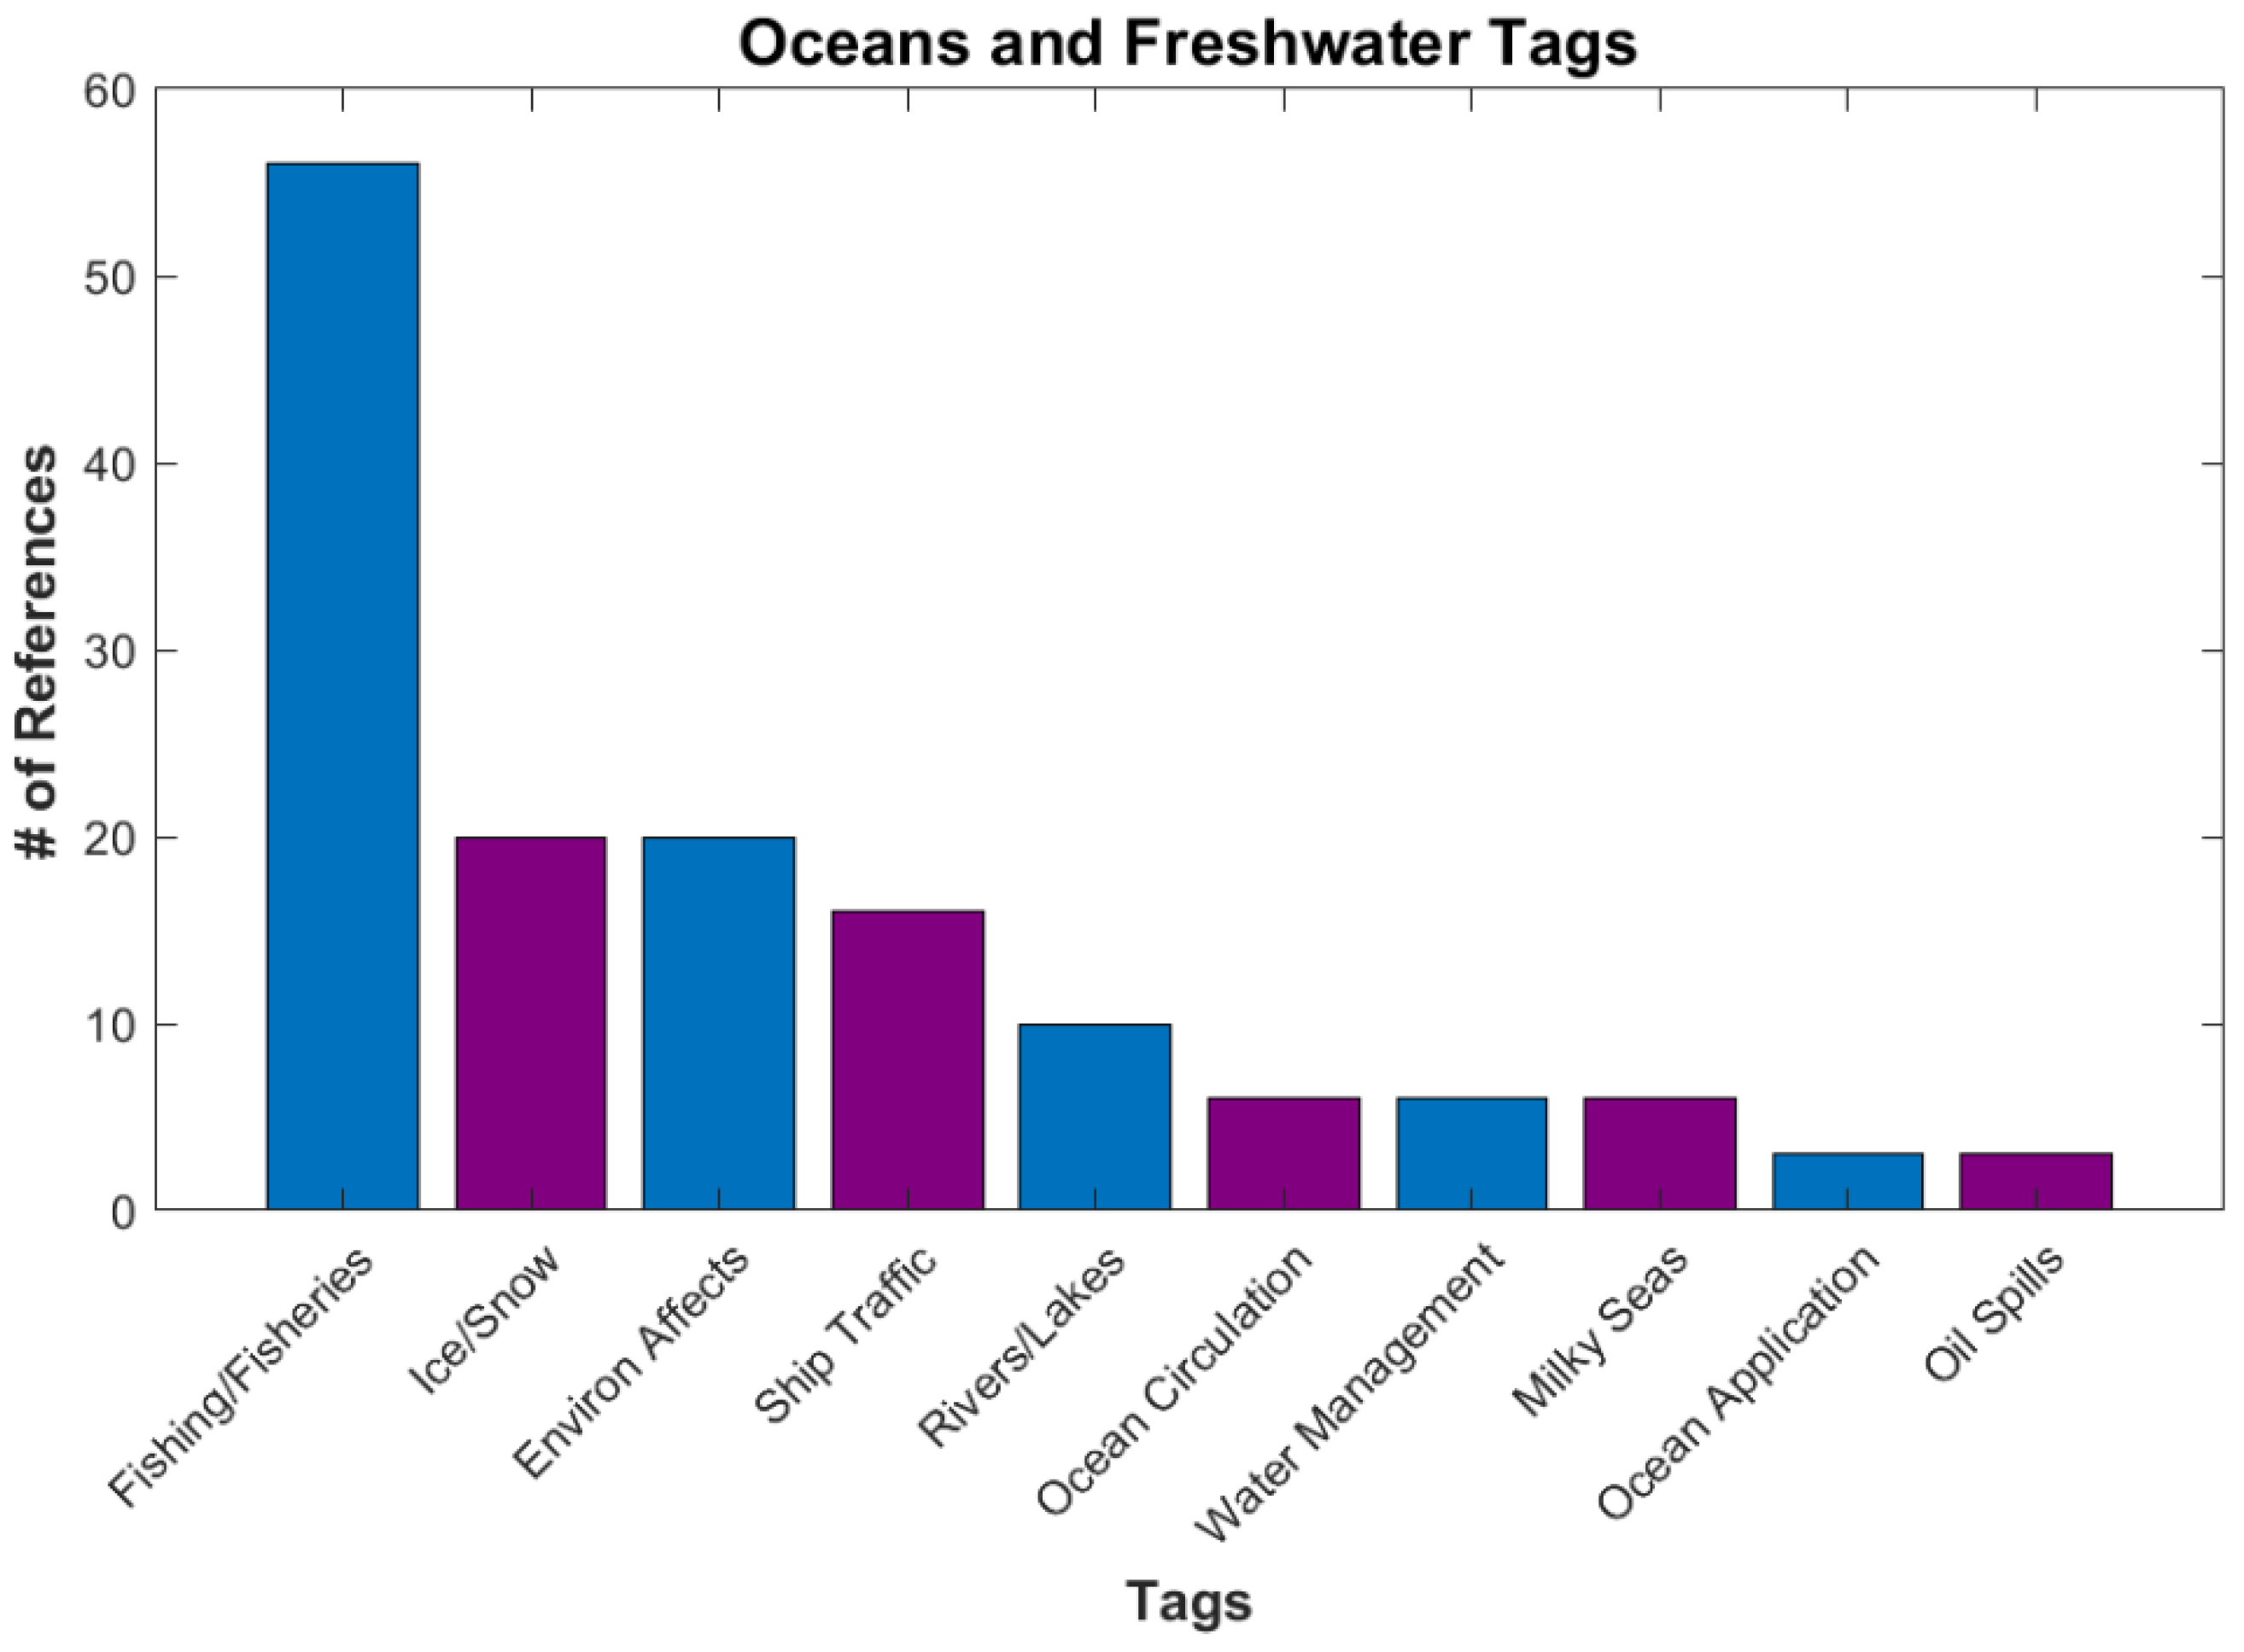
Oceans and Freshwater, with 84 references, include applications that involve water resources (Figure 12). Fishing is a large tag in this category. The DNB can detect the lights associated with night fishing, which can be used to monitor the number and locations of fishing boats [49]. It is also useful for keeping track of ship traffic [50]. Bioluminescence, ocean circulation, and ice references are also in this category. A recent publication about Milky Seas (which is a large area of bioluminescence within calm waters) detected by the DNB [51] was discussed in a recent NY Times article “https://www.nytimes.com/2021/08/27/science/ocean-bioluminescent-satellite.html (accessed on 16 January 2023)”.
3.2.8. Natural Resources
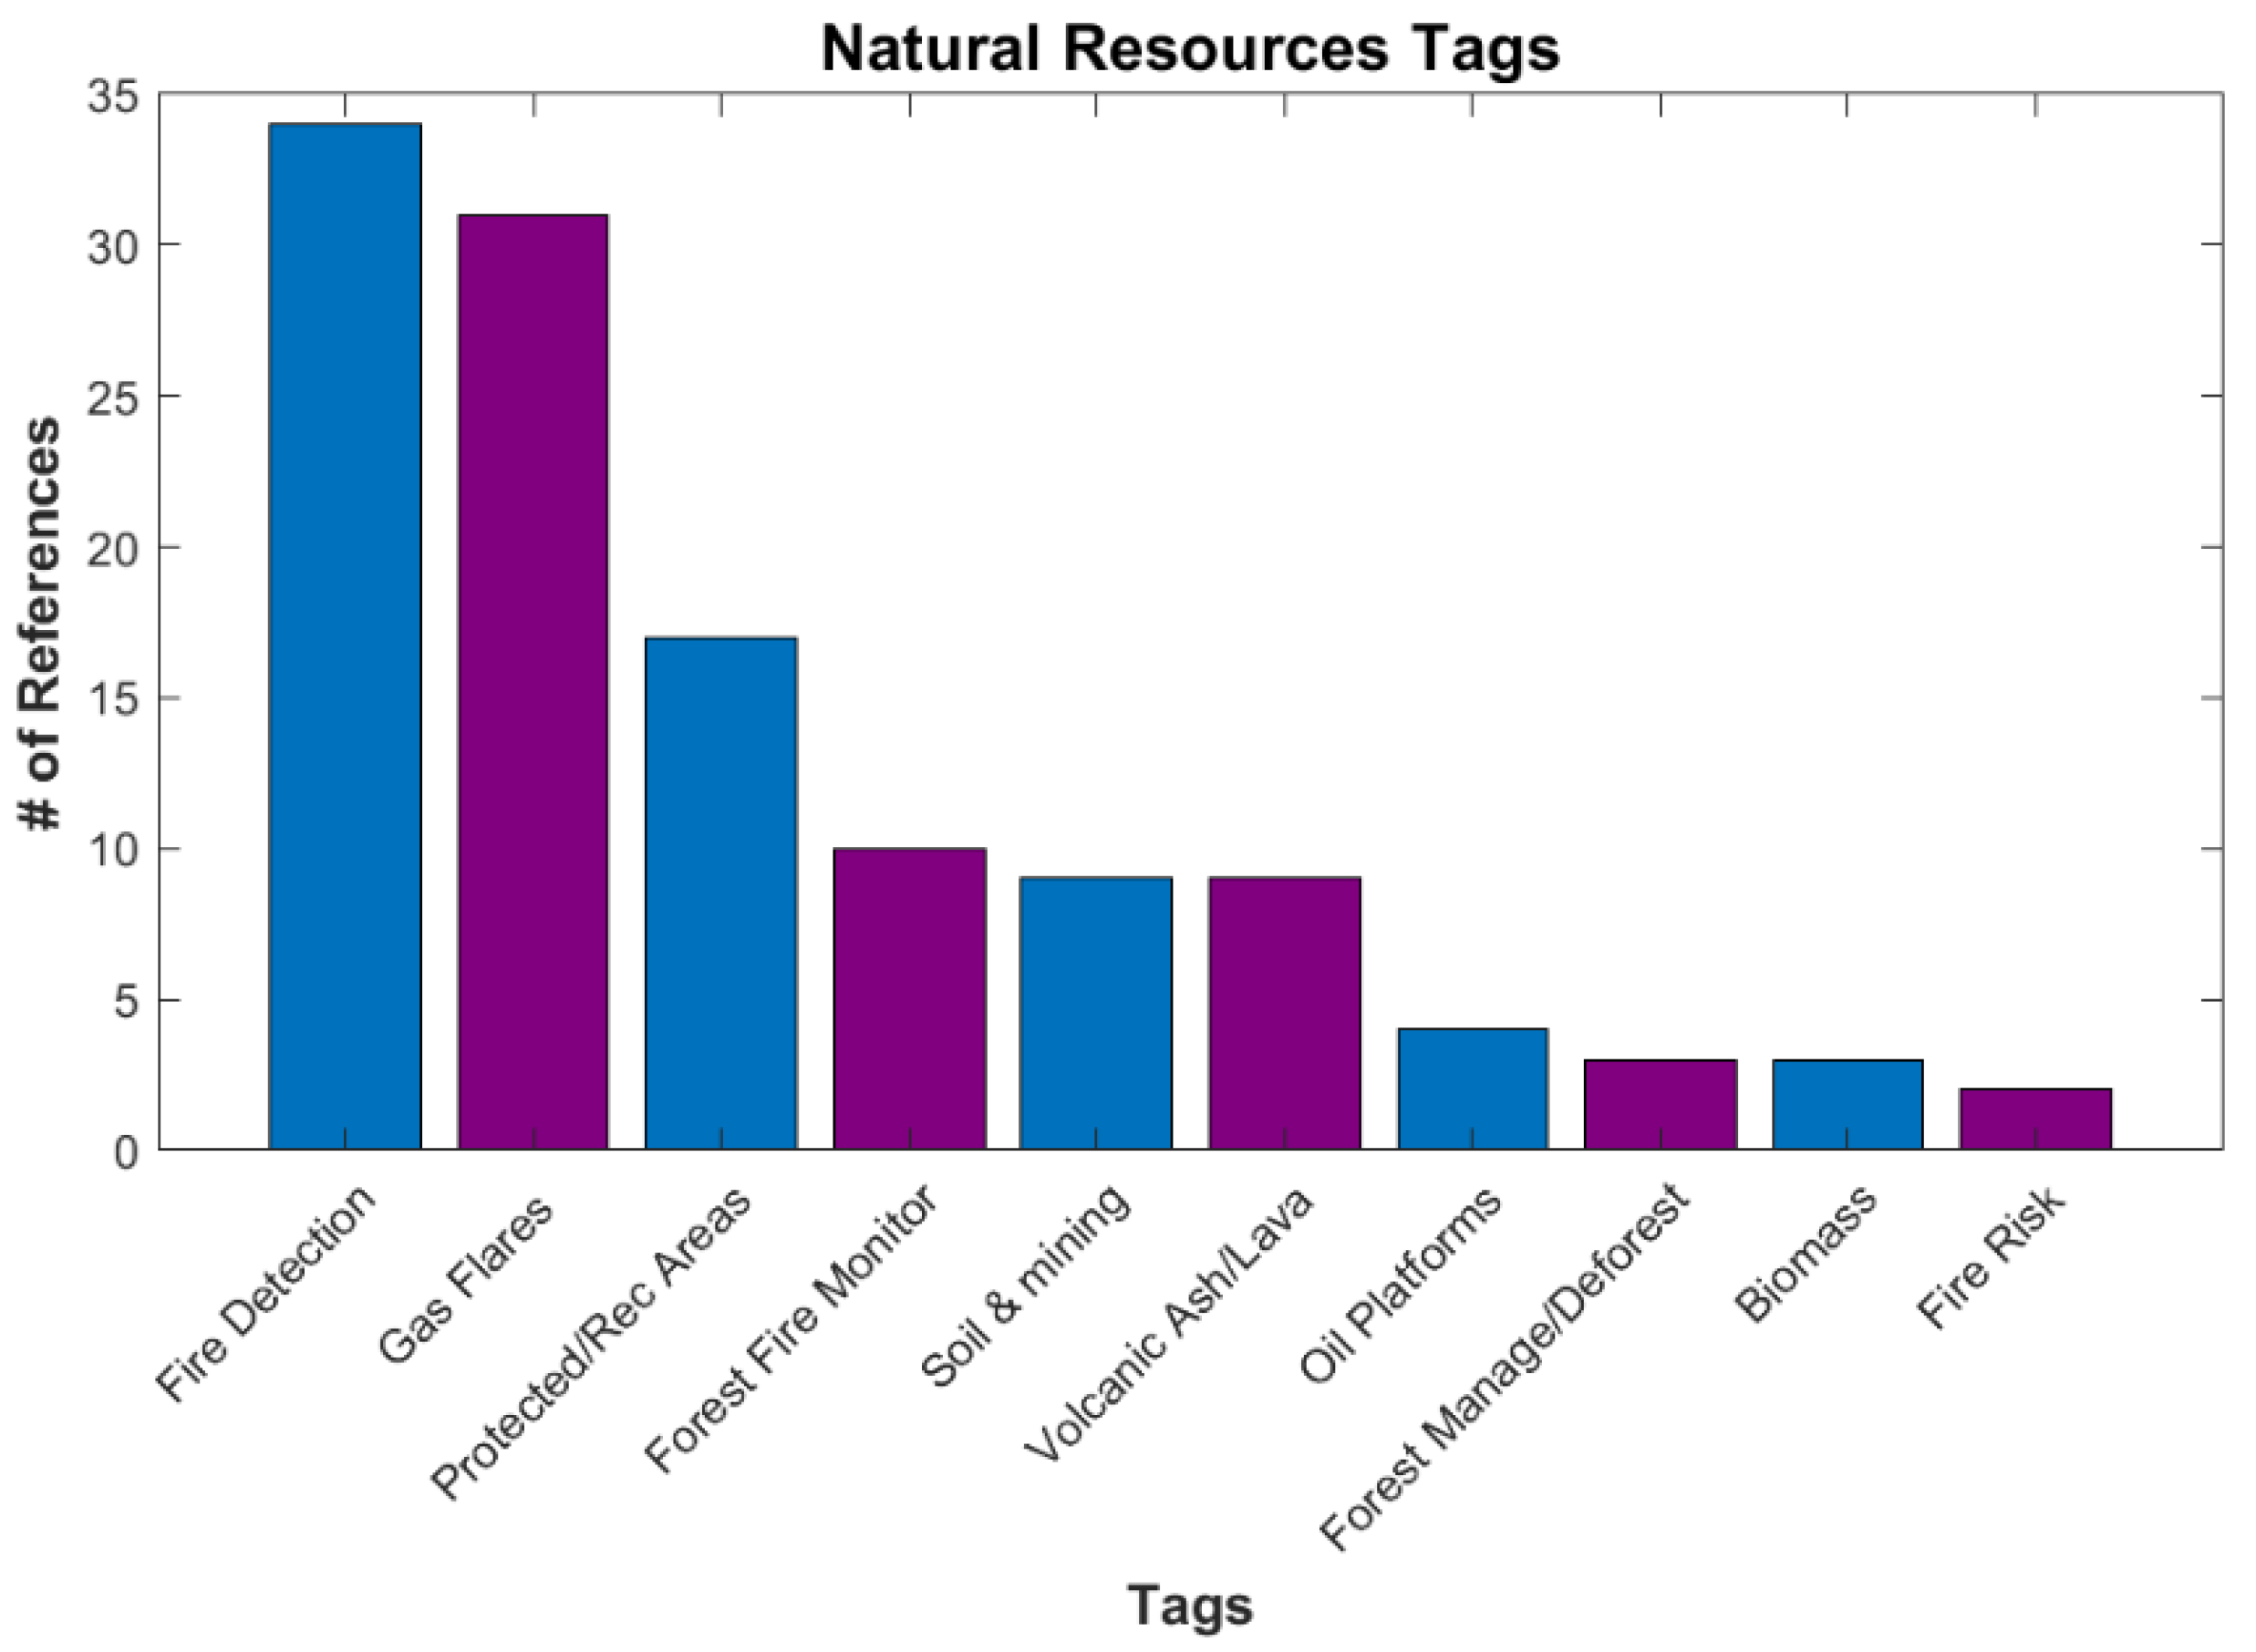
The smallest category is Natural Resources, with 52 references. It contains both protecting and exploiting natural resources (Figure 13). A concern that has become more important in recent years is wildfire. Several tags are associated with the detection and location of wildfires, along with determining fire risk [52]. A large exploitation tag is gas flares, which are associated with oil production and oil field operations [53]. While not fitting in either protection or exploitation, volcanic lava and ash are in this category as they are natural hazards too.
3.3. Miscellaneous
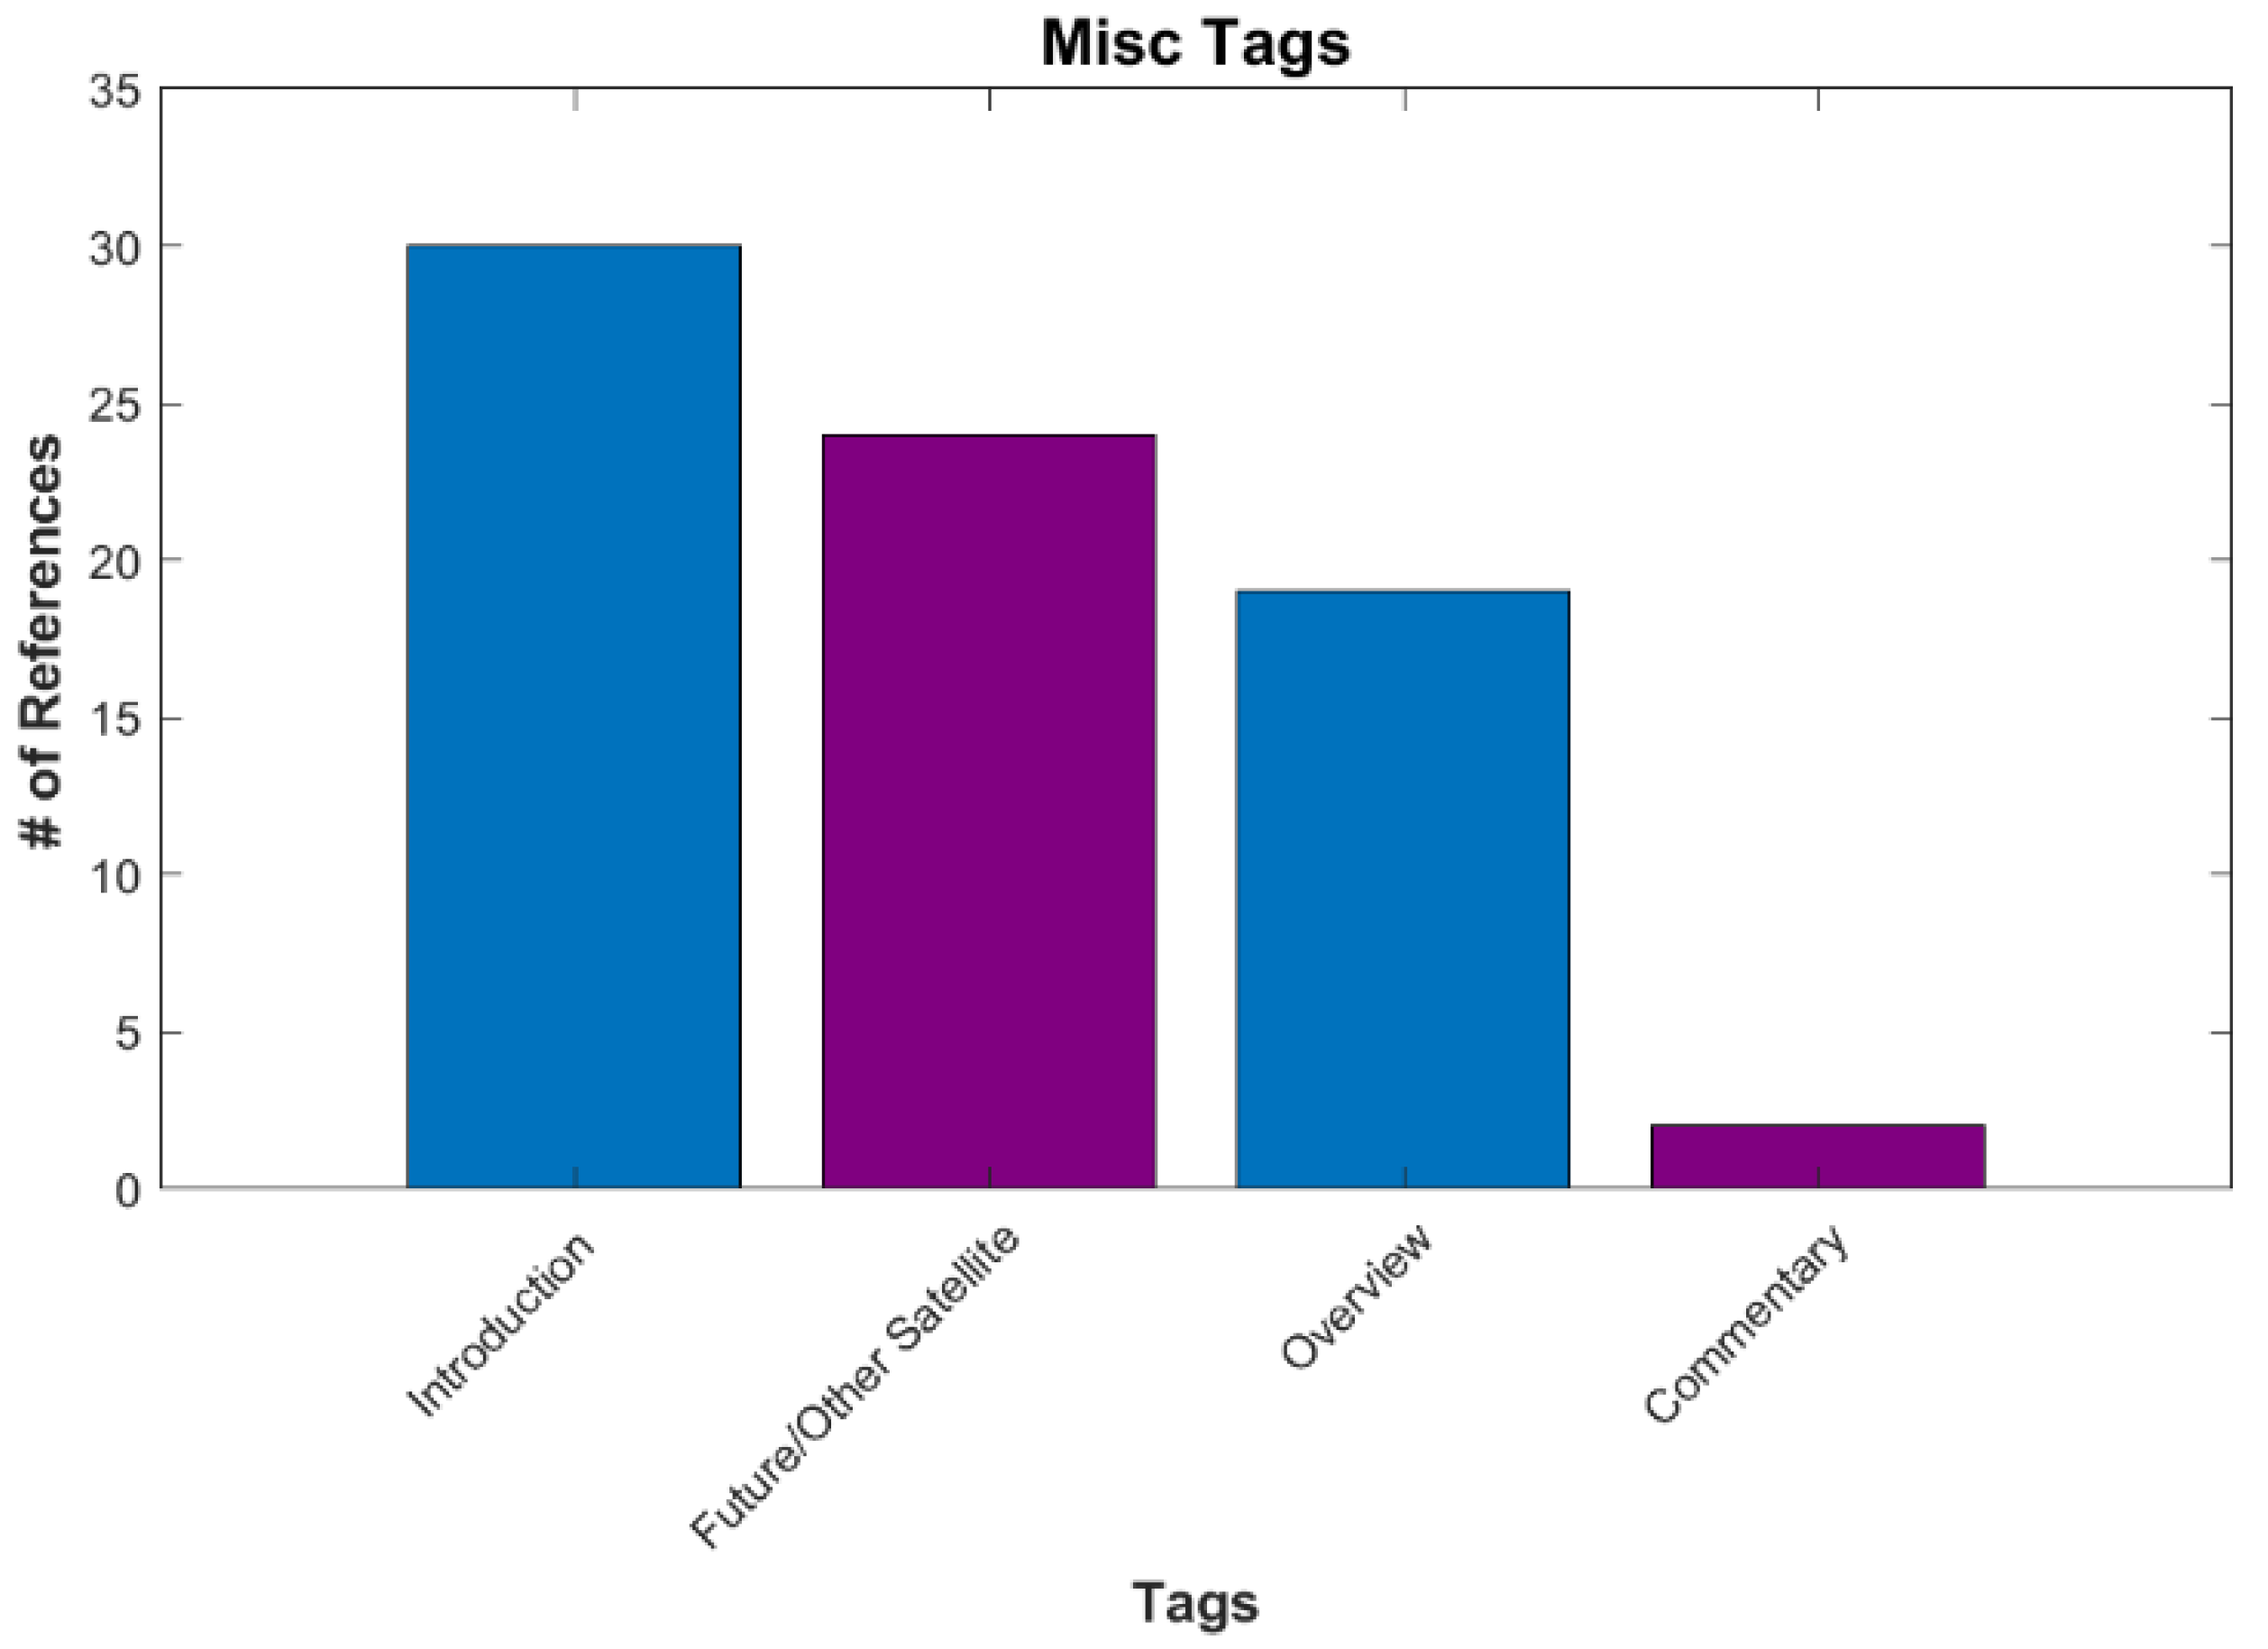
Miscellaneous (Misc.) is the last main category and the smallest, with 53 references (Figure 14). Most of these papers are introductions of the new VIIRS series or an overview of the program. Future satellites include papers on CubeSats. One paper tagged commentary attempts to tie the city lights’ images from NASA to environmentalism and environmental justice [54].
3.4. Other Tags
There are other tags in the database which apply to multiple categories. Tags associated with computer processing or mathematics are prime examples. These tags include algorithms, data processing, machine learning, and modelling. In particular, machine learning has become more common across different areas of study. Another tag is recorded presentation, where the database entry contains a link to an associated media file. Review is a tag where the reference is a review of a given area of study.
4. Comparisons
4.1. Light Type: Artificial vs. Natural
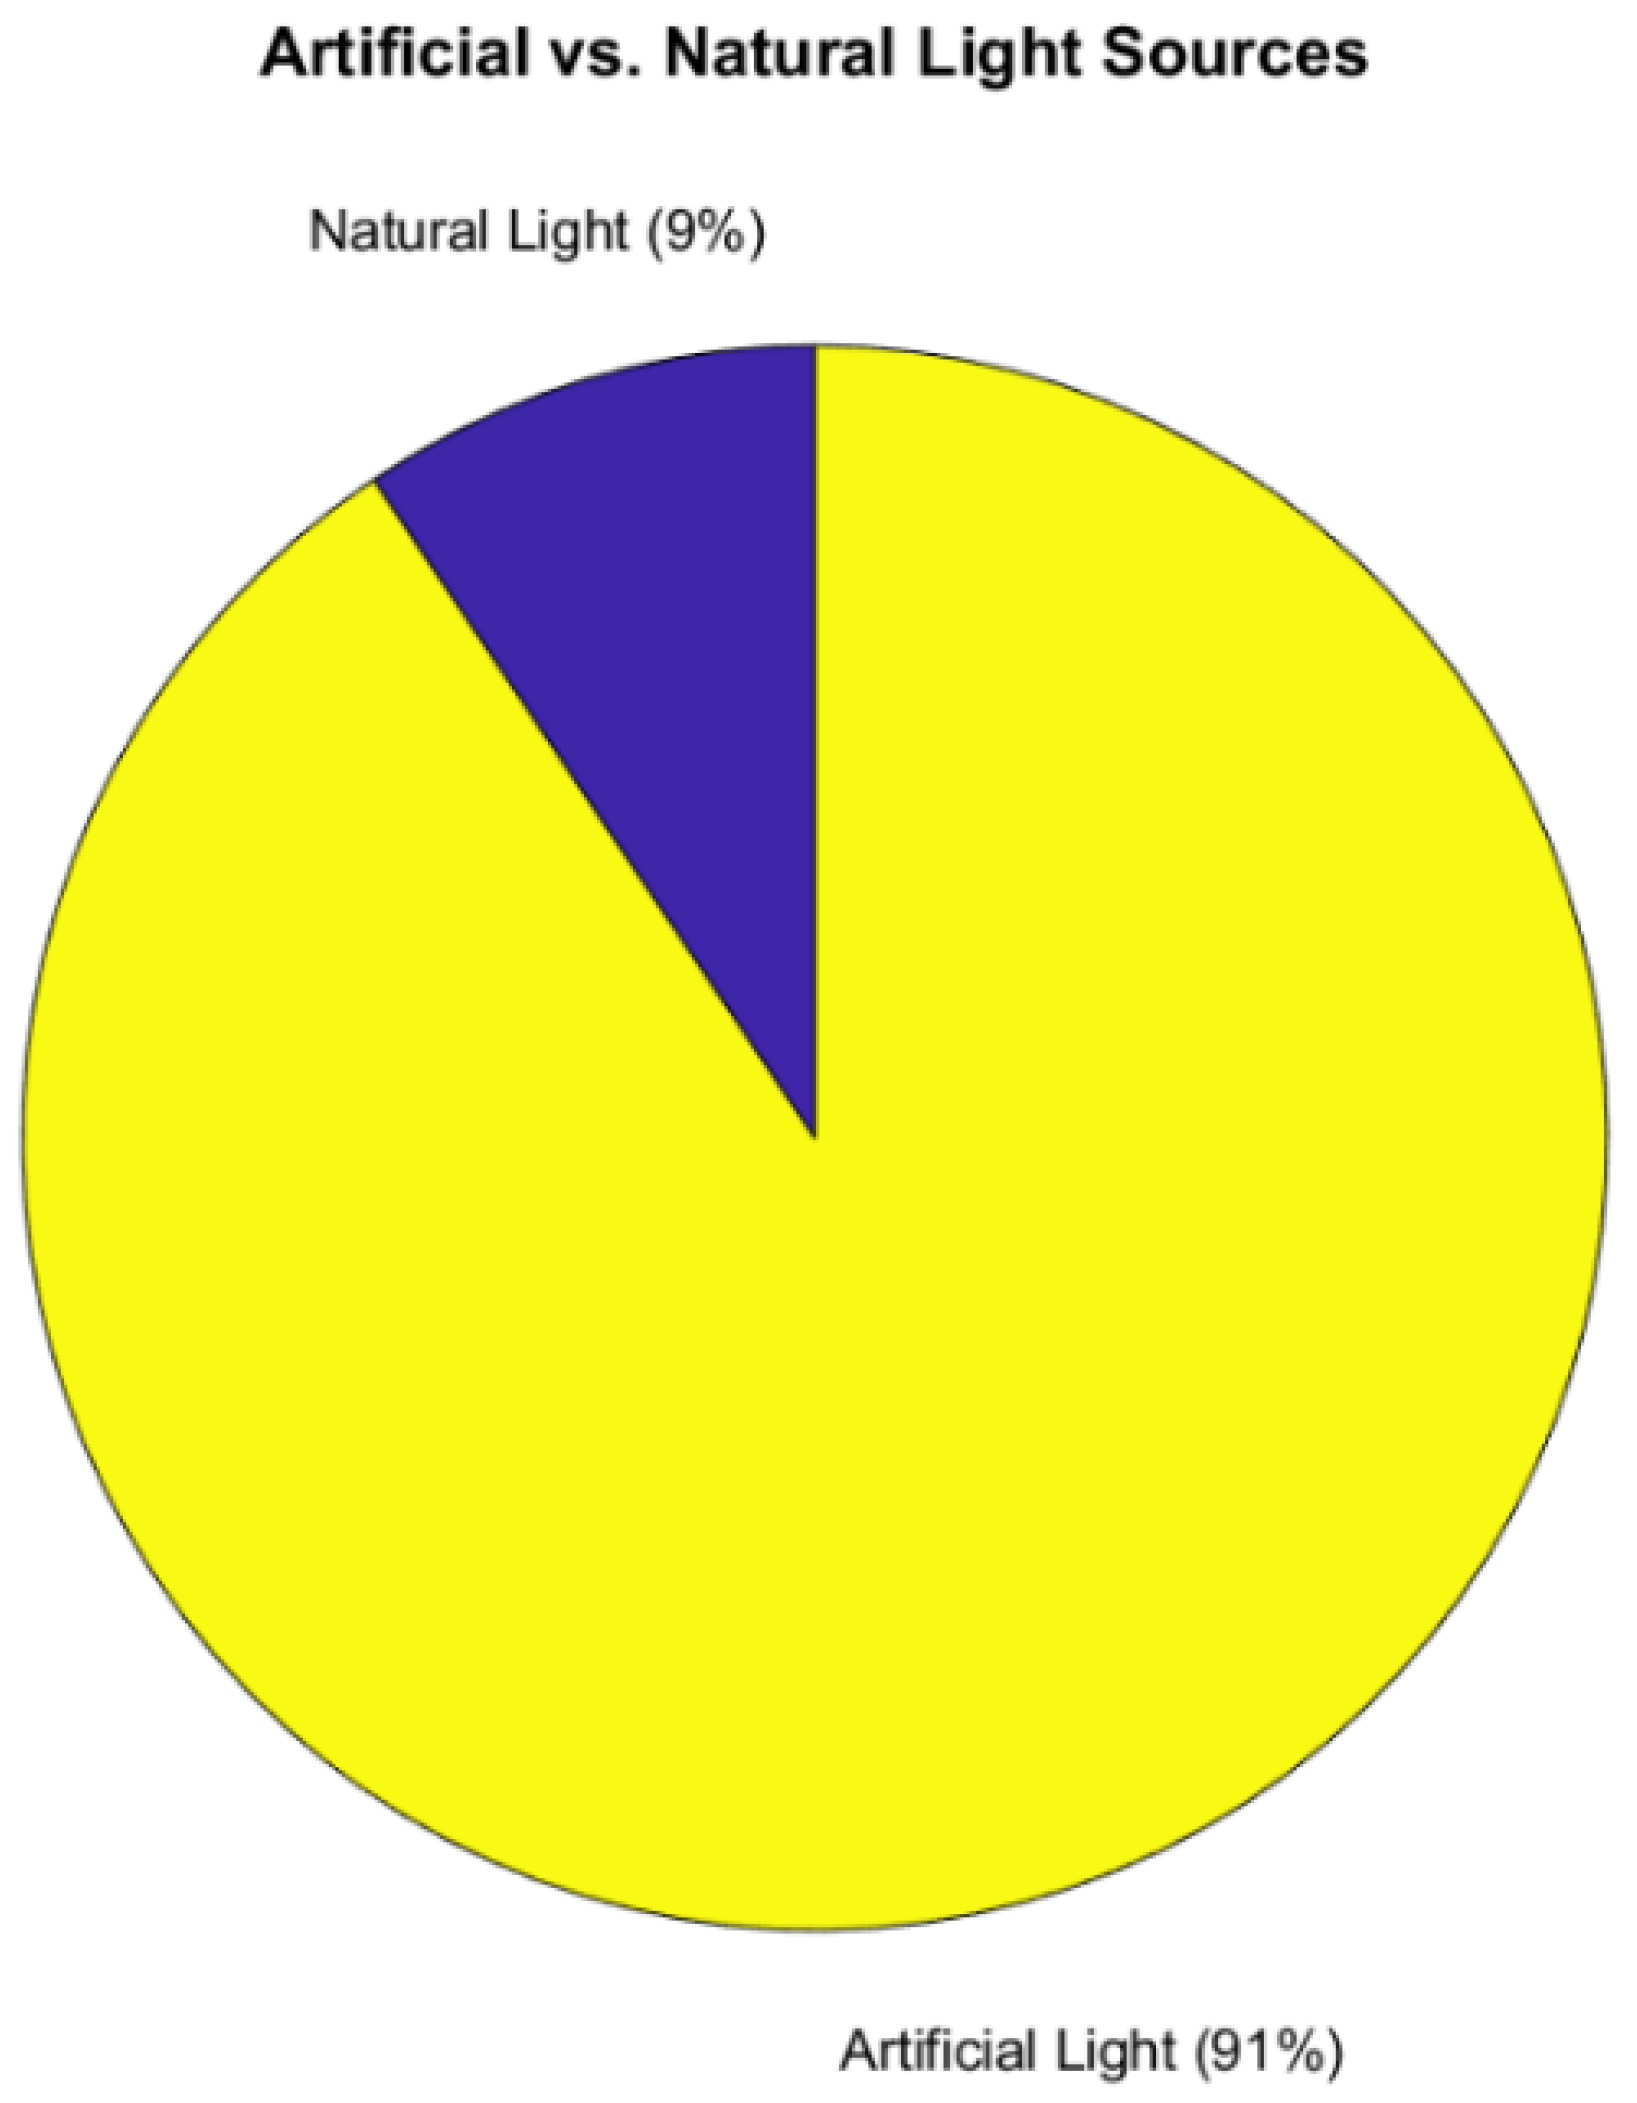
The DNB can detect both artificial and natural lights. One relevant question to this study is how many Application references use one vs. the other as their principal source of nighttime information. Figure 15 shows the comparison between natural vs. artificial light usage. While the DNB was designed for applications using natural light (especially moon light), artificial light is used significantly more often (91%) by the research and end-user community at this time. The entire Urban and Land Use, Human Activity, and Civil Engineering and Structure categories involve artificial lights. ALAN studies in Biology are focused on artificial lights. Additional tags using artificial light include fishing, light pollution, gas flares, oil platforms, and ship traffic. Any duplicate tags between categories within Artificial Lights were removed.
Natural light includes tags on airglow, wildfire, bioluminescence, lightning, volcanic processes, and auroras. Duplicate tags were removed.
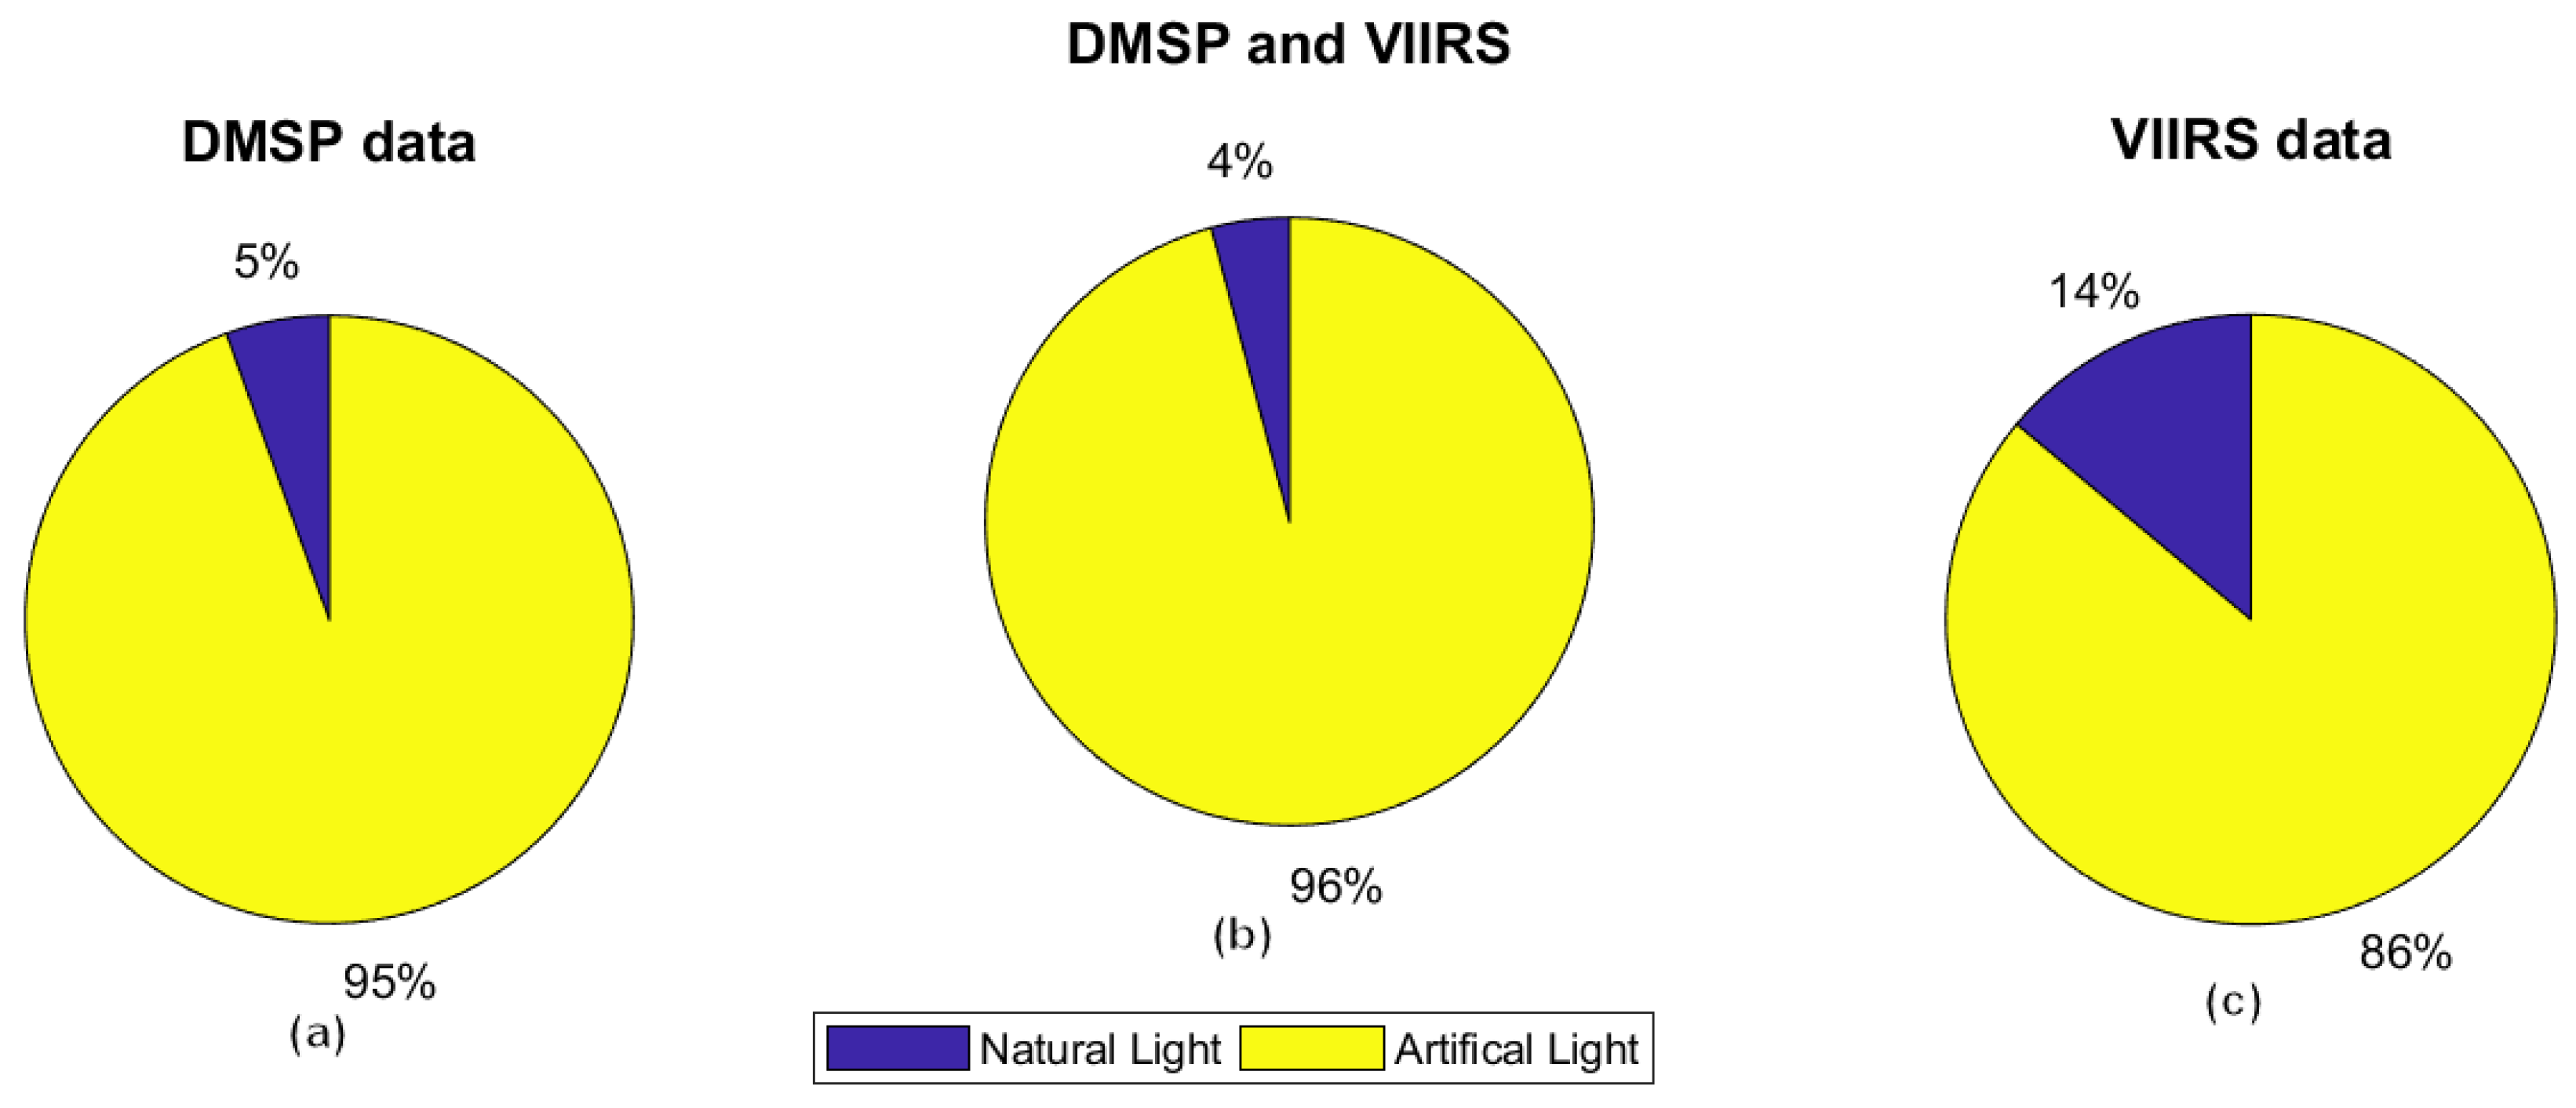
Another question is whether this split is different for DMSP vs. the newer VIIRS imagers. As seen in Figure 16, papers using VIIRS are taking advantage of the DNB detection of natural light more often.
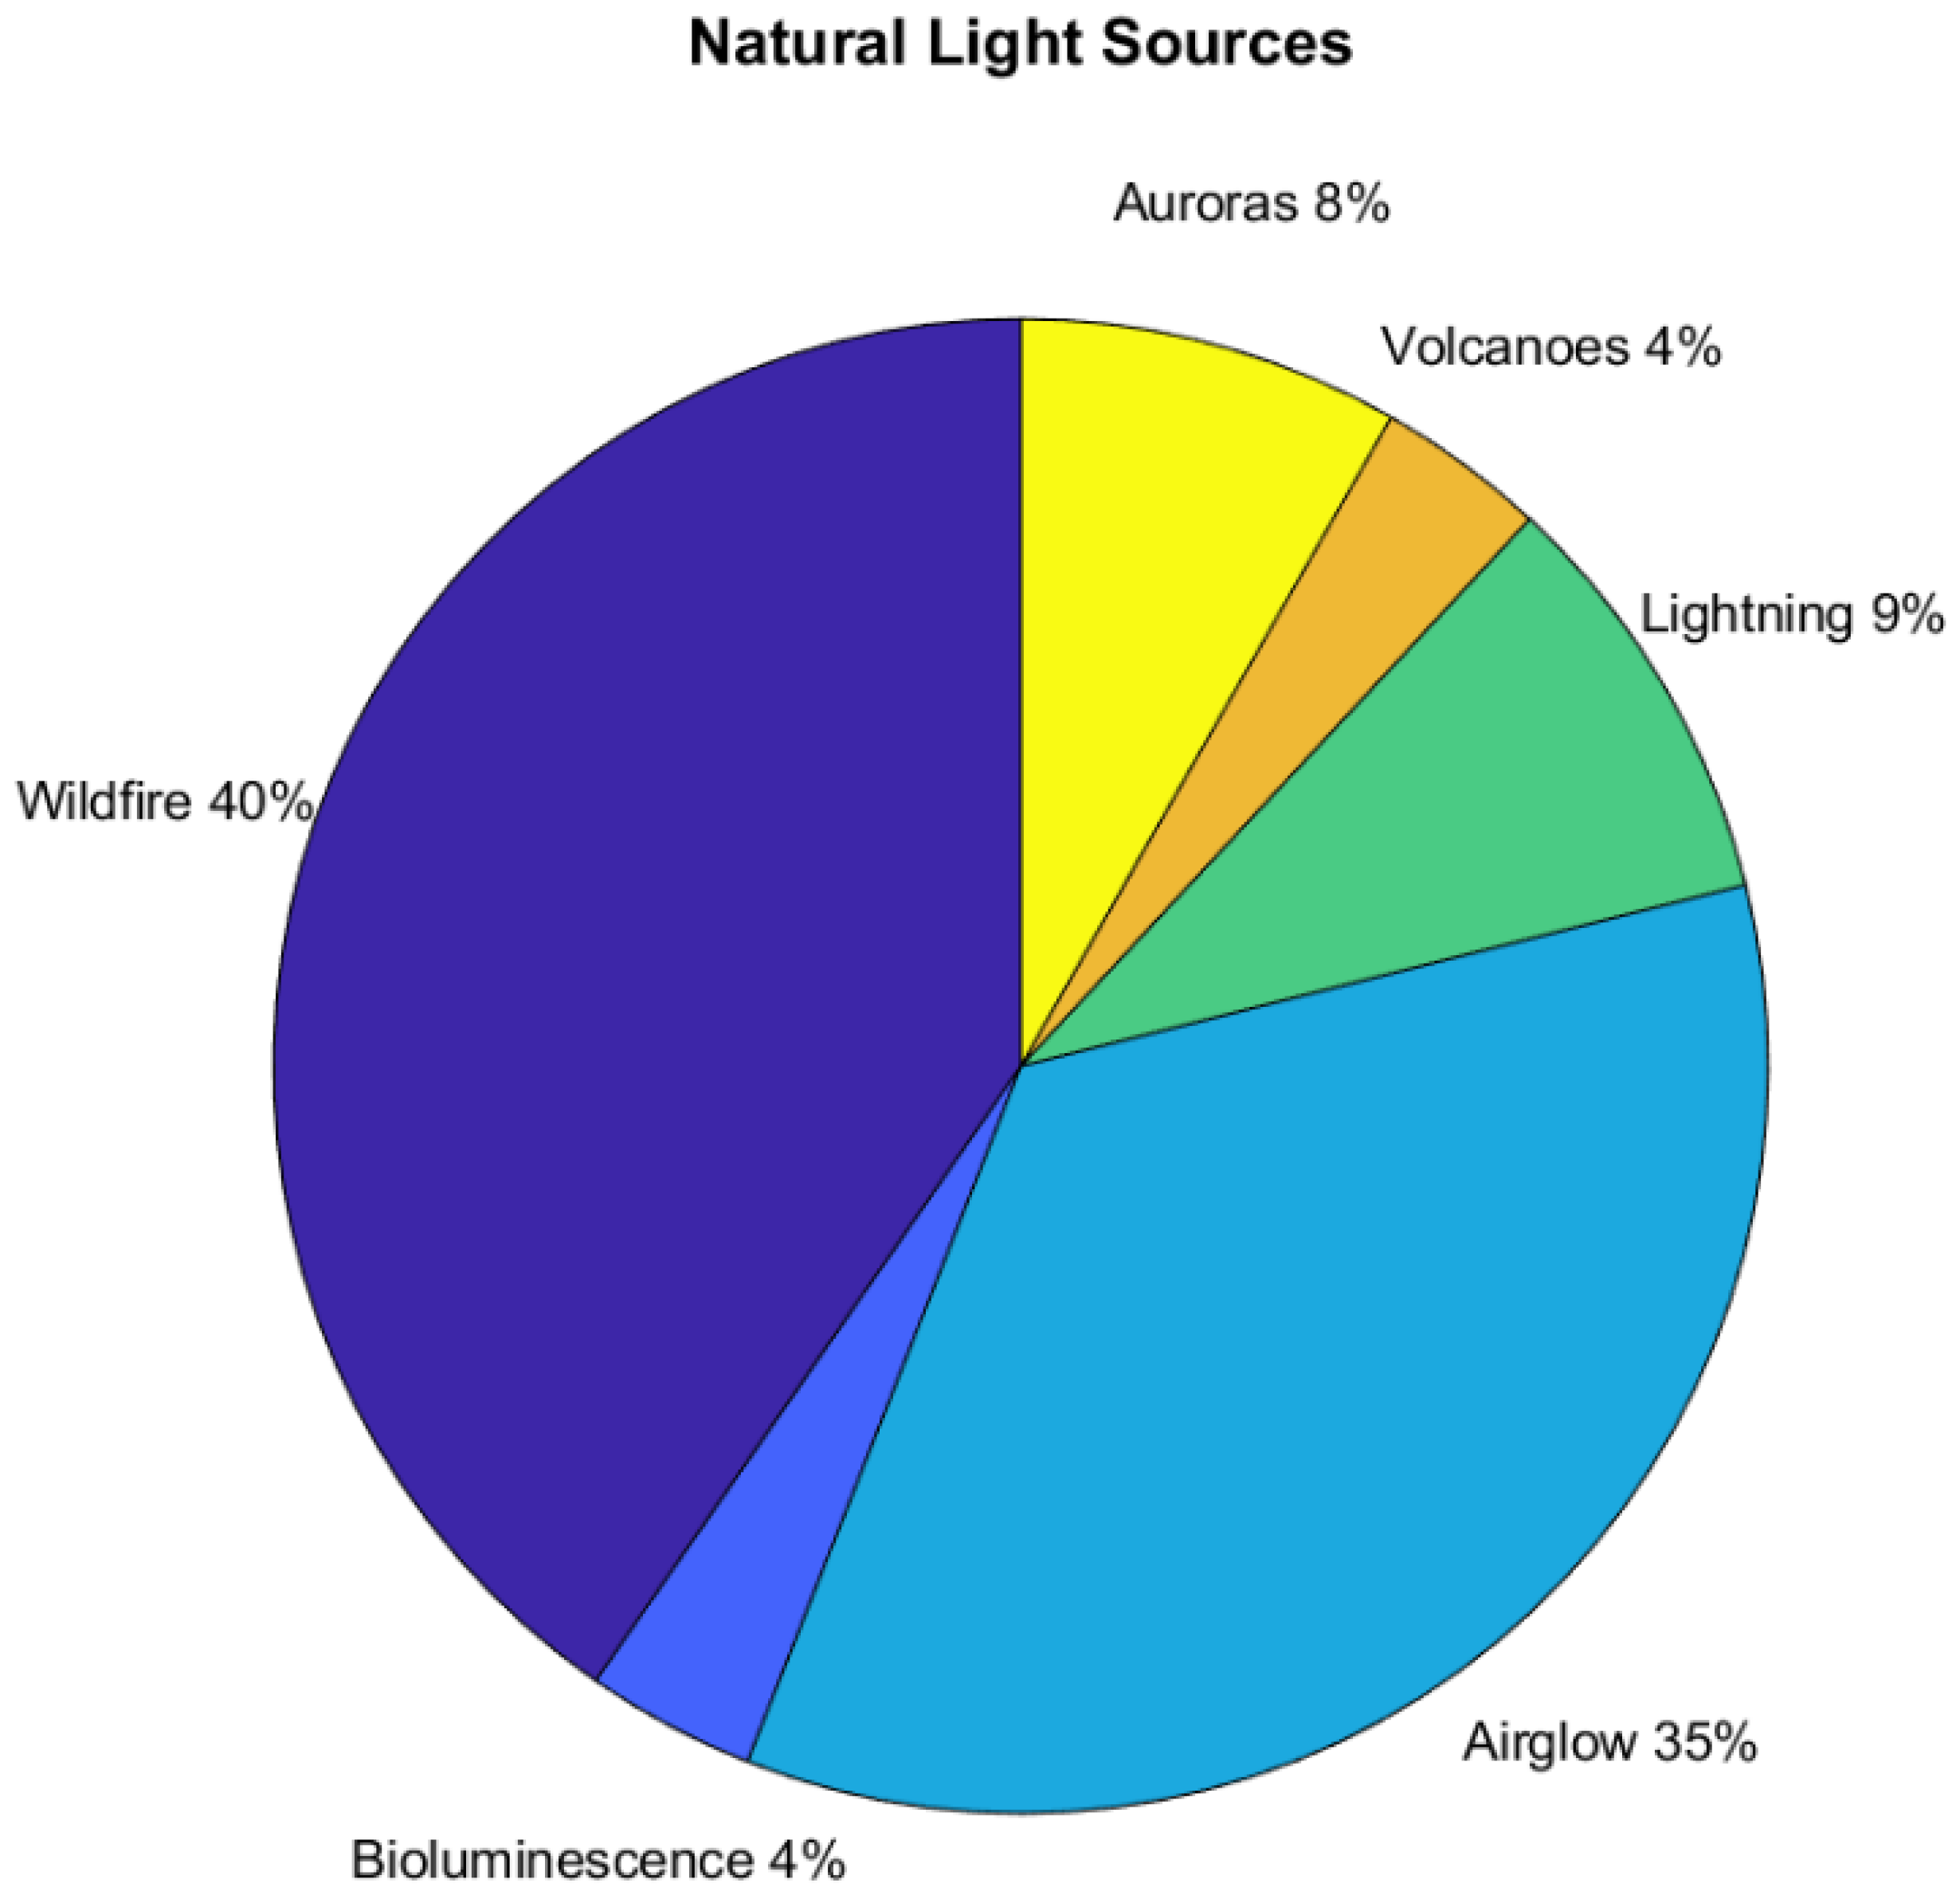
What makes up natural or artificial light? Figure 17 shows the percentages of the 109 references that used natural light. Wildfires were found to be the largest component, with airglow (an entirely unanticipated capability) coming in second.
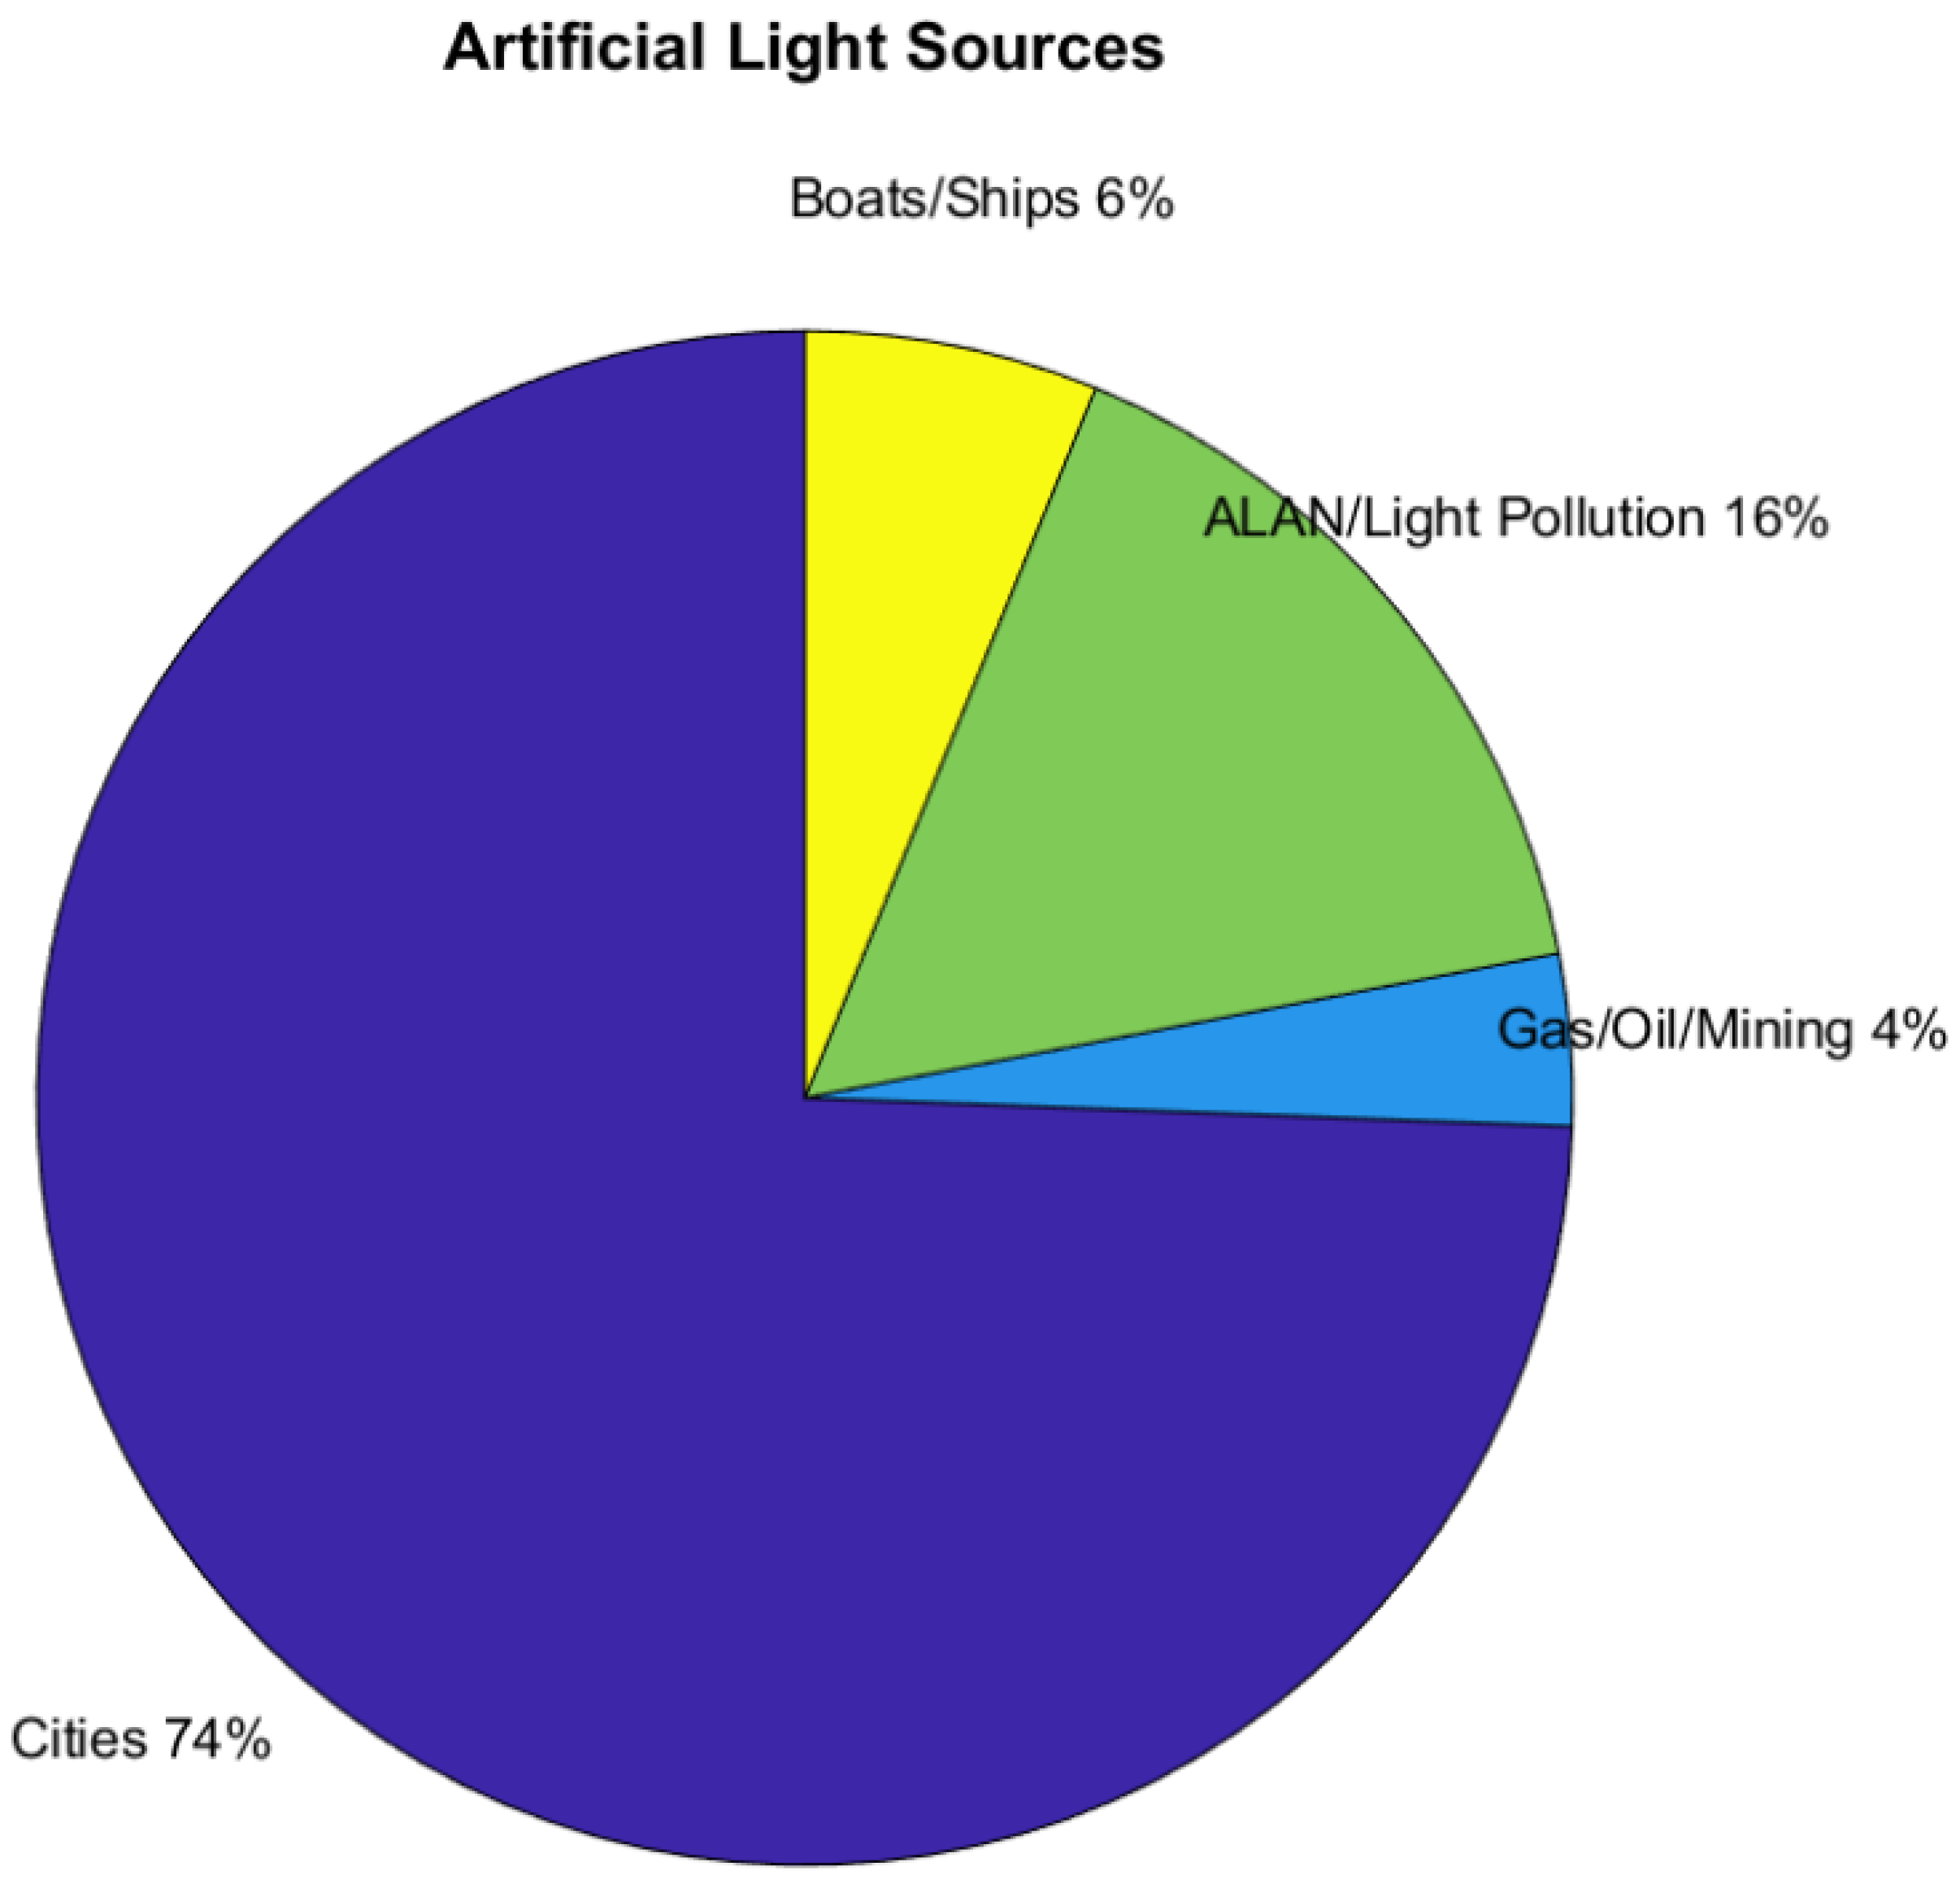
The majority of the 1051 references that use artificial light come from cities and ALAN studies (Figure 18).
4.2. Moonlight
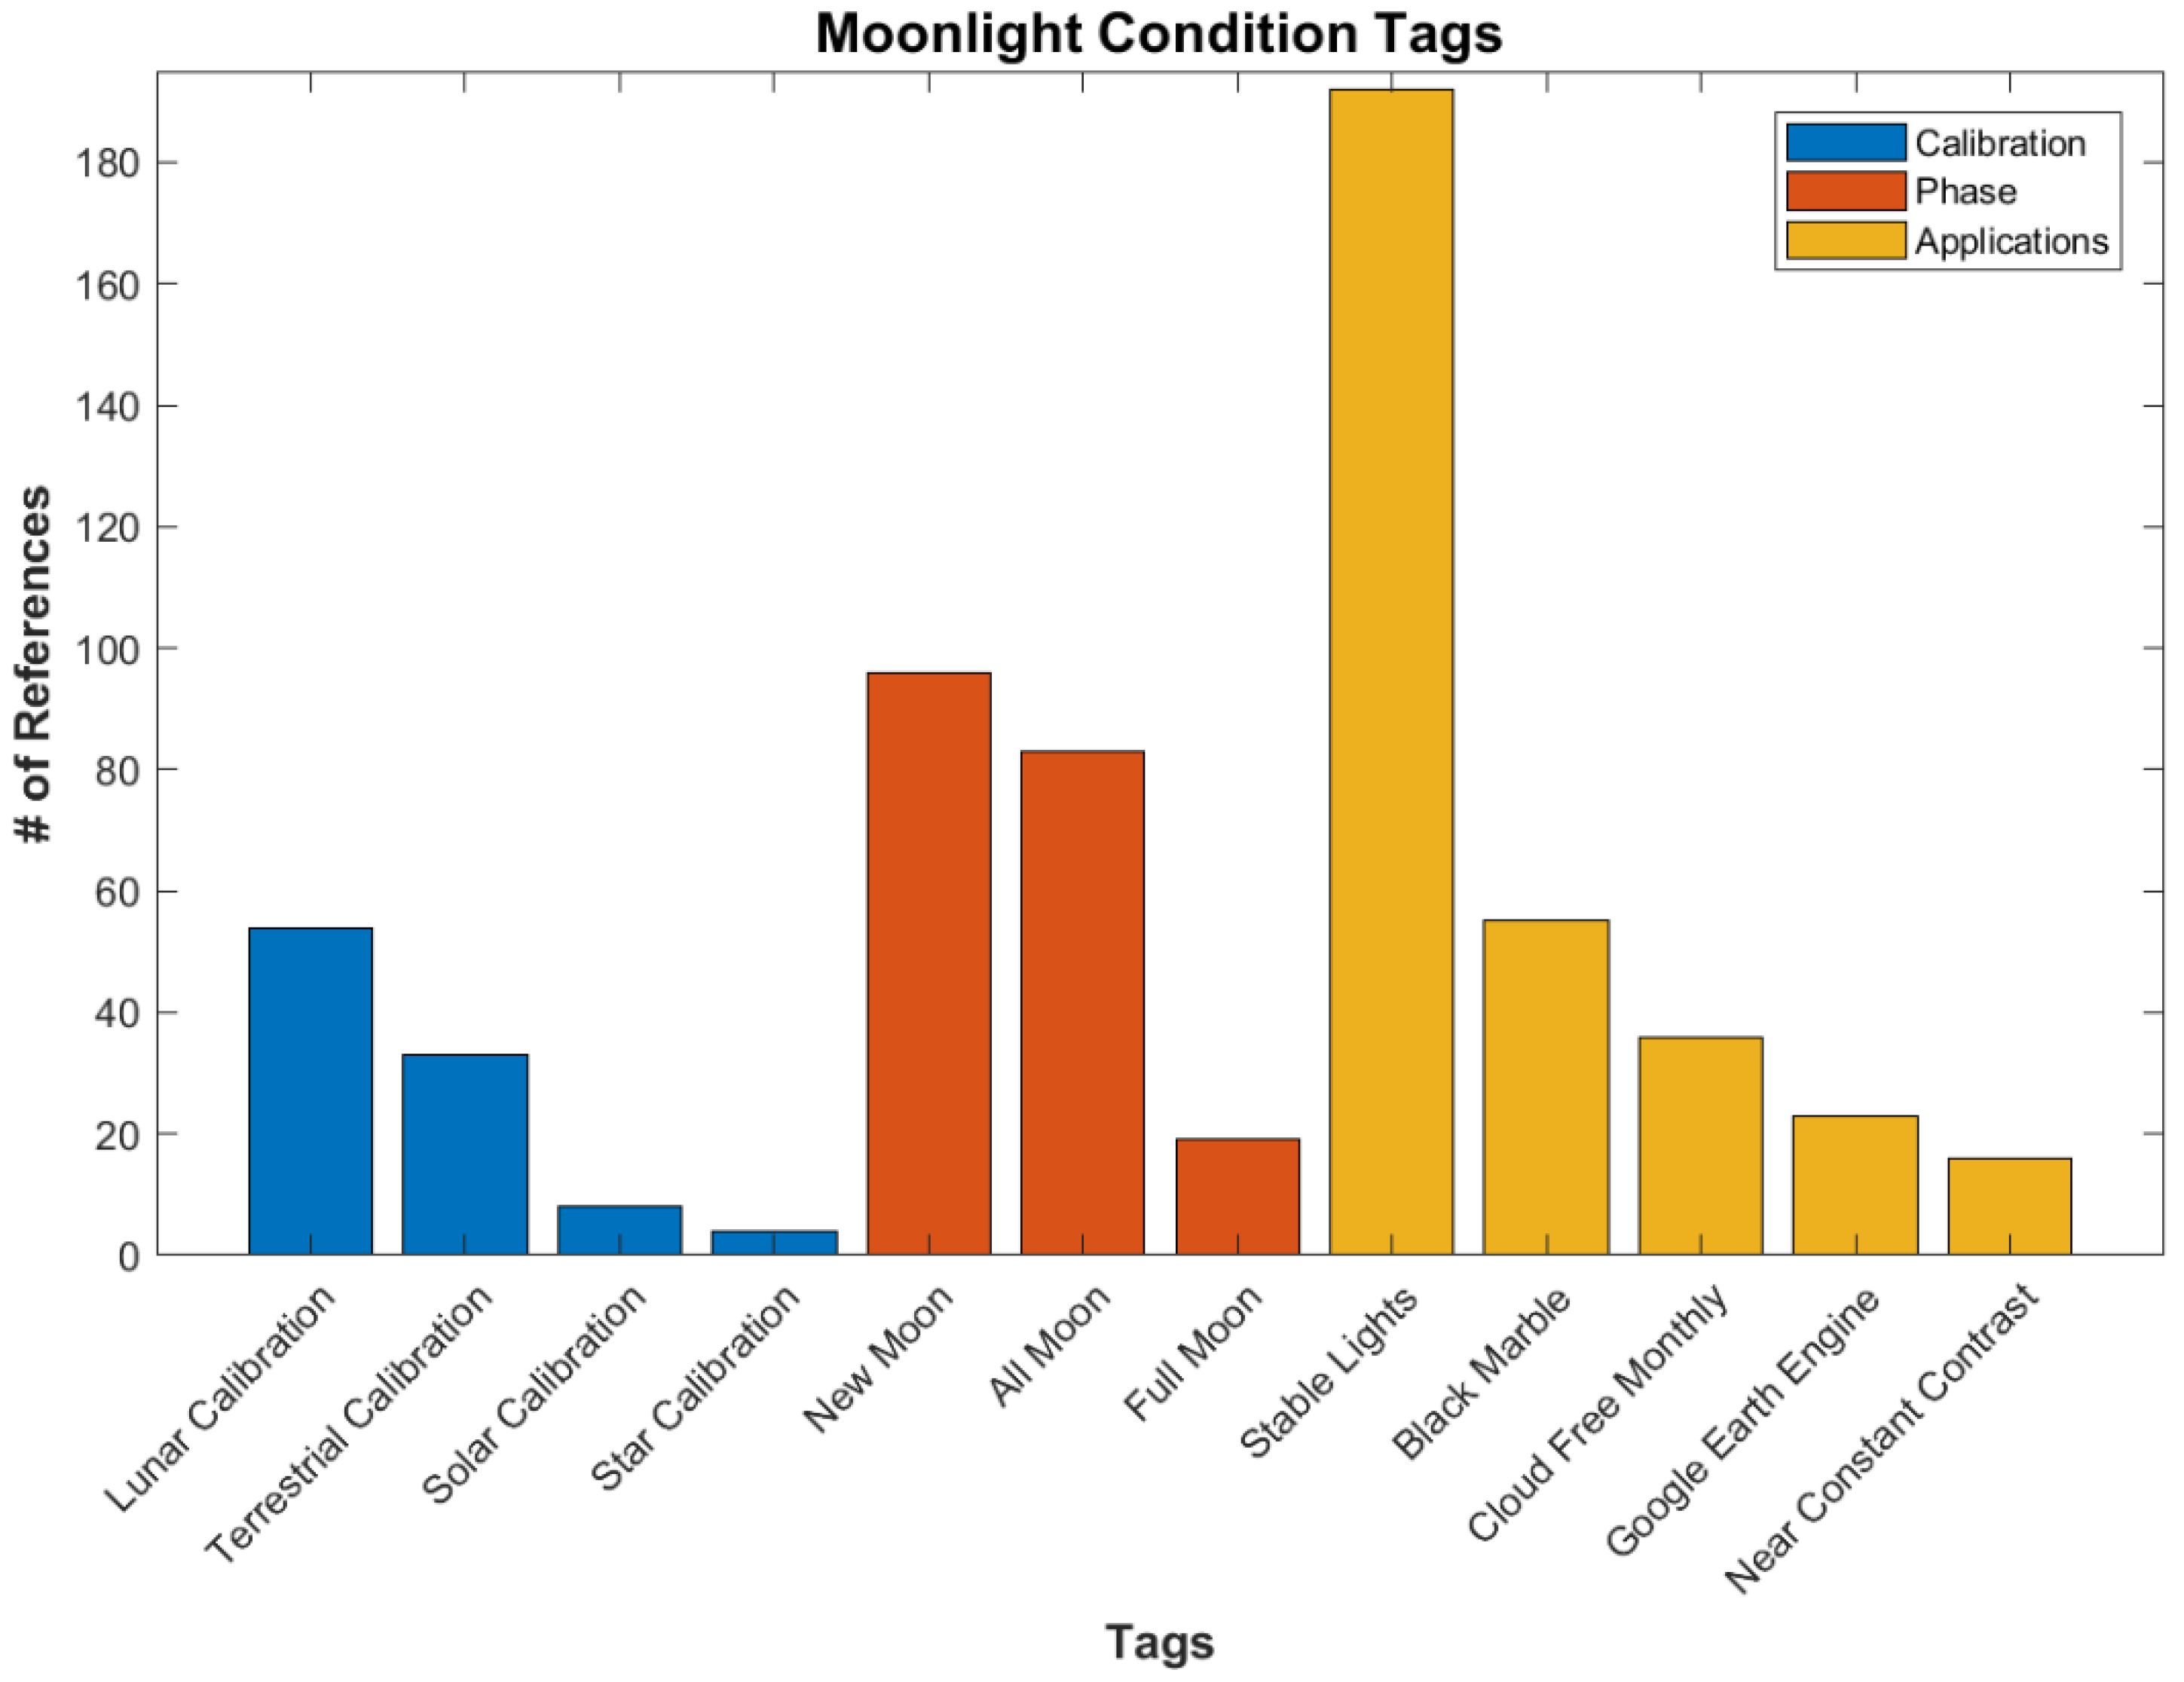
A major factor in the use of the DNB is the lunar phase. Some applications require new moon conditions, allowing for city and other lights on the surface to be easily observable. These include social science applications, ALAN studies, fishing, and bioluminescence. Others, such as cloud or oil slick detection, require moonlight to be present, while some methods can be calibrated to be used under all moon phases. While many references do not specify the phase of moon required, the ones that do are shown in Figure 19.
The Stable Lights product is a DMSP product that uses data at or near the new moon phase in order to identify stable lights from human habitation [8]. These data are often used in social science applications. Black Marble and Cloud Free Composites are similar products using the newer VIIRS data [13,55]. Another VIIRS product, Near Constant Contrast, produces visible wavelength imagery that has a similar appearance from day to night for all phases of the moon [56].
4.3. Earth System Spheres
The Earth system can be considered in terms of coupled “spheres”: the cryosphere, lithosphere, hydrosphere, biosphere, and atmosphere. One way of considering how the scope of DNB applications fits into earth system science is to examine how the current reference data fall into those categories.
The atmosphere pertains to the composition of the troposphere/stratosphere/mesosphere/thermosphere/ionosphere, including its weather. Per Figure 5, atmospheric topics comprise one of our main DNB research pursuits, accounting for 183 references in the database. We anticipate that this proportion will increase over time, as the previous generation DMSP/OLS was not as well-suited to atmospheric science due to its lack of calibration and fewer complementary spectral bands used in most algorithms. With the DNB’s calibration, combined with the availability of lunar irradiance models, its data can be utilized in a way that is analogous to daytime visible bands, opening the door to myriad nocturnal applications previously relegated to daytime-only scenes.
The lithosphere refers to the Earth’s land surfaces. This is not a prominent category in the DNB database, but there are a few relevant tags, namely, surface reflectance/albedo, volcanic lava, soil and mining, oil platforms, and impervious surfaces. Together, these account for 85 references. Similar to the atmospheric category, we anticipate DNB applications in surface characterization to increase via usage for nocturnal cloud masking in land surface temperature algorithms and moisture analyses, as suggested by Miller et al. [1].
The hydrosphere includes all the saline and fresh water components on the Earth’s surface (oceans, seas, rivers, lakes, and ponds), as well as subsurface (aquifers). In the database, most of this sphere is in the category of Ocean and Freshwater. In addition, included in this category are two dredging references under the soil and mining tag, which is under Natural Resources. In total, there are 81 references. The DNB has particular utility at night for resolving flood zones via lunar reflectance. The slight red-shift and wider bandwidth of the DNB response function (0.705 µm band center, ~400 nm wide) compared to conventional daytime visible bands (~0.64 µm, ~10 nm wide) makes the DNB more sensitive to the “red edge” in vegetation, where chlorophyll-a reflectance increases significantly into the near infrared. Conversely, water surfaces are strongly absorptive in the near-infrared, such that the juxtaposition of standing water and vegetation (as might be seen in flood zones) provides a strong reflectance contrast. The daytime analog to this behavior can be observed in the 0.865 µm band which is positioned in the red-edge for the purpose of analyzing vegetation health.
The cryosphere is a particularly important category for low-light sensors, given that these sensors have traditionally been carried by polar-orbiting satellites which provide good spatial and temporal coverage to high latitudes (owing to the significant imagery swath overlap). Importantly, the low-light measurement provides unique visible information to these high latitudes during the polar winter. Through the use of lunar reflectance, these sensors can detect sea ice and its motion, even in the presence of overriding clouds [1], provide additional targets for atmospheric motion vectors, and delineate snow-covered and snow-free land surfaces. In addition, these measurements can detect aurora and use auroral light as a kind of illumination source. Although the current database contained only 20 ice/snow tagged entries, for the reasons stated above, we anticipate this category to see particularly strong growth over the next decade.
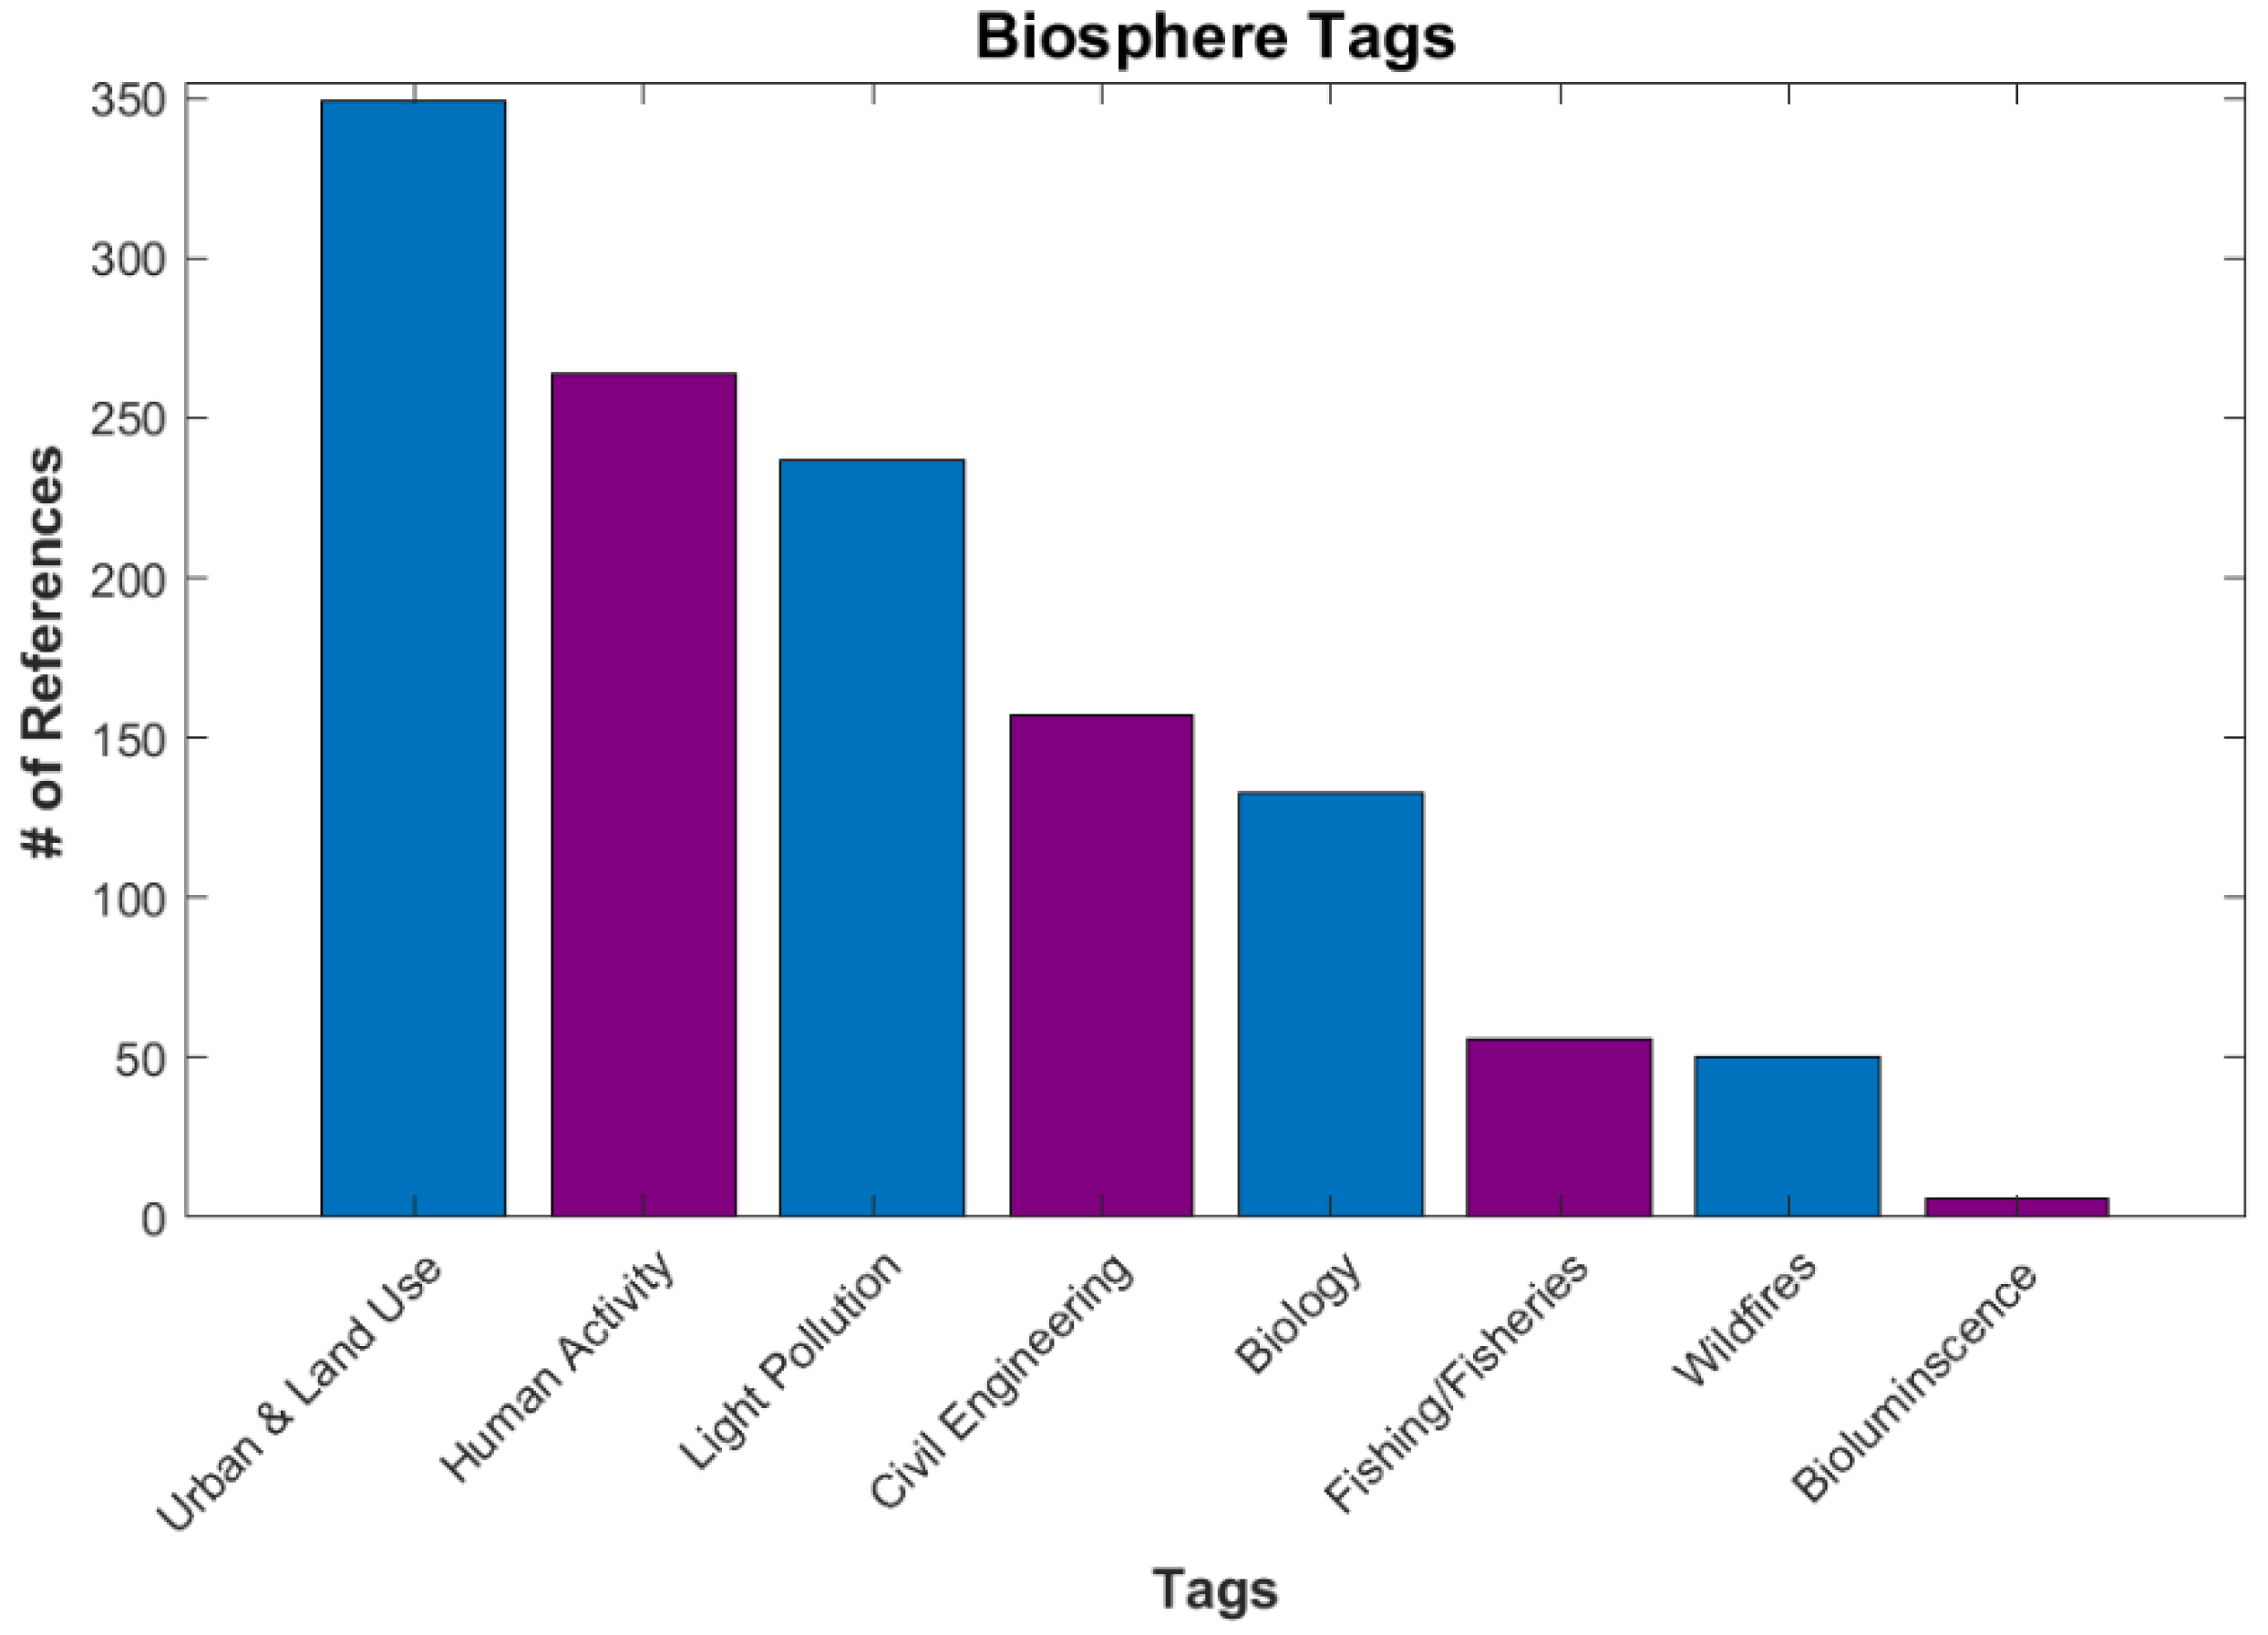
The last category considered is the Biosphere, which comprises all living things of the sea and the land, including humans. This is the largest category for the DNB database, with 1048 references, due to the extensive use of artificial lights to gain information on human activity and behaviors in a way that no other measurement from space can. All references in Urban and Land Use, Human Activity, Civil Engineering and Structure, and Biology are found in this sphere. There may be nascent applications for vegetation at night, based on the chlorophyll-sensitivity of the DNB response function, as mentioned above. The DNB has been used in conjunction with MODIS NDVI data to study urban extent and changes on vegetation cover [57,58,59]. Figure 20 shows the current breakdown of references for the Biosphere category.
5. Discussion
5.1. The Evolution of Low-Light Science
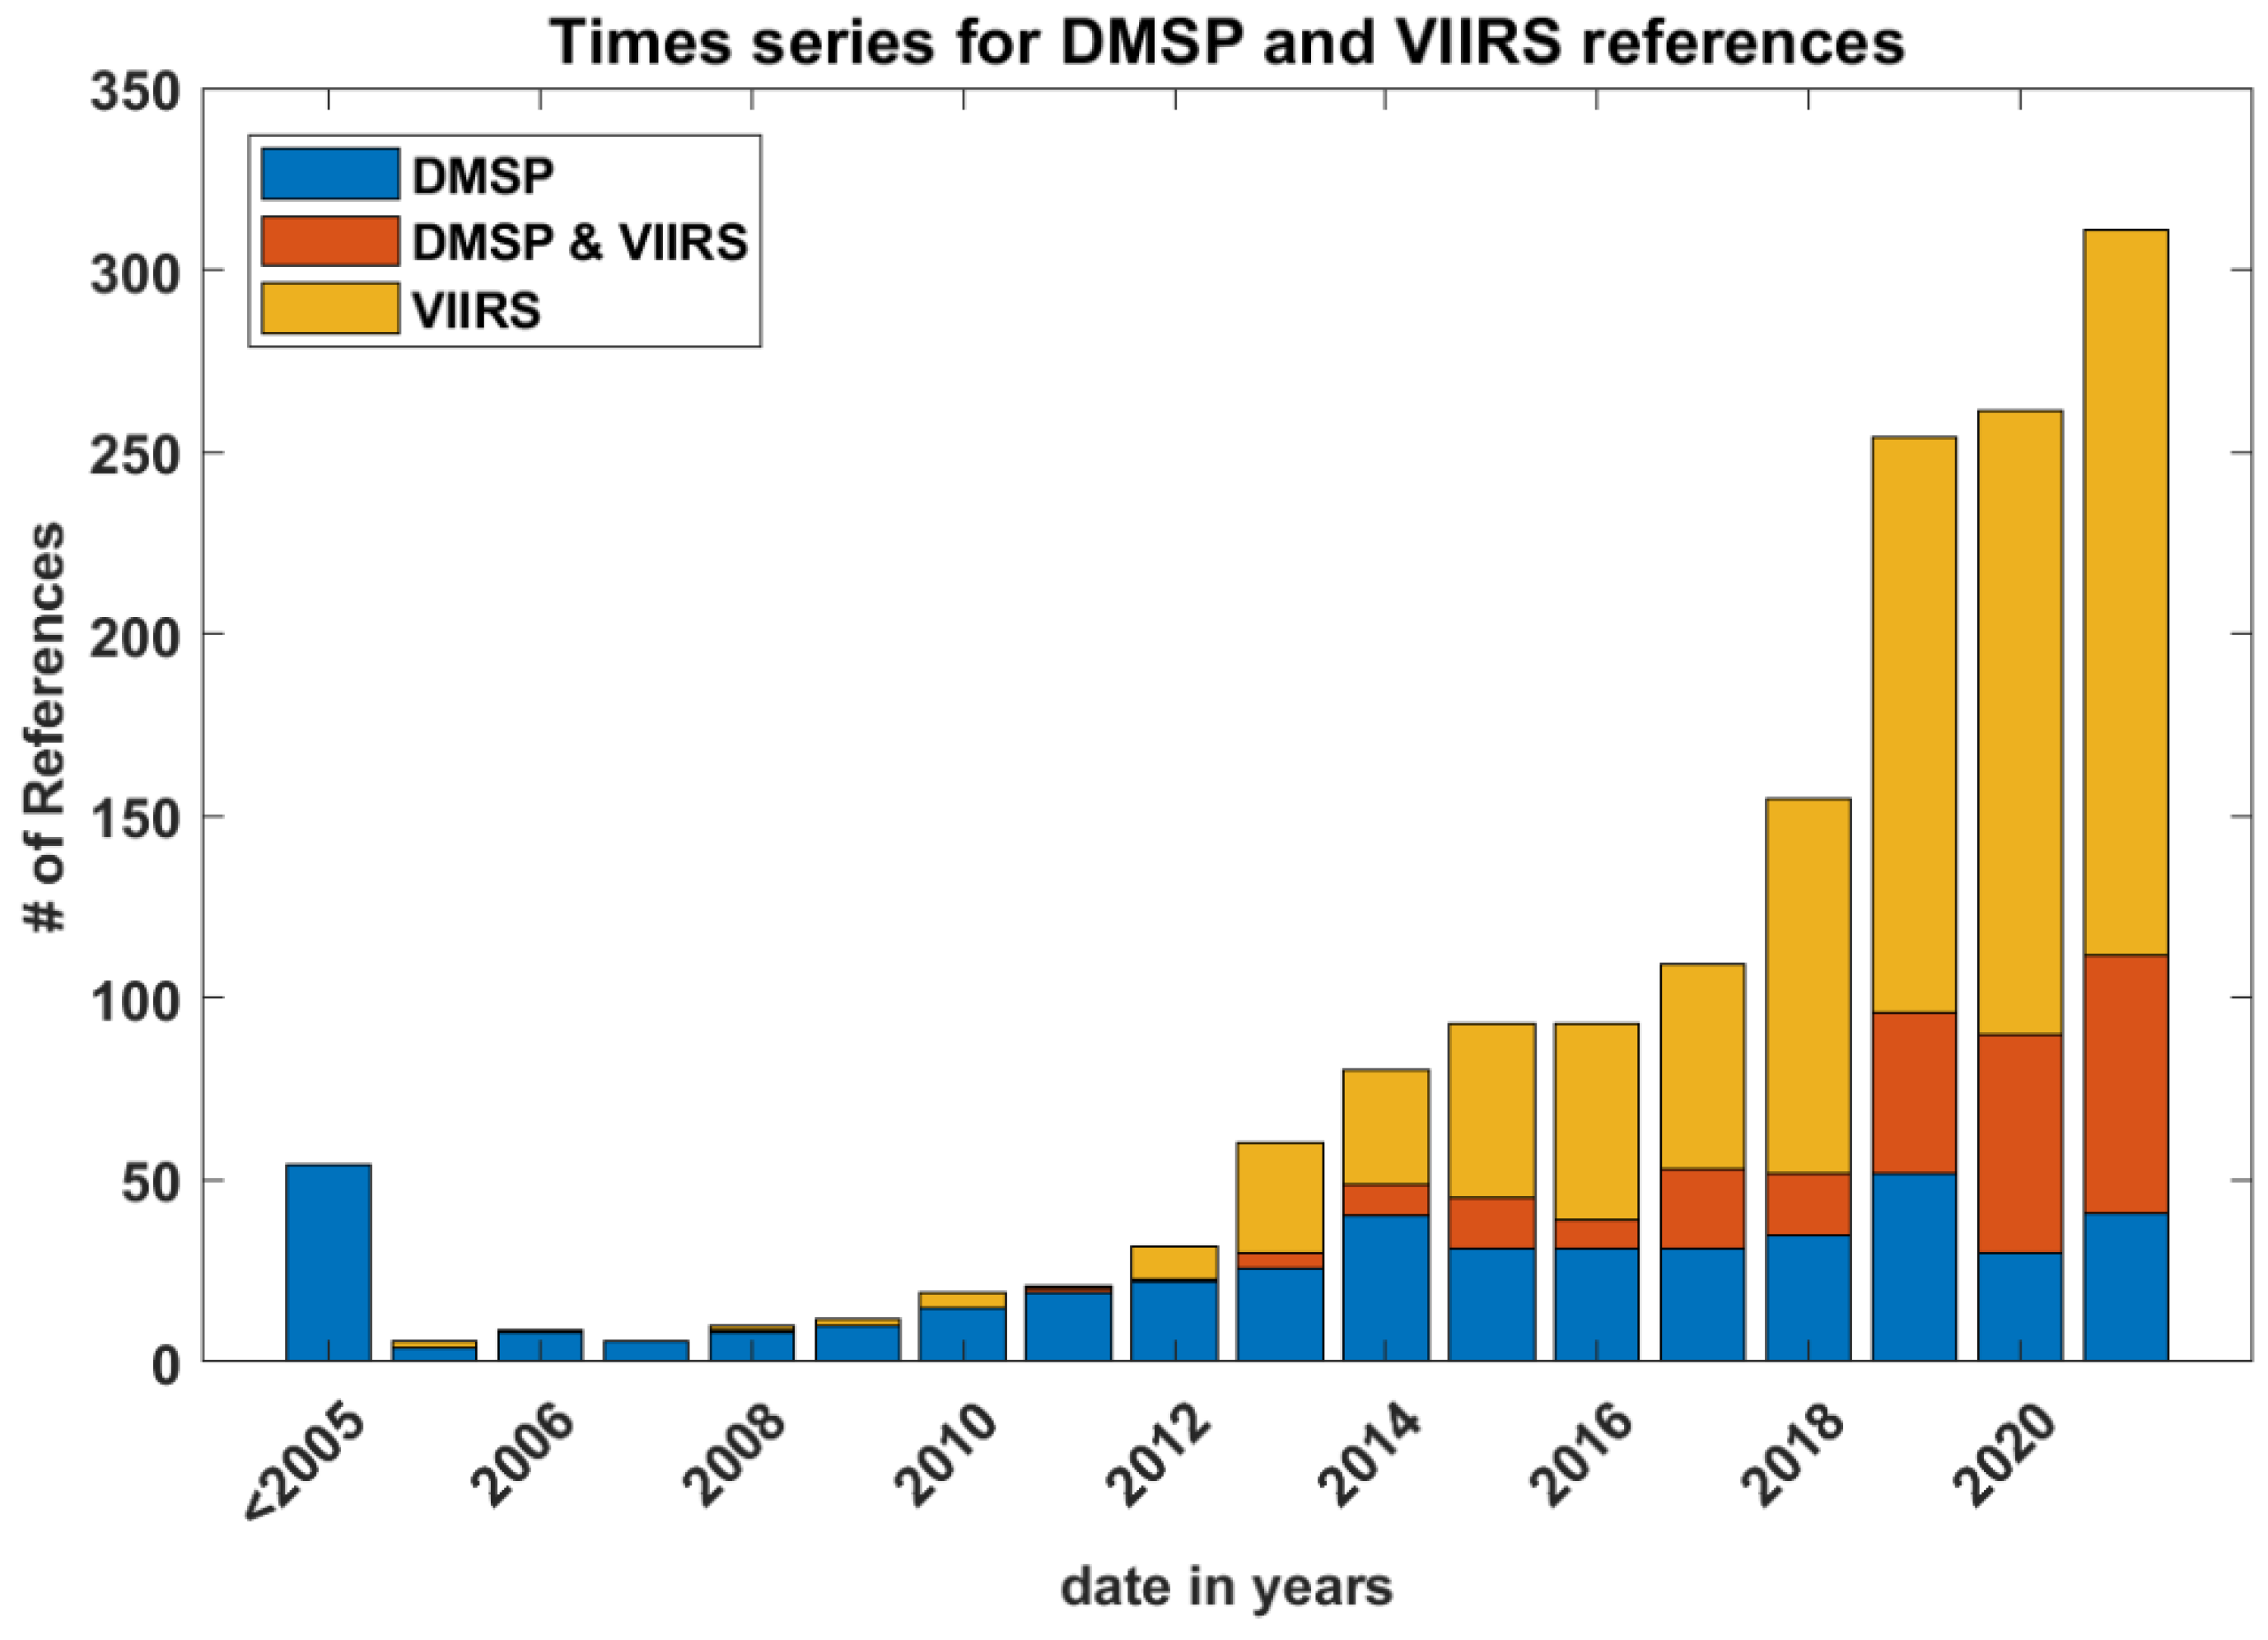
As more time passes since the gradual decommissioning of the DMSP series (the last members of the constellation have a planned end of life sometime between 2023 and 2026) and with the advent of the JPSS series (beginning with Suomi NPP, NOAA-20, and the recent launch of JPSS-2), it was expected that studies using VIIRS data would rise and those using OLS data would naturally decline. Figure 21 shows how the number of VIIRS references has indeed steadily increased, passing DMSP references in 2015, and exploding in the last four years. However, Figure 21 also indicates a slight increase in DMSP references. This increase may correspond to an increased interest in light pollution and the myriad applications of ALAN, stimulated by new attention that the DNB has drawn to the field. Here, DMSP provides a longer-term record which, with improved calibration transfer techniques leveraging the DNB during the period of DMSP/JPSS program overlap, may revitalize the use of the OLS for various studies of human activity and growth over time.
To wit, there is also a growing number of references using both OLS and VIIRS in tandem. While some of these studies involve basic comparisons between the two, several papers connect the two data sets into a lengthy time series, useful for showing changes in urban size, structure, and land use. All indications are that this increased use of low-light visible data will continue. Even during the first year of the COVID-19 pandemic (2020), there was a marked increase in VIIRS and DMSP + VIIRS references. Some of these studies involved the use of low-light visible measurements in assessing human behavioral changes during COVID-19 lockdowns.
5.2. Possible Future Improvements to Low-Light Visible Observations
As the interest in low-light visible data appears to be increasing, the next question is how we can further improve these novel observations. In the atmospheric and earth science communities, increased temporal and spatial resolution would be helpful, as well as exploring new research in other areas such as flood monitoring, sea ice detection, and improved diurnal cloud climatologies. Social sciences and light pollution studies would benefit greatly from higher spatial and temporal resolution, particularly at the different time periods when humans are active.
A challenge of contemporary low-light sensors is that newer LED technology emit significant light in the blue portion of the visible spectrum, mostly missed by the spectral response functions of VIIRS, DMSP, and Luojia 1-01 [8,60,61]. The lack of detection can cause misleading inferences of light pollution trends. These are issues that can be addressed with future satellite-based low-light sensors.
The smaller, less expensive systems of the SmallSat/CubeSat era may provide cost-effective opportunities to explore the various iterations on low-light visible technology. In recent years, The Aerospace Corporation has fielded promising new sensors in this regard, such as CUMULOS on board the NASA/JPL-managed ISARA CubeSat mission [8], which featured a simple VIR/NIR camera system that compared favorably to the DNB. Low-light is not confined to visible wavelengths either; the near-infrared airglow camera (NIRAC) and the follow-on phenomenology imager and nighttime observer (PIANO) sensors, both flown on the International Space Station, are small instrument technologies that have demonstrated the capability to detect airglow and atmospheric gravity waves within airglow modulations. These and other small format sensors, including possible future multispectral systems, stand to change the game in low-light sensing.
5.3. Toward a Geostationary-Based Low-Light Visible Measurement
Given the success of low-light visible observations on the low-earth-orbiting satellite platform thus far, both in terms of augmenting the current day-only parameters and enabling entirely new forms of information, a natural question arises as to the potential for such measurements on a geostationary satellite. The key advantages of such an observing system would be the high temporal resolution, providing the ability to study the dynamics of natural and artificial night light sources as well as the nocturnal arm of the diurnal cycle (especially for certain parameters that require a visible measurement to characterize).
Whereas a constellation of low-earth-orbiting satellites could, in principle, begin to fill in the temporal gaps, an aspect of geostationary measurements that is particularly important to low-light visible observations is the constant viewing geometry. ALAN has been shown to exhibit strong sensitivity to viewing geometry, due to factors such as structural/foliage blockages, light shielding, and the bidirectional reflectance properties of the surrounding unilluminated surfaces. Furthermore, slight mismatches in the pixel grid of individual satellites will impart variability tied to the inherent spatial heterogeneity of ALAN.
The main challenge to achieving a geostationary-based low-light visible capability resides in minimizing the contributions of stray light and then mitigating any residual contributions. Stray light is any source of light in the DNB bandpass reaching the DNB detectors that does not originate from the imaged scene but comes instead from external sources. Some of these sources are described briefly here.
The first form of stray light involves the scatter of direct beam sunlight into the sensor optics due to reflections off parts of the telescope. When viewing the nighttime Earth from a geostationary orbit, the Sun is, by definition, somewhere in the forward-facing hemisphere of the sensor. Only during the periods surrounding the fall and spring equinoxes will the satellite pass through Earth’s shadow for a brief time. Otherwise, direct sunlight will illuminate the Earth-viewing side of the satellite. In most cases, the solar disk will not be in the field of regard of the sensor, as defined by the telescope aperture/baffling, but scattering off the internal walls of an imperfectly absorbing surface may still result in this form of stray light entering the optical assembly. Careful design of the baffling to minimize such effects is thus necessary.
A second form of stray light involves “sneak paths” of sunlight scattering into the satellite optics from unanticipated angles. These sources include scatter-off parts of the spacecraft itself or via entry through interfaces that have not been properly shielded. Once more, careful design to position the sensor with a clear forward-facing hemisphere, conducting a fully assembled/integrated system light test with the telescope aperture closed, is strongly advised. Here, some design lessons can be learned from the experience of the DNB, which improved its handling of the sneak-path stray light observed on Suomi when implementing the DNB on JPSS-1.
A third and very important form of stray light involves contributions of diffusely scattered light off the Earth’s surface and atmospheric limb while the sensor is imaging a nighttime full disk scene (apart from local midnight at the sub-satellite point near the equinoxes), which will contain some portion of illuminated surface. Consider also the summer or winter solstices at local midnight to the sub-satellite point; Earth’s polar summer hemisphere is in full daylight, often with highly scattering clouds and snow/ice surfaces. The magnitude of the stray light will be scene-dependent and decrease away from the terminator. Here, a sensor design that involves a smaller field of regard that can be moved away from the terminator is one possible approach to mitigate the issue.
Ultimately, even with the best laid plans and hardware fabrication, it is likely that some amount of stray light contamination would remain in any geostationary-based low-light visible measurement. Residual artifacts would then need to be mitigated in the post-processing of the digital data. Experience with the DNB has shown that the careful characterization of stray light and detector-striping patterns allow for the design of effective ad hoc correction algorithms, resulting in useful, high-quality imagery [62,63,64]. We encourage the community to consider the substantial benefits of a time-resolved, constant line-of-sight observing system of Earth as motivation to face these design challenges boldly, with caution, creativity, and our eyes wide-open.
6. Conclusions
Research using low-light nighttime visible data, and the DNB in particular, over the decade of the Suomi NPP and JPSS program, continues to grow and covers a large variety of fields. Interestingly, the group boasting the largest usage to date is the social sciences rather than the atmospheric sciences community. This is despite the intended purpose of the DNB for meteorological imagery and the “Key Performance Parameter” of the DNB being focused on assisting the National Weather Service (NWS) forecasters, particularly in high latitudes.
The number of publications using DNB data also continues to grow non-linearly each year compared to the legacy of OLS. Our database reflects a growing interest in the science of light. DNB data are an important resource for those who try to understand and quantify our natural world and the people who live in a connected way within it.
Author Contributions
Conceptualization, C.L.C. and S.D.M.; methodology, validation, formal analysis C.L.C.; writing –original draft preparation, review and editing C.L.C. and S.D.M.; supervision and project administration, S.D.M.; funding acquisition, S.D.M. All authors have read and agreed to the published version of the manuscript.
Funding
This research was funded by the National Oceanic and Atmospheric Administration (NOAA)/National Environmental Satellite, Data, and Information Service (NESDIS) under grant numbers NA19OAR4320073 and NA14OAR4320125.
Data Availability Statement
The database used for this study can be viewed on “https://www.zotero.org/ (accessed on 16 January 2023)” under the DNB literature collection.
Acknowledgments
We would like to acknowledge Renate Brummer and William Line for their editorial assistance with the manuscript.
Conflicts of Interest
The authors declare no conflict of interest.
References
- Miller, S.; Straka, W.; Mills, S.; Elvidge, C.; Lee, T.; Solbrig, J.; Walther, A.; Heidinger, A.; Weiss, S. Illuminating the Capabilities of the Suomi National Polar-Orbiting Partnership (NPP) Visible Infrared Imaging Radiometer Suite (VIIRS) Day/Night Band. Remote Sens. 2013, 5, 6717–6766. [Google Scholar] [CrossRef] [Green Version]
- Bennett, M.M.; Smith, L.C. Advances in Using Multitemporal Night-Time Lights Satellite Imagery to Detect, Estimate, and Monitor Socioeconomic Dynamics. Remote Sens. Environ. 2017, 192, 176–197. [Google Scholar] [CrossRef]
- Cho, Y.; Ryu, S.-H.; Lee, B.R.; Kim, K.H.; Lee, E.; Choi, J. Effects of Artificial Light at Night on Human Health: A Literature Review of Observational and Experimental Studies Applied to Exposure Assessment. Chronobiol. Int. 2015, 32, 1294–1310. [Google Scholar] [CrossRef] [PubMed]
- Witmer, F.D.W. Remote Sensing of Violent Conflict: Eyes from Above. Int. J. Remote Sens. 2015, 36, 2326–2352. [Google Scholar] [CrossRef]
- Hu, K.; Qi, K.; Guan, Q.; Wu, C.; Yu, J.; Qing, Y.; Zheng, J.; Wu, H.; Li, X. A Scientometric Visualization Analysis for Night-Time Light Remote Sensing Research from 1991 to 2016. Remote Sens. 2017, 9, 802. [Google Scholar] [CrossRef] [Green Version]
- Luo, Y. Knowledge Map Analysis on the Application of Nighttime Light Data in Chinese Academic Research. Int. J. Sci. 2020, 7, 18. [Google Scholar]
- Levin, N.; Kyba, C.C.M.; Zhang, Q.; de Miguel, A.S.; Román, M.O.; Li, X.; Portnov, B.A.; Molthan, A.L.; Jechow, A.; Miller, S.D.; et al. Remote Sensing of Night Lights: A Review and an Outlook for the Future. Remote Sens. Environ. 2020, 237, 111443. [Google Scholar] [CrossRef]
- Pack, D.W.; Coffman, C.M.; Santiago, J.R. A Year in Space for the CUbesat MULtispectral Observing System: CUMULOS. In Proceedings of the Small Satellite Conference, Logan, UT, USA, 8 August 2019; p. 19. [Google Scholar]
- Jiang, W.; He, G.; Long, T.; Guo, H.; Yin, R.; Leng, W.; Liu, H.; Wang, G. Potentiality of Using Luojia 1-01 Nighttime Light Imagery to Investigate Artificial Light Pollution. Sensors 2018, 18, 2900. [Google Scholar] [CrossRef] [Green Version]
- Wei, S.; Jiao, W.; Long, T.; Liu, H.; Bi, L.; Jiang, W.; Portnov, B.A.; Liu, M. A Relative Radiation Normalization Method of ISS Nighttime Light Images Based on Pseudo Invariant Features. Remote Sens. 2020, 12, 3349. [Google Scholar] [CrossRef]
- Elvidge, C.D.; Baugh, K.E.; Kihn, E.A.; Kroehl, H.W.; Davis, E.R. Mapping City Lights with Nighttime Data from the DMSP Operational Linescan System. Photogram. Eng. Remote Sens. 1997, 63, 727–734. [Google Scholar]
- Elvidge, C.D.; Zhizhin, M.; Ghosh, T.; Hsu, F.-C.; Taneja, J. Annual Time Series of Global VIIRS Nighttime Lights Derived from Monthly Averages: 2012 to 2019. Remote Sens. 2021, 13, 922. [Google Scholar] [CrossRef]
- Román, M.O.; Wang, Z.; Sun, Q.; Kalb, V.; Miller, S.D.; Molthan, A.; Schultz, L.; Bell, J.; Stokes, E.C.; Pandey, B.; et al. NASA’s Black Marble Nighttime Lights Product Suite. Remote Sens. Environ. 2018, 210, 113–143. [Google Scholar] [CrossRef]
- Chen, H.; Sun, C.; Xiong, X.; Sarid, G.; Sun, J. SNPP VIIRS Day Night Band: Ten Years of On-Orbit Calibration and Performance. Remote Sens. 2021, 13, 4179. [Google Scholar] [CrossRef]
- Dong, K.; Li, X.; Cao, H.; Tong, Z. Intercalibration Between Night-Time DMSP/OLS Radiance Calibrated Images and NPP/VIIRS Images Using Stable Pixels. IEEE J. Sel. Top. Appl. Earth Obs. Remote Sens. 2021, 14, 8838–8848. [Google Scholar] [CrossRef]
- Xiong, X.; Butler, J.J. MODIS and VIIRS Calibration History and Future Outlook. Remote Sens. 2020, 12, 2523. [Google Scholar] [CrossRef]
- Elvidge, C.D.; Baugh, K.E.; Zhizhin, M.; Hsu, F.-C. Why VIIRS Data Are Superior to DMSP for Mapping Nighttime Lights. APAN Proc. 2013, 35, 62. [Google Scholar] [CrossRef] [Green Version]
- Gibson, J.; Olivia, S.; Boe-Gibson, G.; Li, C. Which Night Lights Data Should We Use in Economics, and Where? J. Dev. Econ. 2021, 149, 102602. [Google Scholar] [CrossRef]
- Chen, L.; Zhang, P.; Lv, J.; Xu, N.; Hu, X. Radiometric Calibration Evaluation for RSBs of Suomi-NPP/VIIRS and Aqua/MODIS Based on the 2015 Dunhuang Chinese Radiometric Calibration Site in Situ Measurements. Int. J. Remote Sens. 2017, 38, 5640–5656. [Google Scholar] [CrossRef] [Green Version]
- Zhai, W.; Han, B.; Cheng, C. Evaluation of Luojia 1-01 Nighttime Light Imagery for Built-Up Urban Area Extraction: A Case Study of 16 Cities in China. IEEE Geosci. Remote Sens. Lett. 2019, 7, 1802–1806. [Google Scholar] [CrossRef]
- Chen, H.; Xiong, X.; Geng, X.; Twedt, K. Stray-Light Correction and Prediction for Suomi National Polar-Orbiting Partnership Visible Infrared Imaging Radiometer Suite Day-Night Band. J. Appl. Remote Sens. 2019, 13, 1. [Google Scholar] [CrossRef]
- Qiu, S.; Shao, X.; Cao, C.Y.; Uprety, S.; Wang, W.H. Assessment of Straylight Correction Performance for the VIIRS Day/Night Band Using Dome-C and Greenland under Lunar Illumination. Int. J. Remote Sens. 2017, 38, 5880–5898. [Google Scholar] [CrossRef]
- Cao, H.; Li, X.; Tong, Z. Impact of Image Saturation on Radiometric Intercalibration of DMSP/OLS Nighttime Light Images. IEEE J. Sel. Top. Appl. Earth Obs. Remote Sens. 2021, 14, 7948–7960. [Google Scholar] [CrossRef]
- Hu, Y.; Chen, J.; Cao, X.; Chen, X.; Cui, X.; Gan, L. Correcting the Saturation Effect in DMSP/OLS Stable Nighttime Light Products Based on Radiance-Calibrated Data. IEEE Trans. Geosci. Remote Sens. 2022, 60, 1–11. [Google Scholar] [CrossRef]
- Gorelick, N.; Hancher, M.; Dixon, M.; Ilyushchenko, S.; Thau, D.; Moore, R. Google Earth Engine: Planetary-Scale Geospatial Analysis for Everyone. Remote Sens. Environ. 2017, 202, 18–27. [Google Scholar] [CrossRef]
- Ch, R.; Martin, D.A.; Vargas, J.F. Measuring the Size and Growth of Cities Using Nighttime Light. J. Urban Econ. 2021, 125, 103254. [Google Scholar] [CrossRef] [Green Version]
- Li, C.; Wang, X.; Wu, Z.; Dai, Z.; Yin, J.; Zhang, C. An Improved Method for Urban Built-Up Area Extraction Supported by Multi-Source Data. Sustainability 2021, 13, 5042. [Google Scholar] [CrossRef]
- Elvidge, C.D.; Baugh, K.E.; Kihn, E.A.; Kroehl, H.W.; Davis, E.R.; Davis, C.W. Relation between Satellite Observed Visible-near Infrared Emissions, Population, Economic Activity and Electric Power Consumption. Int. J. Remote Sens. 1997, 18, 1373–1379. [Google Scholar] [CrossRef]
- Aslan, N.; Koc-San, D. Spatiotemporal land use change analysis and future urban growth simulation using remote sensing: A case study of antalya. Int. Arch. Photogramm. Remote Sens. Spatial Inf. Sci. 2020, XLIII-B3-2020, 657–662. [Google Scholar] [CrossRef]
- Tan, M. Urban Growth and Rural Transition in China Based on DMSP/OLS Nighttime Light Data. Sustainability 2015, 7, 8768–8781. [Google Scholar] [CrossRef] [Green Version]
- Román, M.O.; Stokes, E.C. Holidays in Lights: Tracking Cultural Patterns in Demand for Energy Services: Tracking cultural patterns in demand for energy services. Earth’s Future 2015, 3, 182–205. [Google Scholar] [CrossRef]
- Addison, D.; Stewart, B. Nighttime Lights Revisited: The Use of Nighttime Lights Data as a Proxy for Economic Variables; The World Bank Group: Washington, DC, USA, 2015; p. 30. Available online: https://ssrn.com/abstract=2691791 (accessed on 16 January 2023).
- Pan, G.; Xu, Y.; Ma, J. The Potential of CO2 Satellite Monitoring for Climate Governance: A Review. J. Environ. Manag. 2021, 277, 111423. [Google Scholar] [CrossRef] [PubMed]
- Yue, J.; Perwitasari, S.; Xu, S.; Hozumi, Y.; Nakamura, T.; Sakanoi, T.; Saito, A.; Miller, S.D.; Straka, W.; Rong, P. Preliminary Dual-Satellite Observations of Atmospheric Gravity Waves in Airglow. Atmosphere 2019, 10, 650. [Google Scholar] [CrossRef]
- Zhang, J.; Miller, S.D.; Reid, J.S.; Hyer, E.J.; McHardy, T.M. From OLS to VIIRS, an Overview of Nighttime Satellite Aerosol Retrievals Using Artificial Light Sources. In Proceedings of the 2015 AGU Fall Meeting, San Francisco, CA, USA, 14–18 December 2015. [Google Scholar]
- Hawkins, J.D.; Solbrig, J.E.; Miller, S.D.; Surratt, M.; Lee, T.F.; Bankert, R.L.; Richardson, K. Tropical Cyclone Characterization via Nocturnal Low-Light Visible Illumination. Bull. Am. Meteorol. Soc. 2017, 98, 2351–2365. [Google Scholar] [CrossRef] [Green Version]
- Bertinelli, L.; Strobl, E. Quantifying the Local Economic Growth Impact of Hurricane Strikes: An Analysis from Outer Space for the Caribbean. J. Appl. Meteorol. Climatol. 2013, 52, 1688–1697. [Google Scholar] [CrossRef]
- Paranunzio, R.; Ceola, S.; Laio, F.; Montanari, A. Evaluating the Effects of Urbanization Evolution on Air Temperature Trends Using Nightlight Satellite Data. Atmosphere 2019, 10, 117. [Google Scholar] [CrossRef] [Green Version]
- Wang, Z.; Román, M.O.; Sun, Q.; Molthan, A.L.; Schultz, L.A.; Kalb, V.L. Monitoring disaster-related power outages using NASA black marble nighttime light product. Int. Arch. Photogramm. Remote Sens. Spatial Inf. Sci. 2018, XLII–3, 1853–1856. [Google Scholar] [CrossRef] [Green Version]
- Elvidge, C.D.; Milesi, C.; Dietz, J.B.; Tuttle, B.T.; Sutton, P.C.; Nemani, R.; Vogelmann, J.E. U.S. Constructed Area Approaches the Size of Ohio. Eos Trans. AGU 2004, 85, 233. [Google Scholar] [CrossRef] [Green Version]
- Gaston, K.J.; Ackermann, S.; Bennie, J.; Cox, D.T.C.; Phillips, B.B.; de Miguel, A.S.; Sanders, D. Pervasiveness of Biological Impacts of Artificial Light at Night. Integr. Comp. Biol. 2021, 61, 1098–1110. [Google Scholar] [CrossRef]
- Hyde, E.; Frank, S.; Barentine, J.C.; Kuechly, H.; Kyba, C.C.M. Testing for Changes in Light Emissions from Certified International Dark Sky Places. Int. J. Sustain. Light. 2019, 21, 11–19. [Google Scholar] [CrossRef]
- Beatty, T.G. The Detectability of Nightside City Lights on Exoplanets. Mon. Not. R. Astron. Soc. 2022, 513, 2652–2662. [Google Scholar] [CrossRef]
- Kamrowski, R.L.; Limpus, C.; Jones, R.; Anderson, S.; Hamann, M. Temporal Changes in Artificial Light Exposure of Marine Turtle Nesting Areas. Glob. Chang. Biol. 2014, 20, 2437–2449. [Google Scholar] [CrossRef] [PubMed]
- Cabrera-Cruz, S.A.; Smolinsky, J.A.; Buler, J.J. Light Pollution Is Greatest within Migration Passage Areas for Nocturnally-Migrating Birds around the World. Sci. Rep. 2018, 8, 3261. [Google Scholar] [CrossRef] [PubMed]
- Pauwels, J.; Le Viol, I.; Azam, C.; Valet, N.; Julien, J.-F.; Bas, Y.; Lemarchand, C.; de Miguel, A.S.; Kerbiriou, C. Accounting for Artificial Light Impact on Bat Activity for a Biodiversity-Friendly Urban Planning. Landsc. Urban Plan. 2019, 183, 12–25. [Google Scholar] [CrossRef]
- Rybnikova, N.A.; Haim, A.; Portnov, B.A. Artificial Light at Night (ALAN) and Breast Cancer Incidence Worldwide: A Revisit of Earlier Findings with Analysis of Current Trends. Chronobiol. Int. 2015, 32, 757–773. [Google Scholar] [CrossRef]
- Bustamante-Calabria, M.; de Miguel, A.S.; Martín-Ruiz, S.; Ortiz, J.-L.; Vílchez, J.M.; Pelegrina, A.; García, A.; Zamorano, J.; Bennie, J.; Gaston, K.J. Effects of the COVID-19 Lockdown on Urban Light Emissions: Ground and Satellite Comparison. Remote Sens. 2021, 13, 258. [Google Scholar] [CrossRef]
- Elvidge, C.; Zhizhin, M.; Baugh, K.; Hsu, F.-C. Automatic Boat Identification System for VIIRS Low Light Imaging Data. Remote Sens. 2015, 7, 3020–3036. [Google Scholar] [CrossRef] [Green Version]
- Lebona, B.; Kleynhans, W.; Celik, T.; Mdakane, L. Ship Detection Using VIIRS Sensor Specific Data. In Proceedings of the 2016 IEEE International Geoscience and Remote Sensing Symposium (IGARSS), Beijing, China, 10–15 July 2016; pp. 1245–1247. [Google Scholar]
- Miller, S.D.; Haddock, S.H.D.; Straka, W.C.; Seaman, C.J.; Combs, C.L.; Wang, M.; Shi, W.; Nam, S. Honing in on Bioluminescent Milky Seas from Space. Sci. Rep. 2021, 11, 15443. [Google Scholar] [CrossRef]
- Wooster, M.J.; Roberts, G.J.; Giglio, L.; Roy, D.P.; Freeborn, P.H.; Boschetti, L.; Justice, C.; Ichoku, C.; Schroeder, W.; Davies, D. Satellite Remote Sensing of Active Fires: History and Current Status, Applications and Future Requirements. Remote Sens. Environ. 2021, 267, 112694. [Google Scholar] [CrossRef]
- Faruolo, M.; Caseiro, A.; Lacava, T.; Kaiser, J.W. Gas Flaring: A Review Focused on Its Analysis from Space. IEEE Geosci. Remote Sens. Mag. 2020, 9, 258–281. [Google Scholar] [CrossRef]
- Pritchard, S.B. The Trouble with Darkness: NASA’s Suomi Satellite Images of Earth at Night. Environ. Hist. 2017, 22, 312–330. [Google Scholar] [CrossRef]
- Elvidge, C.D.; Baugh, K.; Zhizhin, M.; Hsu, F.C.; Ghosh, T. VIIRS Night-Time Lights. Int. J. Remote Sens. 2017, 38, 5860–5879. [Google Scholar] [CrossRef] [Green Version]
- Liang, C.K.; Mills, S.; Hauss, B.I.; Miller, S.D. Improved VIIRS Day/Night Band Imagery with Near-Constant Contrast. IEEE Trans. Geosci. Remote Sens. 2014, 52, 6964–6971. [Google Scholar] [CrossRef]
- Guo, W.; Lu, D.; Wu, Y.; Zhang, J. Mapping Impervious Surface Distribution with Integration of SNNP VIIRS-DNB and MODIS NDVI Data. Remote Sens. 2015, 7, 12459–12477. [Google Scholar] [CrossRef] [Green Version]
- Xia, N.; Li, M.; Cheng, L. Mapping Impacts of Human Activities from Nighttime Light on Vegetation Cover Changes in Southeast Asia. Land 2021, 10, 185. [Google Scholar] [CrossRef]
- Dou, Y.; Liu, Z.; He, C.; Yue, H. Urban Land Extraction Using VIIRS Nighttime Light Data: An Evaluation of Three Popular Methods. Remote Sens. 2017, 9, 175. [Google Scholar] [CrossRef] [Green Version]
- Barentine, J.C.; Walker, C.E.; Kocifaj, M.; Kundracik, F.; Juan, A.; Kanemoto, J.; Monrad, C.K. Skyglow Changes over Tucson, Arizona, Resulting from a Municipal LED Street Lighting Conversion. J. Quant. Spectrosc. Radiat. Transf. 2018, 212, 10–23. [Google Scholar] [CrossRef] [Green Version]
- Kyba, C.; Garz, S.; Kuechly, H.; de Miguel, A.; Zamorano, J.; Fischer, J.; Hölker, F. High-Resolution Imagery of Earth at Night: New Sources, Opportunities and Challenges. Remote Sens. 2014, 7, 1–23. [Google Scholar] [CrossRef] [Green Version]
- Mills, S.; Weiss, S.; Liang, C. VIIRS Day/Night Band (DNB) Stray Light Characterization and Correction. In Proceedings of the Proc. SPIE, Earth Observing Systems XVIII, San Diego, CA, USA, 23 September 2013; Butler, J.J., Xiong, X., Gu, X., Eds.; Volume 8866, p. 88661P. [Google Scholar] [CrossRef]
- Lee, S.; Cao, C. Soumi NPP VIIRS Day/Night Band Stray Light Characterization and Correction Using Calibration View Data. Remote Sens. 2016, 8, 138. [Google Scholar] [CrossRef] [Green Version]
- Mills, S.; Miller, S. VIIRS Day/Night Band—Correcting Striping and Nonuniformity over a Very Large Dynamic Range. J. Imaging 2016, 2, 9. [Google Scholar] [CrossRef]
Figure 1.
Comparison between a DMSP/OLS and VIIRS DNB image.

Figure 2.
The division between different satellite data sets in the database.

Figure 3.
Percent of references between the top three categories in the database.

Figure 4.
The number of references for each subcategory tag under Data and Performance.

Figure 5.
The number of references for each subcategory tag under Applications.

Figure 6.
Number of references for various tags under Applications/Urban and Land Use.

Figure 7.
Number of references for various tags under Applications/Human Activity.

Figure 8.
Number of references for various tags under Applications/Atmosphere.

Figure 9.
Number of references for various tags under Applications/Civil Engineering and Structure.

Figure 10.
The number of references for various tags under Applications/Lights.

Figure 11.
Number of references for various tags under Applications/Biology.

Figure 12.
Number of references for various tags under Applications/Oceans and Freshwater.

Figure 13.
Number of references for various tags under Applications/Natural Resources.

Figure 14.
The number of references for various tags under Misc.

Figure 15.
Comparison between the number of references using natural light vs. artificial.

Figure 16.
Comparison between the number of references using natural light vs. artificial. (a) DMSP data. (b) DMSP and VIIRS data. (c) VIIRS data.
Figure 16.
Comparison between the number of references using natural light vs. artificial. (a) DMSP data. (b) DMSP and VIIRS data. (c) VIIRS data.

Figure 17.
References using natural light sources.

Figure 18.
References using artificial light sources.

Figure 19.
Different tags showing moonlight conditions per number of references.

Figure 20.
Number of references under Biosphere.

Figure 21.
Time series of publication dates for number of references according to sensor.


Table 1.
Main tagging categories and subcategories.
| Data and Performance | Applications | Misc. |
|---|---|---|
| Data Products and Display | Atmosphere | Commentary |
| Performance | Biology | Future Satellites |
| Civil Engineering and Structure | Introduction | |
| Human Activities | Overview | |
| Lights | ||
| Natural Resources | ||
| Oceans and Freshwater | ||
| Urban and Land Use |
Disclaimer/Publisher’s Note: The statements, opinions and data contained in all publications are solely those of the individual author(s) and contributor(s) and not of MDPI and/or the editor(s). MDPI and/or the editor(s) disclaim responsibility for any injury to people or property resulting from any ideas, methods, instructions or products referred to in the content. |
© 2023 by the authors. Licensee MDPI, Basel, Switzerland. This article is an open access article distributed under the terms and conditions of the Creative Commons Attribution (CC BY) license (https://creativecommons.org/licenses/by/4.0/).
Share and Cite
MDPI and ACS Style
Combs, C.L.; Miller, S.D. A Review of the Far-Reaching Usage of Low-Light Nighttime Data. Remote Sens. 2023, 15, 623. https://doi.org/10.3390/rs15030623
AMA Style
Combs CL, Miller SD. A Review of the Far-Reaching Usage of Low-Light Nighttime Data. Remote Sensing. 2023; 15(3):623. https://doi.org/10.3390/rs15030623
Chicago/Turabian StyleCombs, Cynthia L., and Steven D. Miller. 2023. "A Review of the Far-Reaching Usage of Low-Light Nighttime Data" Remote Sensing 15, no. 3: 623. https://doi.org/10.3390/rs15030623
Note that from the first issue of 2016, this journal uses article numbers instead of page numbers. See further details here.