
Deformation Monitoring and Trend Analysis of Reservoir Bank Landslides by Combining Time-Series InSAR and Hurst Index

1
School of Geophysics and Geomatics, China University of Geosciences, Wuhan 430074, China
2
School of Geography and Information Engineering, China University of Geosciences, Wuhan 430078, China
*
Author to whom correspondence should be addressed.
Remote Sens. 2023, 15(3), 619; https://doi.org/10.3390/rs15030619
Submission received: 1 December 2022
/
Revised: 17 January 2023
/
Accepted: 18 January 2023
/
Published: 20 January 2023
(This article belongs to the Special Issue Ground Deformation Source Modeling Using Remote Sensing Techniques)
Abstract
:Landslides along the Three Gorges Reservoir in China pose a threat to coastal residents and waterway safety. To reduce false positive misjudgments caused by a sudden local change in the landslide deformation curve, in this paper, we propose an effective method for predicting the deformation trend of reservoir bank landslides. We take reservoir bank landslides in the Wanzhou District of the Three Gorges Reservoir area as the research object. The Time-Series Interferometric Synthetic Aperture Radar (InSAR) method and 62 Sentinel-1A images from 2018 to 2022 were selected for landslide deformation monitoring, and the Hurst index was calculated to characterize the deformation trend. Furthermore, we propose a method for predicting the deformation trend based on the statistical distribution of deformation rates and the physical significance of the Hurst index. After the field survey and Global Positioning System (GPS) verification, the Time-Series InSAR results are shown to be reliable. We take the Sifangbei landslide as a representative case to analyze the validation results. It is found that the determined Sifangbei landslide deformation trend is consistent with the conclusions for the region. In addition, the deformation trend of a reservoir bank slope has obvious spatial and temporal differences. Changes in the reservoir water level and concentrated rainfall play roles similar to those of catalysts. The proposed method, involving the combination of Time-Series InSAR and the Hurst index, can effectively monitor deformation and predict the stability trend of reservoir bank landslides. The presented research results provide new ideas and solutions for landslide prevention and risk mitigation in reservoir areas.

1. Introduction
Reservoir bank landslides are a special type of hazard that is affected by groundwater level fluctuation [1]. These landslides are stable in their natural state, but under the disturbance of external factors such as rainfall, reservoir storage, and engineering activities, their stability will change to varying degrees [2]. Once destabilized, they may block navigation channels and cause secondary disasters, such as surges [3,4], resulting in serious human casualties and property damage [5,6]. In 1963, a 270 million m3 landslide ran down the Vajont reservoir, destroying the city of Longarone and killing about 2000 people [7,8]. Another five million m3 landslide occurred in the Pontesei reservoir, and people on the opposite side were killed by the resulting surge [7]. Further serious landslides include the Qianjiangping landslide [9], the Yesa reservoir landslide [10], and so on. The Wanzhou district of the Three Gorges Reservoir area has a high distribution of reservoir bank landslides due to its complex geological environment [11]. Since the impoundment of Three Gorges Reservoir in 2003, several landslides in the reservoir area have deformed significantly, such as the Baishuihe landslide [12], Tangjiao landslide [13], and Shuping landslide [14]. Thus, it is important to carry out deformation monitoring and trend analysis for coastal landslides.
The displacement curve of a reservoir bank landslide often shows stepwise characteristics, which makes it difficult to judge the evolutionary stage and deformation trend [11,15]. Therefore, it is important to realize continuous deformation monitoring of reservoir bank landslides. Traditional deformation monitoring equipment such as borehole tiltmeters and Global Positioning System (GPS) are suitable, but their high cost limits their regional application to such landslides on a large scale. Synthetic aperture radar (SAR) interferometry is an effective method for surface deformation monitoring, which has the advantages of a wide monitoring range and high accuracy [16,17,18]. With the free distribution of some satellite imagery, Interferometric SAR (InSAR) has become a high-potential, low-cost landslide monitoring technology [19,20].
For specific applications, it is important to select an appropriate InSAR monitoring method according to the research problem. Differential InSAR (D-InSAR) uses a few SAR images to monitor surface deformation but cannot meet the needs of long-term monitoring due to spatial and temporal decoherence and atmospheric delay [21,22]. Persistent scatterer InSAR (PS-InSAR) is suitable for monitoring ground objects with stable back-scattering ability, but its use is limited in certain areas, such as farmland and woodland [23]. In contrast, Time-Series InSAR with persistent scatterer (PS) and distributed scatterer (DS) as coherent point targets for solving the deformation rate can achieve effective monitoring in urban and mountainous areas. Therefore, the application of Time-Series InSAR for early identification [24,25], monitoring [26,27], and risk assessment [28] of landslides has become a global research hotspot.
Compared with the current deformation state, the future deformation trend of a reservoir bank landslide is usually of more concern. Unlike pure curve prediction using machine learning and deep learning, the deformation prediction of reservoir bank landslides with physical significance is currently mostly focused on judgment based on the curvature or angle change of the deformation curve. This method is easy to calculate, but false positive misjudgment may occur due to too much focus being placed on the sudden local change of the deformation curve. The Hurst index can measure the time correlation of a time series and is a powerful indicator to quantify the relative trend of time-series data [29]. It is presently widely used for financial stock price prediction [30] and in vegetation-related climate change studies [31]. In the early stage, many researchers studied the Hurst index in the context of landslide stability analysis and prediction. He et al. took the Xintan landslide and the Huanglashi landslide as examples and found that the time of Hurst index reduction coincided well with the time of landslide instability [32]. Cao et al. have analyzed the stability and deformation trend of the Sanzhouxi landslide using the Hurst index based on actual landslide deformation data [33]. With the increase in landslide data and the development of Time-Series InSAR technology, the Hurst index, based on fractal theory, has come back into view and has gradually been applied to landslide research in terms of time-series prediction and influence factor analysis. Roccati et al. have analyzed potential rainfall trends using the Mann–Kendall test and the Hurst index, suggesting that future scenarios in which rainfall thresholds are exceeded, thus leading to landslides, may occur more frequently [34]. Li et al. have combined a Long Short-Term Memory deep learning framework and the Hurst index to accurately identify the sharp seasonal deformation of landslides [35]. Liu et al. have used the Hurst index to analyze the stability of the Woda landslide based on the deformation data obtained by distributed scatterer InSAR (DS-InSAR) [36]. Overall, the application of the Hurst index in the landslide field and its combination with other methods have attracted increasing attention.
In addition, it is not sufficient to analyze landslide deformation only by the line-of-sight (LOS) deformation rate calculated by Time-Series InSAR, as the landslide deformation information extracted by Time-Series InSAR is usually limited. On the one hand, it is necessary to continuously improve InSAR technology in order to enhance the spatial and temporal accuracy of monitoring. On the other hand, it is necessary to use mathematical statistics, numerical simulation, machine learning, and other methods to mine more useful information from the existing incomplete data. For example, the projection transformation of the line-of-sight and the three-dimensional (3D) reconstruction of landslide surface deformation are important processes for mining useful information [37,38]. In its long and multi-field use in research, the Hurst index has shown great advantages in time-dimension information mining [39,40]. Thus, it is necessary and very meaningful to reintroduce the Hurst index for deformation trend analysis and prediction of regional landslides on the basis of massive SAR data.
In this paper, we take reservoir bank landslides in the Wanzhou District of the Three Gorges Reservoir area as the research object. By utilizing the benefits of Time-Series InSAR and the Hurst index, we convert the deformation trend from the time dimension to the spatial dimension. Additionally, we analyze the deformation behavior of a specific landslide with noticeable deformation in the study area. The main objectives of this study include (a) Deformation monitoring of reservoir bank landslides; (b) trend prediction of landslide deformation in the next 4 years; and (c) exploring the relationship between reservoir bank landslide deformation and rainfall or reservoir water level, in order to provide new ideas and solutions for landslide prevention and risk mitigation in the reservoir area.
2. Study Area and Datasets
2.1. Study Area
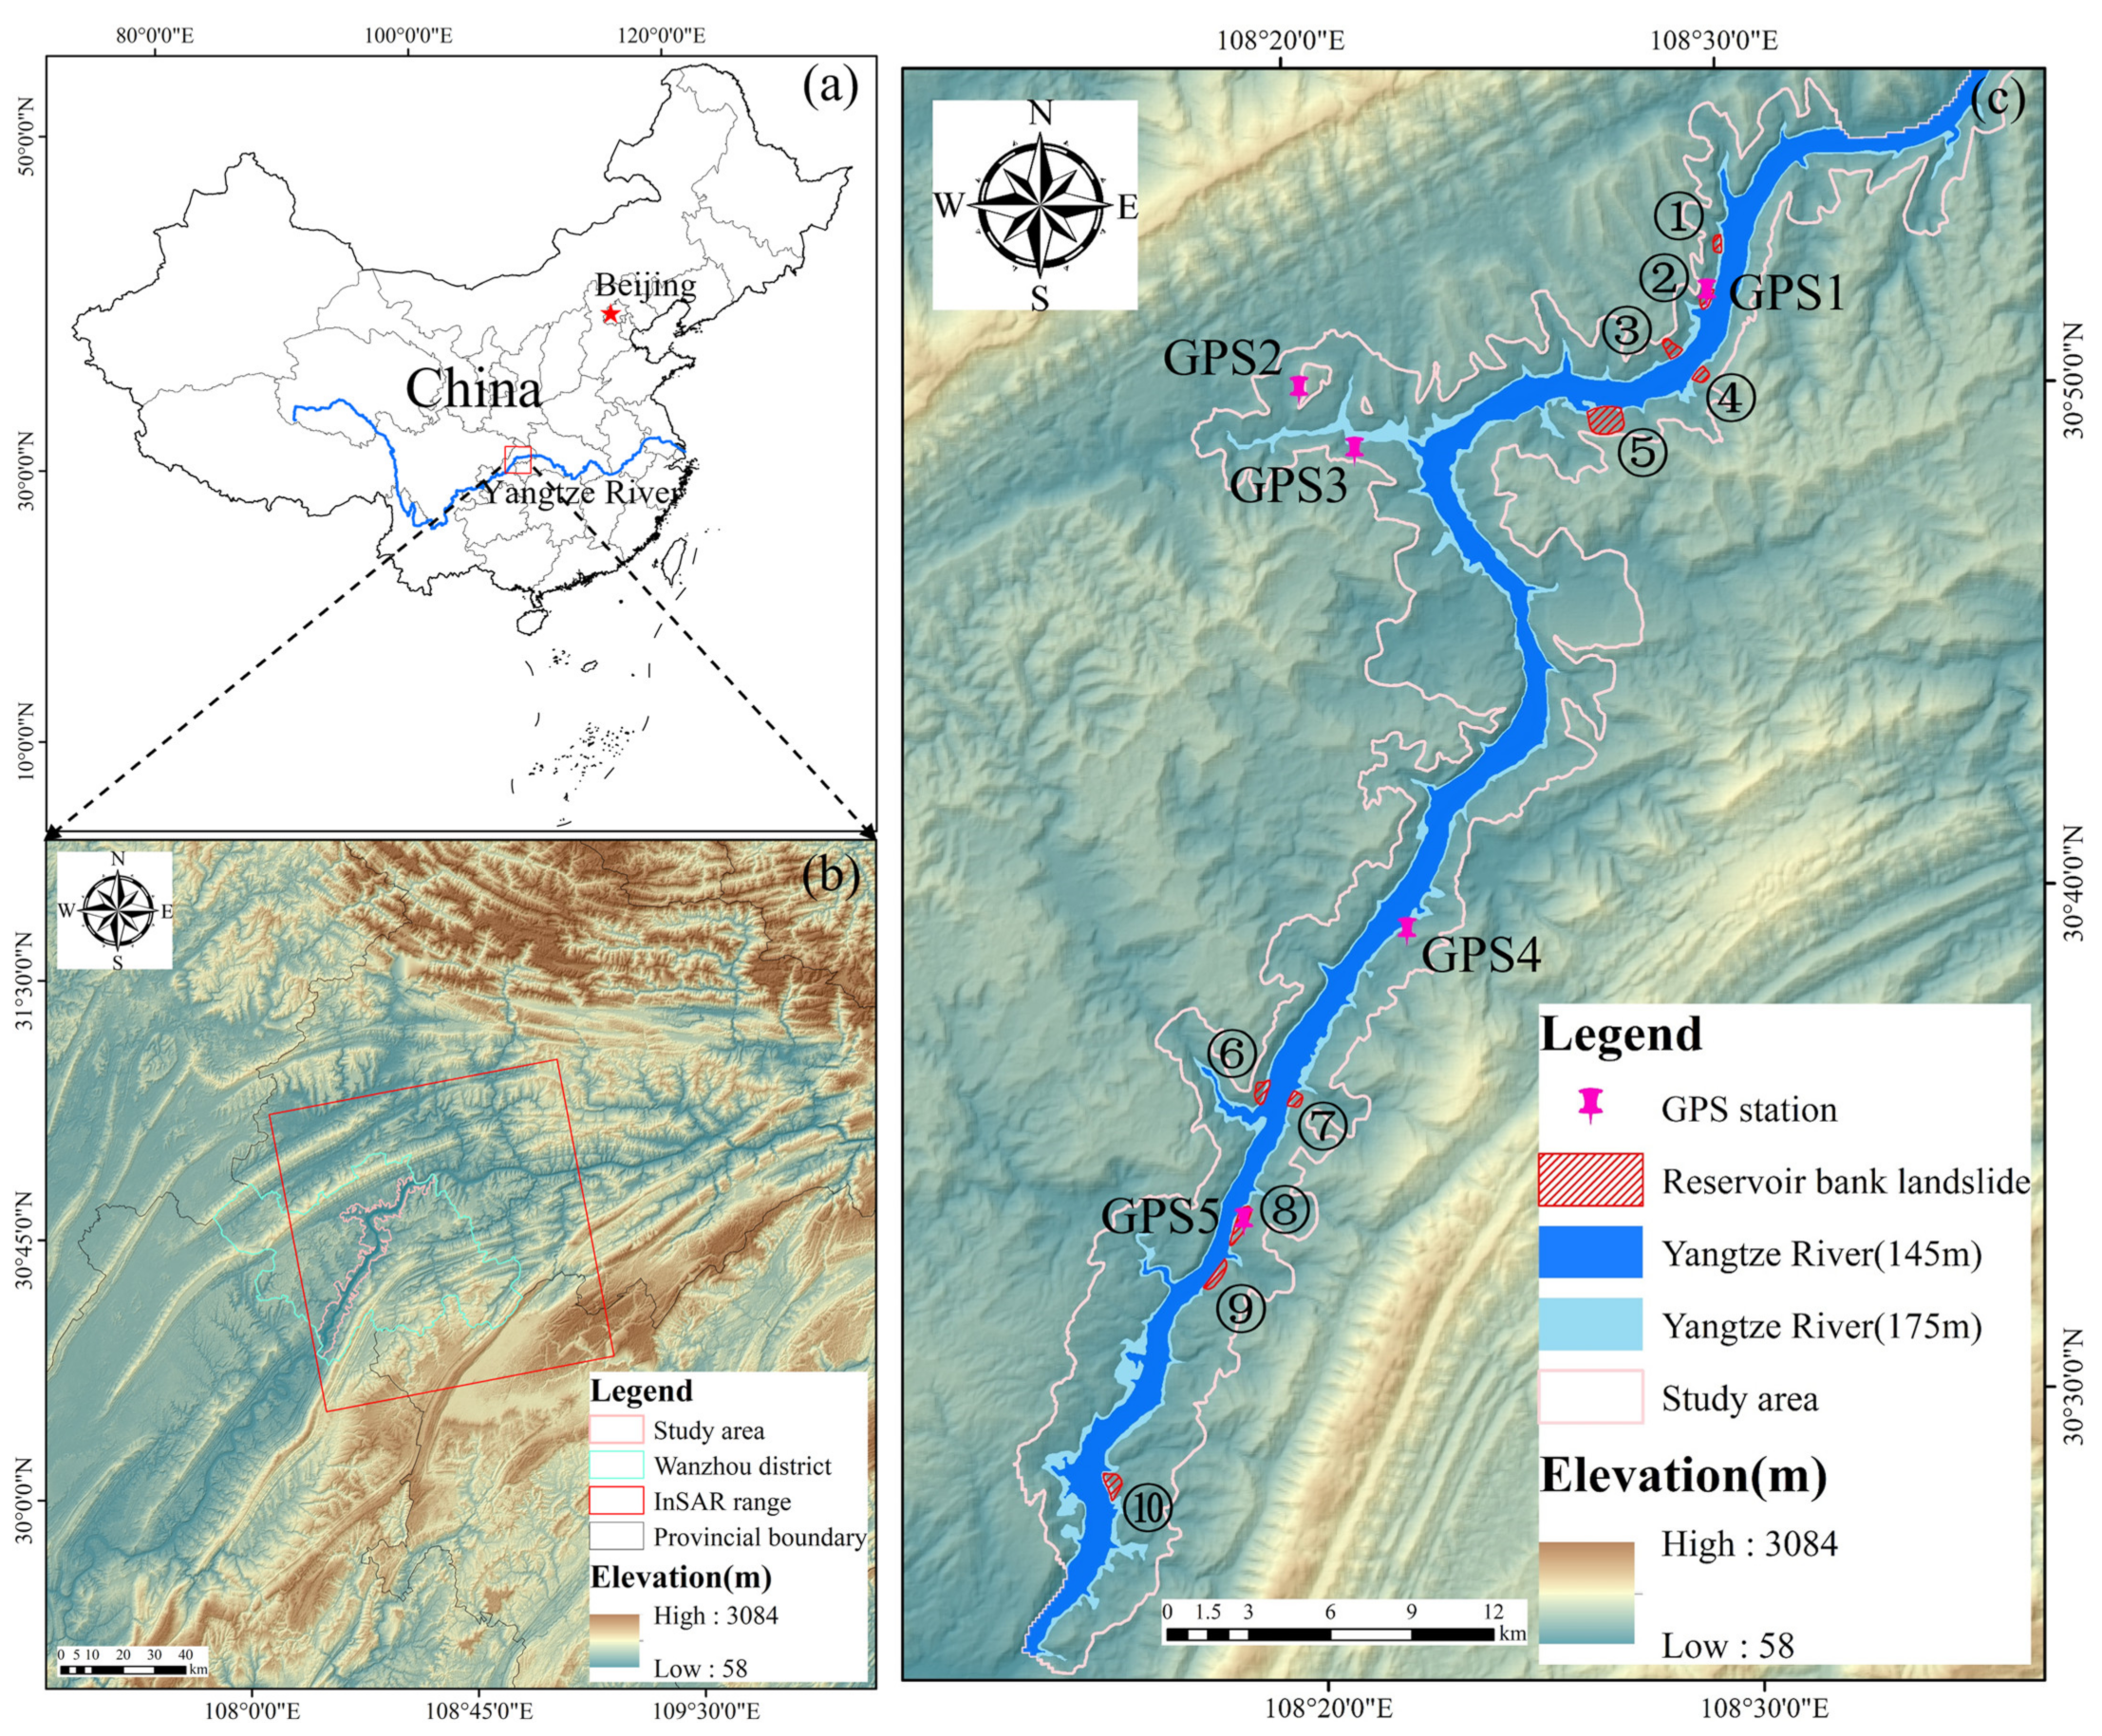
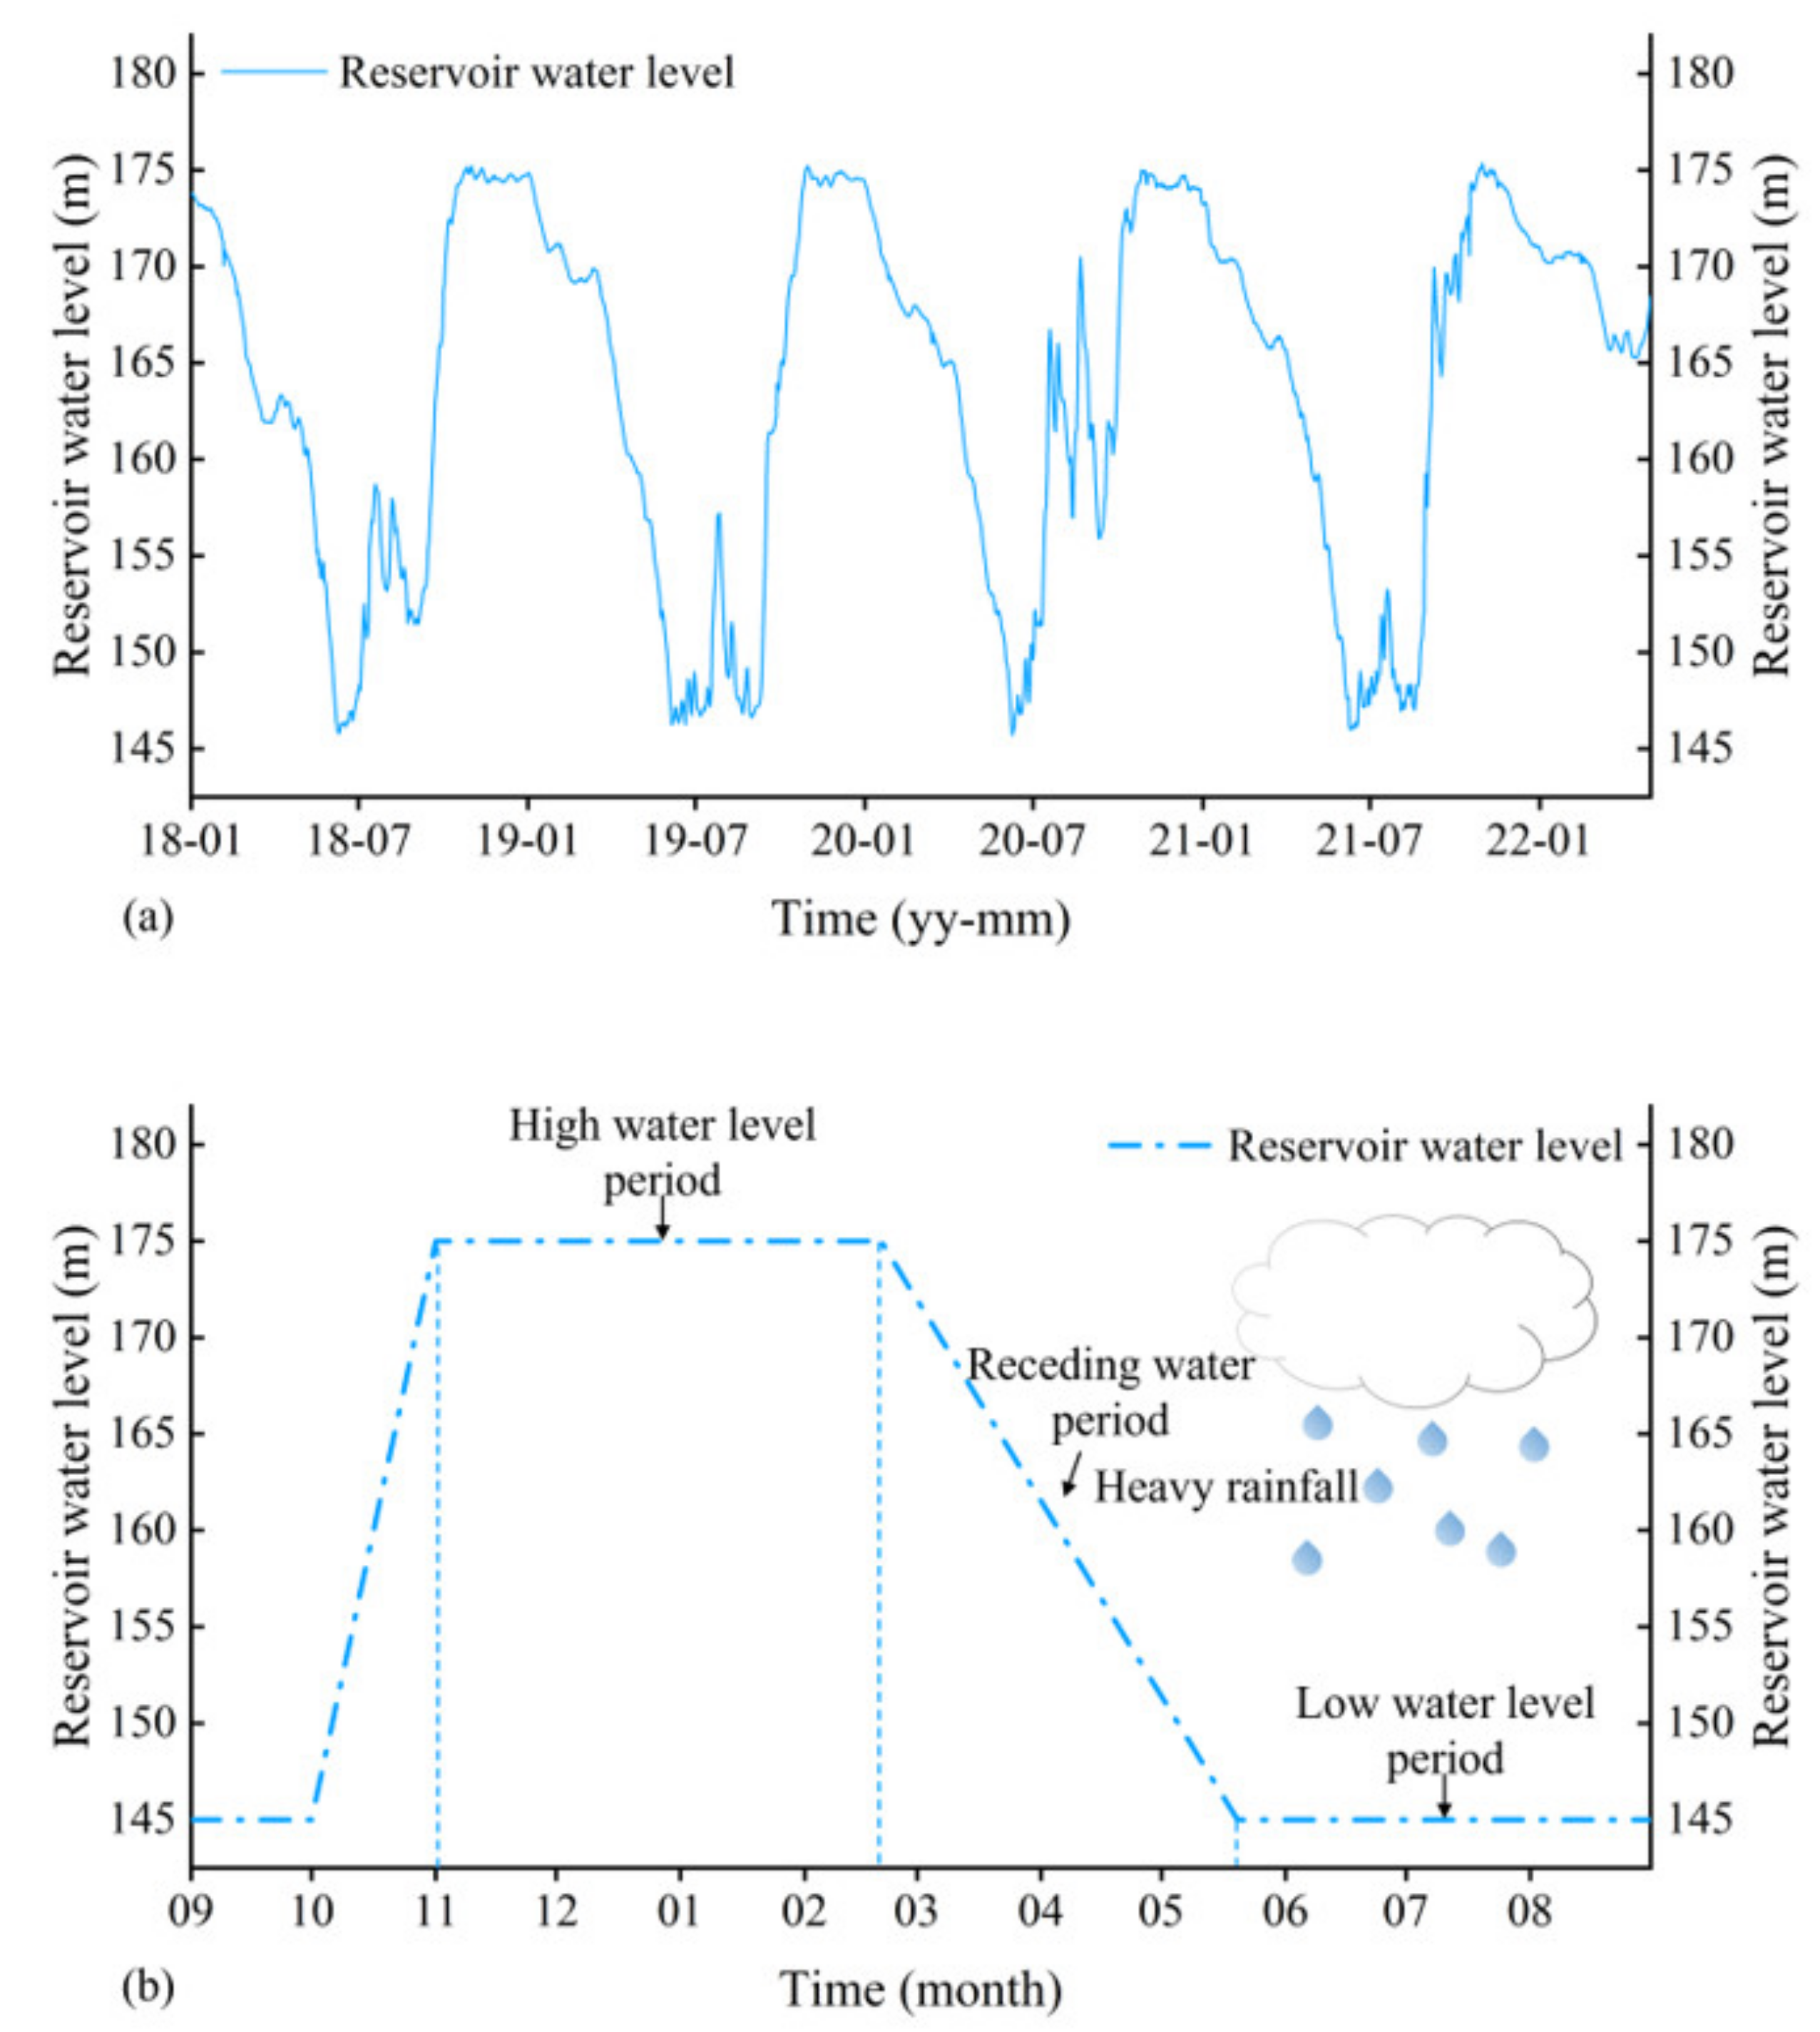
The study area is about 80 km long and 6 km in width (Figure 1) and is located in northeastern Chongqing, China. The study area has a sub-tropical humid, monsoon climate with abundant sunshine and rainfall. The average annual rainfall is 1200 mm, mainly concentrated in April–October, accounting for about 90% of the year. The study area is overlain by Quaternary accumulation and underlain by Jurassic quartz sandstone and mudstone. Since 2013, the water level of the Three Gorges Reservoir has periodically fluctuated between 145 and 175 m. According to the variation curve of reservoir water level (Figure 2a), and considering the research content, we divided it into three periods: From March to June, from July to October, and from November to February of the following year (Figure 2b).
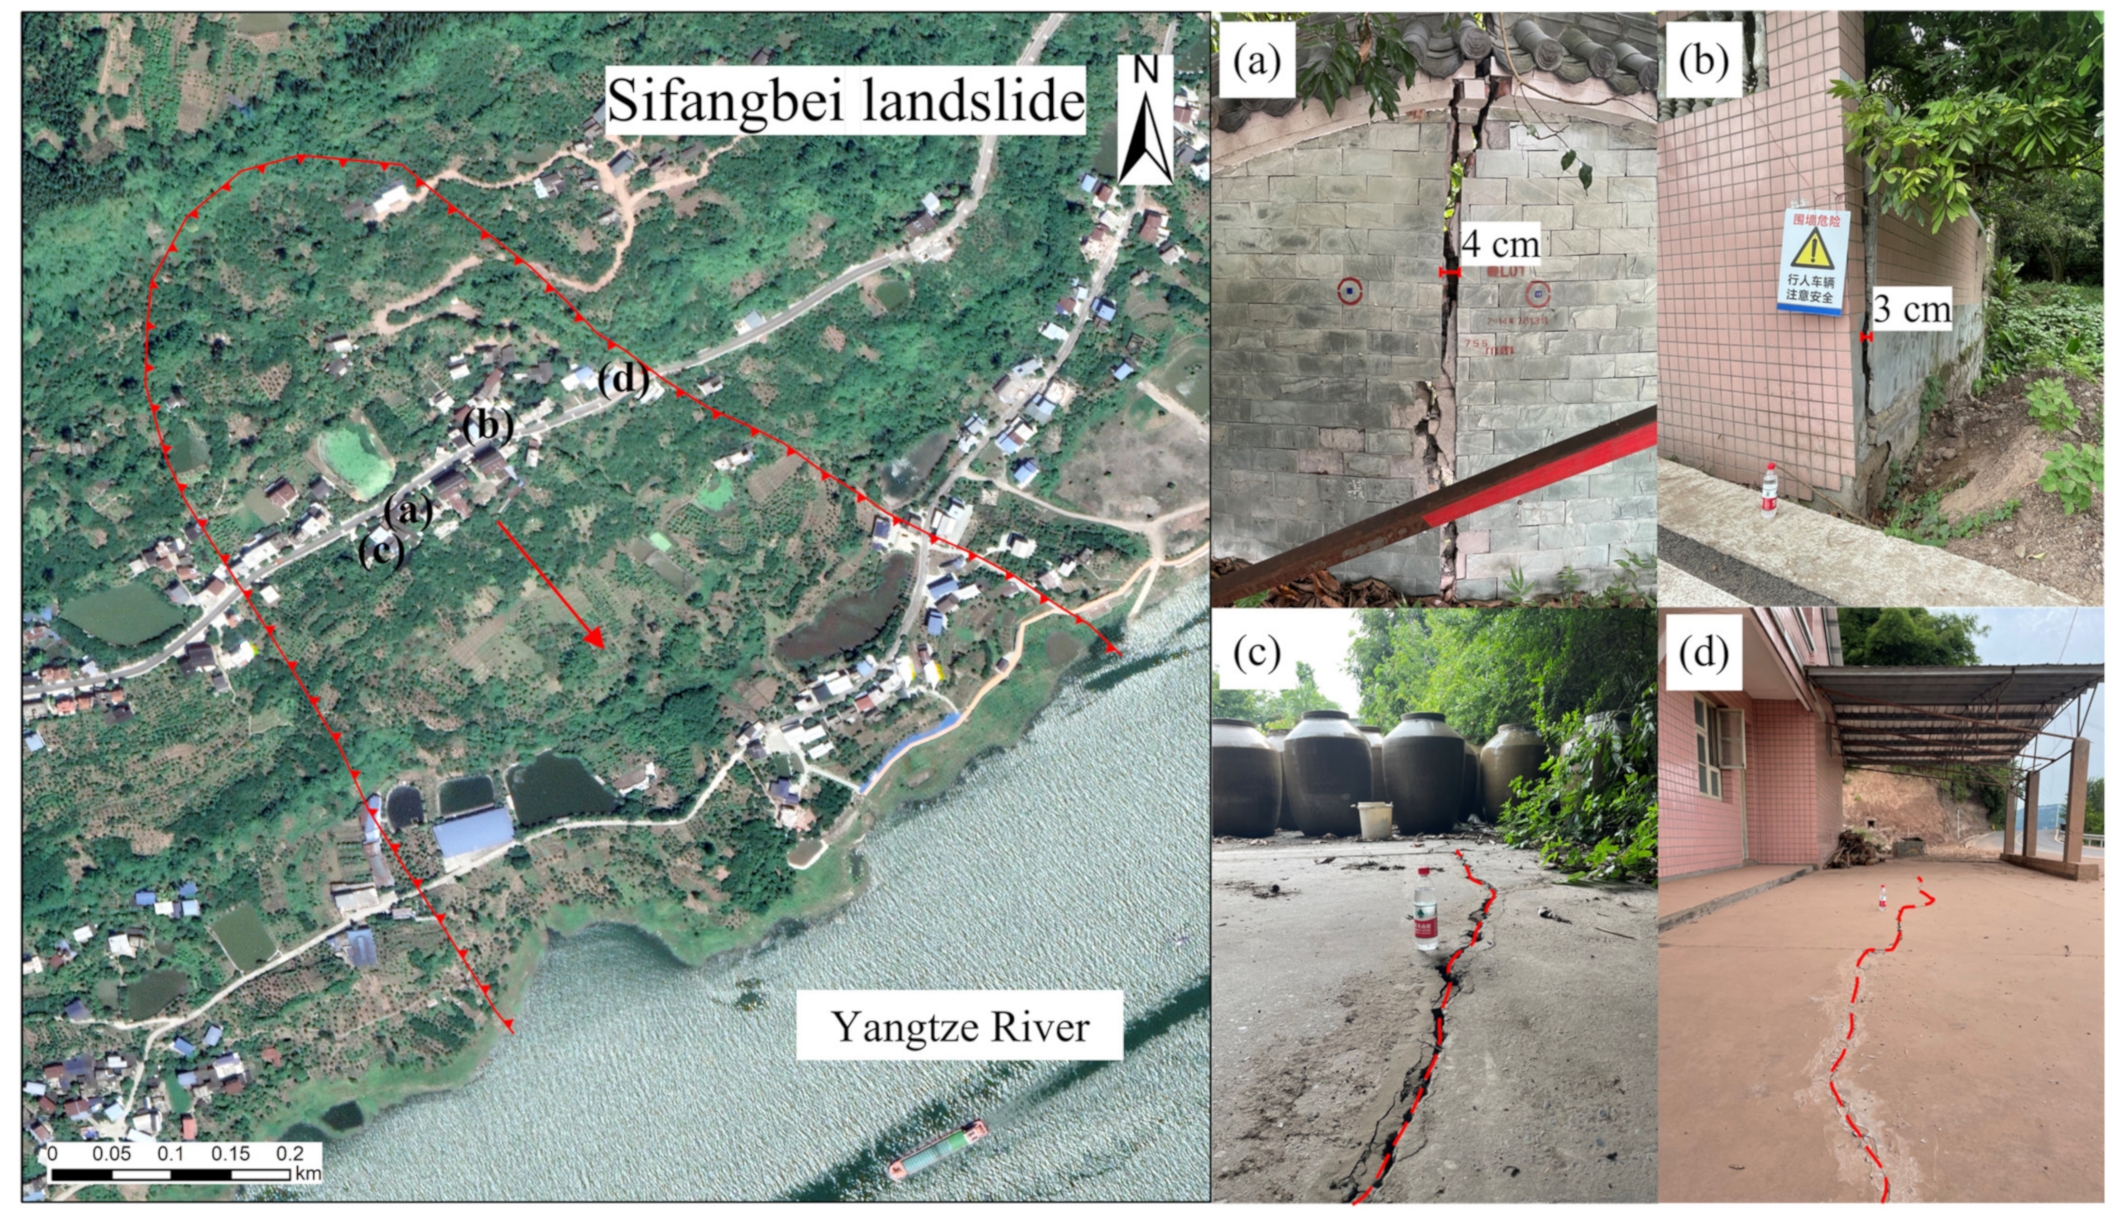
There are 10 reservoir bank landslides with deformation activities in the study area (Table 1). In 2021, the local deformation rates of the Sifangbei and Jinjinzi landslides exceeded −50 mm/yr. The left sliding body of the Rangduchangbei landslide deformed greatly, with a deformation rate of about −400 mm/yr. The deformation rates of the Xiangjiaping, Tangjiao, and Zhangjiacitang landslides were in the range of −40–0 mm/yr. The deformation rates of the other four landslides were in the range of −20–0 mm/yr. Sifangbei landslide was taken as a representative case for the validation analysis (marked with number ③ in Figure 1c). Under the effect of rainfall and reservoir water level change, ground cracks have appeared in the landslide, some house walls are cracked, and local deformation is still intensifying (Figure 3).
2.2. Datasets
In this study, we used 62 Sentinel-1A images collected at European Space Agency (ESA) from 11 January 2018 to 2 January 2022. These Sentinel-1A images are ascending orbit data with a track of 84. Sentinel-1A is a C-band SAR satellite with a new terrain observation with progressive scan SAR (TOPSAR) imaging mode. It has a short revisit period of 12 days and a spatial coverage of 250 km × 250 km with a medium resolution, making it suitable for large-scale landslide monitoring. At the same time, we collected precise orbit data of the Sentinel-1A images from the ESA. The 30 m resolution Shuttle Radar Topography Mission Digital Elevation Model (SRTM DEM) obtained from the National Aeronautics and Space Administration (NASA) was used for image registration and topographic phase removal. The real-time data were applied in the Generic Atmospheric Correction Online Service for InSAR (GACOS) in order to remove the tropospheric delay. The 0.5 m optical image downloaded from the 91 Satellite Map is used to show the Sifangbei landslide boundary and the InSAR monitoring results.
In order to verify the accuracy of Time-Series InSAR results, we collected the monitoring data of five GPS stations from 2016 to the present from the Chongqing Geohazard Monitoring System. The GPS stations are shown in Figure 1. Meanwhile, we collected the elevation range, average thickness, and other parameters of the 10 reservoir bank landslides and their deformation rate in 2021 from the Chongqing Geohazard Monitoring System. In addition, we collated the reservoir water level data and rainfall data from 2018 to 2022 in order to analyze the relationship between the reservoir bank landslide deformation trend and influencing factors.
3. Methods
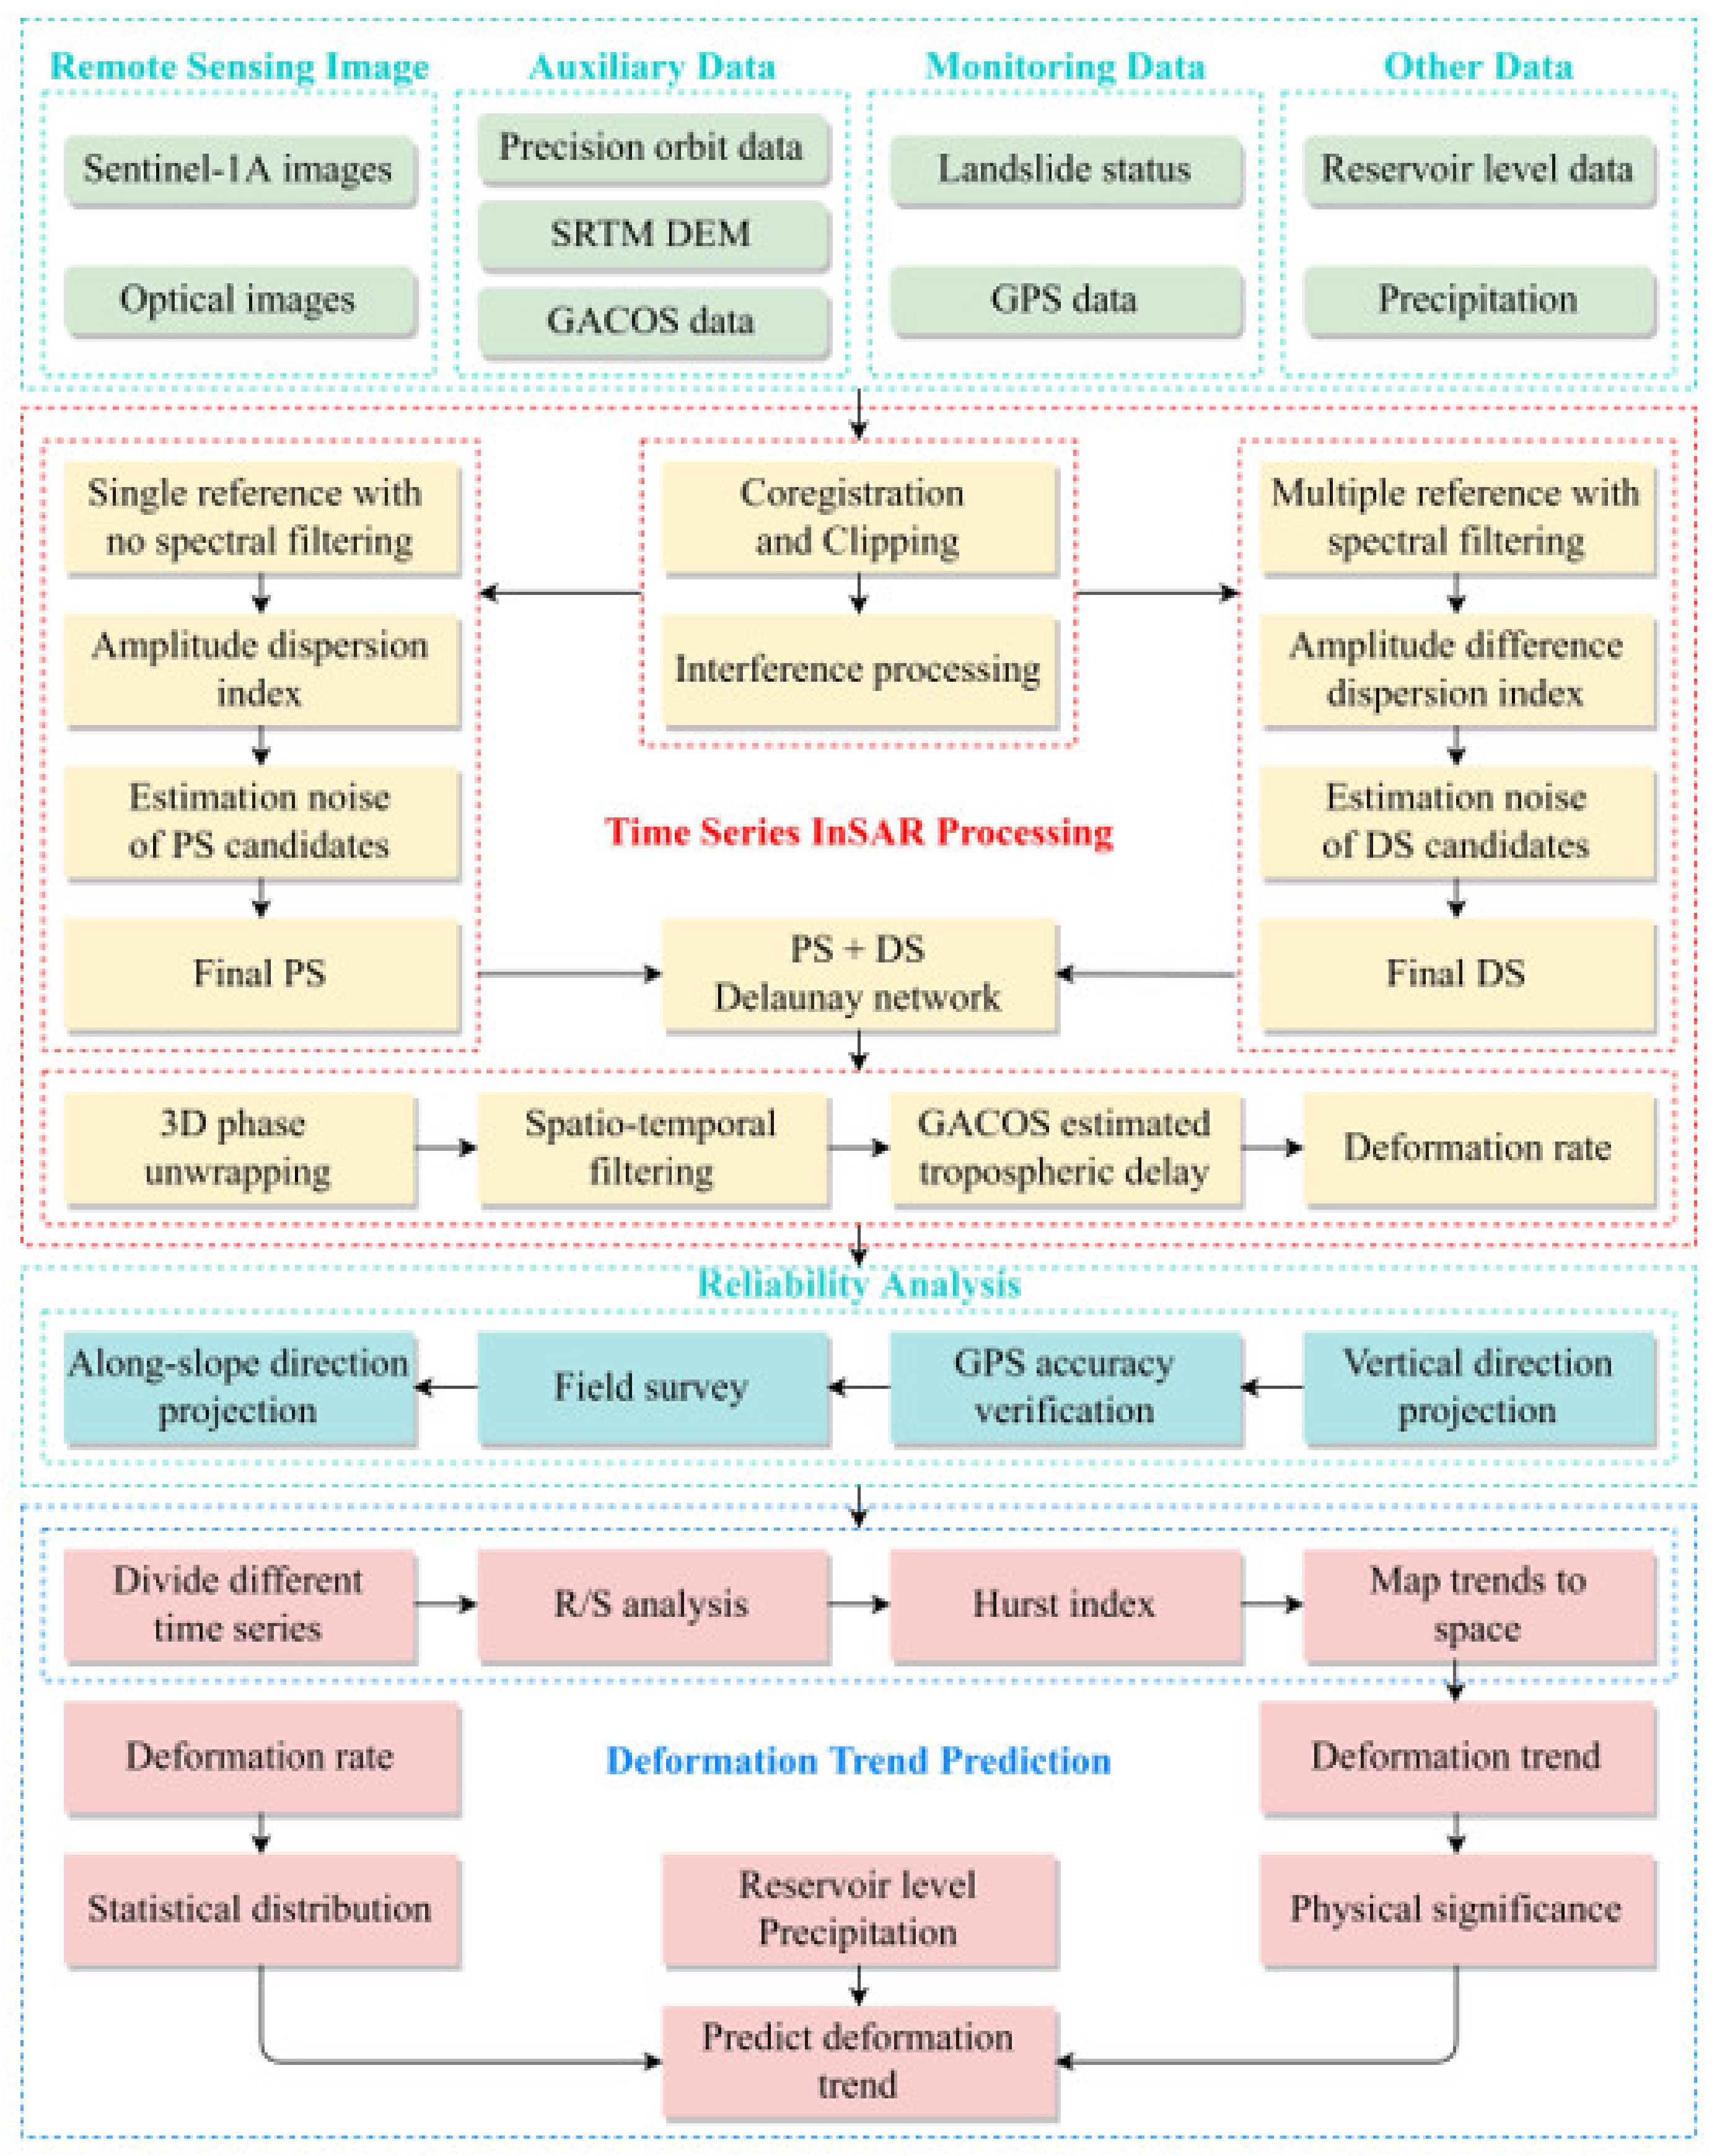
In this study, the Stanford Method for Persistent Scatterer/Multi-Temporal InSAR (StaMPS/MTI) [41] was used to monitor deformation in Wanzhou District of the Three Gorges Reservoir area by combining PS and DS point targets. The basic data processing flow is shown in Figure 4. First, the Sentinel-1A images were registered and cropped with precision orbit and SRTM DEM in the InSAR Scientific Computing Environment (ISCE). Then, the interferogram stack was generated. Next, PS and DS points were selected through several iterations. Thus, their deformation phase information was extracted to calculate the deformation. Finally, the Hurst index of different time ranges was calculated using the Rescaled Range (R/S) method to characterize the deformation trend, allowing us to map the deformation trend spatially and to discover the spatial and temporal deformation law of reservoir bank landslides. In addition, the Sifangbei landslide, with obvious features, significant deformation, and complete data in the study area, was used as a representative case to validate the reliability of the deformation trend. The relationship between the deformation trend and influencing factors was analyzed in detail regarding the reservoir water level and rainfall.
3.1. PS and DS Selection
We combine the amplitude and phase to select PS and DS. The amplitude dispersion index DA was used to extract almost all PS initial candidate points in the dataset, while the amplitude difference dispersion index was used to extract almost all DS initial candidate points in the dataset. and are defined as follows:
where and are the standard deviation and mean of the pixel point amplitude, respectively; and is the standard deviation of the amplitude difference between the reference image and the slave image.
The phase noise of the candidate point is described by , which is an indicator determining whether the candidate point is a PS or DS. Pixels with higher , and lower show better amplitude and phase stability. In this way, PS selection not only reduces the computational burden but also effectively improves the accuracy of the results. is calculated as follows:
where is the wrapped phase, is the spatially correlated term, is the spatially uncorrelated look angle error, is the corresponding pixel, is the interferogram, and N is the number of interferograms.
It is worth noting that, although similar algorithms are used to select PS and DS, the extracted coherent point targets are different, as they are applied to a single reference interference dataset without spectrum filtering and multi-reference interference dataset with spectrum filtering, respectively.
3.2. Time-Series InSAR Processing
Next, the PS and DS are connected to generate a Delaunay triangular network and perform phase differencing. The wrapped phase consists of spatially correlated components and spatially uncorrelated look angle errors. The spatially correlated component includes the deformation phase, orbital phase, atmospheric phase, and spatially correlated look angle errors, while the spatially uncorrelated component mainly includes the spatially uncorrelated look angle error. The wrapped phase of the xth pixel in the ith interferogram can be expressed as follows:
where , , , and are the deformation phase, atmospheric phase, orbital phase, topographic phase, and noise phase, respectively. Then, 3D phase unwrapping is performed. The interferograms are unwrapped in three dimensions: two in space and one in time [42]. Atmospheric delay in the troposphere is removed using external GACOS data [43,44,45]. After that, the deformation is obtained from the phase using the singular value decomposition method.
The SAR sensor measures the deformation along the LOS direction, which does not directly reflect the deformation characteristics of the landslide. Cascini et al. and Herrera et al. have proposed a widely used method [37,46] that allows for projection of the deformation in the LOS direction onto the steepest direction of the slope. The transformation parameters of this method are obtained according to the satellite flight attitude and DEM. The formula is defined as follows:
where is the movement along the slope direction, is the movement along the LOS direction, is the angle between the LOS direction and the slope direction, is the incident angle, is the aspect, is the angle between the azimuth direction and the north direction, and is the slope.
3.3. Hurst Index
The Hurst index was first proposed by Hurst, who studied the hydrological problems of the Nile [47] and was later improved by Mandelbrot [48]. Afterward, it developed into fractal theory and was gradually applied to the analysis of landslide data [34,35]. The Hurst Index can be calculated using the R/S method, in order to estimate the future trend. It can be used to discover the future persistence degree or possibility of the current state, requiring almost no assumptions on the study objectives and having good robustness [49].
When N SAR images compose a time-series {uN}, we divide the series equally into m sub-series with length x. Each sub-series can be defined as follows:
where is the ith value of the sub-series and is the mean value of the sub-series. Then, we calculate the extreme deviation R and the standard deviation S as follows:
Mandelbrot [48] proved that the following relationship exists between and x:
where k is a constant and H is the Hurst index. Taking the logarithm of Equation (10), we obtain the following linear relationship:
Different x (i.e., different time scales) correspond to different value. The Hurst index H can be estimated using the least squares method. The value of H is between 0 and 1. When it is equal to 0.5, the time series is independent in different dimensions, indicating a random state with no significant law. When it is greater than 0.5 and less than 1, it means the evolutionary process is persistent, and the state will not change. When it is greater than 0 and less than 0.5, it means the evolutionary process will step in the opposite direction. The closer the value is to 1, the stronger the persistence of the evolutionary process. The closer the value is to 0, the stronger the inverse persistence [47,48].
3.4. Deformation Trend Prediction
Combining the advantages of Time-Series InSAR and the physical significance of the Hurst index, we propose a prediction method for landslide deformation trend analysis. First, the deformation rate obtained by Time-Series InSAR is graded according to the statistical distribution (Figure 5). We classify −10–0 mm/yr and <−10 mm/yr into stable and deformed, respectively. Meanwhile, the Hurst index is graded according to the physical significance described in Section 3.3, with high randomness of the Hurst index at around 0.5. Thus, the Hurst index was divided into 0–0.4, 0.4–0.6, and 0.6–1, which correspond to the current state of landslide being changed, undetermined, and maintained, respectively. Table 2 shows the criteria for deformation trend determination based on the deformation rate and Hurst index.
In the table, v is the deformation rate (mm/yr) and H denotes the Hurst index.
4. Results and Analysis
4.1. Slope Deformation Rate
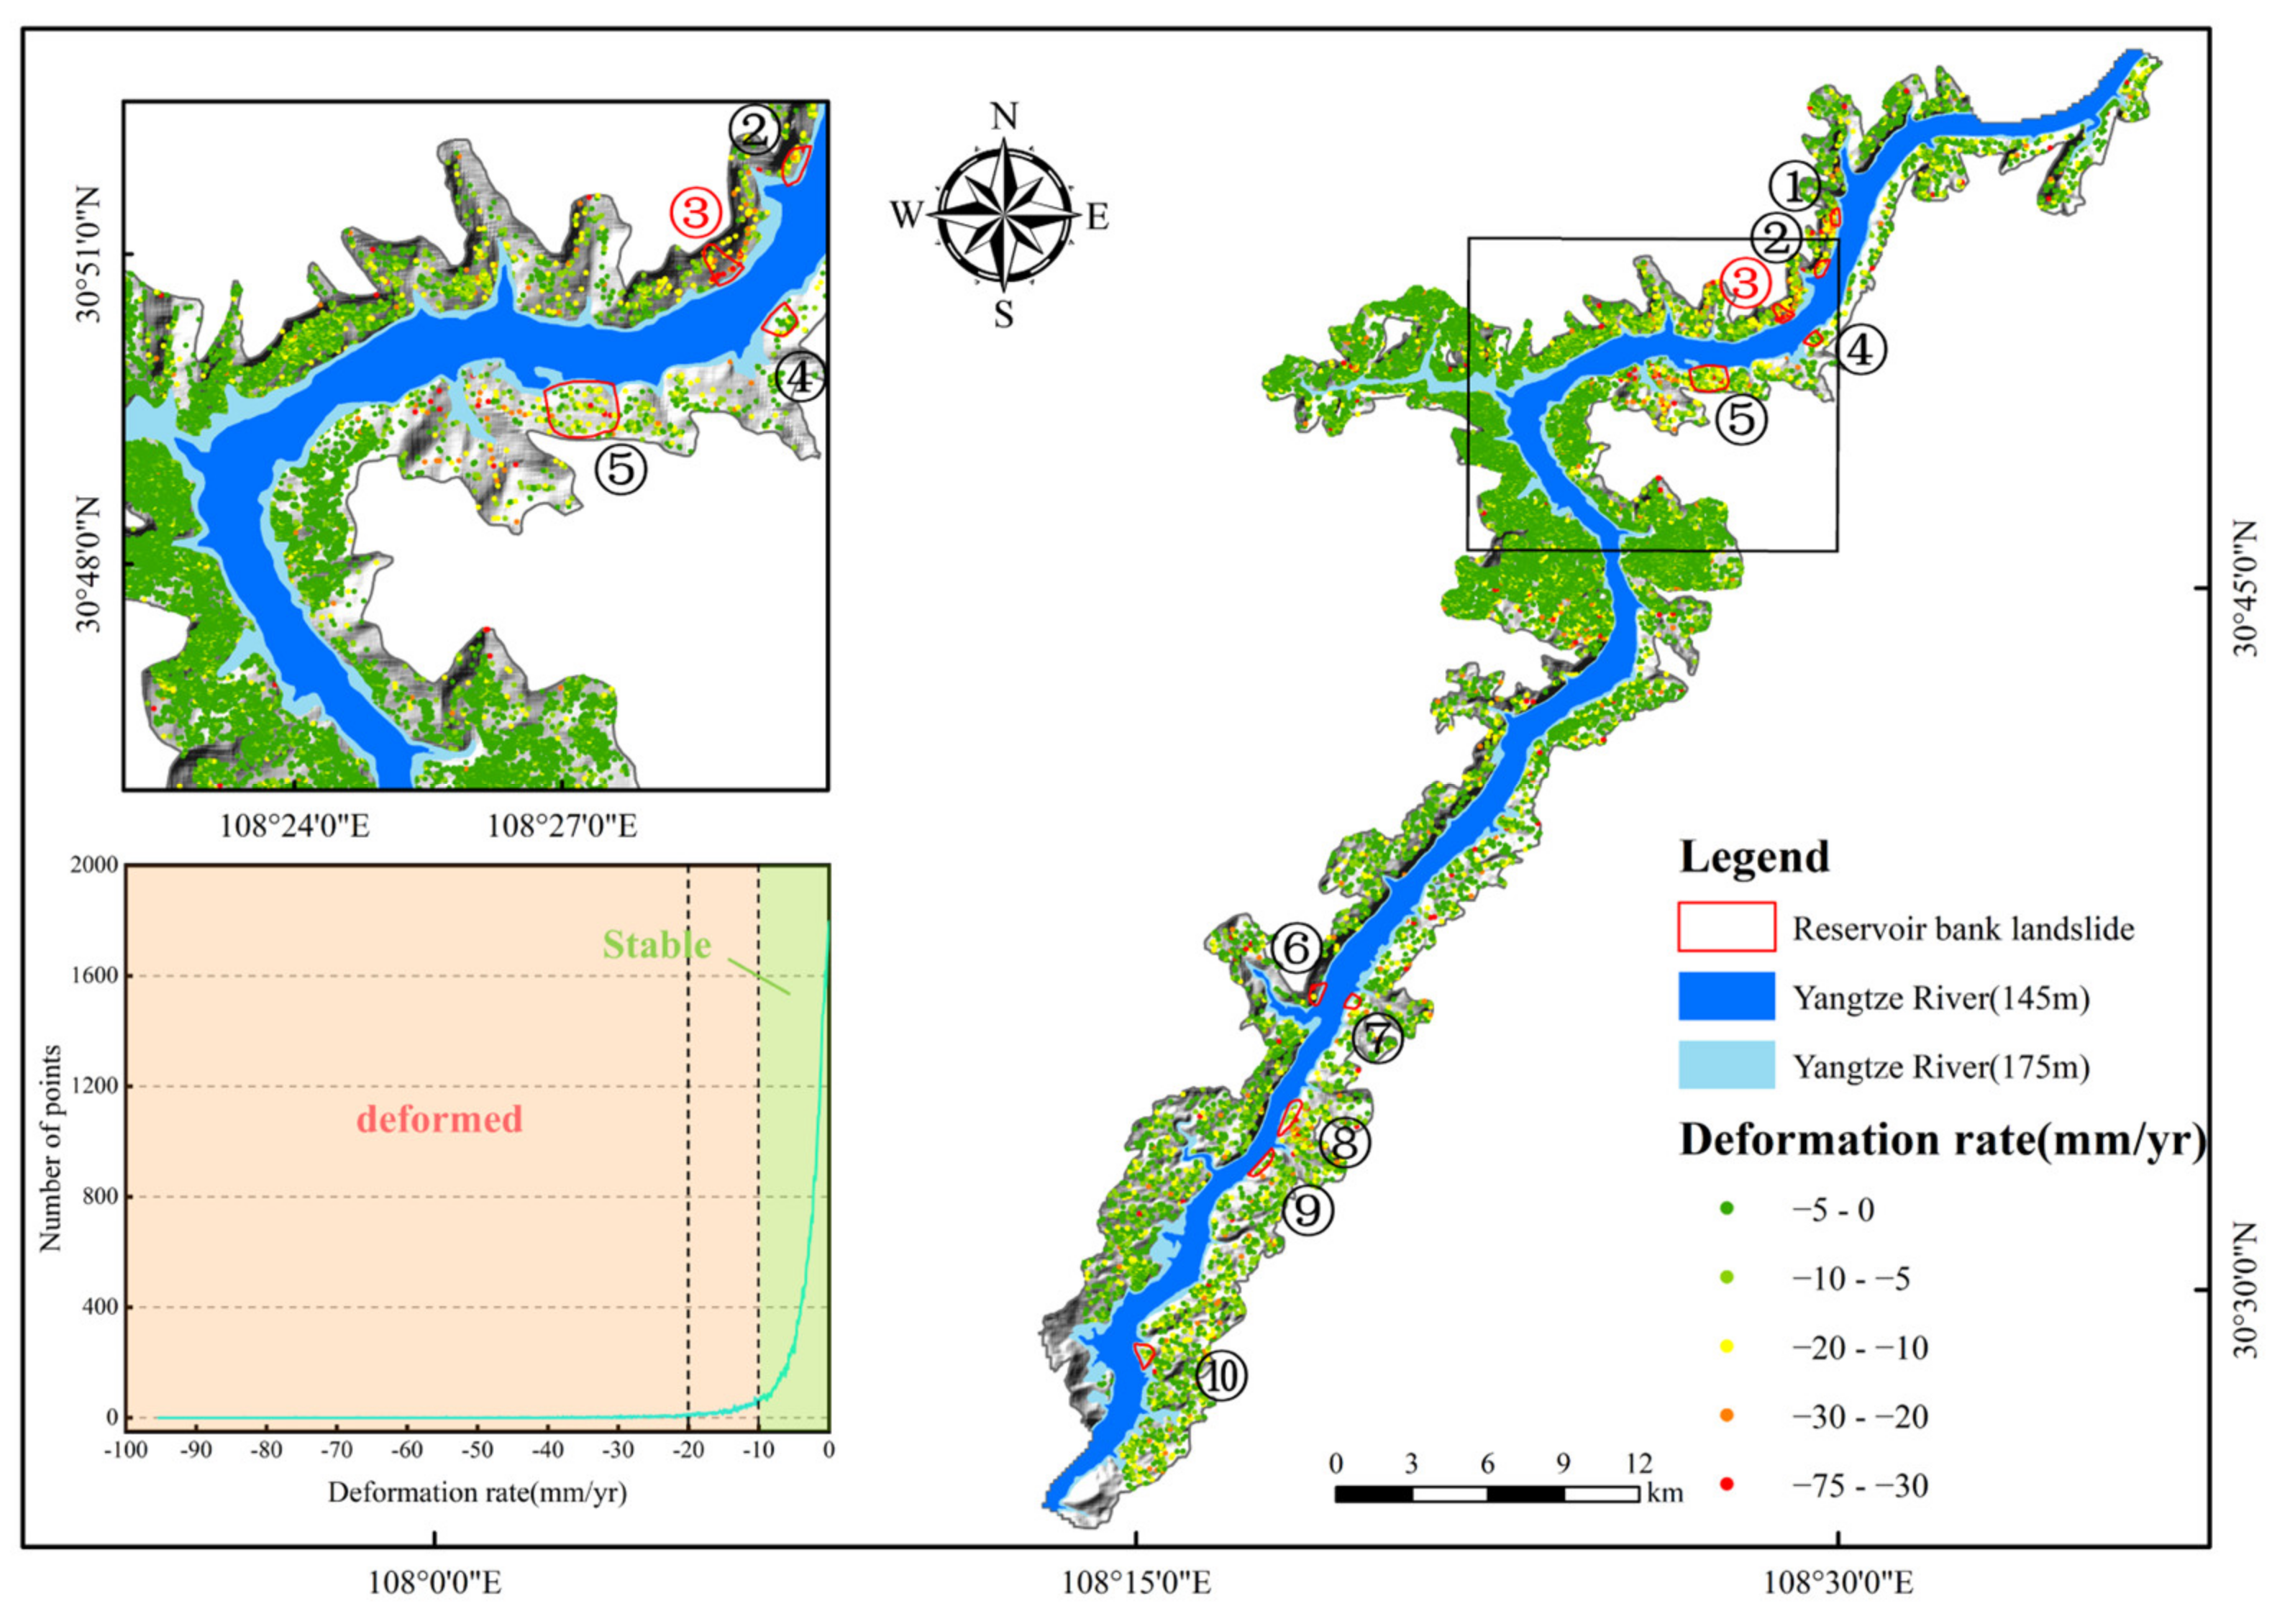
We obtained surface deformation information for the rectangular area covering the study area (i.e., the red box in Figure 1b). To be precise, after many rounds of phase unwrapping and effectively eliminating tropospheric delay, a total of 472,541 point targets were extracted by the PS-InSAR method, while 730,764 point targets were extracted by the Time-Series InSAR method described in Section 3.1 and Section 3.2. In comparison, the number of point targets increased by 54.64%. As the Three Gorges Reservoir area is mountainous and lacks strong scattering targets, the point targets obtained by the traditional PS-InSAR method were sparse and could not meet the demands of regional deformation monitoring. There were 104,130 point targets in the study area, with a density of 295 km−2. The deformation rate in the LOS direction was projected onto the slope direction, according to the method described in Section 3.2. Figure 5 shows the spatial distribution and deformation rate of the Time-Series InSAR measurement points along the slope direction.
Overall, the deformation rate of most areas in the Wanzhou District of the Three Gorges Reservoir area ranged from −5 to 0 mm/yr. It was found that the local deformation rate of four reservoir bank landslides exceeded −30 mm/yr; namely, the Sifangbei landslide, Laotangfang landslide, Tangjiao landslide, and Rangduchangbei landslide (Figure 5). The deformation rates of the Xiangjiaping landslide, Sharentian landslide, Jinjinzi landslide, and Zhangjiacitang landslide were in the range of −20–0 mm/yr, while the deformation rates of the Datangbang landslide and Wuchiba landslide were within −10 mm/yr.
We compared the above InSAR results with the collected GPS data in the vertical direction. The horizontal distance between each measurement point and the GPS station was less than 20 m. Then, we calculated the deviation and RMSE using data at similar time points. A comparison between the Time-Series InSAR measurements and GPS observations is provided in Table 3. The RMSE of the five groups of data was 2.55 mm/yr. The deviation was mainly caused by the incomplete coincidence of InSAR measurements and GPS observations in time and space. Referring to previous experimental results [50,51,52], the Time-Series InSAR measurements were in good agreement with the GPS observations and can be used for regional deformation monitoring and trend analysis.
4.2. Slope Deformation Trend Analysis
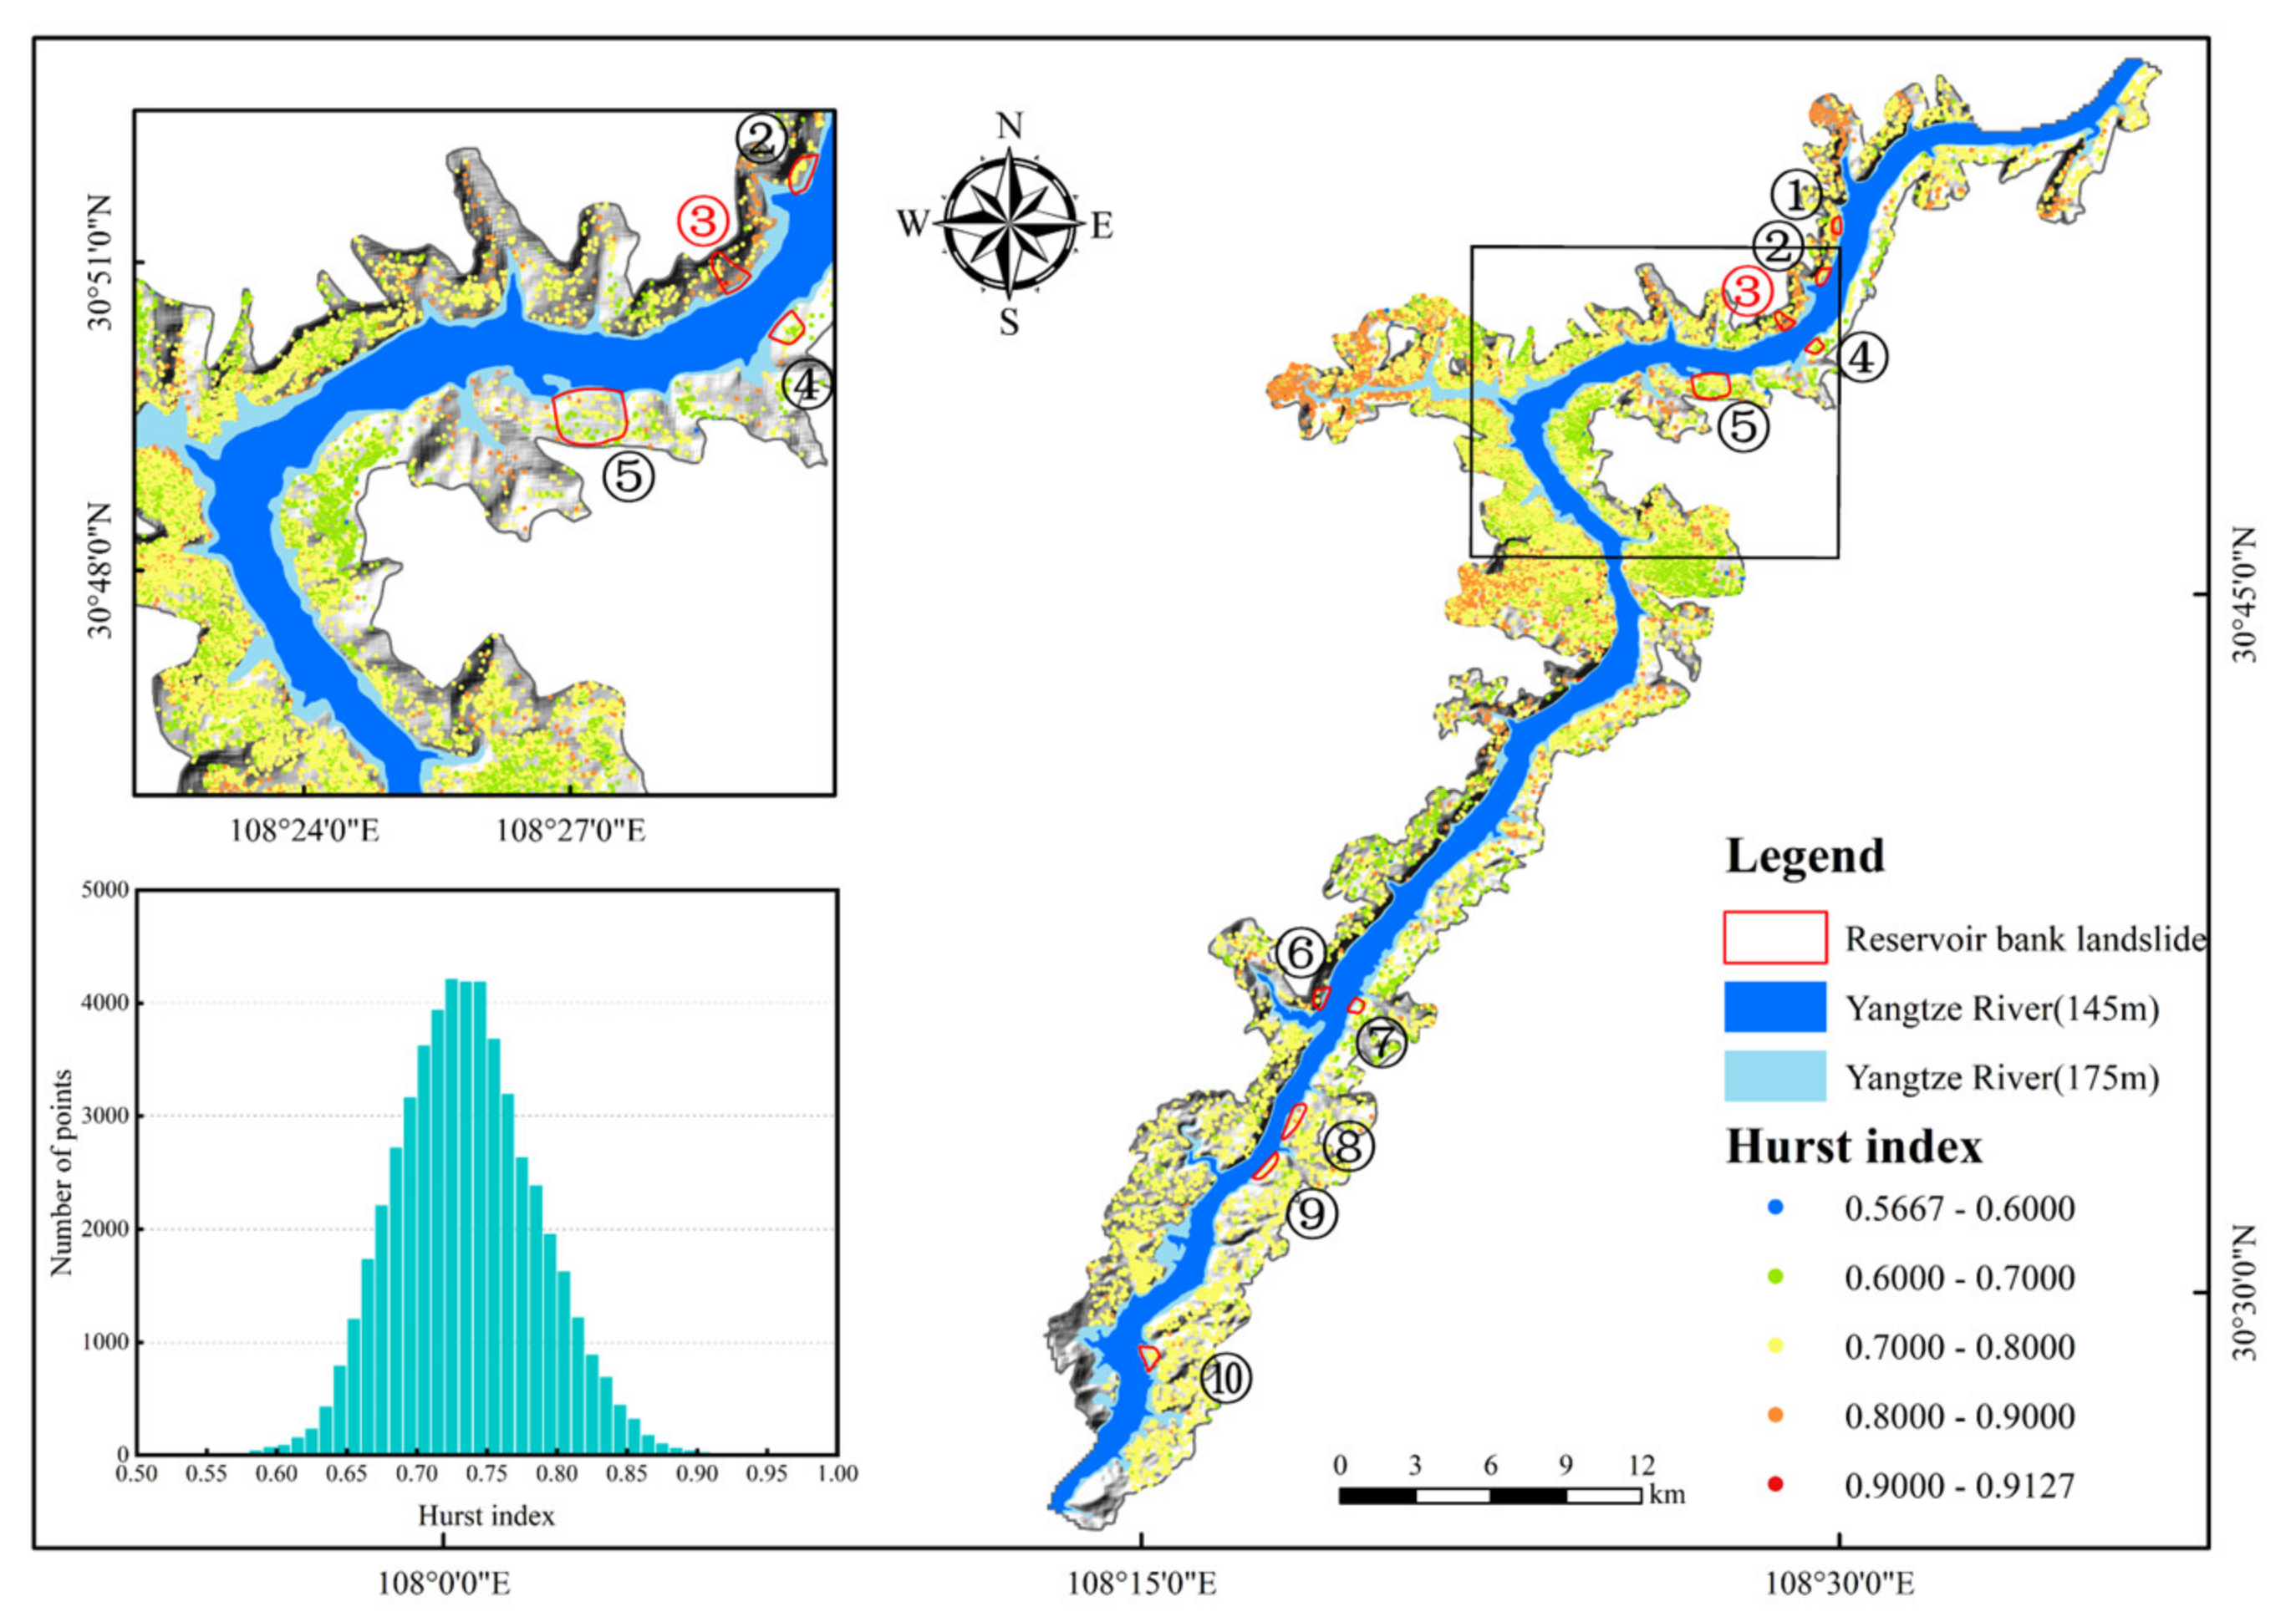
Based on the Time-Series InSAR results, the Hurst index of the time-series deformation was calculated for each measurement point. Then, the Hurst index values for the study area from 2018 to 2022 were obtained (Figure 6). The result showed that the Hurst index values of the study area obeyed a normal distribution, ranging from 0.5 to 1, with a concentrated distribution from 0.7 to 0.75, indicating that the current stable or active state of the slope in the study area will not change (Figure 6). The local Hurst index values of the Sifangbei landslide exceeded 0.9, and the overall values were between 0.7 and 0.9, indicating that the landslide will continue to maintain its current slow deformation state with strong persistence. The Hurst index values for the Laotangfang landslide, Sharentian landslide, Rangduchangbei landslide, and Jinjinzi landslide were between 0.7 and 0.9, while those for the Xiangjiaping landslide, Tangjiao landslide, Datangbang landslide, Wuchiba landslide, and Zhangjiacitang landslide were between 0.6 and 0.8. This indicates that the above landslides will continue to maintain their current slow deformation state but with relatively weak persistence.
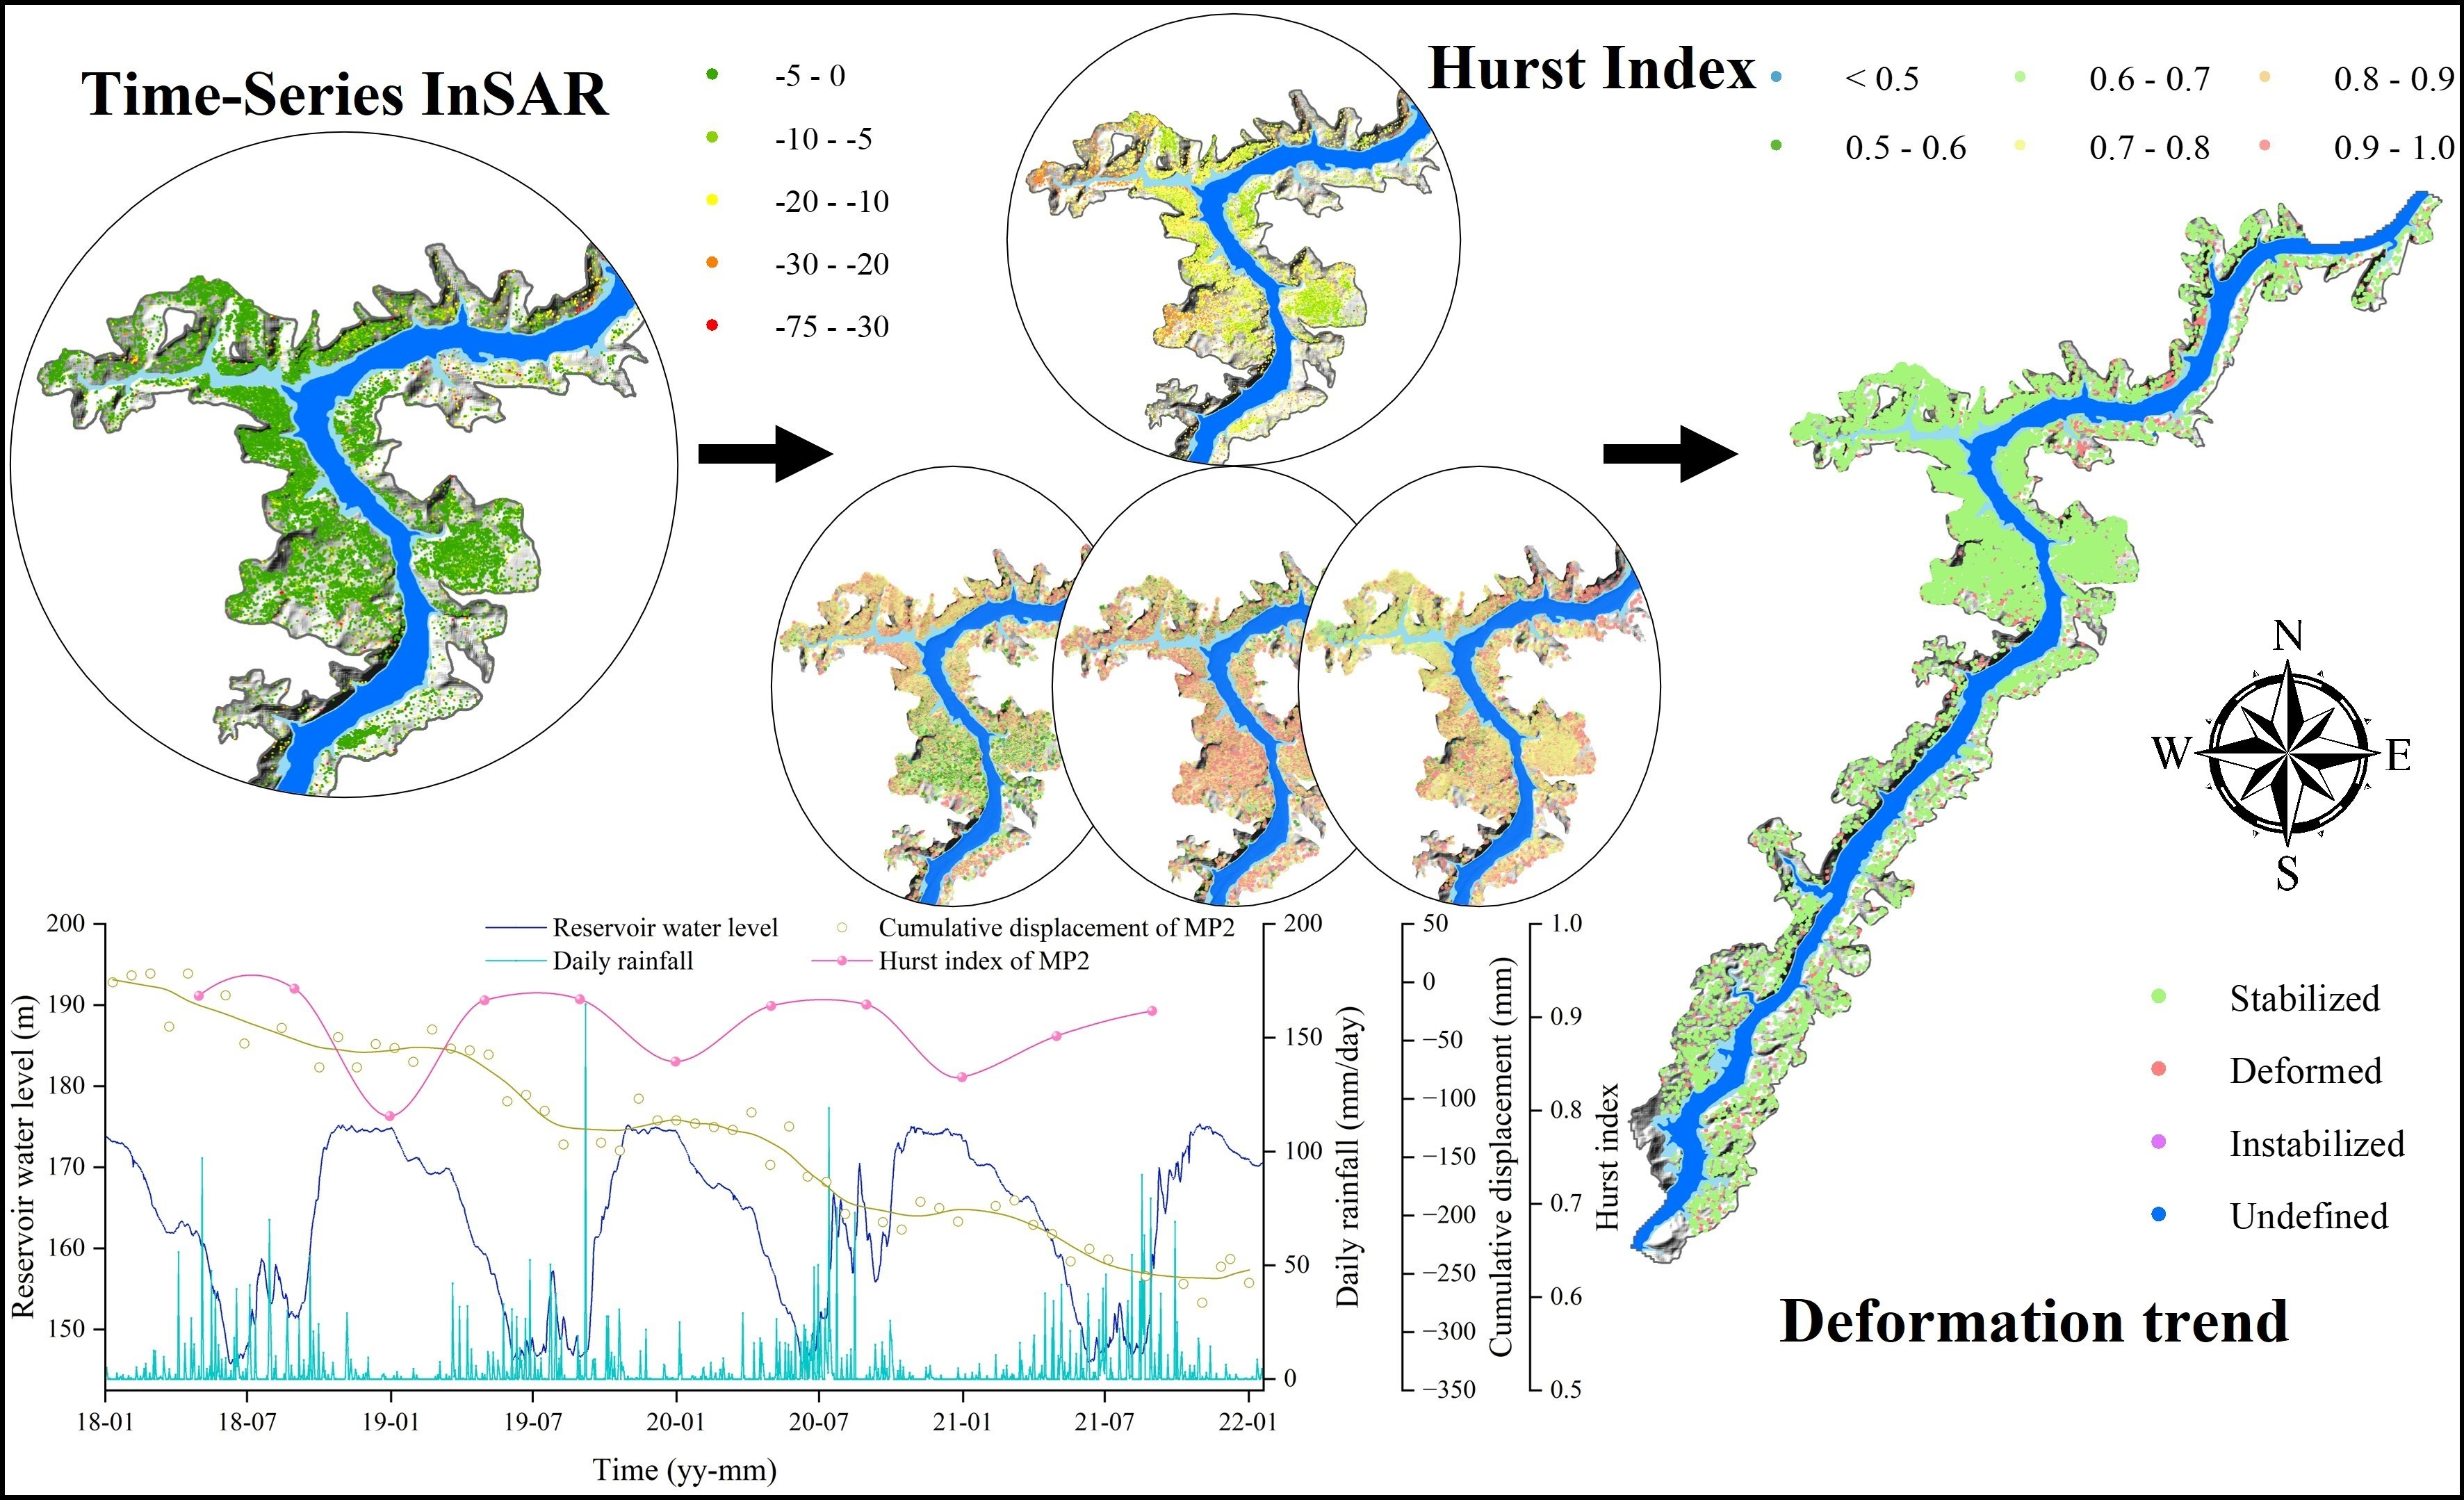
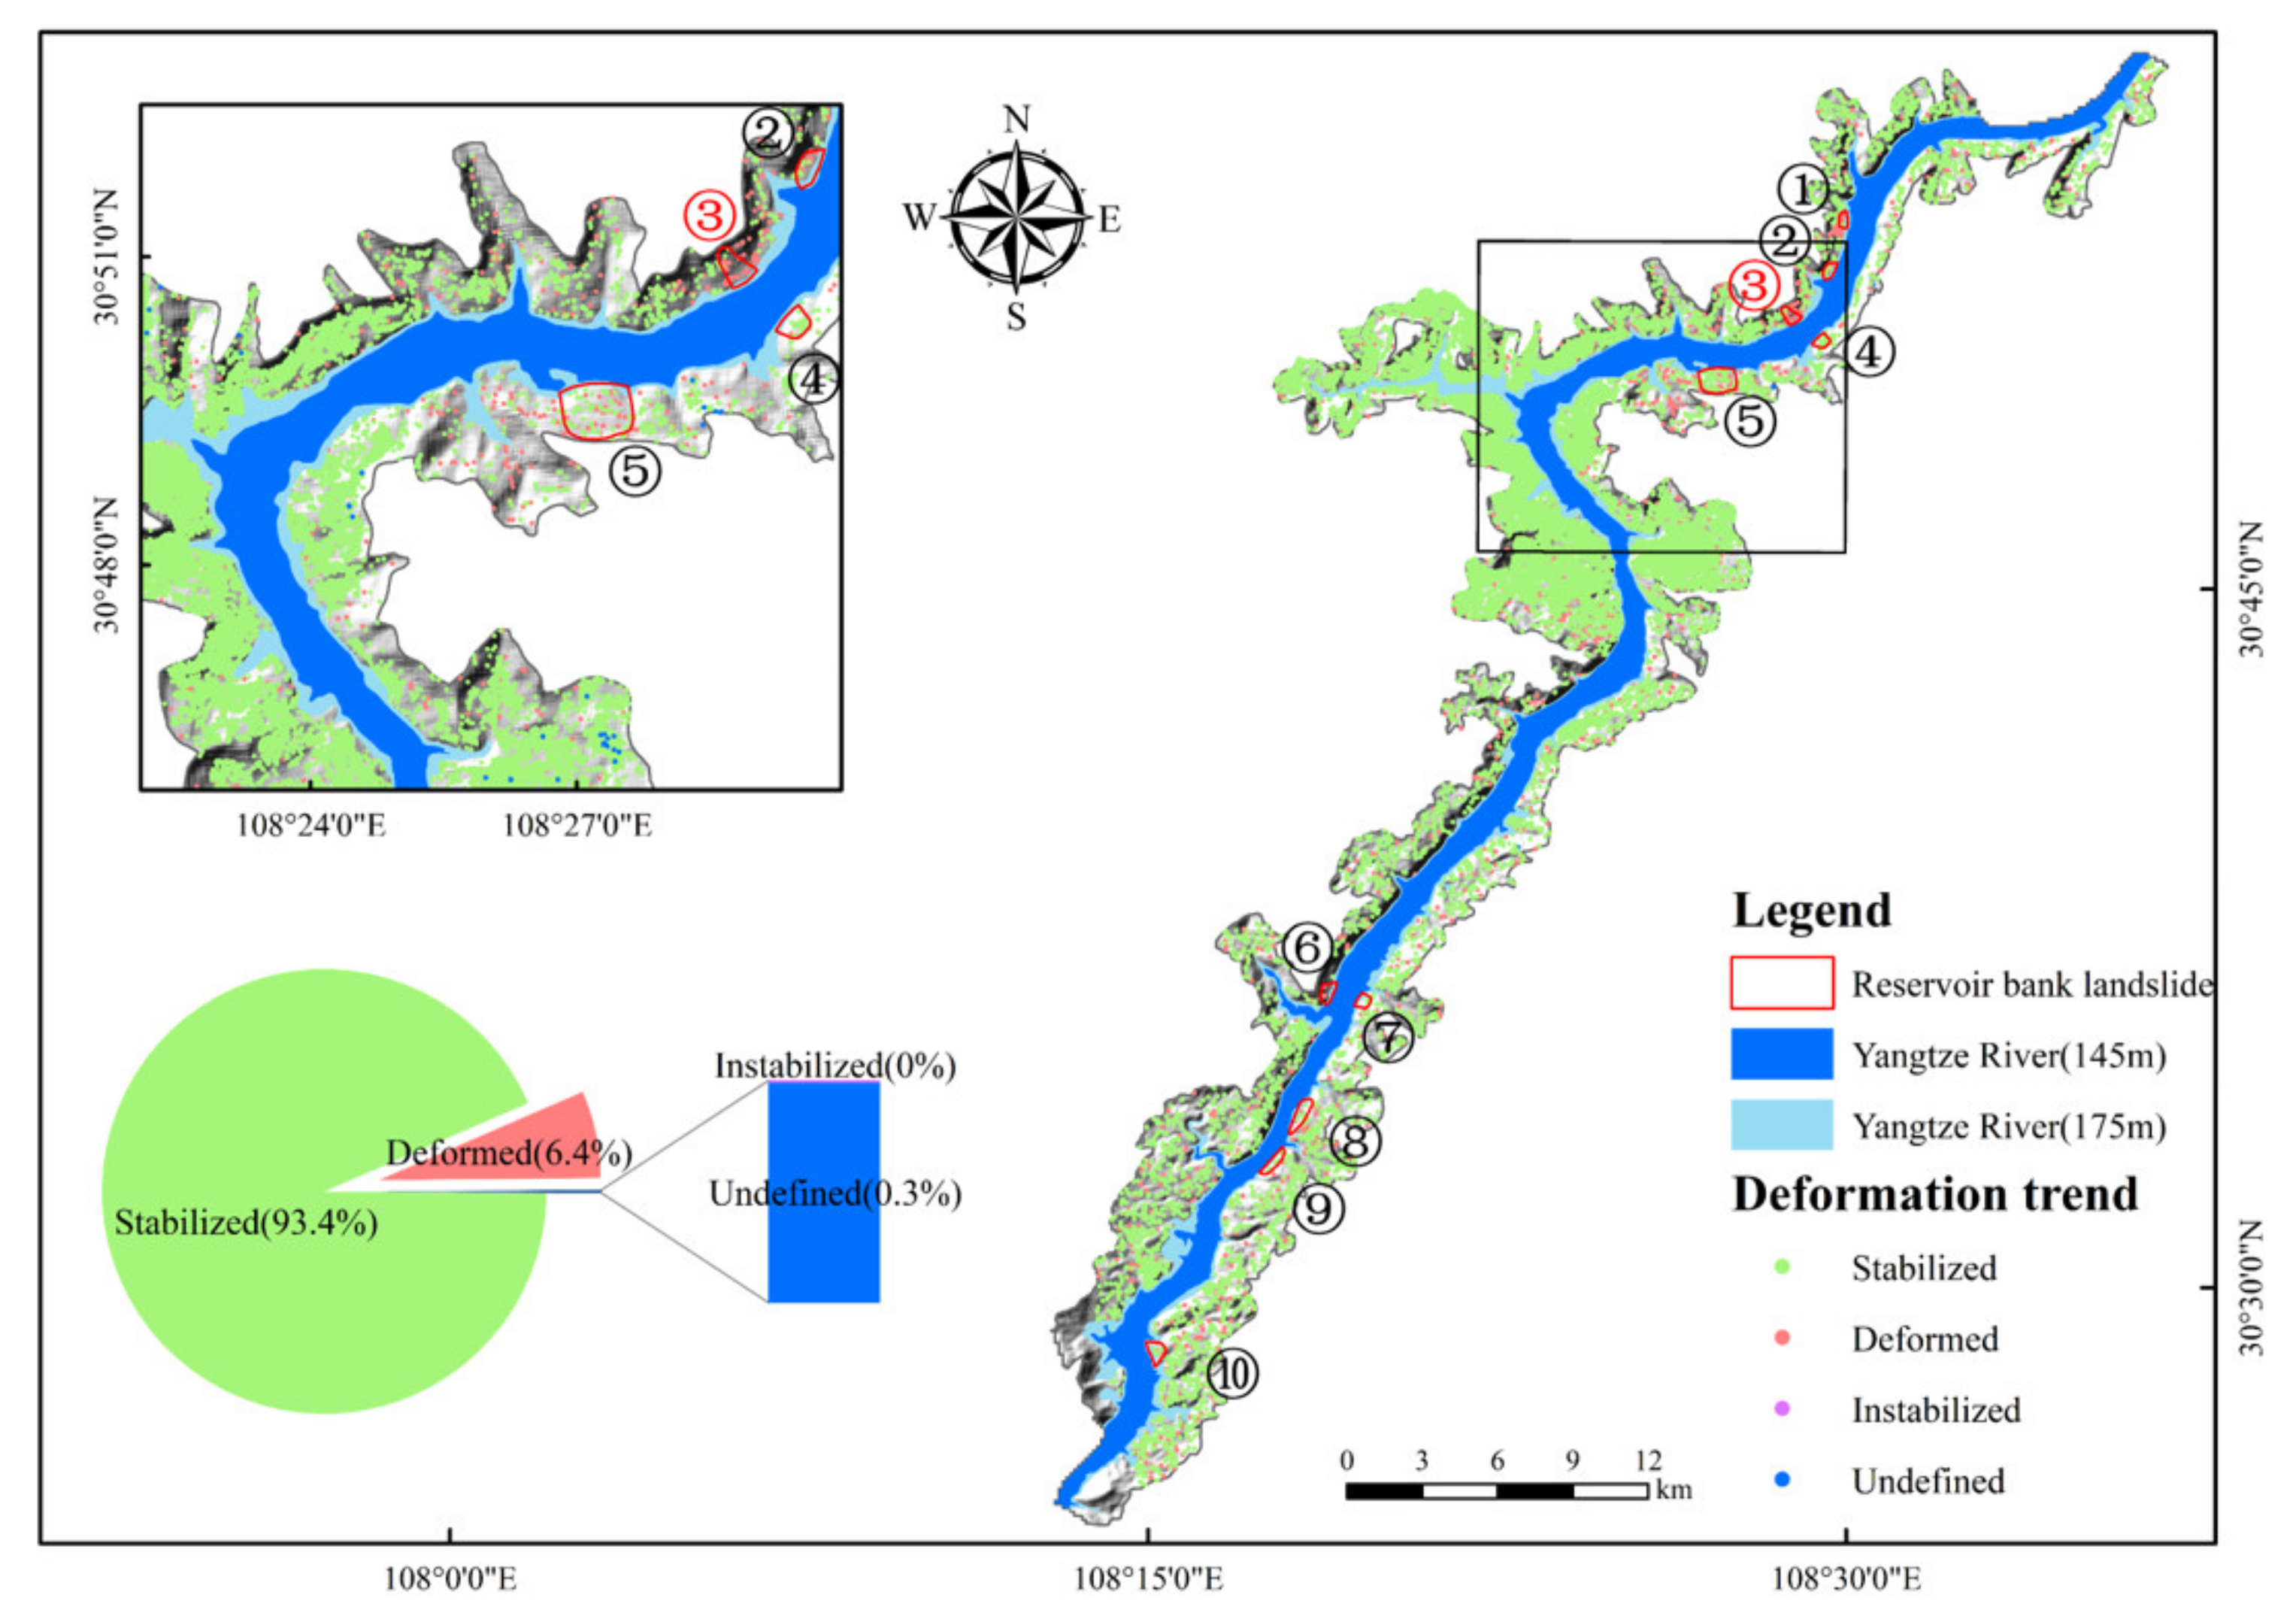
According to the method described in Section 3.4, combined with the slope deformation rate and Hurst index from 2018 to 2022, the spatial distribution of the slope deformation trend for the next 4 years was predicted (Figure 7). The results show that the deformation trend for a total of 48,921 measurement points was to remain stable, while 3328 measurement points will continue to deform. However, the deformation trend of 144 measurement points was undetermined. The future deformation trends of the slopes along the Yangtze River were very spatially uneven. The locations of continued deformation were concentrated on four known landslides in the north of the study area. The central and southern parts of the study area were mostly stable areas. Comparing the locations of the reservoir bank landslides, we can see that the Xiangjiaping landslide, Datangpang landslide, and Wuzhuba landslide are expected to remain stable over the next four years, while other active landslides will maintain their current state and continue to deform.
4.3. Deformation Trend Analysis of Sifangbei Landslide
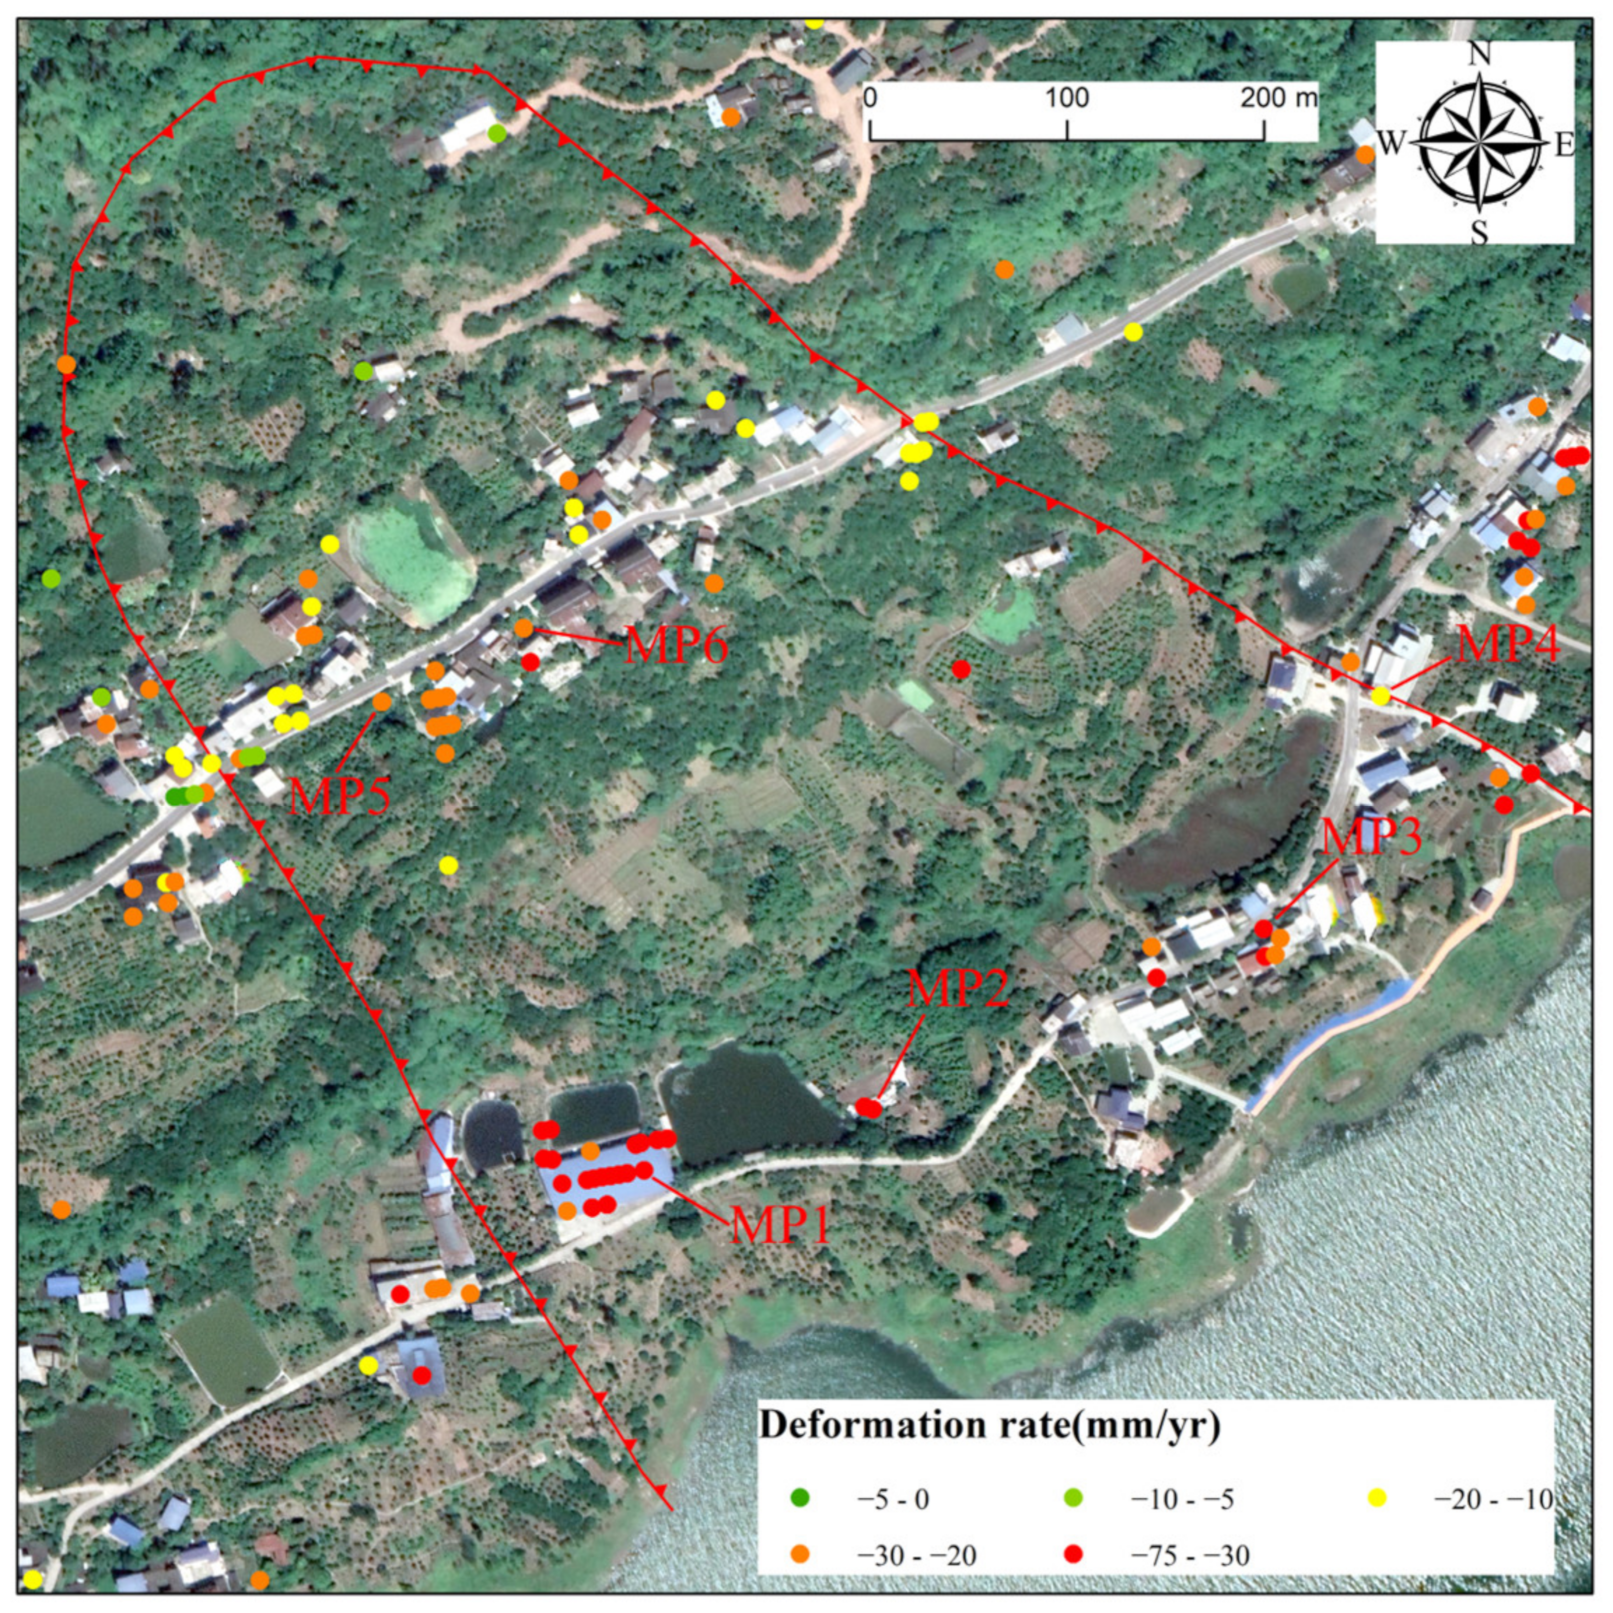
Figure 8 shows the spatial distribution and deformation rate of InSAR measurement points of the Sifangbei landslide. The front edge of the landslide is strongly deformed, with a deformation rate between −75 and −30 mm/yr, while the rear edge of the landslide deforms relatively slowly, with a deformation rate between −30 and −20 mm/yr. In the vertical landslide sliding direction, the central part of the landslide deforms most strongly, followed by the west side, while the east side deforms more slowly.
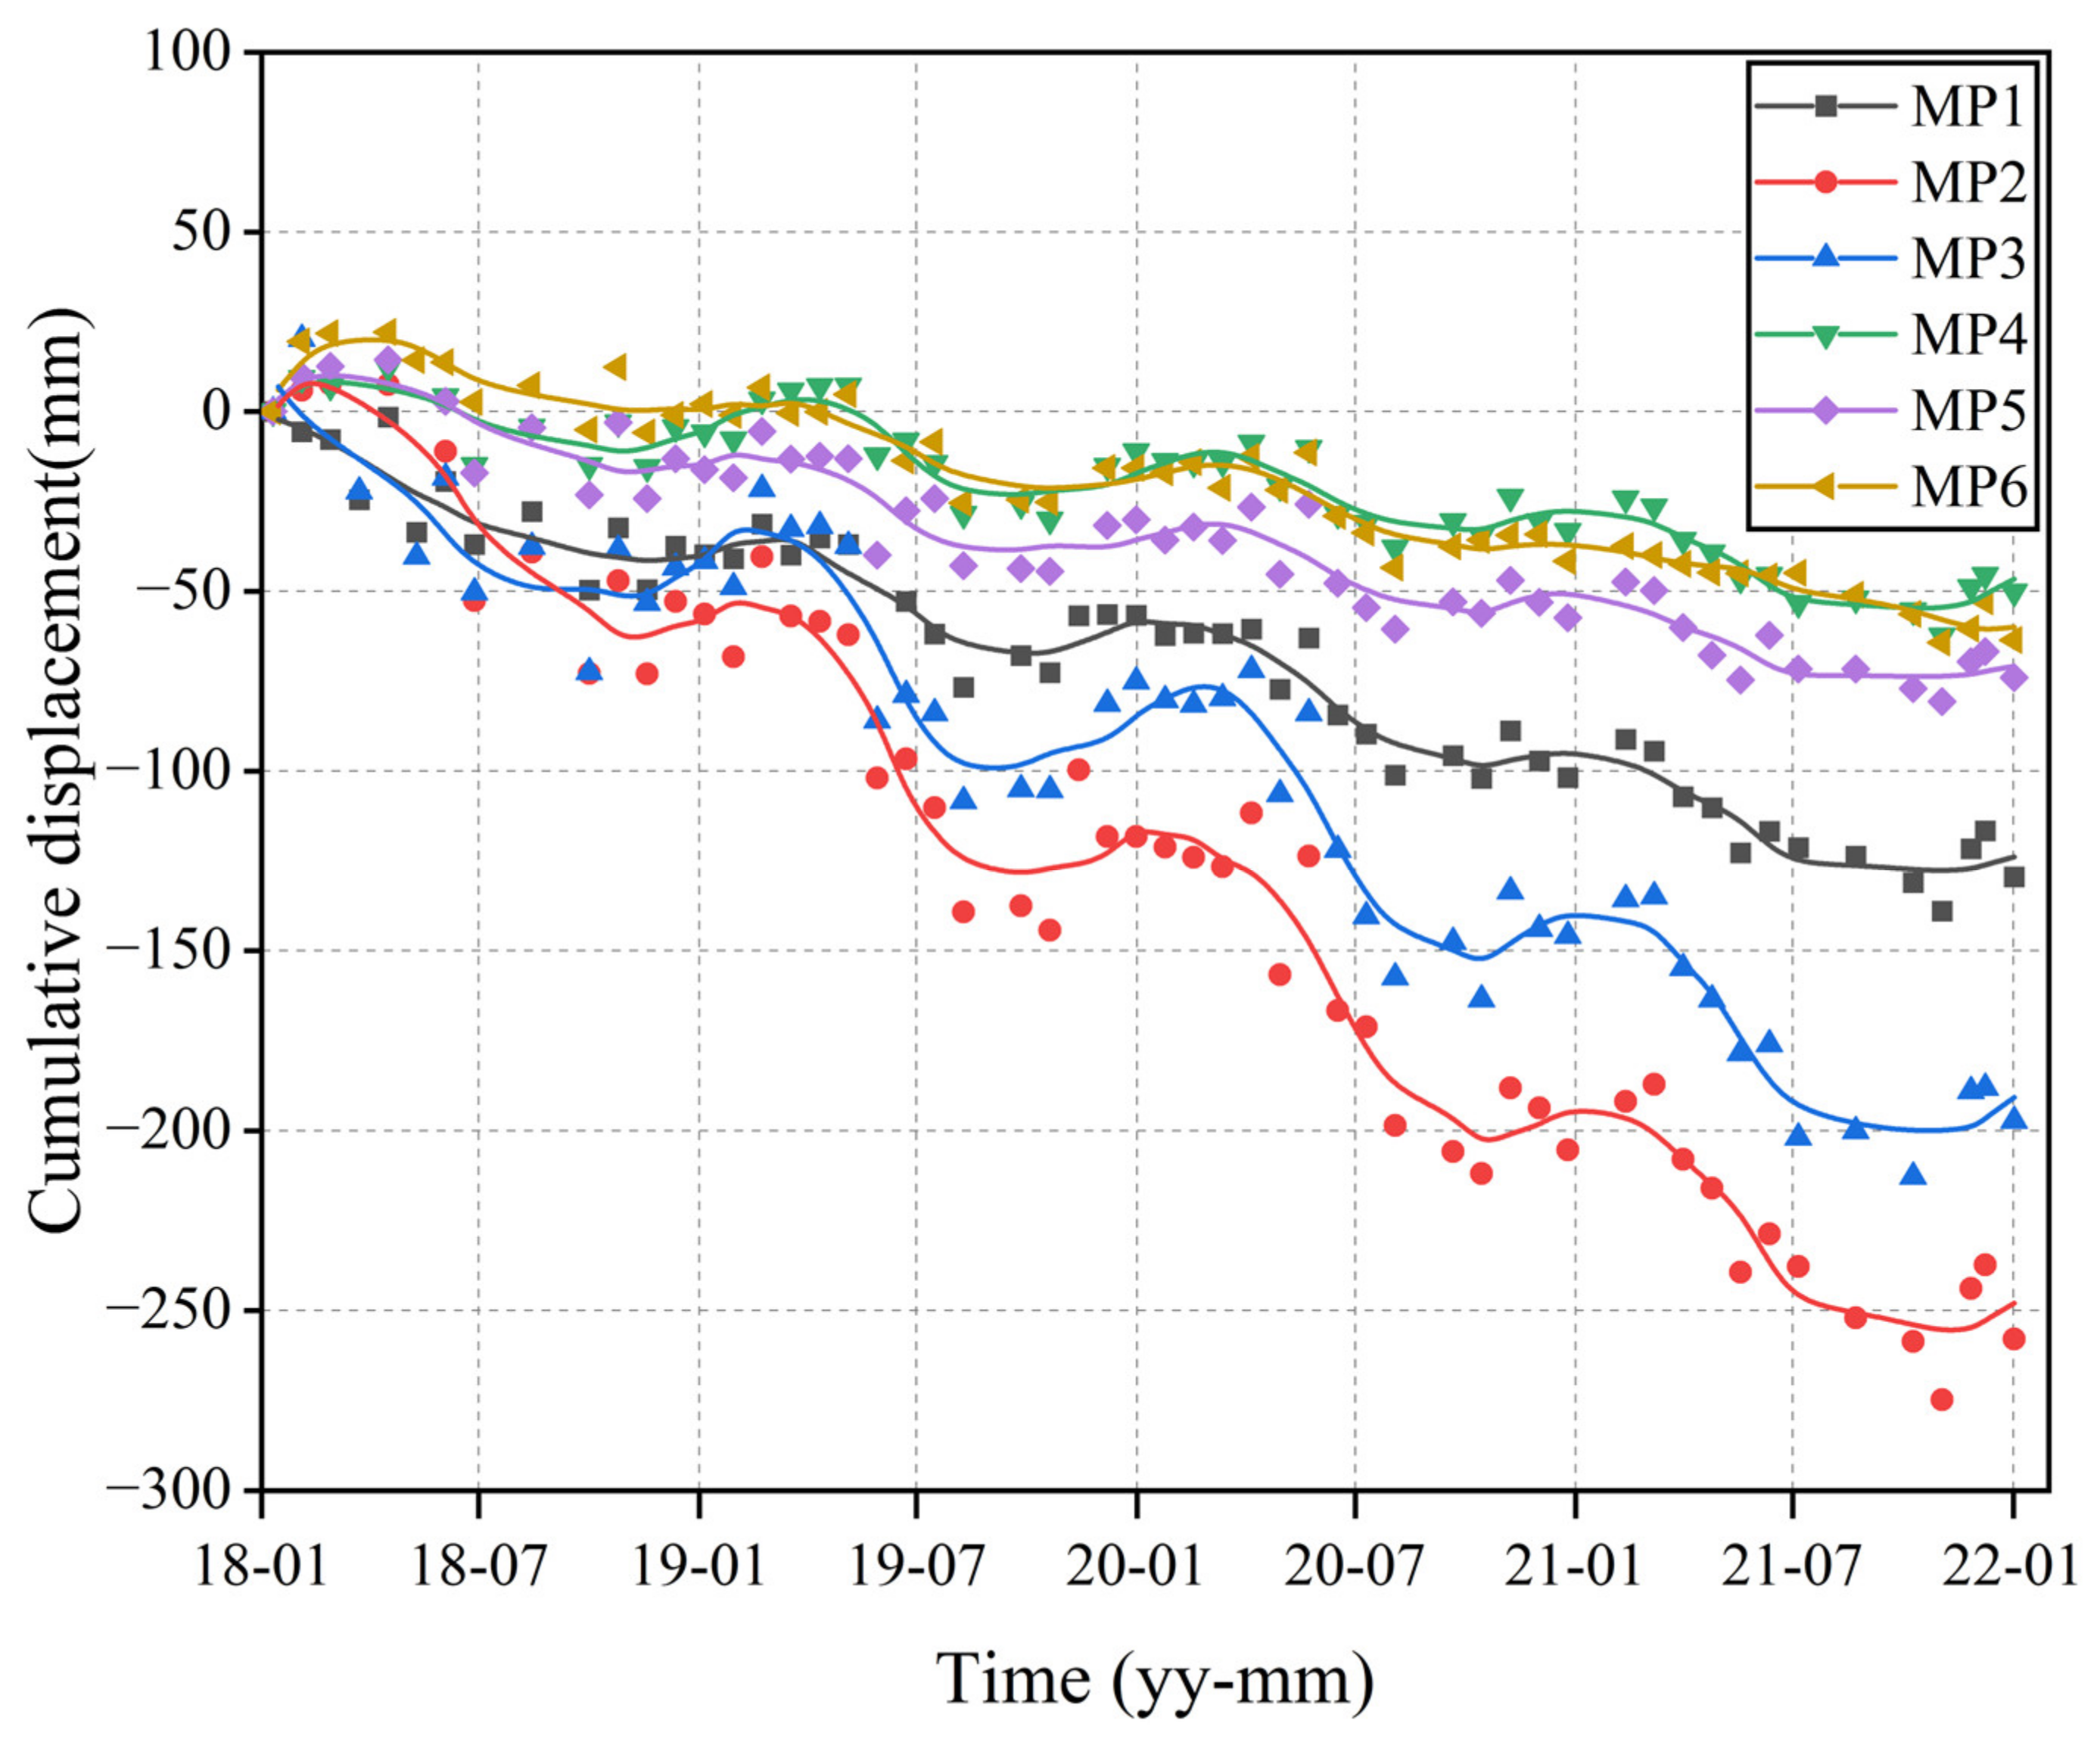
Some measurement points at different locations were selected to further analyze the spatial and temporal deformation characteristics of the Sifangbei landslide from 2018 to 2022 (Figure 8 and Figure 9). MP2 and MP3 are located in the middle of the front edge of the landslide (Figure 9) and present the most active movement, with a cumulative displacement of 250 mm. MP1 is located on the west side of the landslide front (Figure 9), with a relatively reduced cumulative displacement of this point (150 mm). MP4 is located on the east side of the landslide front, with a cumulative displacement of 50 mm (Figure 9). MP5 and MP6 are located in the east and middle of the rear edge of the landslide, respectively, with a cumulative displacement of about 80 mm (Figure 9). In addition, the cumulative displacement curves of the above-selected points all presented obvious stepwise characteristics, with the front edge of the landslide being more obvious than the rear edge. The reservoir water level starts to drop in March every year, and the rainfall gradually increases. Due to the lag effect, the cumulative displacement of the landslide increases greatly from May to June every year.
5. Discussion
5.1. Reliability Analysis of Slope Deformation Trend
In order to assess the reliability of the slope deformation trend characterized by the Hurst index and the predicted deformation trend, we analyzed the results from the following two aspects:
- (a)
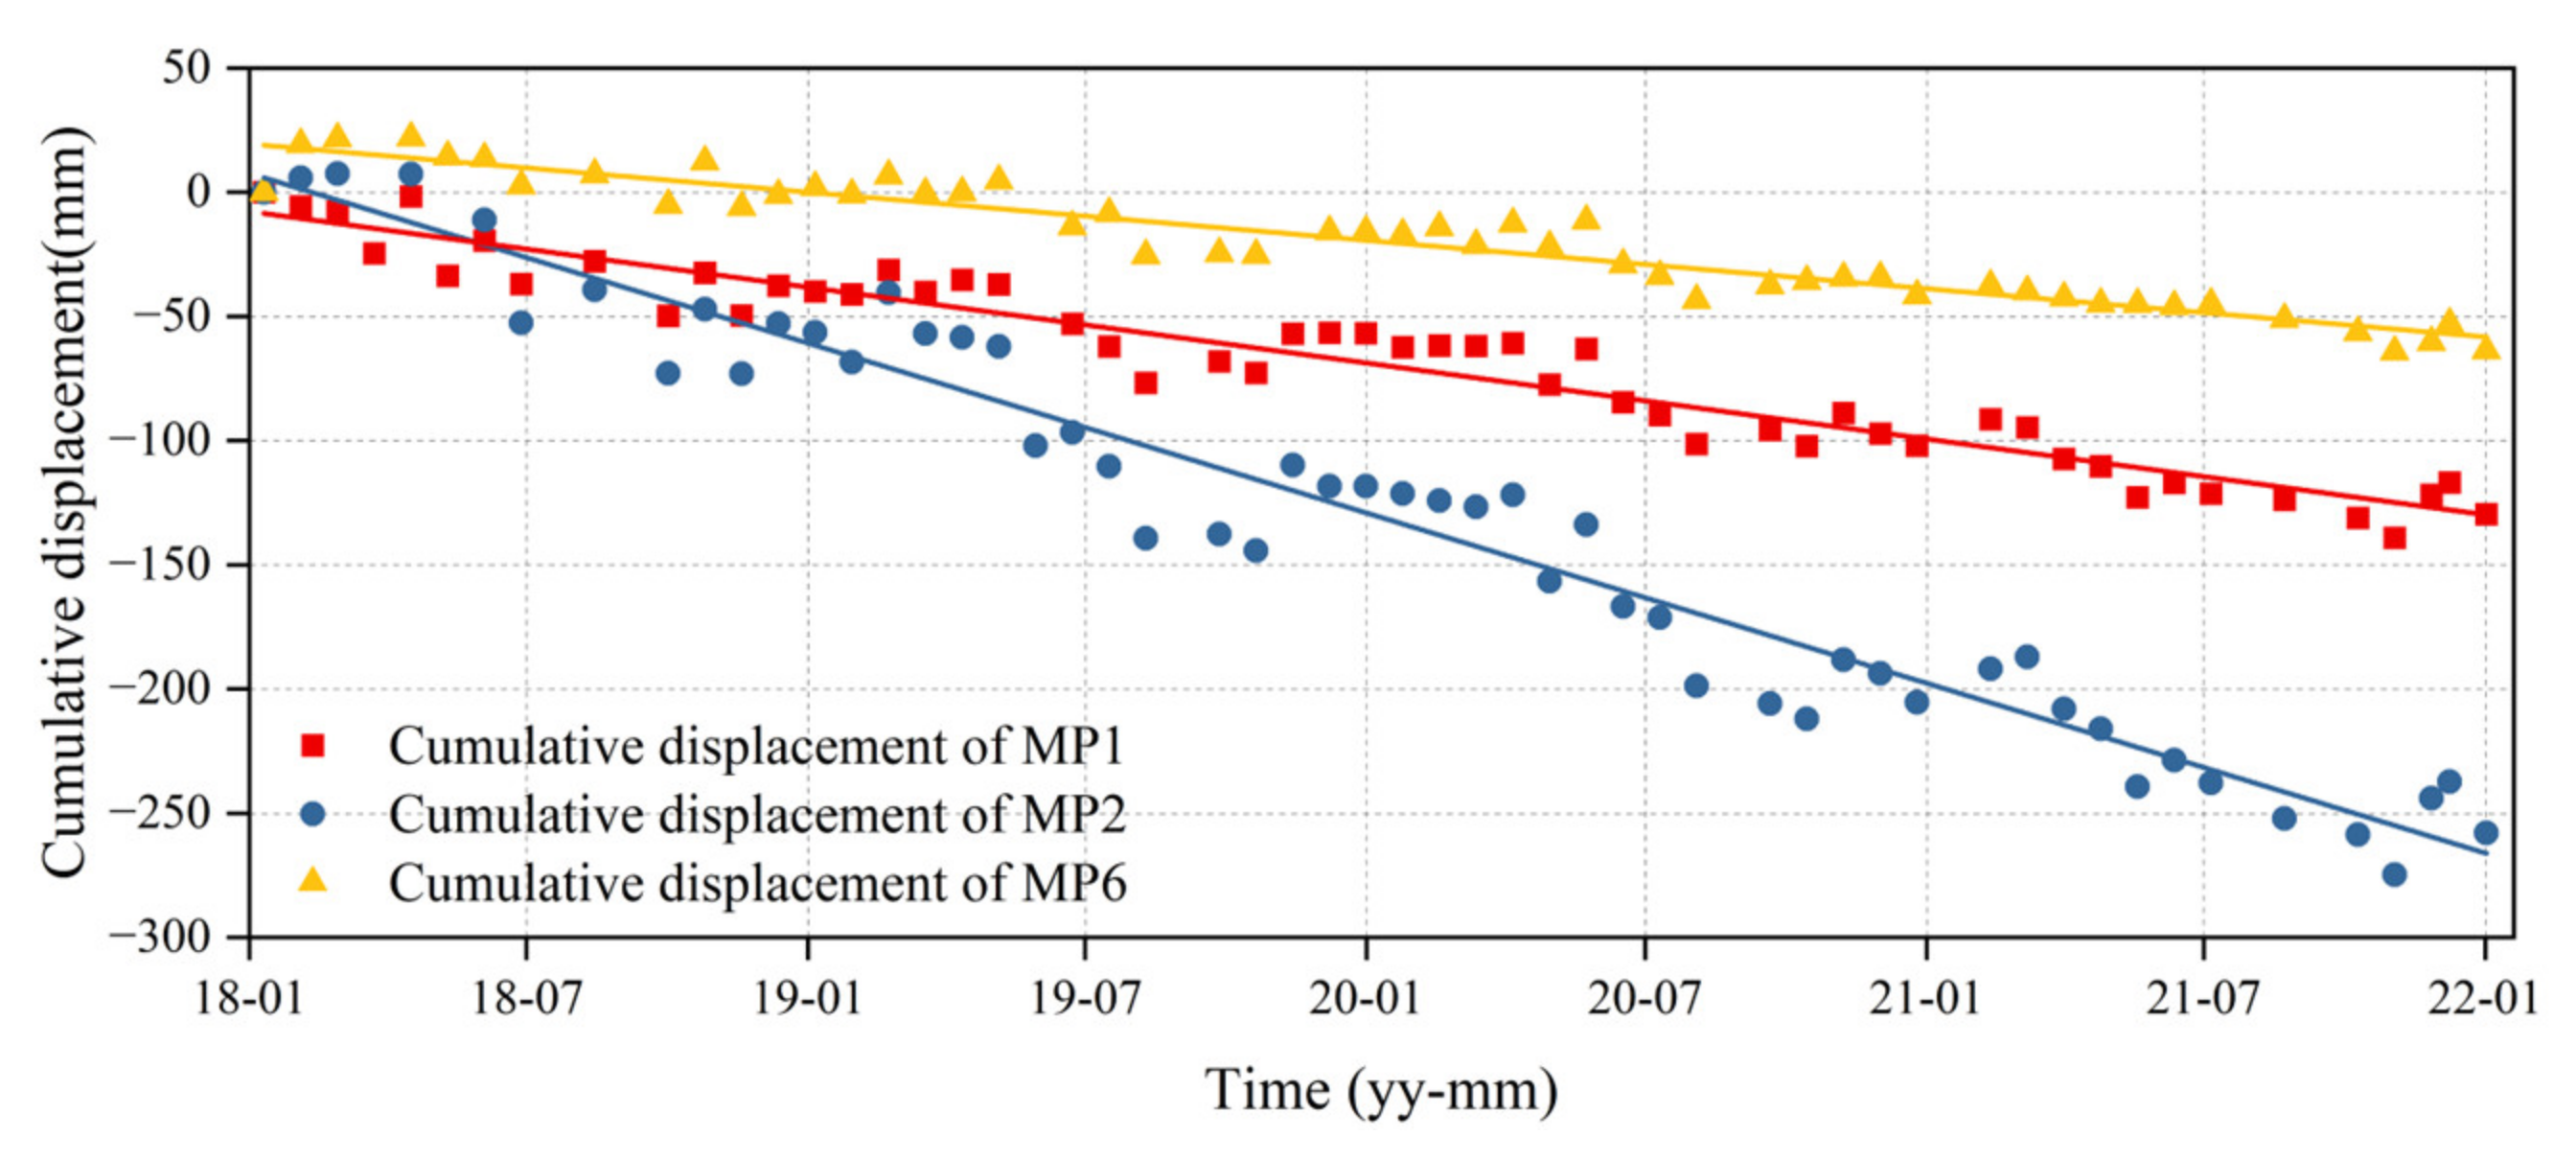
- Consistency between the strength of the deformation trend and the magnitude of the Hurst index at the Sifangbei landslide measurement points. The cumulative displacement curves and the corresponding Hurst index value at MP1, MP2, and MP6 are shown in Figure 10. We found that Hurst index values calculated using measurement points in different positions were different but presented a certain regularity. MP2 is at the leading edge of the Sifangbei landslide and had the largest cumulative deformation, with a corresponding Hurst index value of 0.8833. The cumulative deformation of MP1 and MP6 decreased in turn, and the trend line gradually slowed down, with corresponding Hurst index values of 0.8698 and 0.8082, respectively. Through comparison, it was found that the deformation trend of the measurement points was consistent with the Hurst index, which can, therefore, effectively represent the deformation trend of the landslide.
- (b)
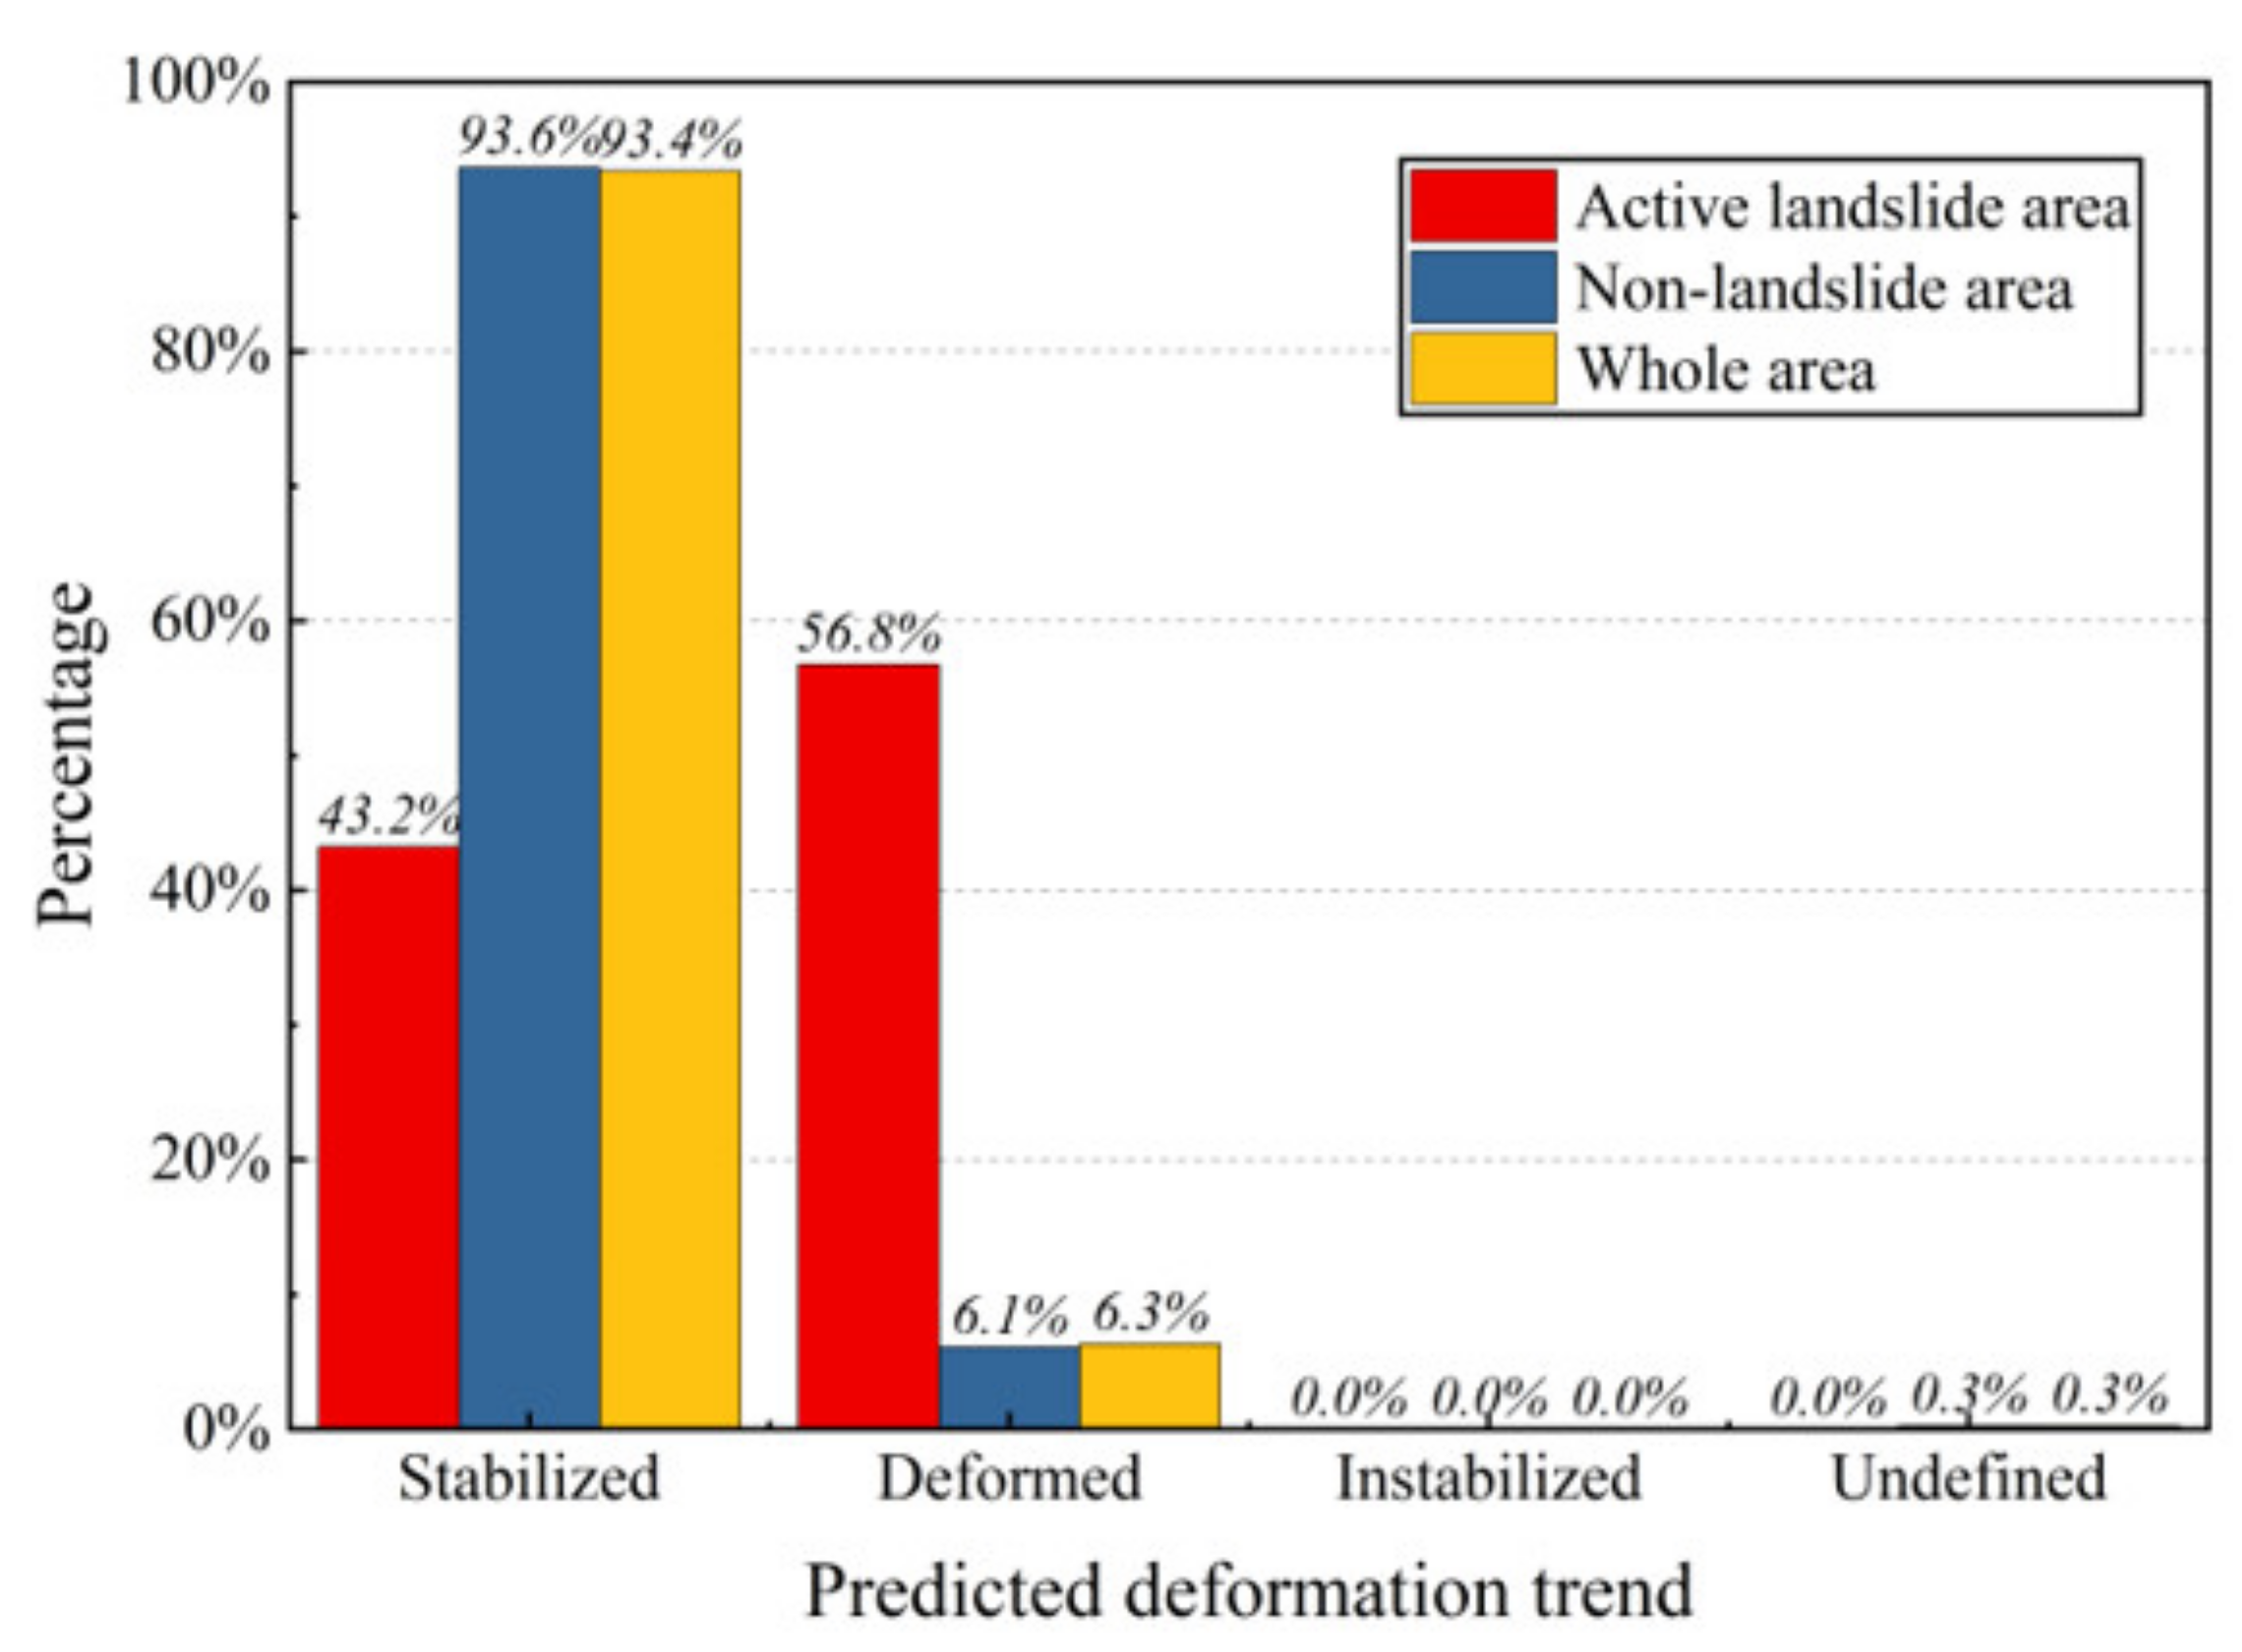
- Consistency between the predicted deformation trend percentage and the actual situation in the active landslide area and the non-landslide area. The percentages of the four deformation states predicted for the active landslide area and the non-landslide area were counted (Figure 11), and it was found that 93.7% of the non-landslide areas were stabilized, while the deformation areas only accounted for 6.1%. In the known active landslide areas, the stabilized and deformed areas accounted for 43.2% and 56.8%, respectively. From the collected data (Table 1), it can be seen that the deformation rates of the Datangbang landslide and the Wuzhuba landslide were low in 2021. The predicted results also indicated that they would gradually stabilize. The deformation ratio of the active landslide area to the non-landslide area was in line with the reality detailed in Table 1.
5.2. Spatial and Temporal Differences of Slope Deformation Trend
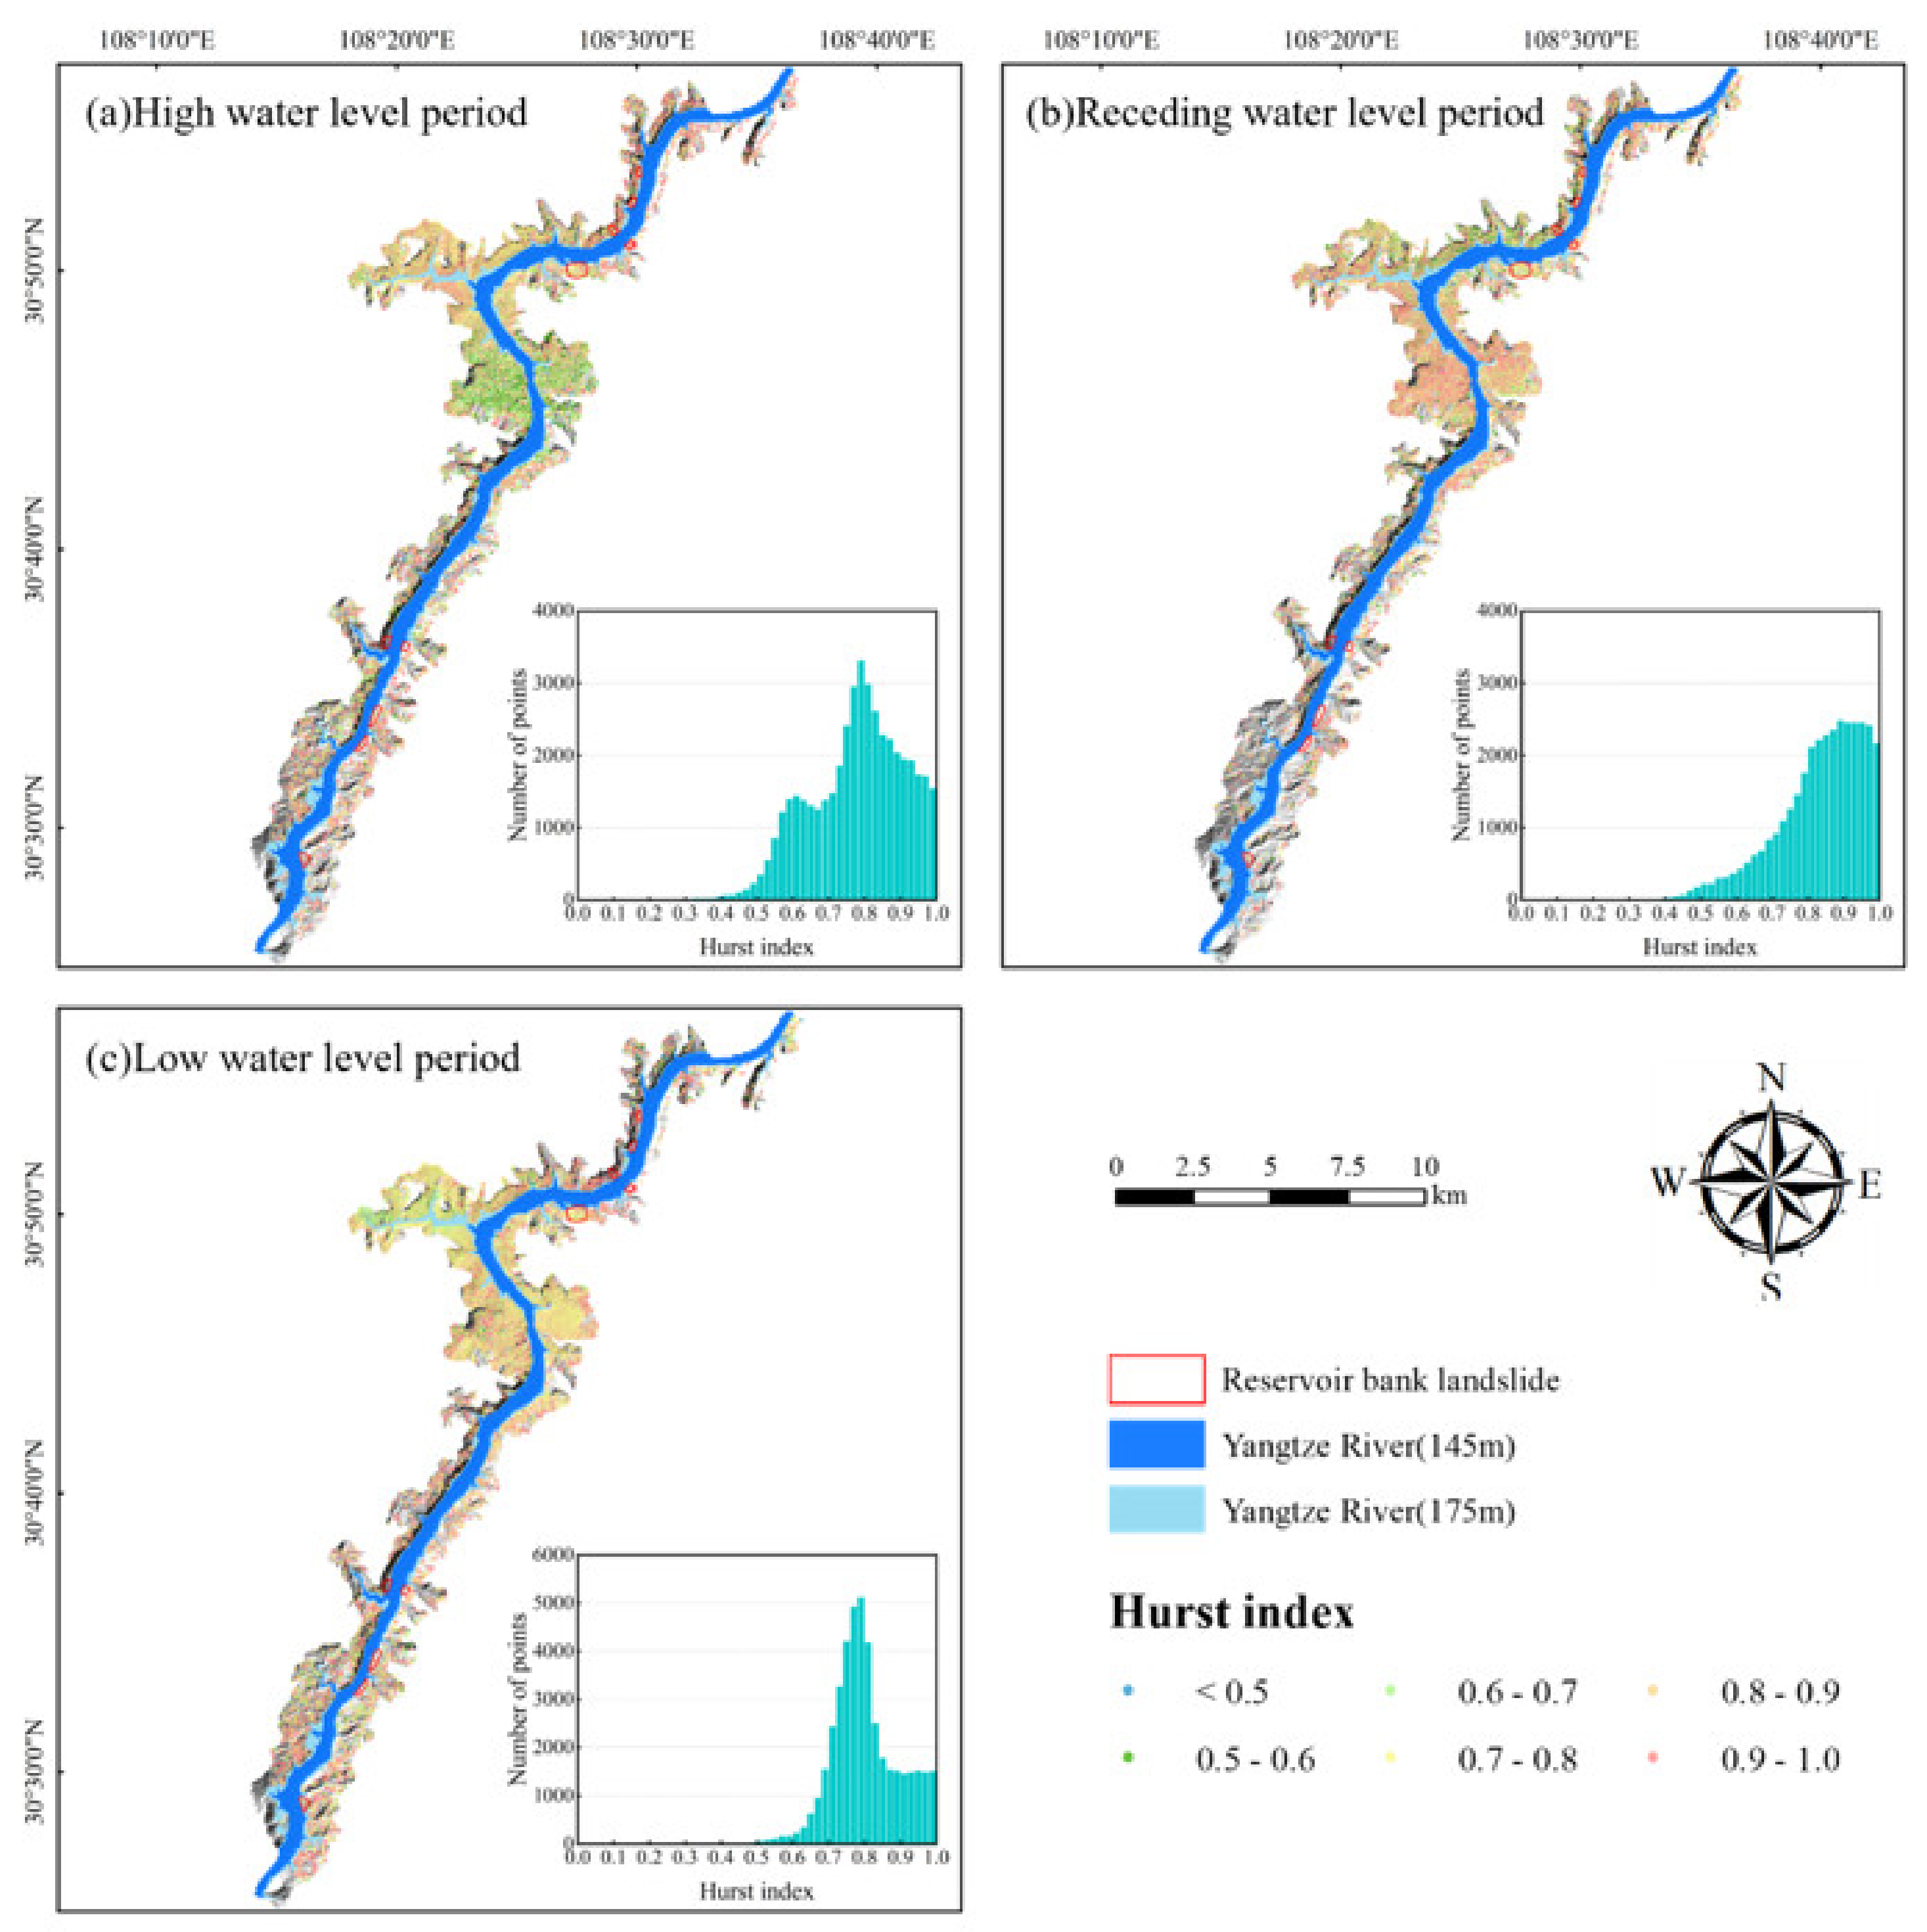
We found that the reservoir bank slopes at different water level periods and spatial locations tended to exhibit different deformation trends. Taking November 2020 to October 2021 as an example (Figure 12), the Hurst index varied obviously in time and space. The spatial distribution was uneven from the north to the south. This is because the material source in the northern part of the study area is sufficient, and the average thickness of the reservoir bank slope is larger (Table 1), while the southern slopes are generally steep. Therefore, different accumulation conditions have formed. Moreover, due to the special material composition and loose structure of the reservoir bank slope, the permeability is strong. Under the comprehensive influence of accumulation conditions and hydrological conditions, the deformation trend of the reservoir bank slope presented obvious spatial differences.
As can be seen from Figure 12, the distribution of Hurst index values in different water level periods showed obvious differences: The mean values in the high water level period, receding water level period, and low water level period were 0.77, 0.83, and 0.80, respectively, while the median values in the high water level period, receding water level period, and low water level period were 0.79, 0.85, and 0.78, respectively. The Hurst index of the whole study area increased first and then decreased. Under the influence of rainfall and reservoir water level, the deformation trend of reservoir bank slopes showed obvious temporal differences. Therefore, short-term deformation trend prediction often leads to the illusion that the deformation is slowing down or intensifying. As such, we believe that the prediction of the reservoir bank landslide deformation trend should be based on long time series. In addition, the selection of time-series data is very important.
5.3. Relationship between Landslide Deformation Trend and Influencing Factors
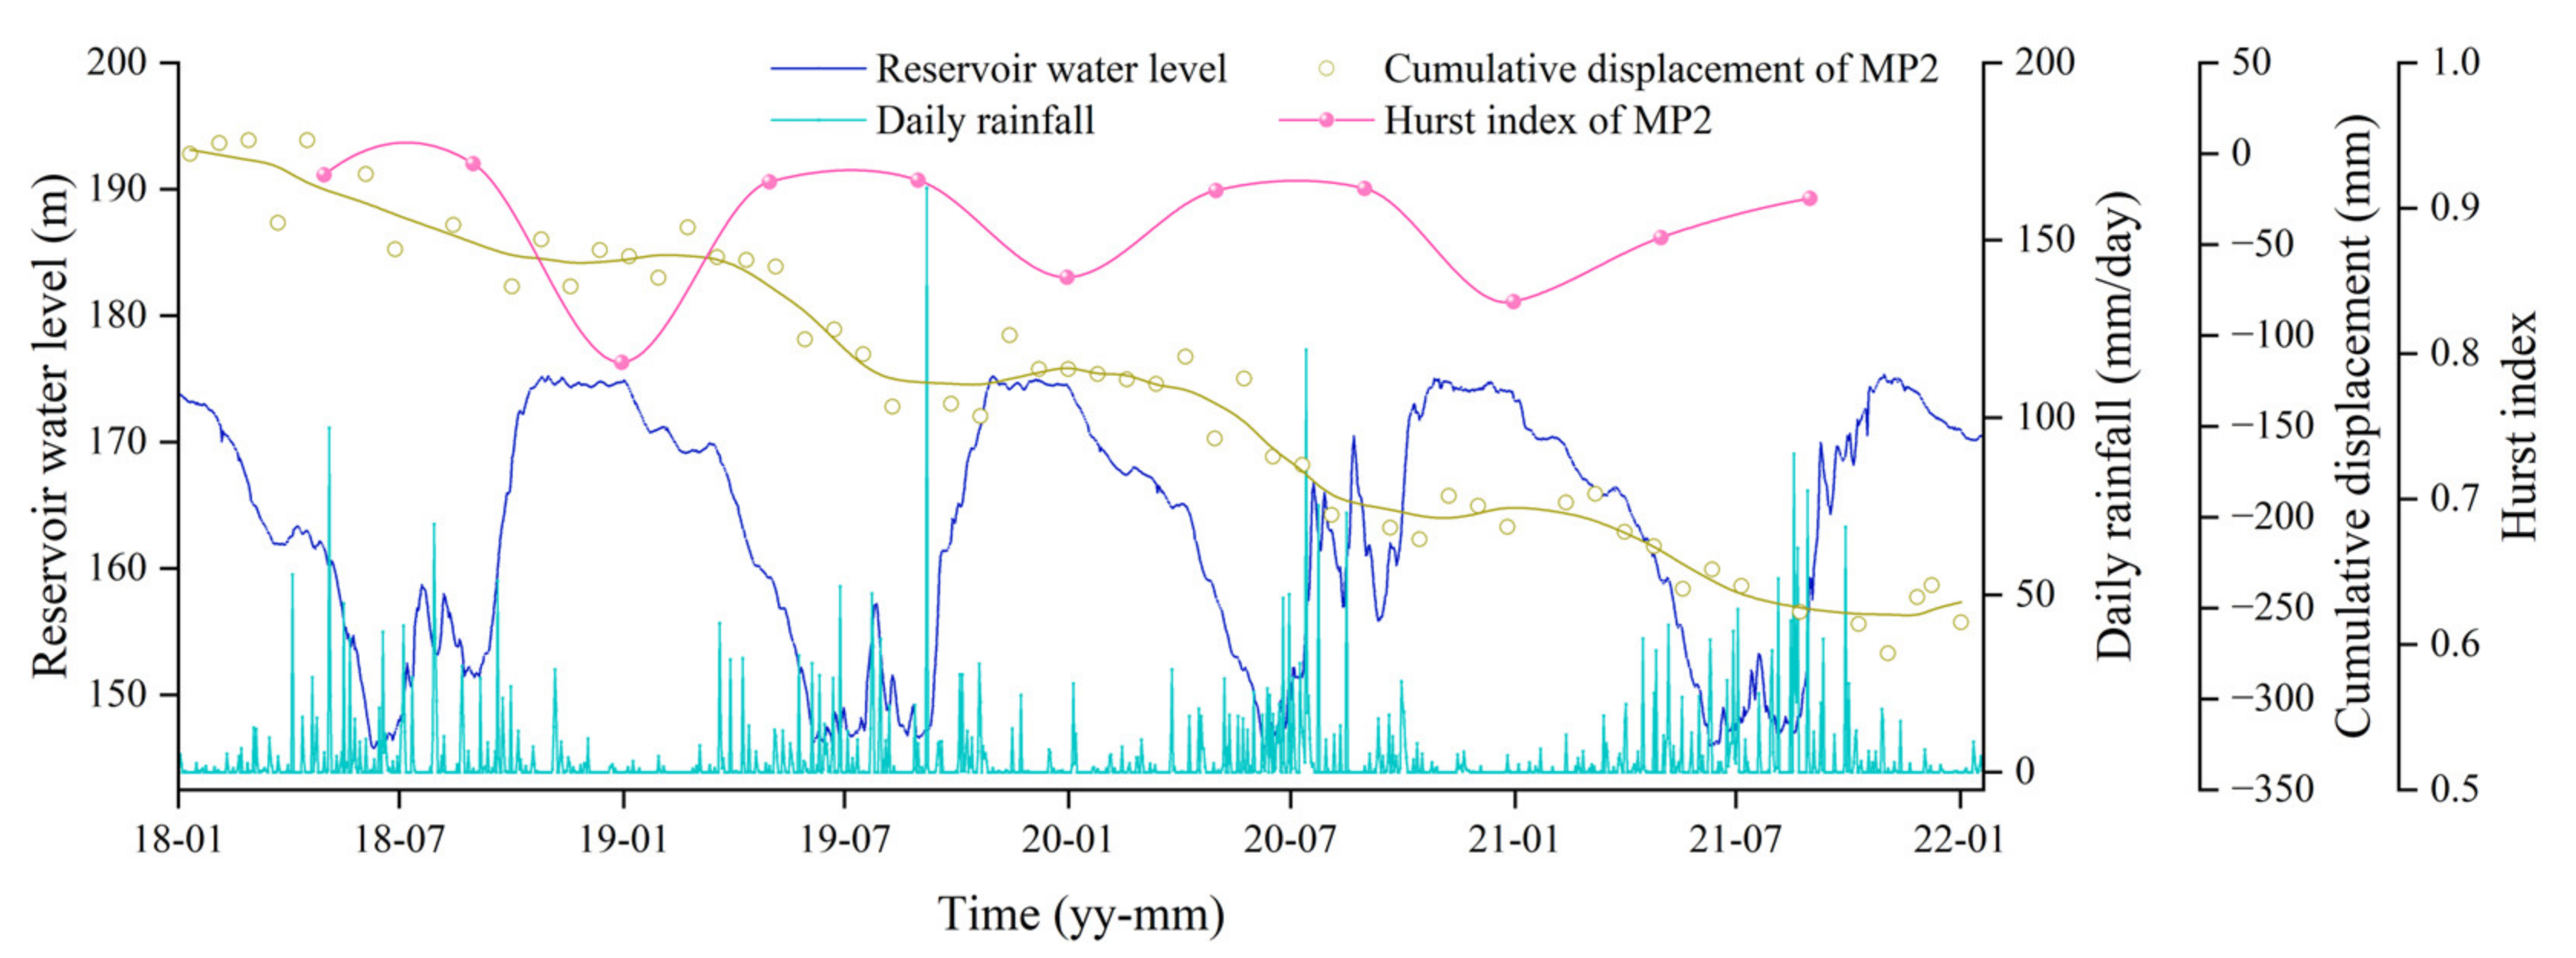
Figure 13 shows the cumulative displacement curve and Hurst index value for the MP2 measurement point on the Sifangbei landslide under different water level periods and rainfall. Comparing the cumulative displacement curve of landslide with the change curve of Hurst value. We found that when the water level dropped, landslide deformation increased, and the Hurst index value was greater than 0.9. Therefore, the landslide will continue to deform in its current state, and the deformation will be very persistent. When the water level is high, landslide deformation decreases, and the Hurst index value decreases to about 0.8. In this case, the landslide will continue to deform in its current state, but the deformation will be less persistent. From the above, it can be seen that the landslide is deformed during the periods in which the water level drops and when the water level is high, where the decrease in water level has a greater impact on the deformation trend. In addition, with the change in reservoir water level and rainfall, the landslide deformation showed obvious stepwise characteristics and a certain degree of lag. The reservoir water level drops from March to June every year, while landslide deformation increases obviously from May to June, with a displacement of 50 to 60 mm. In summary, the deformation trend of reservoir bank landslides has strong correlations with reservoir water level and rainfall. Reservoir bank landslides are still deformed when the reservoir water level and rainfall do not change; however, when the reservoir water level changes or concentrated rainfall occurs, the deformation of the reservoir bank landslide will obviously intensify. As such, changes in reservoir water level and/or concentrated rainfall play roles similar to a “catalyst”.
5.4. Limitations and Prospects
For this study, we completed deformation monitoring and trend analysis of reservoir bank landslides in Wanzhou District. In addition, the deformation trends of reservoir bank slopes for the next four years were predicted. However, we should note certain limitations: (1) The LOS direction deformation obtained by Time-Series InSAR is one-dimensional. With the increase in multi-source remote sensing data, it will be an inevitable trend to realize the extraction of three-dimensional landslide deformation information; (2) both InSAR and Hurst index processing requires a lot of computation. In practical applications, it would be better to improve the performance of the device and consider implementing intelligent extraction; and (3) combining massive SAR data with deep learning and data mining may achieve better intelligent identification and prediction of large area hazards. This is expected to be an exploration direction closely affecting the livelihood of many people, but there is still a long way to go.
6. Conclusions
In this study, Time-Series InSAR and the Hurst index were utilized to achieve deformation monitoring and trend analysis of reservoir bank slopes. According to the statistical distribution of the deformation rate and the physical significance of the Hurst index, an effective reservoir bank slope deformation trend prediction method was proposed. In order to verify the reliability of the regional results, the Sifangbei landslide was taken as a representative case. It was found that when the water level drops, landslide deformation intensifies, the deformation trend strengthens, and the Hurst index value becomes larger. At a high-water level, landslide deformation slows down, the deformation trend weakens, and the Hurst index value becomes smaller. Overall, the deformation trend is highly consistent with the Hurst index.
The reservoir bank slope deformation trend presented obvious spatial and temporal differences, with an uneven distribution from north to south in space and with changes in the reservoir water level and rainfall in time. This is presumed to be related to the regional geological structure, topography, hydrology, material composition, and loose structure of the slope itself. In addition, the landslides along the Yangtze River in Wanzhou District show obvious stepwise characteristics and a certain degree of lag. The reservoir water level and concentrated rainfall play roles that are similar to that of a “catalyst”.
According to the field investigation and GPS verification, we found that the analysis method combining Time-Series InSAR and the Hurst index has high reliability. In addition, it is important to select the appropriate length of time-series data, which can effectively reduce the false positive misjudgment of deformation curves due to local mutation. Time-Series InSAR has the advantage of massive data, while the Hurst index can detect abnormalities in time-series data. In conclusion, combining Time-Series InSAR and the Hurst index can allow for the deformation monitoring and trend prediction of reservoir bank slopes, providing new ideas and solutions for hazard prevention and mitigation in reservoir areas.
Author Contributions
L.C. provided full guidance on experimental processing and manuscript writing. X.Z. processed the dataset, carried out the analysis, and wrote the original draft of this manuscript. C.Z. revised and improved this manuscript. All authors contributed to the study conception and design. All authors have read and agreed to the published version of the manuscript.
Funding
This research is supported by the project “Studies on spatial–temporal differences in large accumulation landslide deformation and its vulnerability model for buildings in the Three Gorges reservoir” (grant no. 41877525), which is financed by the National Natural Science Foundation of China.
Data Availability Statement
The Sentinel-1A images and precise orbit data were provided by the European Space Agency. The GACOS data were provided by Generic Atmospheric Correction Online Service for InSAR. The SRTM DEM was provided by the National Aeronautics and Space Administration. The 0.5 m optical image was collected by 91 Satellite Map. We thank the Geological Environment Monitoring Master Station of Chongqing for providing GPS data and detailed information of 10 reservoir bank landslides. The data ere not available online. If readers want to have the data, they can request it by e-mail from the authors.
Acknowledgments
We thank the reviewers for their suggestions that improved the quality of this paper. We thank Qin Chen and Kaiqiang Zhang for their help in data collection. We thank Shilin Zhu, Jingsong Chen, Lei Huang, and other laboratory colleagues for their help in field surveys.
Conflicts of Interest
The authors declare that they have no known competing financial interest or personal relationship that could have appeared to influence the work reported in this paper.
References
- Schuster, R.L. Reservoir-induced landslides. Bull. Int. Assoc. Eng. Geol. 1979, 20, 8–15. [Google Scholar] [CrossRef]
- Reyes-Carmona, C.; Barra, A.; Galve, J.; Monserrat, O.; Pérez-Peña, J.; Mateos, R.; Notti, D.; Ruano, P.; Millares, A.; López-Vinielles, J.; et al. Sentinel-1 DInSAR for monitoring active landslides in critical infrastructures: The case of the rules reservoir (Southern Spain). Remote Sens. 2020, 12, 809. [Google Scholar] [CrossRef] [Green Version]
- Li, Y.; Chen, L.; Yin, K.; Zhang, Y.; Gui, L. Quantitative risk analysis of the hazard chain triggered by a landslide and the generated tsunami in the three gorges reservoir area. Landslides 2021, 18, 667–680. [Google Scholar] [CrossRef]
- Ouyang, C.; An, H.; Zhou, S.; Wang, Z.; Su, P.; Wang, D.; Cheng, D.; She, J. Insights from the failure and dynamic characteristics of two sequential landslides at Baige Village along the Jinsha River, China. Landslides 2019, 16, 1397–1414. [Google Scholar] [CrossRef]
- Froude, M.J.; Petley, D.N. Global fatal landslide occurrence from 2004 to 2016. Nat. Hazards Earth Syst. Sci. 2018, 18, 2161–2181. [Google Scholar] [CrossRef] [Green Version]
- Liu, X.; Zhao, C.; Zhang, Q.; Lu, Z.; Li, Z.; Yang, C.; Zhu, W.; Liu-Zeng, J.; Chen, L.; Liu, C. Integration of Sentinel-1 and ALOS/PALSAR-2 SAR datasets for mapping active landslides along the Jinsha River Corridor, China. Eng. Geol. 2021, 284, 106033. [Google Scholar] [CrossRef]
- Panizzo, A.; De Girolamo, P.; Di Risio, M.; Maistri, A.; Petaccia, A. Great landslide events in italian artificial reservoirs. Nat. Hazards Earth Syst. Sci. 2005, 5, 733–740. [Google Scholar] [CrossRef] [Green Version]
- Paronuzzi, P.; Rigo, E.; Bolla, A. Influence of filling–drawdown cycles of the vajont reservoir on mt. toc slope stability. Geomorphology 2013, 191, 75–93. [Google Scholar] [CrossRef]
- Wang, F.-W.; Zhang, Y.-M.; Huo, Z.-T.; Matsumoto, T.; Huang, B.-L. The July 14, 2003 Qianjiangping Landslide, Three Gorges Reservoir, China. Landslides 2004, 1, 157–162. [Google Scholar] [CrossRef]
- Gutiérrez, F.; Lucha, P.; Galve, J.P. Reconstructing the Geochronological Evolution of Large Landslides by Means of the Trenching Technique in the Yesa Reservoir (Spanish Pyrenees). Geomorphology 2010, 124, 124–136. [Google Scholar] [CrossRef]
- Liang, X.; Gui, L.; Wang, W.; Du, J.; Ma, F.; Yin, K. Characterizing the Development Pattern of a Colluvial Landslide Based on Long-Term Monitoring in the Three Gorges Reservoir. Remote Sens. 2021, 13, 224. [Google Scholar] [CrossRef]
- Li, D.; Yin, K.; Leo, C. Analysis of Baishuihe landslide influenced by the effects of reservoir water and rainfall. Environ. Earth Sci. 2010, 60, 677–687. [Google Scholar] [CrossRef]
- Huang, F.; Chen, L.; Yin, K.; Huang, J.; Gui, L. Object-oriented change detection and damage assessment using high-resolution remote sensing images, Tangjiao Landslide, Three Gorges Reservoir, China. Environ. Earth Sci. 2018, 77, 183. [Google Scholar] [CrossRef]
- Wang, F.; Zhang, Y.; Huo, Z.; Peng, X.; Araiba, K.; Wang, G. Movement of the Shuping Landslide in the First Four Years after the Initial Impoundment of the Three Gorges Dam Reservoir, China. Landslides 2008, 5, 321–329. [Google Scholar] [CrossRef]
- Du, J.; Yin, K.; Lacasse, S. Displacement Prediction in Colluvial Landslides, Three Gorges Reservoir, China. Landslides 2013, 10, 203–218. [Google Scholar] [CrossRef]
- Intrieri, E.; Raspini, F.; Fumagalli, A.; Lu, P.; Del Conte, S.; Farina, P.; Allievi, J.; Ferretti, A.; Casagli, N. The Maoxian Landslide as Seen from Space: Detecting Precursors of Failure with Sentinel-1 Data. Landslides 2018, 15, 123–133. [Google Scholar] [CrossRef] [Green Version]
- Solari, L.; Del Soldato, M.; Raspini, F.; Barra, A.; Bianchini, S.; Confuorto, P.; Casagli, N.; Crosetto, M. Review of Satellite Interferometry for Landslide Detection in Italy. Remote Sens. 2020, 12, 1351. [Google Scholar] [CrossRef]
- Mondini, A.C.; Guzzetti, F.; Chang, K.-T.; Monserrat, O.; Martha, T.R.; Manconi, A. Landslide Failures Detection and Mapping Using Synthetic Aperture Radar: Past, Present and Future. Earth-Sci. Rev. 2021, 216, 103574. [Google Scholar] [CrossRef]
- Zhou, C.; Cao, Y.; Yin, K.; Wang, Y.; Shi, X.; Catani, F.; Ahmed, B. Landslide Characterization Applying Sentinel-1 Images and InSAR Technique: The Muyubao Landslide in the Three Gorges Reservoir Area, China. Remote Sens. 2020, 12, 3385. [Google Scholar] [CrossRef]
- Mishra, V.; Jain, K. Satellite Based Assessment of Artificial Reservoir Induced Landslides in Data Scarce Environment: A Case Study of Baglihar Reservoir in India. J. Appl. Geophys. 2022, 205, 104754. [Google Scholar] [CrossRef]
- Fruneau, B.; Achache, J.; Delacourt, C. Observation and Modelling of the Saint-Tienne-de-Tinée Landslide Using SAR Interferometry. Tectonophysics 1996, 265, 181–190. [Google Scholar] [CrossRef]
- Chen, Y.; Yu, S.; Tao, Q.; Liu, G.; Wang, L.; Wang, F. Accuracy Verification and Correction of D-InSAR and SBAS-InSAR in Monitoring Mining Surface Subsidence. Remote Sens. 2021, 13, 4365. [Google Scholar] [CrossRef]
- Ferretti, A.; Prati, C.; Rocca, F. Permanent Scatterers in SAR Interferometry. IEEE Trans. Geosci. Remote Sens. 2001, 39, 13. [Google Scholar] [CrossRef]
- Del Soldato, M.; Riquelme, A.; Bianchini, S.; Tomàs, R.; Di Martire, D.; De Vita, P.; Moretti, S.; Calcaterra, D. Multisource Data Integration to Investigate One Century of Evolution for the Agnone Landslide (Molise, Southern Italy). Landslides 2018, 15, 2113–2128. [Google Scholar] [CrossRef] [Green Version]
- Solari, L.; Barra, A.; Herrera, G.; Bianchini, S.; Monserrat, O.; Béjar-Pizarro, M.; Crosetto, M.; Sarro, R.; Moretti, S. Fast Detection of Ground Motions on Vulnerable Elements Using Sentinel-1 InSAR Data. Geomat. Nat. Hazards Risk 2018, 9, 152–174. [Google Scholar] [CrossRef] [Green Version]
- Wasowski, J.; Pisano, L. Long-Term InSAR, Borehole Inclinometer, and Rainfall Records Provide Insight into the Mechanism and Activity Patterns of an Extremely Slow Urbanized Landslide. Landslides 2020, 17, 445–457. [Google Scholar] [CrossRef]
- Fobert, M.-A.; Singhroy, V.; Spray, J.G. InSAR Monitoring of Landslide Activity in Dominica. Remote Sens. 2021, 13, 815. [Google Scholar] [CrossRef]
- Lu, P.; Catani, F.; Tofani, V.; Casagli, N. Quantitative Hazard and Risk Assessment for Slow-Moving Landslides from Persistent Scatterer Interferometry. Landslides 2014, 11, 685–696. [Google Scholar] [CrossRef]
- Hurst, H.E. Methods of using long-term storage in reservoirs. Proc. Inst. Civ. Eng. 1956, 5, 519–543. [Google Scholar] [CrossRef]
- Tiwari, A.K.; Albulescu, C.T.; Yoon, S.-M. A Multifractal Detrended Fluctuation Analysis of Financial Market Efficiency: Comparison Using Dow Jones Sector ETF Indices. Phys. A Stat. Mech. Its Appl. 2017, 483, 182–192. [Google Scholar] [CrossRef]
- Qu, S.; Wang, L.; Lin, A.; Yu, D.; Yuan, M.; Li, C. Distinguishing the Impacts of Climate Change and Anthropogenic Factors on Vegetation Dynamics in the Yangtze River Basin, China. Ecol. Indic. 2020, 108, 105724. [Google Scholar] [CrossRef]
- He, K.; Sun, L.; Wang, S. Displacement Fractal Parameter Hurst Index and Its Application to Prediction of Debris Landslides. Yanshilixue Yu Gongcheng Xuebao/Chin. J. Rock Mech. Eng. 2009, 28, 1107–1115. [Google Scholar]
- Cao, Y.; Yin, K.; Zhou, C. Comprehensive Assessment on Sanzhouxi Landslide Stability Considering Displacement Monitoring. Electron. J. Geotech. Eng. 2013, 18, 5507–5524. [Google Scholar]
- Roccati, A.; Paliaga, G.; Luino, F.; Faccini, F.; Turconi, L. Rainfall Threshold for Shallow Landslides Initiation and Analysis of Long-Term Rainfall Trends in a Mediterranean Area. Atmosphere 2020, 11, 1367. [Google Scholar] [CrossRef]
- Li, H.; Xu, Q.; He, Y.; Fan, X.; Yang, H.; Li, S. Temporal Detection of Sharp Landslide Deformation with Ensemble-Based LSTM-RNNs and Hurst Exponent. Geomat. Nat. Hazards Risk 2021, 12, 3089–3113. [Google Scholar] [CrossRef]
- Liu, Y.; Yang, H.; Wang, S.; Xu, L.; Peng, J. Monitoring and Stability Analysis of the Deformation in the Woda Landslide Area in Tibet, China by the DS-InSAR Method. Remote Sens. 2022, 14, 532. [Google Scholar] [CrossRef]
- Cascini, L.; Fornaro, G.; Peduto, D. Advanced Low- and Full-Resolution DInSAR Map Generation for Slow-Moving Landslide Analysis at Different Scales. Eng. Geol. 2010, 112, 29–42. [Google Scholar] [CrossRef]
- Shi, X.; Zhang, L.; Zhou, C.; Li, M.; Liao, M. Retrieval of Time Series Three-Dimensional Landslide Surface Displacements from Multi-Angular SAR Observations. Landslides 2018, 15, 1015–1027. [Google Scholar] [CrossRef]
- Domino, K. The Use of the Hurst Exponent to Predict Changes in Trends on the Warsaw Stock Exchange. Phys. A Stat. Mech. Its Appl. 2011, 390, 98–109. [Google Scholar] [CrossRef]
- Jiang, L.; Jiapaer, G.; Bao, A.; Guo, H.; Ndayisaba, F. Vegetation Dynamics and Responses to Climate Change and Human Activities in Central Asia. Sci. Total Environ. 2017, 599, 967–980. [Google Scholar] [CrossRef]
- Hooper, A. A Multi-Temporal InSAR Method Incorporating Both Persistent Scatterer and Small Baseline Approaches. Geophys. Res. Lett. 2008, 35, L16302. [Google Scholar] [CrossRef] [Green Version]
- Hooper, A.; Zebker, H.A. Phase Unwrapping in Three Dimensions with Application to InSAR Time Series. J. Opt. Soc. Am. A 2007, 24, 2737. [Google Scholar] [CrossRef]
- Yu, C.; Penna, N.T.; Li, Z. Generation of Real-time Mode High-resolution Water Vapor Fields from GPS Observations. J. Geophys. Res. Atmos. 2017, 122, 2008–2025. [Google Scholar] [CrossRef]
- Yu, C.; Li, Z.; Penna, N.T. Interferometric Synthetic Aperture Radar Atmospheric Correction Using a GPS-Based Iterative Tropospheric Decomposition Model. Remote Sens. Environ. 2018, 204, 109–121. [Google Scholar] [CrossRef]
- Yu, C.; Li, Z.; Penna, N.T.; Crippa, P. Generic Atmospheric Correction Model for Interferometric Synthetic Aperture Radar Observations. J. Geophys. Res. Solid Earth 2018, 123, 9202–9222. [Google Scholar] [CrossRef]
- Herrera, G.; Gutiérrez, F.; García-Davalillo, J.C.; Guerrero, J.; Notti, D.; Galve, J.P.; Fernández-Merodo, J.A.; Cooksley, G. Multi-Sensor Advanced DInSAR Monitoring of Very Slow Landslides: The Tena Valley Case Study (Central Spanish Pyrenees). Remote Sens. Environ. 2013, 128, 31–43. [Google Scholar] [CrossRef]
- Hurst, H.E. Long-Term Storage of Reservoirs: An Experimental Study. Trans. Am. Soc. Civ. Eng. 1951, 116, 770–799. [Google Scholar] [CrossRef]
- Mandelbrot, B. Statistical methodology for nonperiodic cycles: From the covariance to R/S analysis. Ann. Econ. Soc. Meas. 1972, 1, 259–290. [Google Scholar]
- Mandelbrot, B.B.; Wallis, J.R. Robustness of the rescaled range r/s in the measurement of noncyclic long run statistical dependence. Water Resour. Res. 1969, 5, 967–988. [Google Scholar] [CrossRef]
- Necsoiu, M.; McGinnis, R.N.; Hooper, D.M. New insights on the salmon falls creek canyon landslide complex based on geomorphological analysis and multitemporal satellite InSAR techniques. Landslides 2014, 11, 1141–1153. [Google Scholar] [CrossRef]
- López-Vinielles, J.; Fernández-Merodo, J.A.; Ezquerro, P.; García-Davalillo, J.C.; Sarro, R.; Reyes-Carmona, C.; Barra, A.; Navarro, J.A.; Krishnakumar, V.; Alvioli, M.; et al. Combining satellite InSAR, slope units and finite element modeling for stability analysis in mining waste disposal areas. Remote Sens. 2021, 13, 2008. [Google Scholar] [CrossRef]
- Ma, Y.; Li, F.; Wang, Z.; Zou, X.; An, J.; Li, B. Landslide Assessment and Monitoring along the Jinsha River, Southwest China, by Combining InSAR and GPS Techniques. J. Sens. 2022, 2022, 9572937. [Google Scholar] [CrossRef]
Figure 1.
(a) Location of the study area; (b) Location of study area and InSAR range; and (c) Locations of 10 reservoir bank landslides in the study area (① Laotangfang landslide; ② Sharentian landslide; ③ Sifangbei landslide; ④ Xiangjiaping landslide; ⑤ Tangjiao landslide; ⑥ Rangduchangbei landslide; ⑦ Datangbang landslide; ⑧ Jinjinzi landslide; ⑨ Wuchiba landslide; and ⑩ Zhangjiacitang landslide).

Figure 2.
(a) Reservoir water level change curve (2018–2022); and (b) Time division of reservoir water level change in a cycle.
Figure 2.
(a) Reservoir water level change curve (2018–2022); and (b) Time division of reservoir water level change in a cycle.

Figure 3.
Deformations on the Sifangbei landslide: (a) About 4 cm of building wall cracked; (b) about 3 cm of building wall cracked; (c) a ground crack in the yard; and (d) a road crack on the east side.
Figure 3.
Deformations on the Sifangbei landslide: (a) About 4 cm of building wall cracked; (b) about 3 cm of building wall cracked; (c) a ground crack in the yard; and (d) a road crack on the east side.

Figure 4.
The flowchart of landslide deformation monitoring and trend prediction. SRTM DEM: Shuttle Radar Topography Mission Digital Elevation Model; GACOS: Generic Atmospheric Correction Online Service for InSAR; GPS: Global Position System; InSAR: Interferometric Synthetic Aperture Radar; PS: Persistent Scatterer; DS: Distributed Scatterer; R/S: Rescaled Range.

Figure 5.
Spatial distribution of Time-Series InSAR measurement points (slope direction) and deformation rate (① Laotangfang landslide; ② Sharentian landslide; ③ Sifangbei landslide; ④ Xiangjiaping landslide; ⑤ Tangjiao landslide; ⑥ Rangduchangbei landslide; ⑦ Datangbang landslide; ⑧ Jinjinzi landslide; ⑨ Wuchiba landslide; and ⑩ Zhangjiacitang landslide).

Figure 6.
Spatial distribution of Hurst index values from 2018 to 2022 (① Laotangfang landslide; ② Sharentian landslide; ③ Sifangbei landslide; ④ Xiangjiaping landslide; ⑤ Tangjiao landslide; ⑥ Rangduchangbei landslide; ⑦ Datangbang landslide; ⑧ Jinjinzi landslide; ⑨ Wuchiba landslide; and ⑩ Zhangjiacitang landslide).

Figure 7.
Predicted deformation trend of the reservoir bank slopes in the study area for the next four years (① Laotangfang landslide; ② Sharentian landslide; ③ Sifangbei landslide; ④ Xiangjiaping landslide; ⑤ Tangjiao landslide; ⑥ Rangduchangbei landslide; ⑦ Datangbang landslide; ⑧ Jinjinzi landslide; ⑨ Wuchiba landslide; and ⑩ Zhangjiacitang landslide).

Figure 8.
Spatial distribution of InSAR measurement points of the Sifangbei landslide and its deformation rate.
Figure 8.
Spatial distribution of InSAR measurement points of the Sifangbei landslide and its deformation rate.

Figure 9.
Cumulative displacement curves of Time-Series InSAR measurement points of the Sifangbei landslide.
Figure 9.
Cumulative displacement curves of Time-Series InSAR measurement points of the Sifangbei landslide.

Figure 10.
Cumulative displacement curves and the corresponding Hurst index of MP1, MP2 and MP6.

Figure 11.
Statistics of predicted deformation trends in active landslide and non-landslide areas.

Figure 12.
Spatial distribution and statistical distribution of Hurst index values in different water level periods: (a) 2020.11–2021.2 high water level period; (b) 2021.3–2021.6 receding water level period; and (c) 2021.7–2021.10 low water level period.
Figure 12.
Spatial distribution and statistical distribution of Hurst index values in different water level periods: (a) 2020.11–2021.2 high water level period; (b) 2021.3–2021.6 receding water level period; and (c) 2021.7–2021.10 low water level period.

Figure 13.
Relationships between cumulative displacement, Hurst index, rainfall, and reservoir water level.
Figure 13.
Relationships between cumulative displacement, Hurst index, rainfall, and reservoir water level.


Table 1.
Overview of the current status of reservoir bank landslides in the study area.
| Number | Landslides | Elevation Range (m) | Average Thickness (m) | Volume (m3) | Deformation Rate in 2021 (mm/yr) | Activity State |
|---|---|---|---|---|---|---|
| ① | Laotangfang landslide | 125–190 | 35.6 | 925 × 104 | −22.6–13 | Active |
| ② | Sharentian landslide | 160–210 | 28 | 750 × 104 | −14.5–6.2 | Active |
| ③ | Sifangbei landslide | 110–335 | 22 | 643.28 × 10⁴ | −86.4–−1.2 | Active |
| ④ | Xiangjiaping landslide | 113–260 | 20 | 660 × 104 | −34.2–−7.5 | Active |
| ⑤ | Tangjiao landslide | 140–320 | 20 | 2672.4 × 104 | −39.6–1.2 | Reactive |
| ⑥ | Rangduchangbei landslide | 165–270 | 25 | 528 × 104 | −408.6–−0.2 | Active |
| ⑦ | Datangbang landslide | 130–270 | 15 | 218 × 104 | −13.4–2.4 | Stabilized |
| ⑧ | Jinjinzi landslide | 110–225 | 30 | 1600 × 104 | −68.9–−9.8 | Active |
| ⑨ | Wuchiba landslide | 160–245 | 10 | 260 × 104 | −12.2–7.2 | Stabilized |
| ⑩ | Zhangjiaci tang landslide | 121–250 | 17 | 952 × 104 | −40.3–−1.6 | Active |
Table 2.
Deformation trend prediction based on deformation rate (mm/yr) and Hurst index.
| v | / | ||||
| H | |||||
Table 3.
Comparison between Time-Series InSAR measurements and GPS observations (mm/yr).
| Location | GPS | InSAR Deformation Rate | GPS Deformation Rate | Deviation | RMSE |
|---|---|---|---|---|---|
| Active landslide area | GPS1 | −2.15 | 1.21 | 3.36 | 2.55 |
| GPS5 | 0.85 | −3.00 | 3.85 | ||
| Non-landslide area | GPS2 | −11.08 | −12.08 | 1.00 | |
| GPS3 | −0.58 | 1.70 | 2.28 | ||
| GPS4 | −7.28 | −6.82 | 0.46 |
Disclaimer/Publisher’s Note: The statements, opinions and data contained in all publications are solely those of the individual author(s) and contributor(s) and not of MDPI and/or the editor(s). MDPI and/or the editor(s) disclaim responsibility for any injury to people or property resulting from any ideas, methods, instructions or products referred to in the content. |
© 2023 by the authors. Licensee MDPI, Basel, Switzerland. This article is an open access article distributed under the terms and conditions of the Creative Commons Attribution (CC BY) license (https://creativecommons.org/licenses/by/4.0/).
Share and Cite
MDPI and ACS Style
Zhang, X.; Chen, L.; Zhou, C. Deformation Monitoring and Trend Analysis of Reservoir Bank Landslides by Combining Time-Series InSAR and Hurst Index. Remote Sens. 2023, 15, 619. https://doi.org/10.3390/rs15030619
AMA Style
Zhang X, Chen L, Zhou C. Deformation Monitoring and Trend Analysis of Reservoir Bank Landslides by Combining Time-Series InSAR and Hurst Index. Remote Sensing. 2023; 15(3):619. https://doi.org/10.3390/rs15030619
Chicago/Turabian StyleZhang, Xingchen, Lixia Chen, and Chao Zhou. 2023. "Deformation Monitoring and Trend Analysis of Reservoir Bank Landslides by Combining Time-Series InSAR and Hurst Index" Remote Sensing 15, no. 3: 619. https://doi.org/10.3390/rs15030619
Note that from the first issue of 2016, this journal uses article numbers instead of page numbers. See further details here.