
Impacts of Climate Change and Human Activities on NDVI in the Qinghai-Tibet Plateau
by
Lu Sun
1,2,†,
Hao Li
1,2,†,
Jia Wang
1,2,*,
Yuhan Chen
1,2,
Nina Xiong
1,2,
Zong Wang
1,2,
Jing Wang
1,2 and
Jiangqi Xu
1,2 1
Beijing Key Laboratory of Precision Forestry, Beijing Forestry University, Beijing 100083, China
2
Institute of GIS, RS & GPS, Beijing Forestry University, Beijing 100083, China
*
Author to whom correspondence should be addressed.
†
These authors contributed equally to this work.
Remote Sens. 2023, 15(3), 587; https://doi.org/10.3390/rs15030587
Submission received: 8 December 2022
/
Revised: 12 January 2023
/
Accepted: 17 January 2023
/
Published: 18 January 2023
Abstract
:Vegetation changes and factors have a profound influence on the local ecology, the economy, and the long-term durability of human construction. This study focuses on the impacts of climate change and human activity on vegetation changes on the Qinghai-Tibet Plateau and aims to develop a dataset of human activity levels on the plateau. Sen and Mann-Kendall trend analysis was used to evaluate the spatial distribution of vegetation NDVI and its trends, as well as the lagged response of plant growth to climatic circumstances. Using a geodetector model, the effects of meteorological and anthropogenic intensity data were examined. The study’s findings show that, although anthropogenic influences and ecosystem vulnerability caused a decline in the region’s vegetation, a stable climate and a healthy ecosystem supported the growth of vegetation. From 2000 to 2017, the area where vegetation grass improved significantly accounted for the highest proportion, reaching 34.22%. Different anthropogenic intensities are distributed spatially, and this interplay of anthropogenic intensities and climatic factors affects the distribution of vegetation greenness more than each element acting alone. The study of how human activity and climate change affect vegetation greenness can offer practical recommendations for maintaining the Qinghai-Tibet Plateau’s natural ecology. It is crucial to responsibly safeguard the Qinghai-Tibet Plateau’s environment in response to the nation’s ecological civilization.
1. Introduction
The Qinghai-Tibet Plateau is the largest plateau in China in terms of land area, and the highest plateau in the globe is known as the third pole of the earth [1] and is a major reservoir of water, regulating climate change and water resources in East Asia and the world. It is mainly distributed in the middle and low latitudes and possesses a large variety of landform types. Due to its widely varying altitudes, it has developed a variety of climate types, including humid, arid, tropical, and boreal climates [2]. It has been shown that vegetation growth changes are not only influenced by climate change and elevation but also by the evolution of anthropogenic stresses [3,4]. Especially due to the particularity and importance of the Qinghai-Tibet Plateau, it is urgent to study the impact of human activity intensity on vegetation [5,6].
To a certain extent, whether the regional ecological environment is good or not can be obtained from the analysis of the specific situation of vegetation cover change [7,8]. Numerous academics have used various techniques over the past ten years to confirm the relationship between climatic variables and NDVI [9]. Factors such as natural geographical location and climatic conditions are directly related to the evolution of the ecosystem in the region, while human activities can directly influence the change of land type and, thus, the regional environment [10]. The natural surroundings of the area have an impact on the geographic distribution of this ecosystem, and climatic variables, such as temperature, precipitation, solar radiation, and topography, have a direct impact on the different vegetation species and their distribution. The authors use precipitation, temperature, solar radiation, and other data to integrate the effects on NPP, helping to optimize fragile ecosystems [11,12,13]. Land use changes are a direct result of the creation of transportation, infrastructure, cultural, and tourism facilities, among other human-made urban development projects. The authors use livestock data, biodiversity data, land carbon data, and other data to classify land use patterns, including regional urbanization and agricultural expansion and global remote-coupled land use change in all regions of the world [14,15]. Jason and Roland started looking at the causes of Greenland degradation and studying the deterioration of Syrian grasslands as early as 2004 [16]. Additionally, studies in western Washington, USA, have shown a correlation between population density and NDVI levels, indicating that anthropogenic causes have a significant impact on NDVI variations [17]. The researchers that looked into this topic in Africa discovered that anthropogenic factors such as agricultural irrigation and people movement are key contributors to the local vegetation anomalies in the area [18]. Some domestic experts have researched the causes of vegetation cover change in China using the trend analysis method and identified a negative link with human activities [5]. To examine the variations in vegetation cover and its causes in Chongqing, other scholars paired the trend analysis method with a geodetector model [19,20]. They observed that the intensity of human activities had a significant effect on vegetation change [21].
At present, there are still few studies on the question of whether human activity intensity affects vegetation growth on the Qinghai-Tibet Plateau [22]. The absence of high-precise data on the intensity of human activity makes it challenging to assess the association between human activity and vegetation change in this area [23]. Analyzing the particular condition of plant cover changes may help determine, to some degree, if the regional ecological environment is favorable or not. As a result, determining how much human activity is affecting the change in plant cover may provide useful recommendations for ecological and socioeconomic growth that is both sustainable and responsible. It is vital to research the effects of human activity intensity on plant cover since the influence of human activities on it is likely to be irreversible [24], especially on the Qinghai-Tibet Plateau where ecological sensitivity is high [25,26]. This study investigates how climate and human activity affect plant greenness, which may serve as a guide for ecological environmental conservation on the Qinghai-Tibet Plateau and has real-world implications for the region’s sustainable development of both people and nature. There have been several issues in the research on climate change over the Qinghai-Tibet Plateau in recent years as follows: the amplified warming and the physical mechanism of elevation-dependent warming; the applicability of modern reanalysis data; the bias and inaccuracy of climate models in the areas with scarce data over the Qinghai-Tibet Plateau; the projection and risk study of climate change over the Qinghai-Tibet Plateau under the different warming thresholds [27].
The rest of the paper is structured as follows: in Section 2, the materials and methodology of the experiments are described. The results and analysis are in Section 3. A discussion is offered in Section 4. Section 5 provides a conclusion. Section 6 gives a description of the limitations of the study and its future prospects.
2. Materials and Methods
2.1. Study Area
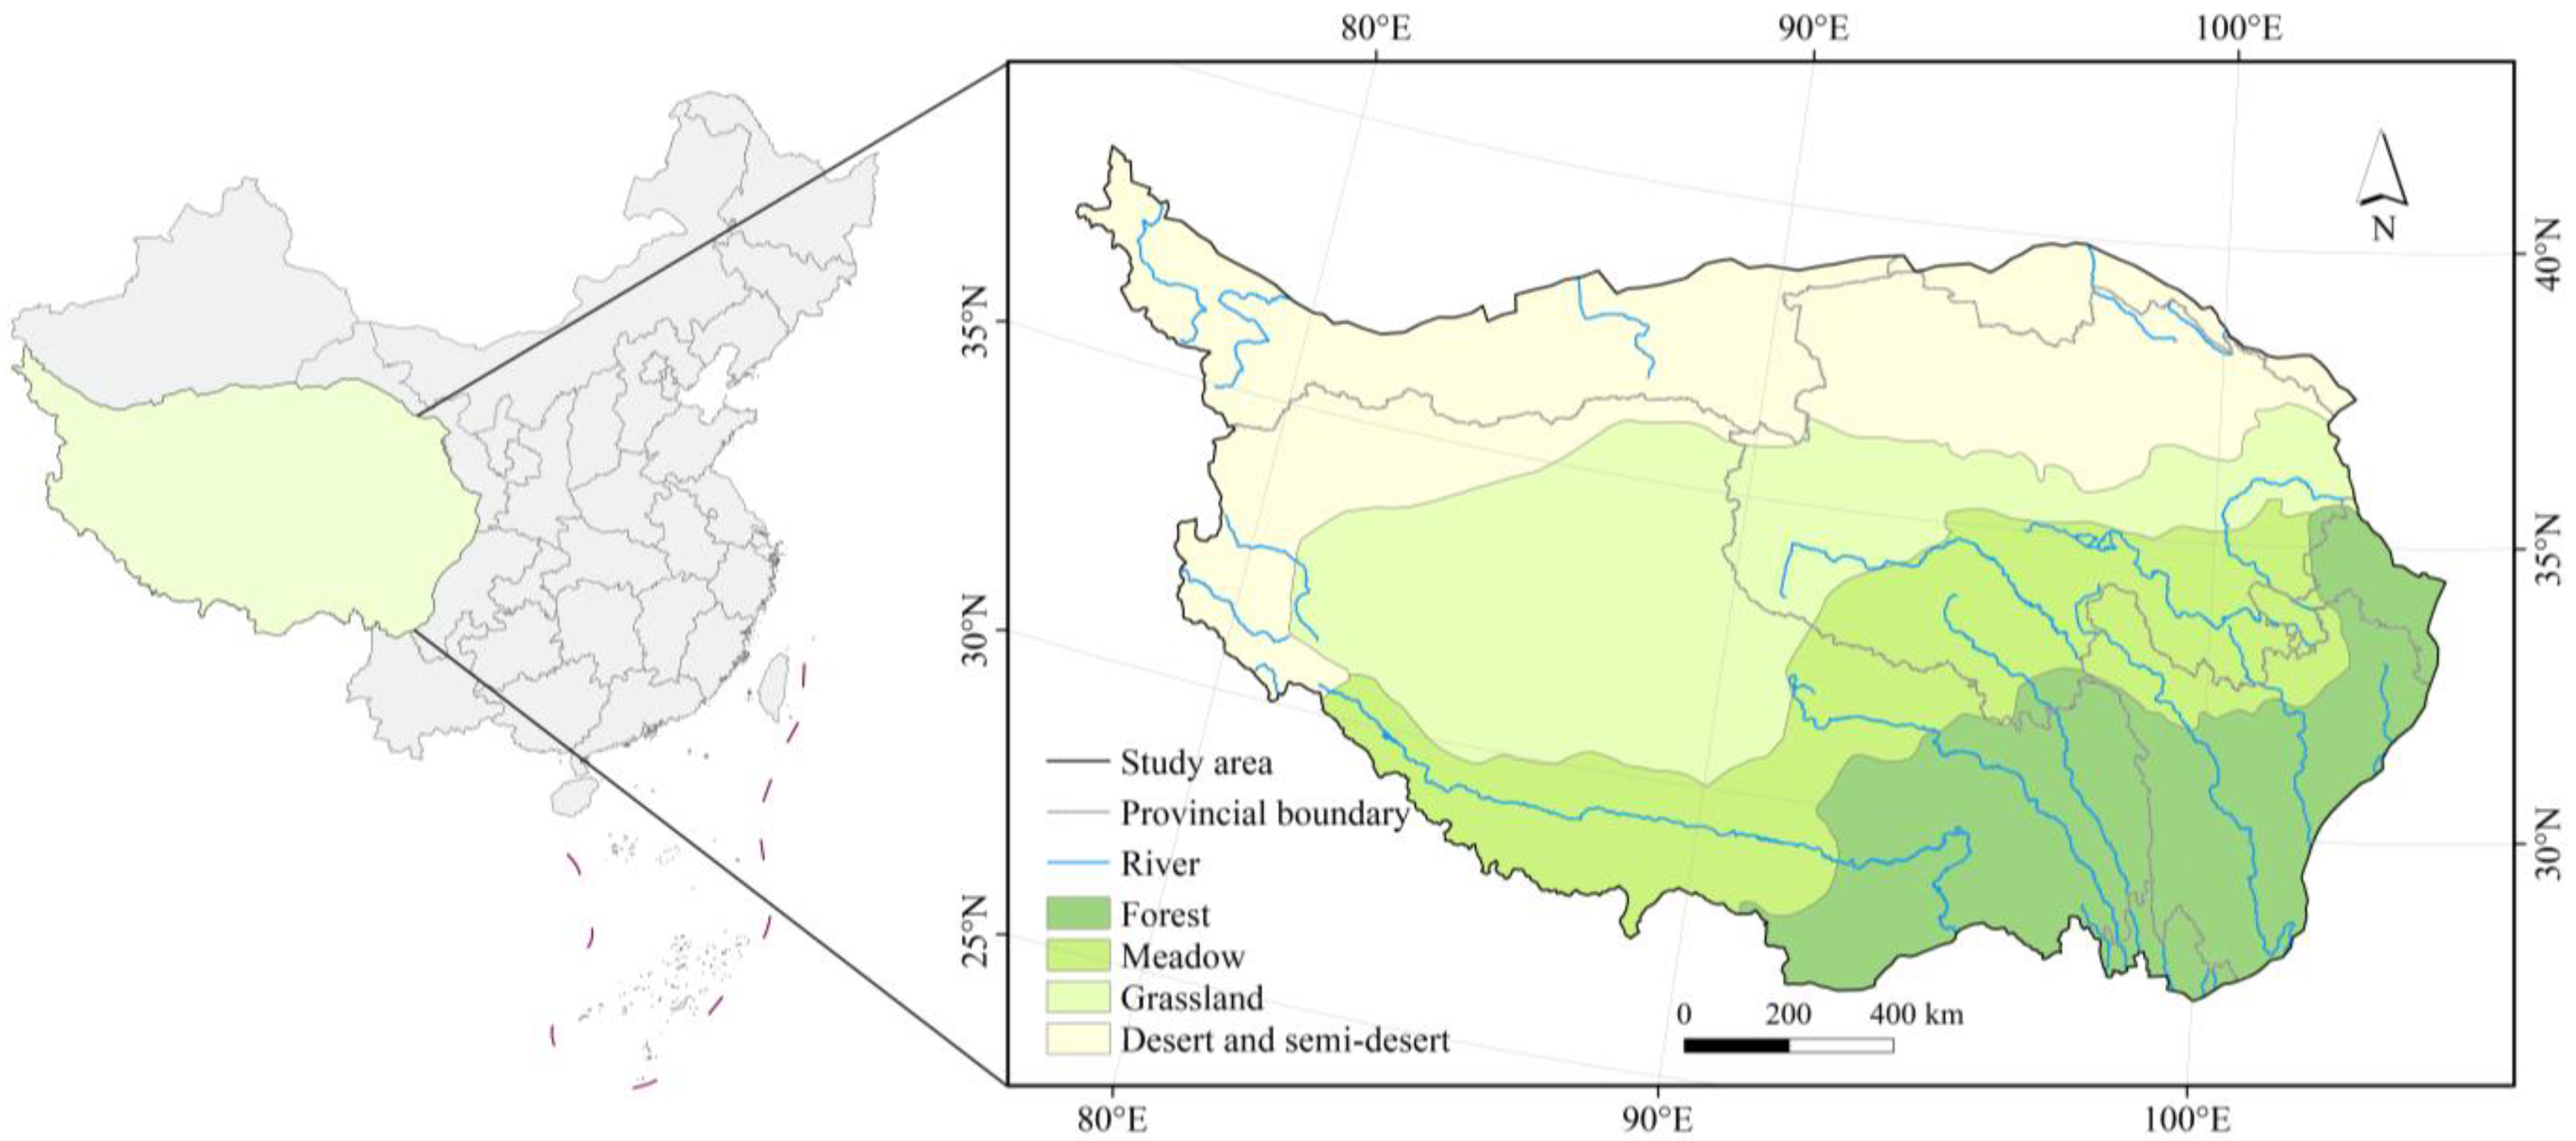
The Qinghai-Tibet Plateau (26°00′N~39°47′N, 73°19′E~104°47′E) is located in southwest China (Figure 1), covering about 26% of the country’s land area [28]. It is characterized by intense solar radiation, complicated topography, significant changes in altitude, low temperatures, and significant temperature differences between the four seasons. It also has a broad east-west and north-south axis. Precipitation steadily declines from the southeast to the northwest under the influence of the southwest monsoon and is irregularly distributed throughout time, with distinct wet and dry seasons. The Kunlun Mountains, Tanggula Mountains, and Himalayas are just three of the numerous mountain ranges in the area. There are many plateaus in the area, with the Qingnan Plateau covering the largest area, the Kangba Plateau and the Aba Plateau being wetter and having larger areas of plateau meadows, etc.; the Qiangtang Plateau being vast, dry, and cold. The runoff in the area increases as a result of the melting of glacial snow in April and May.
Nearly half of the people in the area are Tibetan, and other ethnic minorities include Han, Menba, Qiang, Naxi, and Hui. In the Qinghai-Tibet Plateau region, the majority of the cities are underdeveloped and focus primarily on traditional agriculture and animal husbandry. The Qinghai-Tibet Railway, Qinghai-Tibet Highway, Sichuan-Tibet Highway, and numerous airlines, primarily to Xining and Lhasa, have all helped to gradually improve transportation in recent years. Following this, the tourism sector grew, bringing both cultural and financial benefits to the area.
2.2. Data and Processing
NDVI (Normalized Difference Vegetation Index) can reflect the vegetation cover [29,30]. Currently, NDVI data derived from satellite remote sensing pictures such as SPOT (Systeme Probatoire d’Observation de la Terre) and MODIS (Moderate-Resolution Imaging Spectroradiometer) have been widely used in regional research at different scales, including the detection of vegetation dynamics, the detection of land cover, and the classification of vegetation [31]. In this study, the annual vegetation indices of the Qinghai-Tibet Plateau region from 2000 to 2017 were used. The datasets used in the anthropogenic intensity dataset include population density distribution, land use, cattle and sheep density distribution, and road and railroad data (Table 1).
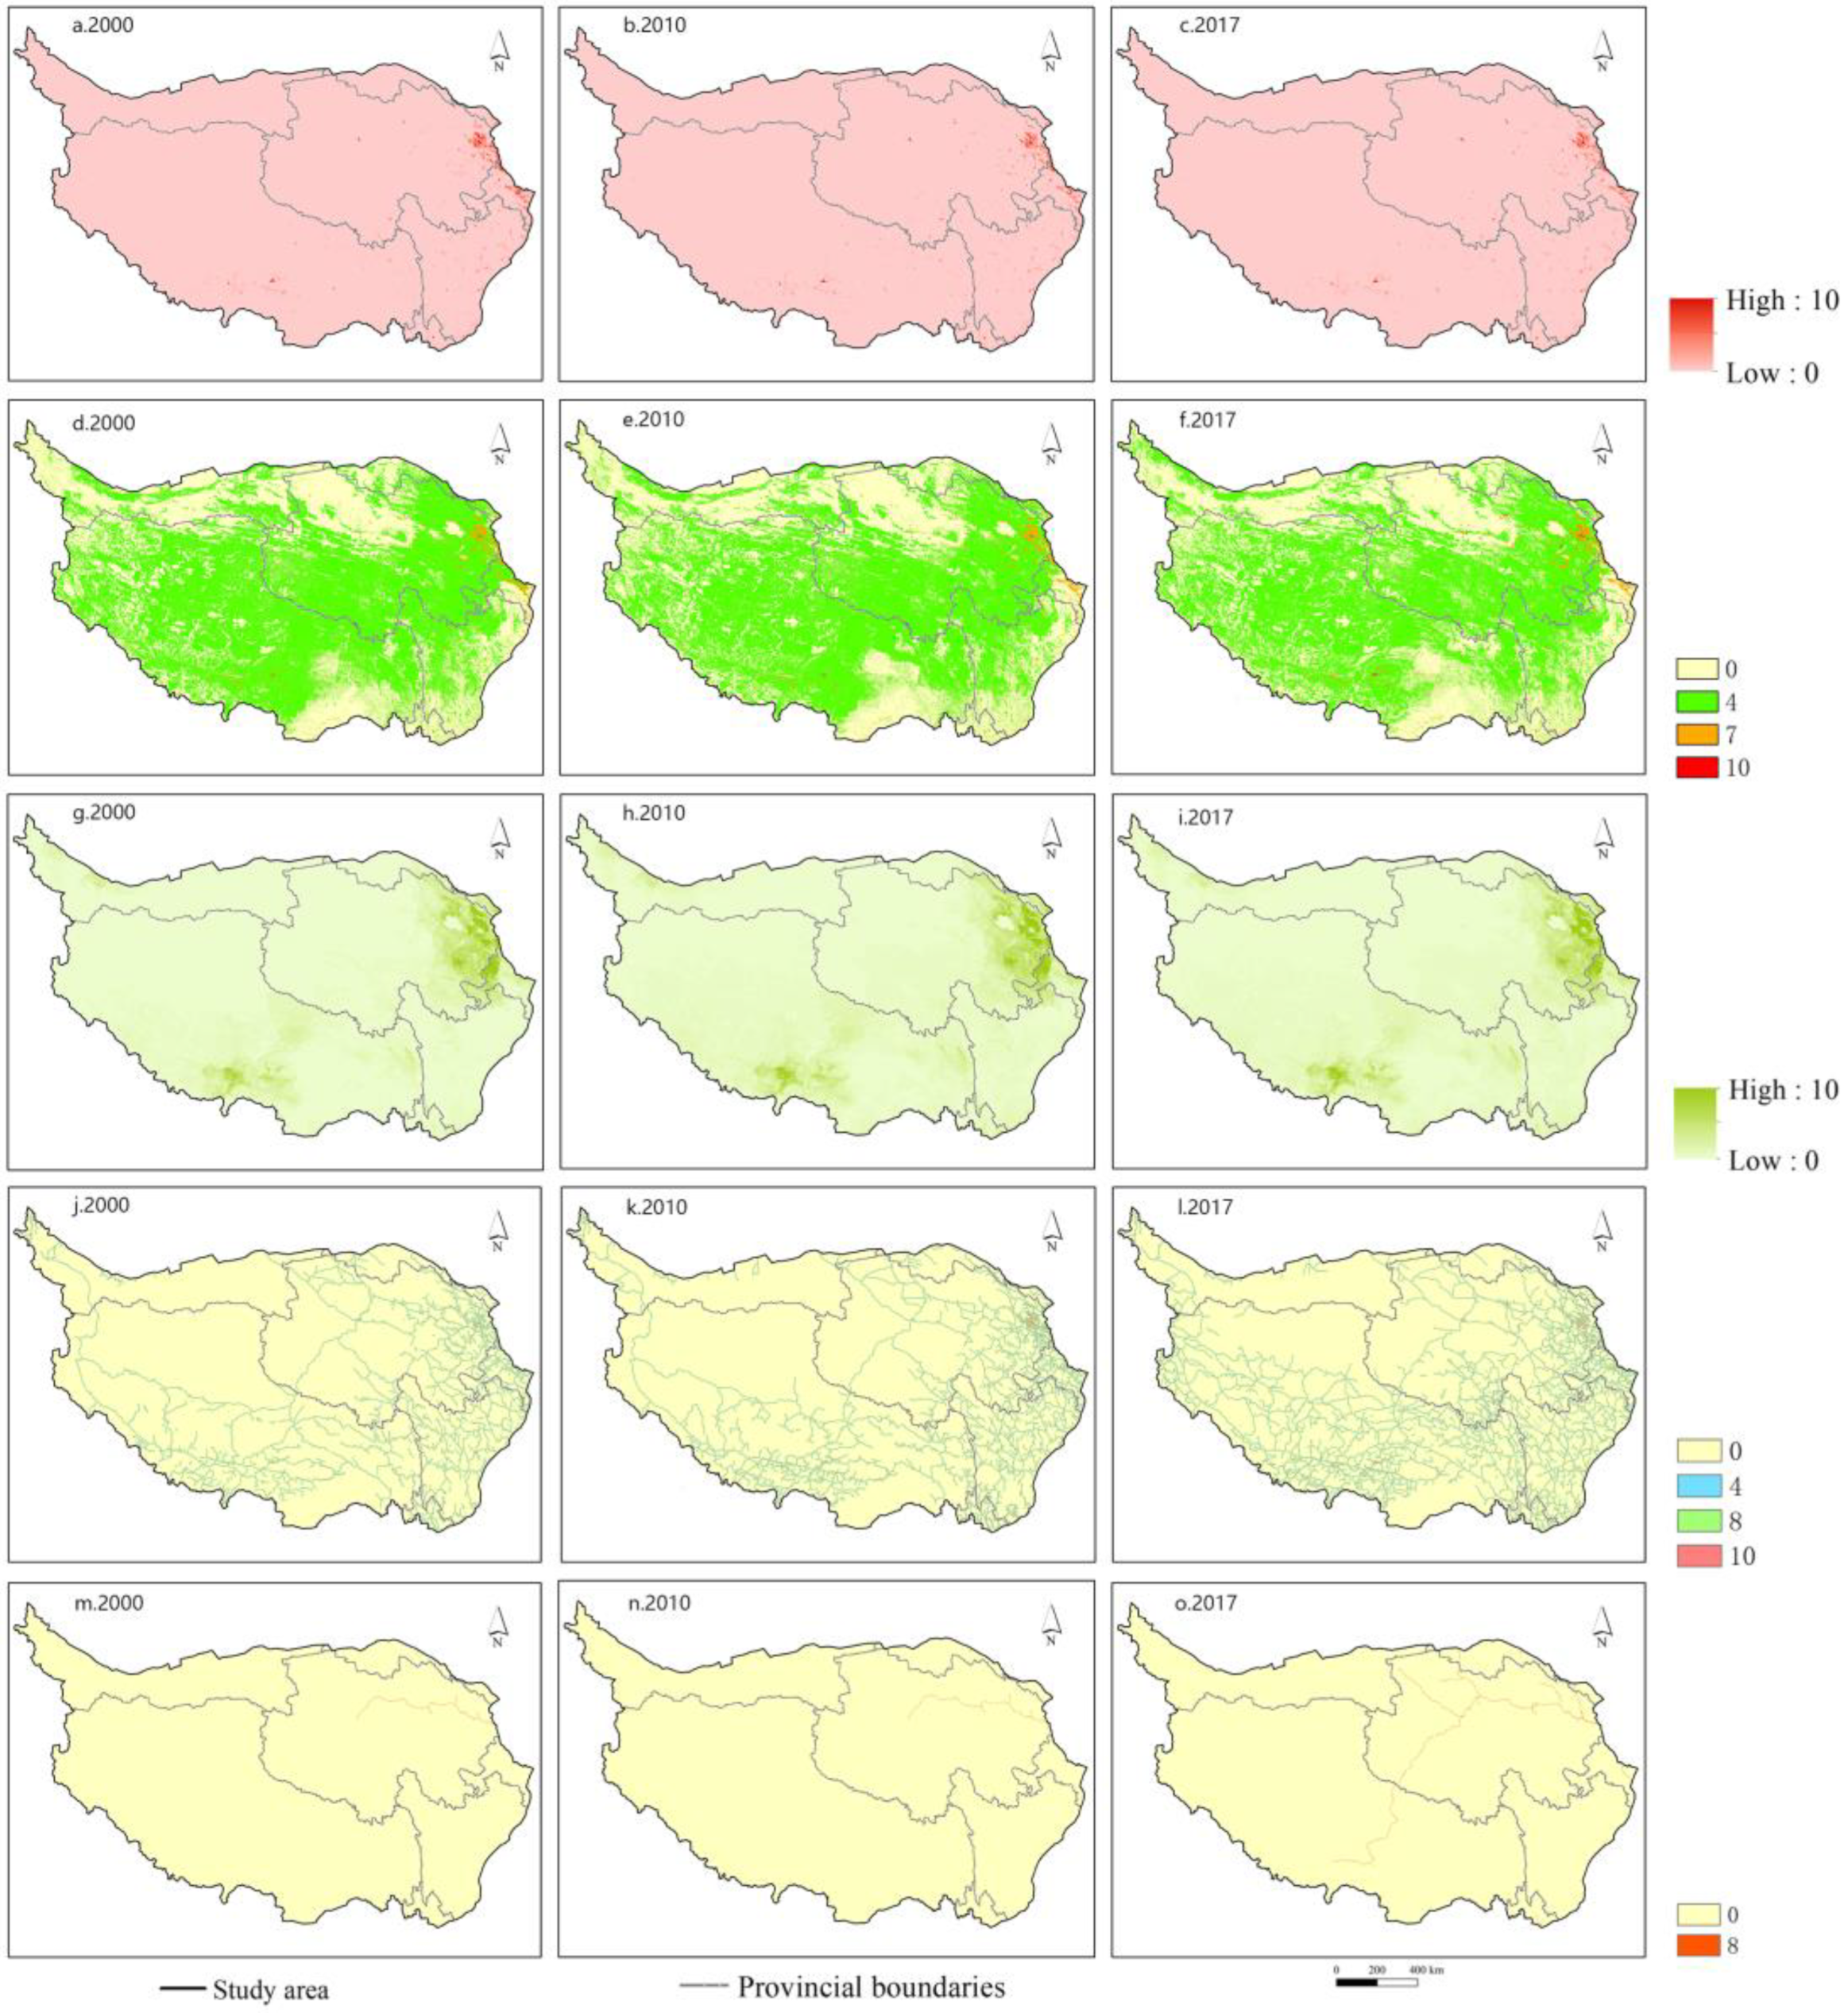
Population density reflects the density of human aggregation, and it is generally believed that human activities in high-density areas have a greater impact on the ecological environment [32], and the impact generally varies logarithmically. To facilitate the later calculation of the data set, the population density was calculated according to the logarithm and normalized to 0–10 (Figure 2a–c). According to the different land use types, the raster data were assigned values of 10 for building land, 7 for arable land, 4 for grassland, and 0 for others (Figure 2d–f). The change rate of cattle and sheep density in different years was calculated relative to the 2010 cattle and sheep inventory and slaughter data, and the cattle and sheep density layers of other years were obtained by extrapolating the trend (Figure 2g–i). The Qinghai-Tibet Plateau region is at a high altitude, and residents are concentrated within the town limits. The road data has a greater influence on the settlements and urban development on both sides of the road. The buffer zone of the road is assigned a value of 10 within 500 m from the road buffer zone, 8 within 500–1500 m from the road buffer zone, 4 within 1500~2500 m from the road buffer zone, and 0 in other areas (Figure 2j–l). The influence of the railroad on the urban and residential environment on both sides is small, and the area within 500 m on both sides of the railroad is assigned a value is 8 points (Figure 2m–o).
2.3. Methods
2.3.1. Assessment of the Change Characteristics of Alpine Vegetation
Sen’s slope estimation and the Mann-Kendall test were used to examine the trend of the change in alpine vegetation’s greenness [33,34]. Sen’s slope estimation can calculate the trend value of the series data, which is the median value in this series, calculated by the following formula:
Sen’s slope estimation selects the trend degree β to determine the trend change of this time series, when β > 0, the time series tends to rise, and β < 0, the time series tends to fall. There is a time series Xt = (x1, x2,..., xn), assuming the existence of pairwise values xi, xj, and setting its size relationship as S, where j > i. Mann-Kendall nonparametric test method for different lengths of time series, there are differences in the selection of statistics for significance test [35]. The categorization statistics were used to determine the proportions of the entire region that had severe degradation, minor degradation, stable unaltered, small improvement, and considerable improvement, respectively.
2.3.2. Human Activity Intensity Assessment
In this study, human activity intensity was estimated by constructing a human footprint dataset in the Qinghai-Tibet Plateau region. Based on a diverse literature study, expert consultation, and field investigation, the human activity intensity proxies that can indicate the impact on vegetation in the alpine region were identified [36]. The data are spatially gridded, resampling all data with a uniform precision of 100 m, and ultimately, the data of each indicator are dimensionless and scored, and the fuzzy superposition model is used to generate human activity intensity distribution maps of the Qinghai-Tibet Plateau region in 2000, 2010, and 2017. The higher score shows the larger impact of human activity on the environment in the region.
2.3.3. Impact of Climate Change and Human Activities on Vegetation Greenness
Geodetector is a statistical method to detect spatial stratified heterogeneity and reveal the driving factors behind it. This method with no linear hypothesis has elegant form and definite physical meaning.
Due to its special geographic location and size, the Qinghai-Tibet Plateau region is home to a wide range of vegetation. These vegetation types can be roughly categorized into the following four zones based on climate, terrain, and vegetation types: the forest zone, meadow zone, grassland zone, and desert and semi-desert zone. The NDVI in each vegetation distribution zone in the setting of the climatic conditions in 2000, 2010, and 2017 were calculated using Excel Geodetector software.
We primarily use the geodetector’s divergence [37,38], factor, and interaction detection in this paper. The variance and factor detection process are broken down into the following two steps: the first step is the detection of the spatial variability of factor Y, and the second is the interpretation of that variability by factor X. The results of this detection are represented by the q-value, which is written as follows:
h = 1,…, n, L is the stratification of variable Y or factor X; Nh is the total number of cells in layer h, and N is the total number of cells in the whole region; is the variance of Y values in layer h, and is the variance of Y values in the whole region. SSW is the total variance of different layers, and SST is the regional variance sum. If the stratification is caused by X, then a bigger q value reflects the stronger explanatory power of factor X on Y-space heterogeneity, and vice versa shows the weaker explanatory power. q has a value range of 0–1, and a larger q value signifies more substantial Y spatial differentiation [38,39,40].
Interaction detection is the identification of whether the explanatory power is independent or joint when multiple factors affect the spatial divergence of Y, and whether that effect is enhanced or diminished [39]. First, the q values generated by each factor on Y as follows: q (X1) and q (X2) are calculated, then X1 and X2 are superimposed to form a new layer X1X2, and the following q value of that layer: q(X1X2) is calculated, and finally the q (X1), q (X2), and q (X1X2) pairs are compared (Figure 3).
3. Results and Analyses
3.1. Spatial and Temporal Distribution Characteristics of NDVI Changes
The yearly average NDVI of the area of the Qinghai-Tibet Plateau was computed using the NDVI distribution data from 2000 to 2017 (Figure 4). The NDVI in this area exhibits the characteristics of a distribution with more to the east and less to the west. Forest, meadow, grassland, desert, and semi-desert zones make up the vegetation conditions from the southeast to the northwest, which is compatible with the geographical distribution of NDVI mean values. On the Qinghai-Tibet Plateau, the humid climatic zone tends to have the highest multi-year NDVI regions, while the arid climate zone has the lowest mean NDVI values.
The southernmost region of the Tibet Autonomous Region has a lower elevation, more river resources, and greater tree growth. These factors contribute to the high NDVI values, which are mostly dispersed in the humid and semi-humid climatic zones. The northern portion of Sichuan has greater rainfall, enough water vapor, and an appropriate temperature, and the predominant plant types there are woods and shrubs. Because of its plentiful water resources and level topography, the region around Qinghai Lake has a much higher NDVI than the other locations. The majority of the NDVI low-value areas are found in arid and semi-arid regions. The Tarim Basin, which has a substantial region of desert with nearly no plant cover and a low NDVI, is characteristic of these areas. The northwest is higher in elevation and has more permafrost and glaciers. The Qinghai-Tibet Plateau, which has a large area of frozen soil and makes up 70% of China, has the biggest permafrost area at low latitudes, with the majority of it located in the northern Tibetan and southern Qinghai Plateaus. Only a small number of tundra plants can persist due to the cold temperature; hence, the NDVI value is low.
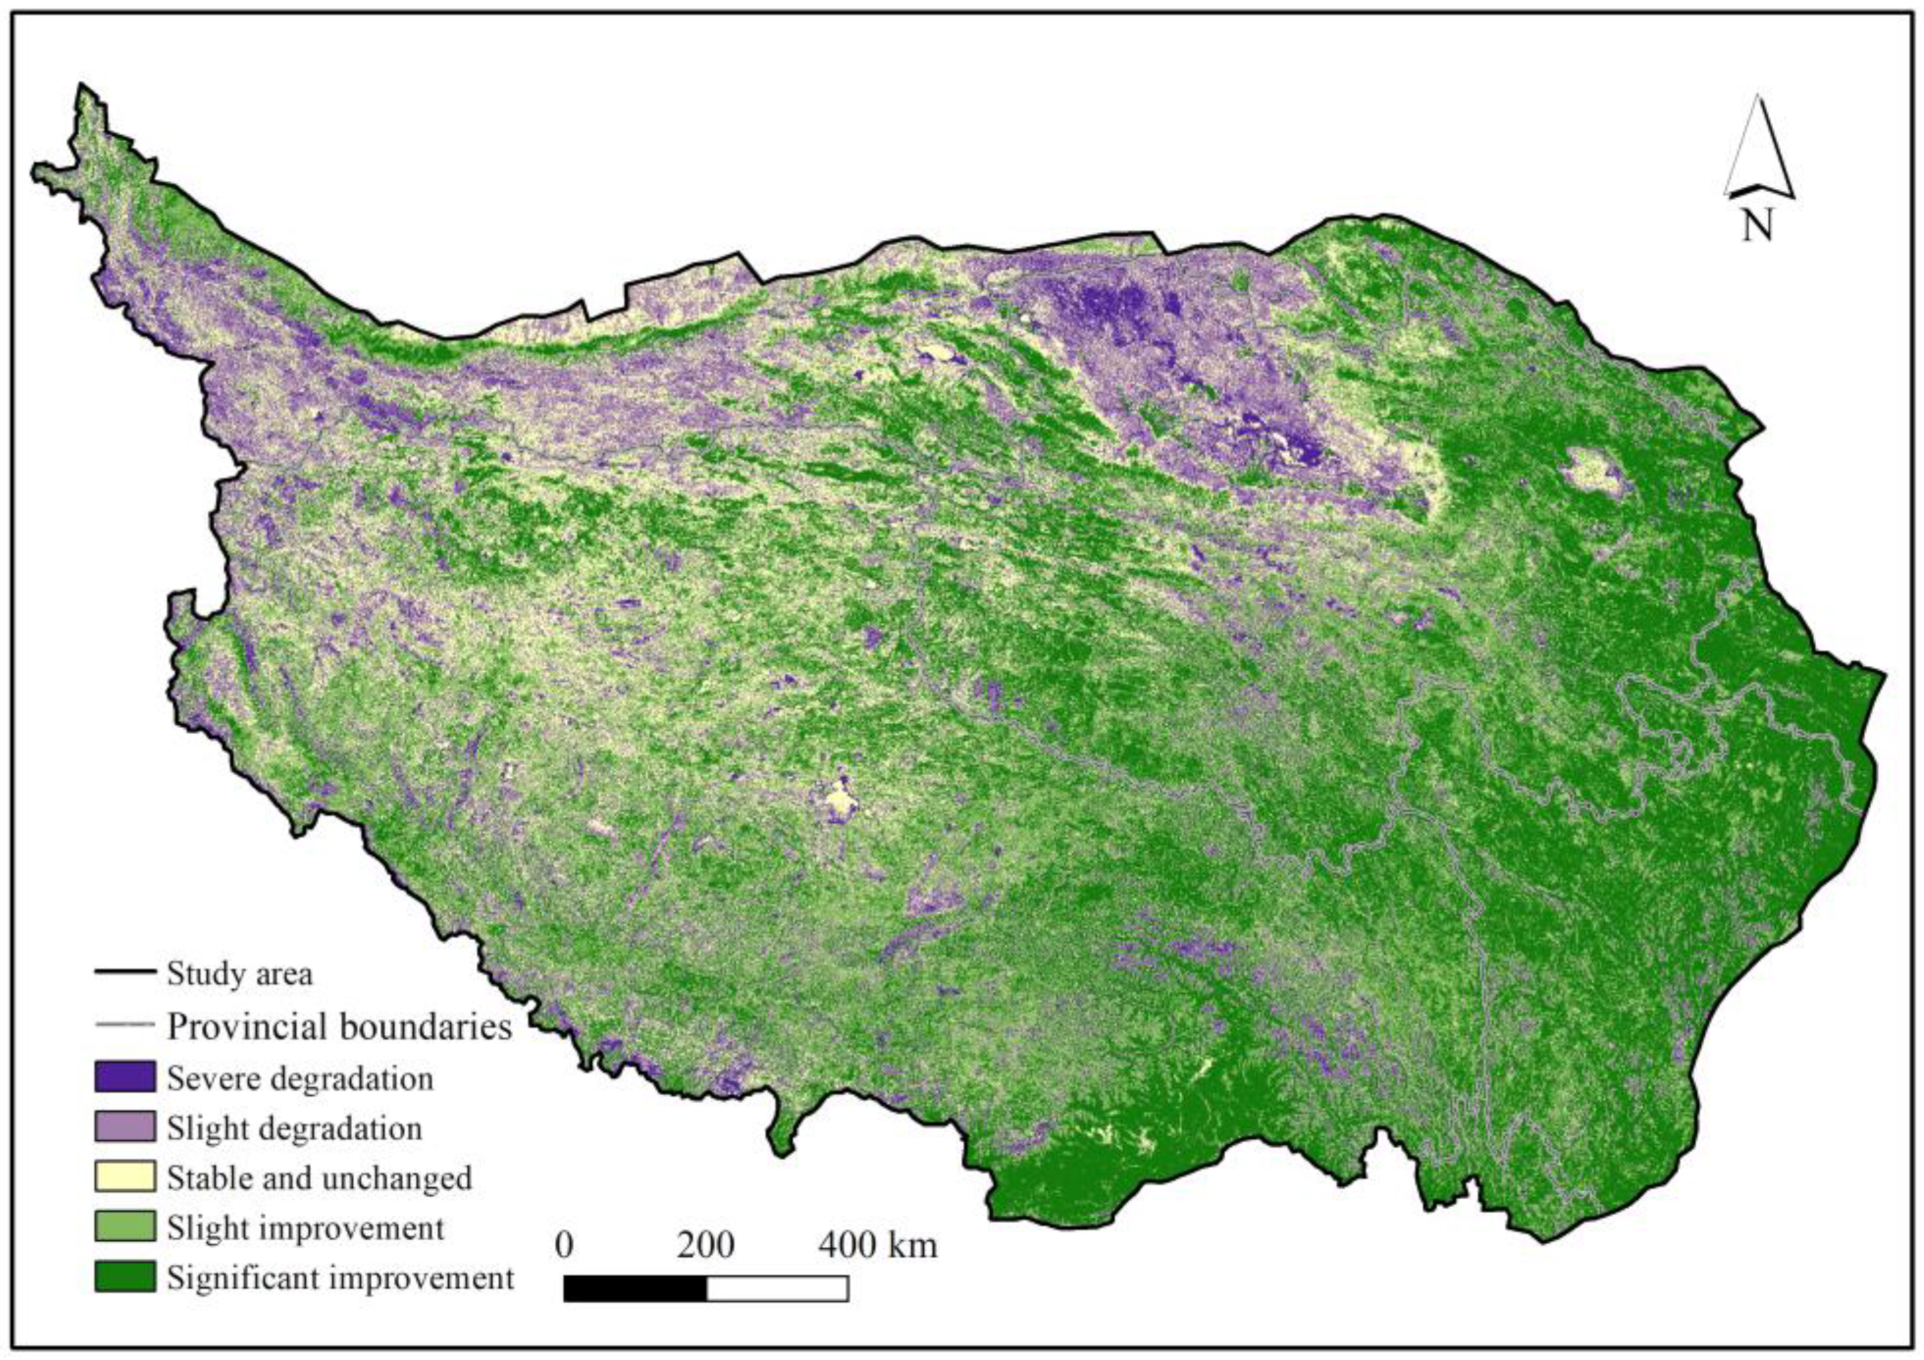
The NDVI trends in the region were analyzed using the Sen and Mann-Kendall model, and the results are shown in Figure 5. The proportion of NDVI greatly improved regions in the Qinghai-Tibet Plateau region is rather high, reaching 34.22%, as can be seen in Table 2. The NDVI improvement areas in this region account for more than half of the 26.42% of regions with minor improvement. The majority of these regions are found in the eastern region of the Qinghai-Tibetan Plateau, which is more suited for vegetation development due to its softer terrain and lower elevation than other regions. It has been determined that the recent changes in the global climate are beneficial to the growth of plants on the Qinghai-Tibet Plateau. In total, 16.74% of the entire area is made up of stable regions. Compared with Figure 1., we can see that more regions are part of the lake and river basins. The region also has a balanced ecosystem with healthy plant growth and a steady NDVI vegetation index thanks to the region’s year-round stable climatic and ecological environment. Only a small portion of the whole Qinghai-Tibet Plateau has significant NDVI deterioration, mostly in the Qaidam Basin, where severe desertification is occurring as a result of unique geological features, an arid climate, and little annual precipitation. In recent years, grazing, traffic construction, urbanization building, and other manmade causes have also consistently hampered the growth of the vegetation in this region in addition to environmental concerns. The NDVI has degraded slightly or perhaps severely as a result of this ecosystem’s vulnerability.
3.2. Distribution of Drivers
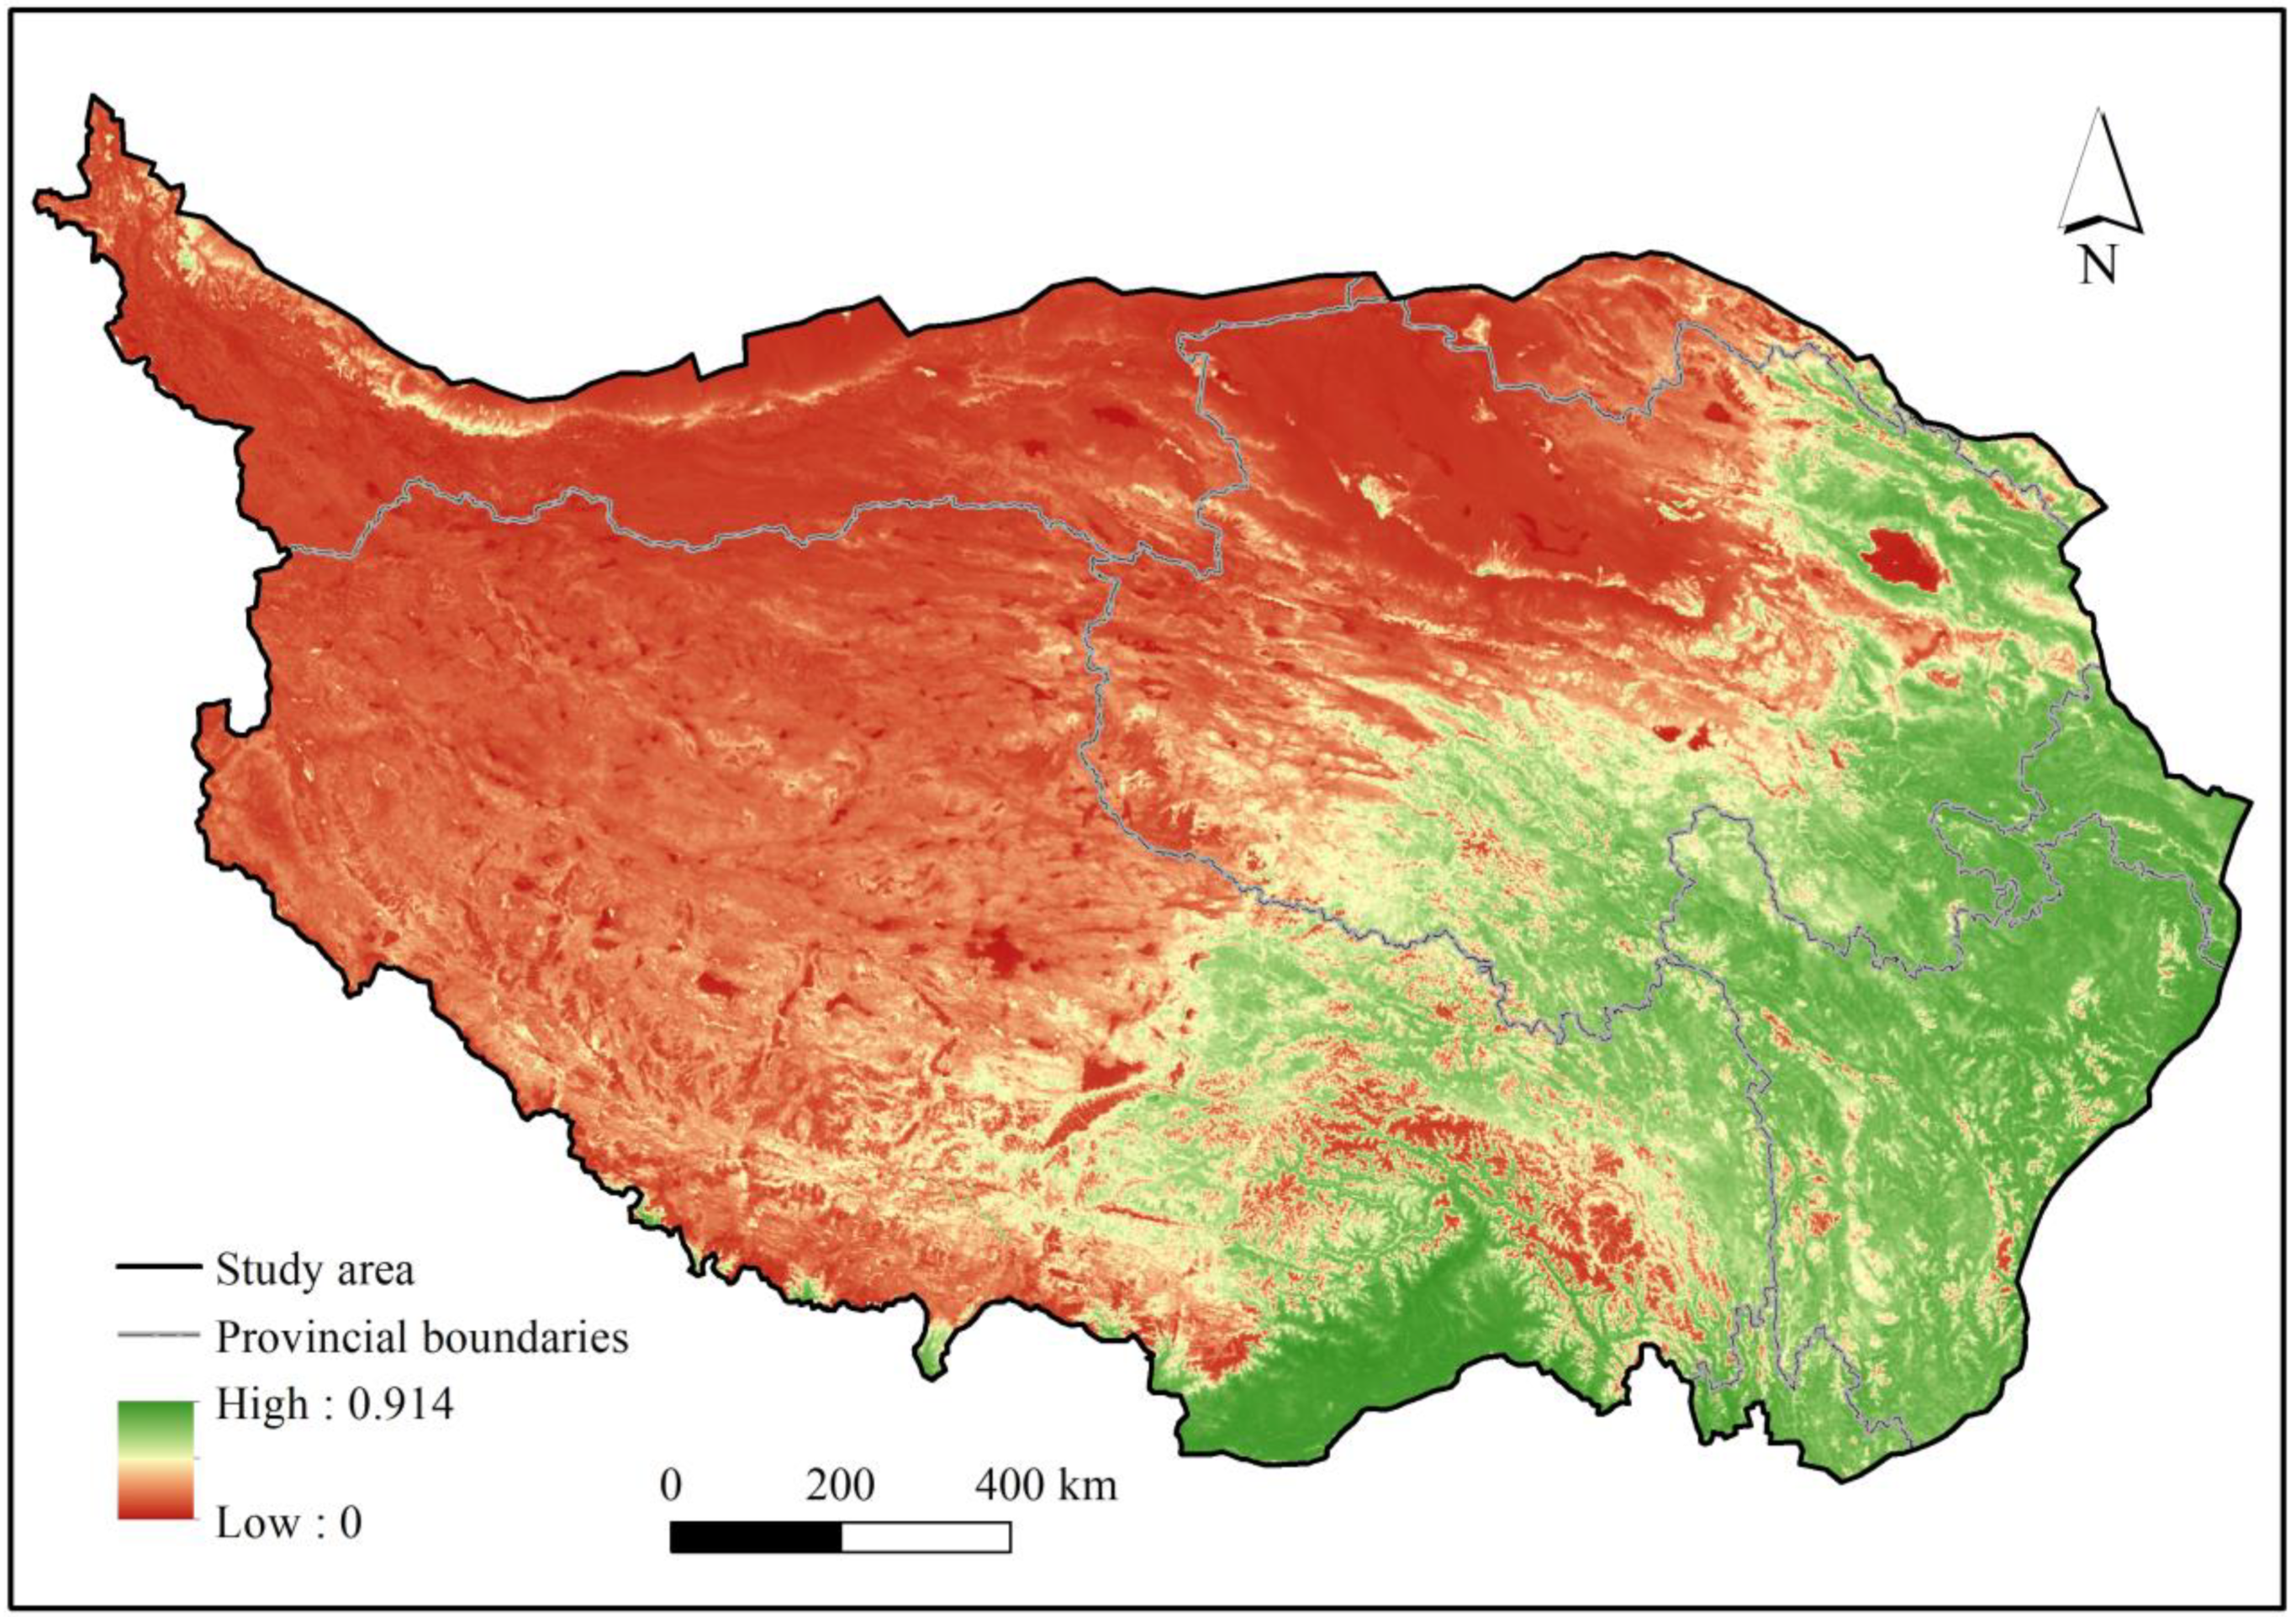
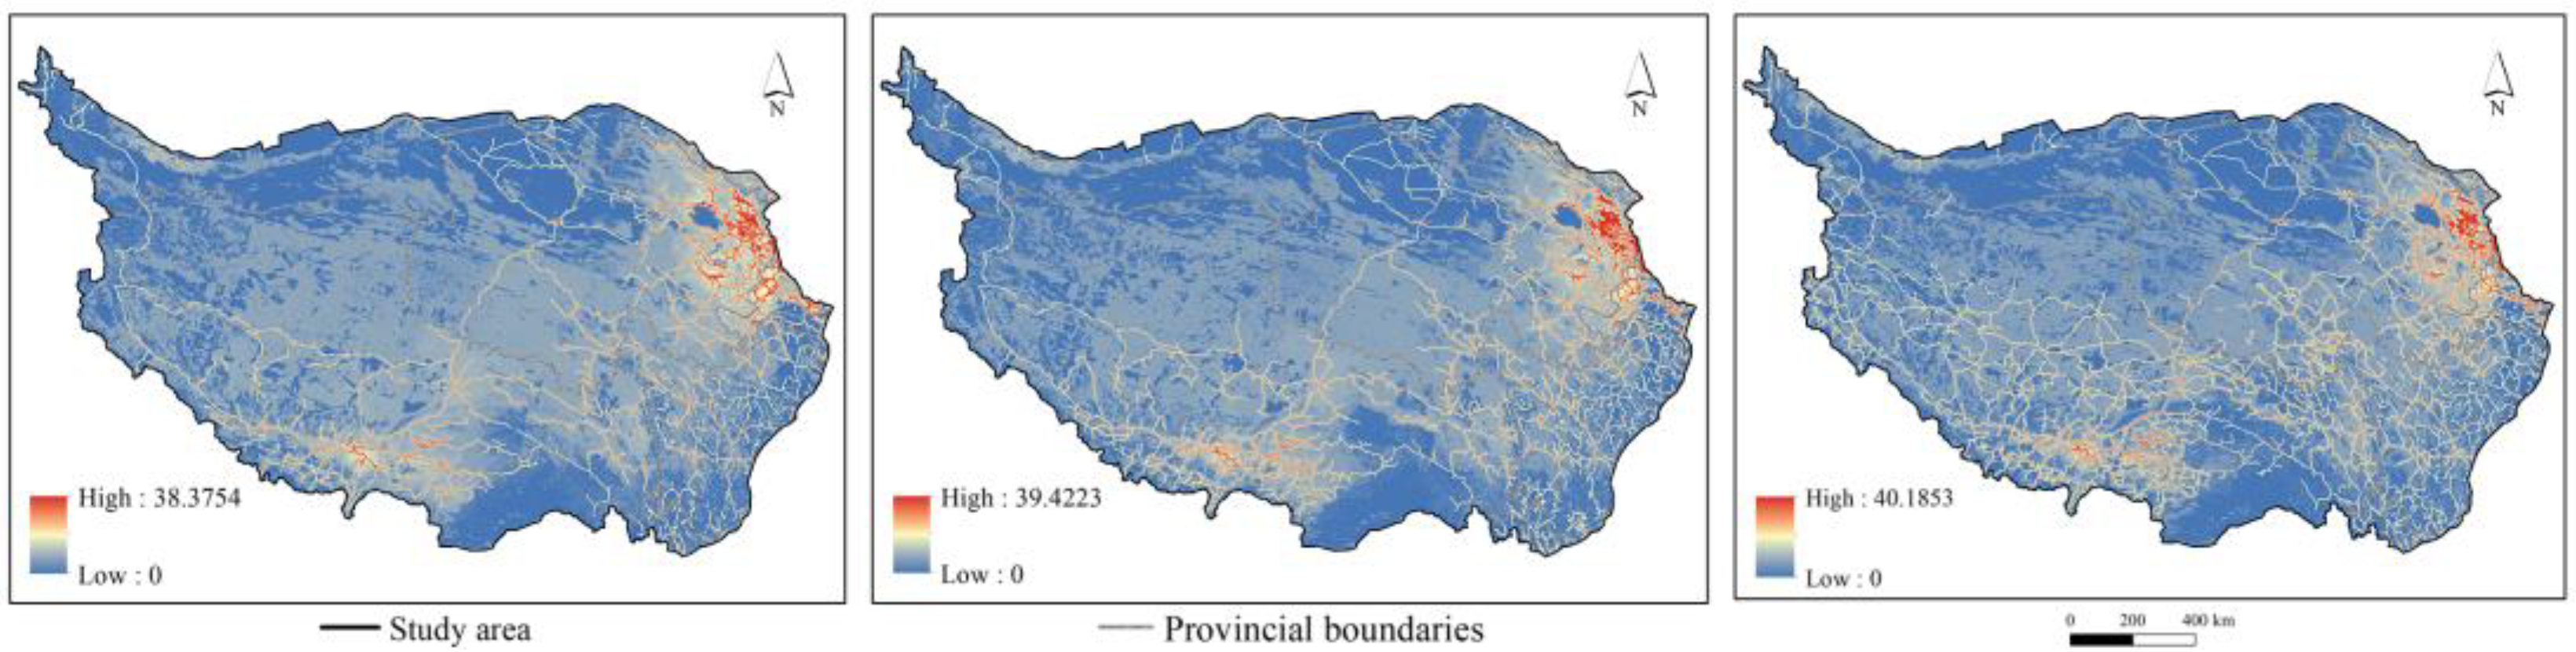
The data analysis and overlay of four types of spatial data layers, namely, population density, land use type, cattle and sheep density distribution, and traffic distribution, yielded three data sets of human activity intensity in the Qinghai-Tibet Plateau region in 2000, 2010, and 2017 (Figure 6). The Qinghai-Tibet Plateau region’s distribution of human activity intensity exhibits the following features listed below: the Qinghai Lake and the Yellow River Basin provide the most fundamental water sources to support the irrigation of farmland and urban economic construction in the region. High-intensity human activities are concentrated in the northeastern part of the Qinghai-Tibet Plateau region, particularly around Xining City in Qinghai Province. Convenient transportation is one of the key factors for people to travel, work, and live in the area, and the development of the railroad and roads in the area is also established initially. The greater population dispersal and higher levels of human activity are the results of the region’s favorable physical setting and early urbanization. Second, the southern region of TAR has a larger concentration of human activity. The majority of this region is situated in the Yarlung Tsangpo River basin, close to the city of Lhasa. The Yarlung Tsangpo River’s valleys often exhibit a stripe-like distribution. Because of its comparatively low and flat topography, milder temperature, and an abundance of water supplies, the area is appropriate for human habitation. The shift in the intensity of human activity from 2000 to 2017 demonstrates the importance of transportation facility distribution for human activity. People in the Qinghai-Tibet Plateau area began their lives in relative seclusion because of the region’s harsher topography and the greater number of glacial mountains. In contrast, since the turn of the century, more advanced railroad construction technology has allowed China to overcome a number of challenges, including the geographical disadvantage of glacial snowfields and the difficult working environment of low temperature and low oxygen, ushering in the era of high-speed railways in the Qinghai-Tibet Plateau region. The region’s population migration and economic expansion have been made possible by improved rail and road transportation infrastructure.
3.3. Impacts of Climate Change and Human Activities on NDVI
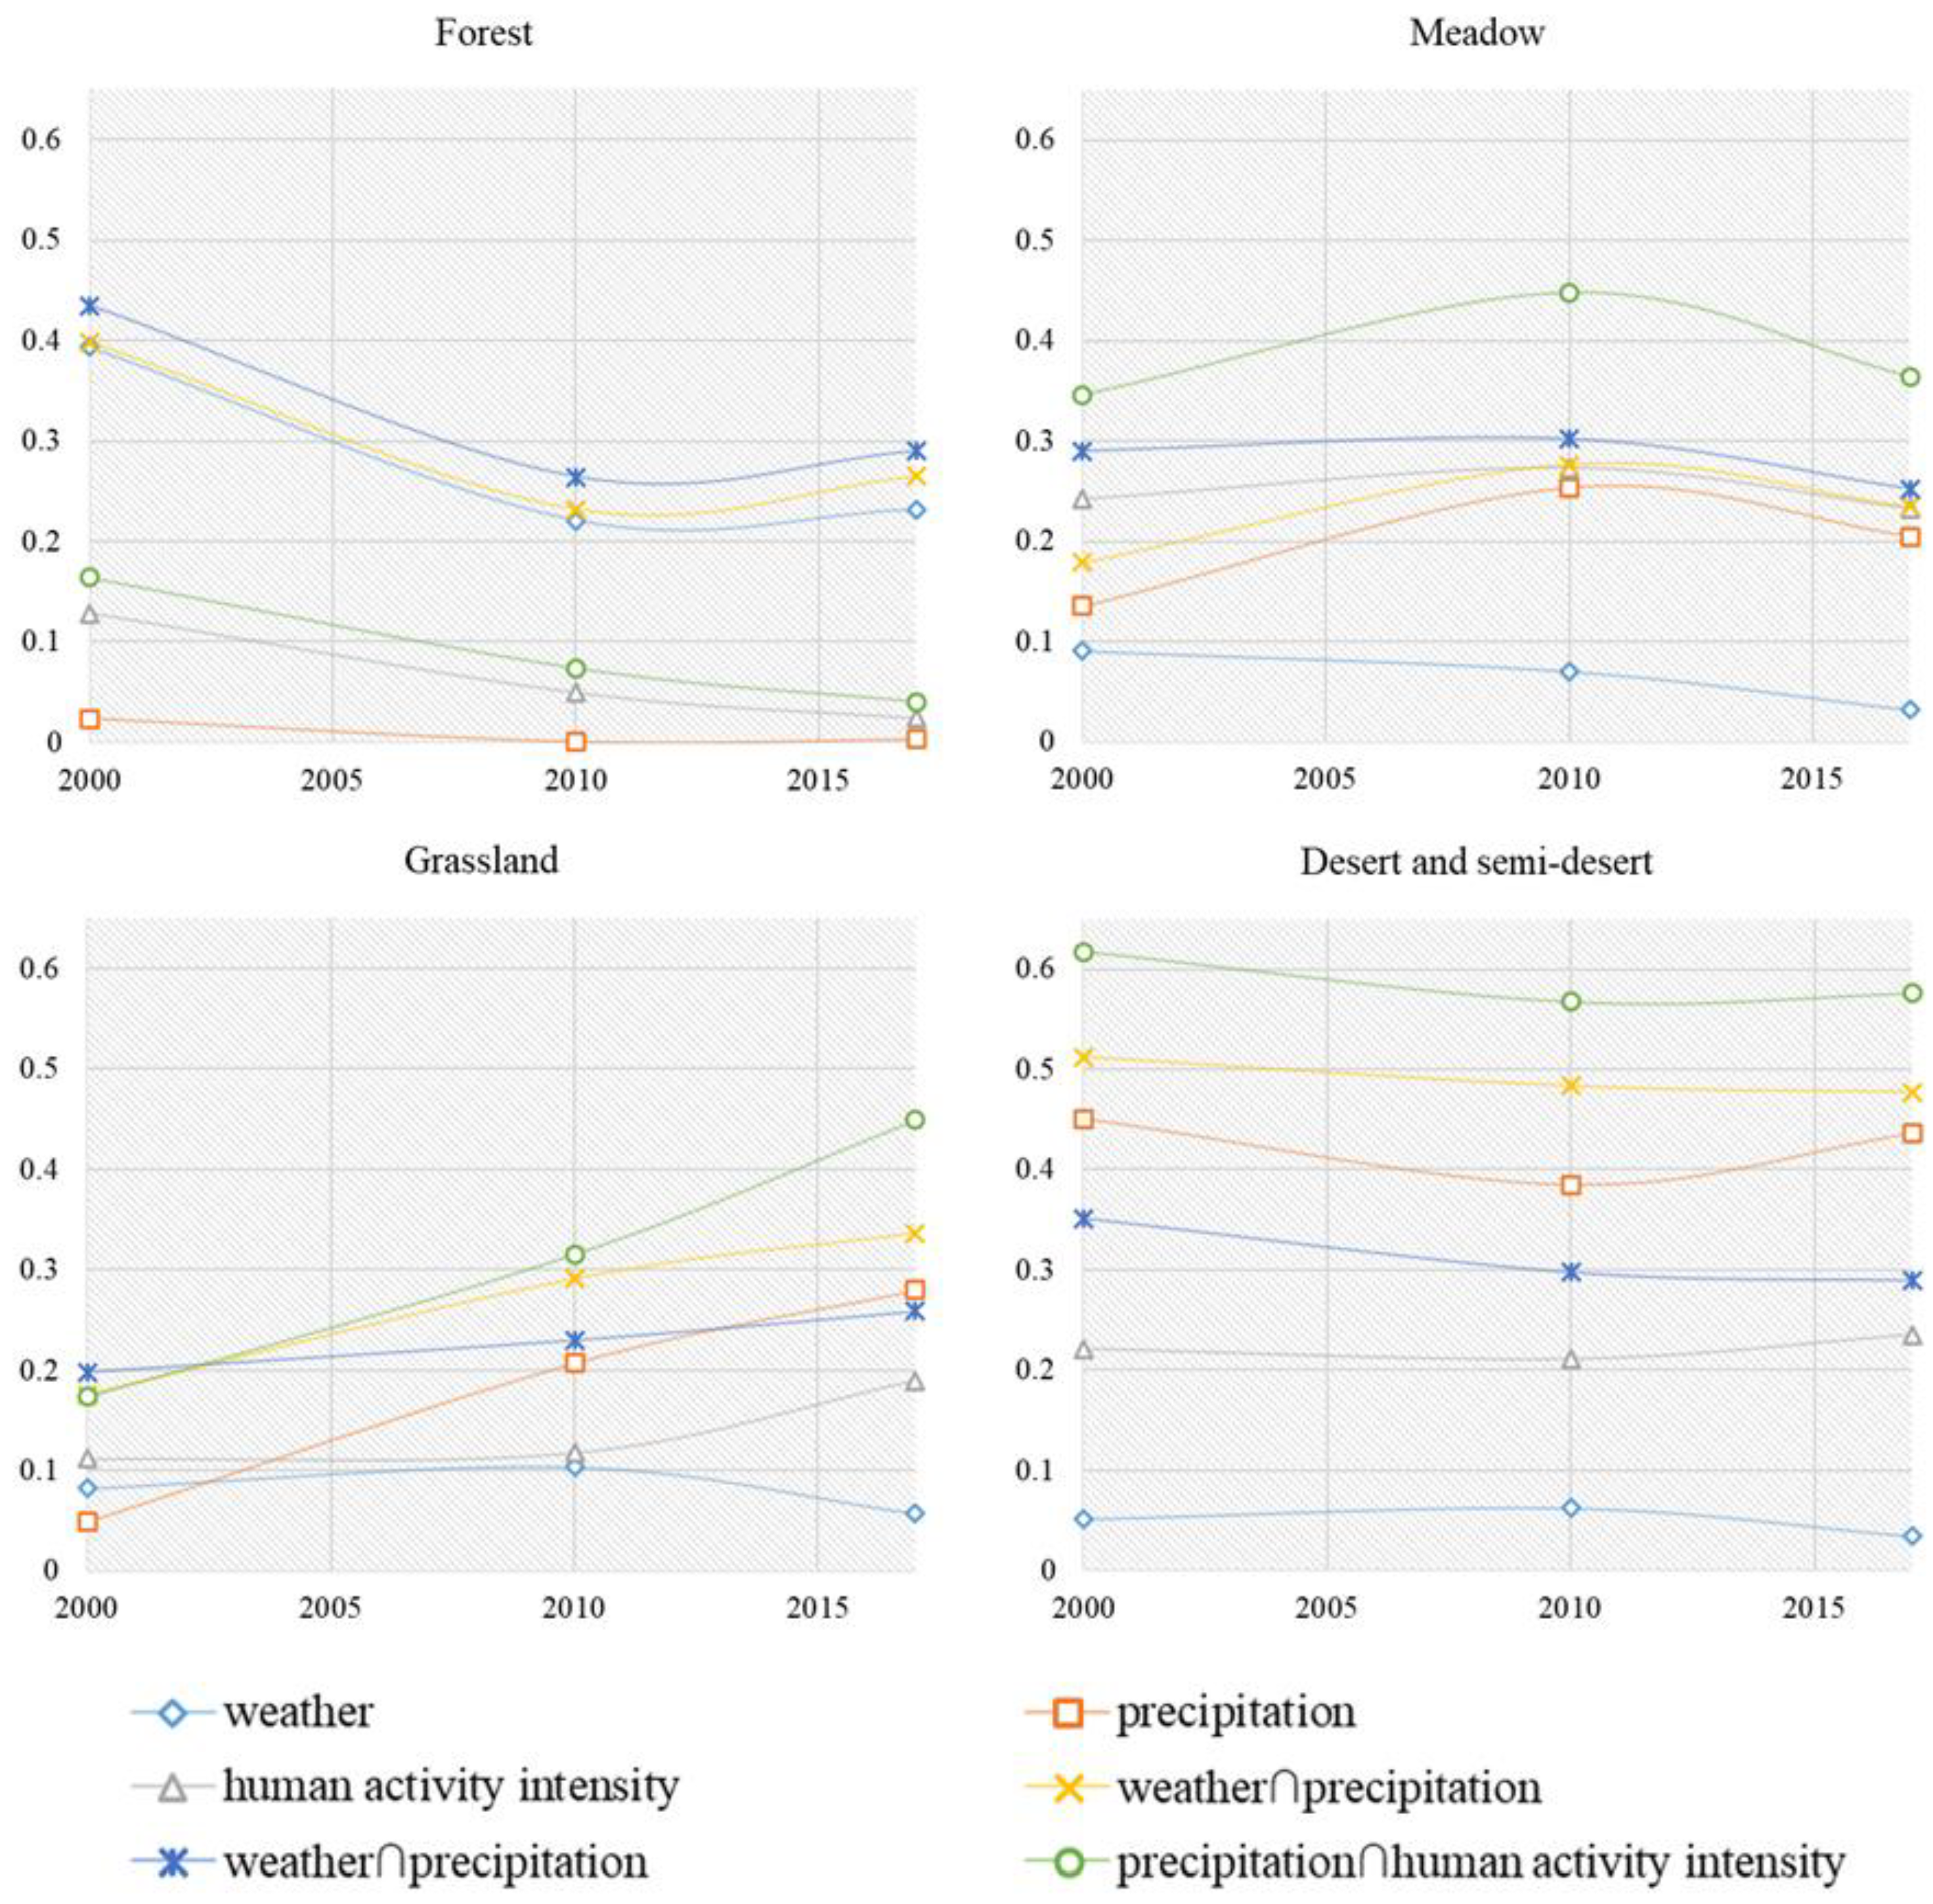
As can be seen in Table 3 and Table 4, the forest zone in 2000 had the greatest q value of the temperature component, which accounted for 39% of the NDVI values. The findings of the interaction detection showed that, in comparison to the single component, the influence of temperature and precipitation on the regional distribution of NDVI was greater. The geographical distribution of NDVI in the altered region was additionally enhanced by the following two factors: temperature and human activity level. The geographical distribution of NDVI in the region was nonlinearly improved by the precipitation and anthropogenic intensity variables. Overall, in the forest zone, the NDVI spatial distribution results are somewhat influenced by temperature, precipitation, and the intensity of human activity. The NDVI spatial distribution bivariate was enhanced in the meadow zone by interactions between all three independent factors, and this interaction had a significantly greater impact than a single independent variable alone. All three independent factors interacted with one another and had a non-linear enhancing impact in the grassland zone. Precipitation had the greatest q value and a 45% effect on the dependent variable in the desert and semi-arid regions. A two-factor amplification effect was created by the components of precipitation and human activity intensity. The primary variables determining the spatial distribution of NDVI in the area varied greatly with the shift in vegetation zones.
As can be shown in Table 5 and Table 6, the forest zone in 2010 had the greatest q value for the temperature factor, the second-highest q value for human activity intensity, and the lowest q value for precipitation. The independent variable variables interacted with one another, much like the results of the interaction detection in the forest zone in 2000, to have a higher impact on the geographical distribution of NDVI than the results of the single-factor interaction. Temperature and level of human activity both had a stronger impact on the distribution of NDVI in the woodland zone. In the meadow zone, precipitation and human activity intensity had similar q values. The geographical distribution of NDVI was enhanced by two variables that interacted with one another. The factors of precipitation, the intensity of human activity, and temperature in the meadow zone improved the spatial distribution of NDVI, and the relationship between vegetation cover and the intensity of human activity grew stronger between 2000 and 2010 as a result of the brisk domestic economic growth, the gradual improvement of railroads and highways, the expansion of the human living footprint, and the shift in the demand for construction land. In the desert and semi-arid zone, the maximum q value of the precipitation factor was 0.38. Precipitation and its associated components have a significant impact on the NDVI distribution in the area, mirroring the findings of interaction detection in 2000. While human activity levels are low, the environment in this area is harsher and more adverse to the growth of flora.
The temperature and the intensity of human activity were the key influencing elements of the forest zone in 2017, as indicated in Table 7 and Table 8, with the intensity of human activity factor having a q value of 0.23. The extent of the intensity of the human activity factor’s effect on the geographical distribution of NDVI steadily increased when combined with the findings of the interaction detection of each factor in the forest zone in 2000 and 2010. As a result of the region’s relatively low elevation in northern Tibet’s forest region, trees flourish there. The link between the geographical distribution of NDVI and the intensity of the human activities in this area is weaker due to the lower population and fewer transportation routes. The intensity of human activity has grown, and the effect on the distribution of vegetation has steadily extended in northern Sichuan, in contrast, where road development has become increasingly extensive in recent years due to improving urban infrastructure. In the meadow zone, the q-values of human activity intensity and precipitation factor are close to one another, with human activity intensity being more significant. The results are consistent with interaction detection results in 2000 and 2010, showing that human activity intensity has a greater impact on NDVI spatial distribution than it does on meadow zone temperature. The meadow zone is more suitable for human settlement and construction operations when combined with the geographical environment, altitude, economic construction, and other objective conditions in this zone, so the intensity of human activities has a greater impact on the spatial distribution of NDVI in this zone. We discovered that the interaction of precipitation and other factors had the biggest impact on the spatial distribution pattern of NDVI when comparing the results of interaction detection of various factors in the meadow zone in 2000 and 2010. Urban development underwent a fast transformation between 2000 and 2010, which had a significant impact on the intensity of human activity. Grazing operations in the area declined between 2010 and 2017, and urban development slowed down somewhat. As a result, there was a small reduction in the effect of human activity intensity on the geographical distribution of NDVI. The greatest q value of precipitation, 0.44, is found in the desert and semi-arid zone. The NDVI distribution in this area is significantly influenced by precipitation and human activity intensity variables, which is consistent with the findings in 2000 and 2010. The desert and semi-desert zones of this area, which is in the northern section of the Qinghai-Tibet Plateau, are arider with little variation in temperature, making them unsuitable for the growth of plants. Therefore, the amount of precipitation has a direct impact on the region’s vegetation distribution and rate of growth. The intensity of human activity affects the spatial distribution of NDVI significantly because it affects the distribution of population density, construction land distribution, cattle and sheep grazing distribution, and road distribution, all of which can directly increase or decrease the area covered by vegetation.
4. Discussion
4.1. Sen and Mann-Kendall Trend Analysis Method
Sen’s slope trend analysis may successfully avoid the impacts of missing time series data and data distribution patterns, as well as the interference of outliers on the time series, as compared to the conventional least squares approach for linear regression trend analysis [41]. A low data series distribution is required for the Mann-Kendall approach, and the existence of outliers does not result in outliers do not significantly alter the series analysis when they are present. Consequently, the Mann-Kendall nonparametric test is typically employed in conjunction with Sen’s slope estimate [33]. Sen and Mann-Kendall trend analysis may be used to assess trends and significance at the image metric scale, whereas linear regressions are often employed to study trends at the regional scale. The Qinghai-Tibet Plateau region did not see considerable climatic change between 2000 and 2017; however, because of its location and the size of the research area, there are likely to be differences between the distribution features of human activity intensity and the total NDVI. It is likely that there are some abnormalities. For examining the regional and temporal fluctuation of NDVI in the Qinghai-Tibet area, the Sen and Mann-Kendall trend analysis approach is more appropriate.
4.2. Spatial and Temporal Variation in Geodetected Results
The temperature has been the main factor determining NDVI [42], with precipitation and human activity intensity having less of an impact on NDVI in the forest zone between 2000 and 2017. Less human activity is present in this area, which has a higher distribution of trees. The component analysis of the meadow zone reveals that the interplay of precipitation and human activity factors significantly influences the distribution of vegetation greenness. Among the single factors, the intensity of human activity has the most impact. The meadow zone mostly lies in a humid region with 600–800 mm of precipitation annually. The ecological setting in this region is appropriate for economic development and human settlement, and any alterations brought about by human activity will have an immediate effect on the distribution of vegetation. The state has recently made a number of deployments to create ecological nature reserves in the Sanjiangyuan and Hengduan Mountains, and these initiatives are crucial to boosting the region’s vegetation’s greenness. The regional distribution of NDVI for the grassland zone generally exhibits an upward tendency for all factors, with the temperature factor’s effect being the only one to show a downward trend. People have been working on grassland conservation, such as artificial grassland conservation and the use of grassland fencing, which supplies fodder and also allows cattle, sheep, and other livestock to lessen their influence on natural grassland and maintain its growth. As a result, between 2000 and 2017, the effect of human activity and precipitation patterns on the spread of vegetation rose quickly. In the desert and semi-arid regions, all elements continued to have an impact on how vegetation is distributed, with precipitation and its interaction factors having the most impact on how vegetation grows. The living conditions are harsher in desert and semi-desert regions, and the intensity of human activity is relatively low, which has little impact on the growth of vegetation in these regions. Therefore, in dry locations, precipitation directly affects how much vegetation grows.
The discrepancies in the geographical distribution of NDVI in the area were also impacted by geography. Temperature is the primary determinant of NDVI in the forest zone, as indicated in Figure 7, but in the meadow zone, the temperature has the least bearing, and human activity intensity has the greatest bearing. The intensity of human activity is higher in the meadow zone when taking into account the combined geographical environment, altitude, economic construction, and other objective circumstances of these two zones. The meadow zone has a bigger population that is centered in and around Lhasa city, has stronger economic growth, and is ideal for grazing sheep and cattle. Urbanization has a bigger influence on the alteration of ecological construction land type because it necessitates more land for development and that land often has lower altitude and flat terrain. Keeping sheep and cattle is also one of the villagers’ primary sources of income. As for the development of flora, natural grazing will have a significant influence. The meadow zone’s natural surroundings are superior, with flatter topography, more frequent rainfall, and more consistent climatic conditions overall. Therefore, in this part of the meadow, the human activity intensity component has the most impact on the spatial distribution of NDVI. Cross-testing findings revealed that the three independent factors interacted with one another in the 2000 Qinghai-Tibet Plateau grassland zone and had a stronger non-linear enhancing impact on the spatial distribution of NDVI than the single component. The three components’ q values are often low when compared to the outcomes of interaction detection in other regions, which suggests that the effect of precipitation, temperature, and human activity intensity on NDVI values in the grassland zone is smaller than it is in other regions. A lot of the northern steppe zone’s mountains and glaciers are covered in snow, and it is typically fairly high up. The majority of the vegetation in this area is tundra and other alpine plants. Additionally, the region is lightly inhabited, has limited urban development, and shows little evidence of grazing, all of which will have little effect on the vegetation cover. Additionally, the southern region, specifically the region near Qinghai Lake, has more vegetation. The footprint of human activities has a greater impact on the vegetation cover in the city of Xining due to its stronger economic growth, dense population, increased road building, and increased infrastructure.
5. Conclusions
We use Sen and Mann-Kendall trend analysis to examine the spatial distribution of vegetation NDVI and its change trends, and we use the geodetector model to analyze the effects of data on the intensity of human activity and weather on the spatial distribution of vegetation NDVI in the Qinghai-Tibet Plateau region. The following are the paper’s key findings:
- The Qinghai-Tibet Plateau’s vegetation’s NDVI reveals that it is more abundant in the east and less so in the west. Forest, meadow, grassland, and desert regions make up the vegetation from the southeast to the northwest. The area with considerably improved NDVI accounted for a comparatively high percentage of 34.22% throughout these 18 years, whereas the area with severe deterioration accounted for the least percentage of 4.12% of the studied area. The NDVI distribution is enhanced by the steady temperature and biological surroundings, which promote plant development. The region’s vegetation NDVI will deteriorate due to anthropogenic causes (such as grazing, traffic, urbanization building, etc.) and the fragility of the environment;
- In the Qinghai-Tibet Plateau region, there are significant variances in the geographical distribution of human activity intensity. The near proximity to rivers, geographic considerations, urbanization, and easy access to transportation are hallmarks of the regional distribution of high-intensity human activities. In established urban regions, there is a concentration of people. The development of roads and railroads has improved locals’ quality of life, encouraged local population movement, and stimulated economic development;
- The relationship between the level of human activity and climatic variables on the Qinghai-Tibet Plateau has an impact on the vegetation’s geographical distribution of greenness. The NDVI spatial distribution in the meadow zone is influenced by both human and climate factors, with the intensity of human activity having the biggest impact on the NDVI distribution in 2010 and 2017. According to interactive detection results from 2000, 2010, and 2017, the temperature has the greatest impact on the NDVI distribution in the forest zone. The intensity of human activity has the largest impact on the geographical distribution of NDVI in the meadow zone, with the q value reaching 0.27 in 2010. Both anthropogenic and climatic influences affect NDVI, with the former having a greater impact. The intensity of human activity is having a greater influence on the geographical distribution of vegetation NDVI with the accelerating economic growth.
6. Limitations and Future Prospects
There are still legitimate problems with this paper’s analysis of the impacts of human activity intensity on vegetation greenness in a climatic setting. It covers each one individually in terms of time series, changes in geographic distribution, and various vegetation zones.
- Due to the challenge of collecting data in the Qinghai-Tibet Plateau area, only five indicators—population density, land use, cattle and sheep density, railroad distribution, and road distribution—were used to generate the anthropogenic activity intensity dataset in this work. Numerous elements, such as social interest centers and tourism attractions, are included in the human activity footprint. The distribution of temples also serves as an indicator of the level of human activity because of the religious convictions of those who live on the Qinghai-Tibet Plateau. If there are more data available, the accuracy of data on human activity intensity will be considerably increased. There is still much to learn about how to quantify the level of human activity;
- In this study, the impact of climate change on the regional distribution of vegetation NDVI was examined using just the following two variables: temperature and precipitation. Relative humidity, solar radiation, and evapotranspiration are all significant contributors to climate change, which is essential for the development of plants. Climate conditions are a highly complicated system. Altitude has a significant impact on plant distribution in the Qinghai-Tibet Plateau area because of its unique geographic position. Future research will take into account altitude, slope, and diverse meteorological circumstances, as well as perform in-depth investigations to better understand the geographical distribution of vegetation NDVI under climate change. The correctness of the experimental findings may be confirmed, and experimental uncertainty can be avoided if field measurements can be carried out in the research region to collect the measured meteorological and vegetation data;
- Using a geodetector, this study examined the effects of human activity intensity on the spatial distribution of vegetation NDVI in the context of climate change. The analysis was conducted from the perspectives of various years and vegetation zones, and while the results were unambiguous, they could not be combined for comparison. The examination of the effect factors on the distribution of vegetation NDVI in the area would be clearer if the analysis findings of many dimensions can be provided thoroughly in the future.
Author Contributions
Conceptualization, L.S., H.L., J.W. (Jia Wang) and N.X.; methodology, L.S. and H.L.; software, L.S., H.L., Y.C., J.W. (Jing Wang) and J.X.; validation, L.S. and H.L.; formal analysis, L.S., H.L., Y.C., J.W. (Jing Wang) and J.X.; investigation, L.S. and H.L.; resources, L.S. and H.L.; data curation, L.S.; writing—original draft preparation, L.S. and H.L.; writing—review and editing, L.S., H.L., J.W. (Jia Wang), N.X. and Z.W.; visualization, L.S. and H.L.; supervision, J.W. (Jia Wang); project administration, J.W. (Jia Wang); funding acquisition, J.W. (Jia Wang). All authors have read and agreed to the published version of the manuscript.
Funding
This work was supported by the Second Tibetan Plateau Exploration (Grant No.2019QZKK0608) and National Natural Science Foundation of China (Grant No.42171329, No.42077454).
Data Availability Statement
Not applicable.
Acknowledgments
We are grateful to the undergraduate students and staff of the Laboratory of Forest Management and “3S” technology, Beijing Forestry University.
Conflicts of Interest
The authors declare no conflict of interest. The funders had no role in the design of the study; in the collection, analyses, or interpretation of data; in the writing of the manuscript; or in the decision to publish the results.
References
- Qiu, J. China: The third pole. Nature 2008, 454, 393–396. [Google Scholar] [CrossRef] [PubMed] [Green Version]
- Gao, X.; Li, T.; Cao, X. Spatial Fairness and Changes in Transport Infrastructure in the Qinghai-Tibet Plateau Area from 1976 to 2016. Sustainability 2019, 11, 589. [Google Scholar] [CrossRef] [Green Version]
- Chen, J.; Yan, F.; Lu, Q. Spatiotemporal Variation of Vegetation on the Qinghai–Tibet Plateau and the Influence of Climatic Factors and Human Activities on Vegetation Trend (2000–2019). Remote Sens. 2020, 12, 3150. [Google Scholar] [CrossRef]
- Chen, B.; Zhang, X.; Tao, J.; Wu, J.; Wang, J.; Shi, P.; Zhang, Y.; Yu, C. The impact of climate change and anthropogenic activities on alpine grassland over the Qinghai-Tibet Plateau. Agric. For. Meteorol. 2014, 189–190, 11–18. [Google Scholar] [CrossRef]
- Wang, J.; Zhao, J.; Li, C.; Zhu, Y.; Kang, C.; Gao, C. The spatial-temporal patterns of the impact of human activities on vegetation coverage in China from 2001 to 2015. Acta Geogr. Sin. 2019, 74, 504–519. (In Chinese) [Google Scholar] [CrossRef]
- Li, S.; Yan, J.; Liu, X.; Wan, J. Response of vegetation restoration to climate change and human activities in Shaanxi-Gansu-Ningxia Region. J. Geogr. Sci. 2013, 23, 98–112. [Google Scholar] [CrossRef]
- Luo, L.; Ma, W.; Zhuang, Y.; Zhang, Y.; Yi, S.; Xu, J.; Long, Y.; Ma, D.; Zhang, Z. The impacts of climate change and human activities on alpine vegetation and permafrost in the Qinghai-Tibet Engineering Corridor. Ecol. Indic. 2018, 93, 24–35. [Google Scholar] [CrossRef]
- Du, Y.; Yan, Q.; Luo, C.; Tong, L. Spatial and temporal variation characteristics of fractional vegetation cover in Qinghai province from 2009 to 2015. In Proceedings of the 2016 4th International Workshop on Earth Observation and Remote Sensing Applications (EORSA), Guangzhou, China, 4–6 July 2016; pp. 169–173. [Google Scholar] [CrossRef]
- Szabó, S.; Elemér, L.; Kovács, Z.; Püspöki, Z.; Kertész, Á.; Singh, S.K.; Balázs, B. NDVI dynamics as reflected in climatic variables: Spatial and temporal trends—A case study of Hungary. GISci. Remote Sens. 2019, 56, 624–644. [Google Scholar] [CrossRef]
- Bucala, A. The impact of human activities on land use and land cover changes and environmental processes in the Gorce Mountains (Western Polish Carpathians) in the past 50 years. J. Env. Manag. 2014, 138, 4–14. [Google Scholar] [CrossRef]
- Wu, Y.; Luo, Z.; Wu, Z. The Different Impacts of Climate Variability and Human Activities on NPP in the Guangdong–Hong Kong–Macao Greater Bay Area. Remote Sens. 2022, 14, 2929. [Google Scholar] [CrossRef]
- Zhu, W.; Pan, Y.; Yang, X.; Song, G. Comprehensive analysis of the impact of climatic changes on Chinese terrestrial net primary productivity. Chin. Sci. Bull. 2007, 52, 3253–3260. [Google Scholar] [CrossRef]
- Wang, D.; Qin, W.; Jia, G.; Shan, Z.; Hao, M. Assessing the effects of climate variability and vegetation conversion on variations of net primary productivity in the mountainous area of North China. For. Ecol. Manag. 2022, 506, 119957. [Google Scholar] [CrossRef]
- Creutzig, F.; Bren d’Amour, C.; Weddige, U.; Fuss, S.; Beringer, T.; Gläser, A.; Kalkuhl, M.; Steckel, J.C.; Radebach, A.; Edenhofer, O. Assessing human and environmental pressures of global land-use change 2000–2010. Glob. Sustain. 2019, 2, 75–99. [Google Scholar] [CrossRef]
- Kaplan, J.O.; Krumhardt, K.M.; Zimmermann, N. The prehistoric and preindustrial deforestation of Europe. Quat. Sci. Rev. 2009, 28, 3016–3034. [Google Scholar] [CrossRef]
- Evans, J.; Geerken, R. Discrimination between climate and human-induced dryland degradation. J. Arid Environ. 2004, 57, 535–554. [Google Scholar] [CrossRef]
- Morawitz, D.F.; Blewett, T.M.; Cohen, A.; Alberti, M. Using NDVI to assess vegetative land cover change in central Puget Sound. Env. Monit Assess 2006, 114, 85–106. [Google Scholar] [CrossRef]
- Boschetti, M.; Nutini, F.; Brivio, P.A.; Bartholomé, E.; Stroppiana, D.; Hoscilo, A. Identification of environmental anomaly hot spots in West Africa from time series of NDVI and rainfall. ISPRS J. Photogramm. Remote Sens. 2013, 78, 26–40. [Google Scholar] [CrossRef]
- Gao, X.; Li, T.; Sun, D. Regional Differentiation Regularity and Influencing Factors of Population Change in the Qinghai-Tibet Plateau, China. Chin. Geogr. Sci. 2021, 31, 888–899. [Google Scholar] [CrossRef]
- He, P.; Bi, R.T.; Xu, L.S.; Wang, J.S.; Cao, C.B. Using geographical detection to analyze responses of vegetation growth to climate change in the Loess Pla-teau, China. Ying Yong Sheng Tai Xue Bao 2022, 33, 448–456. (In Chinese) [Google Scholar] [CrossRef]
- Qi, P.; Zhang, X. Spatiotemporal variation characteristics and driving factors of vegetation cover in Chongqing from 2000 to 2019. Acta Geogr. Sin. 2022, 42, 5427–5436. (In Chinese) [Google Scholar]
- Chen, D.; Xu, B.; Yao, T.; Guo, Z.; Cui, P.; Chen, F.; Zhang, R.; Zhang, X.; Zhang, Y.; Fan, J.; et al. Assessment of past, present and future environmental changes on the Tibetan Plateau. Chin. Sci. Bull. 2015, 60, 3025–3035. (In Chinese) [Google Scholar] [CrossRef]
- Gao, Q.; Zhu, W.; Schwartz, M.W.; Ganjurjav, H.; Wan, Y.; Qin, X.; Ma, X.; Williamson, M.A.; Li, Y. Climatic change controls productivity variation in global grasslands. Sci Rep 2016, 6, 26958. [Google Scholar] [CrossRef] [PubMed] [Green Version]
- Huang, K.; Zhang, Y.; Zhu, J.; Liu, Y.; Zu, J.; Zhang, J. The Influences of Climate Change and Human Activities on Vegetation Dynamics in the Qinghai-Tibet Plateau. Remote Sens. 2016, 8, 876. [Google Scholar] [CrossRef] [Green Version]
- Brandt, M.; Rasmussen, K.; Penuelas, J.; Tian, F.; Schurgers, G.; Verger, A.; Mertz, O.; Palmer, J.R.B.; Fensholt, R. Human population growth offsets climate-driven increase in woody vegetation in sub-Saharan Africa. Nat. Ecol. Evol. 2017, 1, 81. [Google Scholar] [CrossRef] [PubMed] [Green Version]
- Chen, C.; Park, T.; Wang, X.; Piao, S.; Xu, B.; Chaturvedi, R.K.; Fuchs, R.; Brovkin, V.; Ciais, P.; Fensholt, R.; et al. China and India lead in greening of the world through land-use management. Nat. Sustain. 2019, 2, 122–129. [Google Scholar] [CrossRef]
- You, Q.; Kang, S.; Li, J.; Chen, D.; Zhai, P.; Ji, Z. Several research frontiers of climate change over the Tibetan Plateau. J. Glaciol. Geocryol. 2021, 43, 885–901. (In Chinese) [Google Scholar] [CrossRef]
- Chen, X.; Wang, X.; Feng, X.; Zhang, X.; Luo, G. Ecosystem service trade-off and synergy on Qinghai-Tibet Plateau. Geogr. Res. 2021, 40, 18–34. (In Chinese) [Google Scholar] [CrossRef]
- Liu, S.; Gong, P. Change of surface cover greenness in China between 2000 and 2010. Chin. Sci. Bull. 2012, 57, 2835–2845. [Google Scholar] [CrossRef] [Green Version]
- Luo, L.; Duan, Q.; Wang, L.; Zhao, W.; Zhuang, Y. Increased human pressures on the alpine ecosystem along the Qinghai-Tibet Railway. Reg. Environ. Change 2020, 20, 1–13. [Google Scholar] [CrossRef]
- Liu, Y.; Liu, S.; Sun, Y.; Li, M.; An, Y.; Shi, F. Spatial differentiation of the NPP and NDVI and its influencing factors vary with grassland type on the Qinghai-Tibet Plateau. Env. Monit Assess 2021, 193, 48. [Google Scholar] [CrossRef]
- Cai, H.; Yang, X.; Xu, X. Human-induced grassland degradation/restoration in the central Tibetan Plateau: The effects of ecological protection and restoration projects. Ecol. Eng. 2015, 83, 112–119. [Google Scholar] [CrossRef]
- Yuan, L.; Jiang, W.; Shen, W.; Liu, Y.; Wang, W.; Tao, L.; Zheng, H.; Liu, X. The spatio-temporal variations of vegetation cover in the Yellow River Basin from 2000 to 2010. Acta Ecol. Sin. 2013, 33, 7798–7806. (In Chinese) [Google Scholar]
- Hao, H.; Li, Y.; Zhang, H.; Zhai, R.; Liu, H. Spatiotemporal variations of vegetation and its determinants in the National Key Ecological Function Area on Loess Plateau between 2000 and 2015. Ecol. Evol. 2019, 9, 5810–5820. [Google Scholar] [CrossRef]
- Aditya, F.; Gusmayanti, E.; Sudrajat, J. Rainfall trend analysis using Mann-Kendall and Sen’s slope estimator test in West Kalimantan. IOP Conf. Ser. Earth Environ. Sci. 2021, 893, 12006. [Google Scholar] [CrossRef]
- Wu, M.H.; Xue, K.; Wei, P.J.; Jia, Y.L.; Zhang, Y.; Chen, S.Y. Soil microbial distribution and assembly are related to vegetation biomass in the alpine permafrost regions of the Qinghai-Tibet Plateau. Sci. Total Env. 2022, 834, 155259. [Google Scholar] [CrossRef]
- Wang, J.-F.; Hu, Y. Environmental health risk detection with GeogDetector. Environ. Model. Softw. 2012, 33, 114–115. [Google Scholar] [CrossRef]
- Wang, J.F.; Li, X.H.; Christakos, G.; Liao, Y.L.; Zhang, T.; Gu, X.; Zheng, X.Y. Geographical Detectors-Based Health Risk Assessment and its Application in the Neural Tube Defects Study of the Heshun Region, China. Int. J. Geogr. Inf. Sci. 2010, 24, 107–127. [Google Scholar] [CrossRef]
- Wang, J.; Xu, C. Geodetector: Principle and prospective. Acta Geogr. Sin. 2017, 72, 116–134. (In Chinese) [Google Scholar] [CrossRef]
- Wang, J.-F.; Zhang, T.-L.; Fu, B.-J. A measure of spatial stratified heterogeneity. Ecol. Indic. 2016, 67, 250–256. [Google Scholar] [CrossRef]
- Wang, J.; Fan, Y.; Yang, Y.; Zhang, L.; Zhang, Y.; Li, S.; Wei, Y. Spatial-Temporal Evolution Characteristics and Driving Force Analysis of NDVI in the Minjiang River Basin, China, from 2001 to 2020. Water 2022, 14, 2923. [Google Scholar] [CrossRef]
- Zhang, M.; Lal, R.; Zhao, Y.; Jiang, W.; Chen, Q. Spatial and temporal variability in the net primary production of grassland in China and its relation to climate factors. Plant Ecol. 2017, 218, 1117–1133. [Google Scholar] [CrossRef]
Figure 1.
Vegetation map of the Qinghai-Tibet Plateau and its location in China.

Figure 2.
The comparison of the Qinghai-Tibet Plateau’s population density (a–c), land use type (d–f), cattle and sheep density (g–i), roads (j–l), and railroads (m–o) in 2000, 2010, and 2017. The raster data of land use type were assigned values of 10 for building land, 7 for arable land, 4 for grassland, and 0 for others, the road is assigned a value of 10 within 500 m from the road buffer zone, 8 within 500–1500 m from the road buffer zone, 4 within 1500–2500 m from the road buffer zone, and 0 in other areas, and the railroads’ area within 500 m on both sides of the railroad is assigned a value is 8 points.

Figure 3.
Types of interaction between two covariates.

Figure 4.
Spatial distribution of perennial mean NDVI in the Qinghai-Tibet Plateau.

Figure 5.
Trend of annual mean NDVI variation in the Qinghai-Tibet Plateau from 2000 to 2017.

Figure 6.
Map of human activity intensity in Qinghai-Tibet Plateau in 2000, 2010, 2017. By analyzing five data layers, including algebraic calculation, trend recursion, buffering, and normalization, each layer was assigned a uniform threshold range of 0–10. Finally, these five layers were superimposed to obtain.

Figure 7.
The influence of various factors on vegetation distribution in the different vegetation zone.
Figure 7.
The influence of various factors on vegetation distribution in the different vegetation zone.


Table 1.
Data sources.
| Data | Source | Scale |
|---|---|---|
| NDVI | CAS Data Center for Resource and Environmental Sciences (http://www.resdc.cn/DOI accessed on 1 January 2023) | 1 km |
| Annual precipitation | National Qinghai-Tibet Plateau Data Center (http://data.tpdc.ac.cn/zh-hans/ accessed on 1 January 2023) | 1 km |
| Average annual temperature | National Qinghai-Tibet Plateau Data Center (http://data.tpdc.ac.cn/zh-hans/ accessed on 1 January 2023) | 1 km |
| Population density | WorldPop dataset | 100 m |
| Land Use | Globleland30 (http://www.globallandcover.com/ accessed on 1 January 2023) | 30 m |
| Density of cattle and sheep | Food and Agriculture Organization of the United Nations (http://www.fao.org/geonetwork/srv/en/main.home accessed on 1 January 2023) | 100 m |
| Road Distribution | Open Street Map (https://www.openhistoricalmap.org/ accessed on 1 January 2023) | |
| Railroad Distribution | Digital extraction of remote sensing images |
Table 2.
Statistical analysis of annual mean NDVI variation trend in Qinghai-Tibet Plateau from 2000 to 2017.
Table 2.
Statistical analysis of annual mean NDVI variation trend in Qinghai-Tibet Plateau from 2000 to 2017.
| S | Z | NDVI Trend Change | Area Percentage/% |
|---|---|---|---|
| 0.0005 | 1.96 | Significant improvement | 34.22 |
| 0.0005 | −1.960–1.96 | Slight improvement | 26.42 |
| −0.0005–0.0005 | −1.960–1.96 | Stable and unchanged | 16.74 |
| −0.0005 | −1.960–1.96 | Slight degradation | 18.51 |
| −0.0005 | −1.96 | Severe degradation | 4.12 |
The S value represents the trend of NDVI change in the growing season under the influence of climate change or human activities, the Z value represents the statistics of the Mann-Kendall trend test.
Table 3.
Factor detection results in Qinghai-Tibet Plateau in 2000.
| 2000 (q) | Temperature | Precipitation | Human Activity Intensity |
|---|---|---|---|
| Forested areas | 0.3931 | 0.0234 | 0.1281 |
| Meadowlands | 0.0907 | 0.1352 | 0.2422 |
| Grassland zone | 0.0826 | 0.0490 | 0.1118 |
| Desert and semi-desert areas | 0.0514 | 0.4510 | 0.2214 |
Table 4.
Interactive detection results of various factors in Qinghai-Tibet Plateau in 2000.
| 2000 | Temperature ∩ Precipitation | Temperature ∩ Human Activity Intensity | Precipitation ∩ Human Activity Intensity |
|---|---|---|---|
| Forested areas | 0.3981 | 0.4349 | 0.1639 |
| Meadowlands | 0.1790 | 0.2899 | 0.3459 |
| Grassland zone | 0.1758 | 0.1977 | 0.1732 |
| Desert and semi-desert areas | 0.5122 | 0.3517 | 0.6172 |
Table 5.
Factor detection results in Qinghai-Tibet Plateau in 2010.
| 2010 (q) | Temperature | Precipitation | Human Activity Intensity |
|---|---|---|---|
| Forested areas | 0.2209 | 0.0007 | 0.0494 |
| Meadowlands | 0.0702 | 0.2529 | 0.2730 |
| Grassland zone | 0.1039 | 0.2070 | 0.1181 |
| Desert and semi-desert areas | 0.0623 | 0.3850 | 0.2116 |
Table 6.
Interactive detection results of various factors in Qinghai-Tibet Plateau in 2010.
| 2010 | Temperature ∩ Precipitation | Temperature ∩ Human activity intensity | Precipitation ∩ Human Activity Intensity |
|---|---|---|---|
| Forested areas | 0.2318 | 0.2642 | 0.0736 |
| Meadowlands | 0.2763 | 0.3018 | 0.4483 |
| Grassland zone | 0.2909 | 0.2299 | 0.3155 |
| Desert and semi-desert areas | 0.4835 | 0.2981 | 0.5674 |
Table 7.
Factor detection results in Qinghai-Tibet Plateau in 2017.
| 2017 (q) | Temperature | Precipitation | Human Activity Intensity |
|---|---|---|---|
| Forested areas | 0.2318 | 0.0030 | 0.0237 |
| Meadowlands | 0.0317 | 0.2048 | 0.2329 |
| Grassland zone | 0.0575 | 0.2796 | 0.1896 |
| Desert and semi-desert areas | 0.0344 | 0.4362 | 0.2349 |
Table 8.
Interactive detection results of various factors in Qinghai-Tibet Plateau in 2017.
| 2017 | Temperature ∩ Precipitation | Temperature ∩ Human Activity Intensity | Precipitation ∩ Human Activity Intensity |
|---|---|---|---|
| Forested areas | 0.2645 | 0.2897 | 0.0400 |
| Meadowlands | 0.2346 | 0.2521 | 0.3643 |
| Grassland zone | 0.3364 | 0.2588 | 0.4490 |
| Desert and semi-desert areas | 0.4775 | 0.2898 | 0.5757 |
Disclaimer/Publisher’s Note: The statements, opinions and data contained in all publications are solely those of the individual author(s) and contributor(s) and not of MDPI and/or the editor(s). MDPI and/or the editor(s) disclaim responsibility for any injury to people or property resulting from any ideas, methods, instructions or products referred to in the content. |
© 2023 by the authors. Licensee MDPI, Basel, Switzerland. This article is an open access article distributed under the terms and conditions of the Creative Commons Attribution (CC BY) license (https://creativecommons.org/licenses/by/4.0/).
Share and Cite
MDPI and ACS Style
Sun, L.; Li, H.; Wang, J.; Chen, Y.; Xiong, N.; Wang, Z.; Wang, J.; Xu, J. Impacts of Climate Change and Human Activities on NDVI in the Qinghai-Tibet Plateau. Remote Sens. 2023, 15, 587. https://doi.org/10.3390/rs15030587
AMA Style
Sun L, Li H, Wang J, Chen Y, Xiong N, Wang Z, Wang J, Xu J. Impacts of Climate Change and Human Activities on NDVI in the Qinghai-Tibet Plateau. Remote Sensing. 2023; 15(3):587. https://doi.org/10.3390/rs15030587
Chicago/Turabian StyleSun, Lu, Hao Li, Jia Wang, Yuhan Chen, Nina Xiong, Zong Wang, Jing Wang, and Jiangqi Xu. 2023. "Impacts of Climate Change and Human Activities on NDVI in the Qinghai-Tibet Plateau" Remote Sensing 15, no. 3: 587. https://doi.org/10.3390/rs15030587
Note that from the first issue of 2016, this journal uses article numbers instead of page numbers. See further details here.