Technical Note

An Accelerated Hybrid Method for Electromagnetic Scattering of a Composite Target–Ground Model and Its Spotlight SAR Image

School of Physics, Xidian University, Xi’an 710071, China
*
Author to whom correspondence should be addressed.
Remote Sens. 2022, 14(24), 6332; https://doi.org/10.3390/rs14246332
Submission received: 19 September 2022 / Revised: 9 November 2022 / Accepted: 17 November 2022 / Published: 14 December 2022

Abstract

:
In this paper, an accelerated hybrid method of physical optics (PO) shooting and bouncing ray (SBR)–physical theory of diffraction (PTD) is proposed to deal with the electromagnetic scattering of a complex target on rough ground. To accelerate the ray tracing progress, the ray marching technique based on octree structure is employed. In this technique, only the nodes passed by the ray are detected successively until the first facet intersected by ray is found or the ray passes through the bounding box, which greatly decreases the intersection test. Then, based on the accelerated PO-SBR-PTD method, the spotlight synthetic aperture radar (SAR) echo data of the composite target–ground model is obtained by the vector superposition of the echo on each meshed patch. Furthermore, the spotlight SAR image of the composite model is simulated by the polar format algorithm (PFA). In numerical simulations, both the EM scattering of the target and composite model are calculated and evaluated by comparing with the multilevel fast multipole method (MLFMM) in FEKO software. Meanwhile the spotlight SAR image of the composite target–ground model is also compared with the real image in MSTAR data, and a satisfactory similarity between them is obtained. In addition, the SAR images of two targets on rough ground for different pose angles are also presented and analyzed.

Graphical Abstract

1. Introduction

The synthetic aperture radar (SAR) plays an important role in military surveillance and civilian remote sensing due to its unique imaging capability. With the rapid development of computer technology in recent decades, electromagnetic (EM) modeling has become a significant means to rapidly attain the radar scattering echo. Currently, computational EM modeling technology is widely applied to the field of radar imaging. That is, using the EM modeling algorithm to obtain the SAR raw data and then perform the SAR image simulation. Moreover, some physical mechanisms of the interaction between an EM wave and target are considered in EM modeling, which are helpful for image understanding and object recognition. For the SAR image of a complex scene, Kim et al. proposed the imaging simulation of a two-dimensional rough surface based on the backscattering echo by numerical and analytical methods [1]. Li et al. presented the SAR image of the sea surface with breaking waves. Additionally, SAR echo data are simulated by the capillary wave modification facet scattering model (CWMFSM) [2]. Xu et al. investigated the scattering of a comprehensive terrain scene by the vector radiative transfer (VRT) model and the integral equation method (IEM) [3]. Additionally, the polarimetric SAR image of the terrain scene was simulated based on the echo data by the EM modeling algorithm. In addition, the SAR image of a composite target-scene model was also studied. Zhao et al. analyzed a bistatic SAR image of a ship target located on a rough sea surface by employing the high-frequency hybrid method [4].
A lot of methods have been proposed to solve the composite EM scattering of rough surfaces and targets. Numerical methods such as the method of moments (MoM), the multilevel fast multipole method (MLFMM) [5] and the finite element method (FEM) [6] can provide a high calculation precision. However, for the electrically large-scale problems, these full-wave methods are restricted due to their computational resources. Unlike the numerical methods, some high-frequency asymptotic methods can effectively deal with the composite scattering problem due to their lower computational costs and reasonable accuracy. Wei et al. applied a hybrid shooting and bouncing rays–physical optics (SBR-PO) method to investigate the composite scattering from a target above a rough surface with infinite extent [7]. Dong et al. utilized an accelerated algorithm based on the GO-PO/PTD and CWMFSM to analyze the composite scattering from a ship over the sea’s surface [8]. In our paper, the spotlight SAR image of a composite target–ground model is simulated, which needs massive calculations from SAR raw echo in terms of range frequency and azimuth time. In this case, a hybrid high-frequency technique PO-SBR-PTD is chosen to obtain the amplitude of the scattered echo from the composite model. Firstly, the composite target–ground model is divided into a large number of triangular patches. For the patches on the target, the scattering includes first-order and higher-order scattering by the SBR-PTD method, as well as coupled scattering from the ground by the ray tracing technique. For patches on the ground, the scattering includes first-order scattering by PO method and the coupled scattering from the target by the ray tracing technique. In this hybrid method, the most time-consuming process is ray tracing. In order to accelerate the ray tracing process, the ray marching technique based on octree structure is employed in our paper, which greatly decreases the intersection test from ray to box.
During the formation of the spotlight aperture, the radar is continuously steered to the scene center. Therefore, the spotlight SAR mode can offer a high resolution in the azimuth direction. Several algorithms have to be applied to the spotlight SAR processing, i.e., the range migration algorithm, the chirp scaling algorithm [9], the polar format algorithm (PFA) [10], etc. The PFA algorithm is the most classic way due to its inherent advantages. For example, PFA has a good flexibility for the choice of image resolution, size and location [11]. In this paper, based on the SAR raw echo of the composite model, the spotlight SAR image is simulated by the PFA method.

2. An Accelerated Hybrid PO-SBR-PTD Method

2.1. An Accelerated Method for Ray Tracing Process

SBR, which efficiently combines GO and PO, is an efficient high-frequency method for solving the EM scattering of a complex and electrically large-scale target. Compared with PO, some higher-order scattered terms are included by ray tracing in SBR [12], which obviously improves the calculation accuracy. In the hybrid PO-SBR-PTD method, the ray tracing technique is employed in both the scattering of the target and in coupled scattering. Therefore, the ray tracing process is the most time-consuming one. In our paper, the ray marching technique based on an octree structure [13] is adopted, which greatly accelerates the ray tracing process.
In traditional octree–SBR method, each child node under the parent node that intersects with the ray needs to be detected. When the ray passes through a parent node containing eight child nodes, it intersects with four child nodes at most. Thus, the number of intersections between ray and nodes is 2 i = 1 H 4 i , and H is the division levels of the octree. Meanwhile, each facet in the leaf node intersecting with the ray also needs to be detected. The number of intersections between ray and facet is j = 1 4 H M j , and M j is the number of facets in the leaf node j . Therefore, the total number of operations is 1 + 2 i = 1 H 4 i + j = 1 4 H M j for the traditional octree–SBR method [14].
In our ray marching algorithm, a hybrid uniform grid and octree structure is adopted to divide the space, where the established octree structure is used to store facets and the uniform mesh generation is used to determine the spatial location of ray arrival. In this technique, only the nodes passed by the ray are successively detected until the first facet intersected by the ray is found or the ray passes through the bounding box. Thus, the corresponding number of operations is L + j = 1 L M j ; here, L is the number of leaf nodes passed by the ray. Generally, L is far less than 4 H . As shown in Figure 1, along the direction of ray propagation. leaf node 5 is first detected. Each facet in node 5 also needs to be detected to determine whether it intersects with the ray. Then, leaf nodes 4 and 1 are detected successively. When facet 4, which first intersects with the ray, is found, the ray tracing progress is stopped.
The key aspect of the ray marching algorithm lies in the establishment of the corresponding relation between leaf node and spatial unit, and its flowchart is shown in Figure 2.
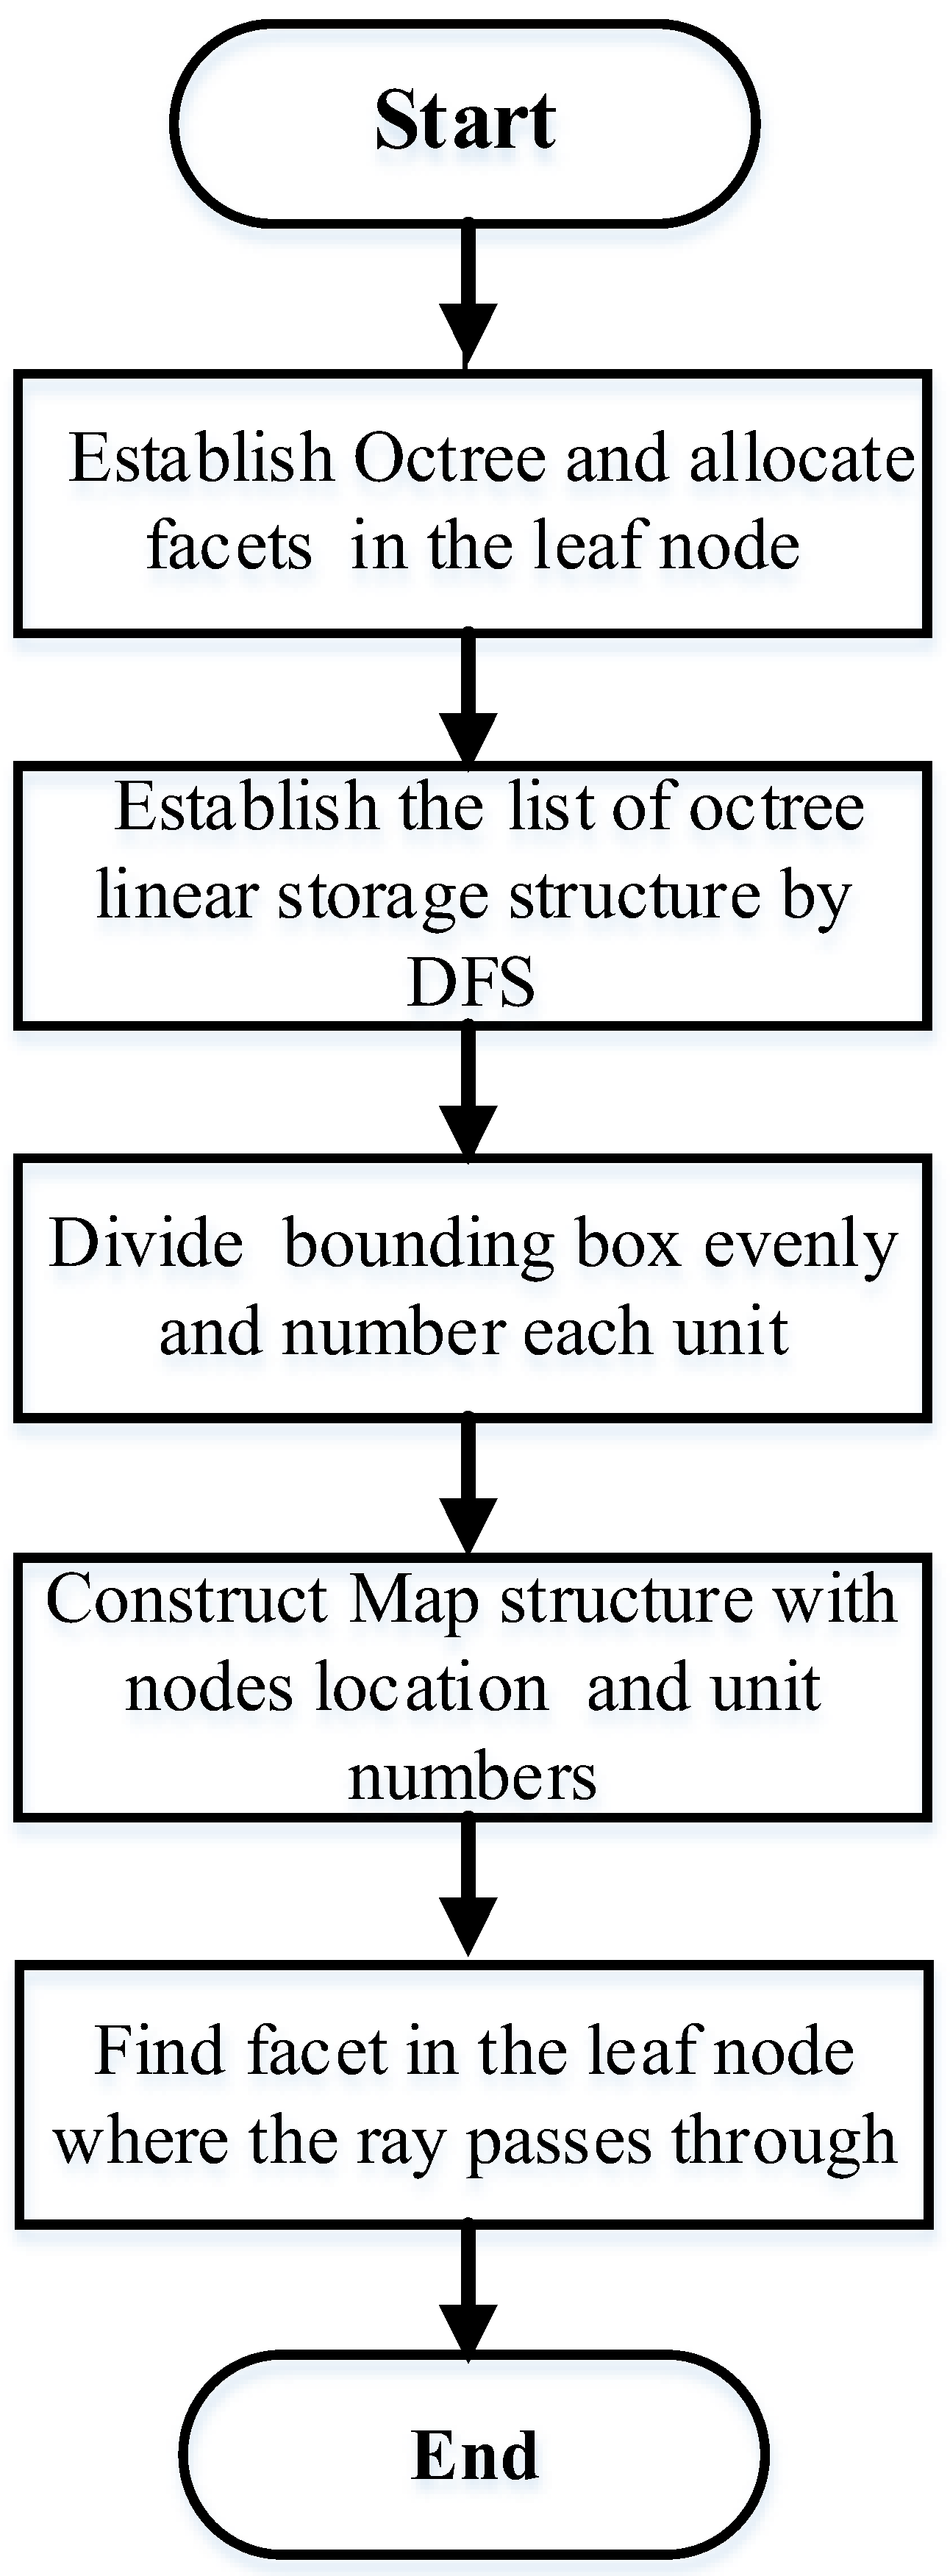
  • Step 1: The octree structure is established and the facets are allocated into the corresponding leaf node.
  • Step 2: The depth-first search (DFS) algorithm is used to traverse the octree. By storing each node in order of access nodes, a list of the octree’s linear storage structure is established.
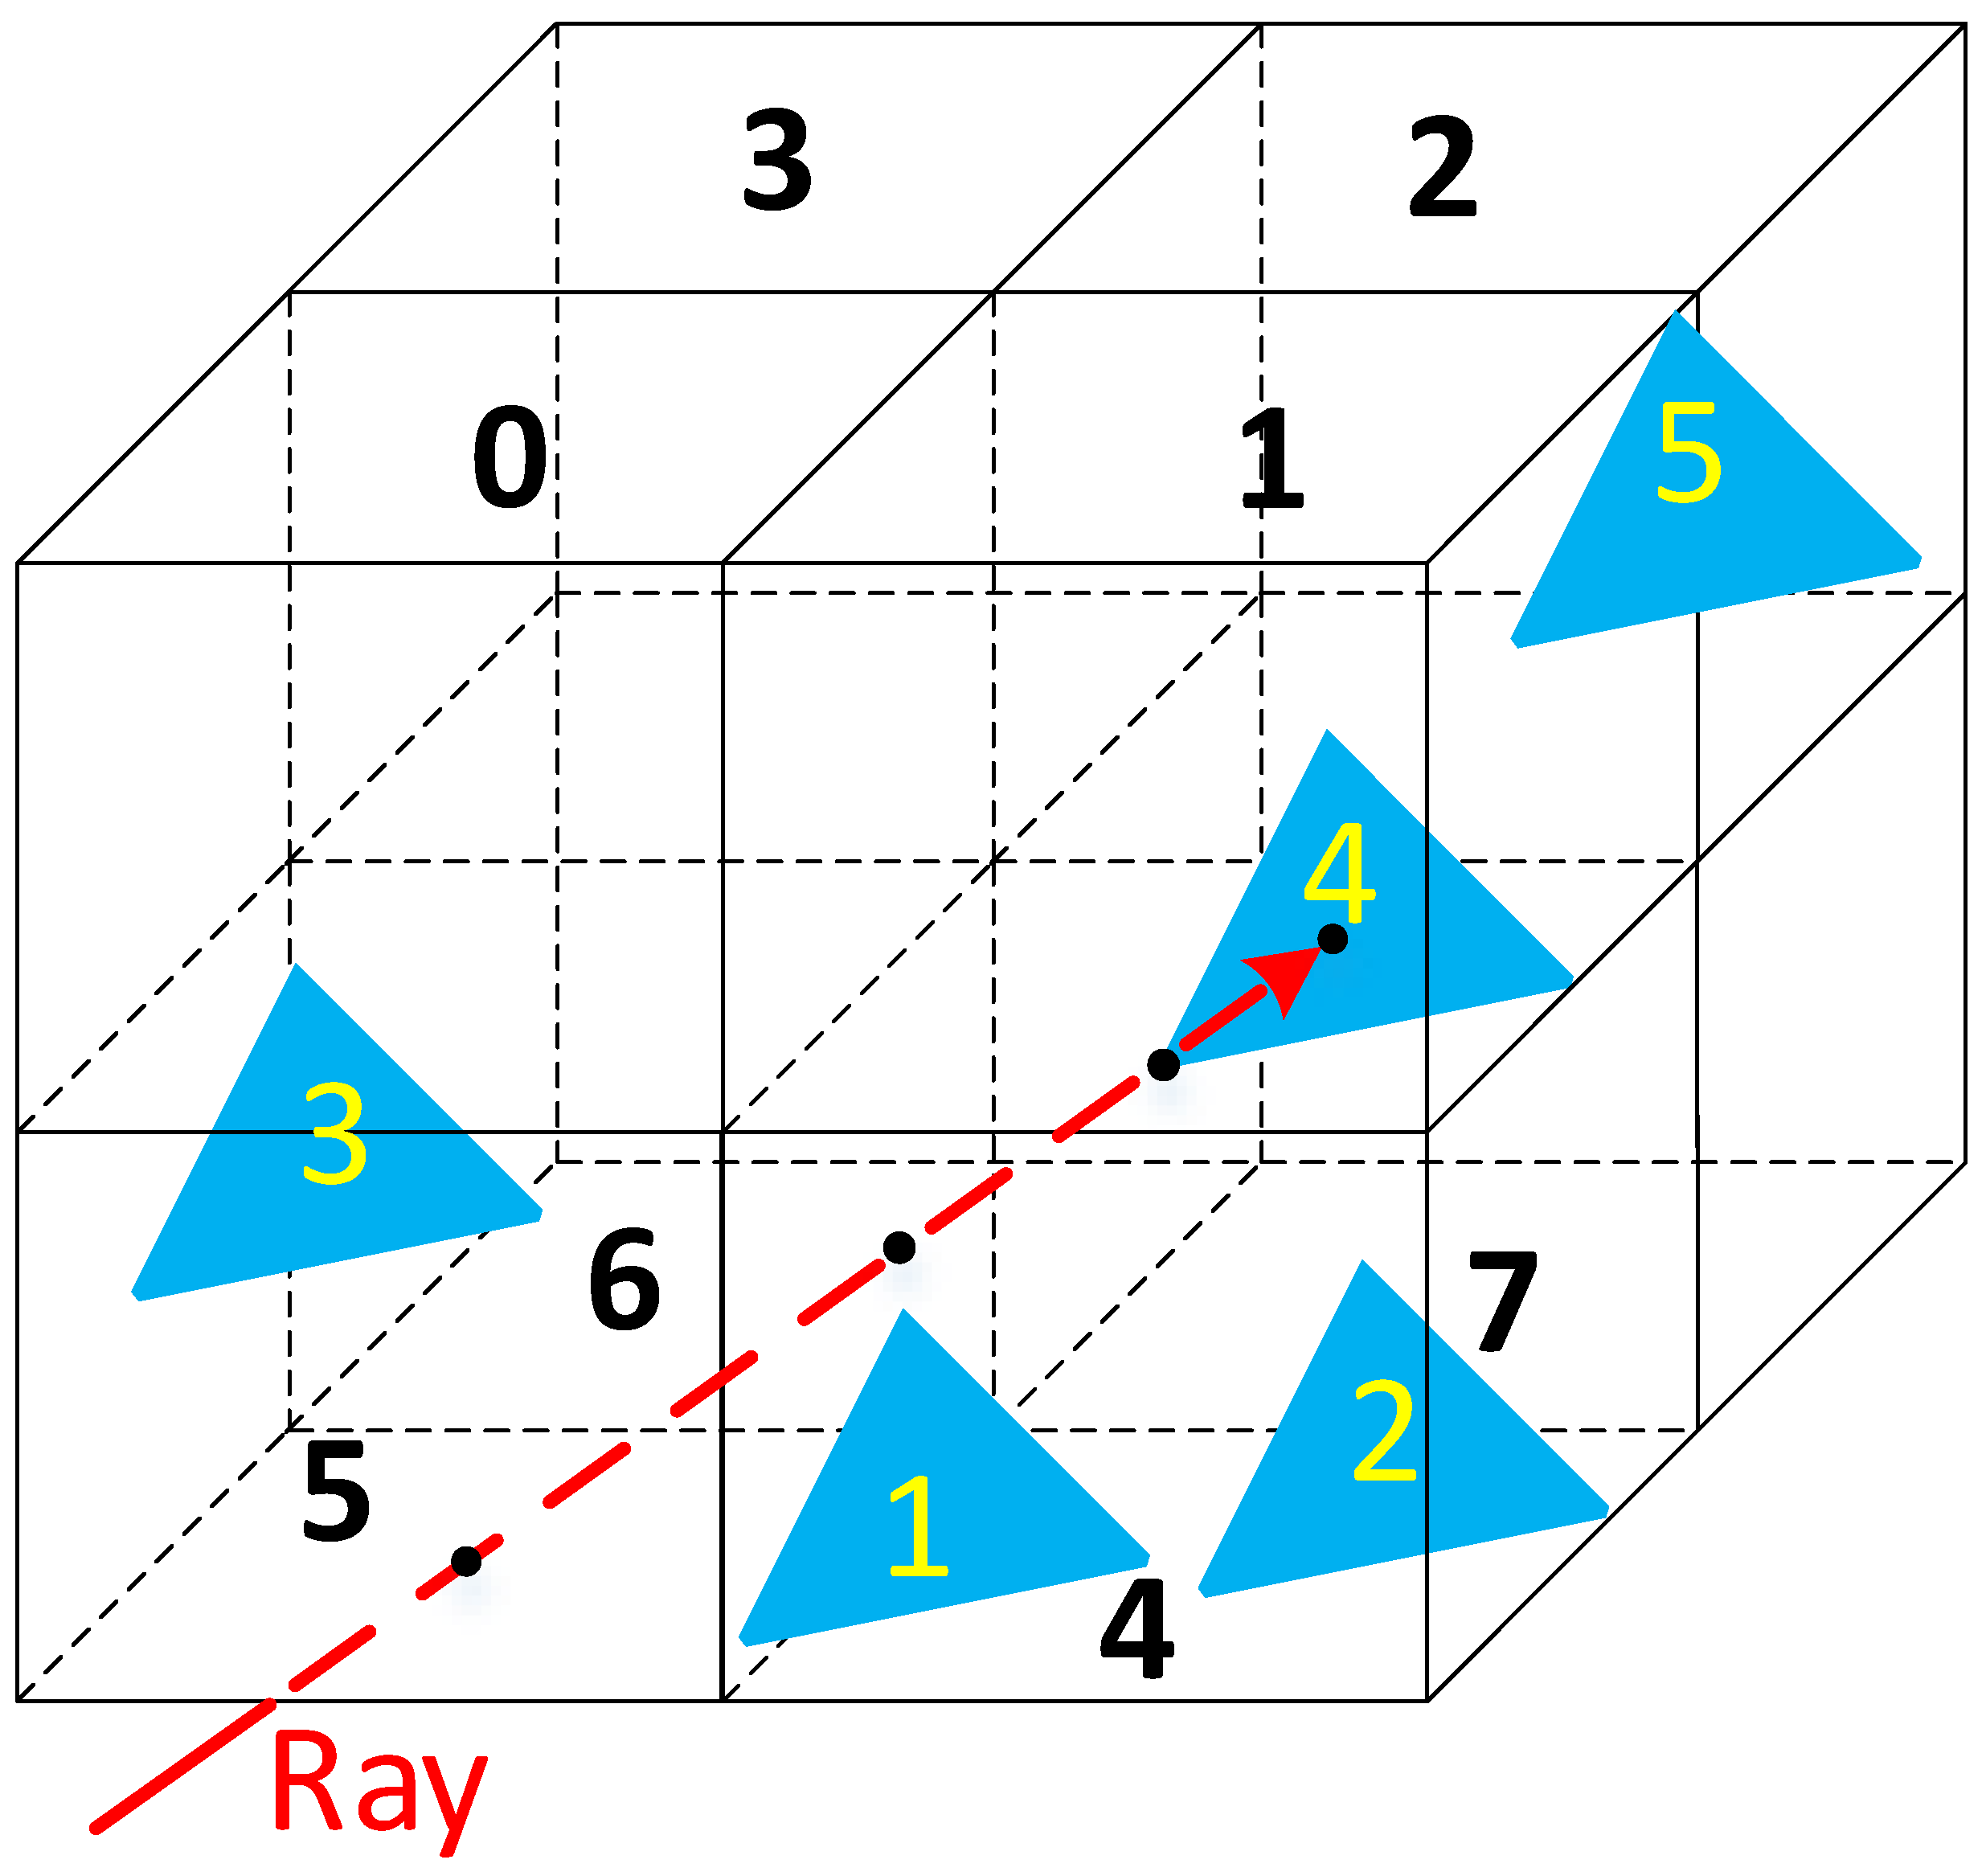
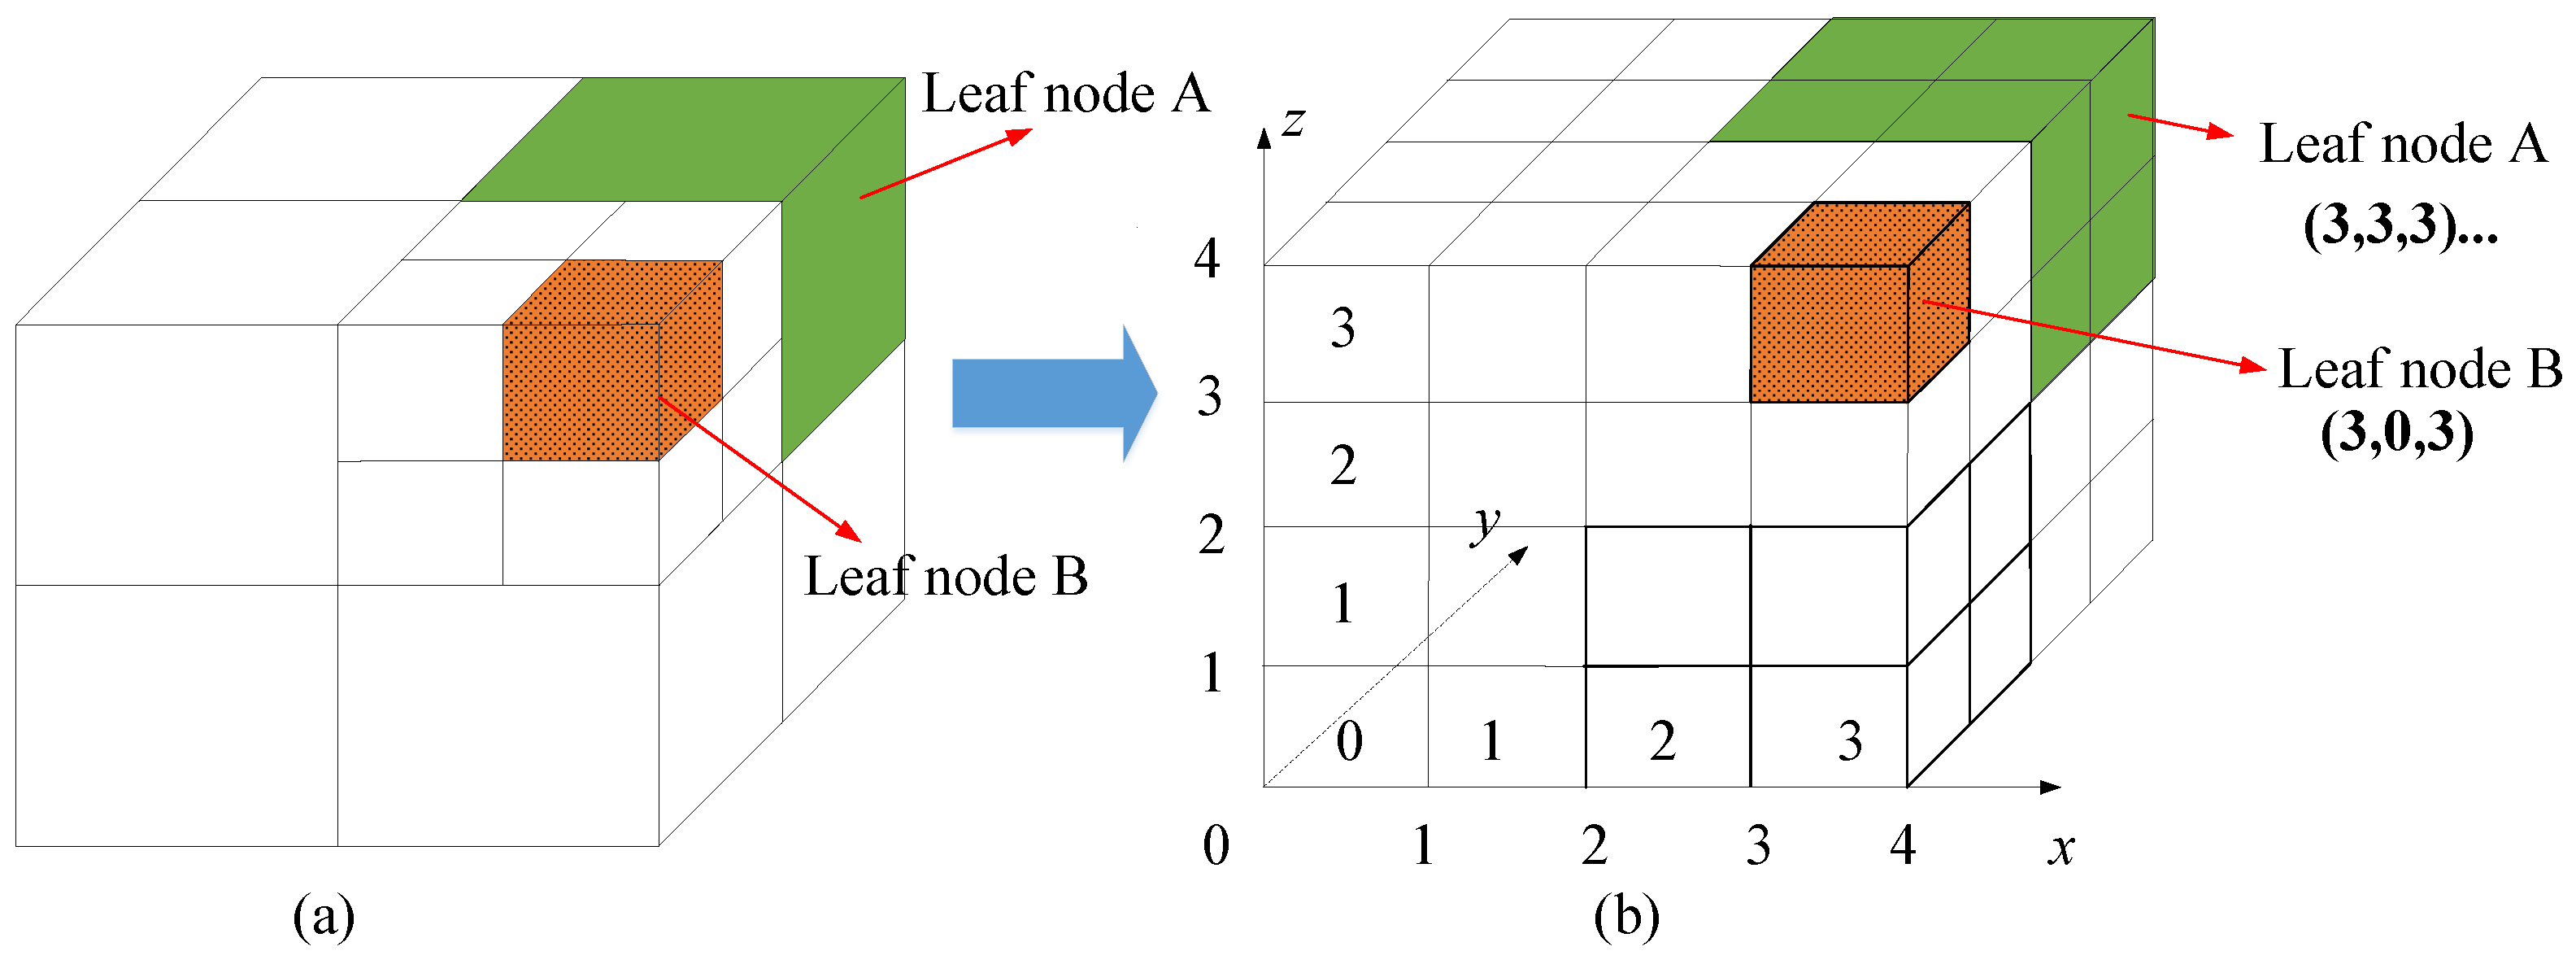
  • Step 3: Choosing the lowest leaf node of the octree as the spatial resolution unit (SRU), the bounding box is evenly divided and each unit is numbered. In Figure 3a, the octree structure is established, and in Figure 3b the bounding box is evenly divided by the SRU. The lowest leaf node is selected as the SRU with the size of V x × V y × V z . Take the minimum vertex of the bounding box as the origin and SRU as the minimum scale to divide the bounding box evenly. Then, each unit is numbered in the x , y and z directions, as shown in Figure 3b. In Figure 3, leaf node B is the smallest leaf node, which only corresponds to a unit ( 3 , 0 , 3 ) . However, leaf node A corresponds to eight units: ( 3 , 3 , 3 ) , ( 2 , 3 , 3 ) , ( 2 , 2 , 3 ) , ( 3 , 2 , 3 ) , ( 3 , 3 , 2 ) , ( 2 , 3 , 2 ) , ( 2 , 2 , 2 ) and ( 3 , 2 , 2 ) .
  • Step 4: Taking the position of the node in the list as the value and the coordinate of the spatial unit as the key, a map structure is established through the hash function. The hash function associates the value with the address where the key is stored.
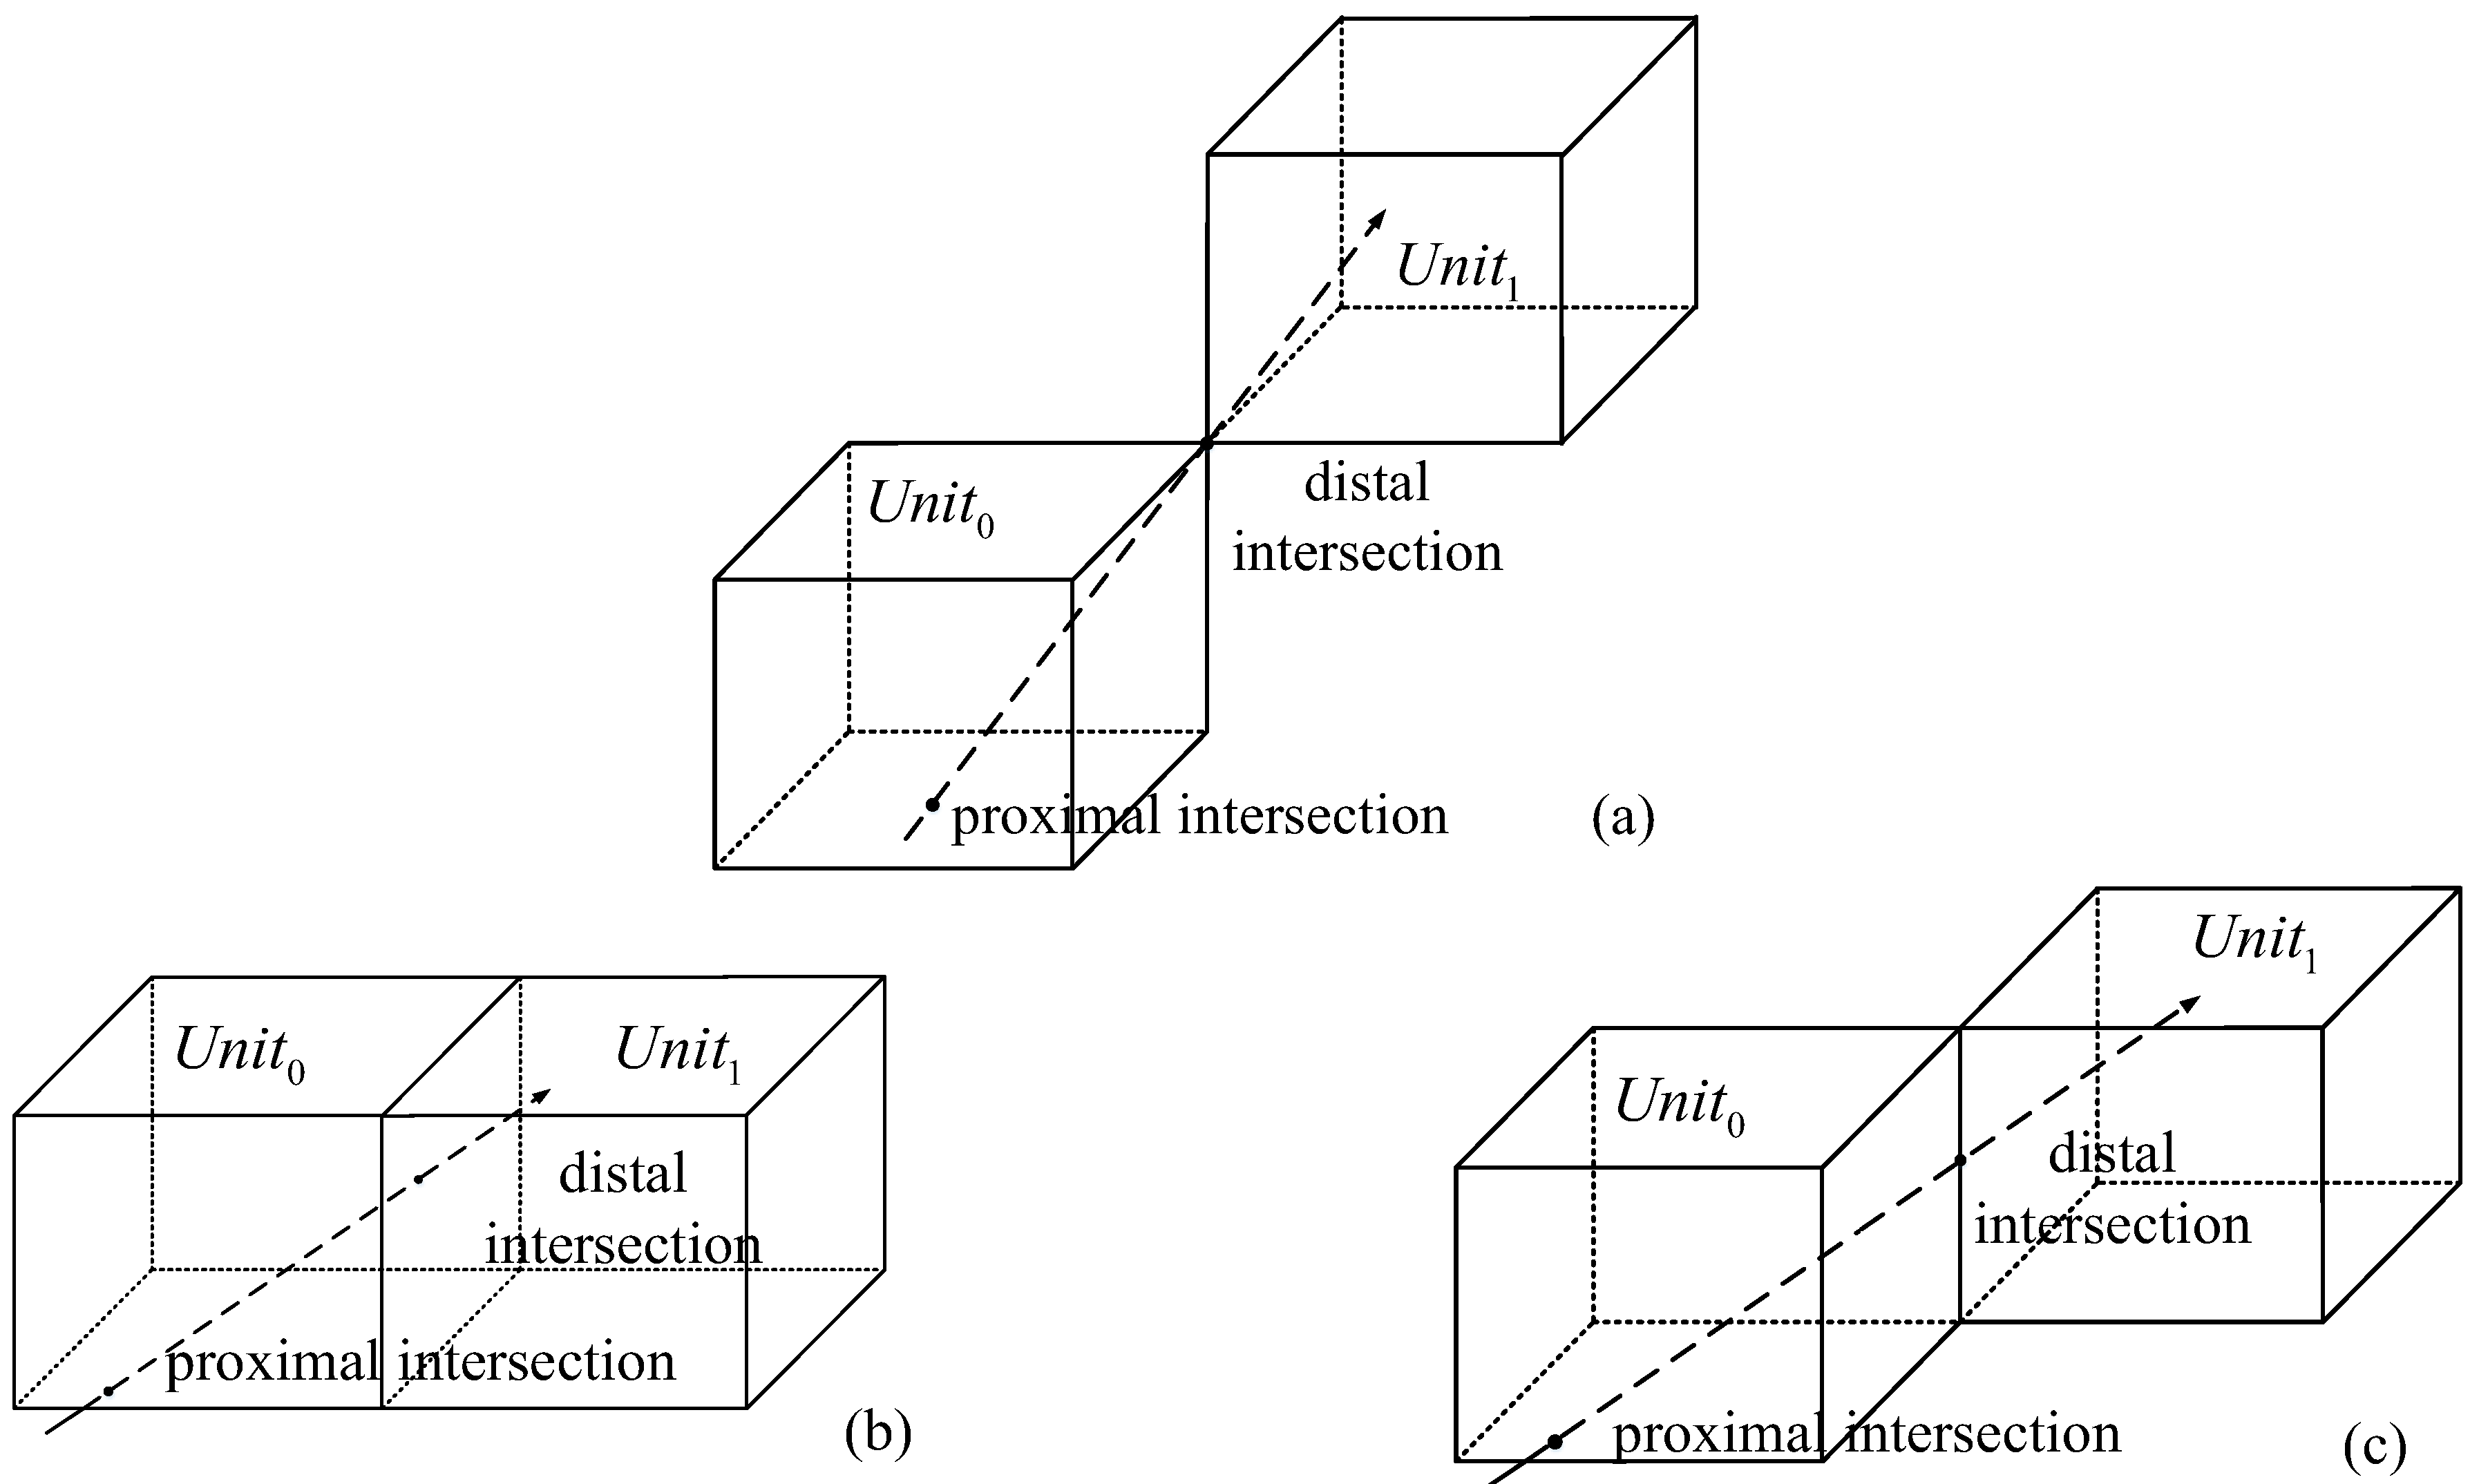
  • Step 5: According to the direction of the ray, each leaf node where the ray is currently located is found successively by the map structure. Then, the intersection test of ray and facet in leaf node is operated until the first facet intersected by the ray is found or the ray passes through the bounding box. Figure 4 shows three cases where the ray intersects with the SRU. There are two intersections between the ray and the SRU, which are called distal intersection and proximal intersection, respectively. The intersection may be on the surface, edge or vertex of the box. According to the location of the distal intersection point and the number of the U n i t 0 , it can be determined that the ray enters the new resolution unit. The U n i t 0 and U n i t 1 can be written as ( u 0 x , u 0 y , u 0 z ) and ( u 1 x , u 1 y , u 1 z ) , respectively. The coordinate of the distal intersection is ( x , y , z ) . The number of the U n i t 1 can be acquired using the following equation
i = int x / V x j = int y / V y k = int z / V z
u 1 x = i i = u 0 x + 1 u 0 x 1 i = u 0 x u 1 y = j j = u 0 y + 1 u 0 y 1 j = u 0 y u 1 z = k k = u 0 z + 1 u 0 z 1 k = u 0 z
After ( u 1 x , u 1 y , u 1 z ) is obtained, the storage address of the leaf node containing U n i t 1 can be acquired through hash function mapping.

2.2. Hybrid PO-SBR-PTD Method

In this hybrid method, the scattering of the target is solved by the SBR-PTD method, the scattering of rough ground is solved by the PO method, and the coupled scattering from the target and ground is calculated by the ray tracing technique. Thus, for the patches on target, the scattering includes the direct scattering by SBR-PTD and the coupled scattering from ground. For the patches on ground, the scattering includes the direct scattering by PO and the coupled scattering from the target.
By the PO integral, the electric field in the far region can be written as:
E P O = j k η 4 π exp ( j k R ) R s ^ × s ^ × J + 1 η M exp j k ( i ^ s ^ ) r   d s
where k = ω μ 0 ε 0 and R are the distance from the source point r to the observed point. i ^ and s ^ are the unit vectors along the incident direction and the scattered direction, respectively. J and M are the equivalent surface electric and magnetic current densities, respectively.
For calculating the integral in Equation (3), Gordon established the Gordon algorithm. This algorithm can accurately solve the PO integral of any polygon, and the size of the polygon is independent of incident frequency. The Gordon surface integral [8] is expressed as
I = exp j k ( i ^ s ^ ) r   d s = Δ S exp j k α r c β = 0 j β k m = 1 3 h ^ d m exp j k r m α sin c k d m α 2 β 0
where Δ S is the area of triangular patch and r c is the center point of the patch. α = i ^ s ^ , h ^ = ( n ^ × α ) / n ^ × α . Here, n ^ is the unit normal vector of patch. β = α ( α n ^ ) n ^ is the projection of α on the patch. d m and r m are the vector along the m th edge and the positional coordinate of the midpoint, respectively.
In SBR, the combination of PO and GO is used to solve the higher-order scattered terms. According to GO theory [15], each ray tube is successively reflected and one PO surface integral occurs at each reflection. Suppose that at the i th reflection point r i the incident field is E ( r i ) , at the neighboring reflection point r i + 1 the electric field E ( r i + 1 ) can be expressed as
E ( r i + 1 ) = ( D F ) i ( Γ ¯ ) i E ( r i ) e j k r i + 1 r i
where ( Γ ¯ ) i represents the planar reflection coefficient matrix. ( D F ) i is the divergence factor of the ray tube.
Moreover, to improve the calculation accuracy further, in this paper, PTD [15] is combined with SBR to consider the scattered contributions from the edges on the target. Thus, the total far-scattered field of the illuminated patch on target or ground can be written as
E target = E S B R f i r s t + E P T D f i r s t + E R T c o u p l e
E g r o u n d = E P O f i r s t + E R T c o u p l e

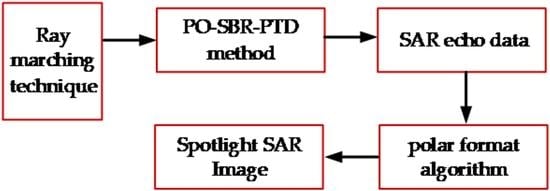
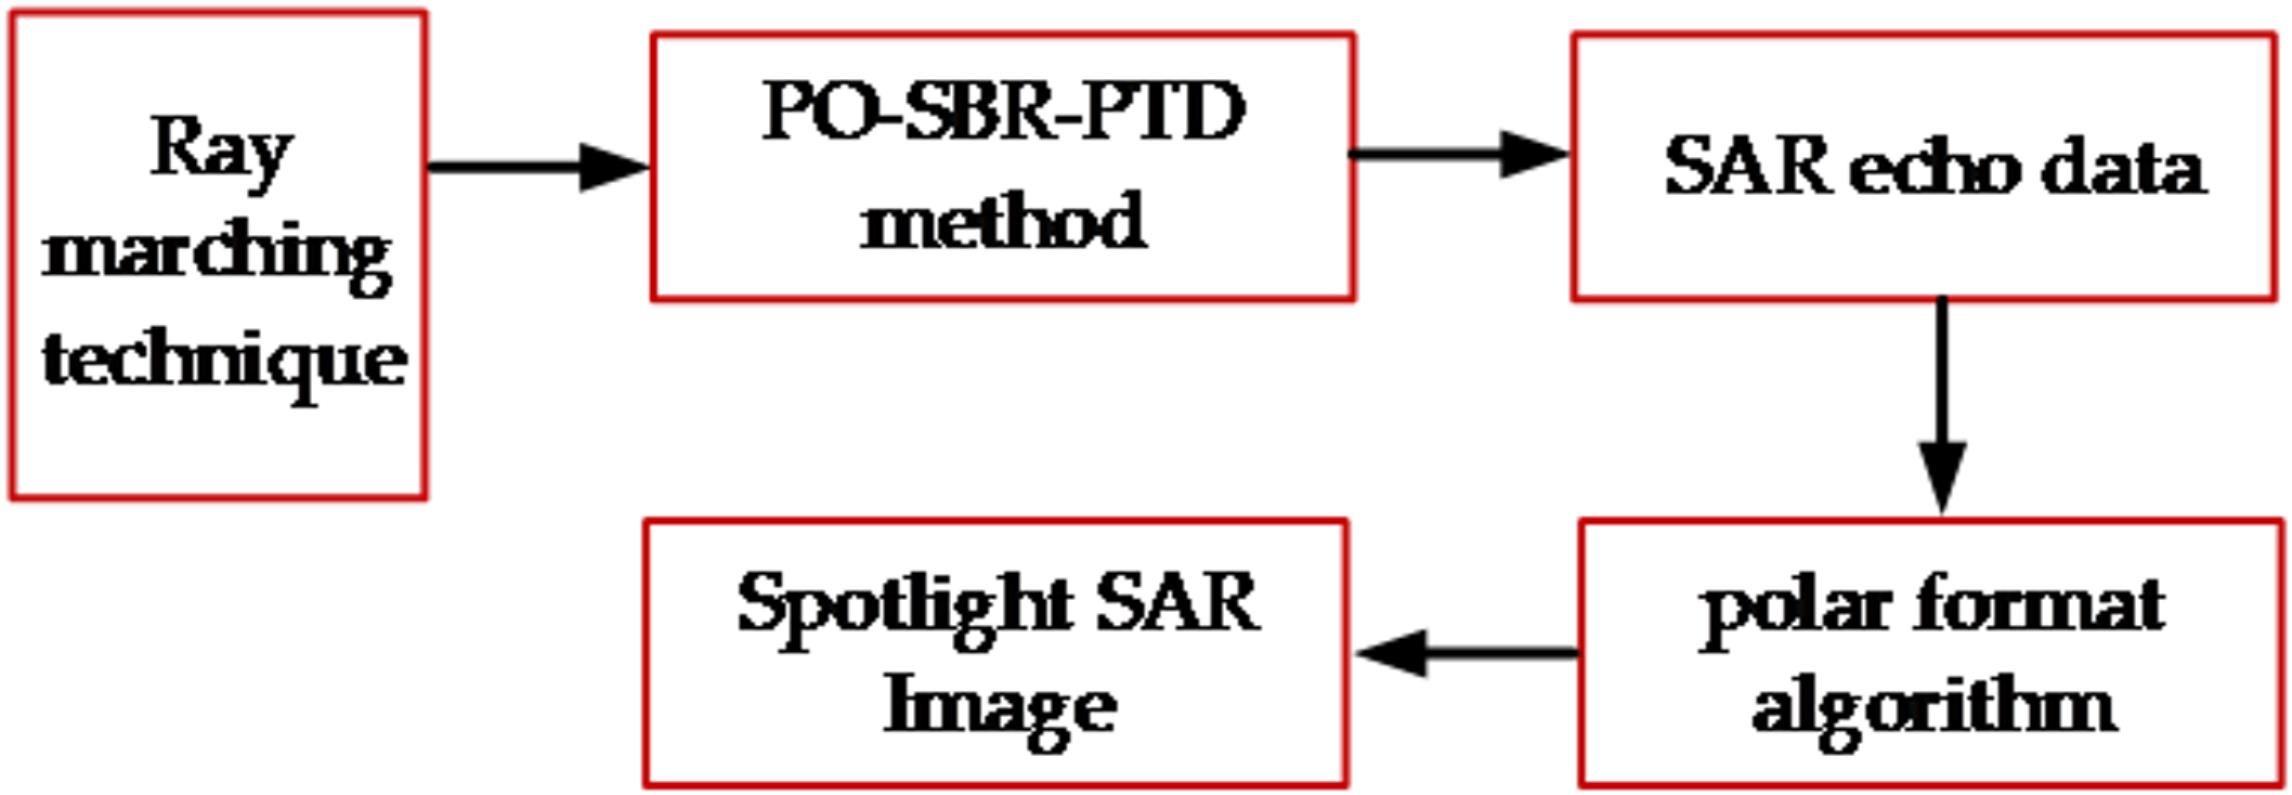
3. Spotlight SAR Imaging of Composite Model

Figure 5 illustrates the geometry of spotlight SAR image. The radar, which moves along the x axis at a height H , is continuously steered onto the scene center. In this paper, the composite target–ground model can be divided into a mass of triangular patches, and each patch is taken as a point target. Thus, the radar echo of the composite model can be regarded as the superposition of echoes from all the patches. Suppose that the linear frequency modulated (LFM) wave is transmitted by radar, then the received echo signal for the composite model is dealt by dechirping and can be expressed in terms of range frequency f and azimuth time t m
S f , t m = i N E i f , t m w r f k r T p w a ( t m ) exp 4 j π f c C R Δ i exp j 4 π k r C 2 R Δ i 2 exp j 4 π R i ( t m ) C f T p sin c T p f + 2 k r R Δ i C
where E i f , t m is the amplitude of scattered echo for patch i , which is solved by the accelerated hybrid PO-SBR-PTD method above. w r and w a are the range and azimuth envelope, respectively. k r is the linear frequency modulated rate and T is the pulse duration. f c is the carrier frequency and j is the imaginary unit. R i t m is the instantaneous distance from radar to patch i at any moment t m . R Δ i = R i t m R 0 t m ; here, R 0 t m is the instantaneous distance from the radar to scene center. N is the total number of triangular patches on the composite target–ground model. C is the velocity of light in free space.
Based on the raw echo data S ( f , t m ) in Equation (8), the residual video phase (RVP) can be removed via multiplying by a linear phase function H R V P ( f ) = exp j π f 2 / k r . Then, transforming the result into the range time domain by means of the inverse FFT, the corresponding echo is expressed as
S ( t , t m ) = i N E i f , t m w r t 2 R i ( t m ) C w a t m exp 4 j π k r C f c k r + t 2 R i ( t m ) C R Δ i
In Figure 5, O is the origin of the coordinates in the scene center, and the coordinate of point P is ( x , y ) . According to the geometric relationship in Figure 5, R Δ i can be written as
R Δ i = R i t m R 0 t m sin θ a ( x cos ϕ a + y sin ϕ a )
where θ a and ϕ a represent the grazing and azimuth angle of the direction from radar to scene center, respectively. By the PFA algorithm, Equation (9) can be rewritten as
S ( t , t m ) = i N E i f , t m w r t 2 R i ( t m ) C w a t m exp j K x x + K y x
In Equation (11), K x = K R sin θ a cos ϕ a and K y = K R sin θ a sin ϕ a are the wavenumber component in the x- and y- directions, respectively. Where K R = 4 π k r / C f c / k r + t 2 R 0 t m / C represents the space wavenumber.
It should be noted that in Equation (11), the collected spotlight SAR echo data is distributed on the polar grid. Therefore, a polar-to-rectangular resampling should be carried out [16]. Then, a 2D complex SAR image can be obtained by performing a 2D inverse FFT (IFFT).

4. Results and Discussion

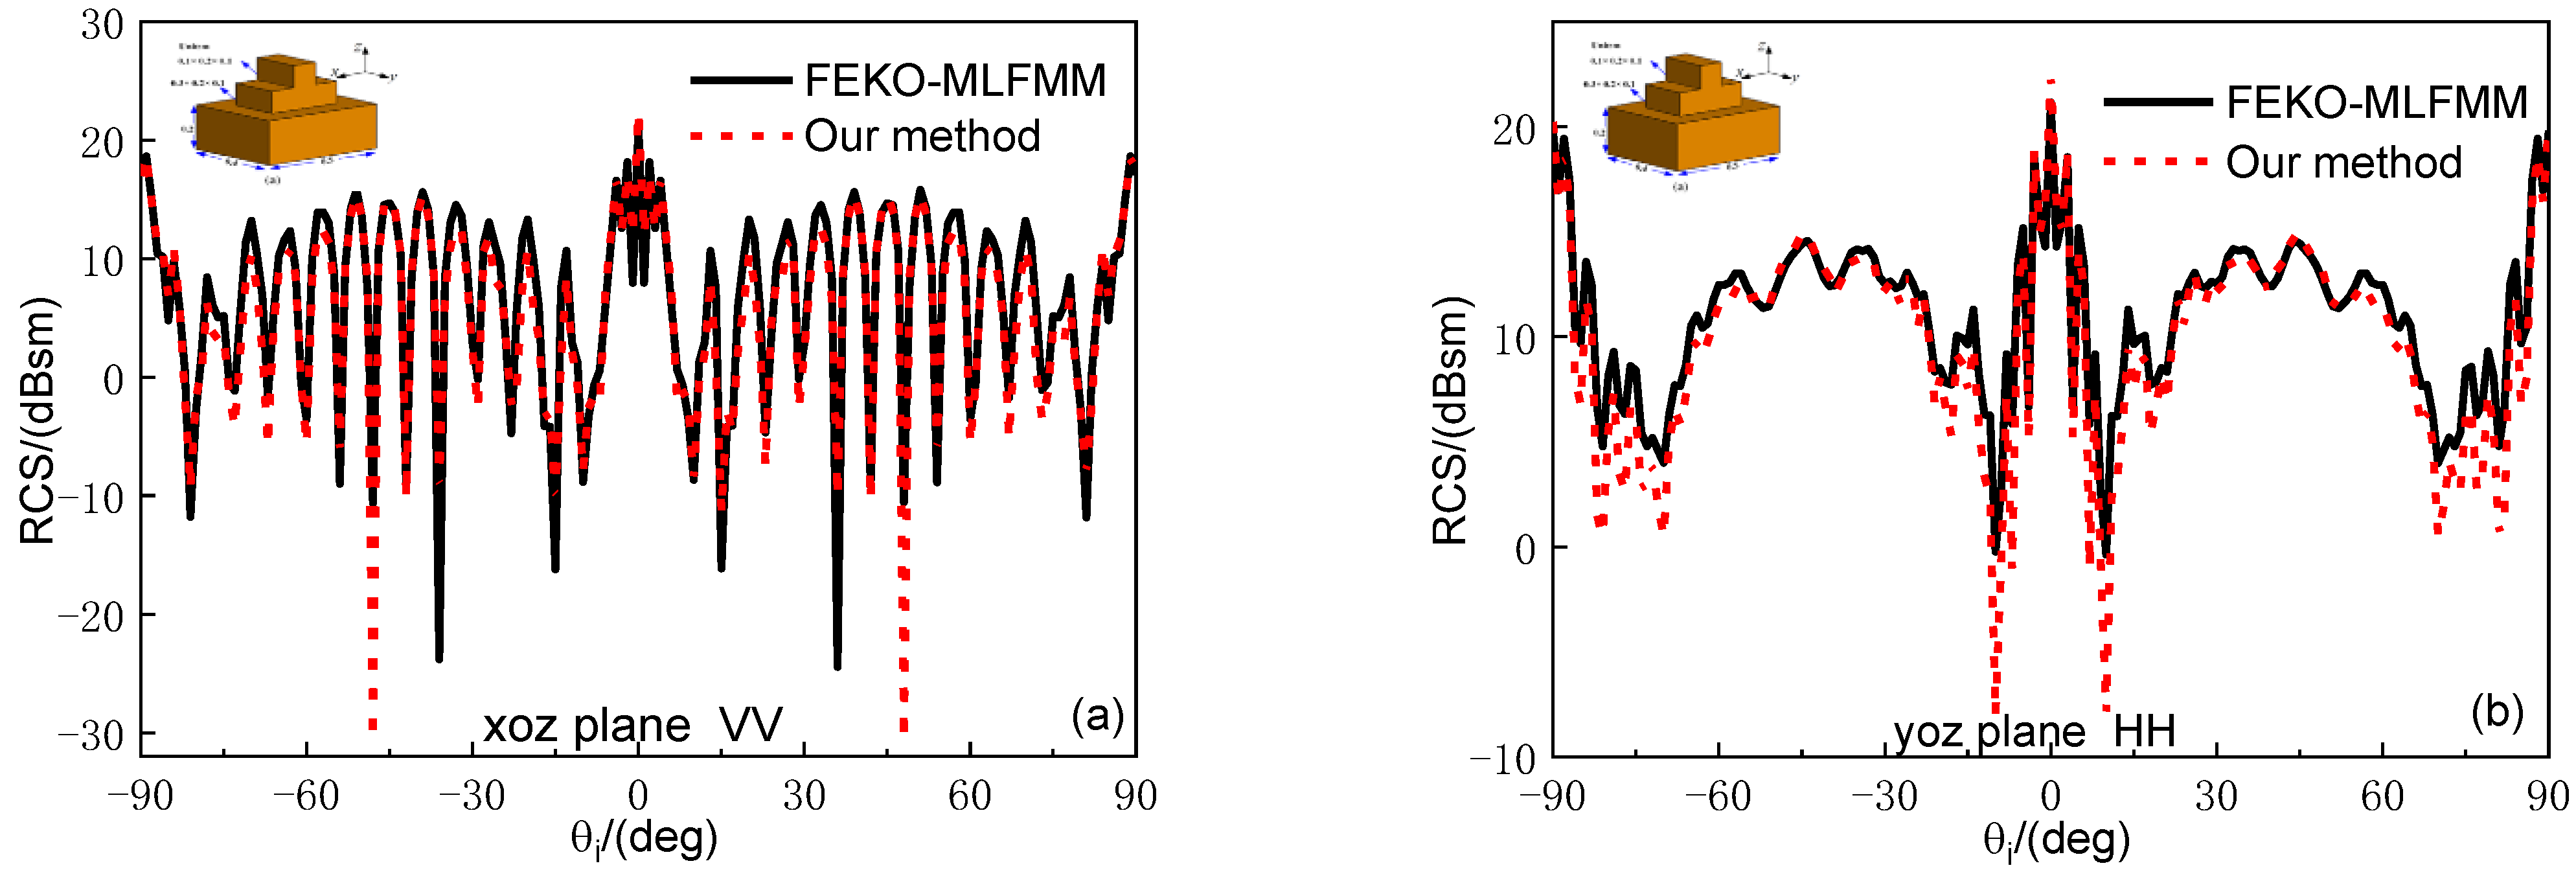
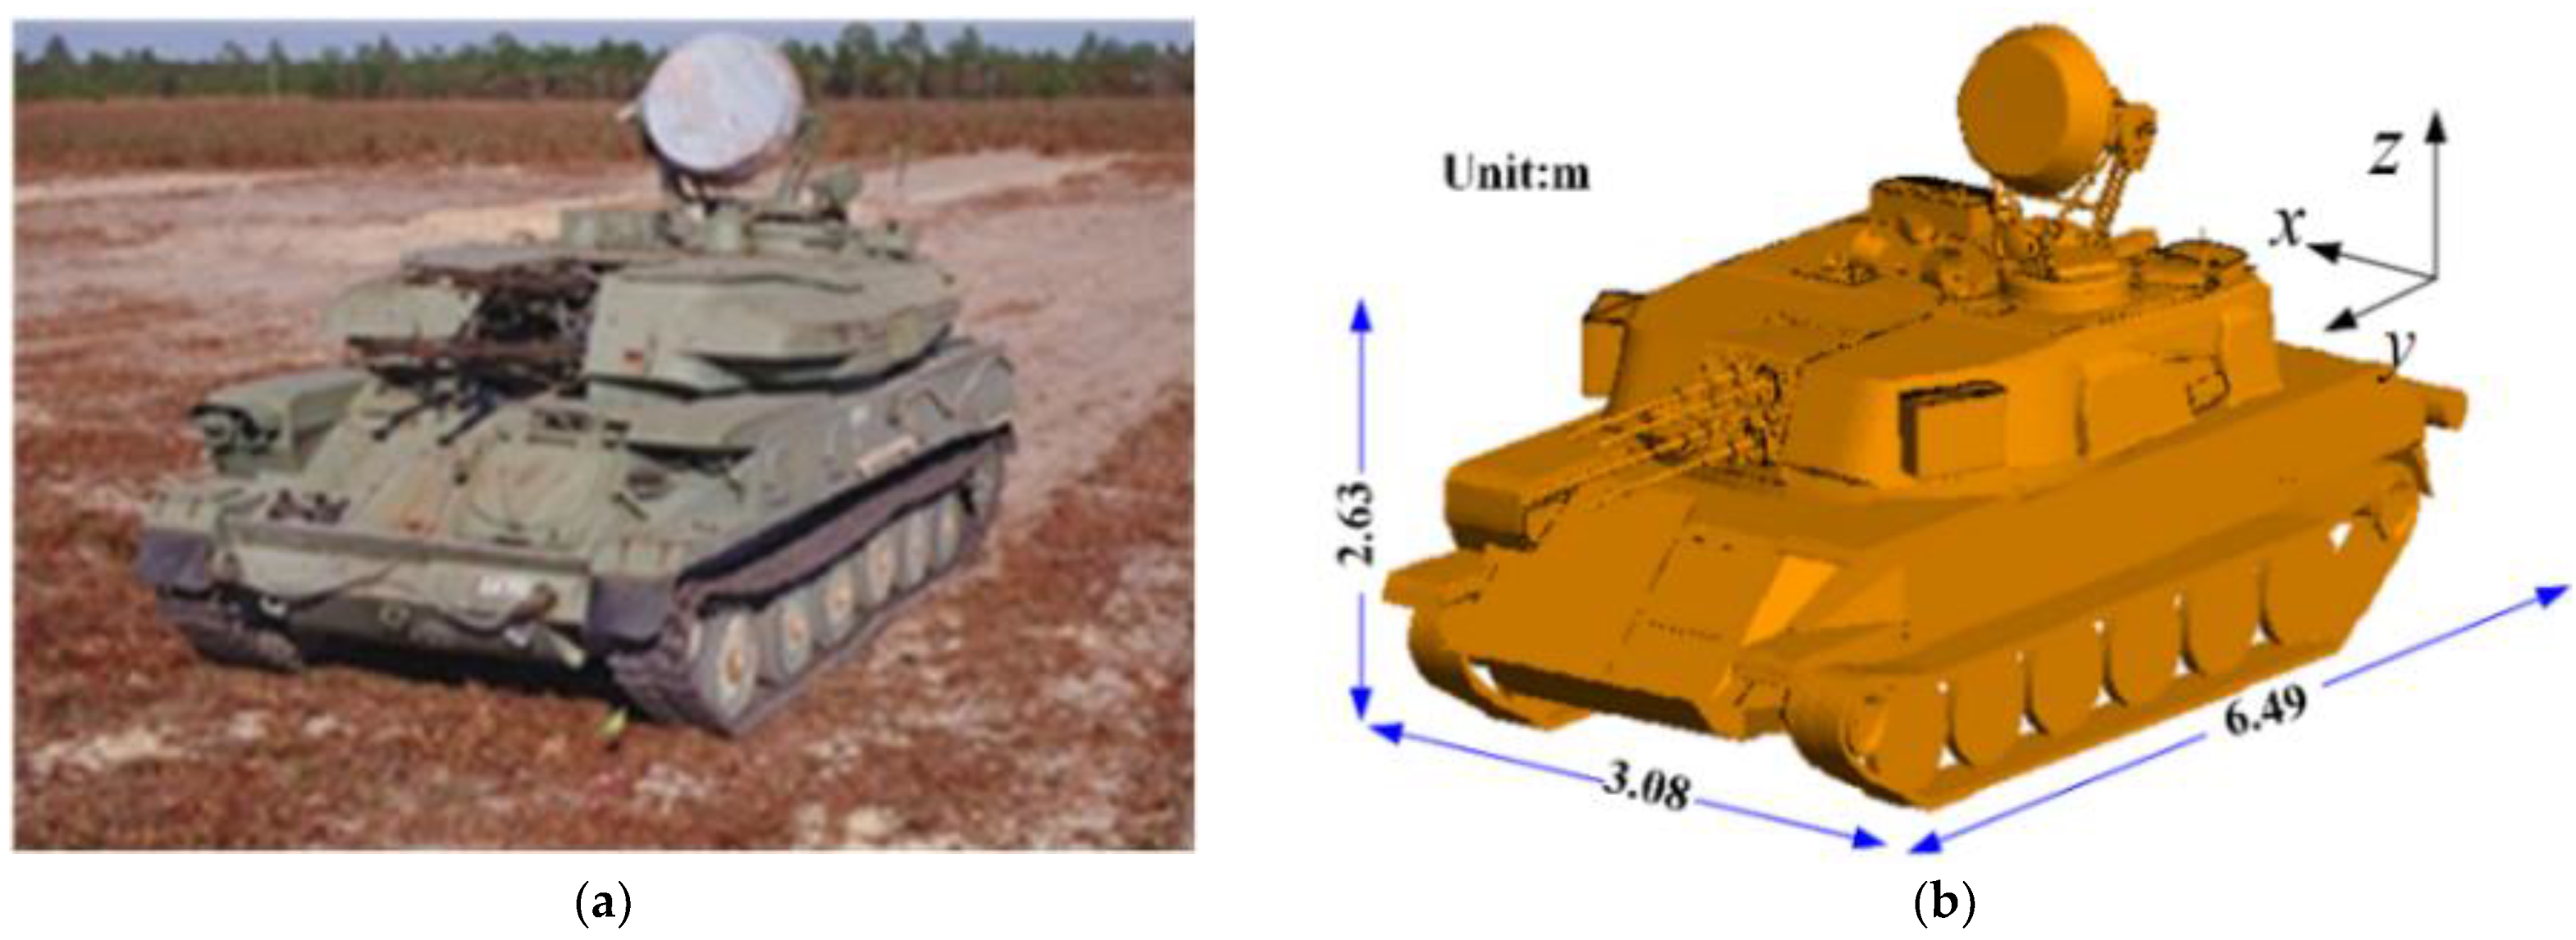
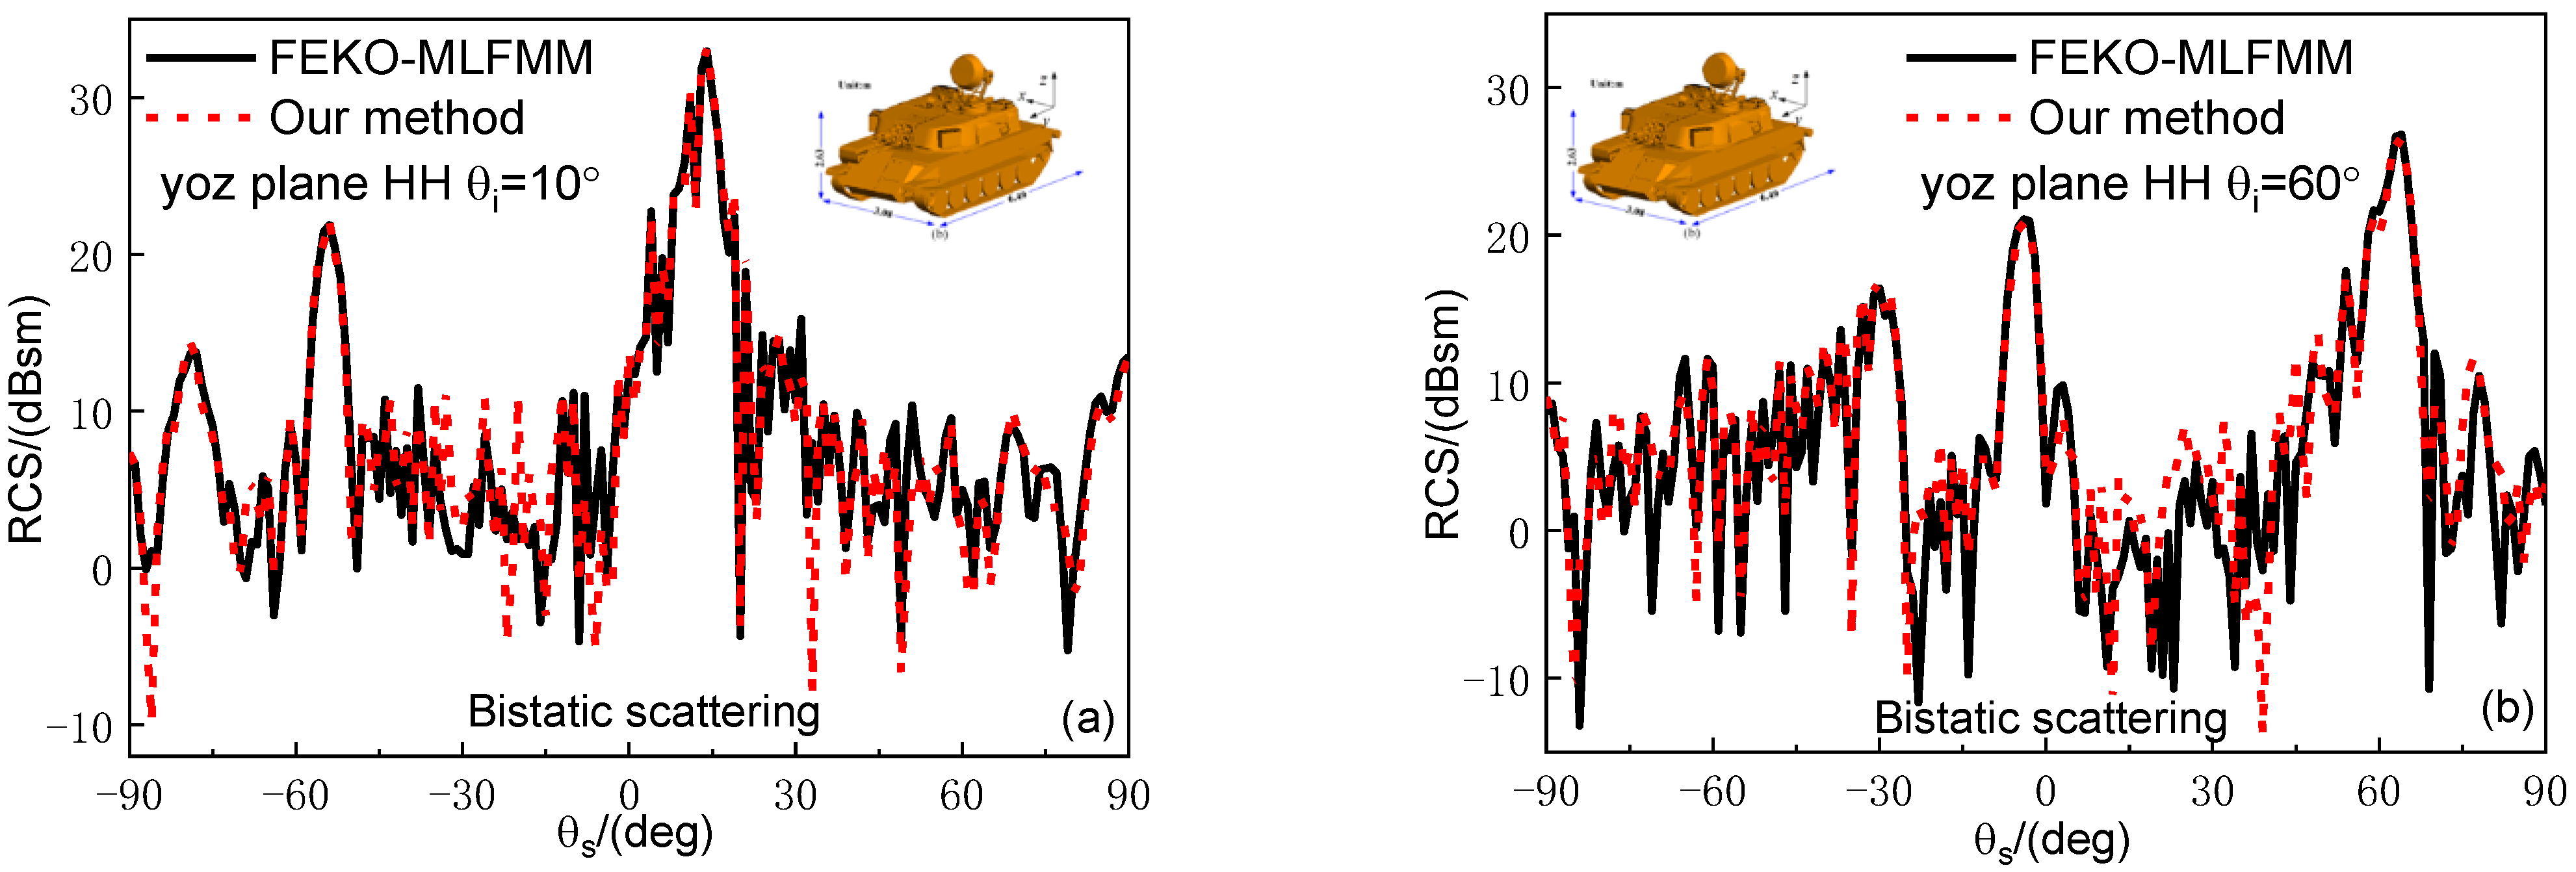
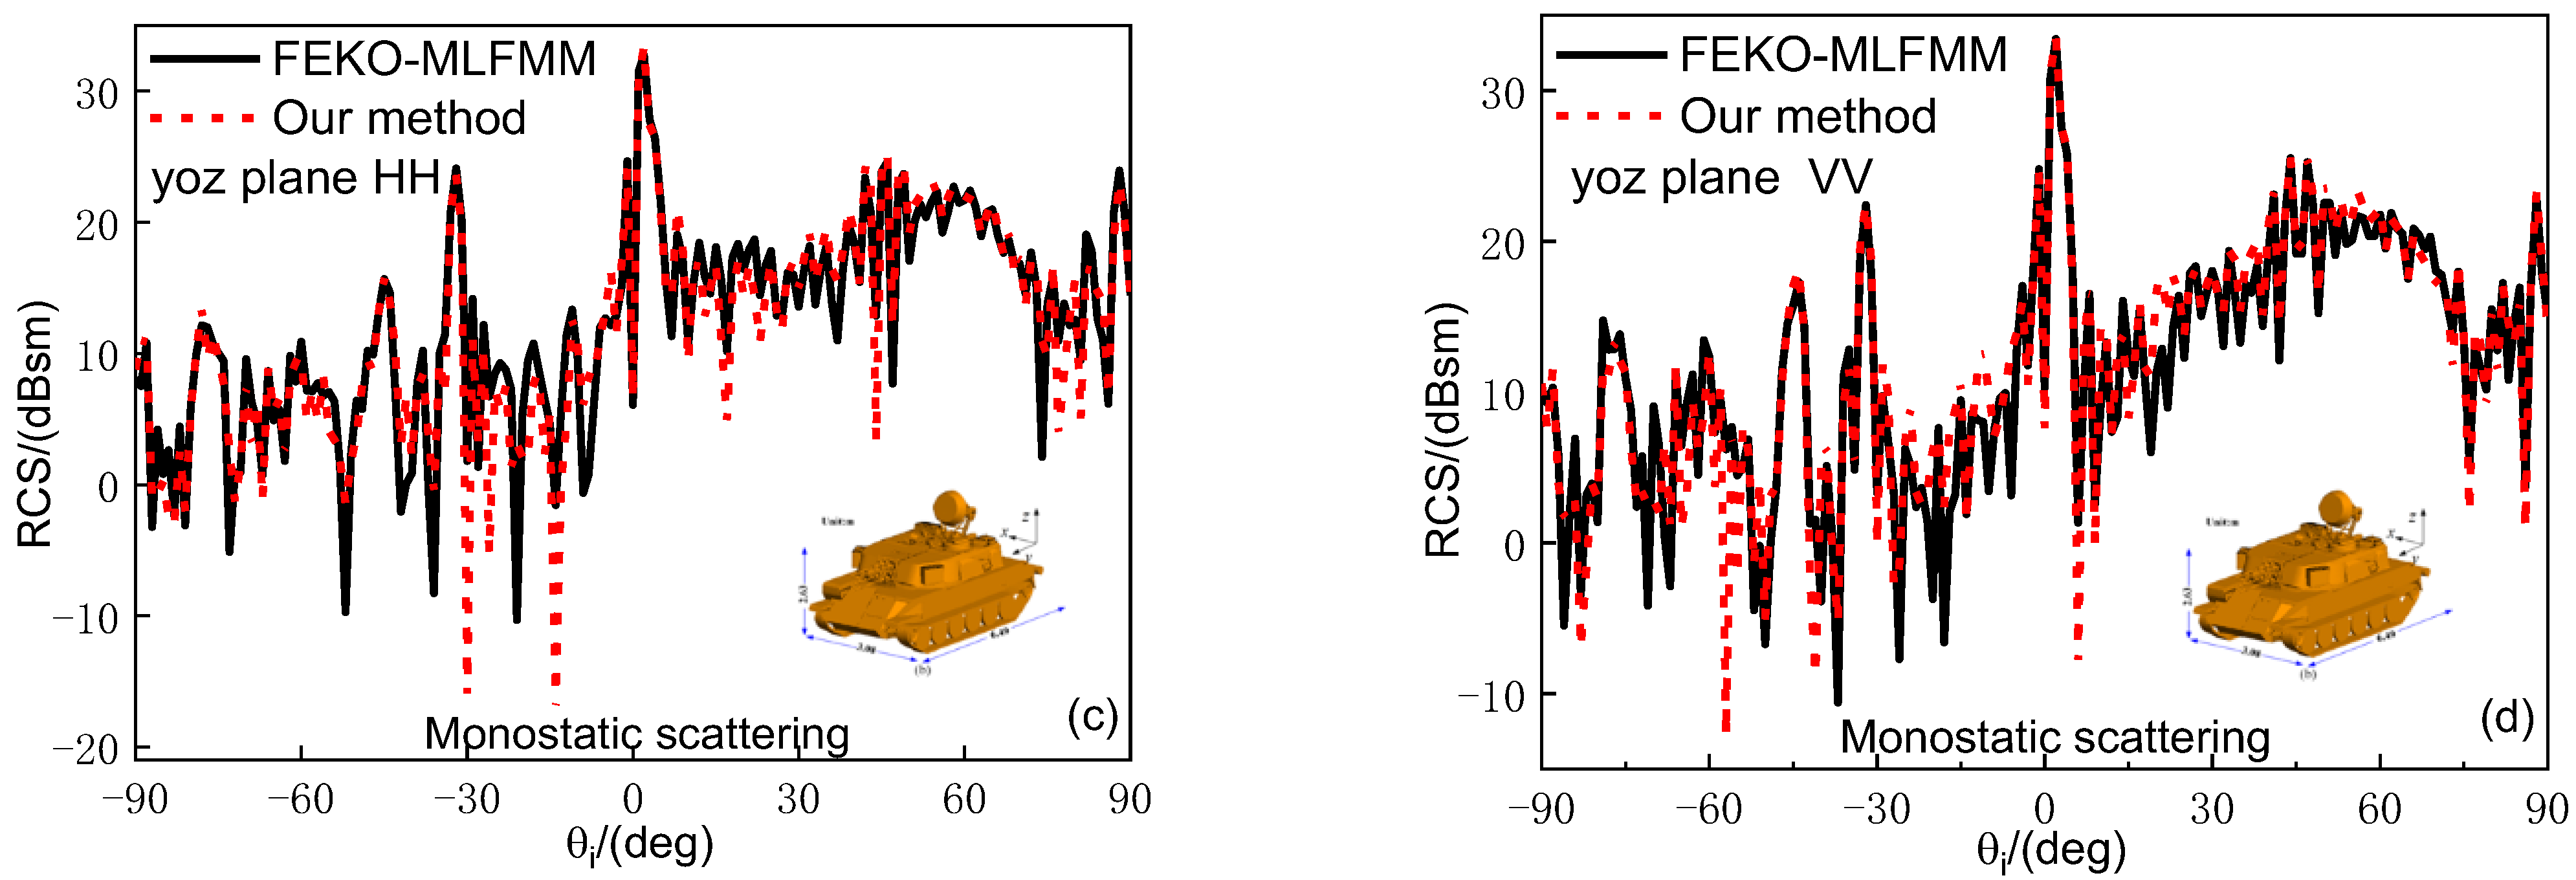
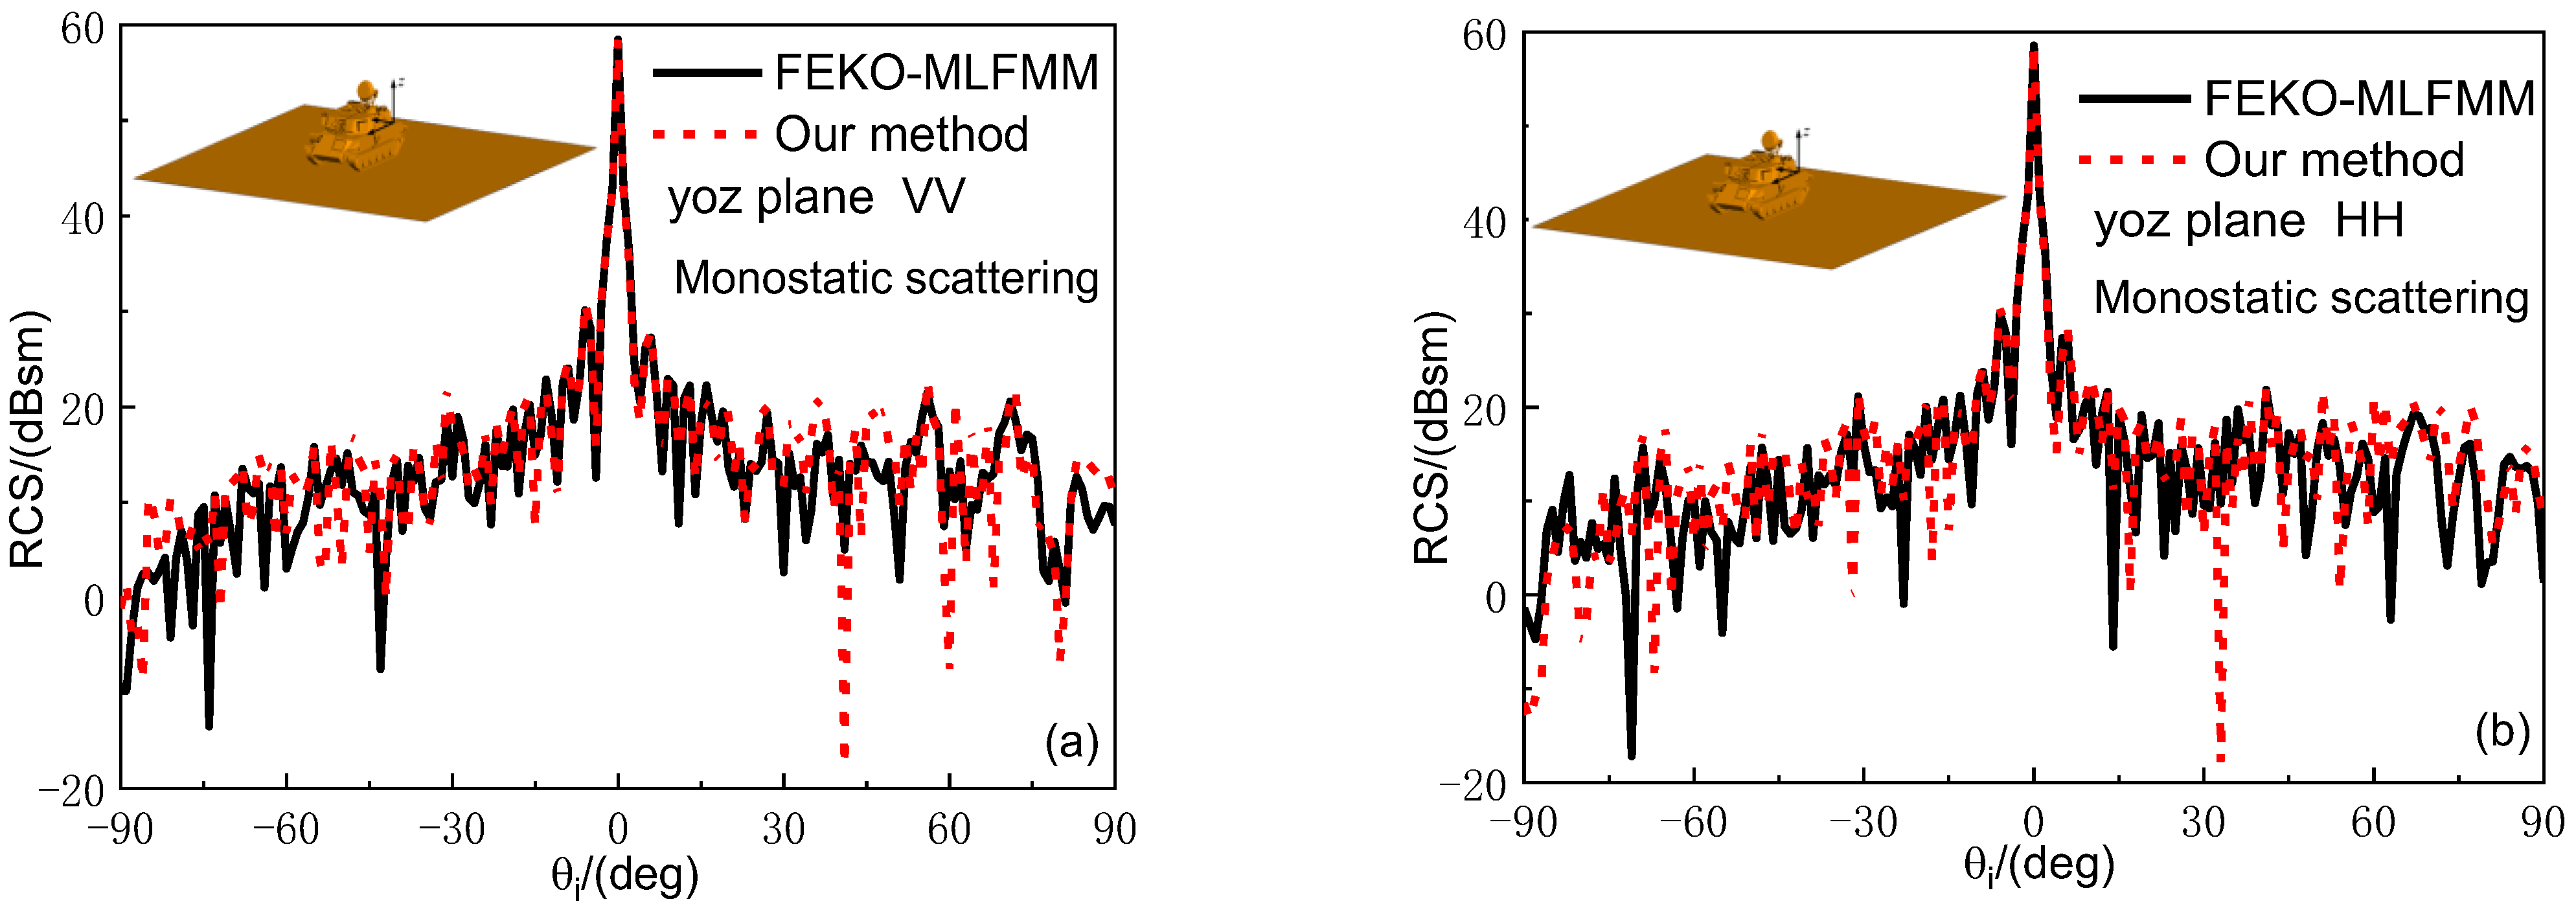
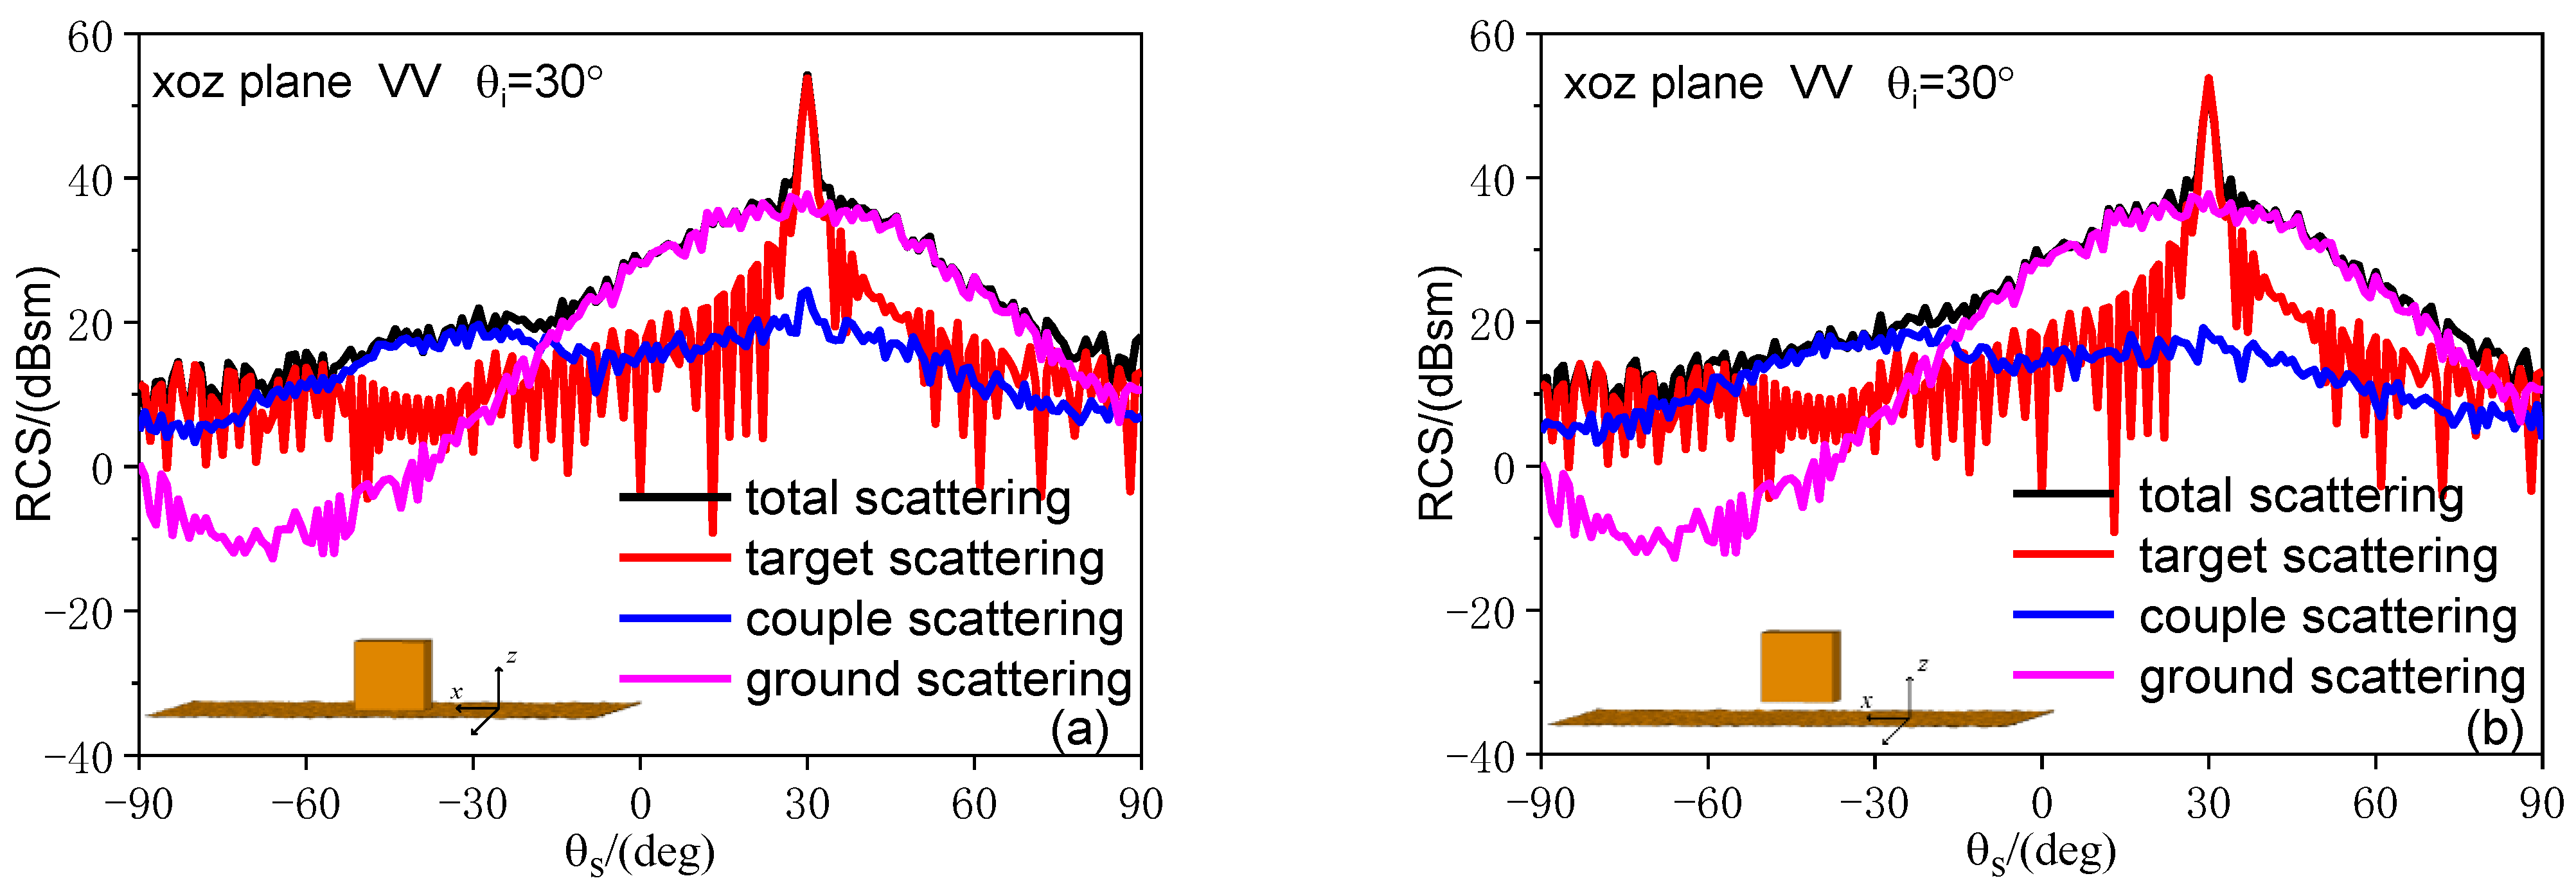
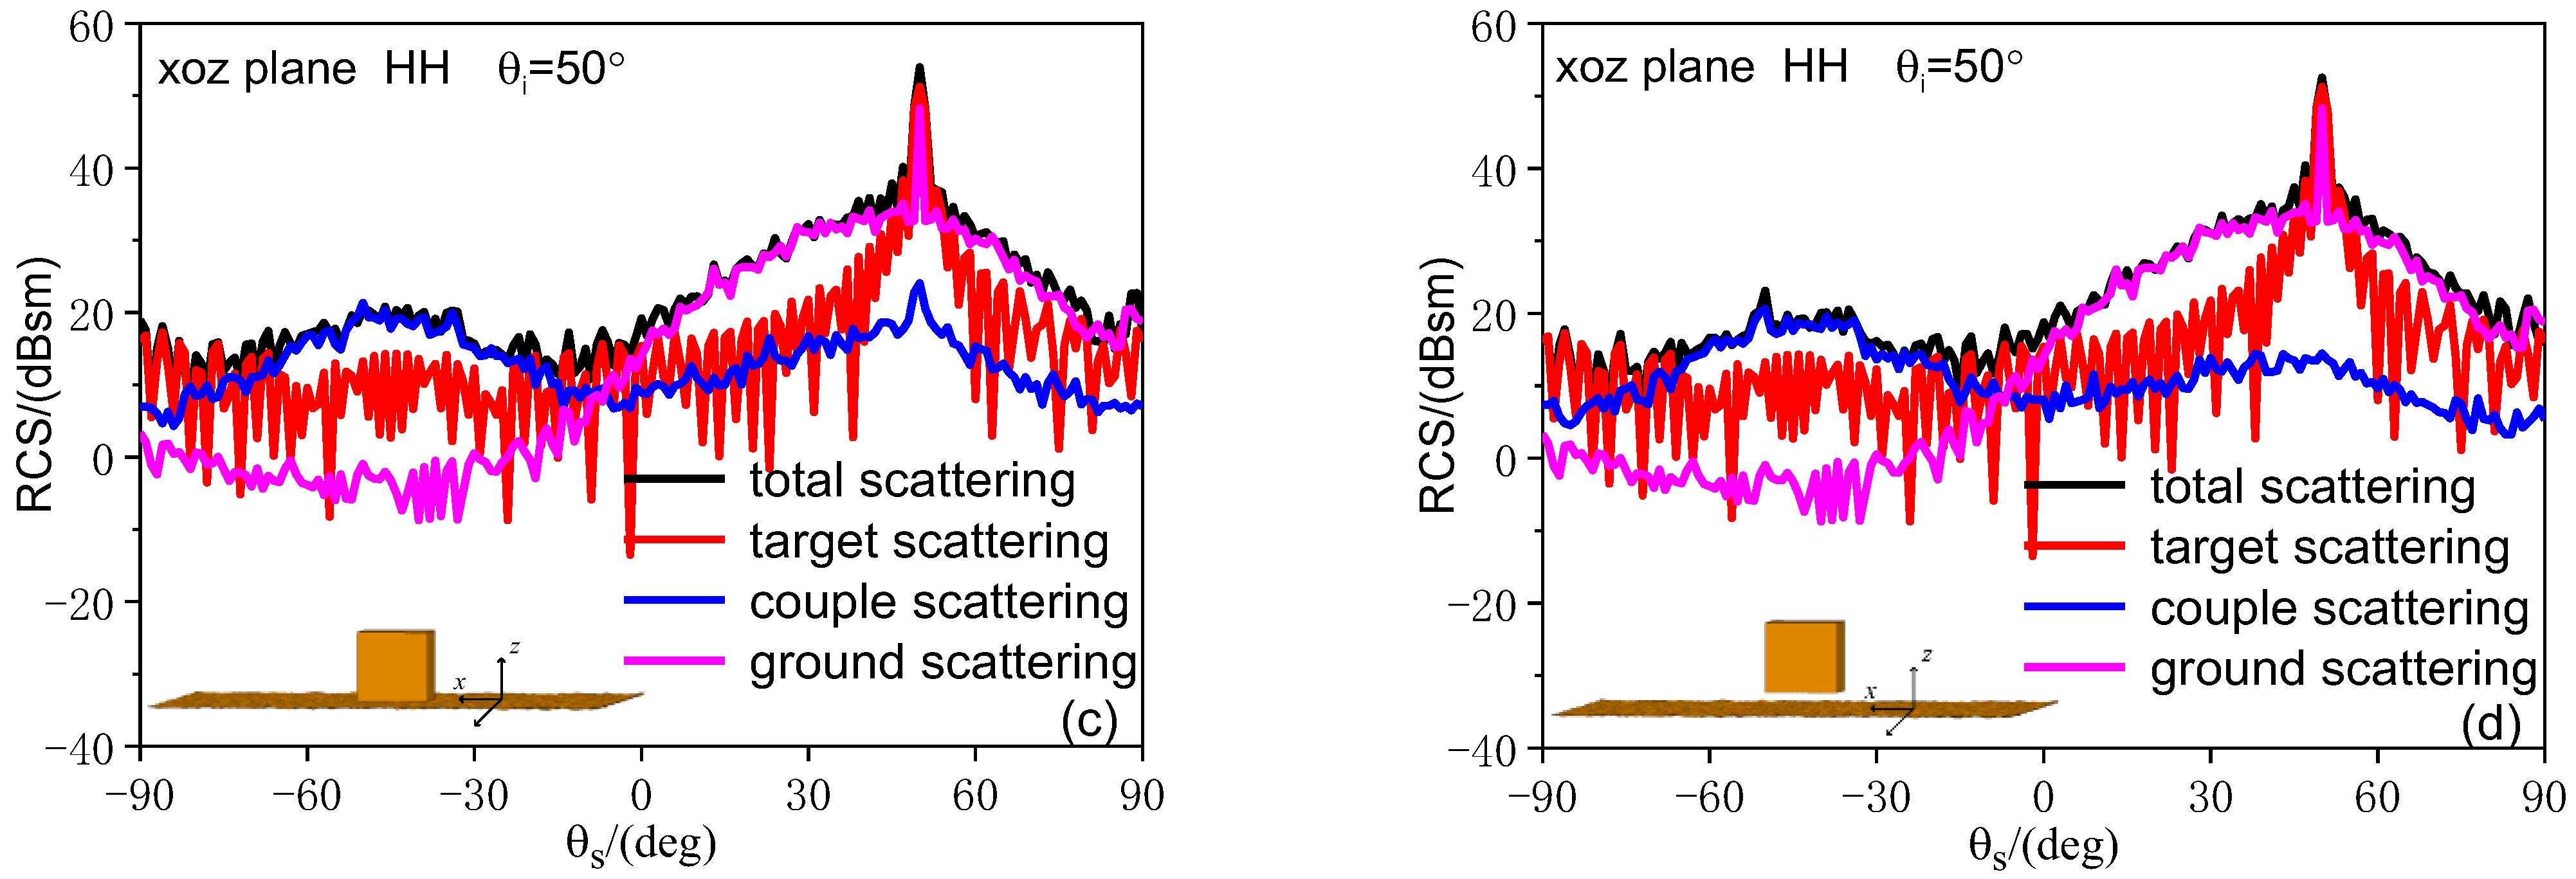
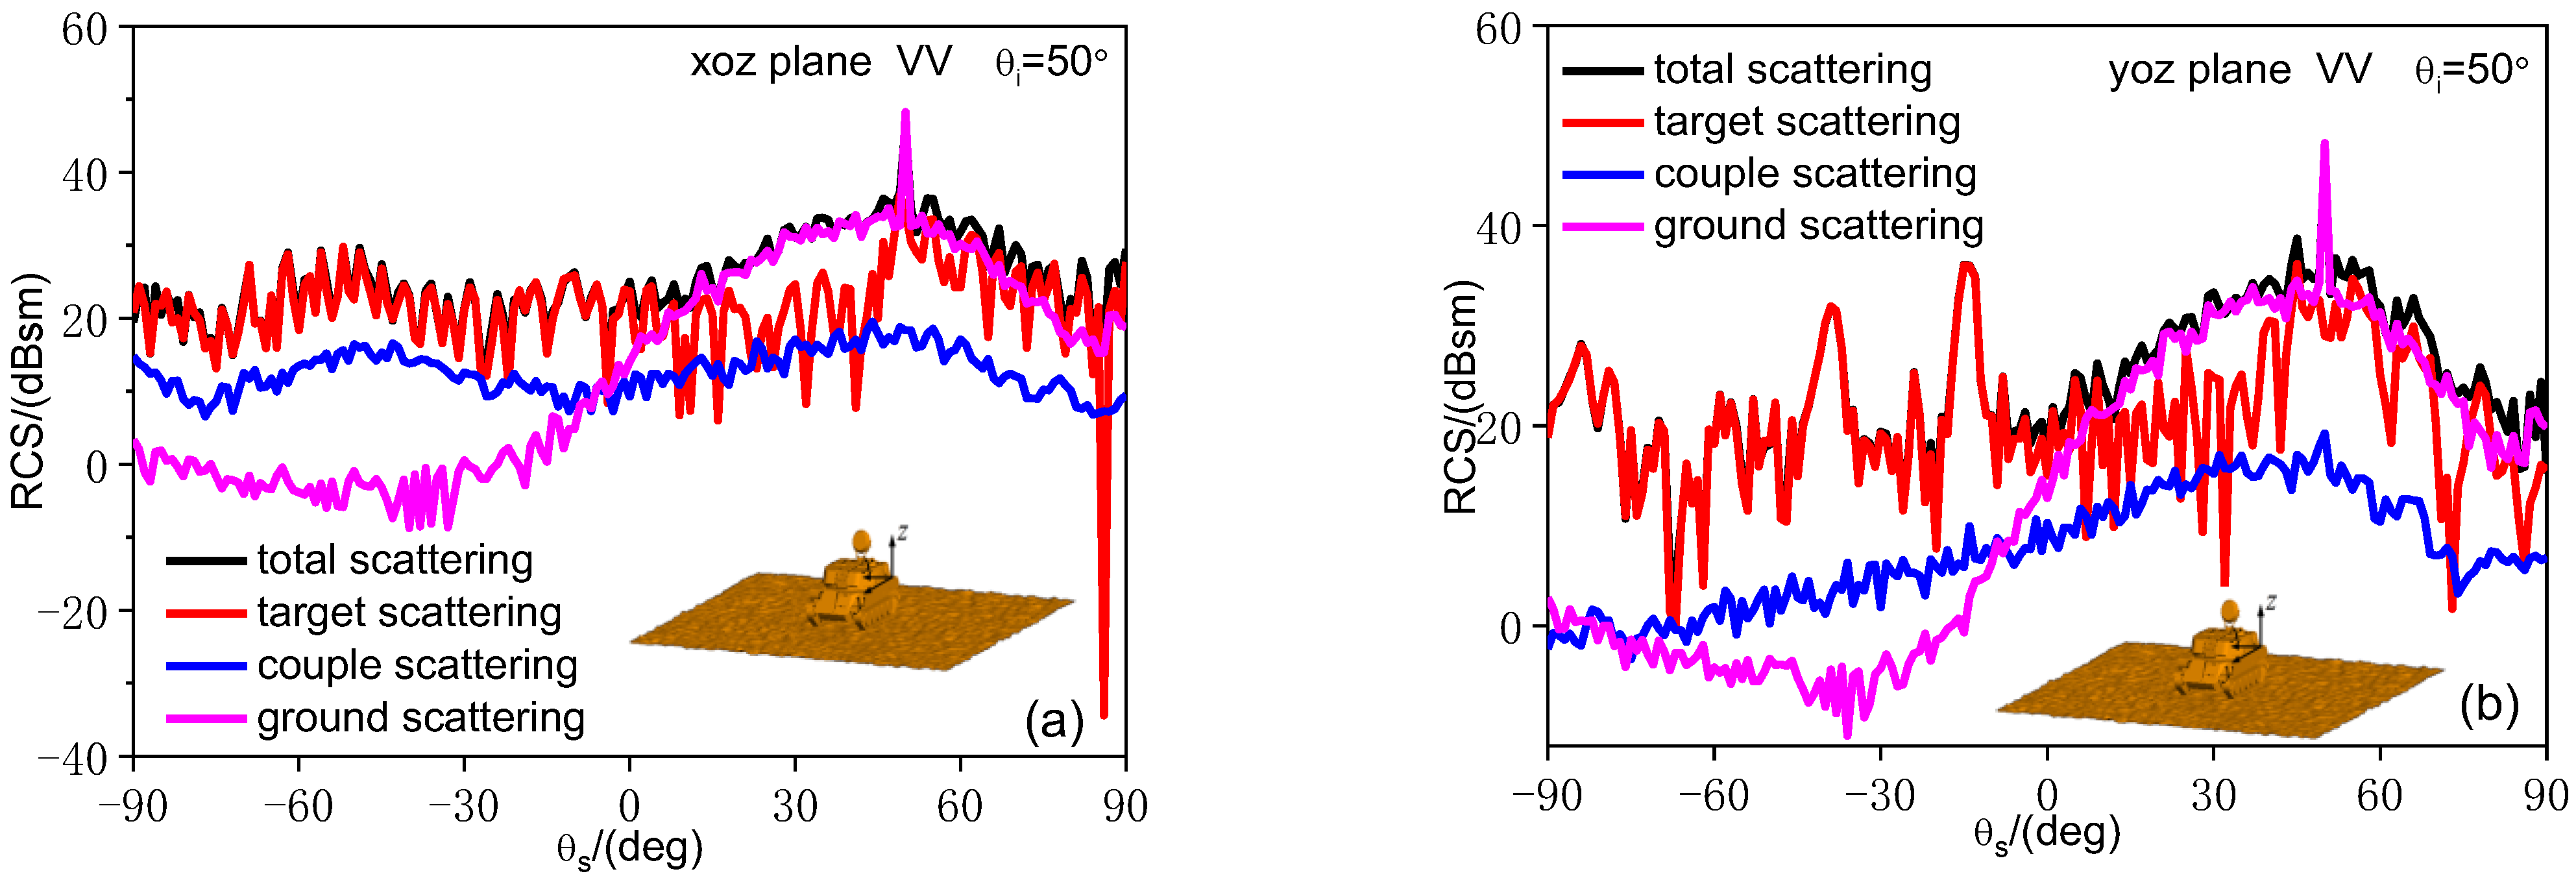
4.1. EM Scattering of Target and Composite Model

In this section, the EM scatterings of the target and composite target–ground model are simulated by our method and compared with the results of MLFMM [17] in FEKO software. All simulations are performed on a computer with an Intel(R) Xeon(R) Platinum 8275CL at 3.00 GHz, 384GBmemory and Intel Visual Fortran Composer XE 2013 SP1. In this paper, the simulations of MLFMM run parallel in 14 threads, and the simulations of SBR-PTD or PO-SBR-PTD run in a single thread.
As the first example, the scattering of the combined cuboid model (CCM) with an incident frequency f = 10   GHz is presented, and the geometry of CCM is shown in Figure 6. In Figure 7, the monostatic scattering of CCM is solved by our accelerated SBR-PTD method for VV and HH polarizations. Additionally, the numerical results by MLFMM in the commercial software FEKO are also presented, where the incident planes are x o z plane in Figure 7a and y o z plane in Figure 7b. Additionally, the CCM is meshed into 150,136 flat triangular patches. From Figure 7, it is obvious that the scattering results by our method and MLFMM have a good agreement for most incident angles. In addition, the consumed computer resources by the two methods are also shown in Table 1. It can be seen that the computational times by the SBR-PTD method are only 0.34% and 0.43% of those by MLFMM for the VV and HH polarizations, respectively. Additionally, the memory consumed by the presented method is about 2.5% of that by MLFMM for the two polarizations. This illustrates that the proposed method greatly saves computer resources.
Figure 8 shows the geometric model of a ZSU-234 antiaircraft gun, which is 6.49 m, 3.08 m and 2.63 m in length, width and height, respectively. The ZSU-234 antiaircraft gun is a specific kind of target in the Moving and Stationary Target Acquisition and Recognition (MSTAR) data [18]. It is important to point out that the CAD model shown in Figure 8b can only guarantee a certain degree of accuracy, with inevitable errors. In Figure 9, the bistatic and monostatic scattering of a reduced-scale antiaircraft gun, which is a fourth of the actual model in Figure 8, are solved by our accelerated SBR-PTD method and MLFMM for different parameters. Where the incident plane is the y o z plane, the incident frequency is f = 10   GHz , and the number of triangular patches for the reduced-scale model is 310353. In Figure 9a,b, the bistatic scatterings of the antiaircraft gun for the HH polarization are presented, and the incident angles are θ i = 10 and θ i = 60 , respectively. In Figure 9c,d, the monostatic scatterings are presented for the HH and VV polarizations. It is evident that both the bistatic and monostatic RCS by the accelerated SBR-PTD method are in satisfactory agreement with those by the FEKO-MLFMM method.
Figure 7 and Figure 9 present the scattering of the CCM and the ZSU-234 antiaircraft gun. The results of our method are compared with those of FEKO-MLFMM. The mean absolute error μ and its standard deviation δ are calculated and presented in Table 2. In statistics, the μ and δ are defined as
μ = 1 M i = 0 M 1 x i , δ = 1 M i = 0 M 1 x i μ 2
where M is the number of total scattering angles, x i = RCS c a l RCS r e f is the difference between the calculated radar cross-section (RCS) ( RCS c a l ) by the proposed method and the reference values RCS r e f by the FEKO-MLFMM. The μ and δ in Figure 7 and Figure 9 are about 1.37~2.84 and 1.40~3.05, respectively. These illustrate that the results by the two methods have good consistency.
In Figure 10, the monostatic scattering of a reduced-scale antiaircraft gun on the plane is investigated with the frequency f = 3   GHz , where the reduced-scale antiaircraft gun is the same as that in Figure 9 and the size of the plane is S = 5   m × 5   m . It is evident that the results of a reduced-scale composite model by our accelerated hybrid PO-SBR-PTD method are in satisfactory agreement with those by the FEKO-MLFMM method. The results further validate the effectiveness of our algorithm.
In Figure 11, the bistatic composite scattering of a cube on and above the rough ground is shown for different polarizations, where the incident frequency is f = 3   GHz and the incident angles are θ i = 30 ° and θ i = 50 ° , respectively. The size of the cube is 4   m × 4   m × 4   m , and the profile of the rough ground with a size of 32 m × 32 m is simulated by the Monte Carlo method [19]. The root mean square (RMS) height of the rough ground is l = 0.1   m , the correlation length is δ = 0.01   m , and the relative dielectric constant is ε r = ( 9.2 , 1.2 ) . The scattering of the cube on rough ground is investigated in Figure 11a,c, and the scattering of the cube above rough ground is investigated in Figure 11b,d. Figure 11 presents four types of RCS, including the total scattering, target scattering, couple scattering and ground scattering. It can be observed that near the specular direction, the scattering of the rough ground is close to the total scattering. In addition, it can be also seen that near the backward direction, the coupling field is close to the total scattering. This is because a dihedral angle structure with strong reflectiveness is formed between the cube and rough ground. Therefore, the coupling scattering between the target and rough surface cannot be ignored.
In Figure 12, the bistatic EM scattering of a full-scale antiaircraft gun on rough ground is investigated for the VV polarization, where the incident parameters are θ i = 50 and f = 3   GHz . The parameters of the rough ground are the same as those in Figure 11. The four types of RCS are also demonstrated in Figure 12. Compared with the result in Figure 11, the scattering of the target shows a significant enhancement for most scattered angles, which is due to the strong scattering from the complex target.

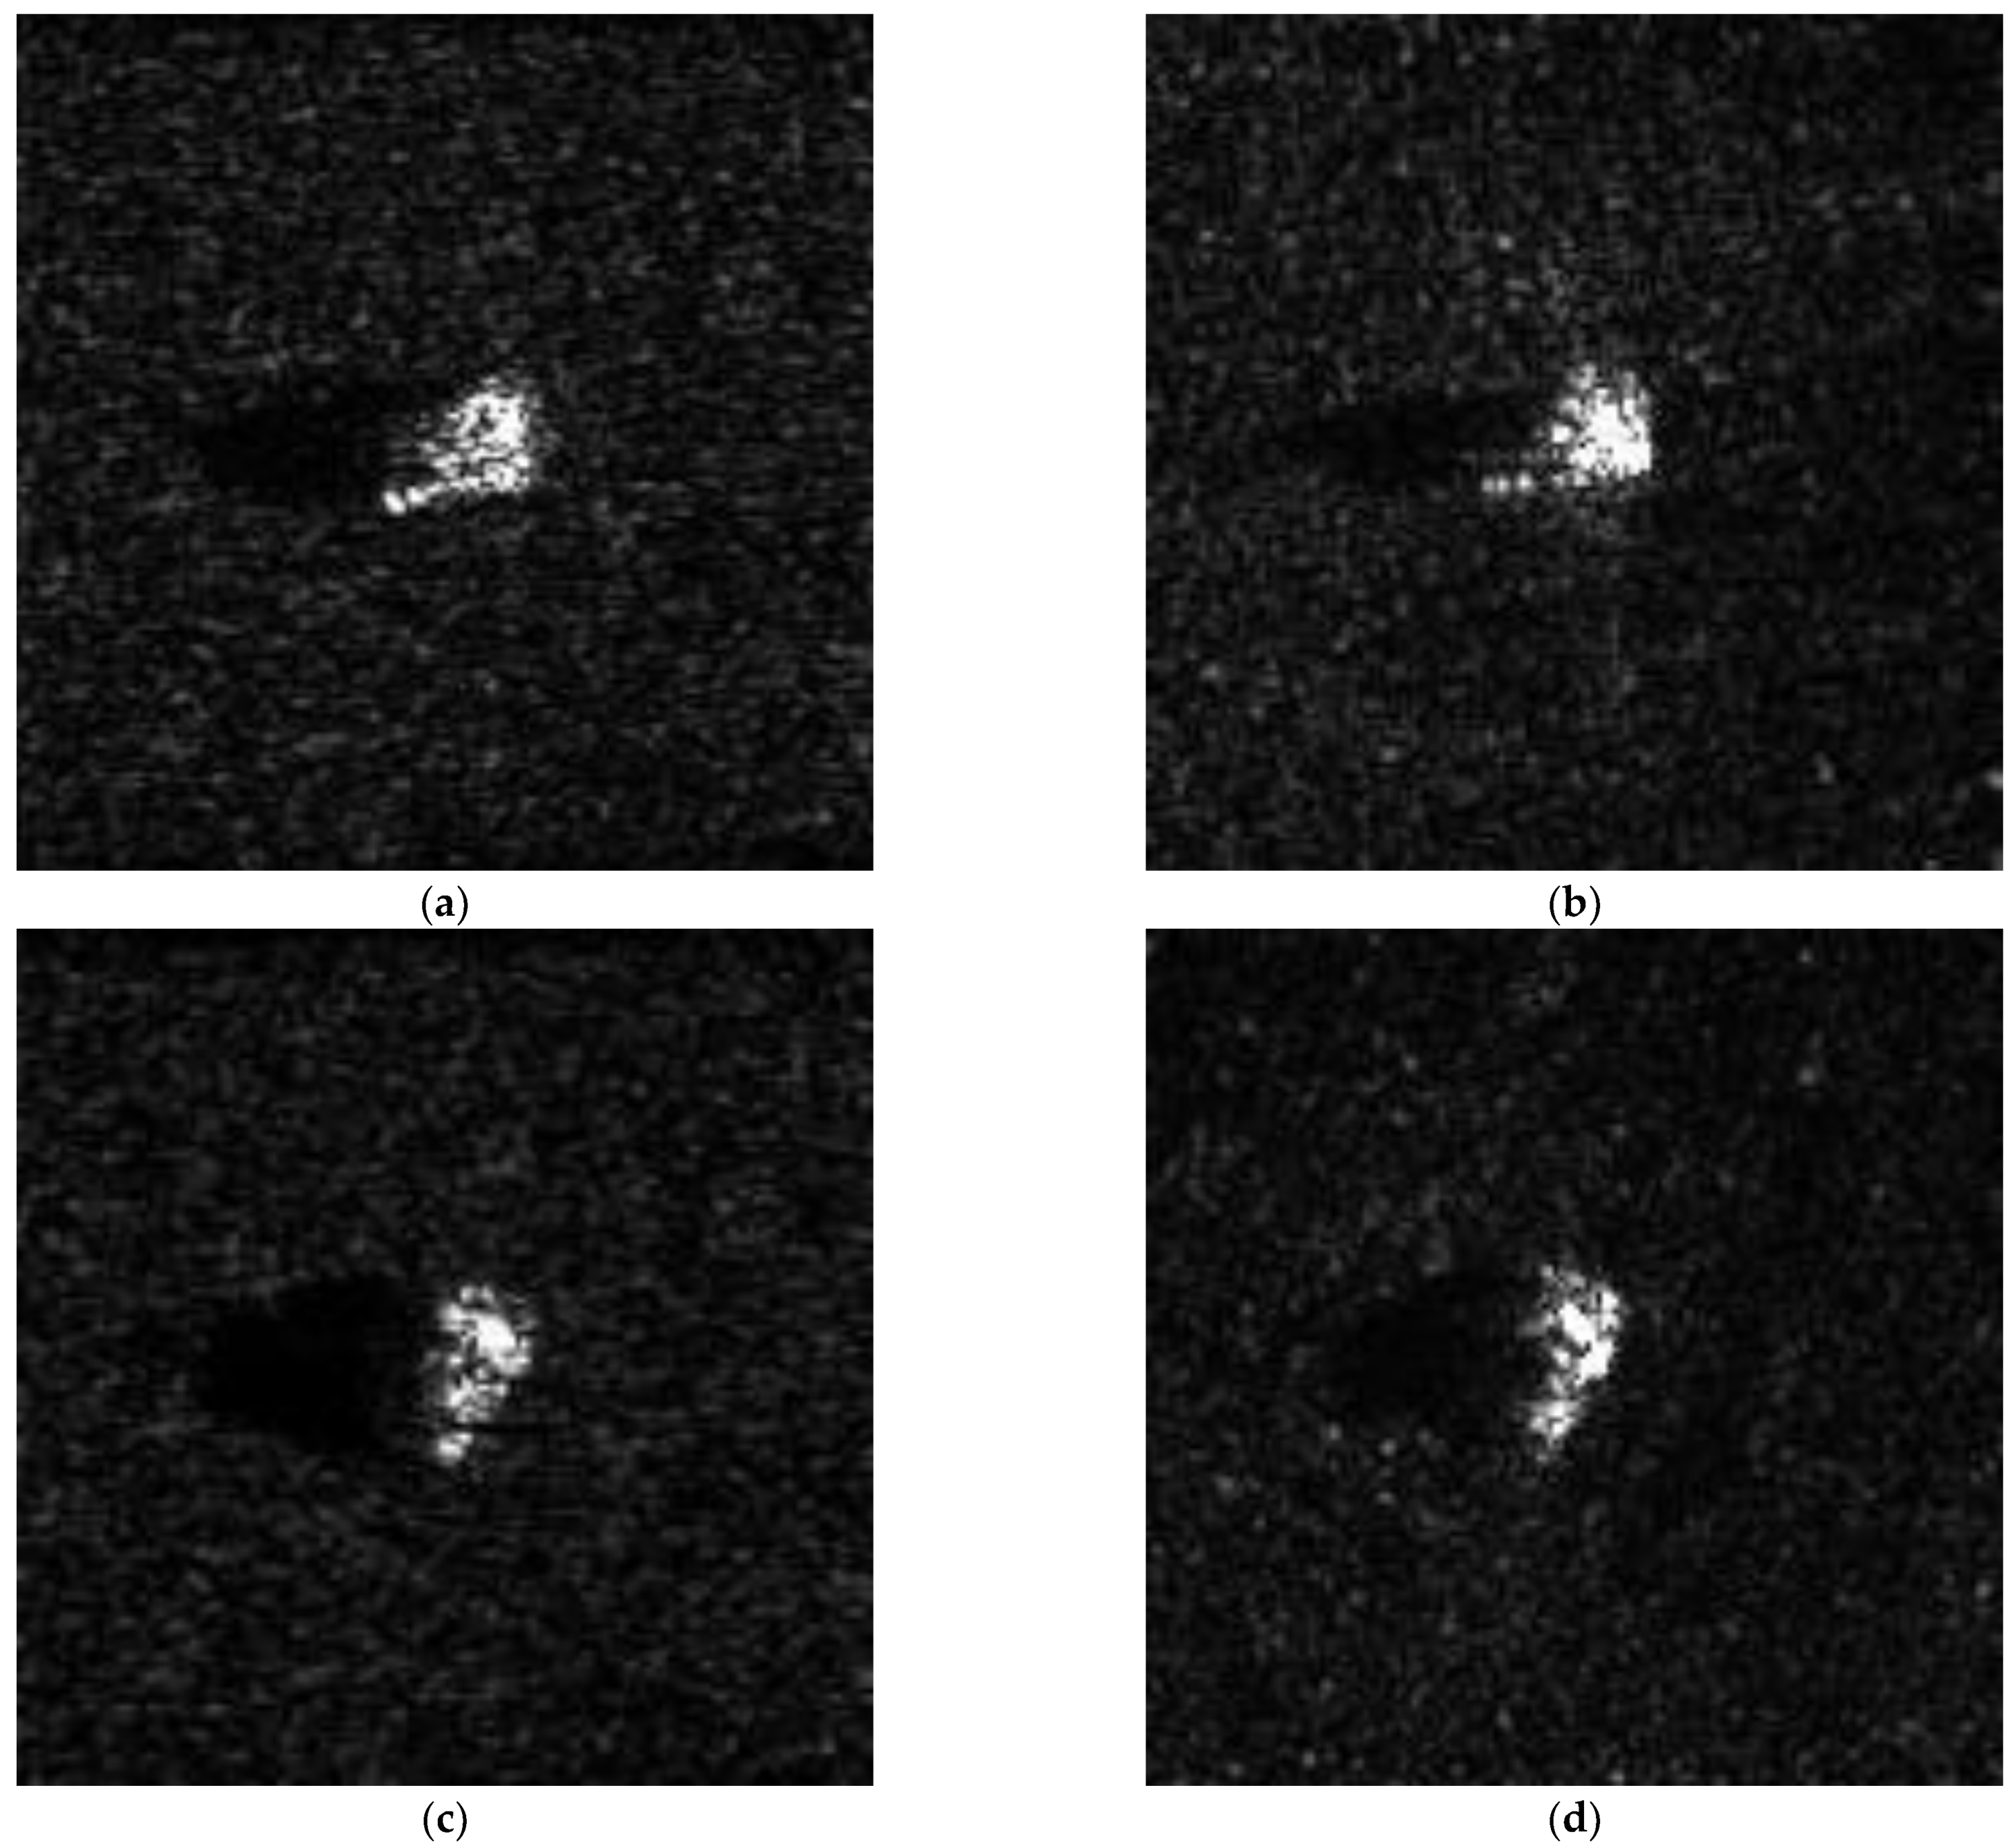
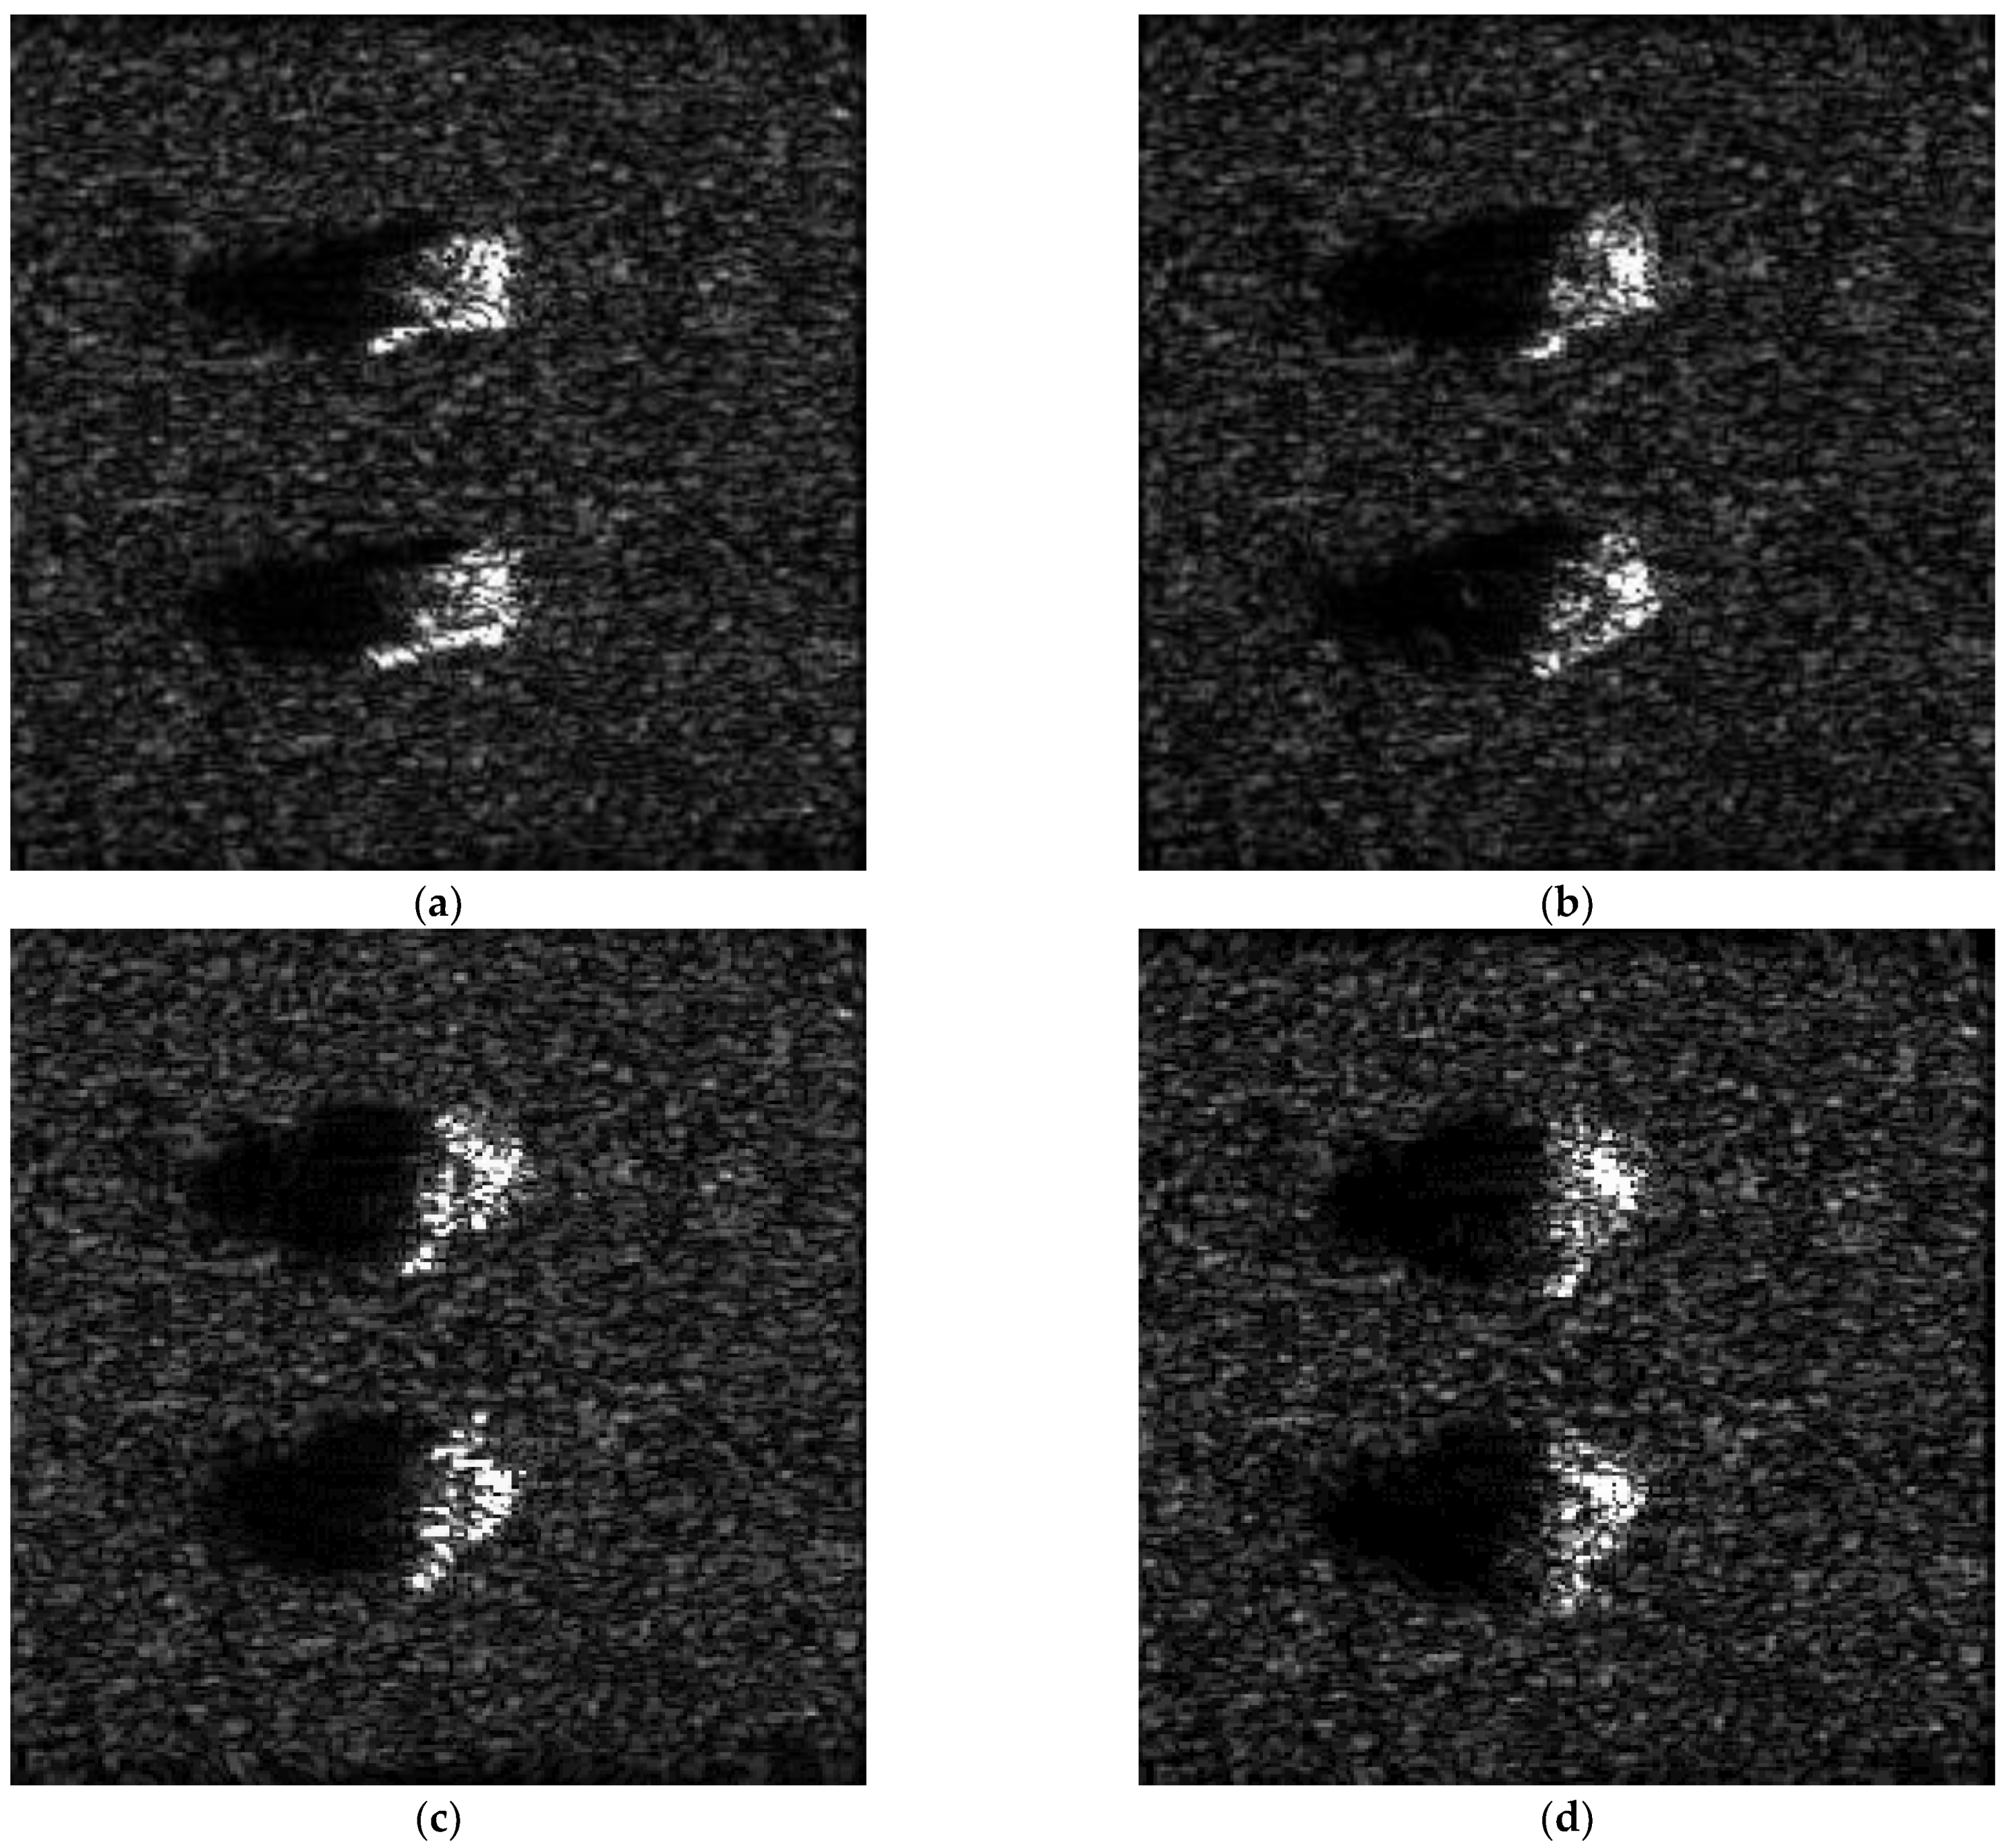
4.2. Spotlight SAR Image

In this section, spotlight SAR images of the composite antiaircraft gun–ground model are simulated and compared with real images in the MSTAR database. The data contain the SAR images of 10 targets, such as tanks, armored vehicles, weapons systems and military engineer vehicles. The range and cross-range resolution are identical and equal to 0.3047 m. MSTAR data were collected with an X-band radar operating at 9.60 GHz with a bandwidth of 591 MHz. Additionally, some parameters of the working spotlight SAR platform are presented in Table 2. In order to compare with the MSTAR images, all SAR images in this paper are normalized and grayed.
In order to evaluate the quality of the simulated image, the Cosine similarity [20] between the simulated image and real image is calculated
C ( f , g ) = f T g f 2 g 2
where f is the feature vector of the simulated image and g is that of the real image. represents the vector’s Euclidean norm. From Equation (13), it can be seen that the bigger the similarity to C there is, the greater the correlation between the simulated image and real image.
In Figure 13, the simulated images and MSTAR data of the ZSU-234 antiaircraft gun are shown for different pose angles, namely ϕ a = 15 and ϕ a = 60 , where the incident angle of the radar wave is θ i = 73 , the RMS height of the rough ground is δ = 0.006   m and the correlation length is l = 0.045   m . The other parameters of rough ground are the same as those in Figure 11. By Equation (13), the similarity between the simulated image and MSTAR data are 84.5% for ϕ a = 15 and 81.4% for ϕ a = 60 . The comparison shows that the simulated image and the actual SAR image have a satisfactory similarity, which proves the effectiveness of our simulated algorithm.
The SAR images of two targets on rough ground are simulated for different pose angles in Figure 14, where the incident angle is θ i = 73 , and the pose angles of the target are ϕ a = 15 , ϕ a = 30 , ϕ a = 45 and ϕ a = 60 . The RMS height of the rough ground is δ = 0.015   m and the correlation length is l = 0.045   m . The distance between two ZSU-234 antiaircraft guns is d = 6   m . The other parameters of the composite model are the same as those in Table 3. Compared with the image in Figure 13, the strong scattering points on the ground are significantly increased. The reason is that as the RMS height δ increases, the roughness of the ground becomes larger and the scattering of the rough ground becomes stronger. Moreover, in SAR images, the shadow area on the ground is obviously observed due to the occlusion of the target. In addition, it is clear that due to the change in the pose angle, the position of the strong scattering point on target changes.

5. Conclusions

In this paper, the EM scattering of a composite target–ground model is solved by an accelerated hybrid PO-SBR-PTD method based on the ray marching technique. In this technique, the uniform mesh generation is used to determine the spatial location of ray arrival, and only the nodes passed by the ray are detected successively, which greatly decreases the intersection test. Then, based on the accelerated hybrid method, the spotlight SAR echo data of the composite model are generated; furthermore, the spotlight SAR image is simulated. In our numerical results, both the EM scattering of the target and composite model are verified, and the spotlight SAR image of composite model is also compared with the real image in MSTAR data. Future investigations will include the spotlight SAR image of a moving target on the ground.

Author Contributions

Conceptualization, J.L. and L.G.; methodology, S.C.; validation, W.M., Y.X. and S.W.; investigation, J.L. and K.L.; writing—original draft preparation, J.L. and W.M.; writing—review and editing, J.L.; funding acquisition, J.L. and L.G. All authors have read and agreed to the published version of the manuscript.

Funding

This research was funded by the National Natural Science Foundation of China, grant numbers 61971338, 61871457, 62231021, 61801362, 41806210 and 62201435, and the Aeronautical Science Foundation of China, grant number 20172081009.

Data Availability Statement

Not applicable.

Acknowledgments

The authors thank the editors and reviewers for their constructive suggestions.

Conflicts of Interest

The authors declare no conflict of interest.

References

  1. Kim, H.; Johnson, J.T. Radar images of rough surface scattering: Comparison of numerical and analytical models. IEEE Trans. Antennas Propag. 2002, 50, 94–100. [Google Scholar] [CrossRef]
  2. Li, J.X.; Zhang, M.; Fan, W.; Nie, D. Facet-based investigation on microwave backscattering from sea surface with breaking waves: Sea spikes and SAR imaging. IEEE Trans. Geosci. Remote Sens. Lett. 2017, 55, 2313–2325. [Google Scholar] [CrossRef]
  3. Xu, F.; Jin, Y.Q. Imaging simulation of polarimetric SAR for a comprehensive terrain scene using the mapping and projection algorithm. IEEE Trans. Geosci. Remote Sens. 2006, 44, 3219–3234. [Google Scholar] [CrossRef]
  4. Zhao, Y.; Zhang, M.; Zhao, Y.W.; Geng, X.P. A bistatic SAR image intensity model for the composite ship-ocean scene. IEEE Trans. Geosci. Remote Sens. 2015, 53, 4250–4258. [Google Scholar] [CrossRef]
  5. Hao, J.W.; Sheng, X.Q. Accurate and efficient simulation model for the scattering from a ship on a sea-like surface. IEEE Trans. Geosci. Remote Sens. Lett. 2017, 14, 2375–2379. [Google Scholar] [CrossRef]
  6. Ozgun, O.; Kuzuoglu, M. Monte Carlo-based characteristic basis finite-element method (MC-CBFEM) for numerical analysis of scattering from objects on/above rough sea surfaces. IEEE Trans. Geosci. Remote Sens. 2012, 50, 769–783. [Google Scholar] [CrossRef]
  7. Wei, Y.W.; Wang, C.F.; Kee, C.Y.; Chia, T.T. An accurate model for the efficient simulation of electromagnetic scattering from an object above a rough surface with infinite extent. IEEE Trans. Antennas Propag. 2021, 69, 1040–1051. [Google Scholar] [CrossRef]
  8. Dong, C.L.; Guo, L.X.; Meng, X. An accelerated algorithm based on GO-PO/PTD and CWMFSM for EM scattering from the ship over a sea surface and SAR image formation. IEEE Trans. Antennas Propag. 2020, 68, 3934–3944. [Google Scholar] [CrossRef]
  9. Nie, Z.X.; Zhu, D.Y.; Mao, X.H.; Zhu, Z.D. The application of the principle of chirp scaling in processing stepped chirps in spotlight SAR. IEEE Trans. Geosci. Remote Sens. Lett. 2009, 6, 860–864. [Google Scholar] [CrossRef]
  10. Jakowatz, C.; Wahl, D.; Eichel, P.; Ghiglia, D.; Thompson, P. Spotlight-Mode Synthetic Aperture Radar: A Signal Processing Approach; Kluwer Academic Publishers: Boston, MA, USA, 1996. [Google Scholar]
  11. Mao, X.H.; Zhu, D.Y.; Zhu, Z.D. Polar format algorithm wavefront curvature compensation under arbitrary radar flight path. In Proceedings of the 2011 IEEE CIE International Conference on Radar, Chengdu, China, 24–27 October 2011. [Google Scholar]
  12. Yang, W.; Kee, C.Y.; Wang, C.F. Novel extension of SBR–PO method for solving electrically large and complex electromagnetic scattering problem in half-space. IEEE Trans. Geosci. Remote Sens. 2017, 55, 3931–3940. [Google Scholar] [CrossRef]
  13. Jin, K.S.; Suh, T.I.; Suk, S.H.; Kim, B.C.; Kim, H.T. Fast ray tracing using a space-division algorithm for RCS prediction. J. Electromagn. Waves Appl. 2012, 20, 119–126. [Google Scholar] [CrossRef]
  14. Dong, C.L.; Guo, L.X.; Meng, X.; Wang, Y. An accelerated SBR for EM scattering from the electrically large complex objects. IEEE Antennas Wireless Propag. Lett. 2018, 17, 2294–2298. [Google Scholar] [CrossRef]
  15. Huang, W.F.; Zhao, Z.; Zhao, R.; Wang, J.-Y.; Nie, Z.; Liu, Q.H. GO/PO and PTD with virtual divergence factor for fast analysis of scattering from concave complex targets. IEEE Trans. Antennas Propag. 2015, 63, 2170–2179. [Google Scholar] [CrossRef]
  16. Kantor, J.M. Polar format-based compressive SAR image reconstruction with integrated autofocus. IEEE Trans. Geosci. Remote Sens. 2020, 58, 3458–3468. [Google Scholar] [CrossRef]
  17. Chew, W.C.; Jin, J.M.; Michielssen, E.; Song, J. Fast Efficient Algorithms in Computational Electromagnetics; Artech House: Boston, MA, USA, 2001. [Google Scholar]
  18. Keydel, E.; Lee, S.; Moore, J. MSTAR extended operating conditions—A tutorial. Proc. SPIE-Int. Soc. Opt. Eng. 1996, 2757, 228–242. [Google Scholar] [CrossRef]
  19. Kuga, Y.; Phu, P. Experimental studies of millimeter-wave scattering in discrete random media and from rough surfaces—Summary. J. Electromagn. Waves Appl. 2012, 10, 451–453. [Google Scholar] [CrossRef] [Green Version]
  20. Sadbhawna; Jakhetiya, V.; Chaudhary, S.; Subudhi, B.N.; Lin, W.; Guntuku, S.C. Perceptually unimportant information reduction and cosine similarity-based quality assessment of 3D-synthesized images. IEEE Trans. Image Process. 2022, 31, 2027–2039. [Google Scholar] [CrossRef] [PubMed]
Figure 1. Ray tracing process in ray marching algorithm.
Remotesensing 14 06332 g001
Figure 2. Flowchart of ray marching algorithm.
Remotesensing 14 06332 g002
Figure 3. Spatial division. (a) Octree–leaf node. (b) Leaf node–spatial unit.
Remotesensing 14 06332 g003
Figure 4. Intersection of ray and SRU: (a) ray passes through the vertex; (b) ray passes through the surface; (c) ray passes through the edge.
Remotesensing 14 06332 g004
Figure 5. Geometry of spotlight SAR image.
Remotesensing 14 06332 g005
Figure 6. Combined cuboid model (a) Geometry; (b) Subdivision model.
Remotesensing 14 06332 g006
Figure 7. Monostatic scattering of combined cuboid using our method and MLFMM (a) x o z plane VV; (b) y o z plane HH.
Remotesensing 14 06332 g007
Figure 8. ZSU-234 antiaircraft gun (a) optical image; (b) CAD model.
Remotesensing 14 06332 g008
Figure 9. Bistatic and monostatic scattering of ZSU-234 antiaircraft gun using our method and MLFMM: (a) bistatic θ i = 10 ; (b) bistatic θ i = 60 ; (c) monostatic HH; (d) monostatic VV.
Remotesensing 14 06332 g009aRemotesensing 14 06332 g009b
Figure 10. Monostatic scattering of ZSU-234 antiaircraft gun on the plane using our method and MLFMM: (a) monostatic VV; (b) monostatic HH.
Remotesensing 14 06332 g010
Figure 11. Bistatic scattering of cube on and above the rough ground using our method (a) on the rough ground θ i = 30 VV; (b) 1 m above the rough ground θ i = 30 VV; (c) on the rough ground θ i = 50 HH; (d) 1 m above the rough ground θ i = 50 HH.
Remotesensing 14 06332 g011aRemotesensing 14 06332 g011b
Figure 12. Bistatic scattering of ZSU-234 antiaircraft gun on rough ground (a) xoz plane; (b) yoz plane.
Remotesensing 14 06332 g012
Figure 13. Similarity between simulated image and MSTAR data: (a) ϕ a = 15 simulated image; (b) ϕ a = 15 MSTAR data; (c) ϕ a = 60 simulated image; (d) ϕ a = 60 MSTAR data.
Remotesensing 14 06332 g013
Figure 14. Spotlight SAR images of two targets on rough ground: (a) ϕ a = 15 ; (b) ϕ a = 30 ; (c) ϕ a = 45 ; (d) ϕ a = 60 .
Remotesensing 14 06332 g014
Table 1. Computation cost comparison between accelerated SBR-PTD and MLFMM in Figure 6.
PolarizationPlaneComputation Time (min)Memory (MB)
SBR-PTDMLFMMSBR-PTDMLFMM
Figure 6aVVxoz2.41693.361606365.19
Figure 6bHHyoz2.55589.181606365.19
Table 2. µ and δ for our method compared with the FEKO-MLFMM.
μ δ
Figure 7a1.932.71
Figure 7b1.371.40
Figure 9a2.102.29
Figure 9b2.843.05
Figure 9c2.262.73
Figure 9d2.202.57
Table 3. Simulated spotlight SAR system parameters.
ParametersValue (unit)ParametersValue (unit)
Carrier frequency9.6 (GHz)Pulse duration1 (μs)
Range bandwidth591 (MHz)Doppler bandwidth493 (Hz)
Height of platform1500 (m)Speed of platform150 (m/s)
Publisher’s Note: MDPI stays neutral with regard to jurisdictional claims in published maps and institutional affiliations.

