Article

Optimization of the Ecological Network Structure Based on Scenario Simulation and Trade-Offs/Synergies among Ecosystem Services in Nanping

1
School of Soil and Water Conservation, Beijing Forestry University, Beijing 100083, China
2
Hebei Province Collaborative Innovation Center for Sustainable Utilization of Water Resources and Optimization of Industrial Structure, Hebei GEO University, Shijiazhuang 050031, China
3
Key Laboratory of Soil and Water Conservation and Desertification Prevention, Beijing Forestry University, Beijing 100083, China
*
Author to whom correspondence should be addressed.
Remote Sens. 2022, 14(20), 5245; https://doi.org/10.3390/rs14205245
Submission received: 21 July 2022 / Revised: 6 October 2022 / Accepted: 18 October 2022 / Published: 20 October 2022

Abstract

:
The optimization of the ecological network structure in Nanping can provide a scientific reference for guaranteeing ecological safety in Southeast China. This study estimated ecosystem services in Nanping with the Integrated Valuation of Ecosystem Services and Trade-offs (InVEST) model based on land-use data from 2020 to 2025 simulated with the CLUE-S model under the natural development scenario and ecological protection scenario and then explored their trade-offs and synergies. The ecological network structure was, thereafter, optimized in terms of the eco-matrix, eco-corridors and nodes based on simulated land use and ecosystem services. The results suggested that the average habitat quality and total soil retention increased, while the average degradation index and total water yield decreased under the ecological protection scenario, indicating that the ecological environment quality tended to be improved. In addition, soil retention had significant synergies with habitat quality and water yield, and habitat quality had significant trade-offs with ecological degradation and water yield on the regional scale under two scenarios, while ecological degradation also showed significant trade-offs with soil retention and water yield. In addition, the results suggested that 11 additional ecological sources could be added, and the number of eco-corridors increased from 15 to 136; a total of 1019 ecological break points were restored, and 1481 stepping stone patches were deployed, which jointly made network circuitry, edge/node ratio and network connectivity reach 0.45, 1.86 and 0.64, respectively, indicating that optimization could effectively improve the structure and connectivity of the ecological network. These findings can provide a theoretical basis for improving the ecological network structure and ecological service functions in Nanping and other regions.

1. Introduction

Improper land management and high-intensity development, along with rapid urbanization and population growth, have led to certain ecological problems around the world, e.g., the fragmentation of natural habitats and the reduction in regional biodiversity [1,2,3]. These ecological problems not only lead to the instability of natural ecosystems but also threaten the sustainable development of the human socioeconomic system to some extent [4,5,6]. The ecological protection and restoration have, therefore, become some of the key issues of global concern [7,8,9]. Scholars and ecological managers have explored various ways for the rational utilization and protection of natural resources in order to address the contradiction between ecological protection and socioeconomic development so as to guarantee sustainable socioeconomic development [8,10,11]. For example, Man and Biosphere Program has been proposed in order to solve various ecological issues, such as ecosystem degradation, habitat fragmentation and the destruction of ecological processes [12].
The report of the 19th National Congress of China proposed that it is necessary to construct eco-corridors and conserve biodiversity in order to promote significant national ecological restoration projects and optimize ecological barriers. Eco-corridors, as basic elements of the landscape pattern, generally play an important role in connecting fragmented habitats, as not only they can help to strengthen the functional relationships between species population and habitats, but they may also help certain wildlife species to navigate through their natural environments [13,14,15,16,17]. In addition, eco-corridors can protect the biodiversity and stability of ecosystems, promote potential species migration and guarantee the stability of ecological processes, which have been widely used to achieve the goal of regulating and improving the regional ecological environment [18,19,20]. In addition, it is of great importance to effectively improve the ecological environment and ensure sustainable development to scientifically construct and improve the ecological network structure, conserve necessary regional ecological processes and preserve essential ecosystem services [2,14,15,21]. In fact, it has been one of the key issues in ecological landscape pattern planning to develop a suitable approach for the comprehensive analysis of the landscape pattern, ecological processes and ecosystem services in order to realize the effective protection of the ecological network structure [22,23,24].
Scholars at home and abroad have extensively investigated the construction of the ecological network structure and eco-corridors based on land use, ecosystem services, etc. [14,20,25]. For example, some scholars obtained the synthetic resistance surface based on multiple natural and social indicators, such as the land-use type, population density and transportation infrastructure, and then explored the potential ecological network of nature reserves [26]. Some other scholars extracted the eco-corridors using the minimum cumulative resistance (MCR) model and established the ecological network based on the landscape pattern [27]. There are also some studies on establishing the ecological network on unused land based on several factors, such as the species migration routes, rainwater management, urban heat island and air quality [2]. Ecosystem services provide an important foundation for the construction of the ecological network structure and eco-corridors [28]. In particular, the same ecological construction activities may have various effects on different ecosystem services, which can be reflected in the trade-offs and synergies among ecosystem services based on correlation analyses; i.e., synergies and trade-offs among ESs reflect the positive and negative correlations between paired ESs [29]. Nevertheless, most of these studies focused on the assessment of the ecological network structure for different landscape types, and there have been very limited relevant studies on the optimization of the ecological network structure based on the simulation or trade-offs and synergies of ecosystem services [3,30,31,32].
Nanping, as one of the national ecological demonstration zones in Fujian Province, provides a series of essential ecosystem services, such as biodiversity conservation, soil retention, food supply and water supply, but it also suffers from serious ecological degradation, along with rapid urbanization [33]. In this study, we aimed to explore the spatial variation in ecosystem services and the potential ecological network structure using scenario analyses, hoping to provide valuable reference information for guiding the sustainable utilization of ecological resources and ecological conservation planning in Nanping, which is of significant application value for guaranteeing ecological security in Southeast China [9]. Firstly, this study simulated the land-use pattern in Nanping under the natural development scenario and ecological protection scenario from 2020 to 2025 with the CLUE-S model. Then, the ecosystem service functions under different scenarios were simulated with the Integrated Valuation of Ecosystem Services and Trade-offs (InVEST) model; thereafter, their trade-offs and synergies were explored with correlation analyses. Finally, the ecological network structure of Nanping was optimized and evaluated from the perspective of the eco-matrix, eco-corridors and nodes based on the simulation results of land use and ecosystem services. The findings of this study can provide firm theoretical support for the ecological management of Nanping.

2. Materials and Methods
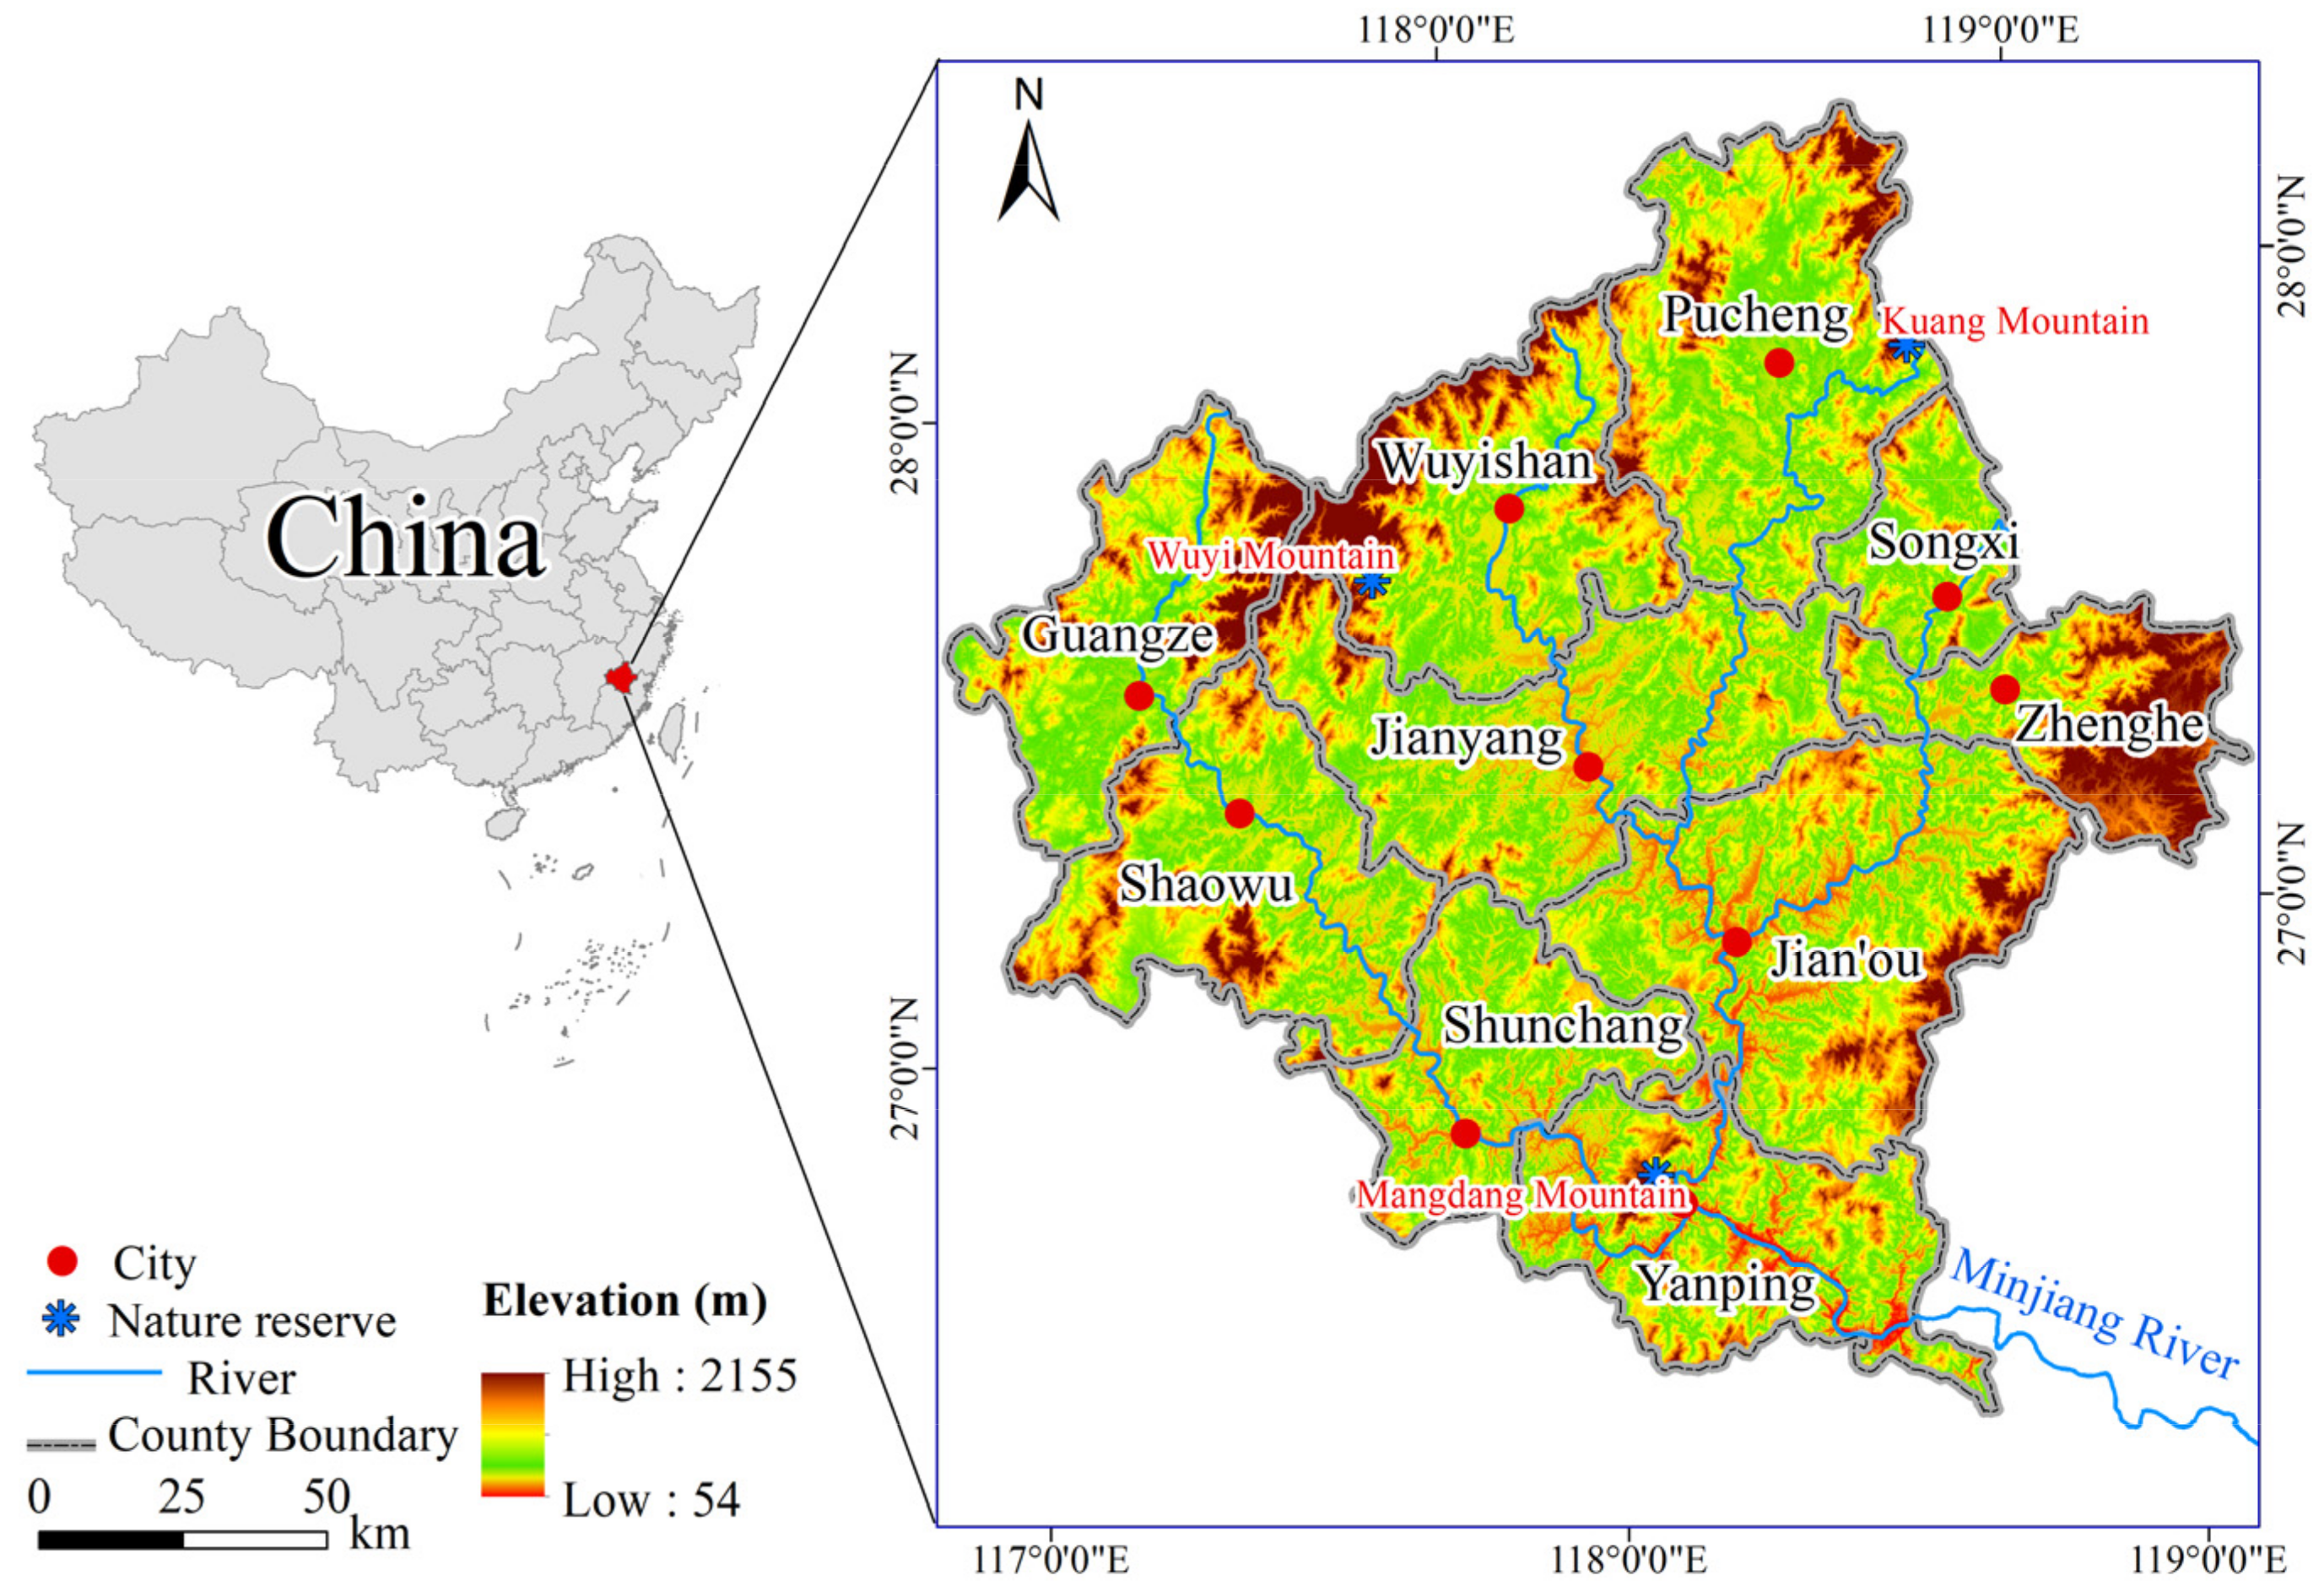
2.1. Study Area

Nanping is located in the north of Fujian Province (26°30′–28°20′N, 117°00′–119°25′E), with a total land area of 26,300 km2, accounting for 21.2% of the total area of Fujian Province (Figure 1). This area is mainly covered by low mountains and hills, and the mountain ranges generally run northeast to southwest. Basins and valleys among mountains are mainly distributed along rivers in an alternate manner, and the height of the mountains is widely variable [33]. The study area belongs to the typical subtropical humid monsoon climate, with the mid-subtropical mountain climate in some mountainous areas. Its annual average precipitation is 1684–1780 mm, and the annual average temperature is 17–19 °C, with abundant light and heat sources. However, the daily temperature is widely variable. In addition, the study area is a key forestry area in South China with natural ecological resources such as Wuyi Mountain, Fozi Mountain, Bao Mountain, Yanping Lake, Huayang Mountain, Xiyuan Canyon and Kuang Mountain, which cover two national nature reserves and six provincial nature reserves. Therefore, Nanping is rich in ecological environment resources and is the main area of ecological functions in Fujian Province and even in Southeast China.

2.2. Data Sources and Processing

A number of data were used in this study, including digital elevation model (DEM) data, soil data, meteorological data, land-use data and socioeconomic data. Specifically, DEM data with a spatial resolution of 30 m were downloaded from the Geospatial Data Cloud website (http://www.gscloud.cn/, accessed on 2 June 2020), based on which slopes and aspects were extracted. In addition, sub-watershed and watershed boundary data were extracted from Watershed of China Extracted Based on DEM (https://www.resdc.cn/DOI/DOI.aspx?DOIID=44, accessed on 3 July 2019). In addition, soil data were extracted from Soil Map Based on Harmonized World Soil Database (v1.2), which was provided by National Tibetan Plateau Data Center (http://data.tpdc.ac.cn/zh-hans/, accessed on 2 June 2020). Moreover, meteorological data (temperature and precipitation) from 15 meteorological stations within and near Nanping were obtained from China Meteorological Administration (http://data.cma.cn/, accessed on 2 June 2020) and were thereafter interpolated using the Kriging interpolation method with a spatial resolution of 30 m. Meanwhile, land-use data with a spatial resolution of 30 m from 2009, 2013 and 2017 were interpolated based on Landsat ETM+/OLI and were verified with a field investigation, and the accuracy reached 92.5%. Socioeconomic data (GDP, population density) and location data were provided by Data Center for Resources and Environmental Sciences of the Chinese Academy of Sciences (http://www.resdc.cn/, accessed on 2 June 2020). The land-use types were reclassified into 8 types according to the data requirements of the InVEST model and the CLUE-S model, i.e., forest land, cultivated land, garden land, grassland, water area, traffic land, built-up area and unused land. In particular, this study carried out scenario simulation by assuming the current meteorological conditions for past and future land-use changes [34]. Distance data, including the distance from residential areas, distance from highways, distance from water areas and distance from railways, were extracted with the distance analysis method on the basis of the location data of residential areas, highways, water bodies and railways. We calculated the distance of each grid cell to the nearest residential areas, highways, railways or water areas.

2.3. Simulation of Land-Use Change in Nanping

This study carried out a scenario simulation of land-use change in Nanping with the CLUE-S model, which includes a non-spatial analysis module and a spatial analysis module and can accurately simulate regional land-use change in a spatially explicit way [35]. Two scenarios were designed in consideration of different future development demands from 2020 to 2025 in the study area, namely, the natural development scenario and the ecological protection scenario, which were thereafter used as input data of the non-spatial analysis module of the CLUE-S model. Firstly, the land-use data for each year from 2009 to 2017 were obtained with the linear interpolation based on the land-use data from 2009, 2013 and 2017. Then, the land-use demand data from 2020 to 2025 under the natural development scenario were forecasted using the GM (1, 1) gray forecast model based on the land-use data from 2009-2017. In particular, the posterior error ratio of the gray forecast model for all land-use types was less than 0.35 (ρ > 0.950), which indicated that the prediction accuracy of the model was robust in this study. Additionally, the land-use demand data from 2020 to 2025 under the ecological protection scenario were estimated according to the settings for ecological environment constraints. Specifically, ecological land, e.g., forest land and water area, decreased to various degrees during 2009–2017 in Nanping, while traffic land, built-up area and unused land increased significantly. Therefore, the ecological environment constraints under the ecological protection scenario were set as follows: no decrease in the area of forest land and grassland and no change in the area of water area. At the same time, according to the adjustment demand for forest land area proposed in the 13th Five-Year Planning in Nanping, the area percentage of forest land area should be no less than 77.5%, while the demand for cultivated land was predicted based on the results of the natural development scenario. In view of the close relationship between tourism and transportation development in Nanping, traffic land under the ecological protection scenario should reach 90% of the level under the natural development scenario. Meanwhile, the increase in the demand for built-up area should not exceed 5% under the ecological protection scenario, while the area of unused land should decrease by 25% and should be mainly converted to garden land, forest land and grassland. In combination with Nanping Master Planning for the period of 2016–2030, more emphasis was put on strengthening the conservation of Mangdang Mountain Nature Reserve and Wuyi Mountain Nature Reserve. Accordingly, these restricted ecological protection areas were added to the simulation with the CLUE-S model.
The driving mechanism of land-use change were explored with statistical analyses based on land-use data and driving factors, which were thereafter used as the input data of the spatial analysis module. The spatial analysis module realized an iterative simulation of the spatial distribution of regional land use on the grid scale in the forecast years based on the input parameters of land-use demand and the driving mechanism of land-use change. Additionally, this study simulated the land-use data of 2017 with the year 2009 data as the baseline year data and calculated the Kappa index to verify the simulation accuracy of the CLUE-S model. This study suggested that there were 104,399 total grids in total, and 81,005 grids were correctly simulated; the Kappa coefficient was 0.78, indicating that the simulation accuracy of the CLUE-S model could meet the accuracy requirements for further simulations of land use under different scenarios.

2.4. Estimation, and Trade-Off and Synergy Analyses of Ecosystem Services Based on Scenario Simulation

Three ecosystem services, i.e., the habitat quality, soil retention and water yield, and ecological degradation were estimated with the InVEST model based on the simulated land-use data under different scenarios in this study. Specifically, habitat quality is a function of habitat suitability and the degradation score [36], and this study estimated the degradation score and habitat quality of the study area using the habitat quality module of the InVEST model based on landscape sensitivity, threat factors, threat intensity, etc., as follows:
Q x j = H j × 1 D x j Z D x j Z + K Z
where H j is the habitat suitability of landscape j; z is the scaling parameter, which was set to 2.5; k is the half-saturation constant, which was set to 0.0574 under the natural development scenario and ecological protection scenario, respectively; and D x j is the degradation score of grid x in landscape j, which was estimated as follows:
D = r = 1 R y = 1 Y r W r r = 1 R W r r y i r x y β x S j r
where Dxj is the ecological degradation score; R is the number of threat factor r; 𝑌𝑟 is the set of grids on 𝑟’s raster map; y represents all grids on r’s raster map; Wr is the weight of threat factor r; ry characterizes whether gird y is threatened; irxy indicates the impact of threat factor r; βx is the accessibility level of grid x; and Sjr is the sensitivity of landscape j to threat factor r, the value of which ranged between 0 and 1.
The soil retention service was estimated using the soil retention module of the InVEST model based on the difference between the potential soil erosion and the actual soil erosion as follows:
S E D R E T = R K L S U S L E
where SEDRET is the soil retention amount, RKLS is the potential soil erosion amount and USLE is the actual soil erosion amount. They were estimated with the universal soil loss equation (USLE) based on precipitation, soil and DEM data.
The water yield service was estimated using the water yield module of the InVEST model based on the difference between the annual rainfall and evapotranspiration on the grid scale as follows [37]:
Y x j = 1 A E T x j P x × P x
where Y x j is the annual water yield (mm) in grid x on land-use type j; P x is the average annual rainfall in grid x; and A E T x j is the actual annual evapotranspiration in grid x on land-use type j. They were estimated based on precipitation data, land-use data and relevant data recommended in InVEST User’s Guide.
This study analyzed the trade-offs and synergies between ecosystem services and ecological degradation under two scenarios with statistical software [38]. Specifically, the Spearman correlation analysis of habitat quality, soil retention, water yield and ecological degradation on the regional scale was carried out with SPSS software. Since these ecosystem services and ecological degradation were estimated on the grid scale and sub-watershed scale, this study up-scaled the data of habitat quality, soil retention and ecological degradation from the grid scale to the sub-watershed scale. Then, the core areas were delimited on the basis of the sub-watershed boundary; thereafter, correlation analyses were carried out on the regional scale with the sub-watershed as the basic spatial unit.

2.5. Optimization of the Ecological Network Structure

This study constructed ecological networks based on the landscape pattern and ecosystem service functions with the minimal cumulative resistance (MCR) model and the gravity model. This study first explored the landscape pattern and accurately distinguished between landscape types and structures with the morphological spatial pattern analysis (MSPA) model, based on which the ecological sources, eco-corridors and nodes were identified. Ecological sources are areas that can provide a variety of ecosystem services and serve as the main habitats for animals and plants. Ecological sources, including core areas and buffer zones, were set as the basis of the ecological network. Then, this study explored the potential eco-corridors among ecological sources with the minimum cumulative resistance (MCR) model based on the landscape types, elevation and ecosystem service functions [39]. This study further classified the eco-corridors into general and important ones with the gravity model based on the intensity of the interactions among ecological sources [33].
The ecological network was mainly optimized based on the simulated ecosystem services and their trade-offs and synergies from the perspective of the eco-matrix, eco-corridors and nodes. This study first selected the core areas with synergies predominantly among ecosystem services based on the trade-off and synergy analysis of ecosystem services as the eco-matrix optimization areas, excluding the ecological sources. Then, proper eco-corridors that could effectively optimize the connection among ecological core areas were added among these eco-matrix optimization areas. Thereafter, proper ecological sources that could effectively optimize the ecological network and maximize the ecological service functions were also added based on the trade-offs and synergies among ecosystem services. Furthermore, ecological break points with restoration potential were identified with the overlay analysis of the main traffic road networks and the optimized ecological network; thereafter, proper “stepping stone patches” were added to restore and improve these ecological break points and enhance the corridor integrity of the eco-corridors. The optimization of the ecological network structure was finally evaluated in terms of the network circuitry (α), edge/node ratio (β) and network connectivity (γ) under two scenarios; the parameters were calculated as follows:
α = L V + 1 2 V 5
β = L V
γ = L 3 ( V 2 )
where L is the number of eco-corridors and V is the number of nodes.

3. Results

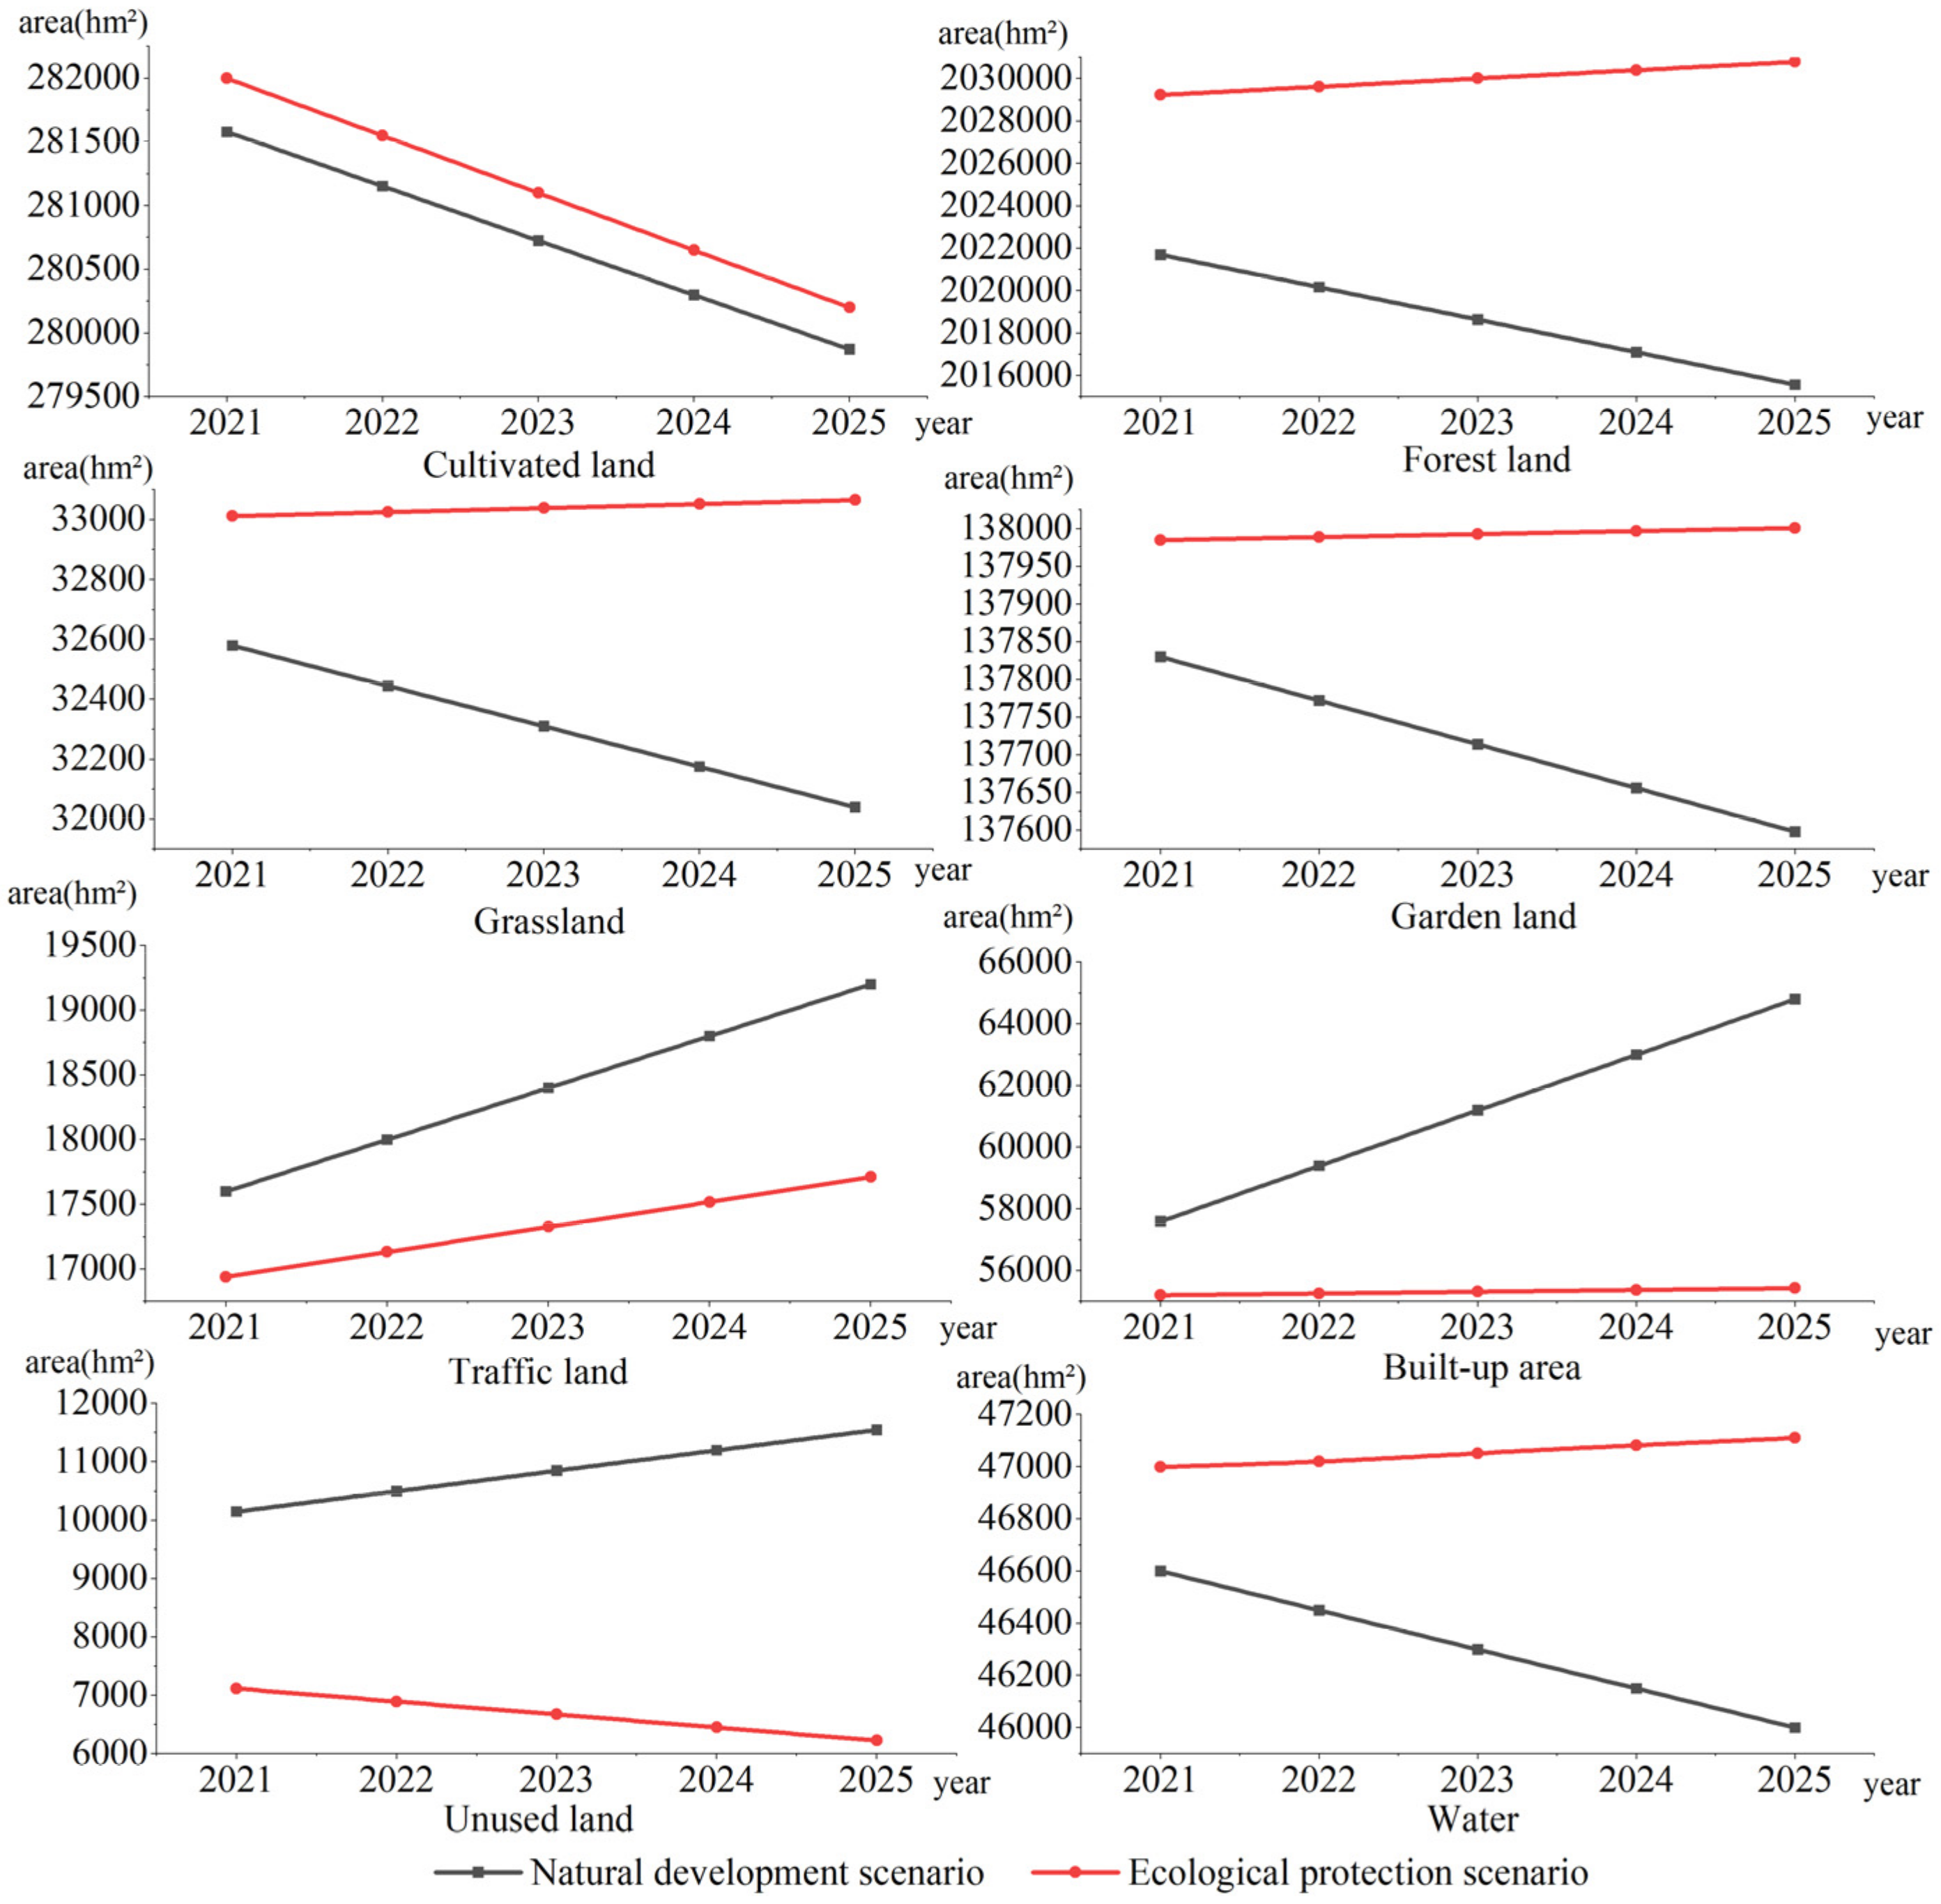
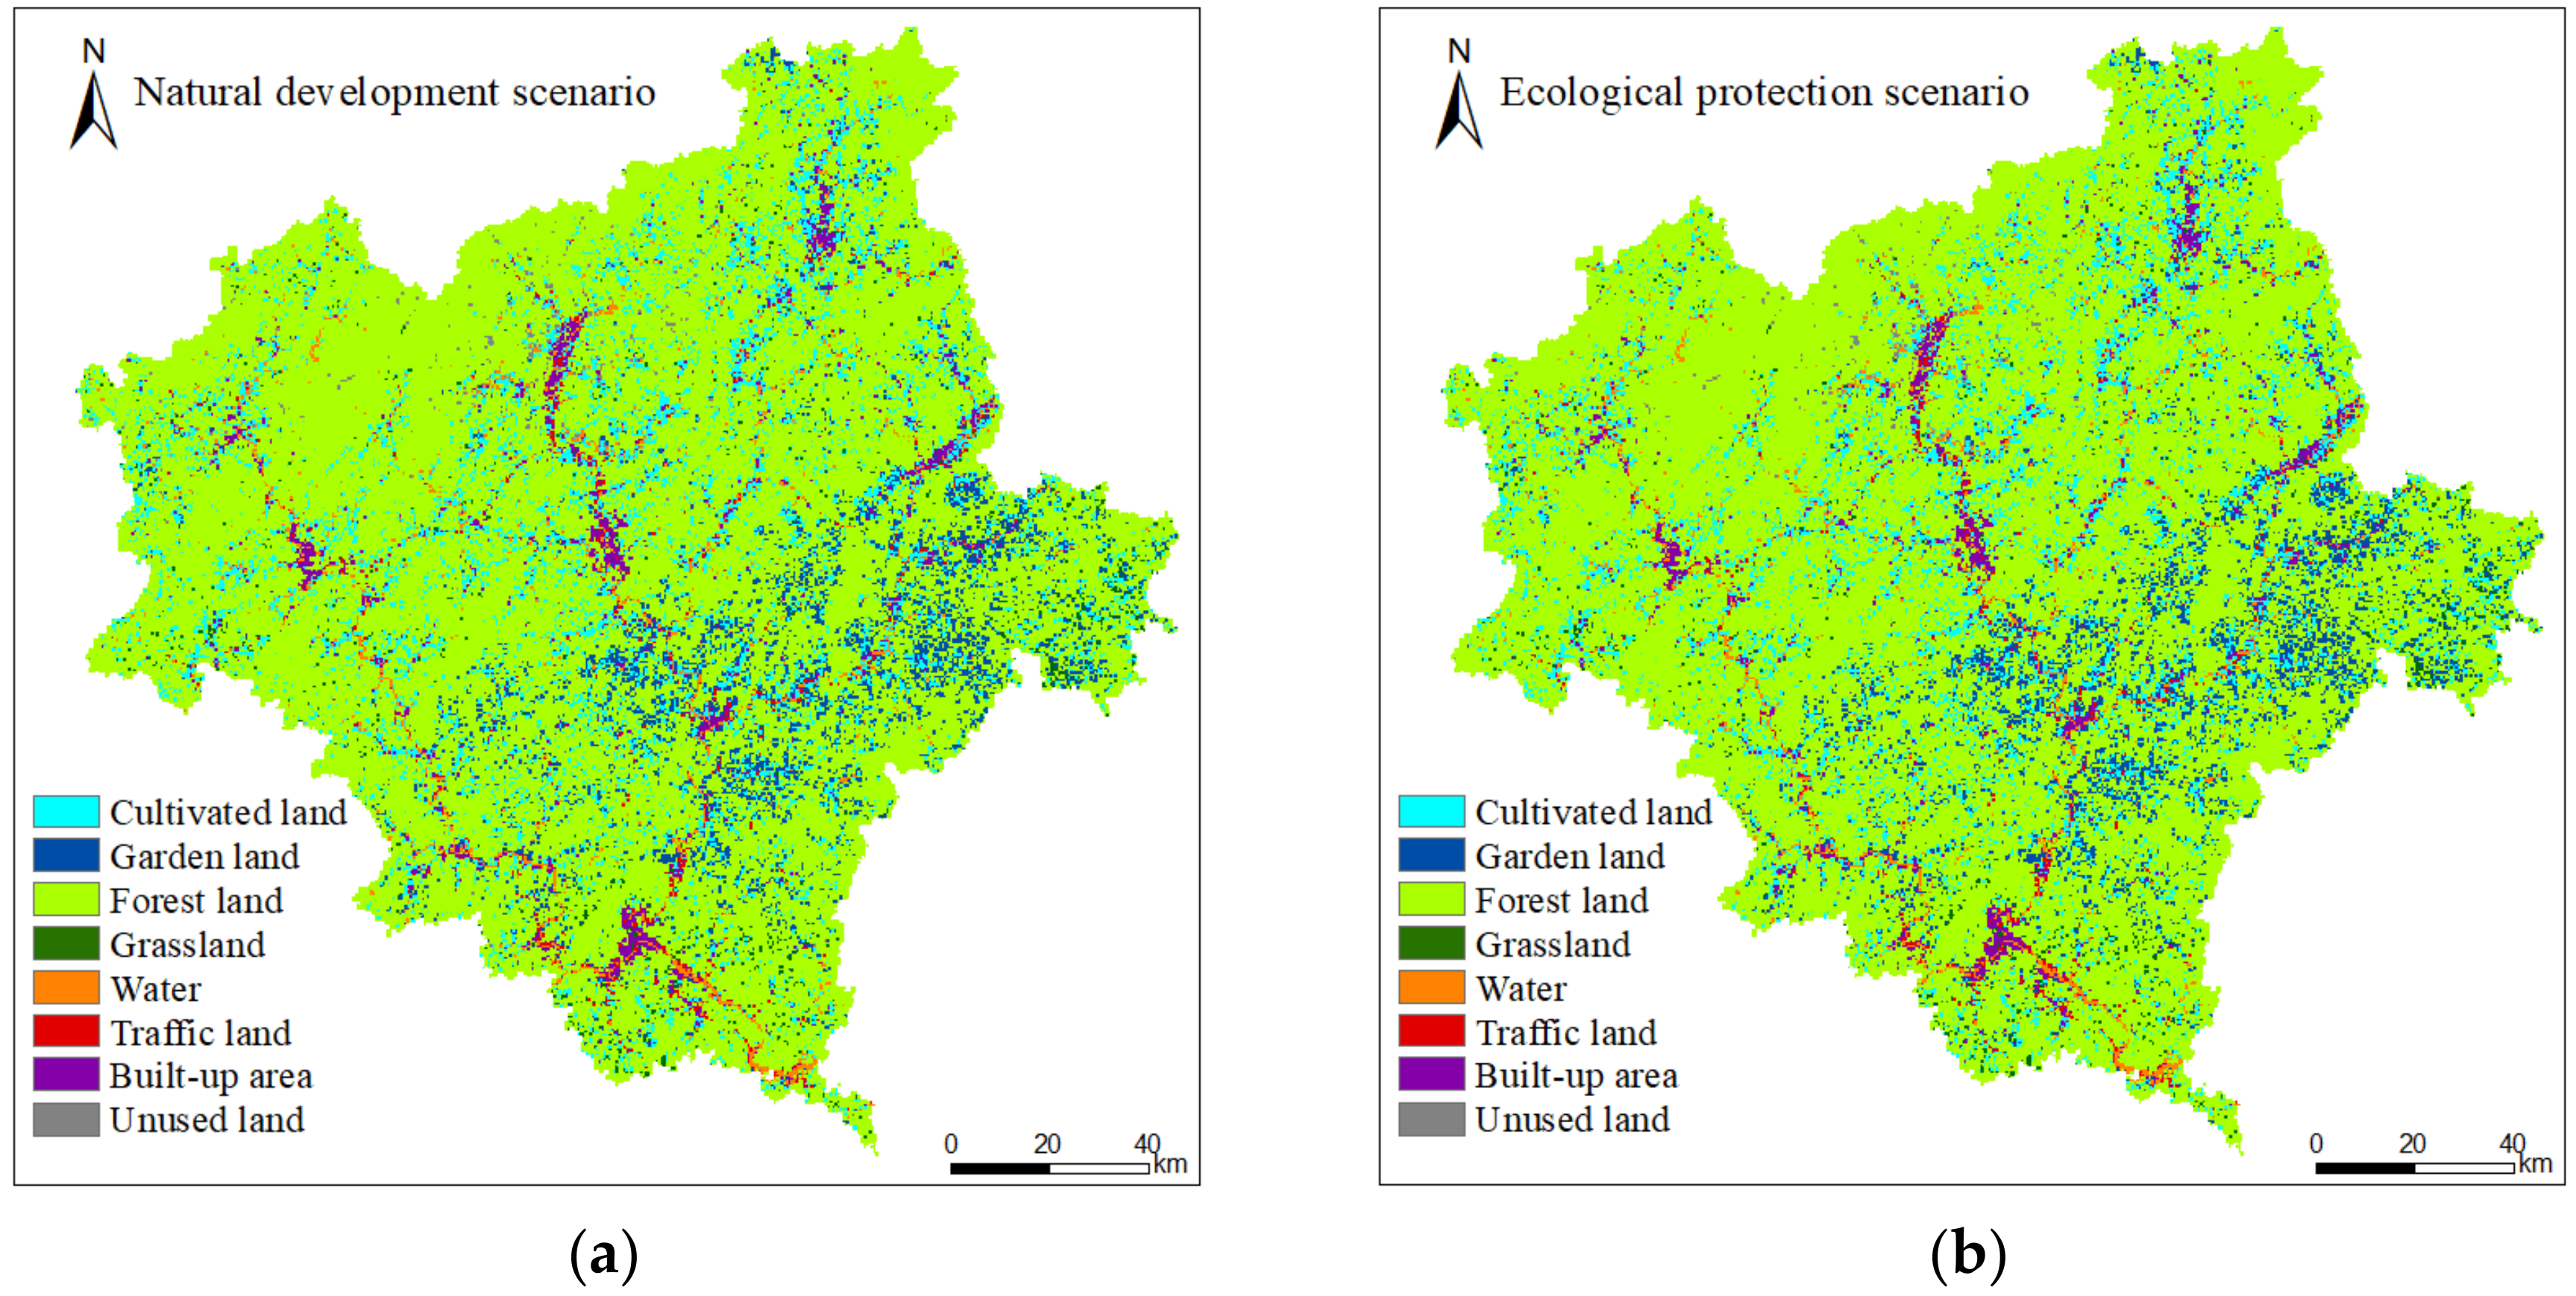
3.1. Simulated Land-Use Change under Different Scenarios in Nanping

The simulation results of the grid cells showed that there was a significant difference in the land-use change under the natural development scenario and that of the ecological protection scenario (Figure 2). Specifically, results under the natural development scenario suggested that the unused land changed most remarkably, increasing by approximately 22.53% in comparison with that in 2017, followed by transportation land and build-up area, which increased by 13.47% and 9.35%, respectively, while grassland decreased most significantly. In particular, the simulated land-use demand under the natural development scenario was highly consistent with the actual land-use data during 2009–2017, and the posterior difference ratios of the gray prediction models were all less than 0.35 (ρ > 0.950), indicating that there was a high prediction accuracy. By contrast, the areas of cultivated land and unused land showed a decreasing trend, and the area of water remained unchanged, while all other land uses increased to different degrees under the ecological protection scenario. Unused land also changed most significantly in comparison with that in 2017 under the ecological protection scenario, decreasing by 17.24%, while forest land increased slightly. In addition, forest land increased by approximately 13,300 hm2, with an increase rate of 0.66%, under the ecological protection scenario; grassland increased by approximately 3.29%, and unused land scattered in the northern part of the study area decreased significantly by approximately 5525 hm2 in comparison with that under the natural development scenario. This indicated that the improvement of regional ecological functions could be achieved through the rational development and ecological protection of unused land. This indicated that the rational development of unused land under the ecological protection scenario could improve the efficiency of intensive land use, which could be helpful for the protection of important ecological source sites and the enhancement of regional ecological functions to a certain extent.
The simulation results of the grid cells suggested that the land-use change during 2017–2025 mainly occurred in the northern and southwest parts of the study area under both the natural development scenario and the ecological protection scenario (Figure 3). Specifically, the most obvious land-use change under the natural development scenario was the conversion of forest land into cultivated land, which was sporadically distributed throughout the study area. In addition, there was also a remarkable conversion of forest land to garden land, which was mainly distributed in the northern part of Zhenghe County, most of Jianou City and the eastern part of Shunchang County in the eastern and central parts of the study area, with a conversion area of approximately 66,125 hm2. This indicated that the soil erosion problem may become more serious along with the increase in garden land in the southeastern part of the study area under the condition of no ecological protection. By contrast, the most obvious land-use change was the conversion of cultivated land into forest land, followed by the conversion of forest land into cultivated land under the ecological protection scenario, but the conversion area was 0.4% lower than that under the natural development scenario. Meanwhile, the area of conversion of construction land into forest land was about 12,425 hm2 under the ecological protection scenario and was mainly concentrated around Sha Xikou Reservoir in Yanping District, the upper reach of Nanpuxi River in Pucheng County and areas near the rivers in Songxi County.

3.2. Simulated Ecosystem Services and Their Trade-Offs and Synergies under Different Scenarios

Table 1 shows the simulated ecosystem services and ecological degradation under the two scenarios in Nanping. The highest value of habitat quality reached 0.98, but the average habitat quality only reached 0.842 under the ecological protection scenario, which was only 0.05 higher than that under the natural development scenario. This may have been related to the fact that the inner part of the urban construction area was less affected by ecological protection policies. Although the overall habitat quality of the study area did not change significantly under the ecological protection scenario, the habitat quality of some ecological source sites showed significant improvement; for example, the average habitat quality of ecological source site 9 reached 0.954. In addition, the average degradation index under the ecological protection scenario decreased by 0.005 in comparison with that under the natural development scenario, indicating that the ecological environment quality could tend to be improved. In addition, the soil retention amount under the natural development scenario was lower than that under the ecological protection scenario, which was mainly related to the expansion of forest land, grassland and garden land. Moreover, the water yield was higher under the natural development scenario, reaching 31.26 × 109 mm, while it only reached 12.56 × 109 mm under the ecological protection scenario. This was because precipitation is assumed to be the only source of water yield in the InVEST model; meanwhile, the water yield is influenced by water evaporation, transpiration, absorption and surface infiltration into vegetation. In fact, the vegetation cover of forest land and grassland increased significantly, leading to stronger transpiration and consequently lower water yield under the ecological protection scenario, which was consistent with the findings of Hornbeck et al. (1993) [40].

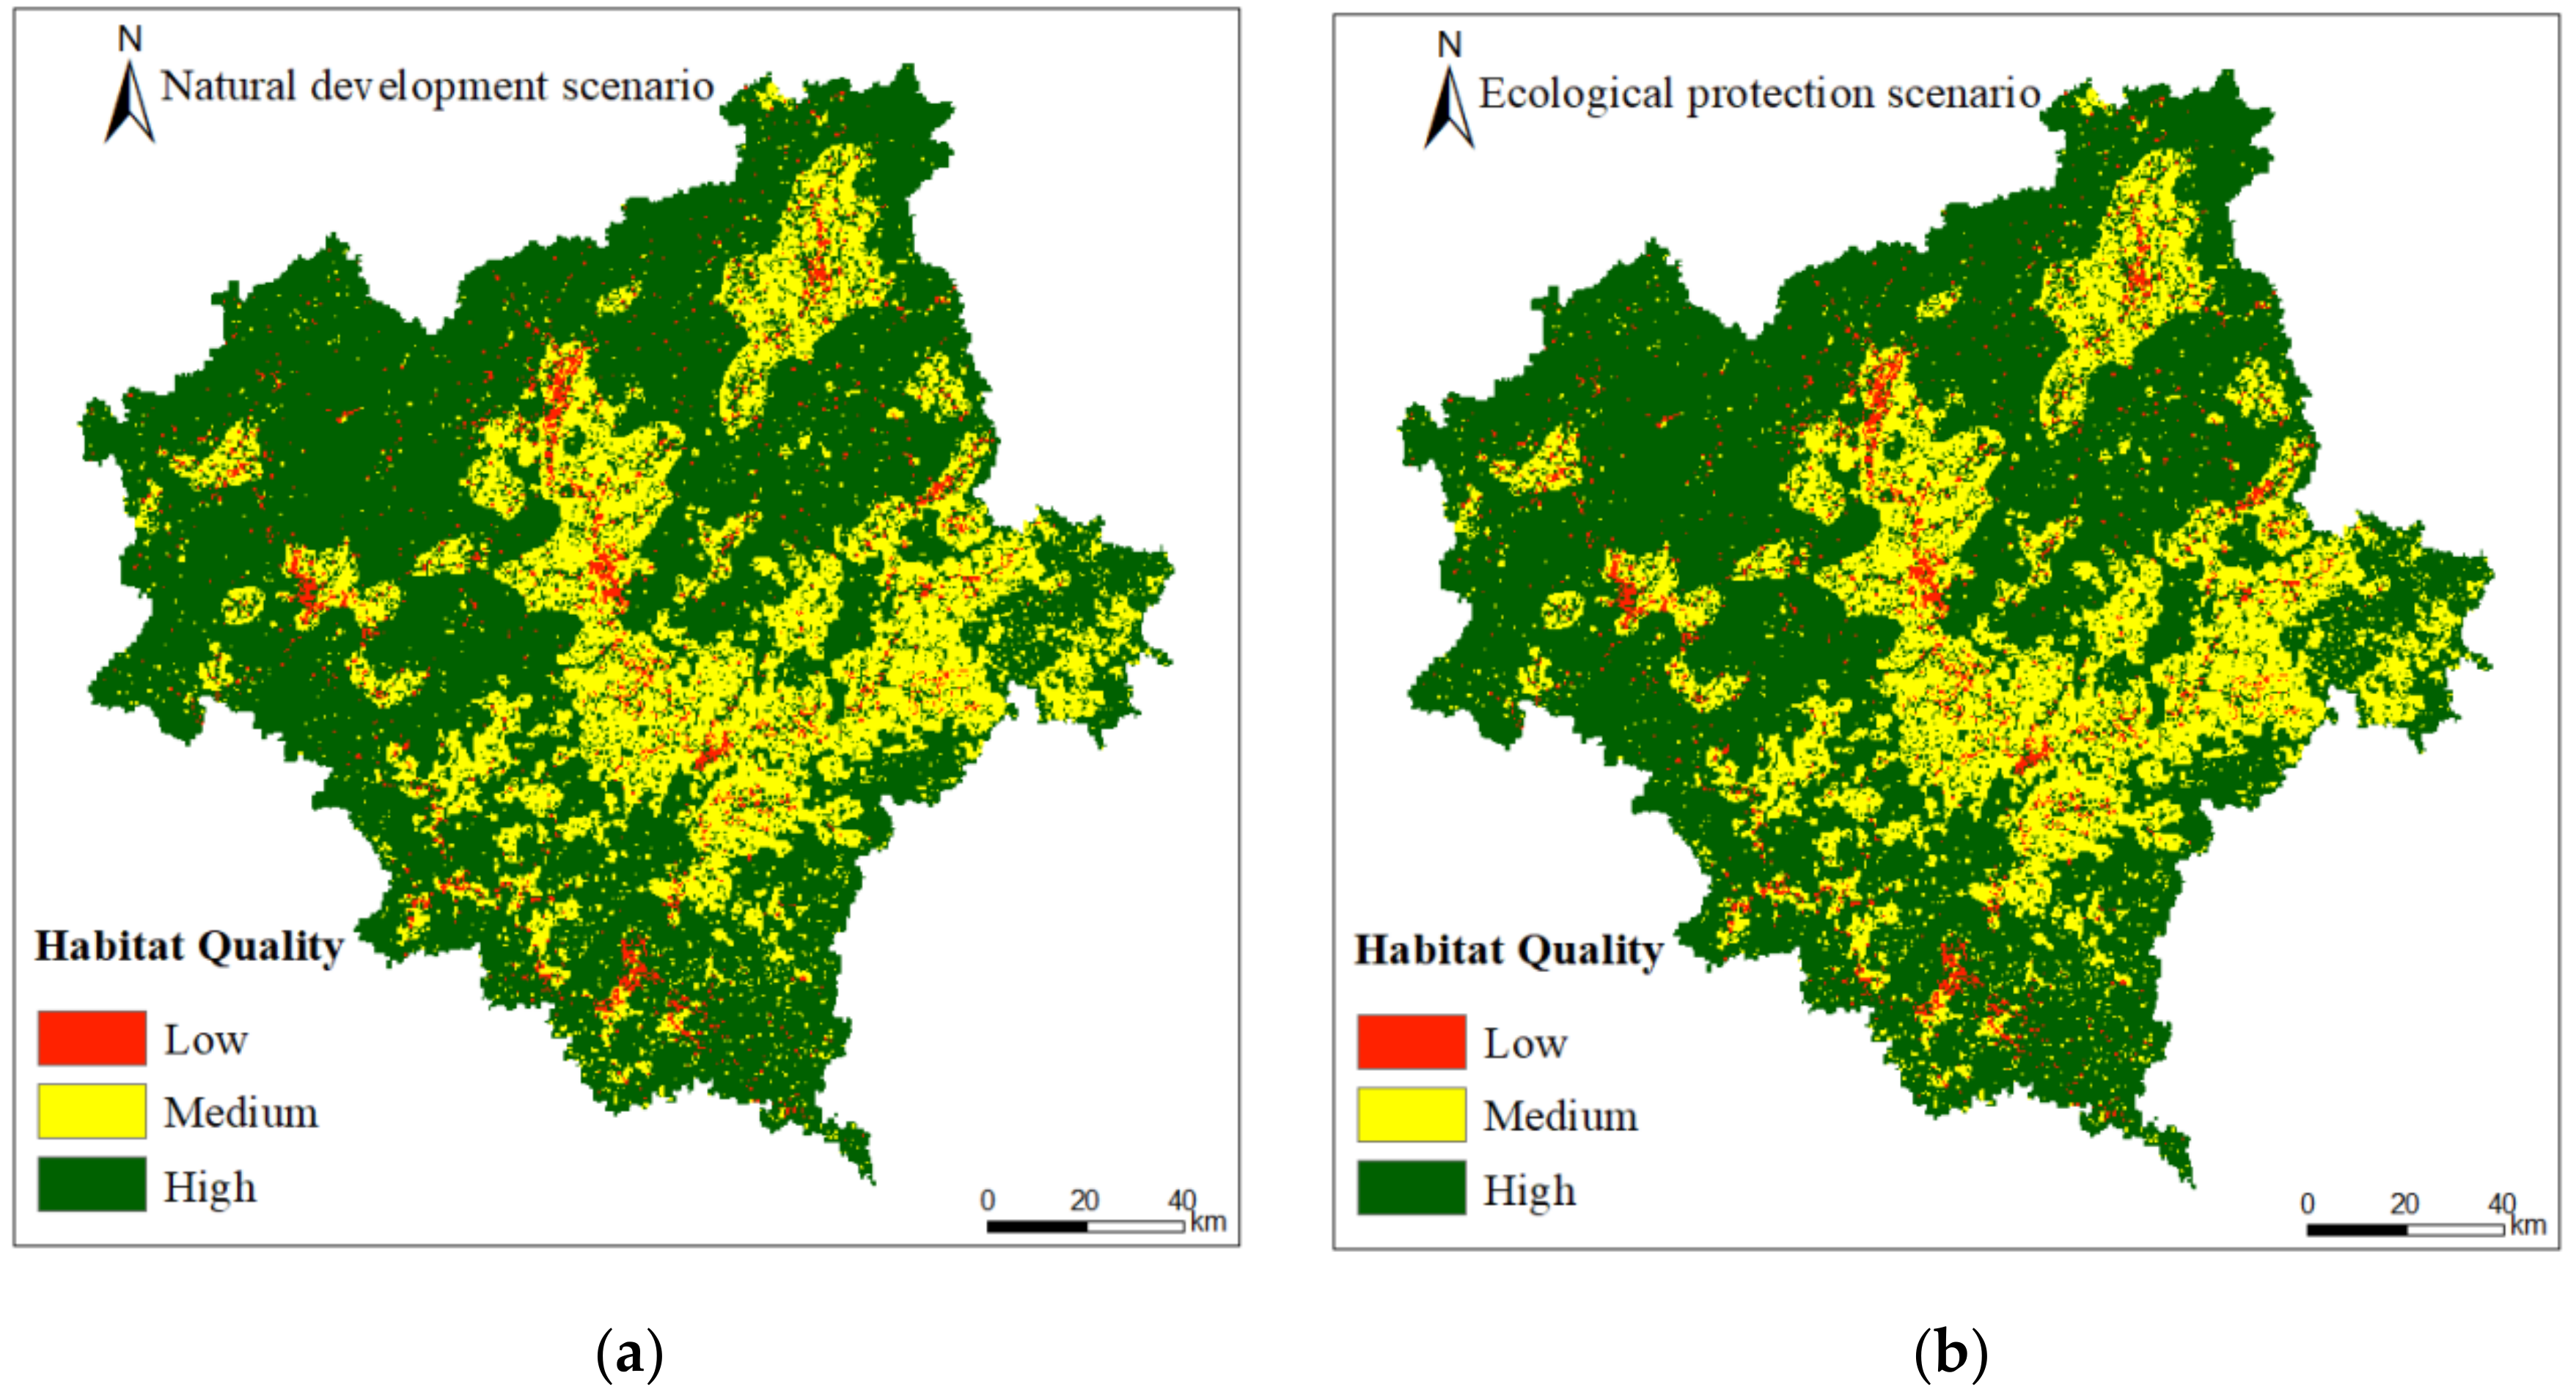
3.2.1. Habitat Quality under Different Scenarios

The habitat quality was estimated using the InVEST model and then was divided into three categories using the natural break point method. It was, overall, higher in the northwest part and lower in the central and southeast parts of the study area under both scenarios (Figure 4). Specifically, the habitat quality in the southern part of the study area improved more significantly, where the area with lower habitat quality in Yanping District shrank significantly and the area with higher habitat quality near the forest parks increased significantly. In addition, habitat degradation was more serious in the central and southern parts of the study area under both scenarios. Meanwhile, habitat degradation was less serious in areas near Kuang Shan Forest Park in Pucheng County in the north part of the study area and a few areas near Mundang Mountain Nature Reserve in Yanping District in the south part of the study area, evolving from general degradation to low degradation, while habitat degradation evolved from high degradation to general degradation in the southern part of Yanping District. In addition, the area percentages of high, general and low habitat quality under the natural development scenario were 70.63%, 25.42% and 3.95%, respectively, while those under the ecological protection scenario were 71.96%, 24.69% and 3.35%, respectively. In comparison with the natural development scenario, the area percentage of high habitat quality under the ecological protection scenario increased by 1.33%, and that of general and low habitat quality decreased by 0.73% and 0.6%, respectively. In addition, the area percentages of low, general and high degradation under the natural development scenario were 40.93%, 43.37% and 15.70%, respectively, while those under the ecological protection scenario were 41.19%, 43.52%, and 15.28%, respectively. In comparison with the natural development scenario, the area percentage of low and general degradation under the ecological protection scenario increased to some degree, while that of high habitat degradation decreased slightly by 0.26%. Overall, the habitat quality of the study area could be improved under the ecological protection scenario, which could lead to better maintenance of biodiversity and provision of essential ecosystem services.

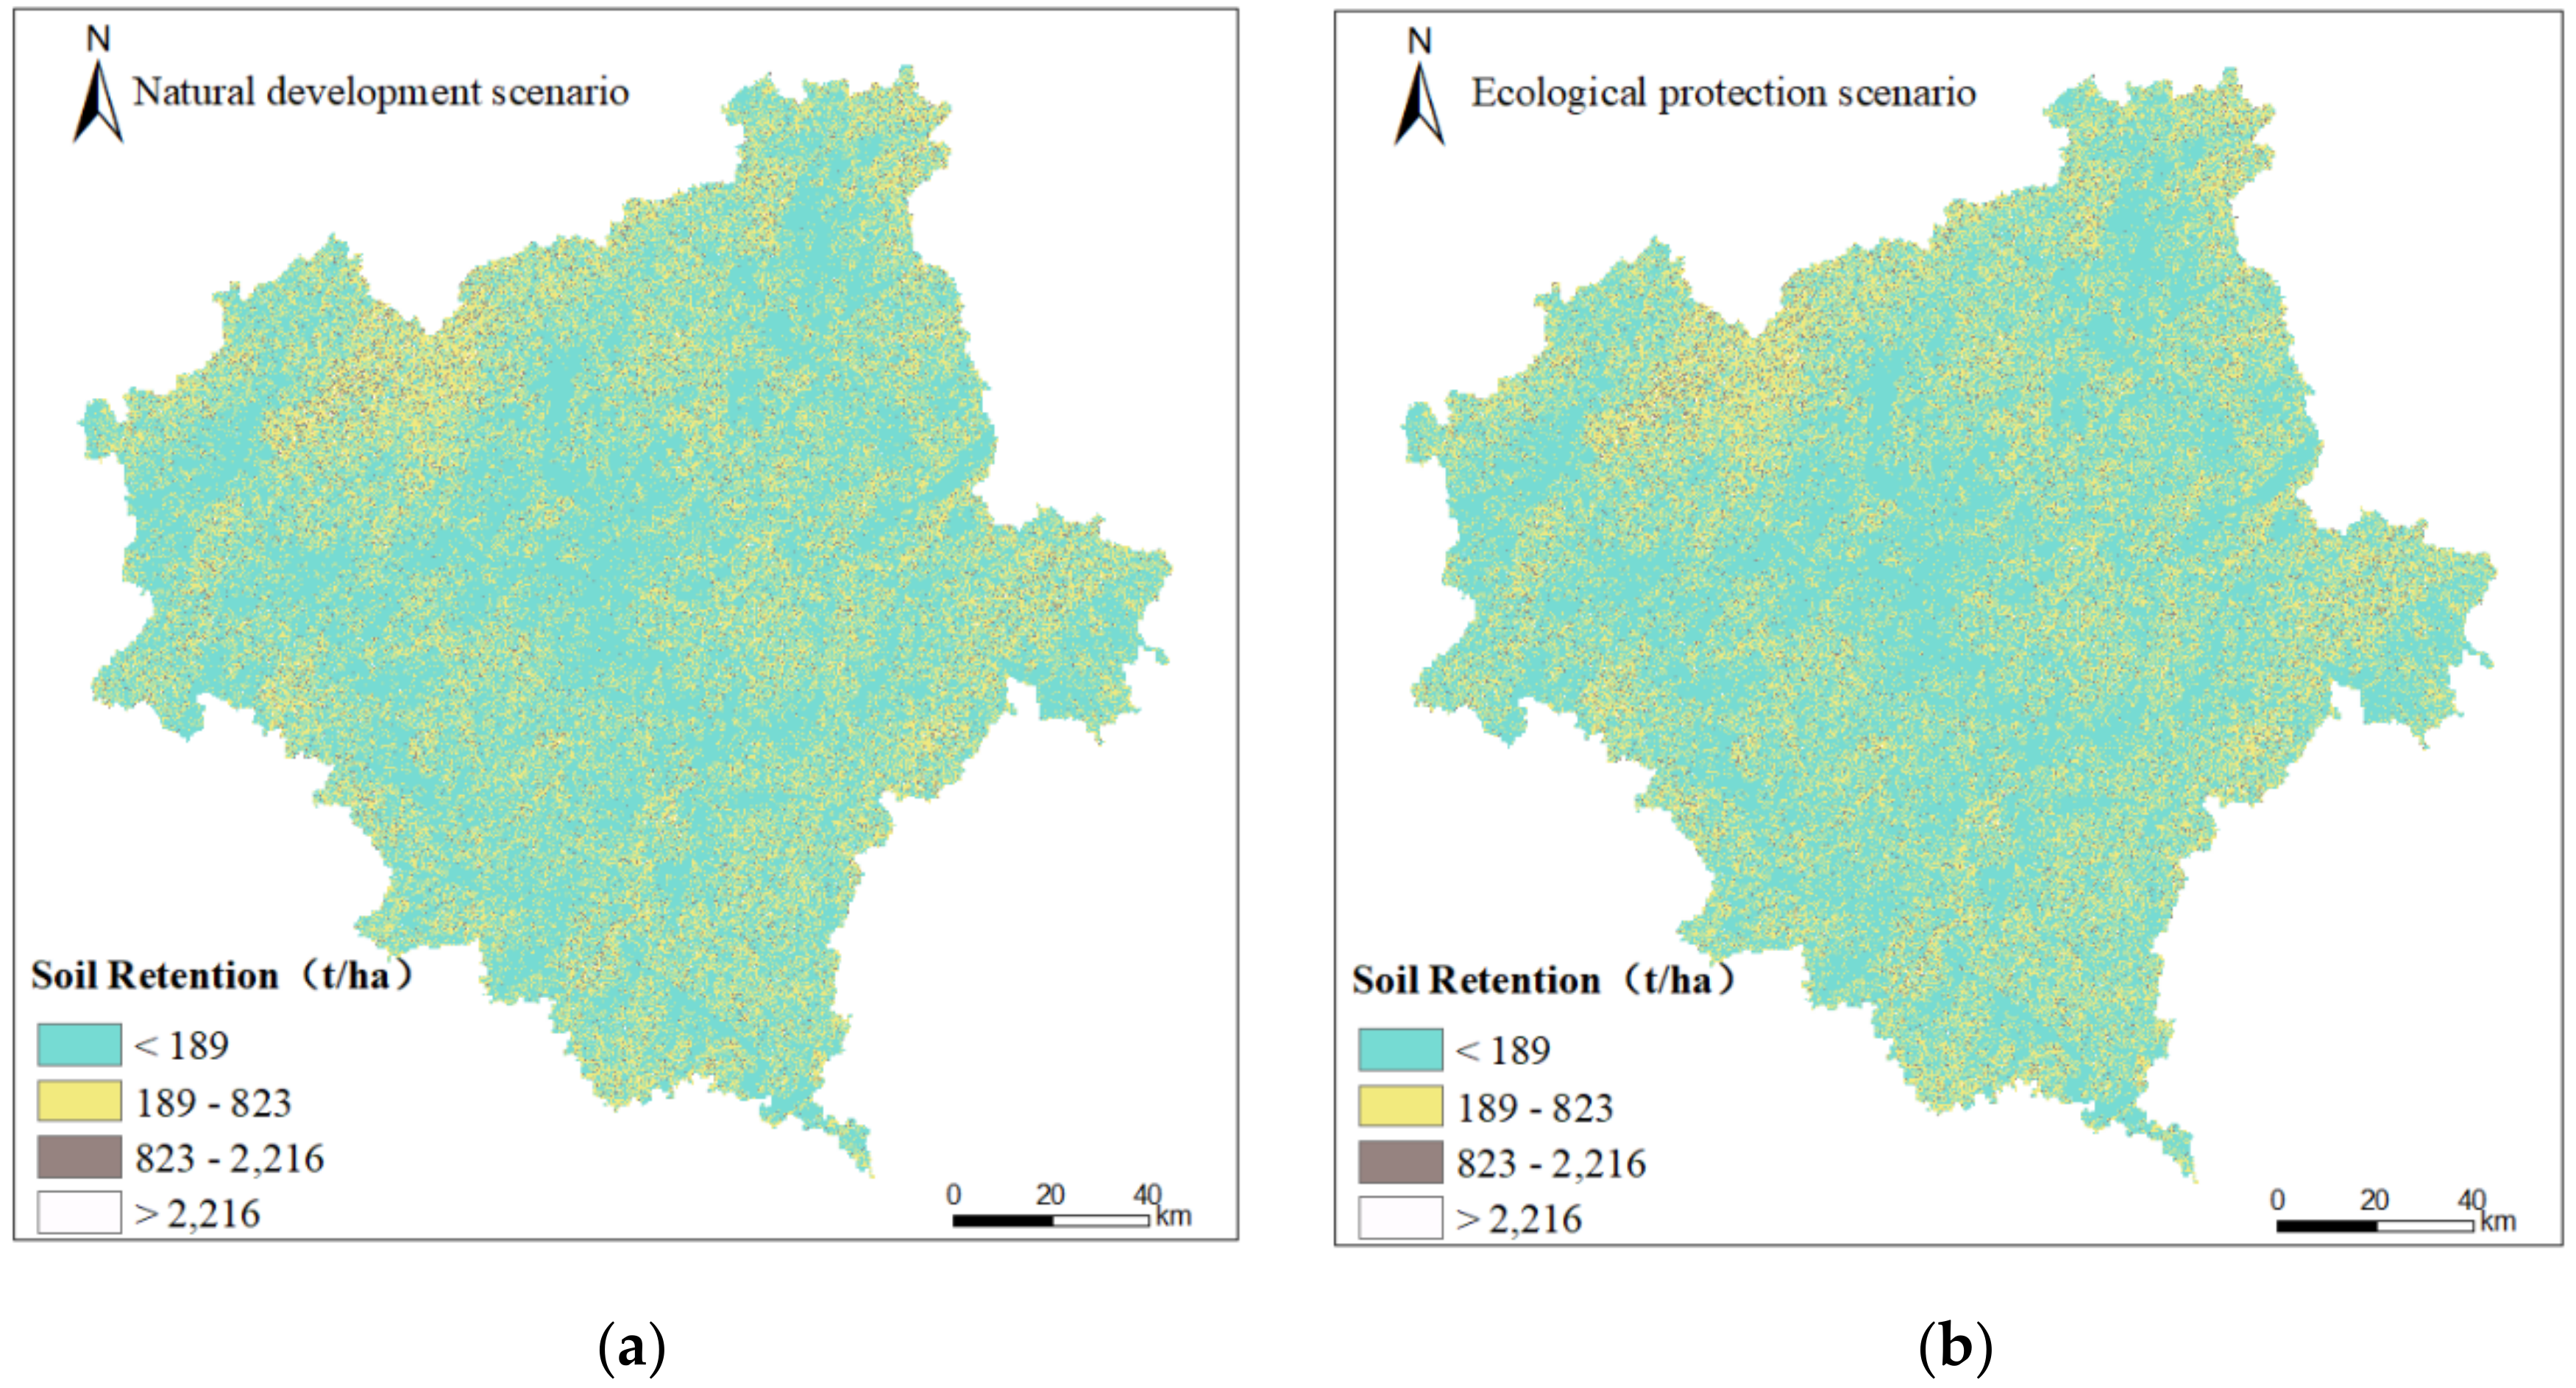
3.2.2. Soil Retention under Different Scenarios

Soil retention was generally higher in the northern part and southern parts and lower in the center part of the study area, with relatively minor differences between the two scenarios (Figure 5). The percentages of areas with soil retention of <189 t·ha−1, 189 t·ha−1–823 t·ha−1, 823 t·ha−1–2216 t·ha−1 and >2216 t·ha−1 under the natural development scenario were 65.88%, 30.40%, 3.29%, and 0.42%, respectively, while those under the ecological protection scenario were 65.82%, 30.46%, 3.30%, and 0.42%, respectively. In contrast, total soil retention increased by 0.16 × 10⁸ t·ha−1, and the percentage of areas with low soil retention under the ecological protection scenario decreased by 0.07%, while soil retention in most part of the study area showed an insignificant change. Specifically, there was a relatively remarkable change in soil retention in Wuyishan City in the northwest part of the study area, where the total soil retention increased by 29.12 t·ha−1, with an increase rate of 1.04%, and soil retention in a few areas increased from of <189 t·ha−1 to 853–2216 t·ha−1. Meanwhile, soil retention in Guangze County in the northwest part of the study area increased by 6426.42 t·ha−1, with an increase rate of 0.24%. This was mainly due to the decrease in soil erosion under the influence of the increase in forest vegetation cover in the northern part of the study area to some extent under the ecological protection scenario. By contrast, soil retention in Songxi County in the eastern part of the study area and Yanping District in the southern part of the study area showed a decreasing trend under the ecological protection scenario, which was mainly because the expanding vegetation cover in these areas was primarily grassland rather than forest land, with relatively lower contribution to soil retention.

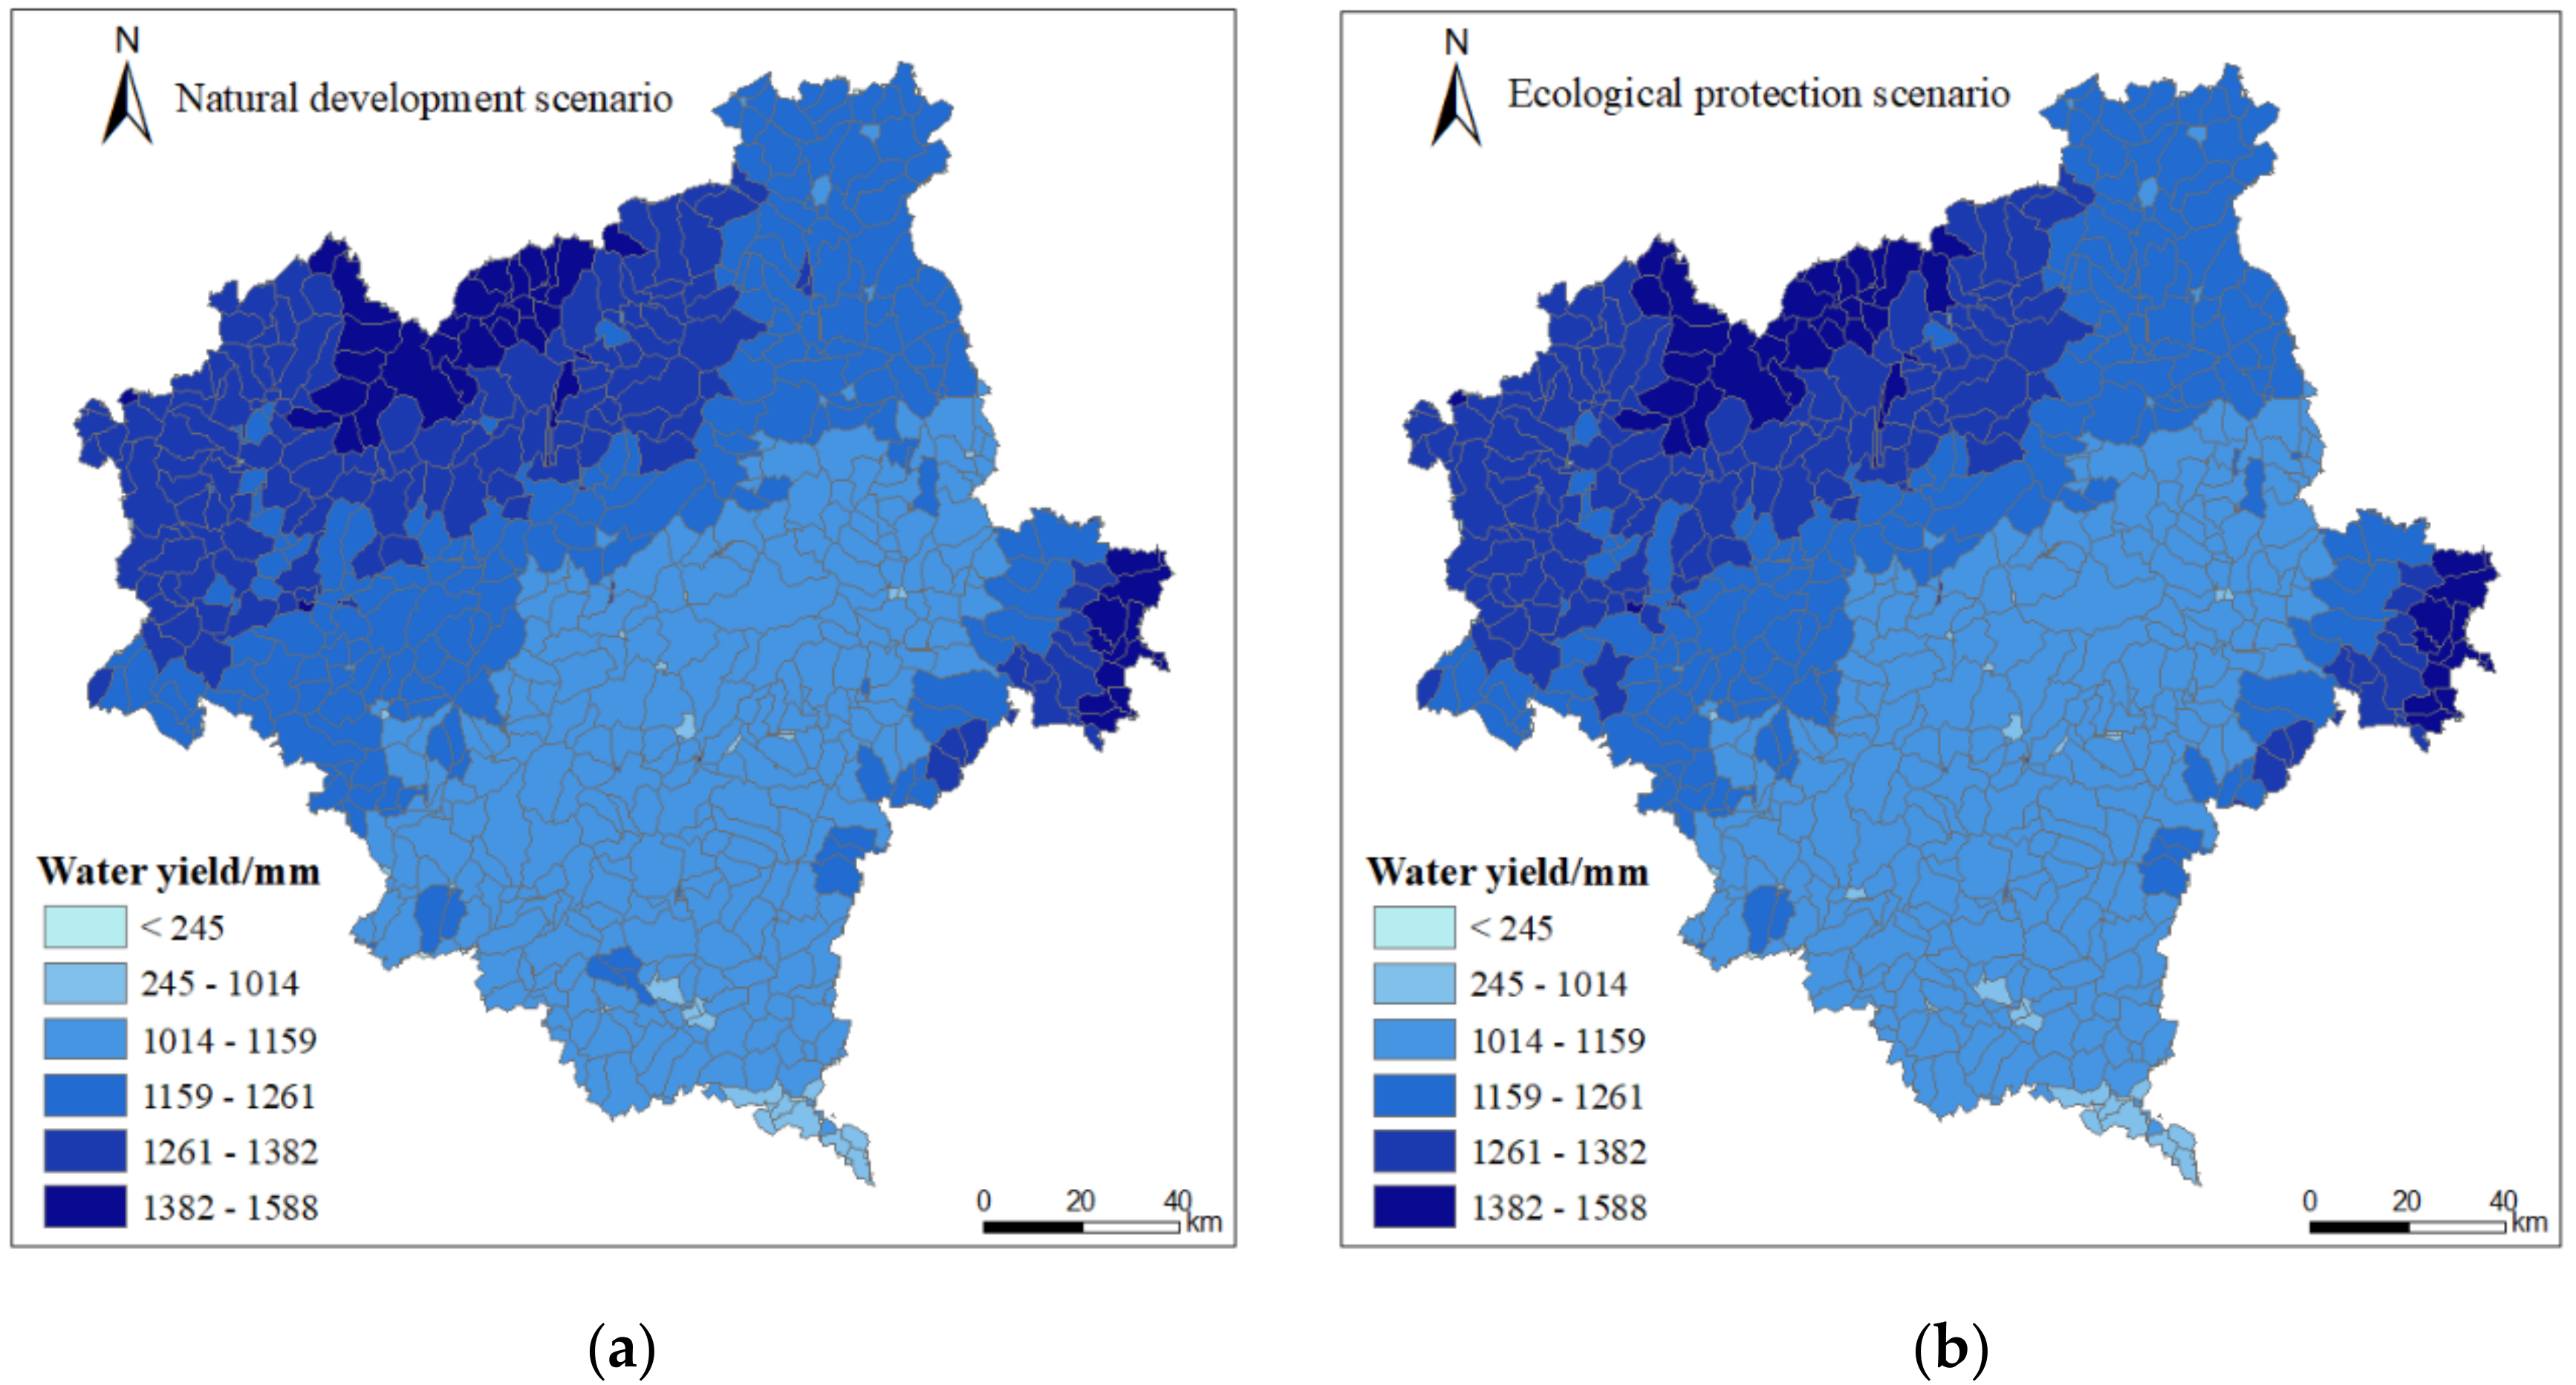
3.2.3. Water Yield under Different Scenarios

The total water yield under the ecological protection scenario decreased by approximately 59.82% in comparison to the natural development scenario, indicating that ecological protection had significant impacts on the water yield. Specifically, the spatial patterns of water yield under the natural development scenario and the ecological protection scenario were generally consistent, showing a decreasing trend from the northwest and southeast parts to the central part of the study area (Figure 6). The water yield was relatively lower in the central part of the study area, e.g., most of Jiangyang City, Jianou City and part of Yanping District, which may have been related to the spatial pattern of the multi-year precipitation in the study area. In addition, the evapotranspiration increased in a few areas with the conversion of unused land into forest land, garden land and grassland under the ecological protection scenario, leading to the decrease in the water yield. Forest land, grassland and garden land accounted for 77.32%, 1.22% and 5.27% of the total land area of the study area under the natural development scenario, respectively, and the average water yields were 1222.57 mm, 1303.54 mm and 1163.88 mm, respectively. By contrast, forest land, grassland, and garden land accounted for 77.84%, 1.27%, and 5.29% of the total land area under the ecological protection scenario, respectively, with average water yields of 1222.16 mm, 1309.18 mm and 1166.57 mm, respectively. In other words, the water yield of forest land decreased slightly by approximately 0.03% under the ecological protection scenario, while those of grassland and garden land increased by approximately 0.04% and 0.23%, respectively. This suggested that the water yield may decrease when more ecological protection measures are carried out and that forest land should not be increased extensively when it is necessary to maintain the maximum water yield in the study area, but it is feasible to appropriately promote the conversion of unused land into grassland and garden land.

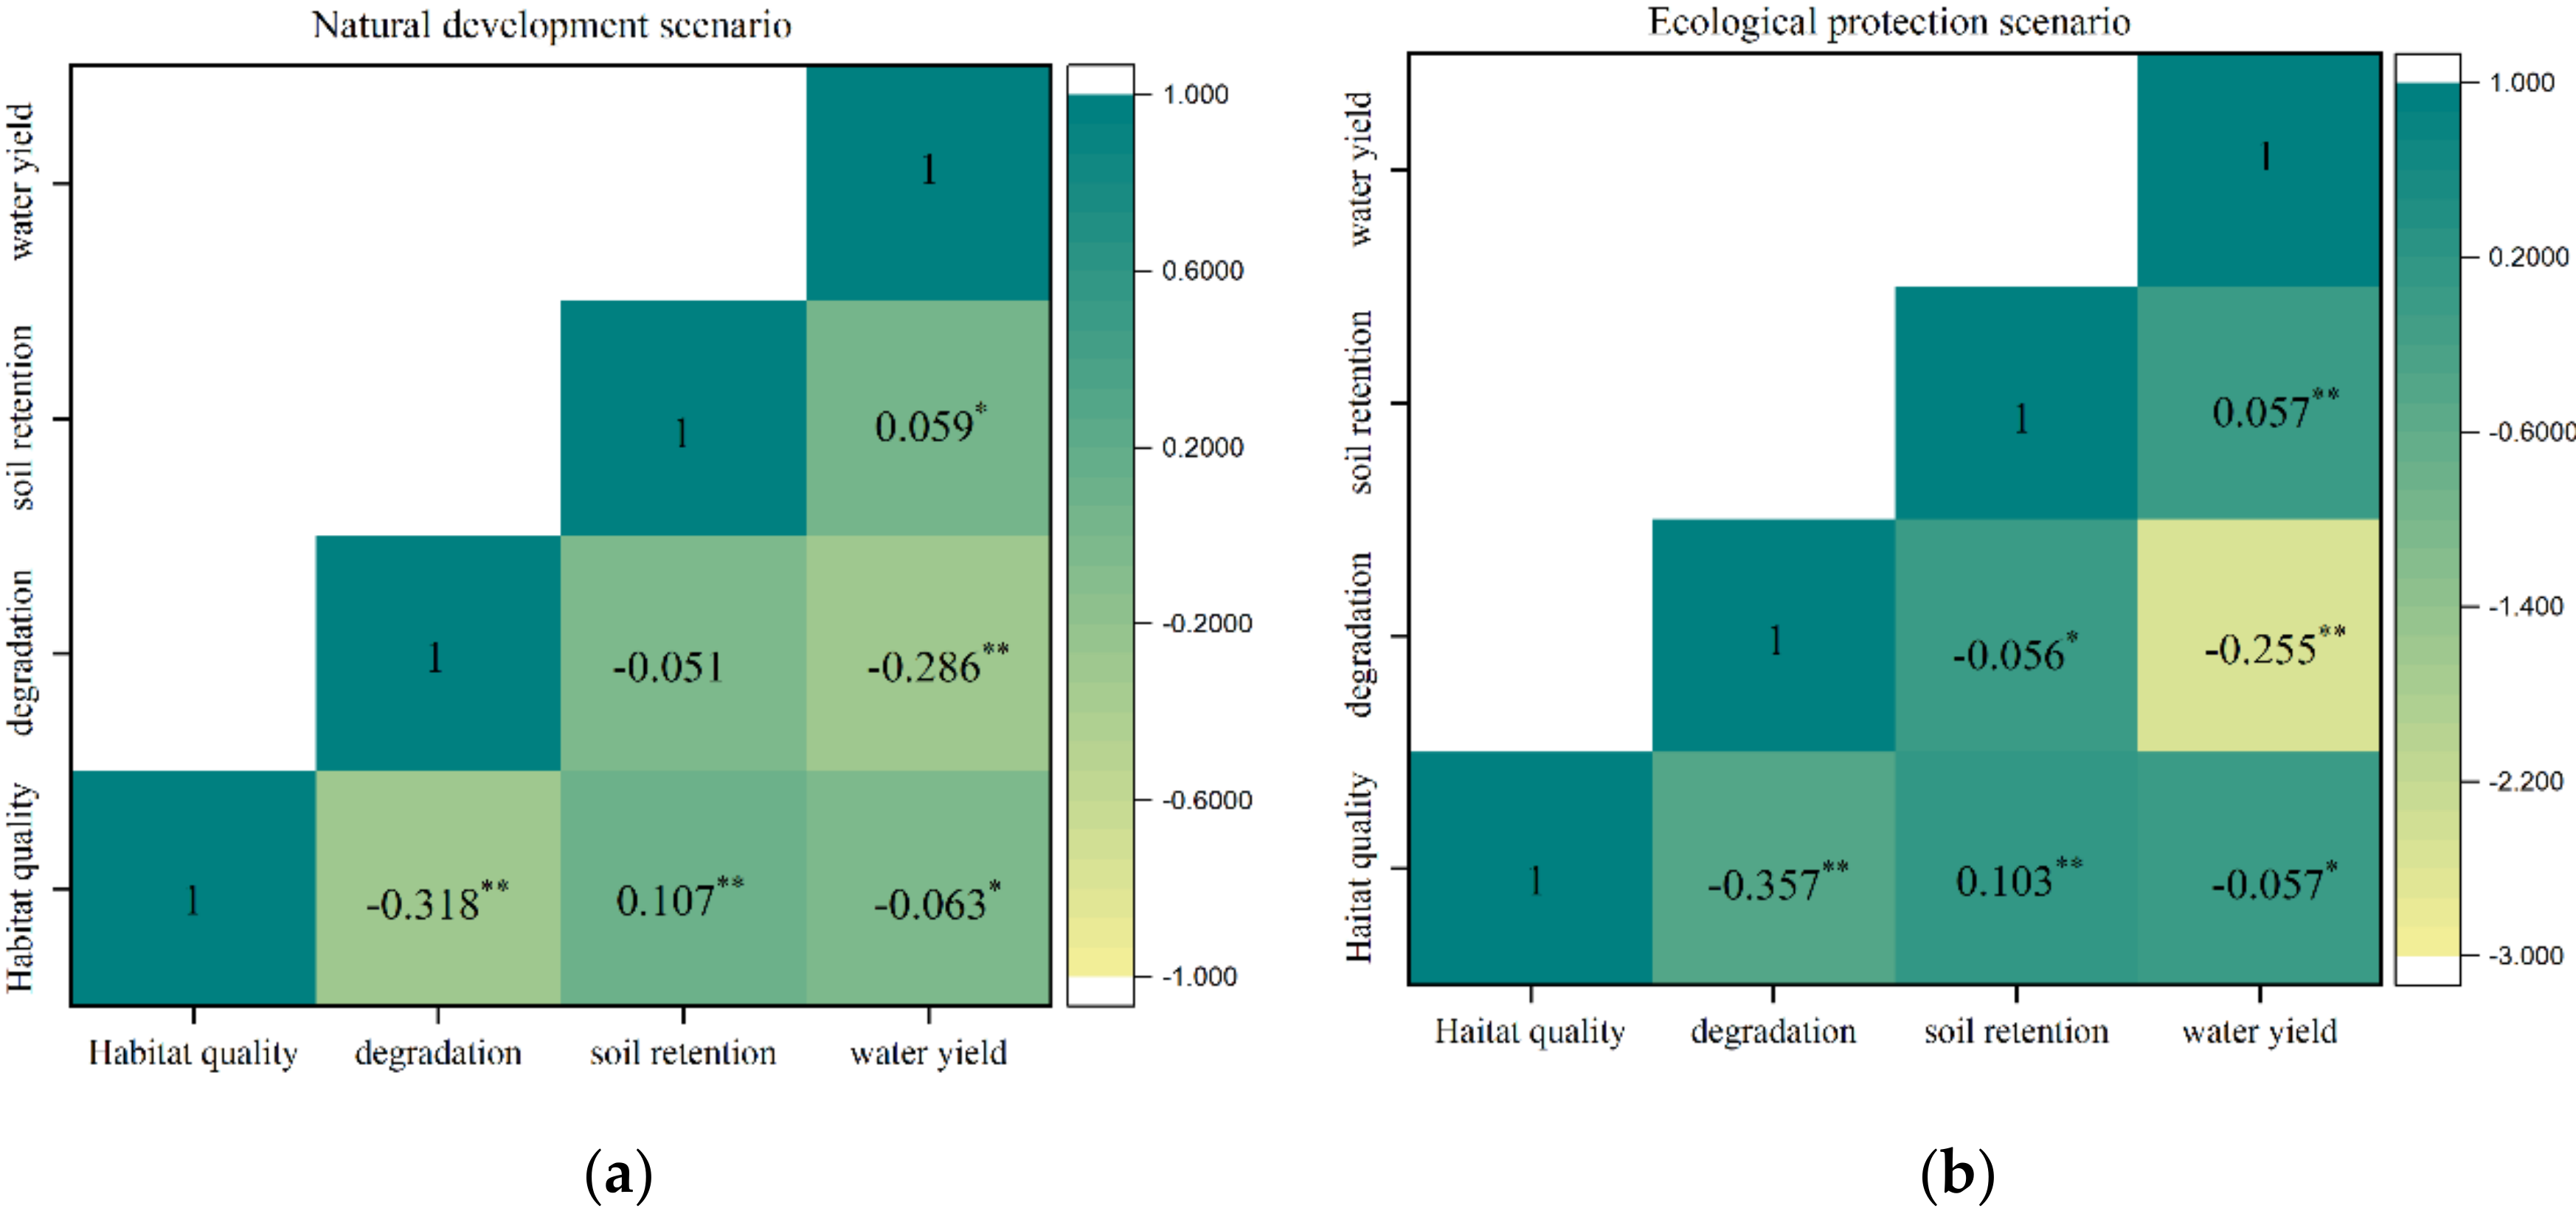
3.2.4. Trade-Offs and Synergies among Ecosystem Services

The trade-offs and synergies among ecosystem services as well as habitat degradation under two scenarios were revealed on the regional scale in this study, which can provide a firm scientific basis for formulating regional ecological protection planning and for the rational utilization of ecological resources. The results under the natural development scenario showed that there was a significant trade-off between water yield and habitat quality and a significant synergy between water yield and soil retention, while habitat quality was significantly synergistic with soil retention (Figure 7), which was generally consistent with the findings of previous studies [38]. On the one hand, the better the habitat quality was, the higher the vegetation cover was, which resulted in higher interception of precipitation and higher resistance to soil erosion, leading to the significant trade-off between water yield and habitat quality and the synergy between habitat quality and soil retention. On the other hand, both water yield and potential soil erosion were closely related to precipitation; the higher precipitation was, the higher the water yield and potential soil erosion were, and the more prominent the role of vegetation cover in the preventing soil erosion was, which led to the synergy between water yield and soil retention. In addition, ecological degradation mainly occurred around towns and transportation construction sites with lower habitat quality due to the expansion of traffic land and built-up area in the study area. Ecological degradation generally led to the decrease in vegetation cover and thus to the decrease in habitat quality and soil retention capacity, resulting in a significant trade-off between habitat degradation and habitat quality, with the coefficient between ecological degradation and habitat quality even reaching −0.318. However, the expansion of built-up area led to the decrease in the role of vegetation cover in retaining precipitation, which increased the water yield and resulted in the significant synergy between ecological degradation and water yield, with the coefficient reaching −0.286.
The trade-offs and synergies between ecosystem services and ecological degradation in the ecological protection scenario were generally consistent with those under the natural development scenario. However, in comparison with the results under the natural development scenario, the trade-off between habitat quality and water yield and the synergy between habitat quality and soil retention under the ecological protection scenario were relatively weaker, and the trade-off between habitat quality and ecological degradation was more significant. Meanwhile, the trade-off between ecological degradation and soil retention became significant, and the trade-off between ecological degradation and water yield weakened to some extent, while the synergy between soil retention and water yield became more significant under the ecological protection scenario. Overall, there was generally a synergy between the habitat quality and soil retention as well as the water yield and soil retention under both scenarios, and there were generally trade-offs between habitat quality and ecological degradation, between habitat quality and water yield, between ecological degradation and soil retention and between ecological degradation and water yield.

3.3. Optimization Results of the Ecological Network Structure

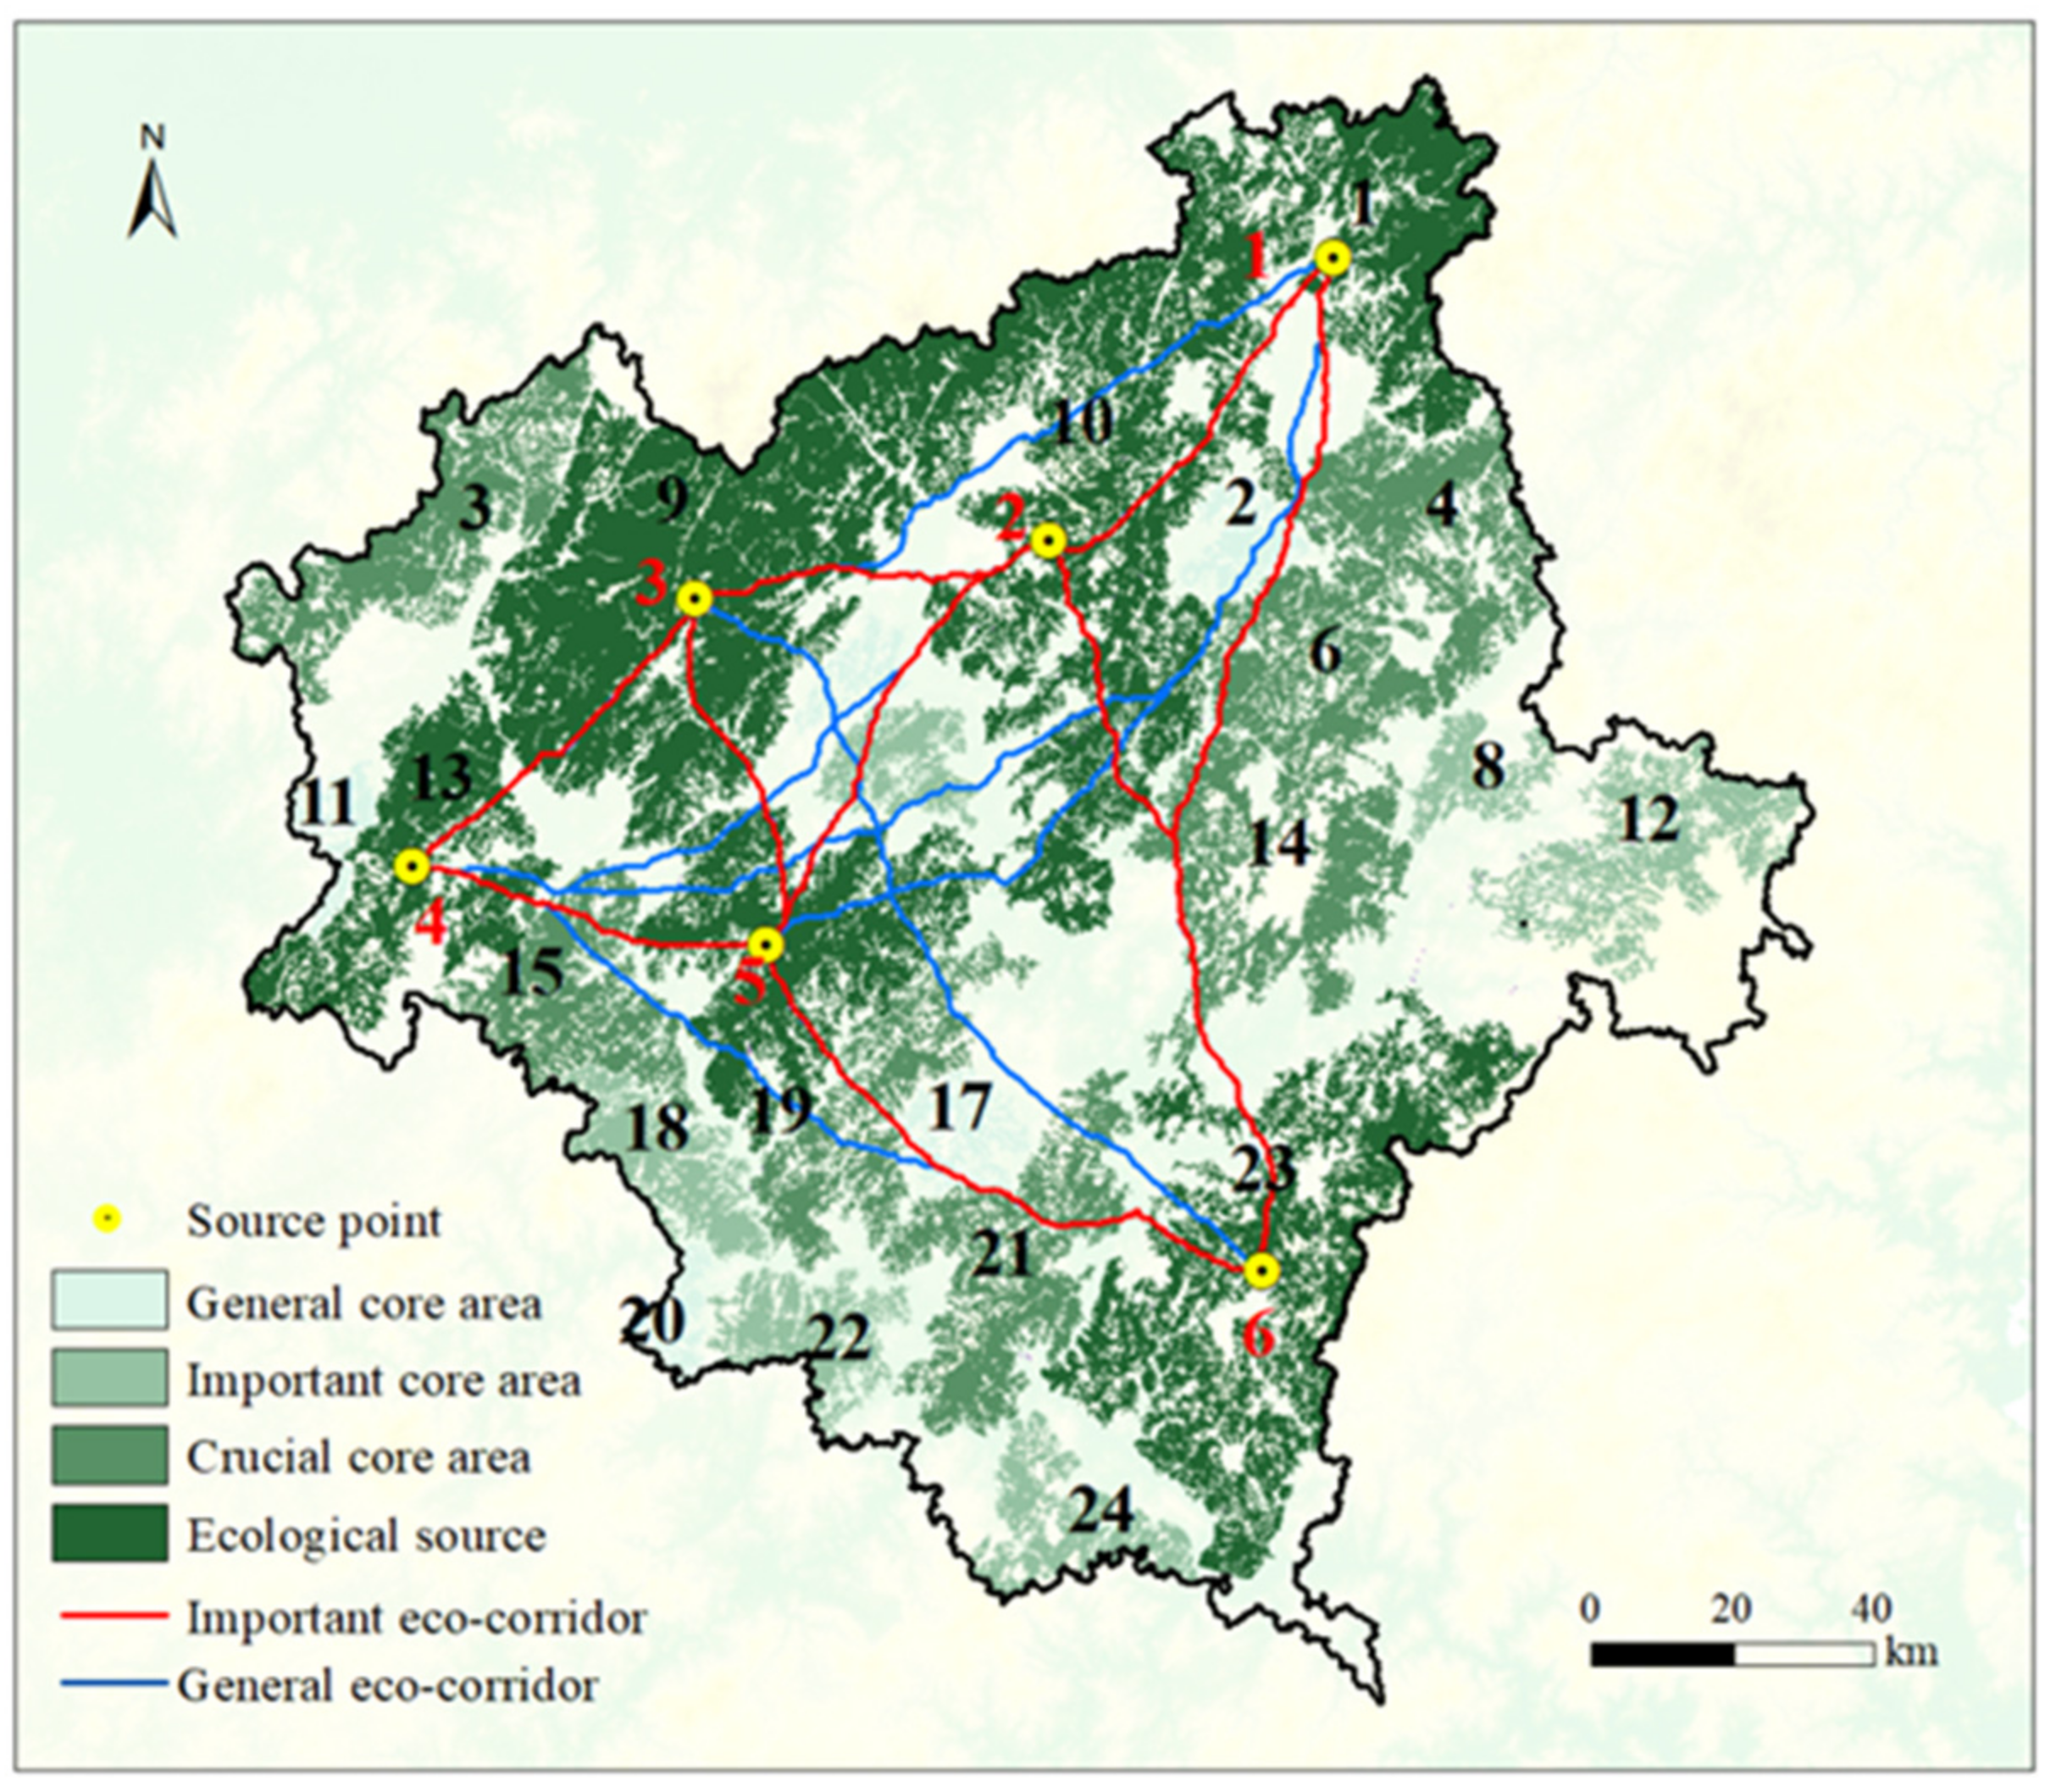
3.3.1. Distribution of the Ecological Network Structure

There were 24 core areas in the study area, which were further classified into general, important and crucial ones (Figure 8). There were 15 eco-corridors among different ecological source areas, including 9 important eco-corridors and 6 general eco-corridors in total, with total lengths of 751.67 km and 14,603.31 km, respectively. These eco-corridors were mainly concentrated in the northern part and extended to the southern part of the study area, overall showing a triangular network structure.

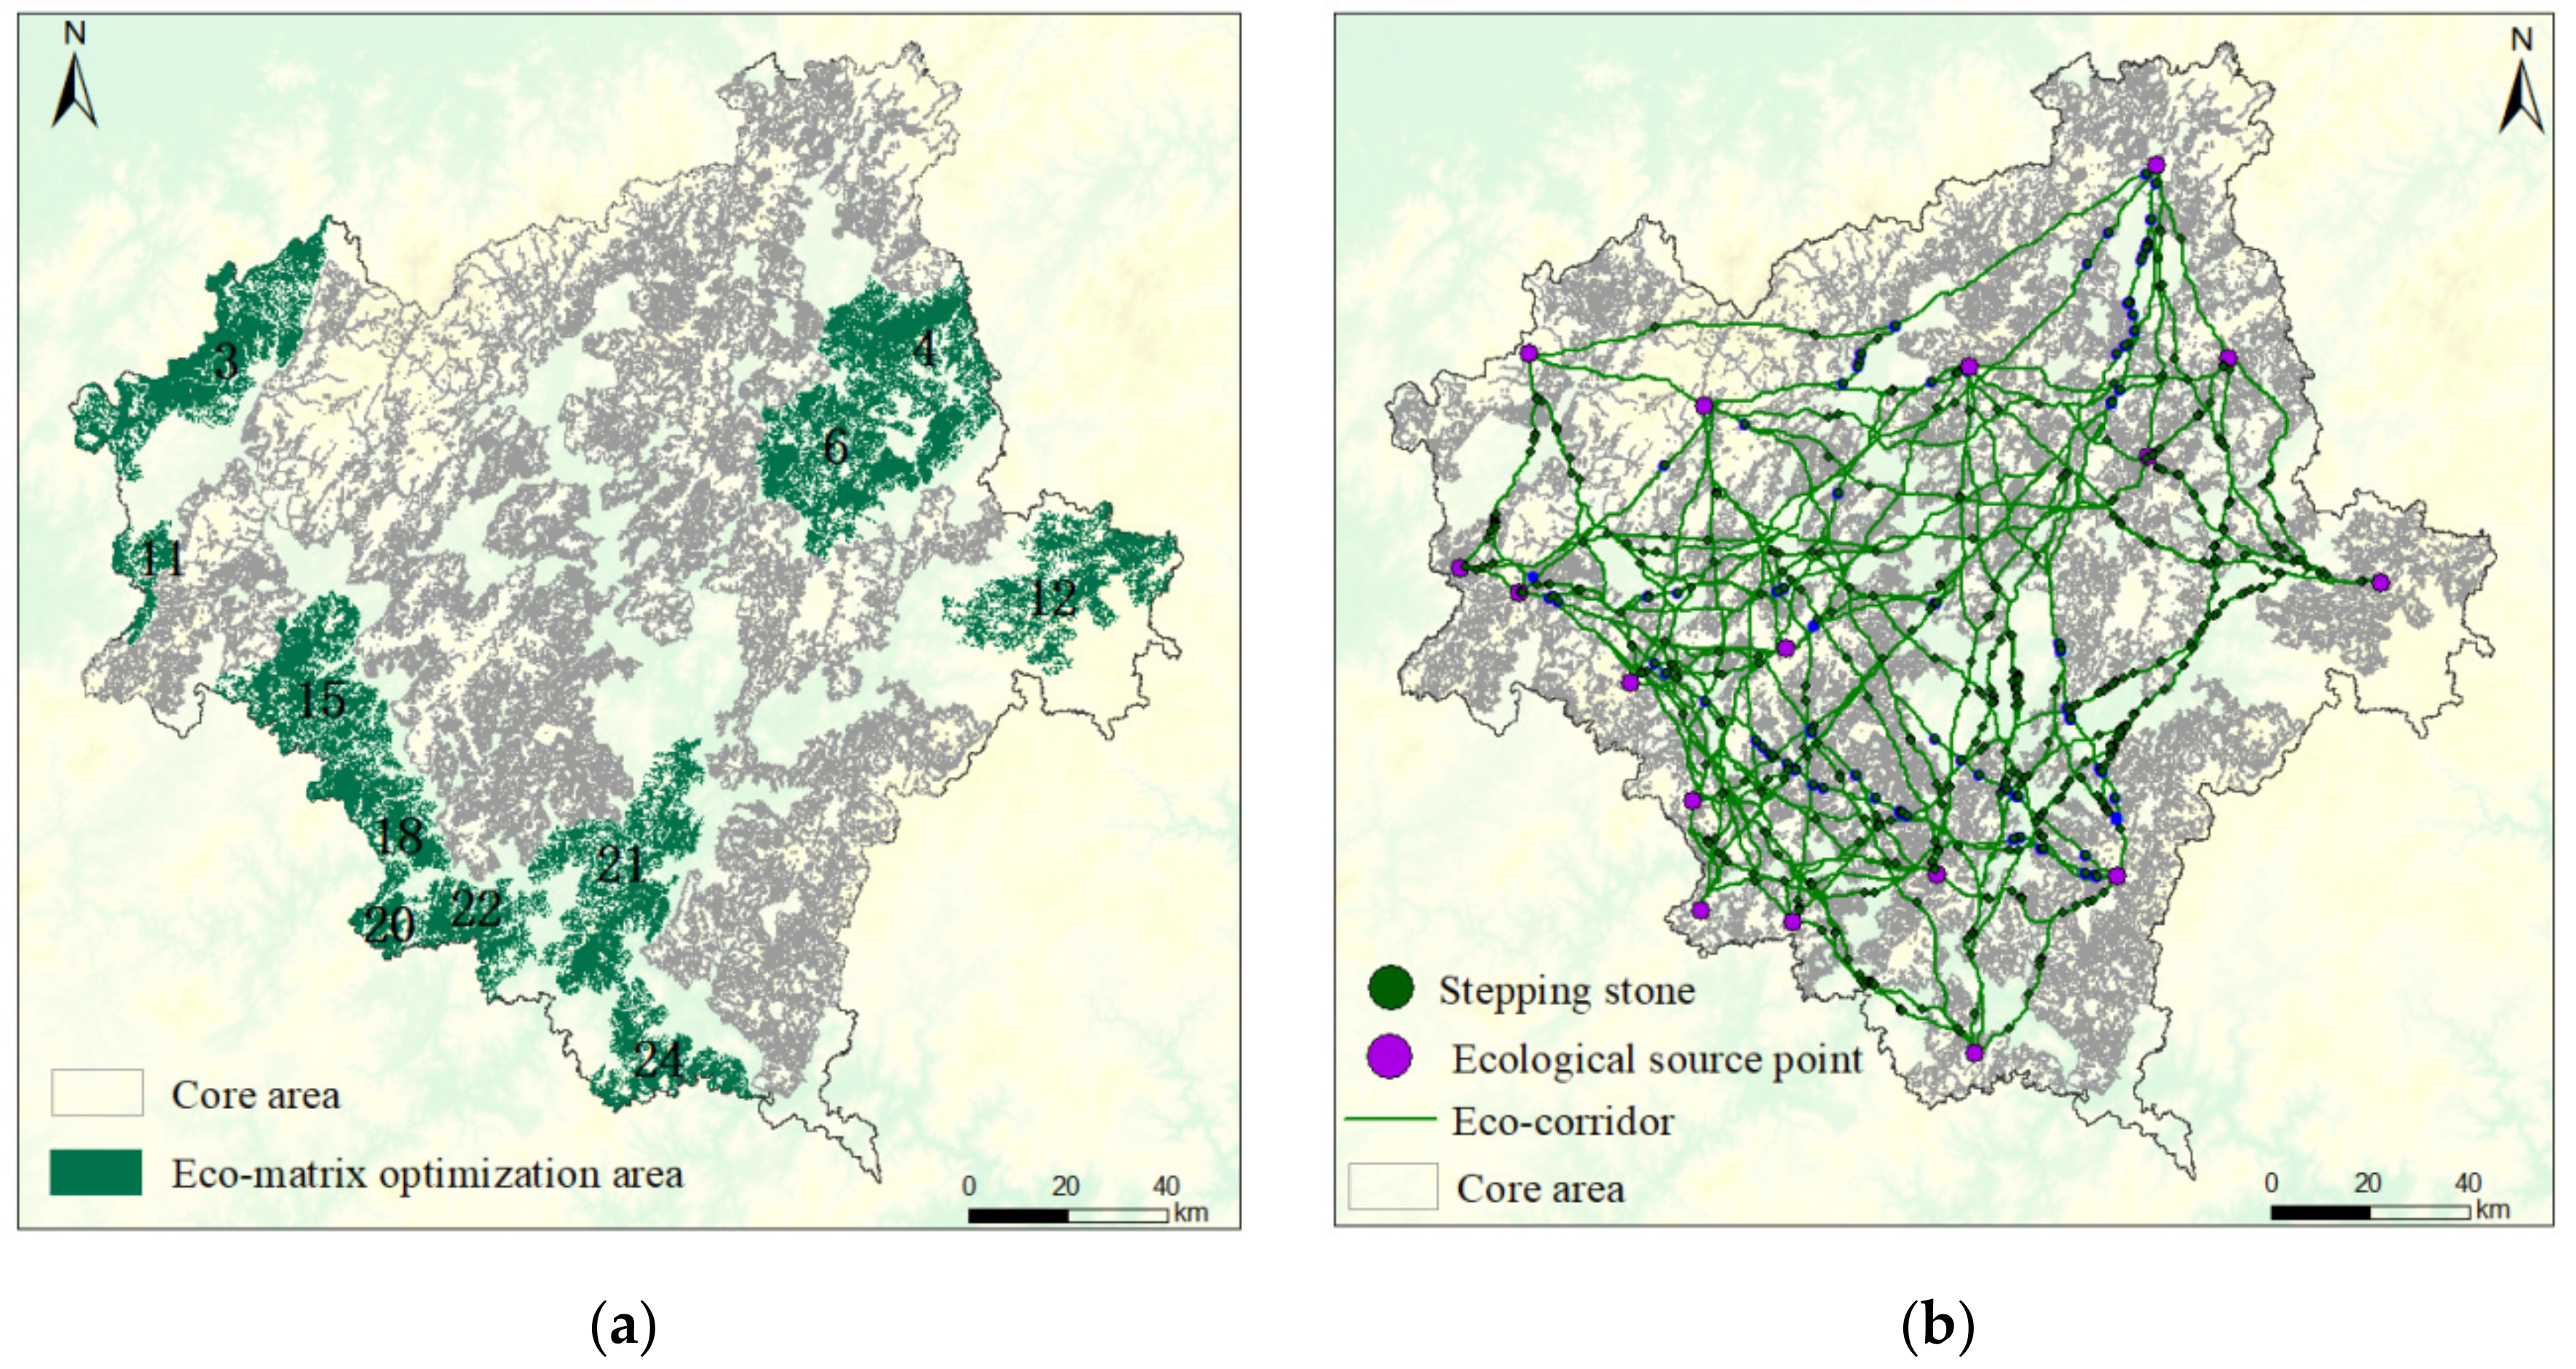
3.3.2. Optimization Results of the Eco-Matrix and Eco-Corridors

This study selected the ecological core areas where there were mainly synergies among ecosystem services and a higher predicted development potential of ecosystem service functions in 2025 on the basis of the trade-offs and synergies between ecosystem services and ecological degradation of the 24 core areas in the study area. Finally, 11 core areas were finally selected as the eco-matrix optimization areas, most of which were mainly located in the eastern and western parts of the study area (Figure 9). Specifically, these 11 core areas included No. 3 in the northwestern part of Guangze County, No. 11 in the western rocky ridge area, No. 15 in the Shitoushan Mountain area in the southwestern part of the study area, No. 18 in the Qitaishan Mountain area, No. 20 in the southern part of Shunchang County, No. 21 and No. 22 in the Mundangshan Mountain area in Yanping District, No. 24 in the Qibaofeng Mountain area in Shunchang County, No. 4 and No. 6 in the Jidangang Mountain area on the border between Pucheng County and Songxi County in the eastern part of the study area and No. 12 in the Nanshangang Mountain area in the eastern part of Zhenghe County. These 11 core areas with the elevation of 500–1000 m were generally far from urban construction areas and served as secondary ecological sources. These eco-matrix optimization areas were generally located in the blind areas of the potential ecological network, and the connection of eco-corridors among the optimized ecological core areas could be greatly improved through optimizing the eco-matrix and the ecological corridors in these areas. The results showed that a total of 121 eco-corridors were added after optimization; the total area of the optimized eco-corridors reached 109,026.27 hm2, and their distribution density was higher in the western part and lower in the southeast part of the study area (Figure 9). Additionally, the statistical results of the landscape composition of the optimized corridors showed that the areas of the core areas, bridging areas and loop areas in these core areas reached 70,517.16 hm2, 1393 hm2 and 846.81 hm2, accounting for 64.68%, 1.28% and 0.78% of the total area of the optimized eco-corridors, respectively. This indicated that the optimized ecological corridors could provide more convenient migration channels for various species.

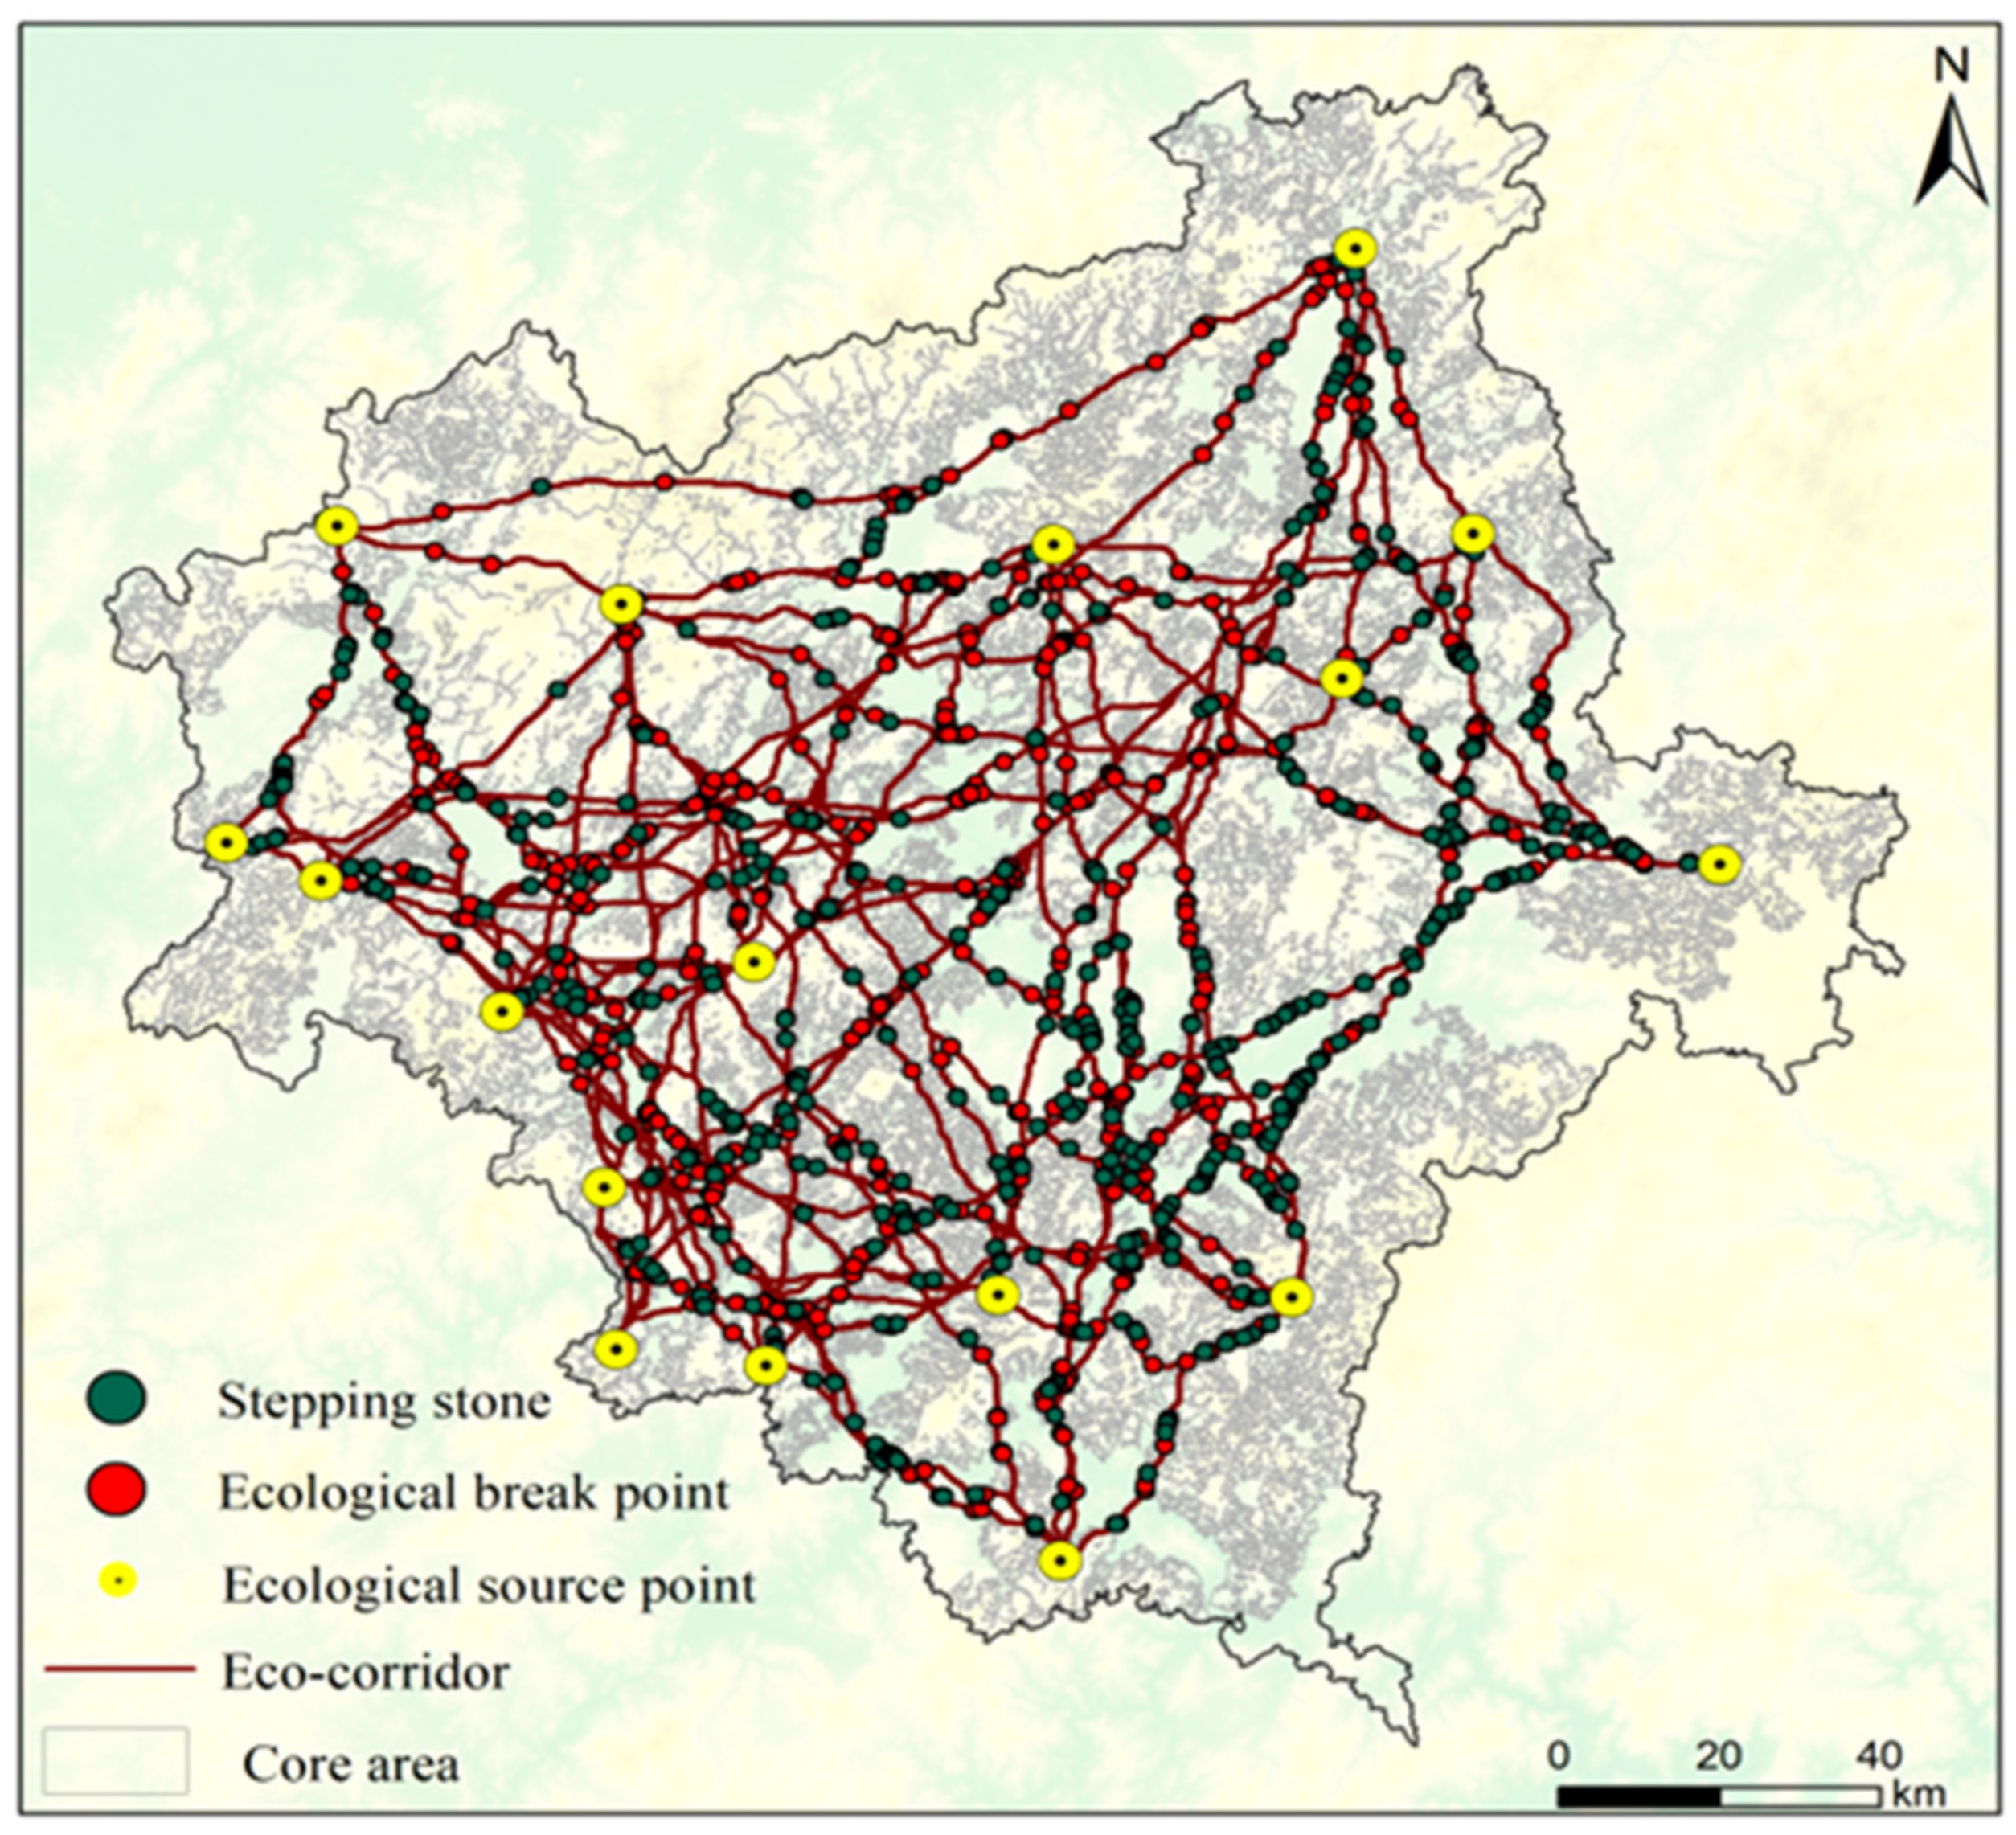
3.3.3. Optimization Result of the Nodes

The results of the overlay analysis of the main traffic road networks (highways and railroads) and the potential ecological network in the study area showed that some of the traffic lands were distributed inside the components of the ecological network, indicating there were some ecological break points in the ecological networks under the condition that some of the ecological networks were blocked by roads. The overlay analysis of the main traffic road networks and the optimized ecological network in the study area showed that there were 1019 ecological break points with restoration potential in the optimized corridor network, which were mainly located in areas with good ecological service functions. The existence of these ecological break points in the eco-corridors reduced landscape connectivity, increased landscape resistance to species migration and thus threatened species migration; therefore, it was necessary to focus more on repairing and improving these ecological break points resulting from traffic land to enhance the ecological corridor integrity (Figure 10). It is notable that the spatial distribution and distance of “stepping stone patches” were particularly important in the ecological network construction due to the relatively long spanning distance between the north and south parts as well as the east and west parts of the study area. The intersection points of eco-corridors also served as important nodes affecting the connectivity of ecological networks; meanwhile, the bridging areas extracted with the MSPA method were important components connecting the core areas in the study area. This study accordingly added 1481 “stepping stone patches” by comprehensively considering the intersection points of potential eco-corridors and bridging areas through the eco-corridors in the study area (Figure 10).

3.3.4. Evaluation Results of Ecological Network Structure Optimization

The number of eco-corridors in the ecological network increased from 15 to 136 after optimization; the area of eco-corridors increased by 83,732.41 hm2, and the corridor length increased by 8167.30 km. In addition, the α index increased from 0.21 to 0.45 after optimization, with an increase of 0.24, indicating that there were more paths available for species migration, and the material circulation and flow were relatively smooth. In addition, the β index increased from 1.25 to 1.86 after optimization, increasing by 0.61 and indicating that the regional ecological network developed toward a network, with better corridor connectivity and a better ecological network structure. Moreover, the γ index increased from 0.23 to 0.64 after optimization, increasing by 0.41, indicating there was a significant increase in connectivity among nodes and that the potential eco-corridors could effectively improve the connectivity level and ecological stability of ecological source sites in the study area.

4. Discussion

This study optimized the ecological network structure based on the trade-offs and synergies between ecosystem services and ecological degradation in the 24 core areas that were obtained using land-use data simulated under different scenarios, and it can provide more scientific and targeted reference for regional ecological protection planning and for the rational utilization of ecological resources. This study selected 11 core areas as the eco-matrix optimization areas, most of which were mainly located in the eastern and western parts of the study area. Therefore, the government of Nanping should pay more attention to the ecological land construction and protection in the area of Shaowu, Shunchang and Jianou and control unreasonable tourism planning and development in order to avoid the fragmentation of landscape and the degradation of ecosystem functions. In addition, more ecological construction in the central urban area should also be paid more attention to, as it could reduce the negative impacts of urban expansion and balance urban economic development and ecological environment protection. In addition, there were 1019 ecological break points with restoration potential in the optimized corridor network, and 1481 “stepping stone patches” were added to the optimized ecological network. Although the northern and southeast regions had better ecological environment and more ecological source areas, there were still plenty of break points to be improved. Therefore, ecological protection cannot be ignored even in the area with great vegetation.
Some policy recommendations on ecological construction were proposed according to the results of this study and the specific conditions of the study area as follows: First, core areas generally played a critical role in improving the ecological network structure; thus, more attention should be paid to the protection of important core areas in the western and northern parts of the study area, and it is necessary to enhance effective connections among patches [41]. In particular, it is necessary to pay special attention to the protection of ecological source areas No. 9 and No. 10 with high connectivity and good ecosystem service functions in the northern part of the study area so as to give full play to their advantages in serving as biological habitats and species migration channels. In addition, it is necessary to further improve the landscape connectivity in ecological source No. 23 in the southern part of the study area. In addition, it is also necessary to establish proper bridge corridors in the ecological source areas with low ecological network connectivity in the western part of the study area, which could promote the regional material exchange and energy flow and improve the overall connectivity of the eco-corridors of the study area. Moreover, special attention should be paid to the construction of eco-corridors in the northern and southern parts of the study area, between which there is a very long migration distance. It is feasible to improve the effectiveness of ecological network connection among these regions by increasing the number of stepping stone patches, rationally arranging the location of stepping stone patches and reducing the distance among stepping stone patches. Overall, the optimization of the ecological network structure should focus on enhancing ecosystem services in the core areas and improving the ecological connectivity in the ecological network structure [42,43,44,45].
This study provided valuable information on the optimization of the ecological network structure based on the simulated land-use pattern and ecosystem service functions, but there were still some shortcomings due to the complexities and uncertainties of ecosystem services and the ecological network structure; thus, it is necessary to carry out more in-depth research in the future [42,46]. Firstly, the setting of the threshold distance has significant impacts on the connectivity of the core areas and the importance of patches. This study set a relatively reasonable distance threshold based on repeated experiments. Specifically, the threshold distance used in the estimation of connectivity and patch importance was set to 5 km, and the connectivity probability was set to 0.5. When the distance among patches was larger than this threshold, the patches were considered to be disconnected. The relevant results were reliable on the whole, but it is necessary to further explore the sensitivity of the distance threshold in future research. Secondly, this study only involved three kinds of ecosystem services and ecological degradation and only explored six types of trade-offs and synergies among them due to data limitation. A more systematic ecosystem service indicator system should be used, and it is necessary to involve more kinds of ecosystem services in future research in order to more comprehensively reveal the landscape interactions. Thirdly, this study involved only two scenarios and did not involve the scenario of rapid economic development; it is, therefore, necessary to carry out more complex scenario simulations in future research. Additionally, this study did not take future climate change into account, which should be further improved in future research.

5. Conclusions

This study simulated the ecosystem services in Nanping based on simulated land use from 2020 to 2025 under the natural development scenario and ecological protection scenario and then explored their trade-off and synergy relationships. The ecological network structure was optimized in terms of the eco-matrix, eco-corridors and nodes based on the simulated land use and ecosystem service functions. The results showed that the habitat quality and soil retention under the ecological protection scenario were better than those under the natural development scenario. However, the water yield decreased under the ecological protection scenario in comparison to the natural development scenario. In addition, soil retention had significant synergies with habitat quality and water yield, and habitat quality had significant trade-offs with ecological degradation and water yield on the regional scale, while ecological degradation also showed significant trade-offs with soil retention and water yield. As for the ecological network structure in Nanping, it was relatively simple, and 11 additional ecological sources could be added. The number of eco-corridors increased from 15 to 136; a total 1019 ecological break points were restored, and 1481 stepping stone patches were deployed after the optimization of the ecological network structure, which jointly made network circuitry, edge/node ratio and network connectivity reach 0.45, 1.86 and 0.64, respectively. The findings of this study can provide reference information for ecological protection and ecological corridor planning in other regions.

Author Contributions

Conceptualization, Z.W. and H.Y.; software, L.X.; validation, Y.Q.; formal analysis, Y.Q.; investigation, L.X. and Y.Q.; resources, Q.J.; data curation, H.Y.; writing—original draft preparation, Z.W. and L.X.; writing—review and editing, Q.J. and H.Y.; visualization, L.X.; supervision, Q.J. and H.Y.; project administration, Q.J.; funding acquisition, Q.J. and H.Y. All authors have read and agreed to the published version of the manuscript.

Funding

This research study was supported by Major Research Plan of National Natural Science Foundation of China (No. 2017ZX07101004 and No. 2017ZX07108002), National Natural Science Foundation of China (No. 41901234 and No. 51909052), Fundamental Research Funds for the Central Universities (No. 2015ZCQSB03) and Hebei Natural Science Foundation (No. D2015207002). Data support from projects of National Natural Science Foundation of China (No. 71225005) and Exploratory Forefront Project for the Strategic Science Plan in IGSNRR, CAS, are also appreciated.

Data Availability Statement

DEM data were downloaded from the Geospatial Data Cloud website (http://www.gscloud.cn/, accessed on 2 June 2020), sub-watershed and watershed boundary data were extracted from Watershed of China Extracted Based on DEM (https://www.resdc.cn/DOI/DOI.aspx?DOIID=44, accessed on 3 July 2019), soil data was provided by National Tibetan Plateau Data Center (http://data.tpdc.ac.cn/zh-hans/, accessed on 2 June 2020), meteorological data were obtained from China Meteorological Administration (http://data.cma.cn/, accessed on 2 June 2020), land use image data were interpreted by author, socioeconomic data (GDP, population density) and location data were provided by Data Center for Resources and Environmental Sciences of the Chinese Academy of Sciences (http://www.resdc.cn/, accessed on 2 June 2020).

Conflicts of Interest

The authors declare no conflict of interest.

References

  1. Saura, S.; Estreguil, C.; Mouton, C.; Rodríguez-Freire, M. Network analysis to assess landscape connectivity trends: Application to European forests (1990–2000). Ecol. Indic. 2011, 11, 407–416. [Google Scholar] [CrossRef]
  2. Zhang, Z.; Meerow, S.; Newell, J.P.; Lindquist, M. Enhancing landscape connectivity through multifunctional green infrastructure corridor modeling and design. Urban For. Urban Green. 2019, 38, 305–317. [Google Scholar] [CrossRef]
  3. Chen, D.; Lu, X.; Hu, W.; Zhang, C.; Lin, Y. How urban sprawl influences eco-environmental quality: Empirical research in China by using the Spatial Durbin model. Ecol. Indic. 2021, 131, 108113. [Google Scholar] [CrossRef]
  4. Khalyani, A.H.; Mayer, A.L. Spatial and temporal deforestation dynamics of Zagros forests (Iran) from 1972 to 2009. Landsc. Urban Plann. 2013, 117, 1–12. [Google Scholar] [CrossRef]
  5. Estoque, R.C.; Murayama, Y. Monitoring surface urban heat island formation in a tropical mountain city using Landsat data (1987–2015). ISPRS J. Photogramm. 2017, 133, 18–29. [Google Scholar] [CrossRef]
  6. Fu, Q.; Xu, L.; Zheng, H.; Chen, J. Spatiotemporal dynamics of carbon storage in response to urbanization: A case study in the Su-Xi-Chang region, China. Processes 2019, 7, 836. [Google Scholar] [CrossRef] [Green Version]
  7. Han, B.; Jin, X.; Xiang, X.; Rui, S.; Zhang, X.; Jin, Z.; Zhou, Y. An integrated evaluation framework for Land-Space ecological restoration planning strategy making in rapidly developing area. Ecol. Indic. 2021, 124, 107374. [Google Scholar] [CrossRef]
  8. Shi, X.; Zhou, F.; Wang, Z. Research on optimization of ecological service function and planning control of land resources planning based on ecological protection and restoration. Environ. Technol. Inno. 2021, 24, 101904. [Google Scholar] [CrossRef]
  9. Qiu, S.; Peng, J.; Zheng, H.; Xu, Z.; Meersmans, J. How can massive ecological restoration programs interplay with social-ecological systems? A review of research in the South China karst region. Sci. Total Environ. 2022, 807, 150723. [Google Scholar] [CrossRef]
  10. Xiang, X.; Li, Q.; Khan, S.; Khalaf, O.I. Urban water resource management for sustainable environment planning using artificial intelligence techniques. Environ. Impact Asses. 2021, 86, 106515. [Google Scholar] [CrossRef]
  11. Yan, R.; Cai, Y.; Li, C.; Wang, X.; Liu, Q.; Yan, S. Spatial interactions among ecosystem services and the identification of win-win areas at the regional scale. Ecol. Complex. 2021, 47, 100938. [Google Scholar] [CrossRef]
  12. Azadi, H.; Van Passel, S.; Cools, J. Rapid economic valuation of ecosystem services in man and biosphere reserves in Africa: A review. Glob. Ecol. Conserv. 2021, 28, e01697. [Google Scholar] [CrossRef]
  13. Kubeš, J. Biocentres and corridors in a cultural landscape. A critical assessment of the ‘territorial system of ecological stability’. Landsc. Urban Plann. 1996, 35, 231–240. [Google Scholar] [CrossRef]
  14. Dondina, O.; Kataoka, L.; Orioli, V.; Bani, L. How to manage hedgerows as effective ecological corridors for mammals: A two-species approach. Agr. Ecosyst. Environ. 2016, 231, 283–290. [Google Scholar] [CrossRef]
  15. Hofman, M.P.; Hayward, M.W.; Kelly, M.J.; Balkenhol, N. Enhancing conservation network design with graph-theory and a measure of protected area effectiveness: Refining wildlife corridors in Belize, Central America. Landsc. Urban Plann. 2018, 178, 51–59. [Google Scholar] [CrossRef]
  16. Morandi, D.T.; de Jesus França, L.C.; Menezes, E.S.; Machado, E.L.M.; da Silva, M.D.; Mucida, D.P. Delimitation of ecological corridors between conservation units in the Brazilian Cerrado using a GIS and AHP approach. Ecol. Indic. 2020, 115, 106440. [Google Scholar] [CrossRef]
  17. Hou, Q.; Du, Y.; Dong, W.; Zeng, Z.; Zhang, L.; Duan, Y.; Hou, X. Smart city oriented ecological corridor layout of Sanshui River Basin in arid area of Loess Plateau. Sustain. Energy. Techn. 2021, 44, 100993. [Google Scholar] [CrossRef]
  18. Mõisja, K.; Uuemaa, E.; Oja, T. Integrating small-scale landscape elements into land use/cover: The impact on landscape metrics’ values. Ecol. Indic. 2016, 67, 714–722. [Google Scholar] [CrossRef]
  19. Parent, J.R.; Volin, J.C. Validating Landsat-based landscape metrics with fine-grained land cover data. Ecol. Indic. 2016, 60, 668–677. [Google Scholar] [CrossRef]
  20. Shi, F.; Liu, S.; Sun, Y.; An, Y.; Zhao, S.; Liu, Y.; Li, M. Ecological network construction of the heterogeneous agro-pastoral areas in the upper Yellow River basin. Agr. Ecosyst. Environ. 2020, 302, 107069. [Google Scholar] [CrossRef]
  21. Serret, H.; Raymond, R.; Foltête, J.-C.; Clergeau, P.; Simon, L.; Machon, N. Potential contributions of green spaces at business sites to the ecological network in an urban agglomeration: The case of the Ile-de-France region, France. Landsc. Urban Plann. 2014, 131, 27–35. [Google Scholar] [CrossRef]
  22. Qiu, B.; Li, H.; Zhou, M.; Zhang, L. Vulnerability of ecosystem services provisioning to urbanization: A case of China. Ecol. Indic. 2015, 57, 505–513. [Google Scholar] [CrossRef]
  23. Mu, J.E.; Ziolkowska, J.R. An integrated approach to project environmental sustainability under future climate variability: An application to US Rio Grande Basin. Ecol. Indic. 2018, 95, 654–662. [Google Scholar] [CrossRef]
  24. Almenar, J.B.; Bolowich, A.; Elliot, T.; Geneletti, D.; Sonnemann, G.; Rugani, B. Assessing habitat loss, fragmentation and ecological connectivity in Luxembourg to support spatial planning. Landsc. Urban Plann. 2019, 189, 335–351. [Google Scholar] [CrossRef]
  25. Fath, B.D.; Scharler, U.M.; Ulanowicz, R.E.; Hannon, B. Ecological network analysis: Network construction. Ecol. Model. 2007, 208, 49–55. [Google Scholar] [CrossRef]
  26. Dutta, T.; Sharma, S.; McRae, B.H.; Roy, P.S.; DeFries, R. Connecting the dots: Mapping habitat connectivity for tigers in central India. Reg. Environ. Chang. 2016, 16, 53–67. [Google Scholar] [CrossRef]
  27. Yu, Q.; Yue, D.; Wang, J.; Zhang, Q.; Li, Y.; Yu, Y.; Chen, J.; Li, N. The optimization of urban ecological infrastructure network based on the changes of county landscape patterns: A typical case study of ecological fragile zone located at Deng Kou (Inner Mongolia). J. Clean. Prod. 2017, 163, S54–S67. [Google Scholar] [CrossRef]
  28. Dou, H.; Li, X.; Li, S.; Dang, D.; Li, X.; Lu, X.; Li, M.; Liu, S. Mapping ecosystem services bundles for analyzing spatial trade-offs in inner Mongolia, China. J. Clean. Prod. 2020, 256, 120444. [Google Scholar] [CrossRef]
  29. Yang, Y.; Li, M.; Feng, X.; Yan, H.; Su, M.; Wu, M. Spatiotemporal variation of essential ecosystem services and their trade-off/synergy along with rapid urbanization in the Lower Pearl River Basin, China. Ecol. Indic. 2021, 133, 108439. [Google Scholar] [CrossRef]
  30. Butler, J.R.; Wong, G.Y.; Metcalfe, D.J.; Honzák, M.; Pert, P.L.; Rao, N.; Van Grieken, M.E.; Lawson, T.; Bruce, C.; Kroon, F.J. An analysis of trade-offs between multiple ecosystem services and stakeholders linked to land use and water quality management in the Great Barrier Reef, Australia. Agr. Ecosyst. Environ. 2013, 180, 176–191. [Google Scholar] [CrossRef]
  31. Jahanishakib, F.; Salmanmahiny, A.; Mirkarimi, S.H.; Poodat, F. Hydrological connectivity assessment of landscape ecological network to mitigate development impacts. J. Environ. Manag. 2021, 296, 113169. [Google Scholar] [CrossRef] [PubMed]
  32. Xu, W.; Wang, J.; Zhang, M.; Li, S. Construction of landscape ecological network based on landscape ecological risk assessment in a large-scale opencast coal mine area. J. Clean. Prod. 2021, 286, 125523. [Google Scholar] [CrossRef]
  33. Xiao, L.; Cui, L.; Jiang, Q.o.; Wang, M.; Xu, L.; Yan, H. Spatial Structure of a Potential Ecological Network in Nanping, China, Based on Ecosystem Service Functions. Land 2020, 9, 376. [Google Scholar] [CrossRef]
  34. Ayivi, F.; Jha, M.K. Estimation of water balance and water yield in the Reedy Fork-Buffalo Creek Watershed in North Carolina using SWAT. Int. Soil Water Conse. 2018, 6, 203–213. [Google Scholar] [CrossRef]
  35. Peng, K.; Jiang, W.; Deng, Y.; Liu, Y.; Wu, Z.; Chen, Z. Simulating wetland changes under different scenarios based on integrating the random forest and CLUE-S models: A case study of Wuhan Urban Agglomeration. Ecol. Indic. 2020, 117, 106671. [Google Scholar] [CrossRef]
  36. Hack, J.; Molewijk, D.; Beißler, M.R. A conceptual approach to modeling the geospatial impact of typical urban threats on the habitat quality of river corridors. Remote Sens. 2020, 12, 1345. [Google Scholar] [CrossRef] [Green Version]
  37. Sharps, K.; Masante, D.; Thomas, A.; Jackson, B.; Redhead, J.; May, L.; Prosser, H.; Cosby, B.; Emmett, B.; Jones, L. Comparing strengths and weaknesses of three ecosystem services modelling tools in a diverse UK river catchment. Sci. Total Environ. 2017, 584–585, 118–130. [Google Scholar] [CrossRef] [Green Version]
  38. Pan, J.; Wei, S.; Li, Z. Spatiotemporal pattern of trade-offs and synergistic relationships among multiple ecosystem services in an arid inland river basin in NW China. Ecol. Indic. 2020, 114, 106345. [Google Scholar] [CrossRef]
  39. Dai, L.; Liu, Y.; Luo, X. Integrating the MCR and DOI models to construct an ecological security network for the urban agglomeration around Poyang Lake, China. Sci. Total Environ. 2021, 754, 141868. [Google Scholar] [CrossRef]
  40. Hornbeck, J.; Adams, M.; Corbett, E.; Verry, E.; Lynch, J. Long-term impacts of forest treatments on water yield: A summary for northeastern USA. J. Hydrol. 1993, 150, 323–344. [Google Scholar] [CrossRef]
  41. Liu, S.; Hou, X.; Yin, Y.; Cheng, F.; Zhang, Y.; Dong, S. Research progress on landscape ecological networks. Acta Ecol. Sin. 2017, 37, 3947–3956. [Google Scholar]
  42. Ignatieva, M.; Stewart, G.H.; Meurk, C. Planning and design of ecological networks in urban areas. Landsc. Ecol. Eng. 2011, 7, 17–25. [Google Scholar] [CrossRef]
  43. Sun, X.; Crittenden, J.C.; Li, F.; Lu, Z.; Dou, X. Urban expansion simulation and the spatio-temporal changes of ecosystem services, a case study in Atlanta Metropolitan area, USA. Sci. Total Environ. 2018, 622, 974–987. [Google Scholar] [CrossRef] [PubMed]
  44. Xu, D.; Ding, X. Assessing the impact of desertification dynamics on regional ecosystem service value in North China from 1981 to 2010. Ecosyst. Serv. 2018, 30, 172–180. [Google Scholar] [CrossRef]
  45. Xing, L.; Hu, M.; Wang, Y. Integrating ecosystem services value and uncertainty into regional ecological risk assessment: A case study of Hubei Province, Central China. Sci. Total Environ. 2020, 740, 140126. [Google Scholar] [CrossRef]
  46. Huang, X.; Wang, H.; Shan, L.; Xiao, F. Constructing and optimizing urban ecological network in the context of rapid urbanization for improving landscape connectivity. Ecol. Indic. 2021, 132, 108319. [Google Scholar] [CrossRef]
Figure 1. Location of the study area.
Remotesensing 14 05245 g001
Figure 2. Prediction of land-use demand from 2020 to 2025 under the natural development scenario and the ecological protection scenario.
Remotesensing 14 05245 g002
Figure 3. Spatial distribution of land use in 2025 under (a) the natural development scenario and (b) the ecological protection scenario.
Remotesensing 14 05245 g003
Figure 4. Spatial pattern of habitat quality in 2025 under (a) the natural development scenario and (b) the ecological protection scenario.
Remotesensing 14 05245 g004
Figure 5. Spatial distribution of soil retention in 2025 under (a) the natural development scenario and (b) the ecological protection scenario.
Remotesensing 14 05245 g005
Figure 6. Spatial distribution of water yield in 2025 under (a) the natural development scenario and (b) the ecological protection scenario.
Remotesensing 14 05245 g006
Figure 7. Trade-offs and synergies between ecosystem services and ecological degradation under (a) the natural development scenario and (b) the ecological protection scenario. * represents p < 0.05, and ** represents p < 0.01.
Remotesensing 14 05245 g007
Figure 8. Distribution of the potential ecological network structure in the study area.
Remotesensing 14 05245 g008
Figure 9. Spatial distribution of the optimized (a) eco-matrix and (b) eco-corridors.
Remotesensing 14 05245 g009
Figure 10. Spatial distribution of the optimized nodes.
Remotesensing 14 05245 g010
Table 1. Variation in ecosystem services under different scenarios in Nanping in 2025.
ScenariosAverage Habitat QualityAverage Degradation IndexTotal Soil Retention (t)Total Water Yield (mm)
Natural development scenario0.7890.02260.22 × 10831.26 × 109
Ecological protection scenario0.8420.01760.38 × 10812.56 × 109
Publisher’s Note: MDPI stays neutral with regard to jurisdictional claims in published maps and institutional affiliations.

