
UAV-Mounted GPR for Object Detection Based on Cross-Correlation Background Subtraction Method


1
Key Laboratory for Information Science of Electromagnetic Waves (MoE), School of Information Science and Technology, Fudan University, Shanghai 200433, China
2
Shanghai Yunyi Electromagnetic Technology Co., Ltd., Shanghai 201100, China
*
Author to whom correspondence should be addressed.
Remote Sens. 2022, 14(20), 5132; https://doi.org/10.3390/rs14205132
Submission received: 26 August 2022
/
Revised: 5 October 2022
/
Accepted: 8 October 2022
/
Published: 14 October 2022
(This article belongs to the Special Issue Trends in UAV Remote Sensing Applications: Part II)
Abstract
:Unmanned aerial vehicle (UAV) ground-penetrating radar (GPR) is an important research topic for target detection in many fields. In this paper, we develop a UAV-mounted GPR system with a frequency band at 150 MHz–309 MHz. However, the received signal in the complex background is covered by various clutter and interference, leading to the serious obscuring of the target. To meet this challenge, a cross-correlation-based background subtraction (CCBS) method and an interference suppression technique are adopted in combination for more accurate detection. The CCBS method processes the raw echo by establishing a background-removal model and using the similarity between each A−Scan and a reference wave. In addition, a Butterworth filter is adopted to get rid of the active electromagnetic interference beyond the working frequencies of the system; then, a lateral Doppler filtering (LDF) technique is introduced to suppress the passive interference generated by the rotation of the UAV rotor itself. Moreover, a practical method for estimating the dielectric constant is introduced by the calibration process of the measured radar echo. Numerical simulations and experimental results by our UAV-GPR system demonstrate that the proposed method has presented a better performance than the traditional methods, and the system has great potential in detecting deeply buried targets.
1. Introduction
Ground-penetrating radar (GPR) is a popular nondestructive testing technique for target detection and imaging in many fields, such as engineering detection [1], ground ice detection [2], and criminal investigations [3]. However, GPR is limited by its huge platform like vehicle-mounted radar, so it cannot work with high efficiency in complex and dangerous environments. In recent years, unmanned aerial vehicle (UAVs) with their lightweight and remote-controlled characteristics have been the focus of increasing interest in military and civilian applications [4,5,6,7]. A significant advantage of UAVs is that they can fly over large areas which are difficult for humans to reach directly [8]. In addition, the accurate positioning technique and automatic flight mode can achieve higher accuracy and efficiency. Therefore, unmanned aerial vehicle (UAV)-mounted GPR for target detection is a promising field of research.
However, for the UAV-GPR system, the accurate interpretation of radar echo is a big challenge due to the impact of background signal or clutter, the electromagnetic interference in environment, the rotor interference of UAV and so on. When background signals or interference of various kinds is stronger than the useful radar echo, it is easy to be misjudged as the target. To remove the background signal and the interference, many researchers have studied the methods about the radar signal processing. An improved method of background and clutter reduction is proposed to highlight the echo of the target by adopting a background window [9]. Mohamed has also proposed a background-removal method by creating a background matrix for GPR data obtained in a relatively flat terrain [10]. Although researchers have studied some effective methods of GPR data processing, there has been little discussion about the low-frequency UAV-mounted GPR on removing the background clutter when working in a complex and changing environment [11,12,13,14,15].
GPR detection faces many challenges in the actual environment. To improve the penetration of the radar, lower frequency ultra-wideband signals are needed. However, this will lead to an increase in antenna size and vulnerability to electromagnetic interference in the environment. In addition, there will be a great deal of clutter in the complex underground environment. Many theories have studied how to eliminate clutter interference to images, such as mean subtraction methods [16], singular value decomposition (SVD) [17], and principal component analysis (PCA) [18]. However, these algorithms are mainly applicable to even and flat terrain, but not fully suitable for UAV ground-penetrating radar. The reason is that the rotor interference of UAV and space electromagnetic interference will make the above methods ineffective.
In this paper, we have developed a low-frequency UAV-GPR system, which includes a hardware system and an algorithm-processing system, which will be described in detail in the following chapters.
First, the structure of the UAV-GPR system, the waveform of the transmitted signal, and the experimental principle are introduced. The system adopts ultra-wideband VHF antennas to transmit narrow-band pulses, and the radar echoes are acquired through a data collector and self-developed acquisition program. The bandwidth of the antenna and the waveform of the received signal are further measured through experiments.
Secondly, the CCBS method is proposed by calculating the cross-correlation between each A−Scan signal and a reference wave, and the size of cross-correlation indicates the degree of similarity. Here, the reference wave is defined as a single echo when there is no target underground. If the value of cross-correlation is large (close to 1), it indicates that the radar echo is similar to the reference wave. That is, the reference wave can be regarded as the background signal to a higher degree. On the contrary, if the value of cross-correlation is small (close to 0), it indicates that the radar echo is similar to the mean signal of all A−Scan echoes in the azimuth dimension, which can be largely considered as the background clutter. The background clutter mentioned in this work includes signals in areas of no interest, antenna direct-coupling waves, ground reflection waves, periodic electromagnetic interference signals, etc. Attentive to the abovementioned considerations, a background removal model is built by weighting the reference wave and the mean signal. In this way, the background signal can be removed effectively. Moreover, a Butterworth filter is used to remove some active electromagnetic interference, which is beyond working frequency of the system. The Doppler shift phenomenon would appear due to the relative motion between radar module and UAV rotors, which makes the received echo appear as a high-frequency component in the Doppler domain, so as to obtain cleaner echo data [19]. The pulse repetition frequency (PRF) in the Doppler domain is 3 Hz. To remove the rotor interference as much as possible, the cut-off frequency of the lateral Doppler filter needs to be slightly higher than the PRF in the Doppler domain. Then, the gain processing technique is used to increase the amplitude of weak echo from the target in deep position.
Thirdly, a calibration method is introduced through the measured radar data in two kinds of mediums to estimate the dielectric constant. Both simulations and experiments are conducted in 150 MHz–309 MHz band. The simulations were performed on the gprMax v.3.0.0 platform [20]. To illustrate the principle of UAV rotor interference, we carried out the comparative tests on an empty lawn and analyzed the source of interference. Furthermore, one floor experiment was conducted to verify the penetrability of the radar module. The simulated and experimental data was processed by the mean subtraction method, the moving average method, and the proposed method. Both the simulations and experiments have shown the effectiveness of the proposed method, and the performance of our UAV-GPR system for target detection is also proven.
This paper is organized as follows. The UAV-GPR system is introduced in Section 2. In Section 3, the detailed signal processing method is described. In Section 4, a calibration method of measured radar data is introduced to estimate the dielectric constant. In Section 5, the simulations and experiments are performed to demonstrate the effectiveness of the proposed method and the performance of our system. Finally, a conclusion is drawn in Section 6.
2. UAV-Mounted GPR System
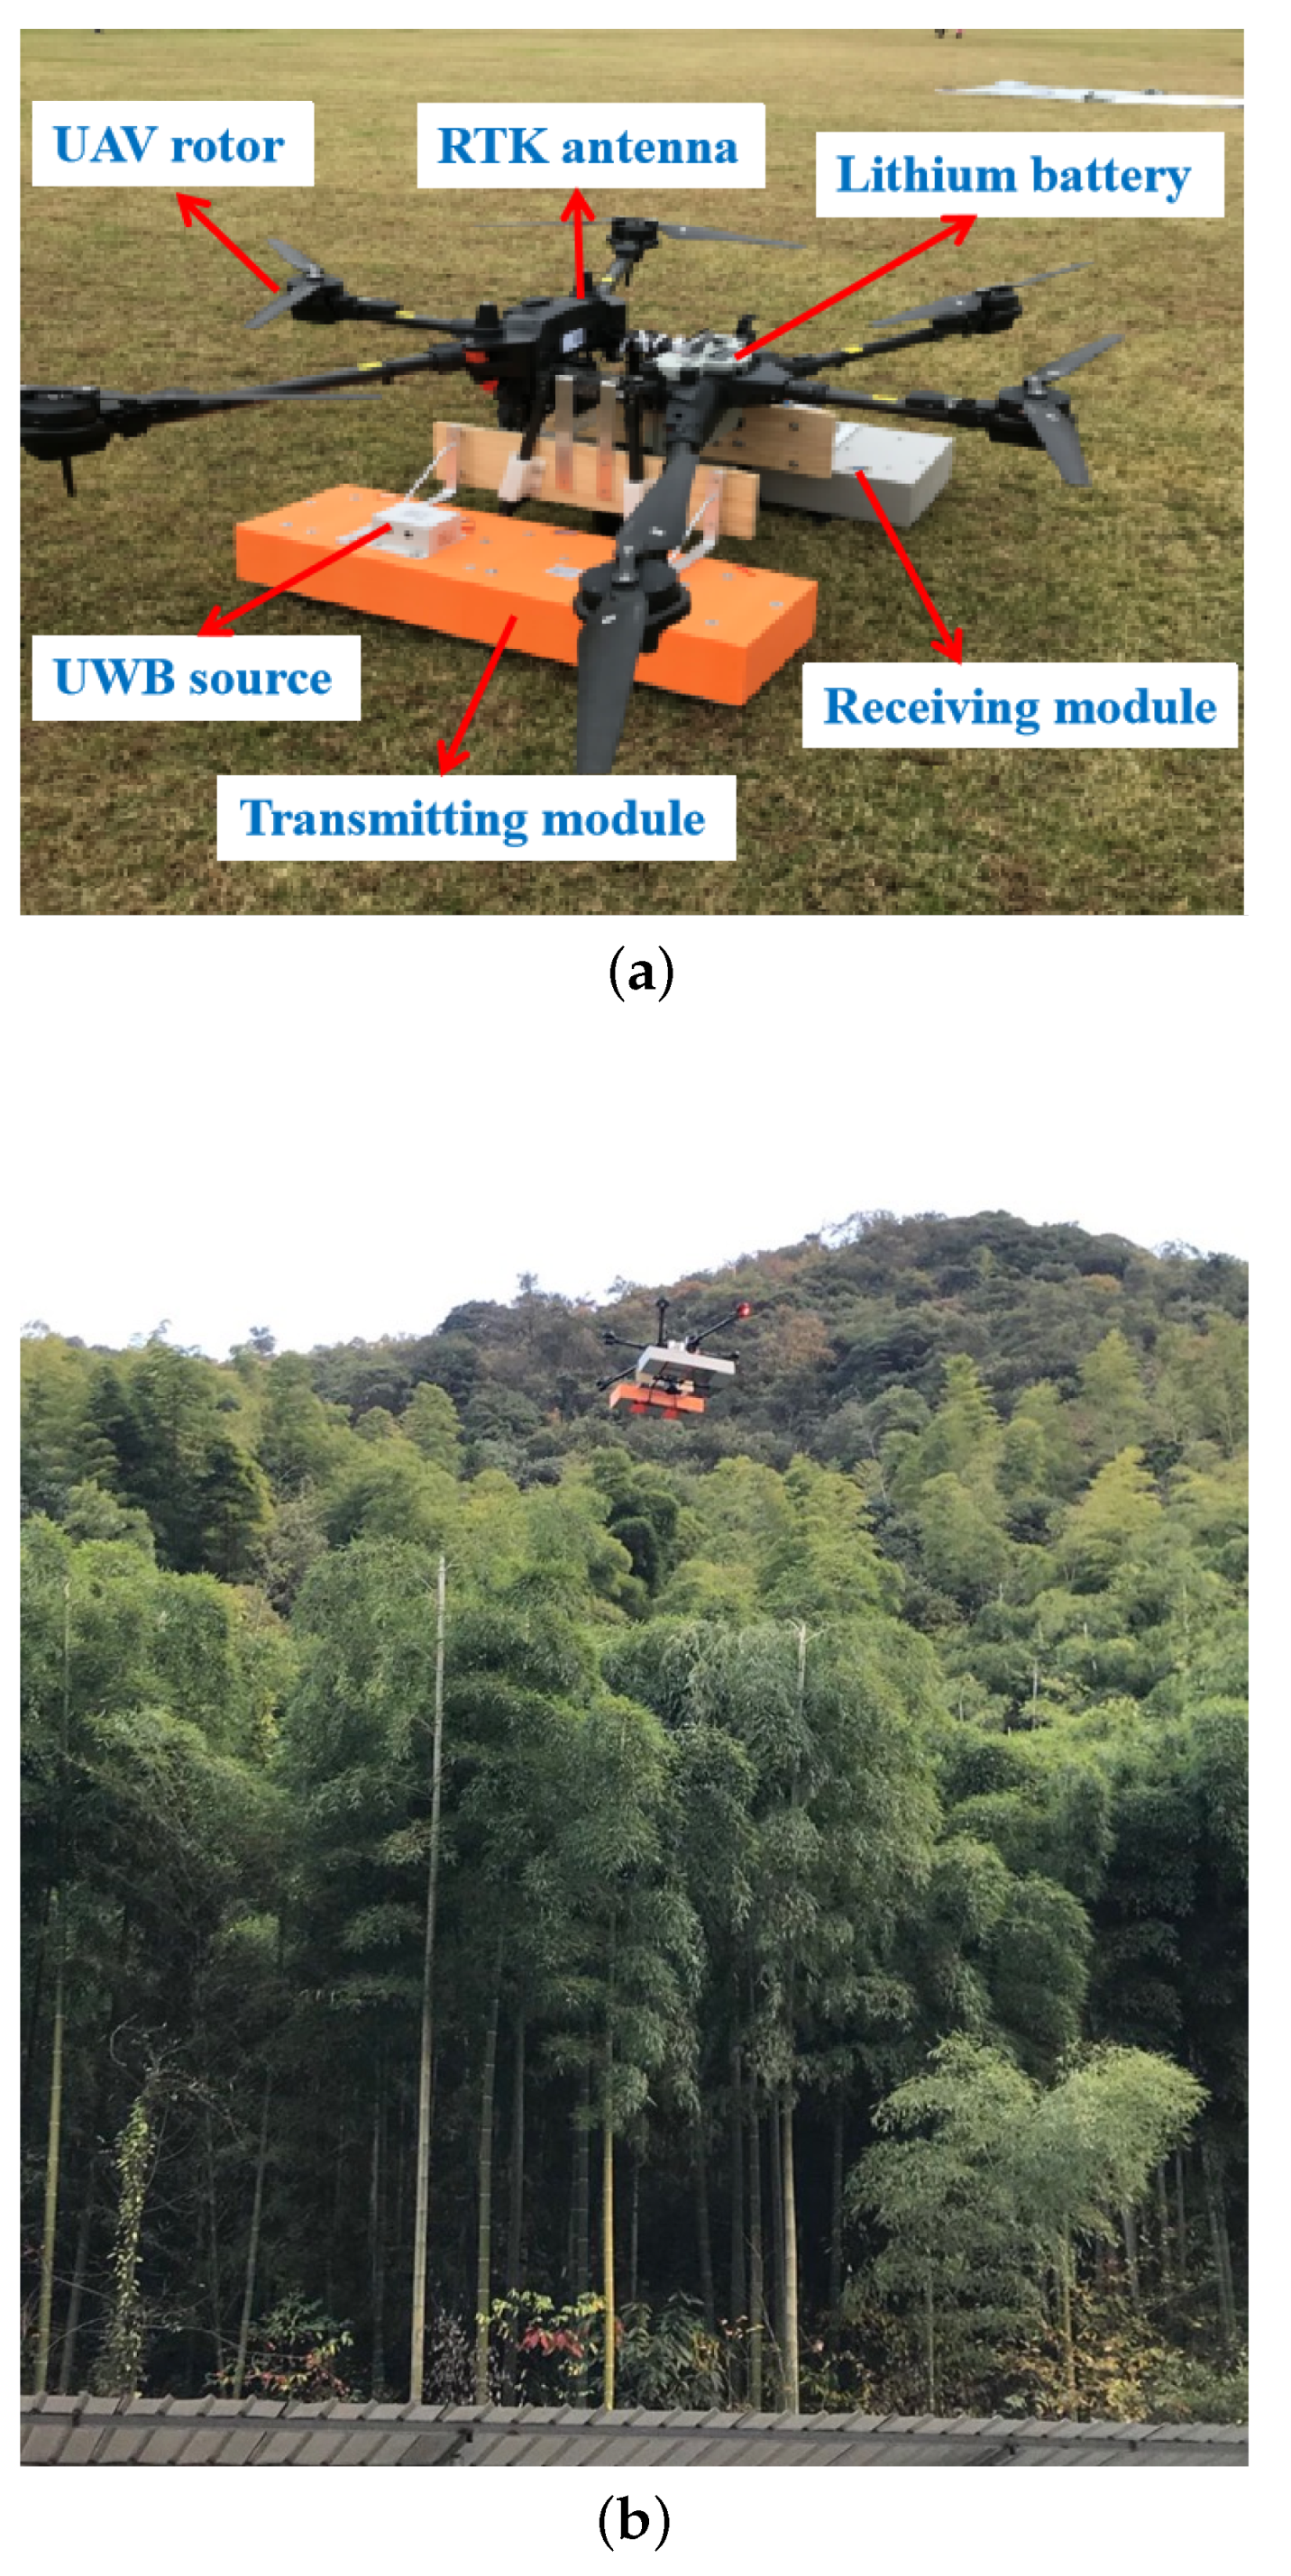
The UAV-mounted GPR system contains four modules: a UAV platform, radar transceiver module, data acquisition module, and signal processing module, as shown in Figure 1. The UAV platform is a modified DJI T20 drone with six high-speed rotors and RTK antenna, which can carry a payload up to 30 kg and fly at the speeds of 30 km/h. The radar transceiver module includes the transmitting module and receiving module. The transmitting module is composed of a narrowband pulse signal generator and the antennas. The pulse repetition frequency (PRF) of the radar system in the longitudinal time domain is 20 GHz. Both the transmitting and receiving modules contain three ultra-wideband VHF band antennas, and its purpose is to increase the power of the signal and improve the penetration ability. The frequency band of the pulse is 150 MHz–309 MHz. The data acquisition module is composed of a microcomputer, a WiFi router, a remote-controlled minicomputer, and a data collector equipped with a high-speed acquisition program. The signal processing and image display modules mainly aim at removing the background signal, low-frequency active electromagnetic interference, and the rotor interference of UAV. The purpose is to show an underground map including the detected target clearly and to cut down the false alarm rate.
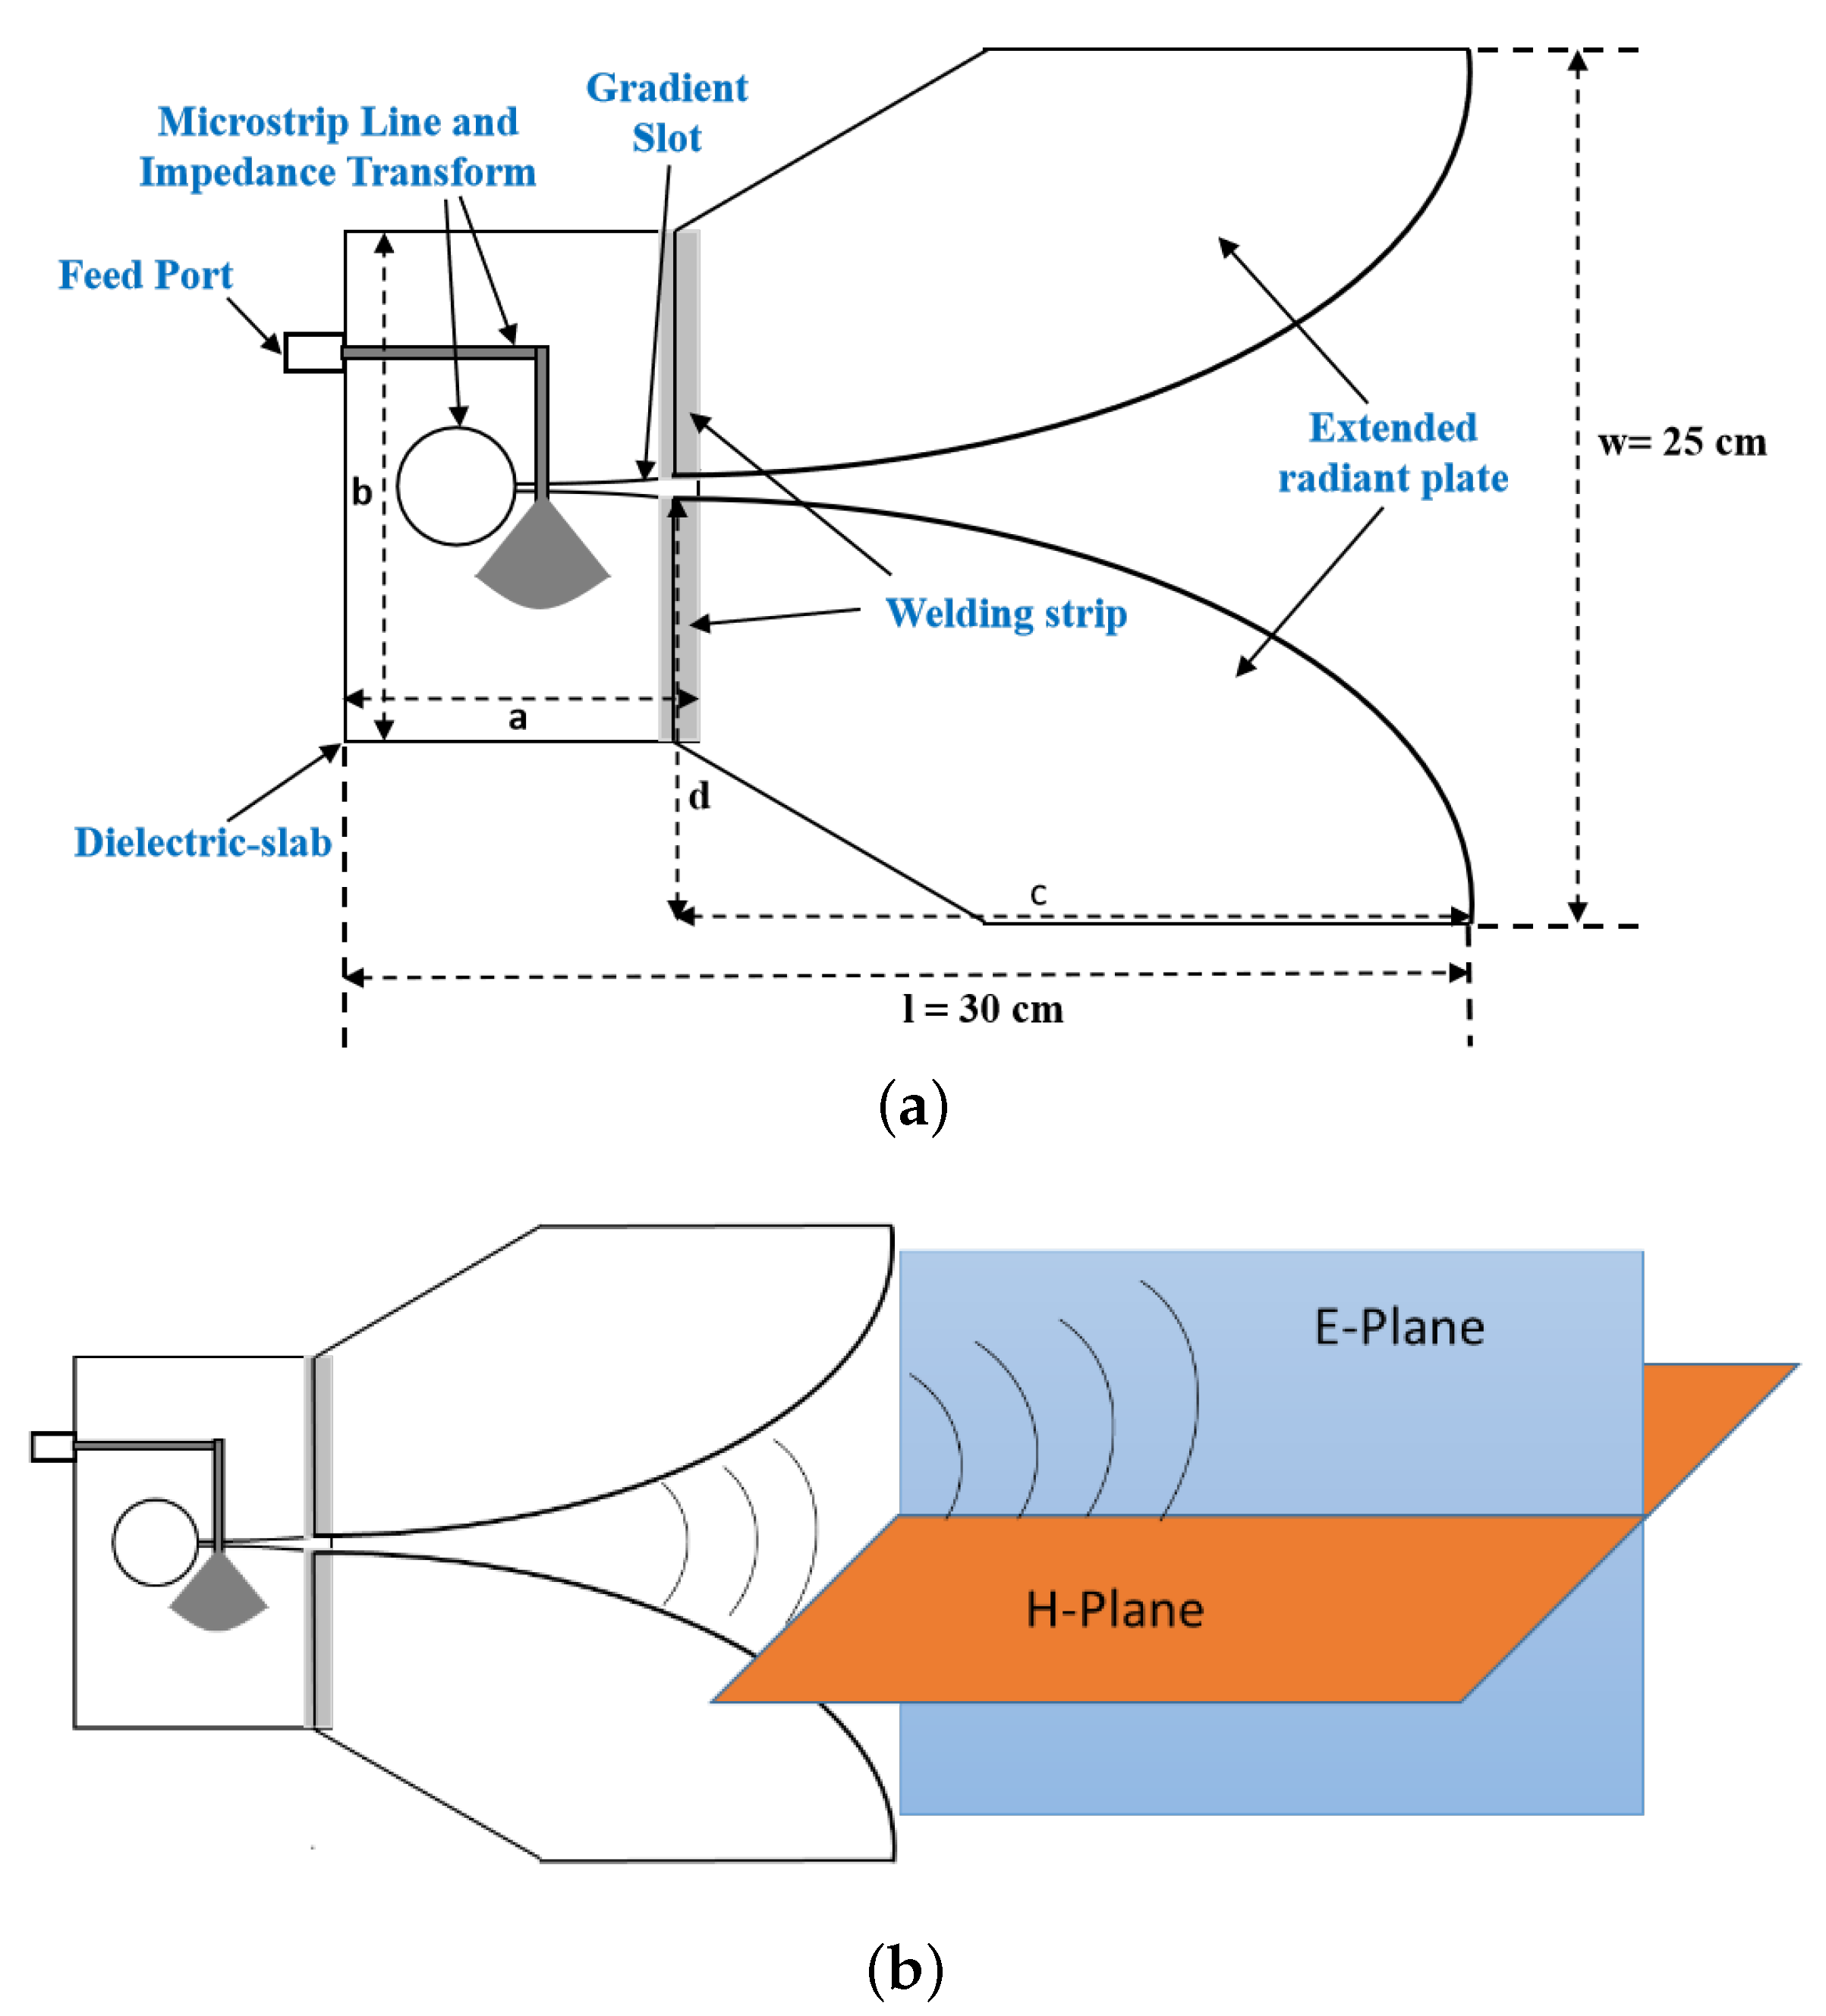
Considering factors of size, gravity, and bandwidth, we chose the ultra-wideband Vivaldi antenna for better penetration. The Vivaldi antenna radiates electromagnetic waves of different frequencies through a tapered line structure, which is a kind of tapered slot antenna. A narrow slot radiates high-frequency components, and a wide slot radiates low-frequency components. The structure of the antenna is shown in Figure 2a, with the total length of 30 cm and the total width of 25 cm. Specifically, the length and width of the dielectric slab are 10 cm and 6 cm, and the long and short sides of the extended radiation plate are 24 cm and 12.5 cm. The feeding network is implemented with a balun which transforms the unbalanced signal from the coaxial cable to a balanced signal at the beginning of the flares. It is based on a tapered microstrip line from 50 to 100 , followed by another 100 line which leads to a radial stub. The microstrip-to-slot transition is formed by the radial stub and a circular cavity. The Vivaldi antenna is a single-polarized antenna. The electric field plane is parallel to the antenna plane, and the magnetic field plane is perpendicular to it. The radiation structure of the antenna is shown in Figure 2b.
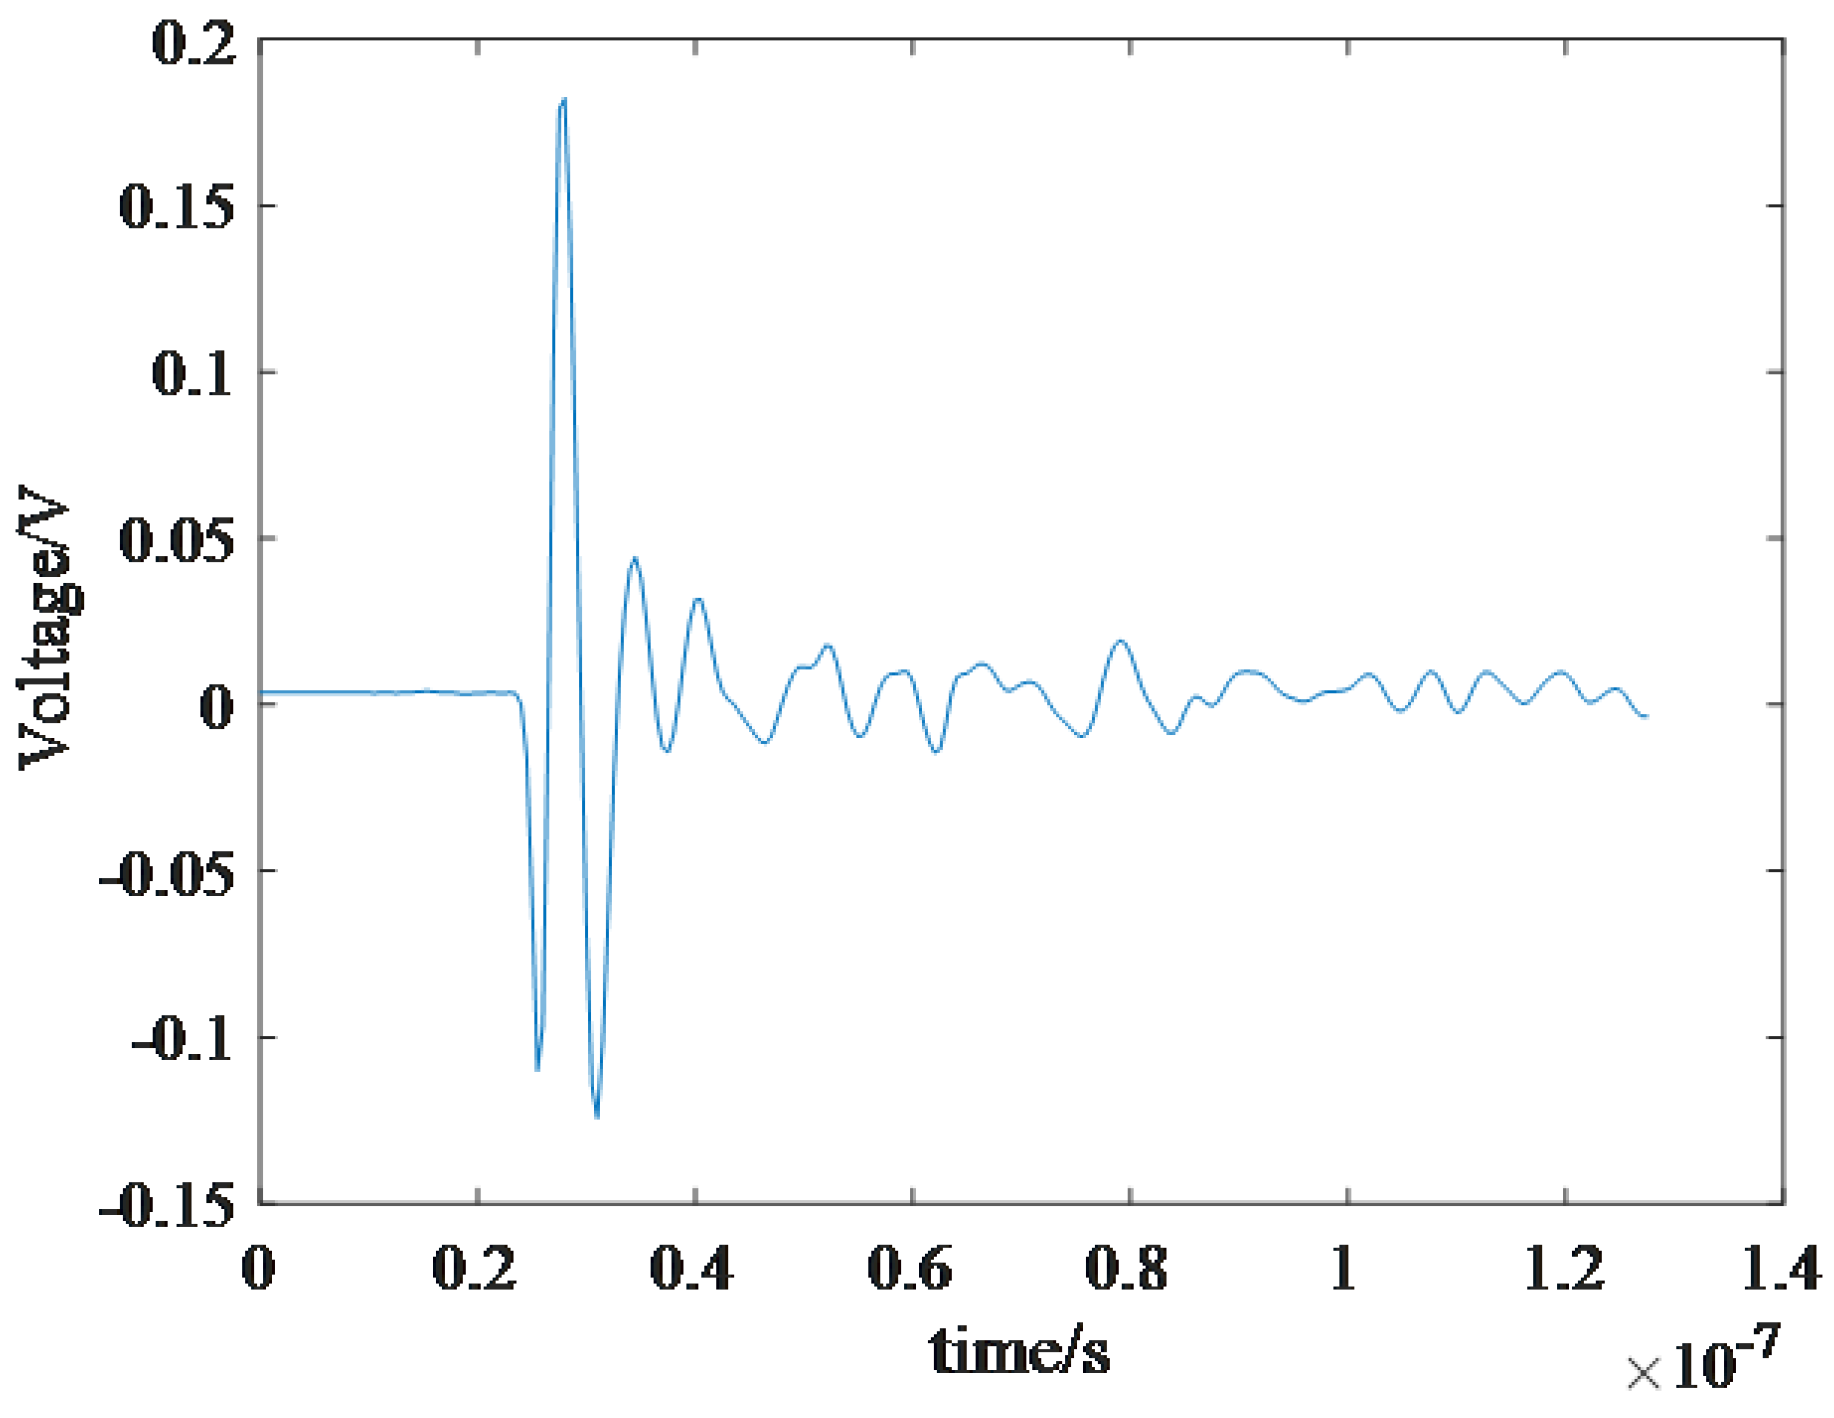
In order to obtain a better resolution and wide band, we use a second-order Gaussian pulse as the transmitted signal. The expression of Gaussian pulse is as follows,
where a is the pulse influence factor, which determines the width of the pulse, and is the amplitude of the pulse, which determines the energy of the pulse. Then, the second-order differential of the Gaussian pulse is calculated to get the second-order Gaussian pulse as follows:
We adopt an avalanche transistor cascade circuit to generate this signal, and the transceiver antenna is used to test the stability of the radiated signal. Here we test a transmitting pulse signal, and the receiving signal is drawn in Figure 3. The signal is consistent with the designed parameters. However, due to the incomplete matching of the antenna and the air and the interference in the environment, the signal has some redundant tails, but this does not affect the test performance of system.
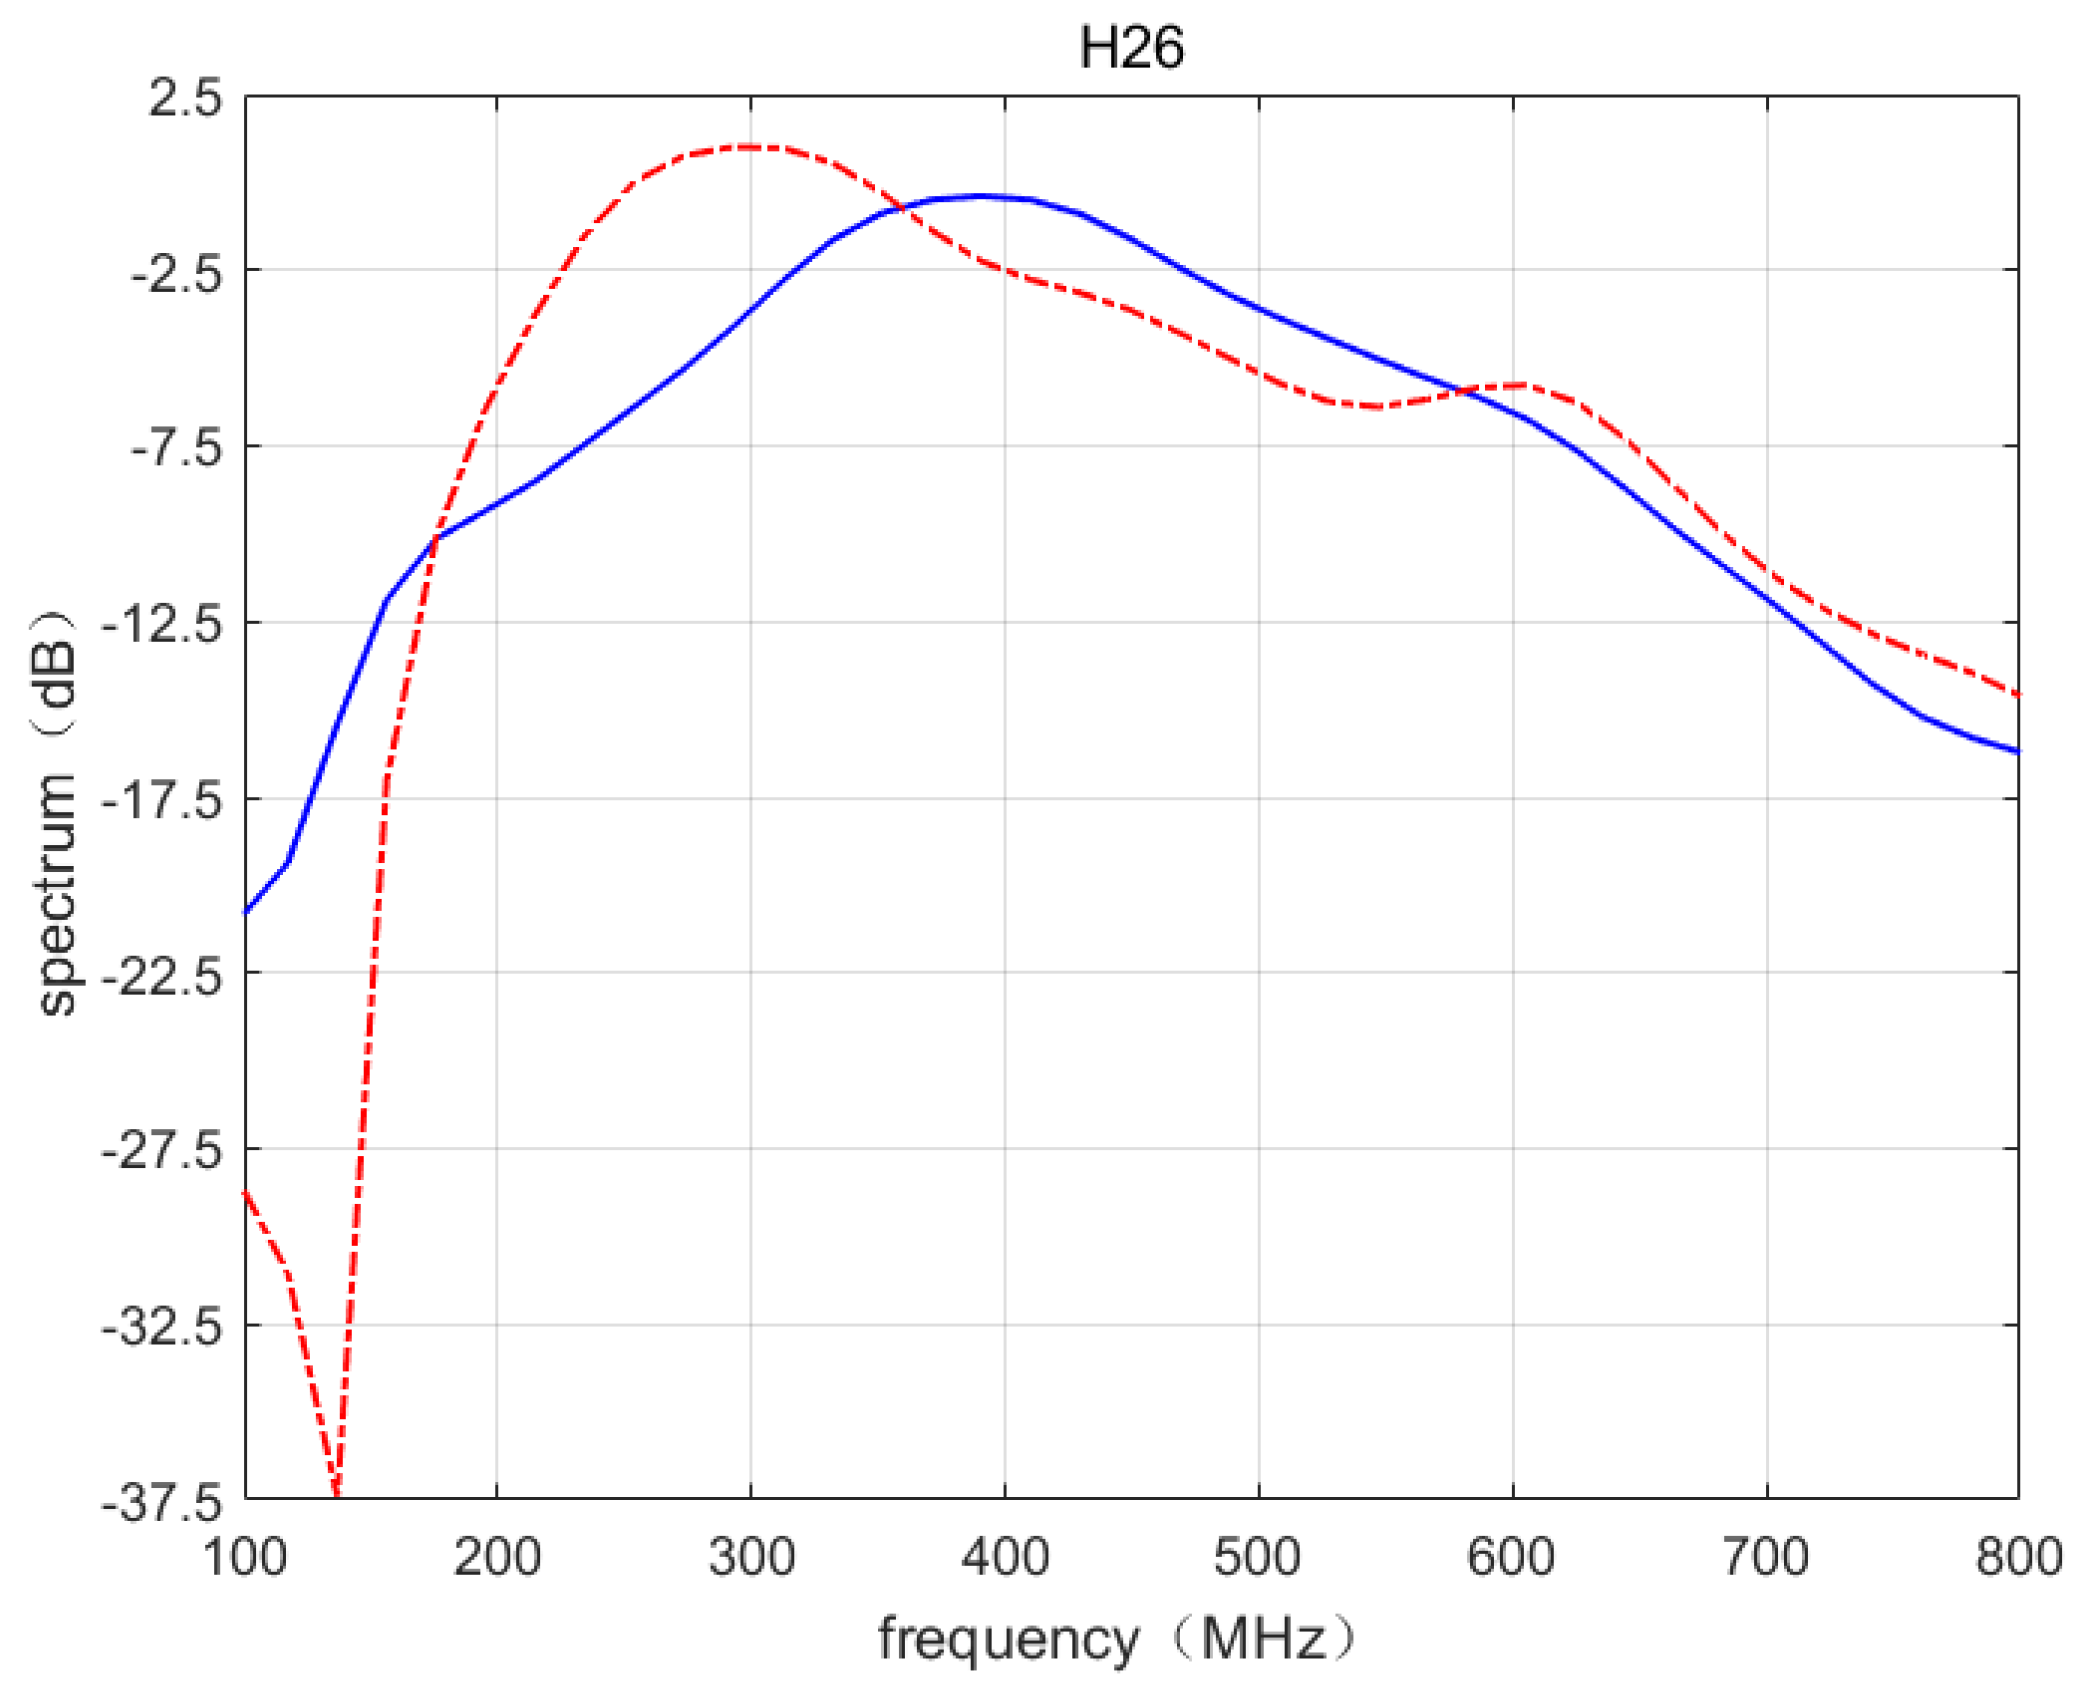
In order to measure the radiation spectrum of the antenna, we conducted the comparative experiments. We measured the frequency spectrum of the transmitted signal directly. Then, some absorbing material is pasted on the back of the antenna, and the received signal is tested. The test results are shown in Figure 4. From the figure, we can see that the bandwidth of the transmitted signal is 159 MHz (from 150 MHz to 309 MHz). The red line represents the spectrum without the absorbing material, and the blue line represents the spectrum after adding the absorbing material on the back of the antenna. It can be seen that the radiation performance of the antenna is good, and can meet the experimental requirements.
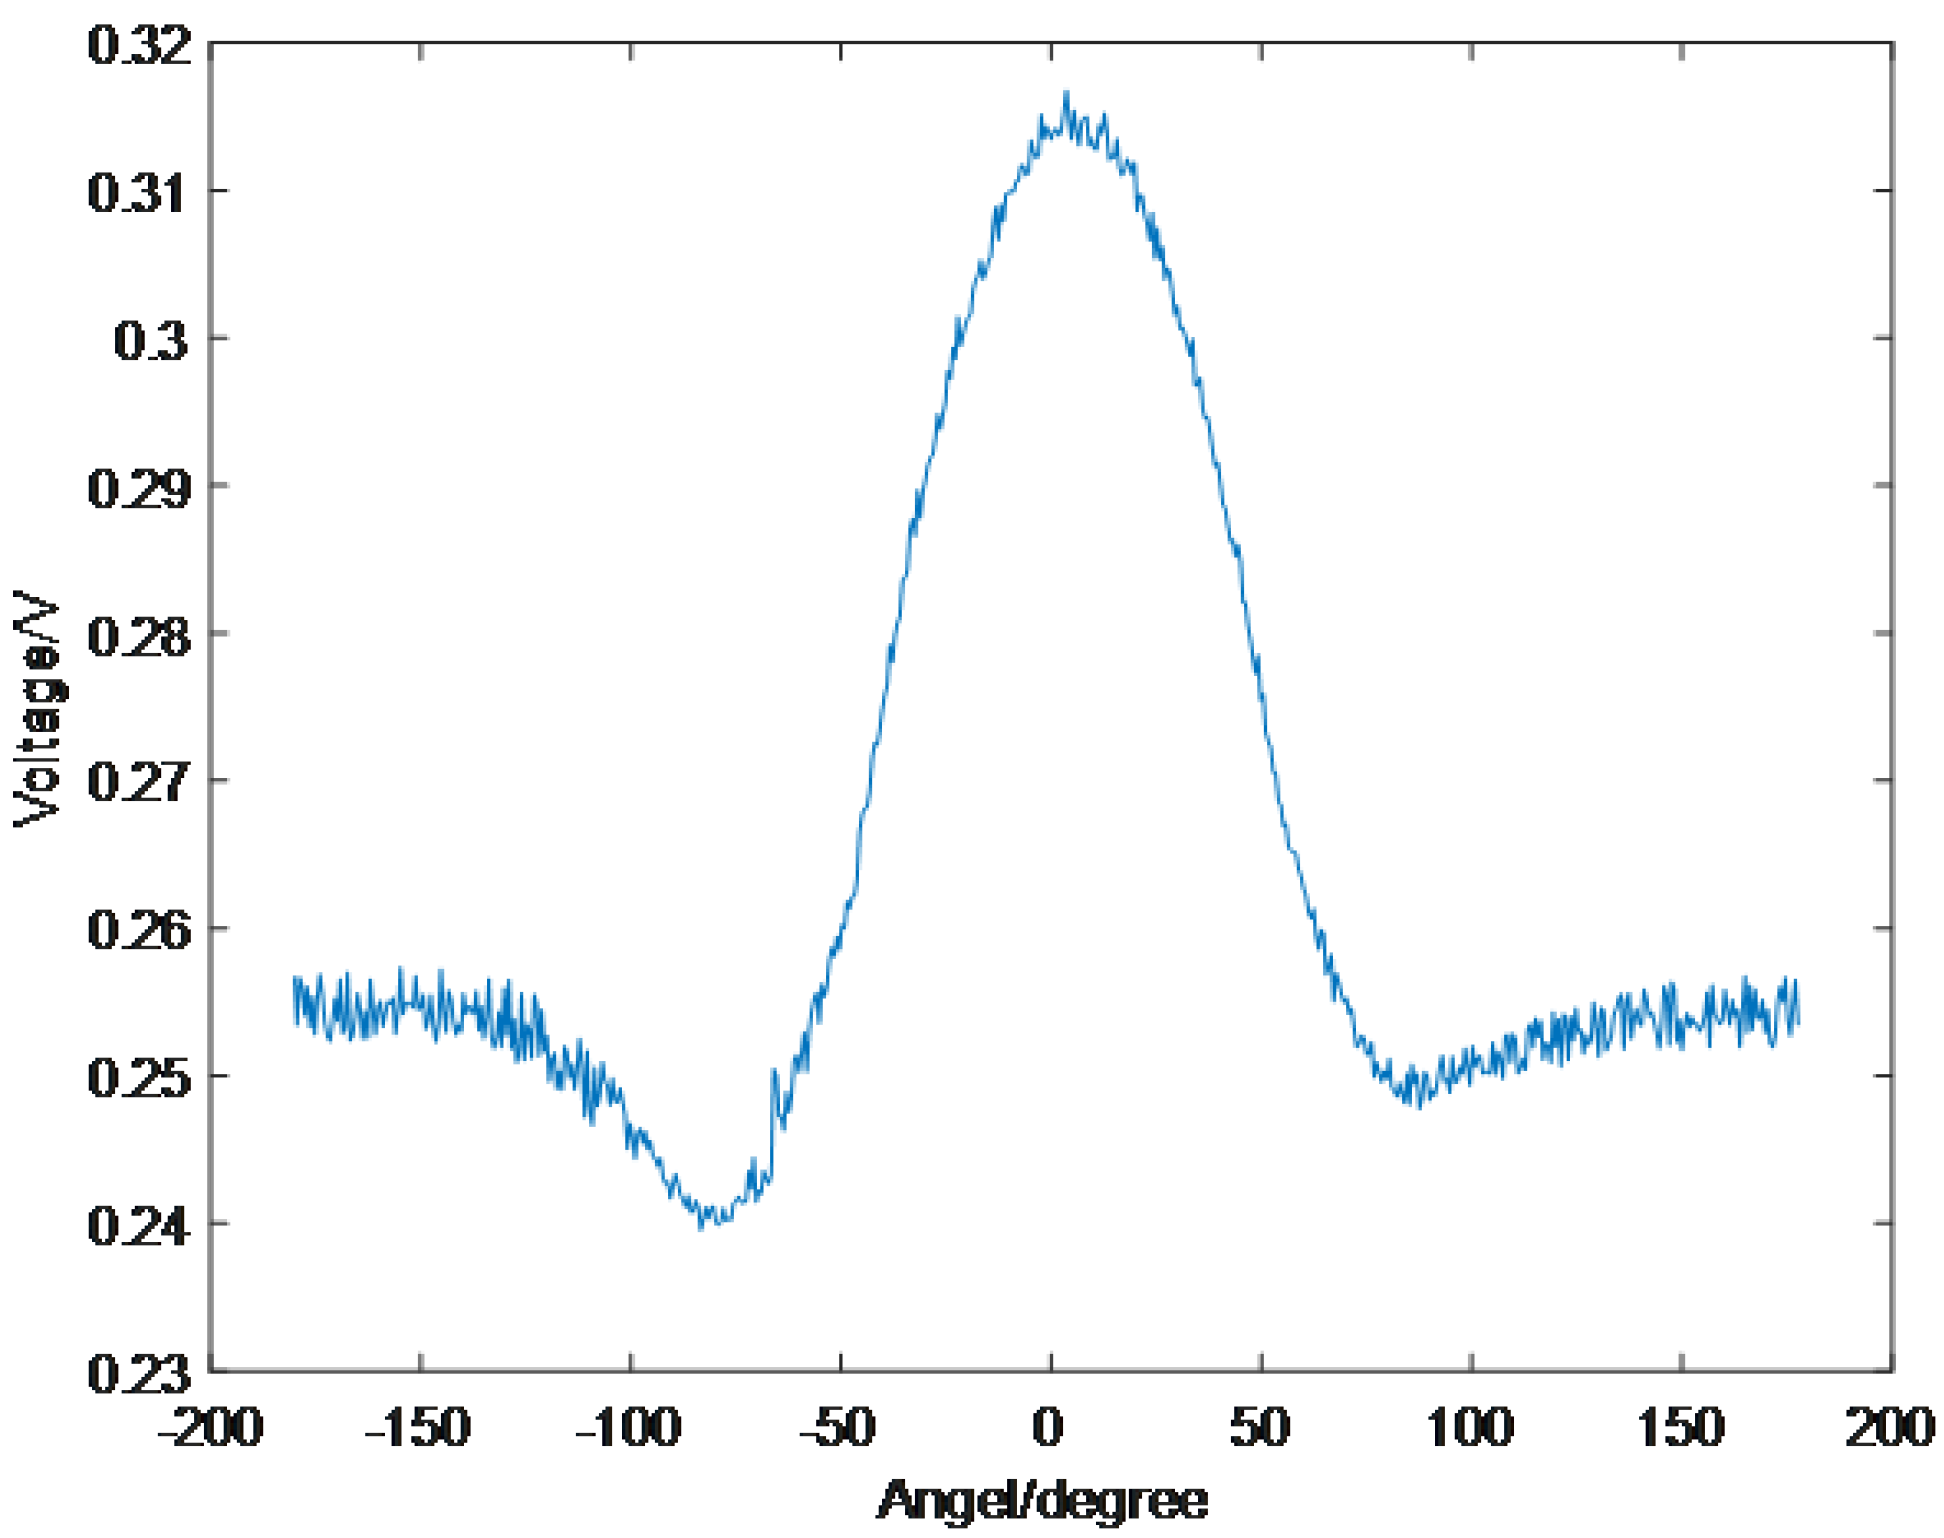
The antenna pattern of UAV-GPR is implemented by testing signal strength in different directions. The main lobe direction of the antenna is , and the radiation characteristics of the antenna are tested in the range of . The test results are shown in Figure 5. It can be seen that the antenna has good directivity and that the main lobe lies in the position of , which has the maximum radiation power.
The UAV-GPR system has characteristics of deep penetration ability, good stability, small size, light weight, etc. Moreover, the transmitting module, receiving module, data collector and microcomputer are integrated with polylactic acid (PLA) materials printed by 3-D printer, which are portable for the system integration. It can be seen that the penetrability and the requirements of system miniaturization are both considered.
3. Signal Processing Method
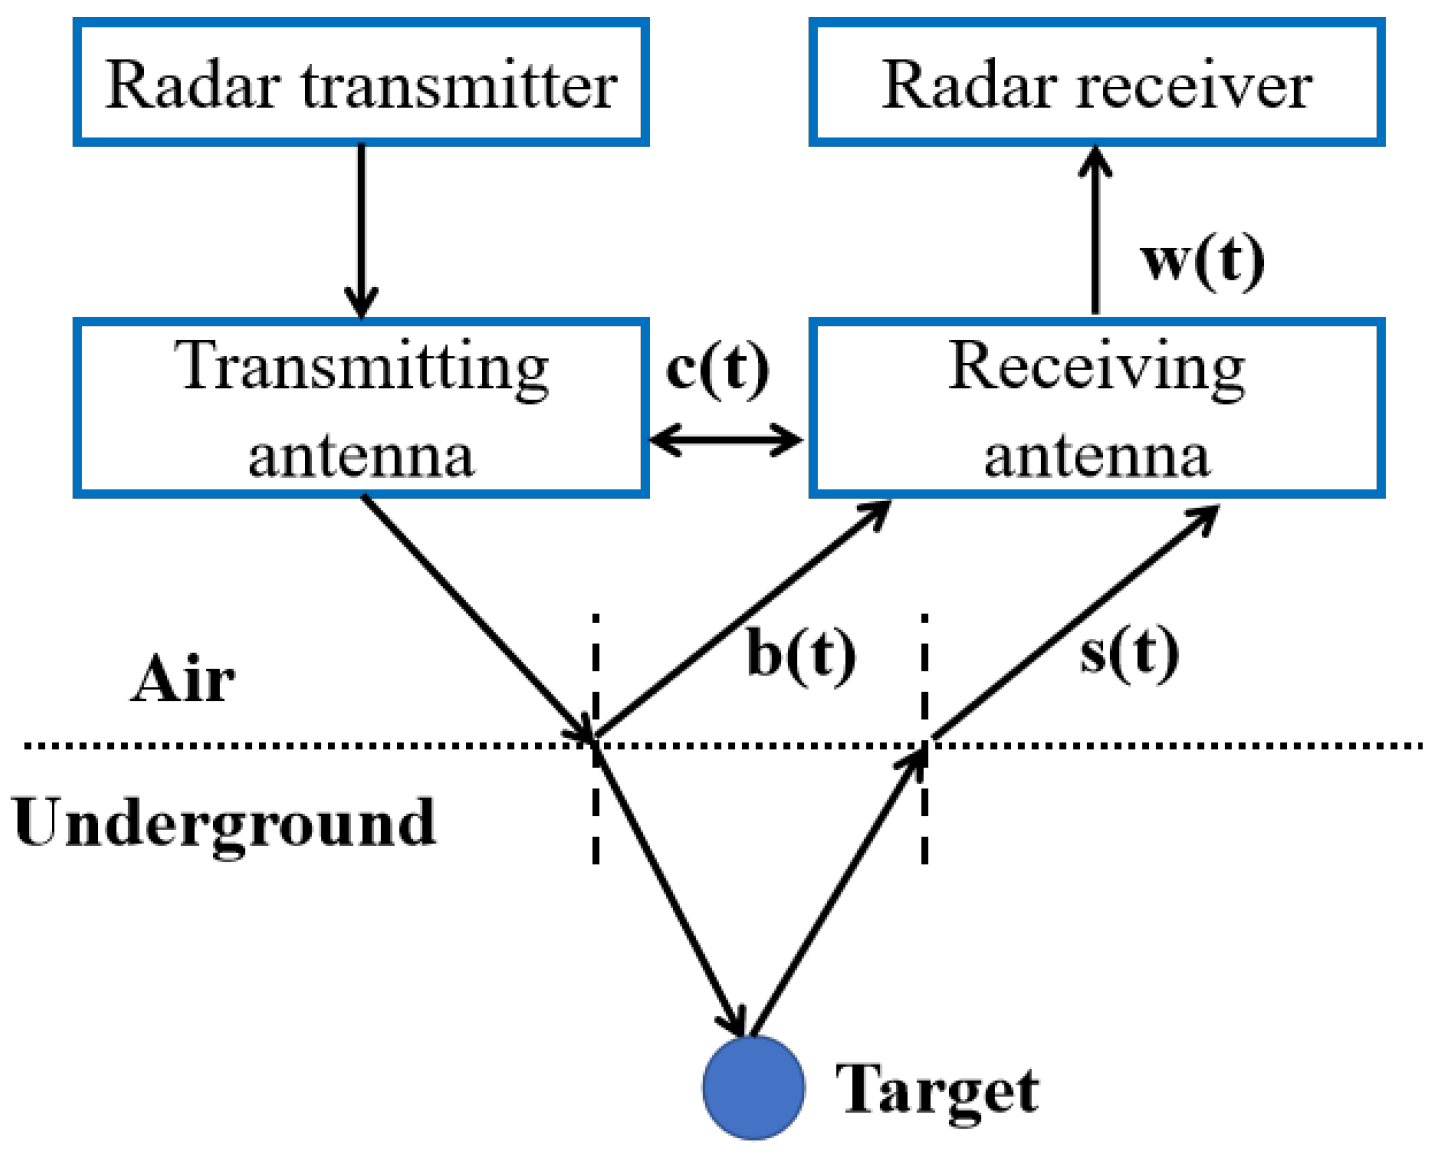
The schematic diagram of the UAV-GPR system is shown as Figure 6. The transmitting antenna transmits the narrow pulse signal underground constantly, and the sampling rate of the pulse is 2 GHz. When the permittivity or conductivity are discontinuous, the pulse signal would be strongly reflected by the interfaces of different medium. The received echo has a delay relative to the transmitted signal, which can be applied to calculate the information of the target depth by combining the dielectric constant. A single radar echo received in height dimension is usually referred to as the A−Scan, which is mainly composed of direct coupled wave between transmitter and receiver , direct reflected wave from the ground , the echo of the underground target , and the noise in the environment . Thus, the total expression of the received echo can be written as
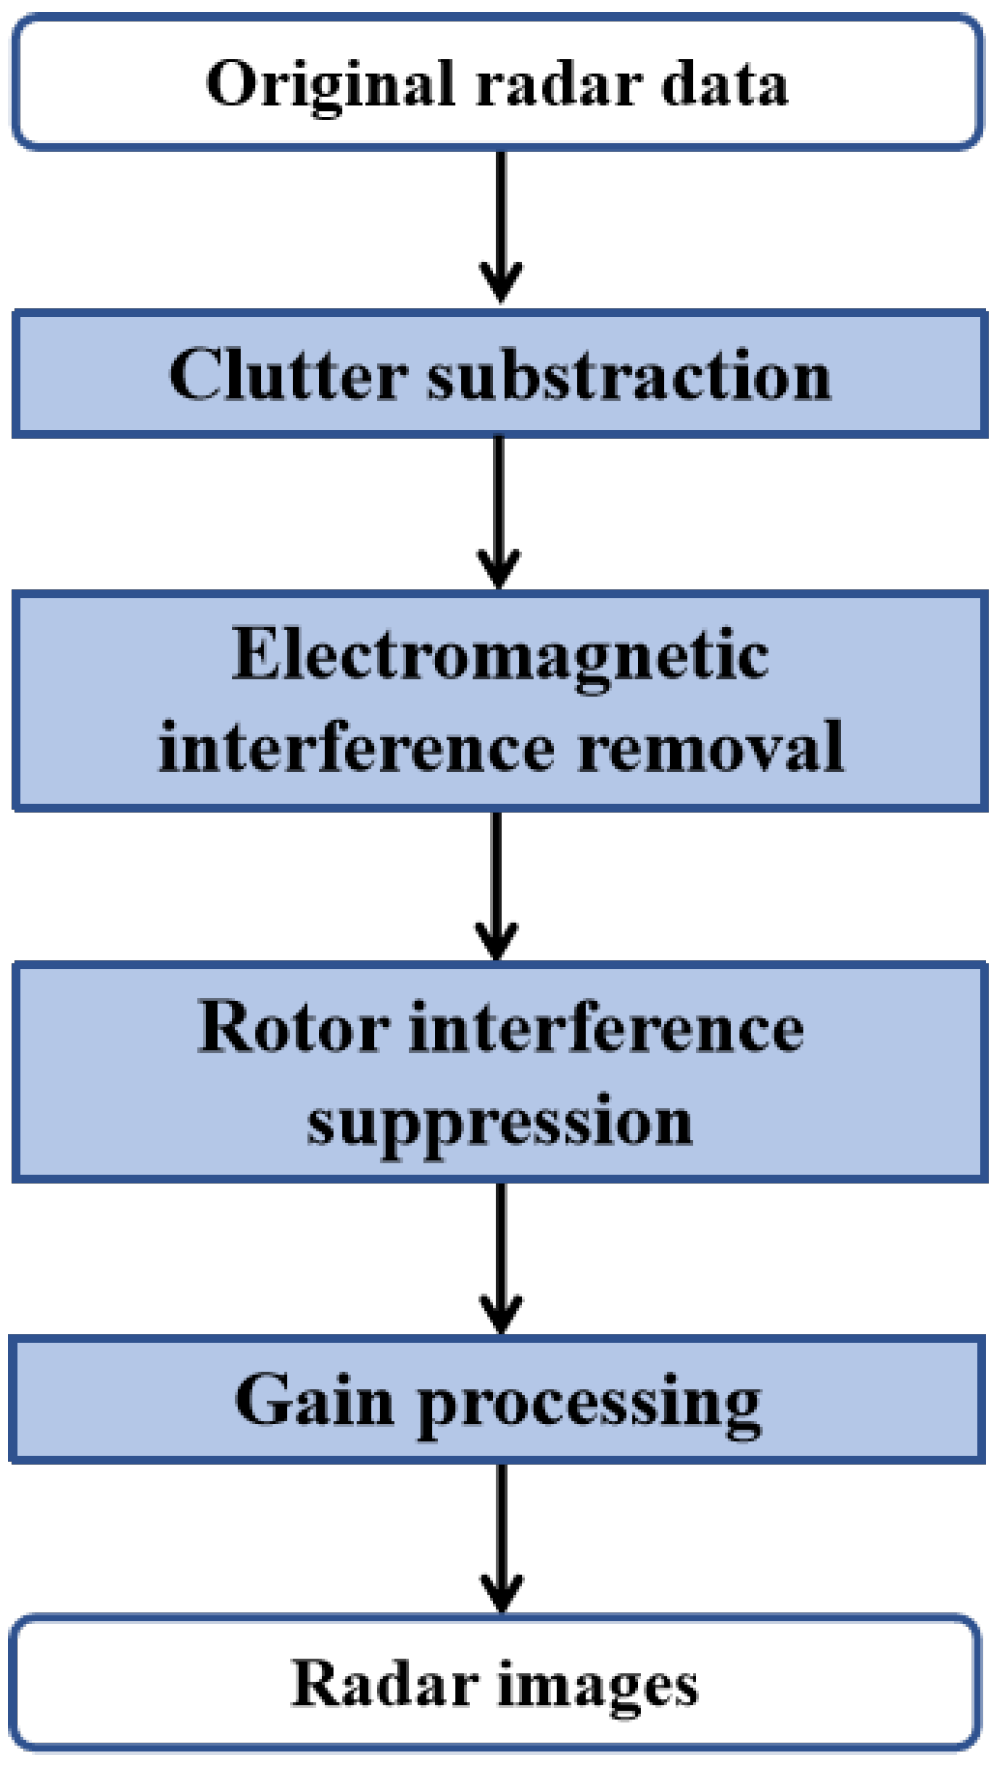
The signal processing step is pivotal for the UAV-GPR data interpretation. As the depth increases, the energy of radar echo will be attenuated in the medium rapidly and then the amplitude of target echo is smaller than that of background signal or interference. Consequently, the motivation of signal processing is to reduce the impact of the background and the interference. In this way, the map of the underground is presented intuitively, and the signal-to-clutter ratio (SCR) of the system can also be improved. In addition, a gain processing technique is adopted to amplify the weak signal for identifying the target located deep underground. The signal processing is extremely important for obtaining the useful information of targets and reducing the false alarm rate, and its diagram is shown in Figure 7.
3.1. Cross-Correlation-Based Background Subtraction Method
For the background signal removal, there are several classical methods; for instance, mean subtraction method [21], moving average background removal method [9,22], SVD-based background removal method [23], the wavelet-based method [24], and so on. Among them, the mean subtraction method is one of the prevalent methods. Assume that the number of samples in one A−Scan is M, B indexes the raw radar echo composed of N A−Scans, and indexes the processed echo after background subtraction, and we have
where i is the index of A−Scan in the azimuth dimension, and j is the index of samples in the height dimension.
The essence of the mean subtraction method is that each A−Scan echo is subtracted by the mean signal of all A-Scan echoes in the azimuth dimension. In general, this method can work well when the test terrain is flat and the background changes very little. However, the test environment in practical applications may be complex or constantly changing. In this situation, the echo may be mixed with varying background, and the mean subtraction method may not suppress the background signal well. In addition, if a reference wave is subtracted by each A−Scan separately, the background can be removed to some extent, but the additional signal will be brought in when the background in the air changes. Therefore, we propose a new cross-correlation-based background subtraction (CCBS) method to alleviate this problem by considering the mean signal and a reference wave simultaneously. The proposed method includes three steps. First, a reference wave is defined as the single A-Scan echo when there is no target underground, denoted as . Secondly, the similarity of each A-Scan and the reference wave is obtained by calculating the cross-correlation coefficient, which is expressed as follows,
where indexes an A−Scan echo in the azimuth dimension, t is the sampling time, and is the intermediate variable. The values of range from 0 to 1. Then, to highlight the differences of echoes, a weighting factor is introduced through the Gaussian function, as shown below:
To make sure that the weighting factor H increases with the increasing of X, the value of is set to 1. The parameter determines the rate of increase; here, is set as 0.5. Finally, a background subtraction model is proposed by weighting the reference wave and the mean of signals in the azimuth dimension. The weighting factors are H and , respectively, and the processed echo is expressed as
When the cross-correlation coefficient of an A−Scan echo and the reference wave H is close to 1, i.e., the echo is similar to the reference wave, we take H as the weighting factor for the reference wave. In this case, the value of H is greater than 1 − H. On the other hand, when the cross-correlation coefficient is close to 0, it indicates that the echo is not similar to the reference wave, so we take 1 − H as the weighting factor of the mean of signals. Here, the value of 1 − H is greater than H. The method takes into account the change of the environment by analyzing the similarity between each received echo and reference wave. By this method, the background signal can mostly be removed.
3.2. Interference Suppression Technique
Our system works at the frequency band from 150 MHz to 309 MHz. If there is a strong electromagnetic interference in the environment, such as that caused by broadcast signals, it is difficult to distinguish the useful echo and interference, and the results may be misjudged. Therefore, we adopted a Butterworth filter to each A−Scan of radar echo after removing the background signal. The frequency band of lower-limit cutoff of the filter is 140–150 MHz, and the upper-limit cutoff of the filter is 310–320 MHz. By this filtering operation, the electromagnetic interference can be basically removed.
Moreover, when the UAV-GPR system is flying, the rotor interference is very serious. As for the source of rotor interference, both the rotor itself and the control motor need to be considered. On the one hand, the high-speed rotation of the rotor can be viewed as a moving target relative to the transceiver module. This regular change of environment may cause the echo in the azimuth dimension to contain non-low-frequency components. On the other hand, the alternating current that controls the motor may generate the magnetic field, which may bring in the extra electromagnetic interference. To explain the interference, we carry out a series of comparative tests, which will be described in the following part.
4. Dielectric Constant Estimation
There are many methods by which to estimate the dielectric constant, such as the Dobson semi-empirical model [25] and the Hallikainen empirical model [26]. Among them, a practical method is the calibration method. This method is based on the GPR-measured data. According to the permittivity of one medium, the reflection coefficient of the medium is obtained, and then the permittivity of the other medium is calculated.
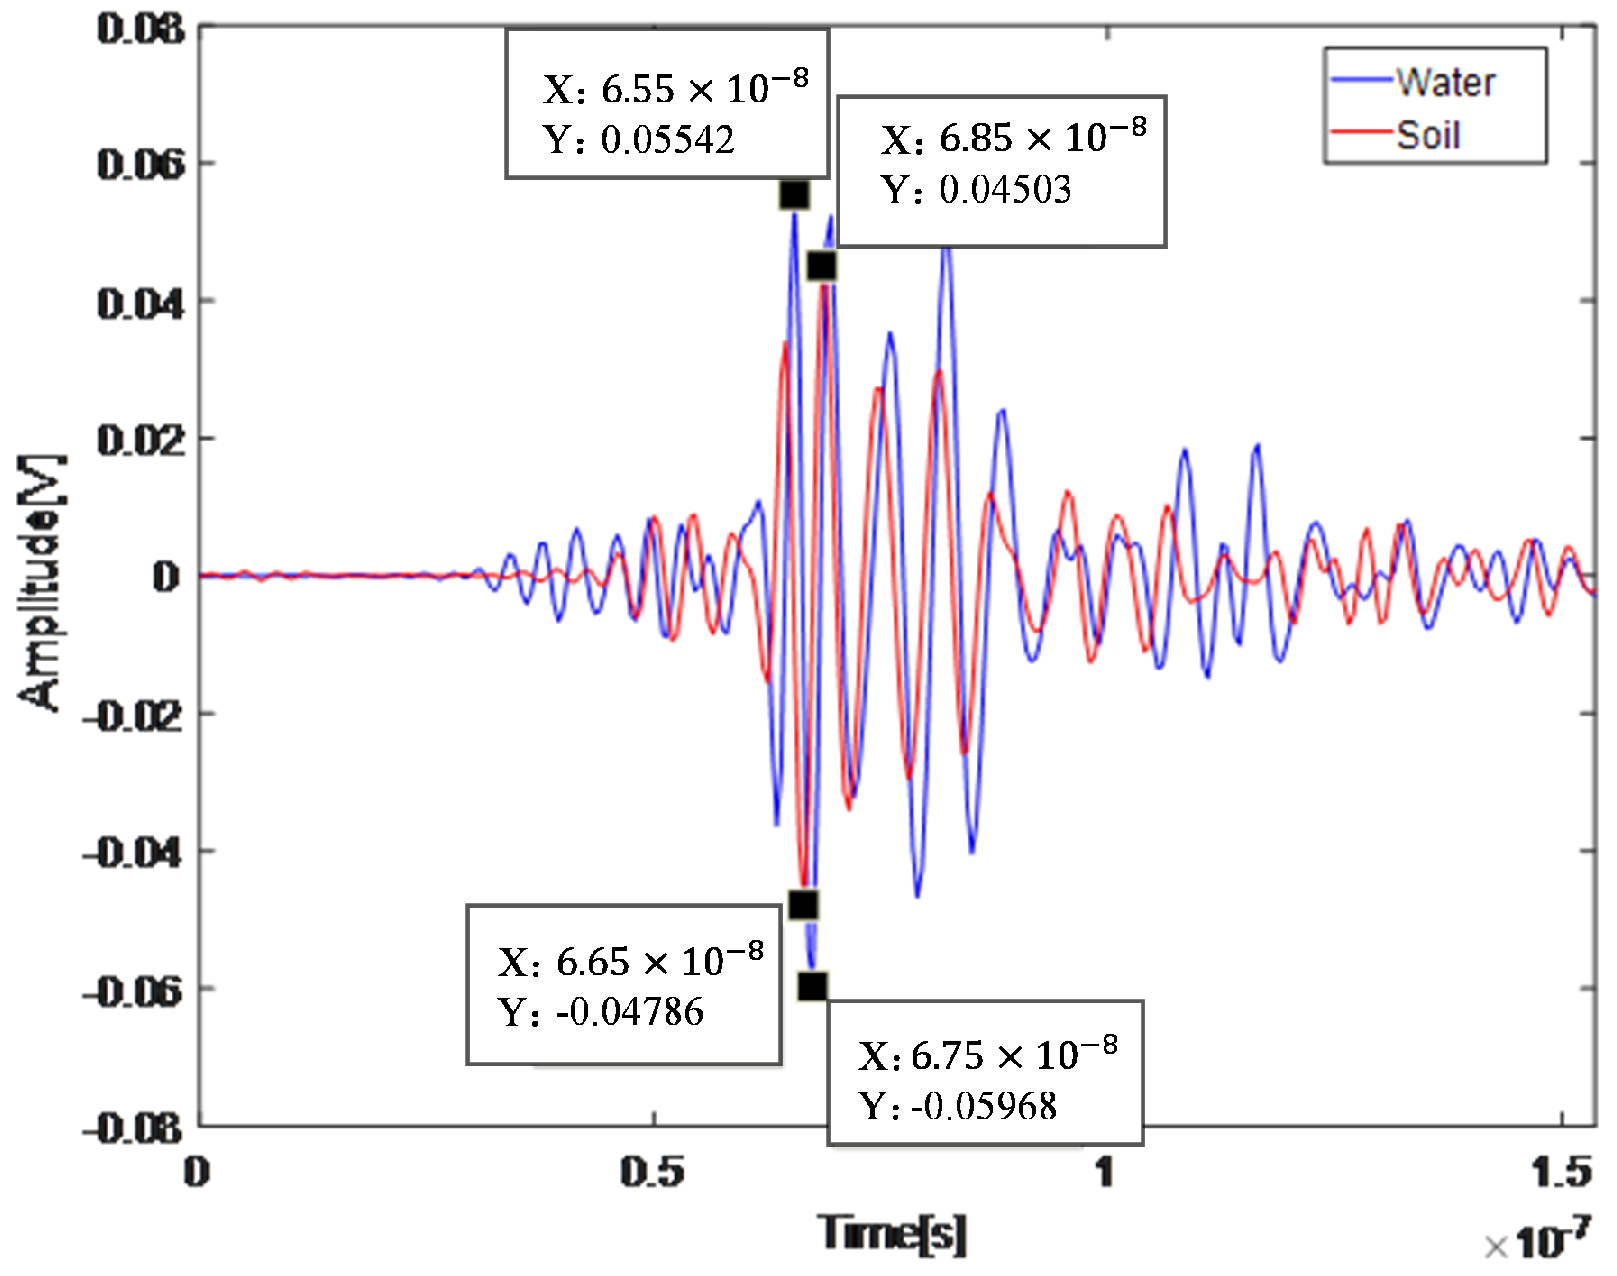
The amplitude of the echo varies greatly at different heights. In the experiment, the echo of two different mediums by the UAV-GPR system at the same height are selected to calculate the dielectric constant. Before calculating the dielectric constant, the obtained radar data need to go through the signal processing step, i.e., background subtraction and interference suppression. The A−Scan of water and soil is shown in Figure 8, and the calculation process is as follows.
The electromagnetic wave generates reflection at the interface of two different mediums, and the reflection coefficient is expressed as
where represents the dielectric constant of the first medium, and represents the dielectric constant of the second medium.
In general, the air is the first medium, whose dielectric constant is 1. Thus, Equation (8) can be rewritten as
The second medium is the other medium. First, we regard water as the calibration medium and receive the radar echo from water surface, and its dielectric constant of water is about 80 [26]. Then, the value of the reflection coefficient can be estimated from the maximum and minimum peaks of the radar echo. Let and index the maximum peak and minimum peak of the echo from water surface, and and index the maximum peak and minimum peak of the ideal echo. Then, the reflection coefficient can be calculated as
where indexes the dielectric constant of water, and are the maximum peak and minimum peak of the echo from water surface, respectively, and indexes the absolute value.
Secondly, we calculated the reflectance coefficient of soil, shown as follows:
Thus, according to Equations (9) and (11), the dielectric constant of soil can be obtained as shown below:
Through the above analysis and calculation, the dielectric constant of the soil is 20.8. In addition, the Dobson semi-empirical model introduces the relationship between the dielectric constant and soil moisture [27]. By our calculation, the measured moisture of the soil is 27%, and the dielectric constant is approximately 21. It can be seen that the value of dielectric constant can be estimated through the calibration method of measured radar data.
5. Simulations and Experiments
5.1. Numerical Simulations
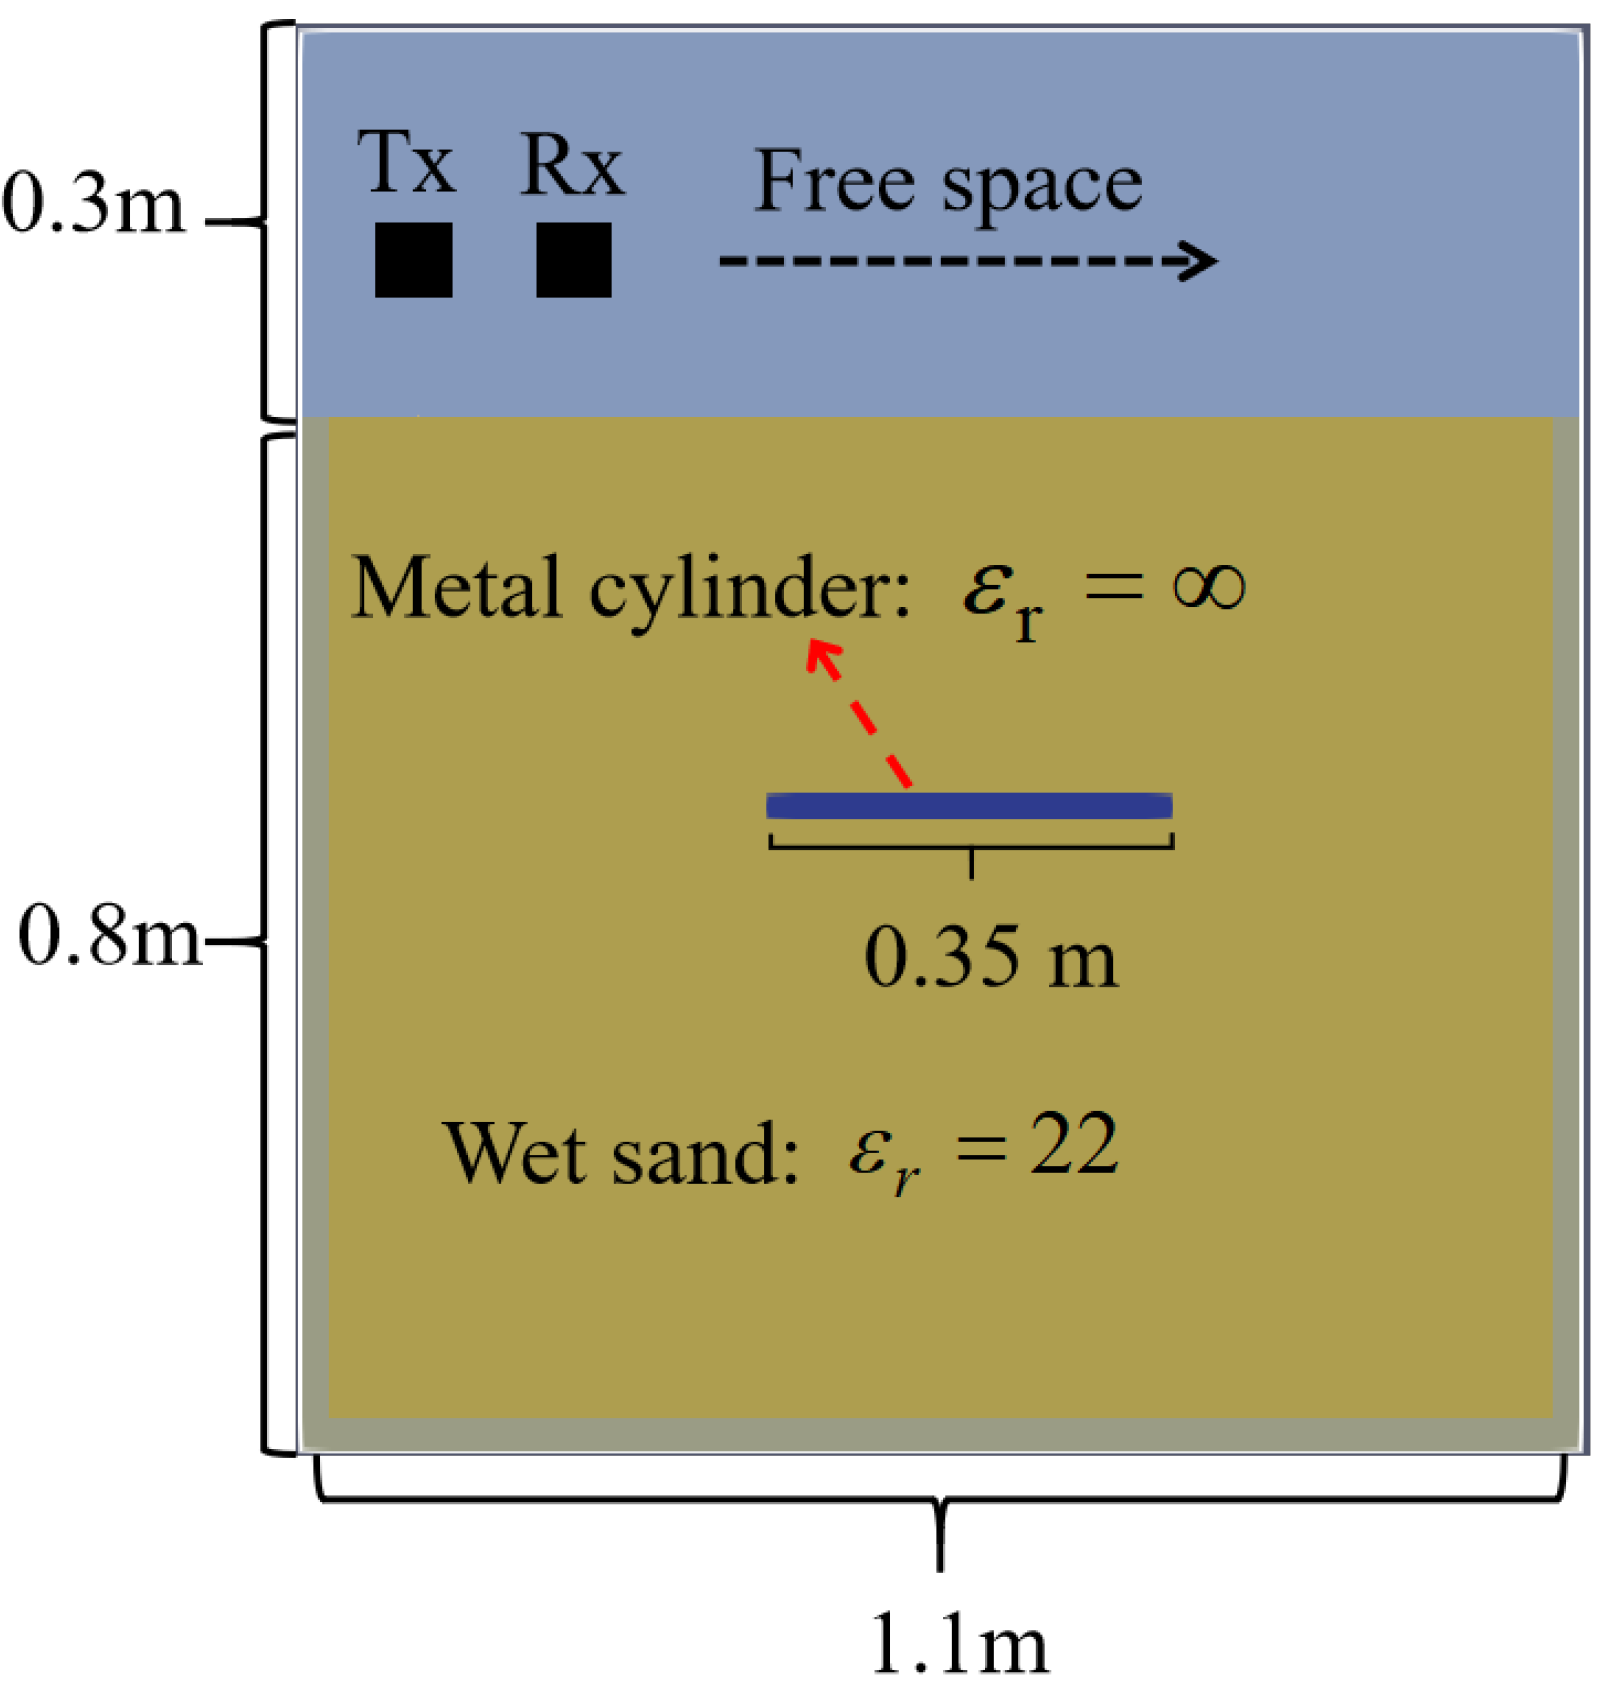
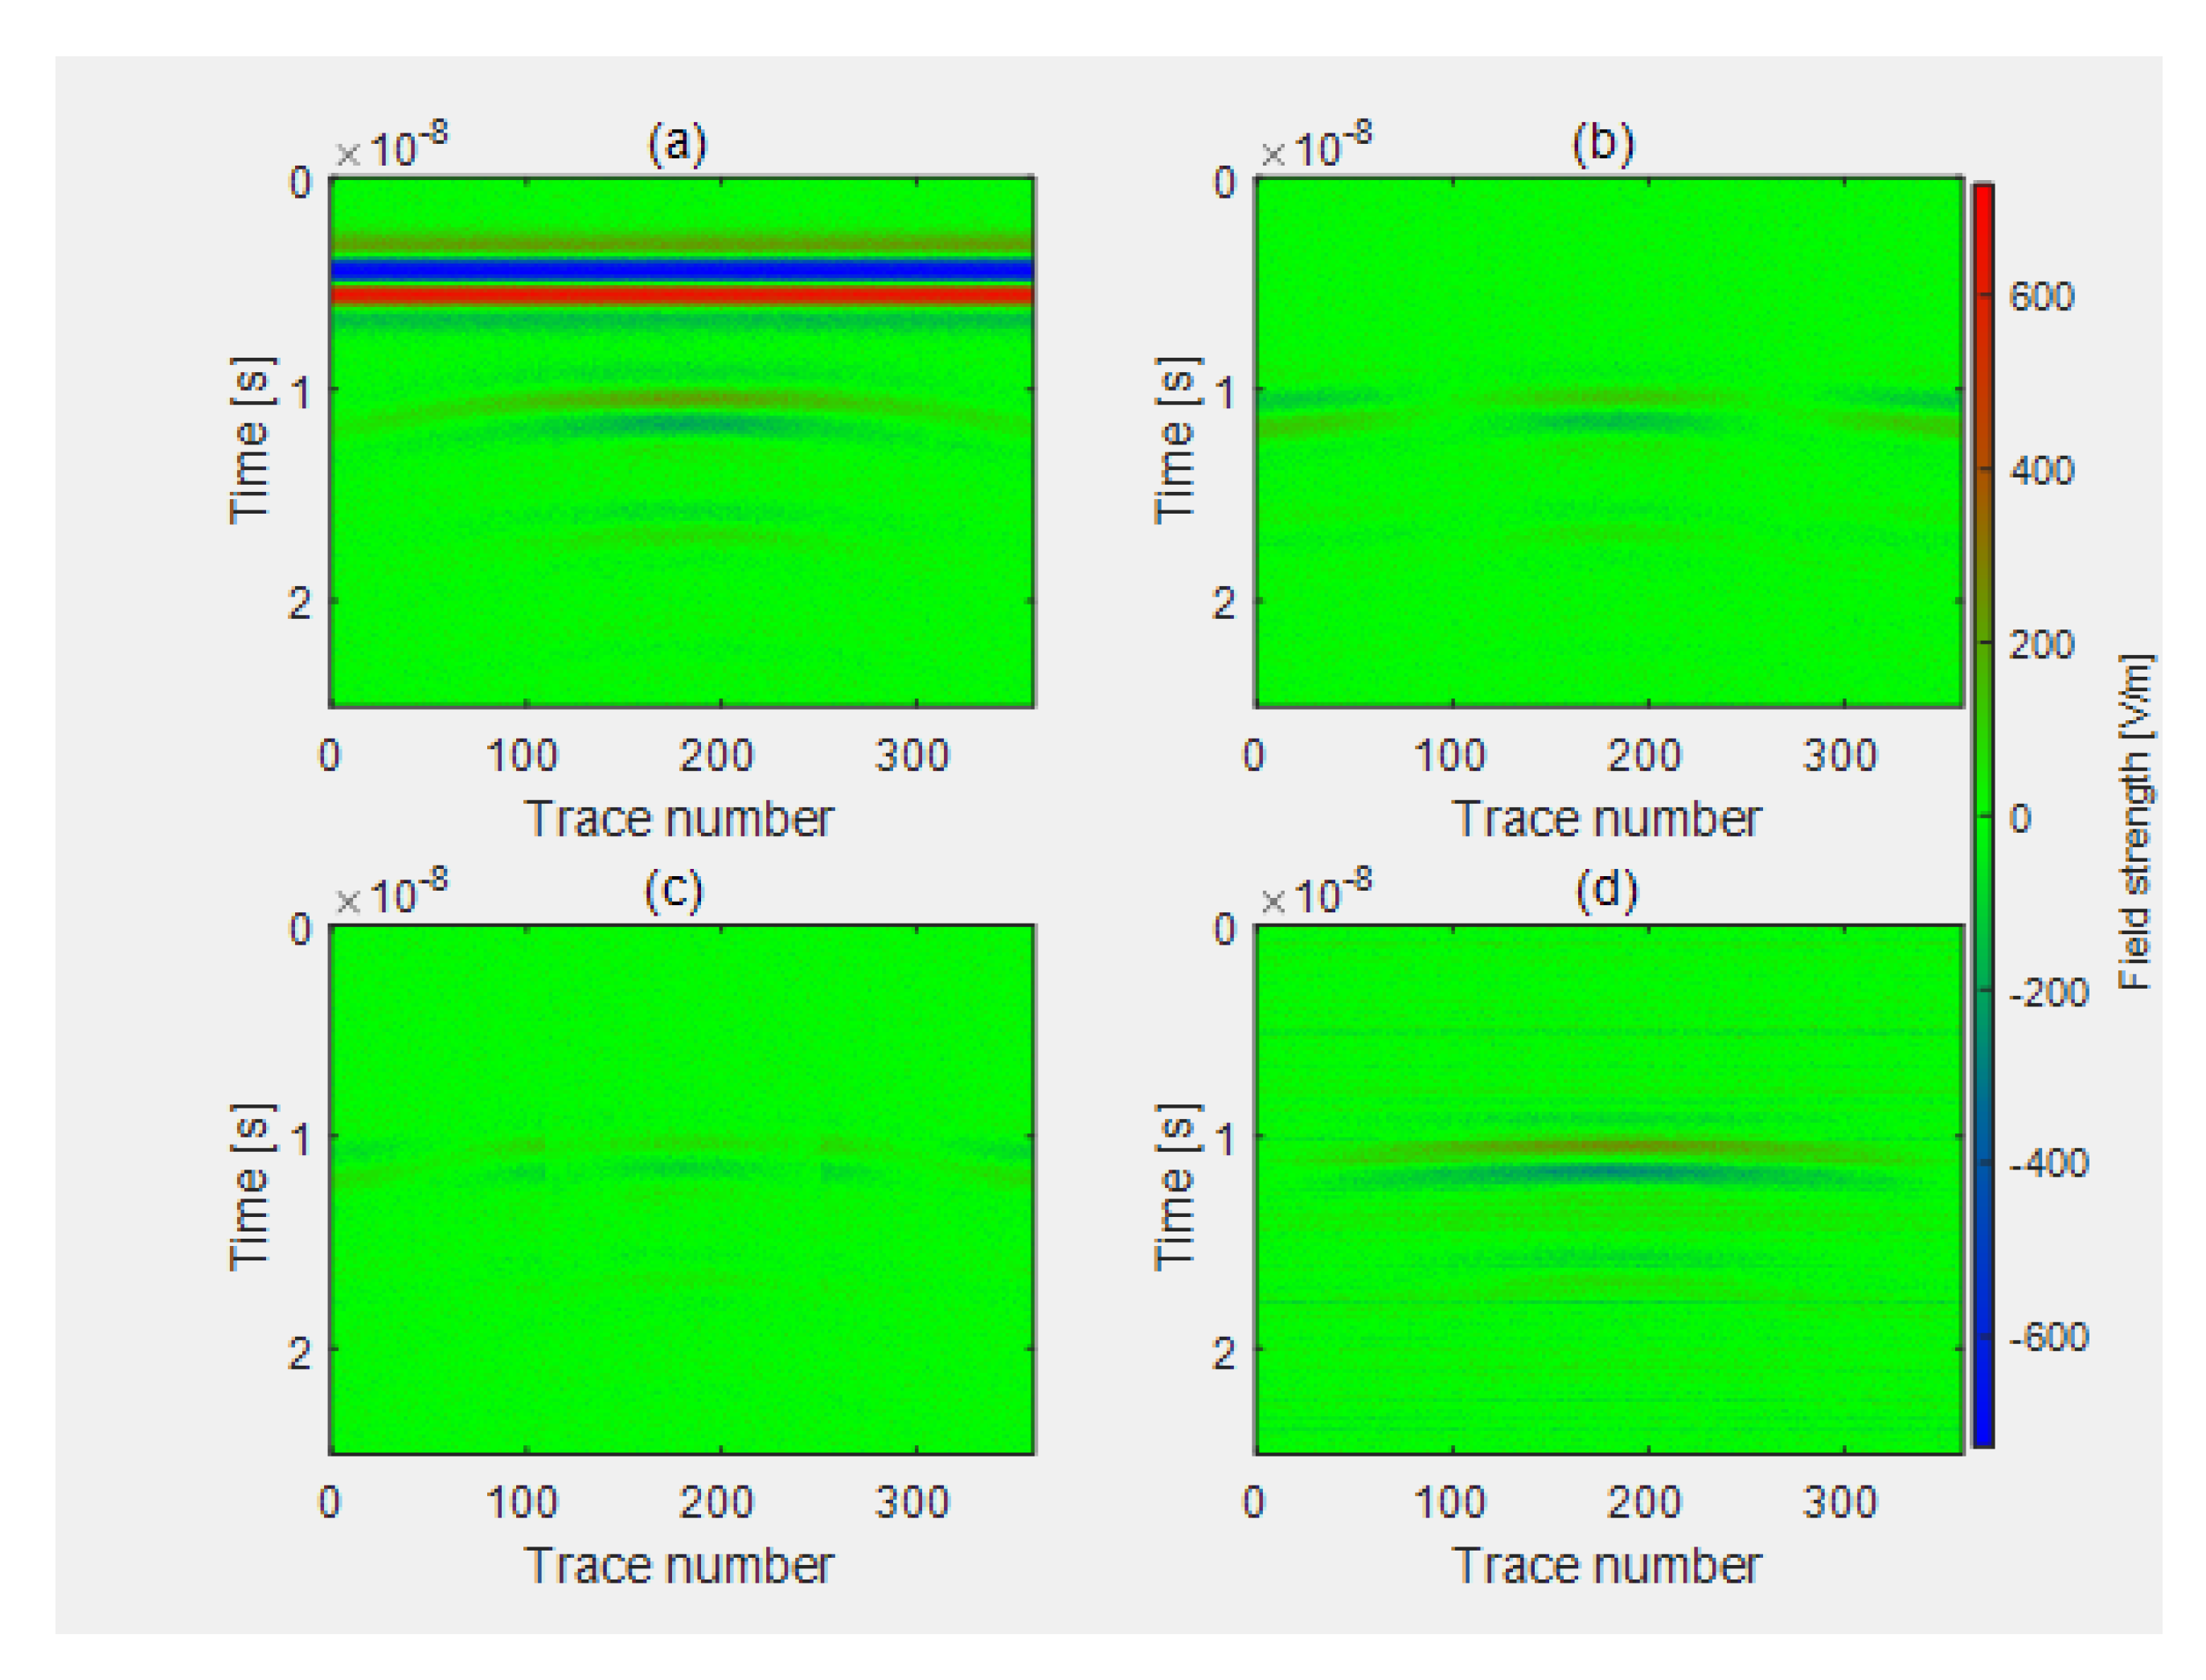
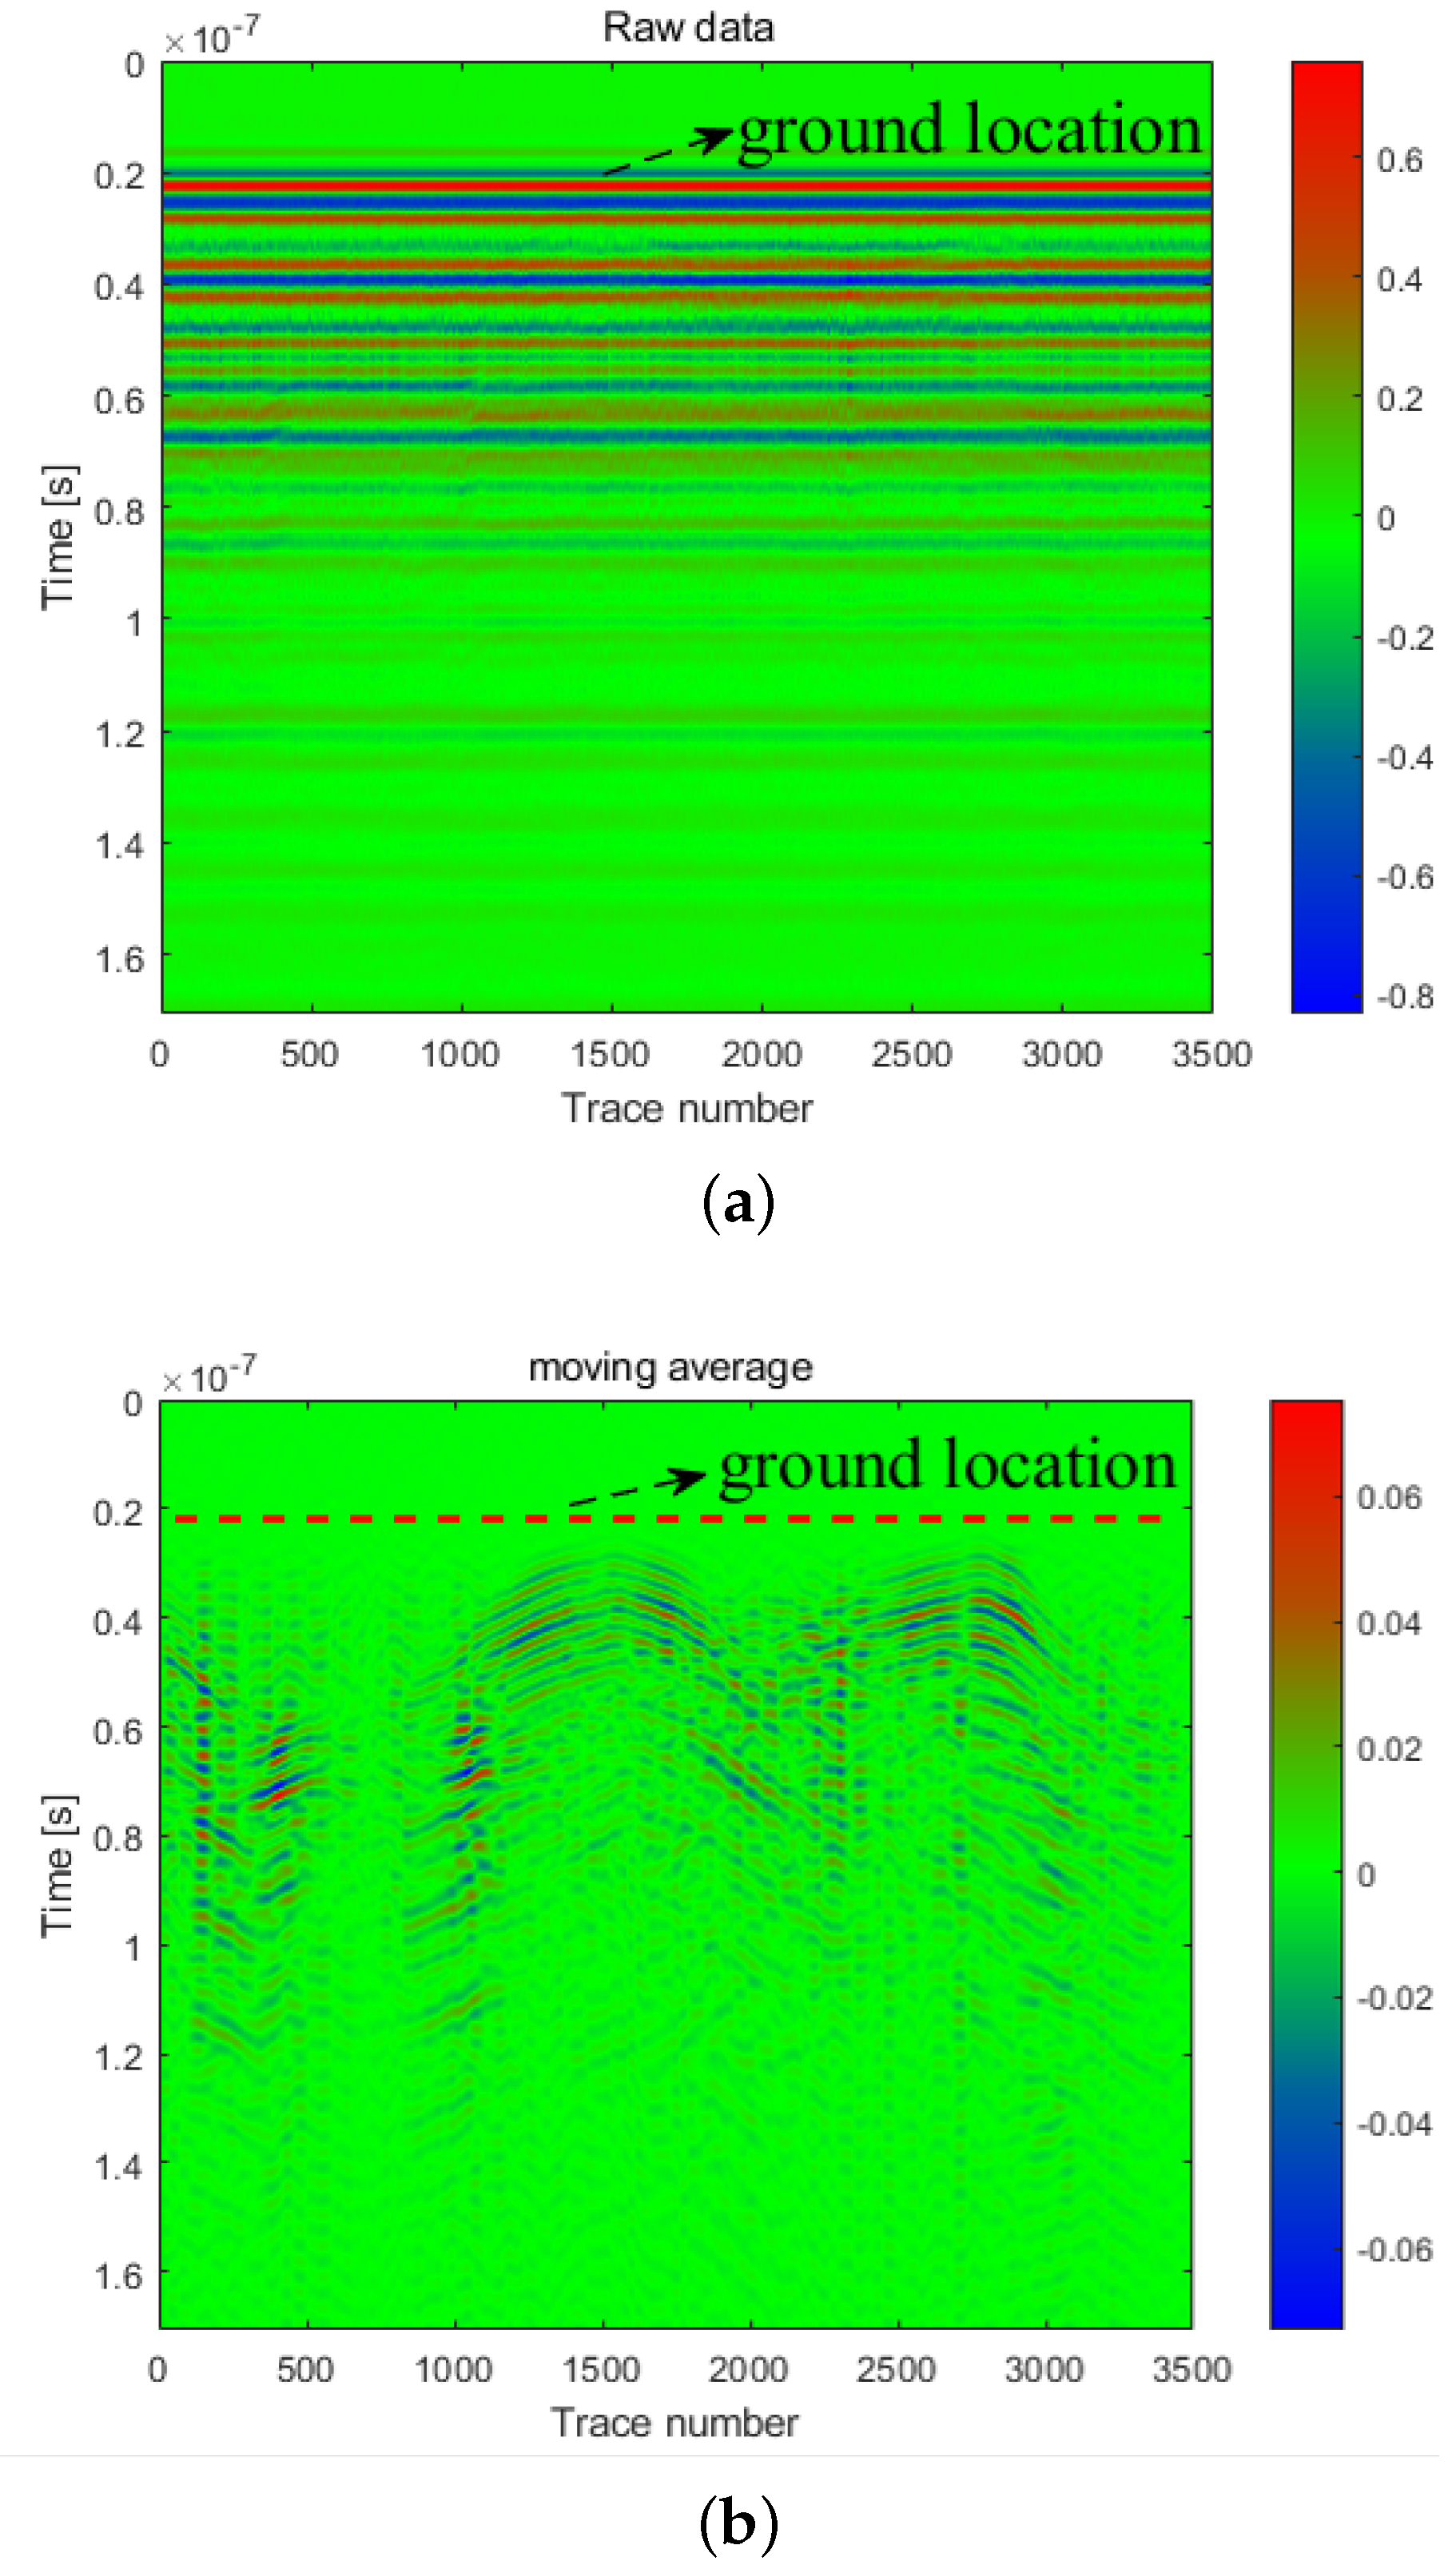
To compare the performance of different background-removal methods, we use the gprMax v.3.0.0 platform to carry out forward simulations. The principle of gprMax is the finite difference time domain (FDTD) [28], and the model of numerical simulation is shown in Figure 9. In this scenario, a metal tube with length of 0.35 m and radius of 0.01 m is regarded as a target, which is horizontally buried in the wet sand with the dielectric constant of 22. Then, a Ricker wavelet is regarded as an excitation source to send the narrowband pulse signal, and the frequencies are from 150 MHz to 309 MHz. Both the transmitter and receiver with moving step length of 0.002 m are placed on top of the wet sand. The time window is 30 ns, and the number of the A−Scan is 360. Then, a Gaussian white noise with the power of 25 dBw is added to the simulations. By using the mean subtraction method, the moving average method, and the proposed CCBS method, the essence of processing the raw echo are shown in Figure 10, respectively.
From the results of Figure 10, we can observe that the mean subtraction method introduces the redundant background signal at the same height as the target, which is easily regarded as the target. The moving average method not only eliminates background but also removes some useful echo. Compared to traditional background removal methods, the proposed CCBS method can highlight the target position more clearly, and the better background removal effect is presented even in noisy environments. In other words, the proposed method is conducive to the accurate interpretation of radar echo.
5.2. Rotor Interference Suppression
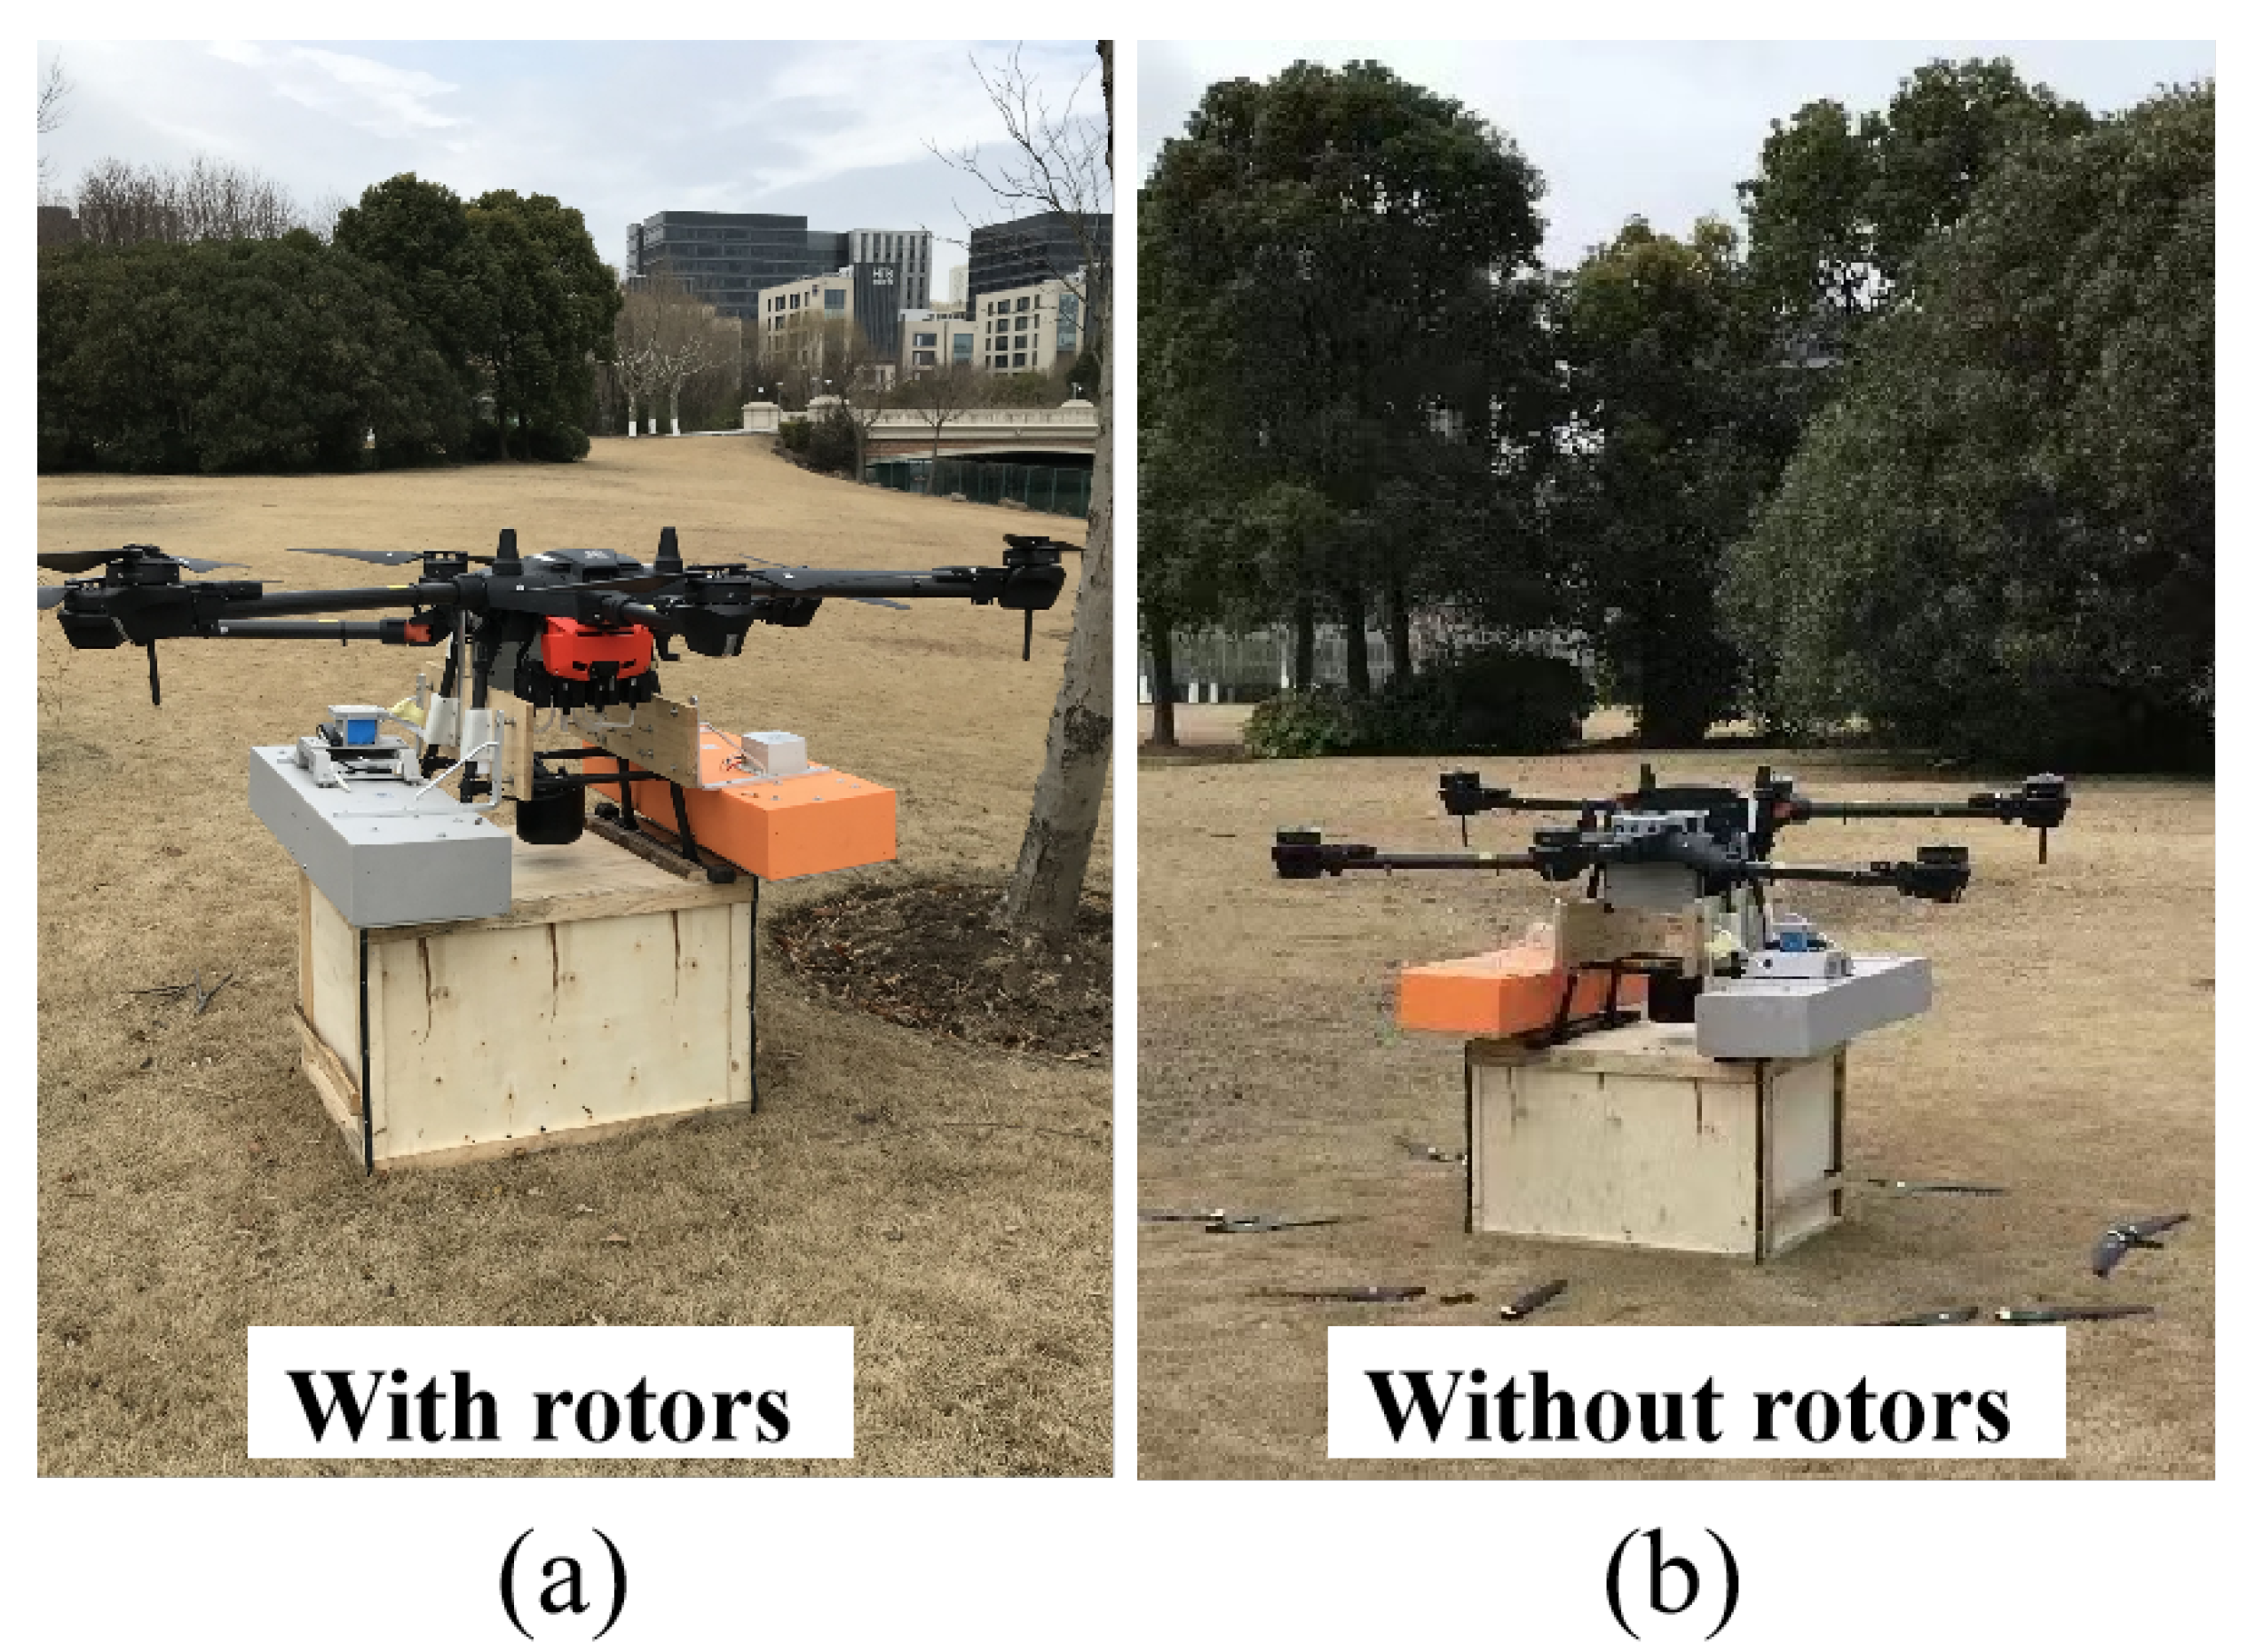
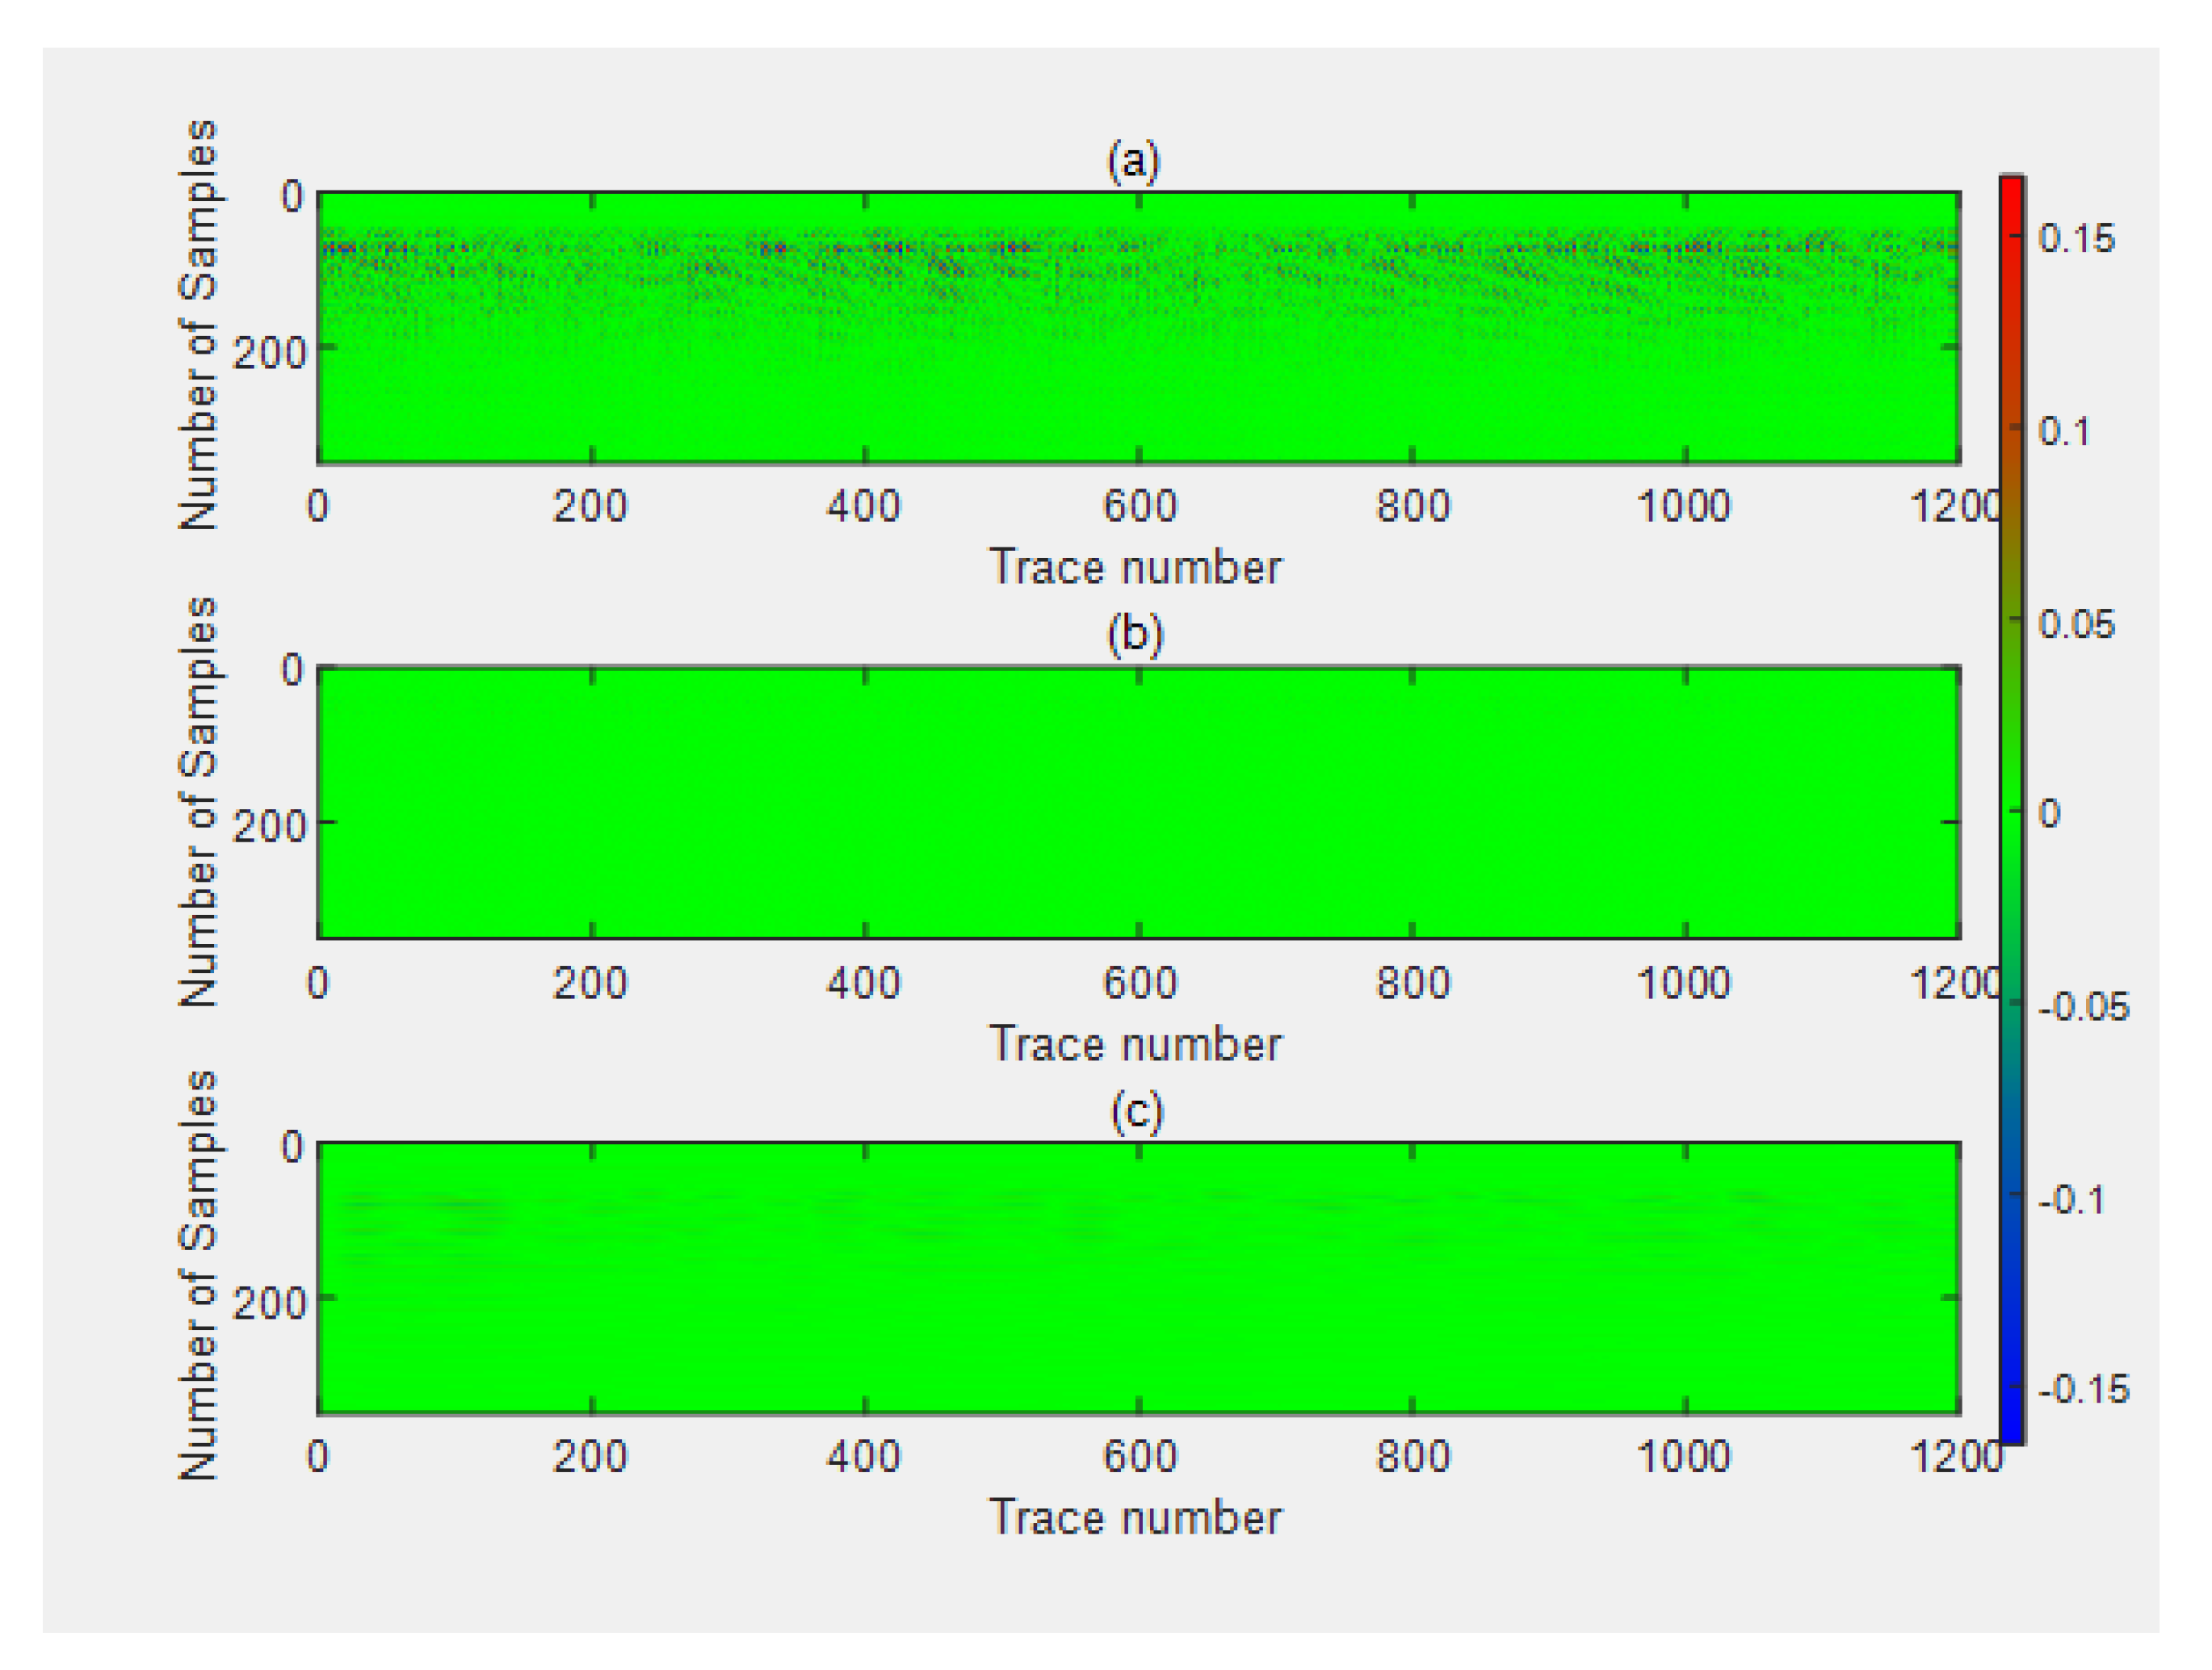
To explain the specific source of rotor interference, here the comparative tests are carried out. In the tests, we use a wooden box to support the UAV-GPR system for simulating the flying scene, as shown in Figure 11. Considering that the rotating rotors or the working motors may cause the interference effect, the tests were set to the following scenarios: with rotors and motors working, and without rotors but motors working at the same rotation speed. The results of these tests are shown in Figure 12a,b, respectively. From the results we can find that the interference comes from the rotors themselves, not the working motor. To mitigate the effect of this rotor interference, a lateral Doppler filtering (LDF) technique is adopted by removing the high-frequency components in the azimuth dimension. The results by the LDF technique under the first test scenario are shown in Figure 12c, and it can be seen that the rotor interference is largely removed.
Moreover, we use RMSE as the quality parameter. The formula is as follows,
where is the waveform in (b) without rotor interference, is the i-th waveform in (a) with rotor interference or (c) after filter rotor interference, n is the total number of waveform sampling points, and N is total number of waveforms. We calculate the RMSE of all the waveform, and then calculate the mean value. The RMSE of (a) and (b) is 0.0057, and the RMSE of (b) and (c) is 0.0034. It can be seen that the LDF has good performance for filtering the rotor interference. The relevant content has been added into the revised manuscript.
5.3. Experimental Results
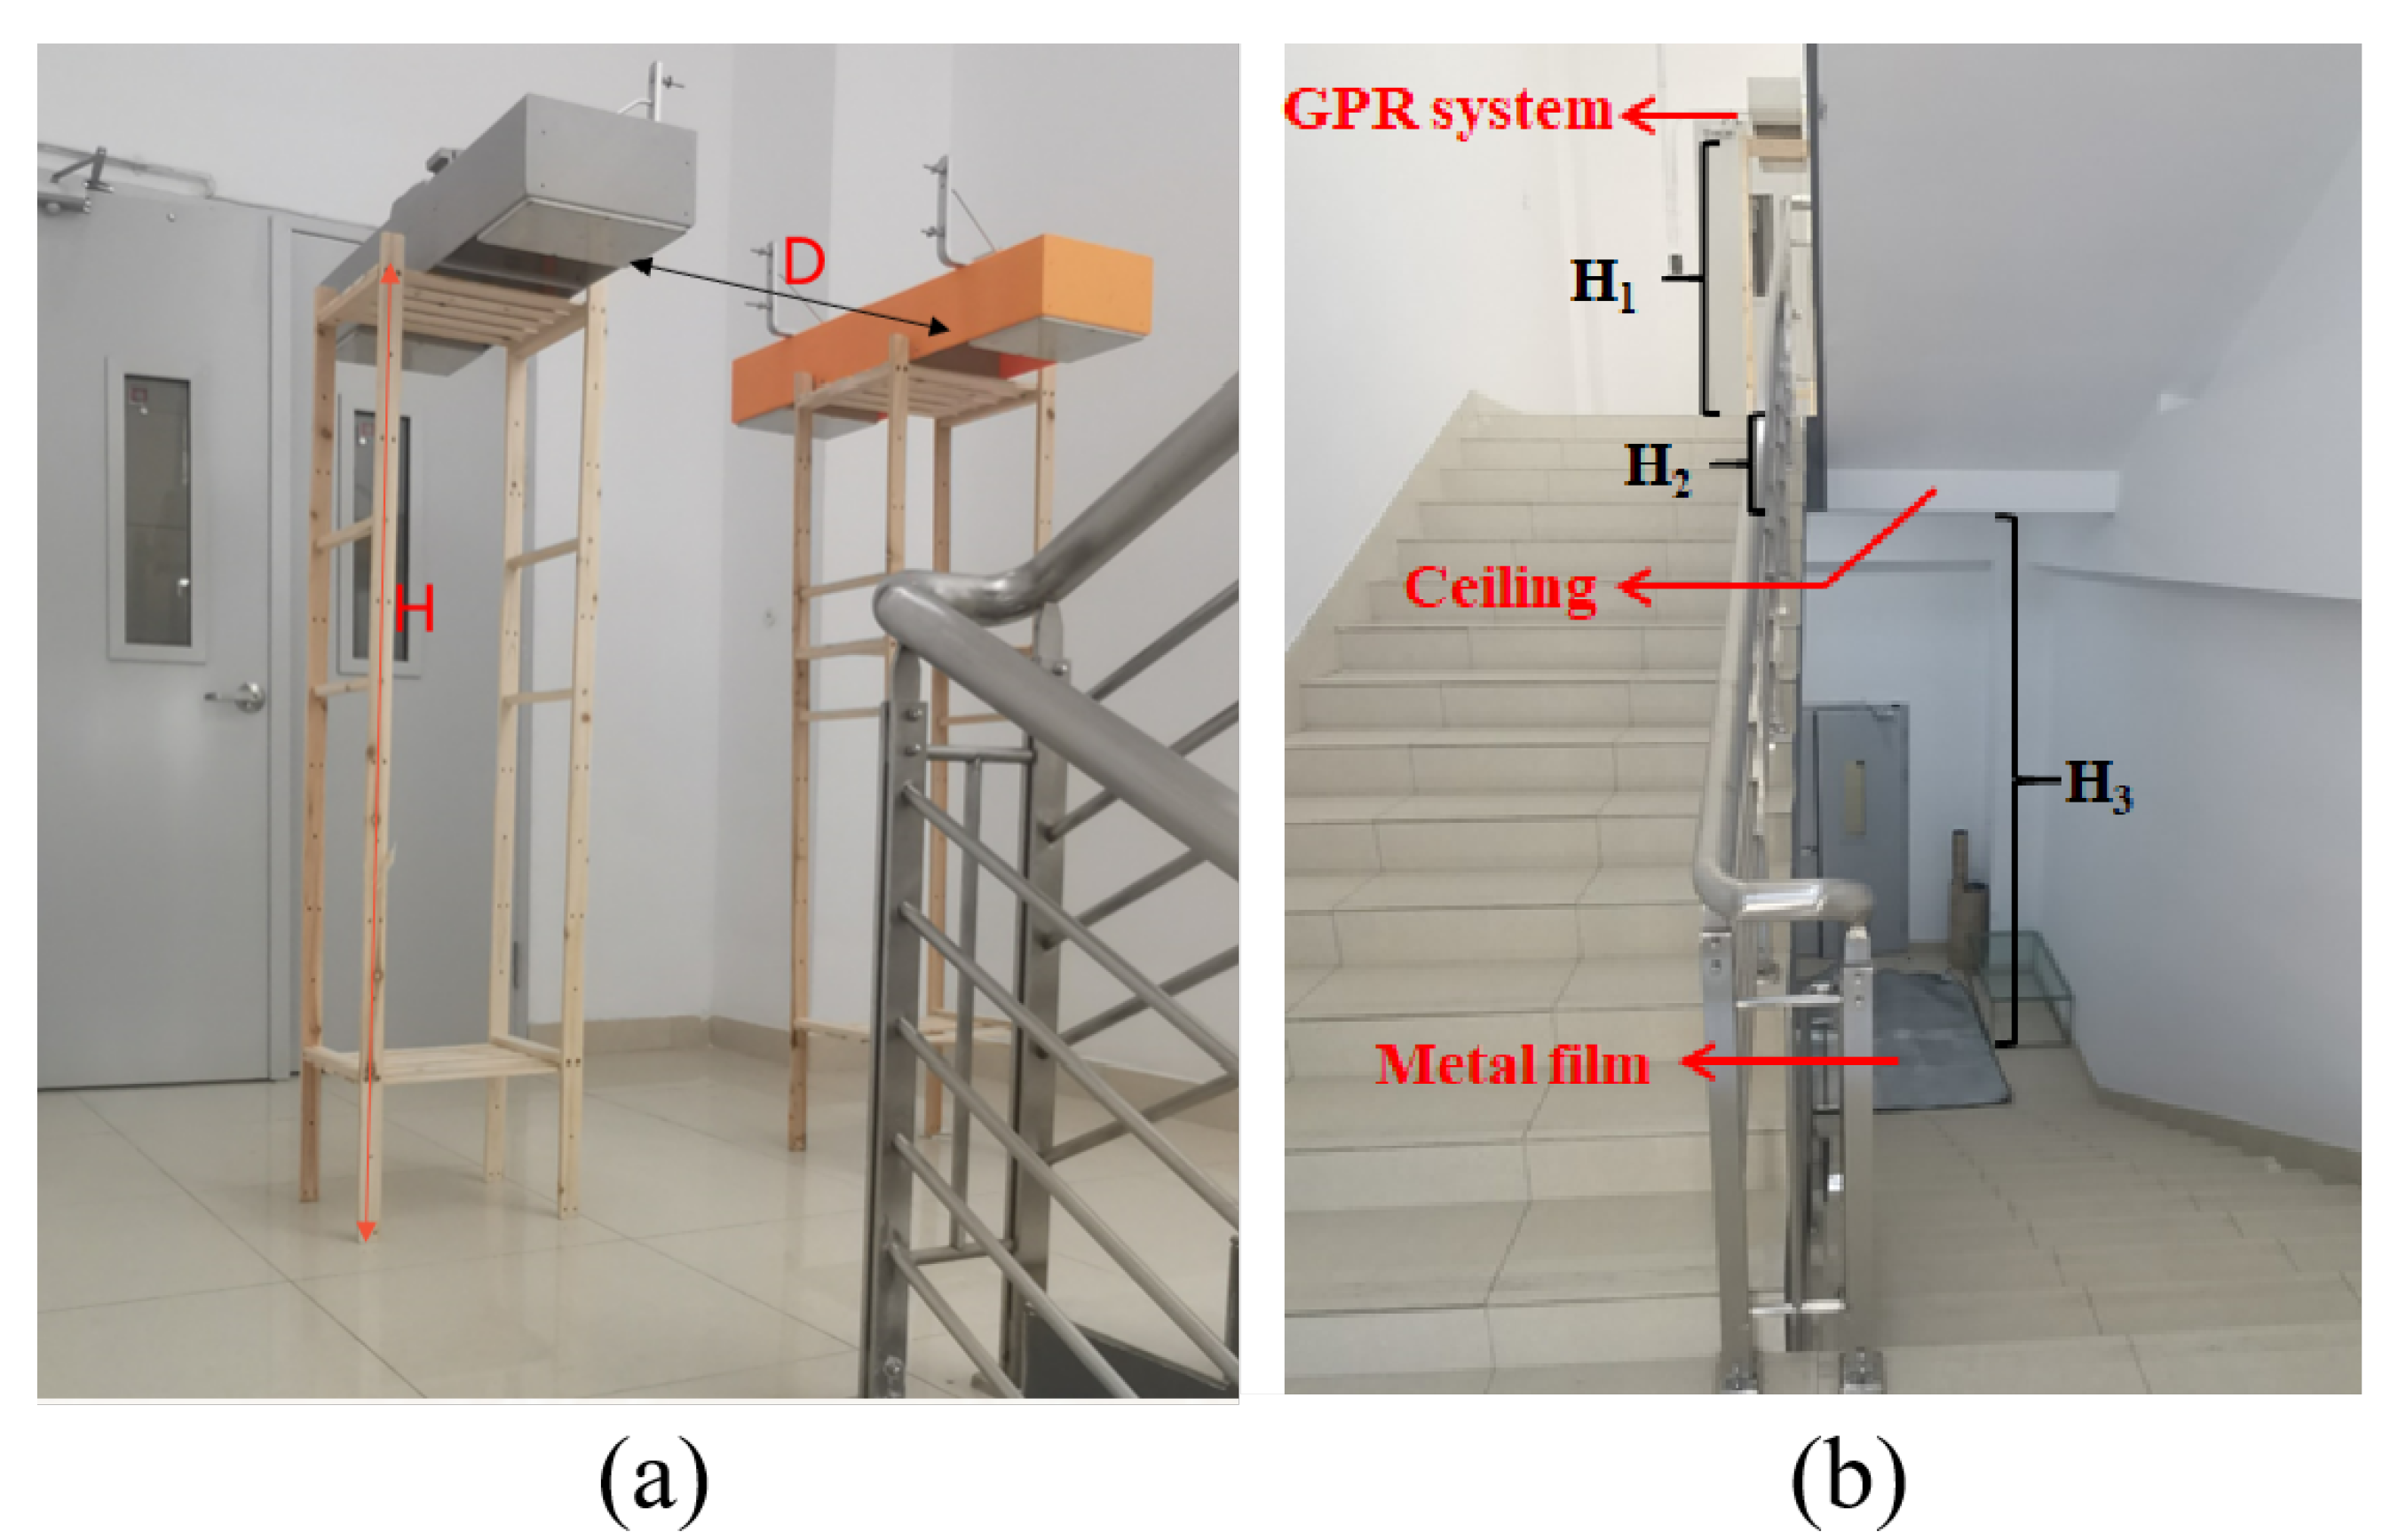
First, we implemented the static experiments to verify the penetration of the transceiver radar module with linearly polarized antennas. All of the equipment is placed on the sixth floor by a wooden frame. The distance is = 1.58 m from the transceiver to the ground, and the distance between the transmitted and received antennas is expressed as D = 1.17 m. For contrast, we placed a metal film with the area of 3 m2 on the fifth floor, as shown in Figure 13. According to measurement, the thickness of the fifth floor ceiling is about = 0.4 m, and the height difference from the ceiling to the ground on the fifth floor is = 4.2 m. So the total height of the measuring system from the ground on the fifth floor is , approximately 6.18 m.
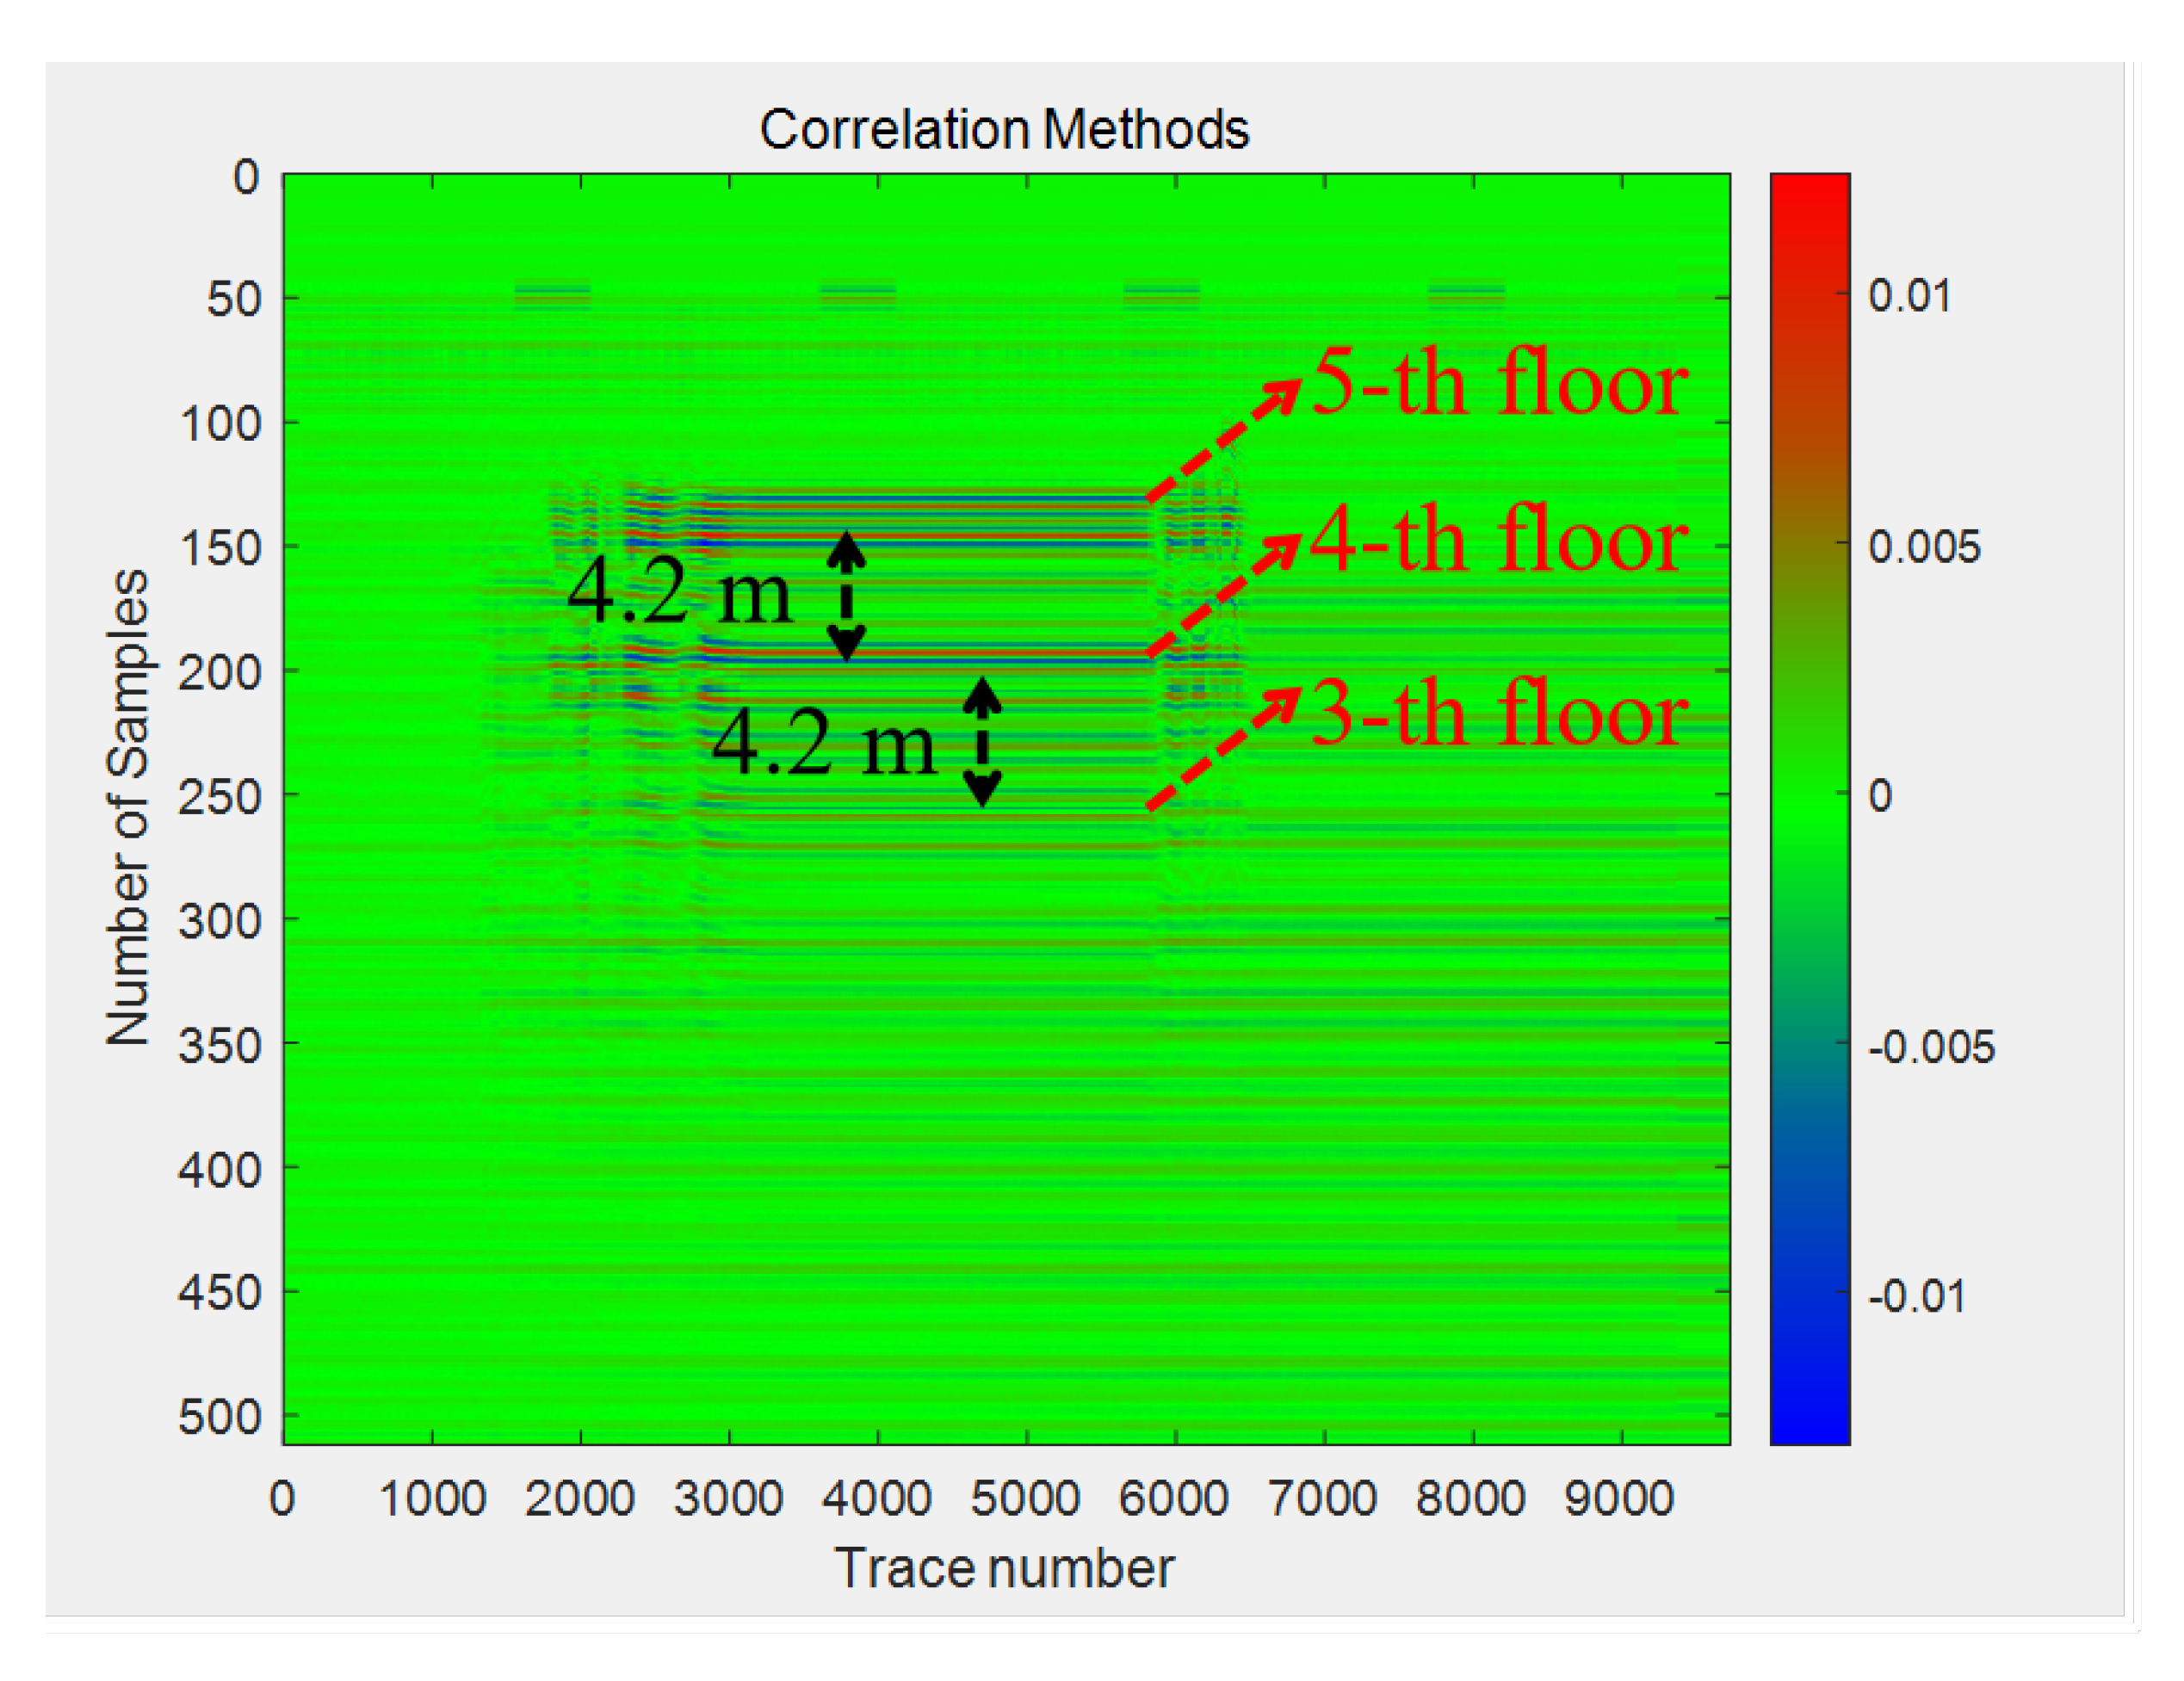
At the beginning of the experiment, there was no metal film on the fifth floor, and the amplitude of radar echo only reflected from the ground was very weak. After measuring for a while, the metal film was tiled on the fifth floor. In this situation, the amplitude of reflected echo is larger than before. In the final stage, the metal film was removed and we ended the test. The total measurement time was about 1.5 min, and the result after processing is shown in Figure 14. It can be seen that the height between the floors is consistent with reality, i.e., the penetrability of the system is verified.
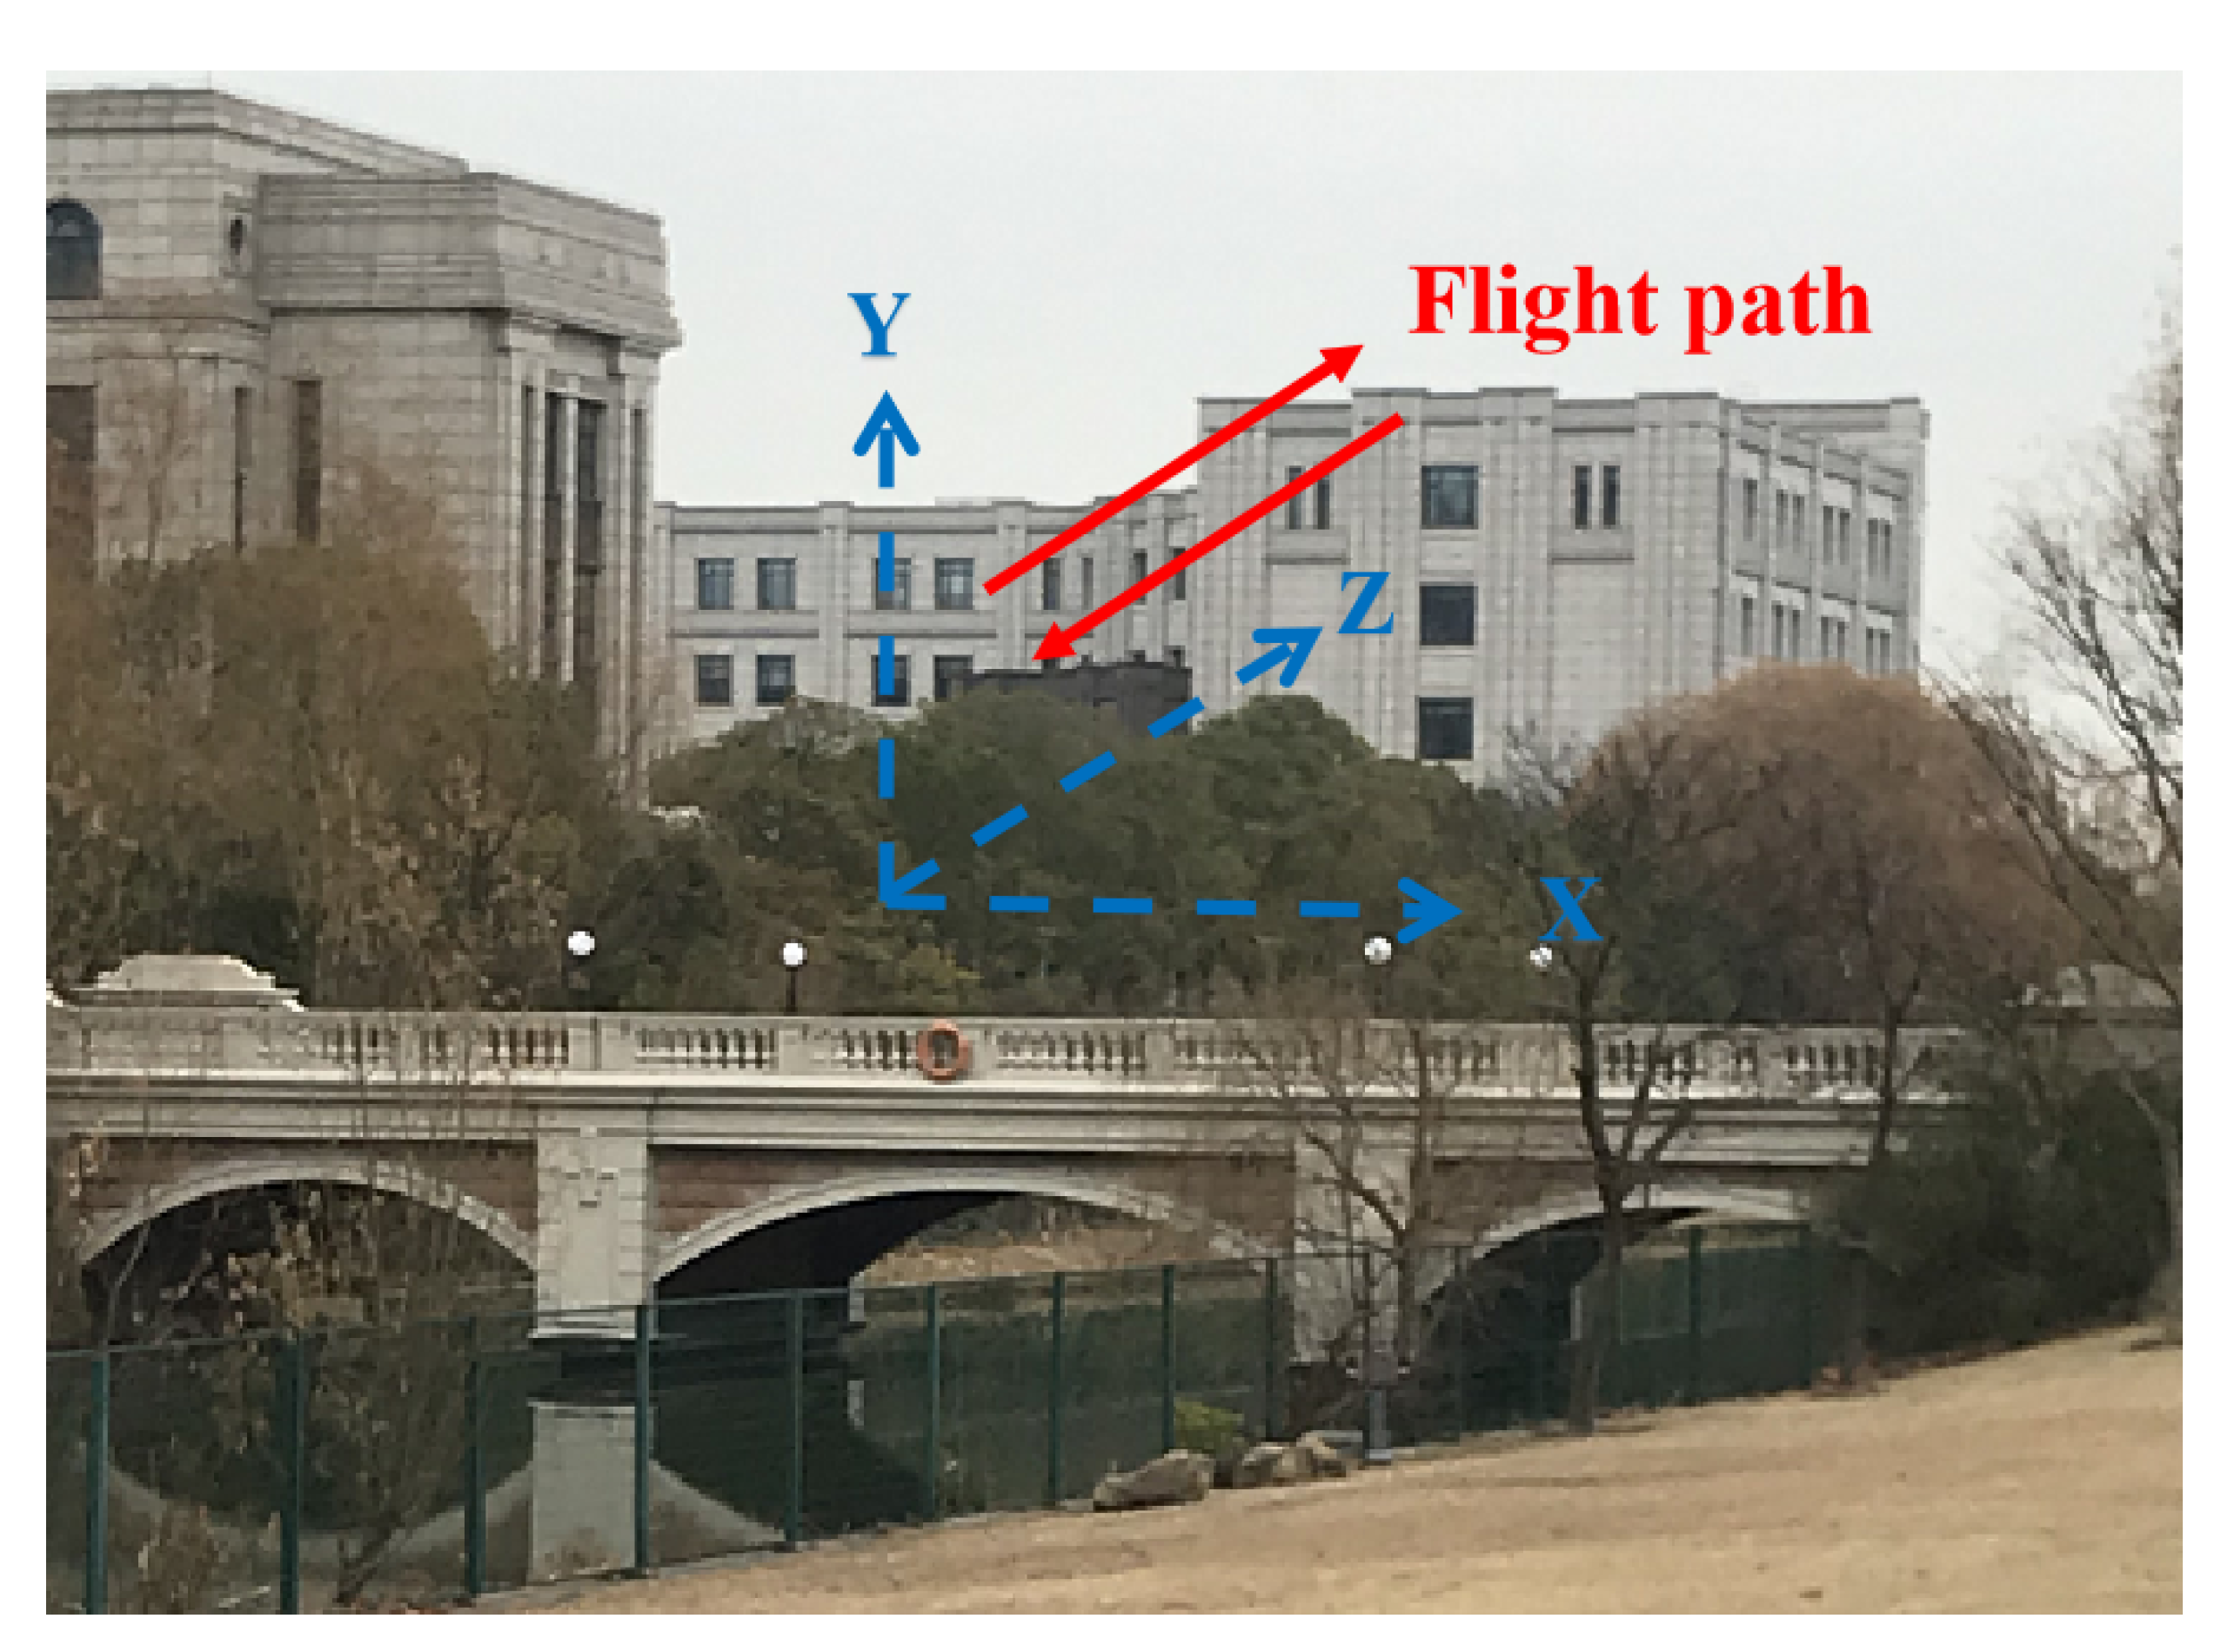
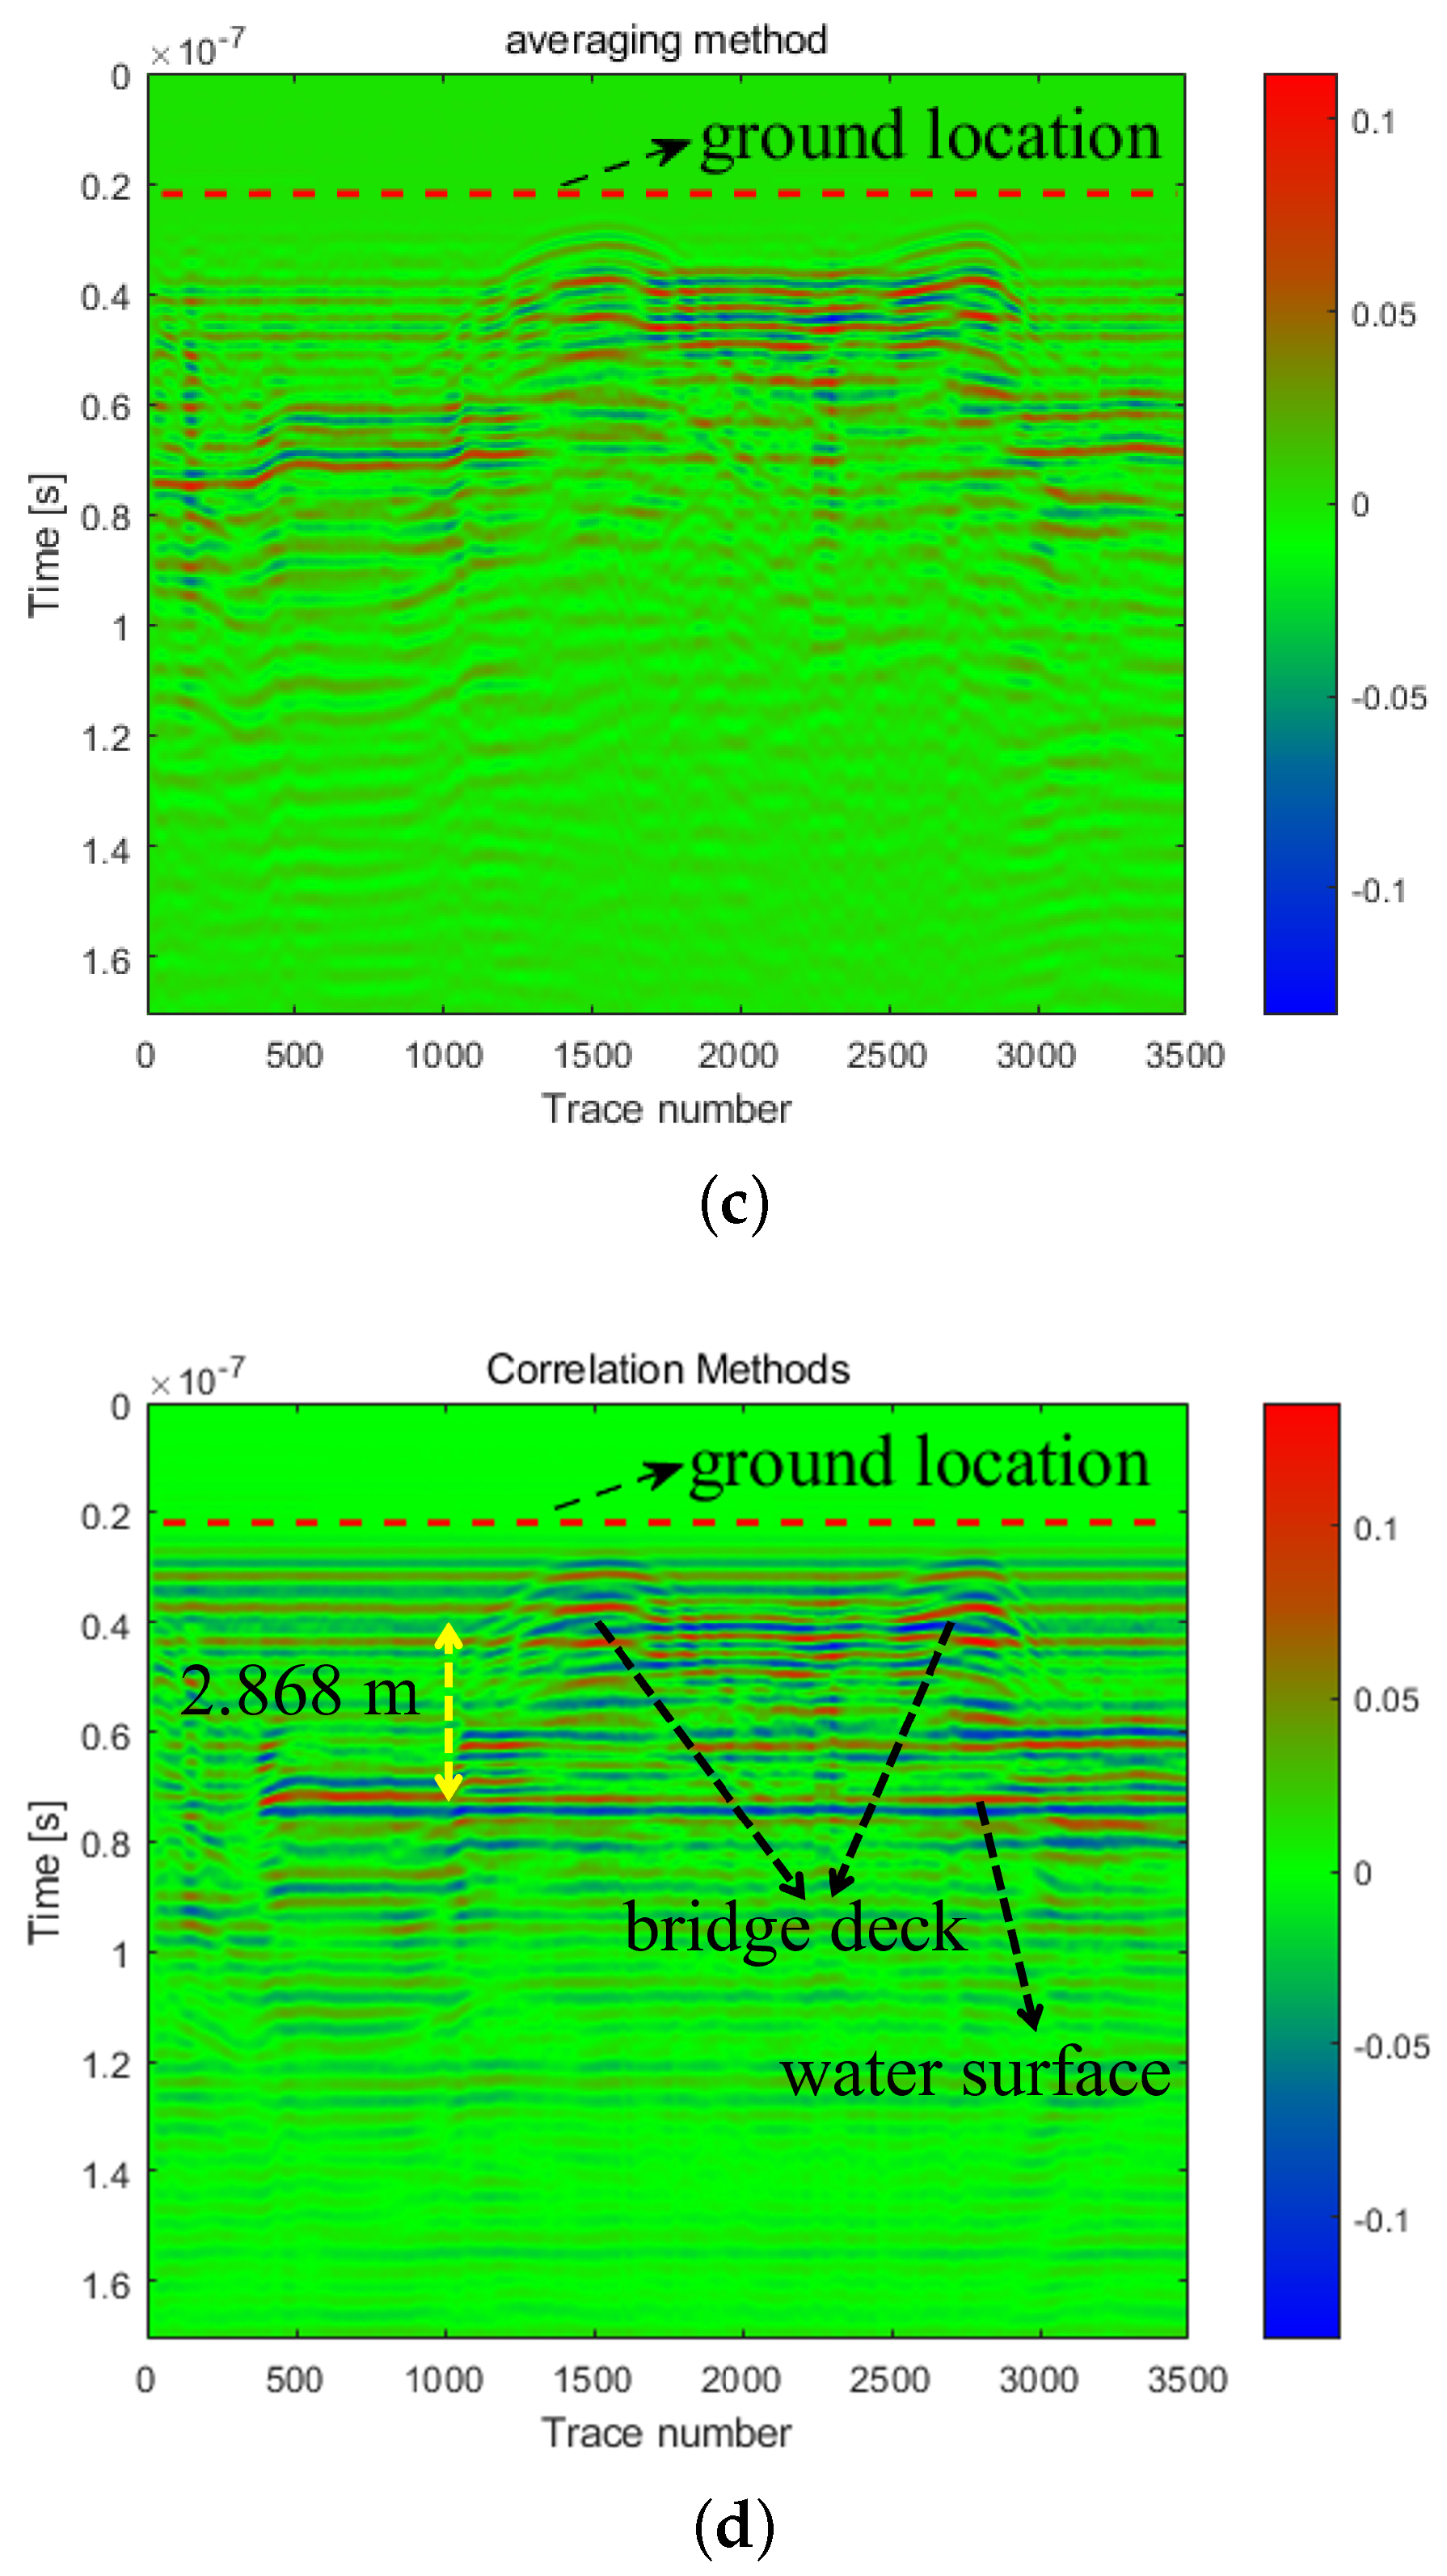
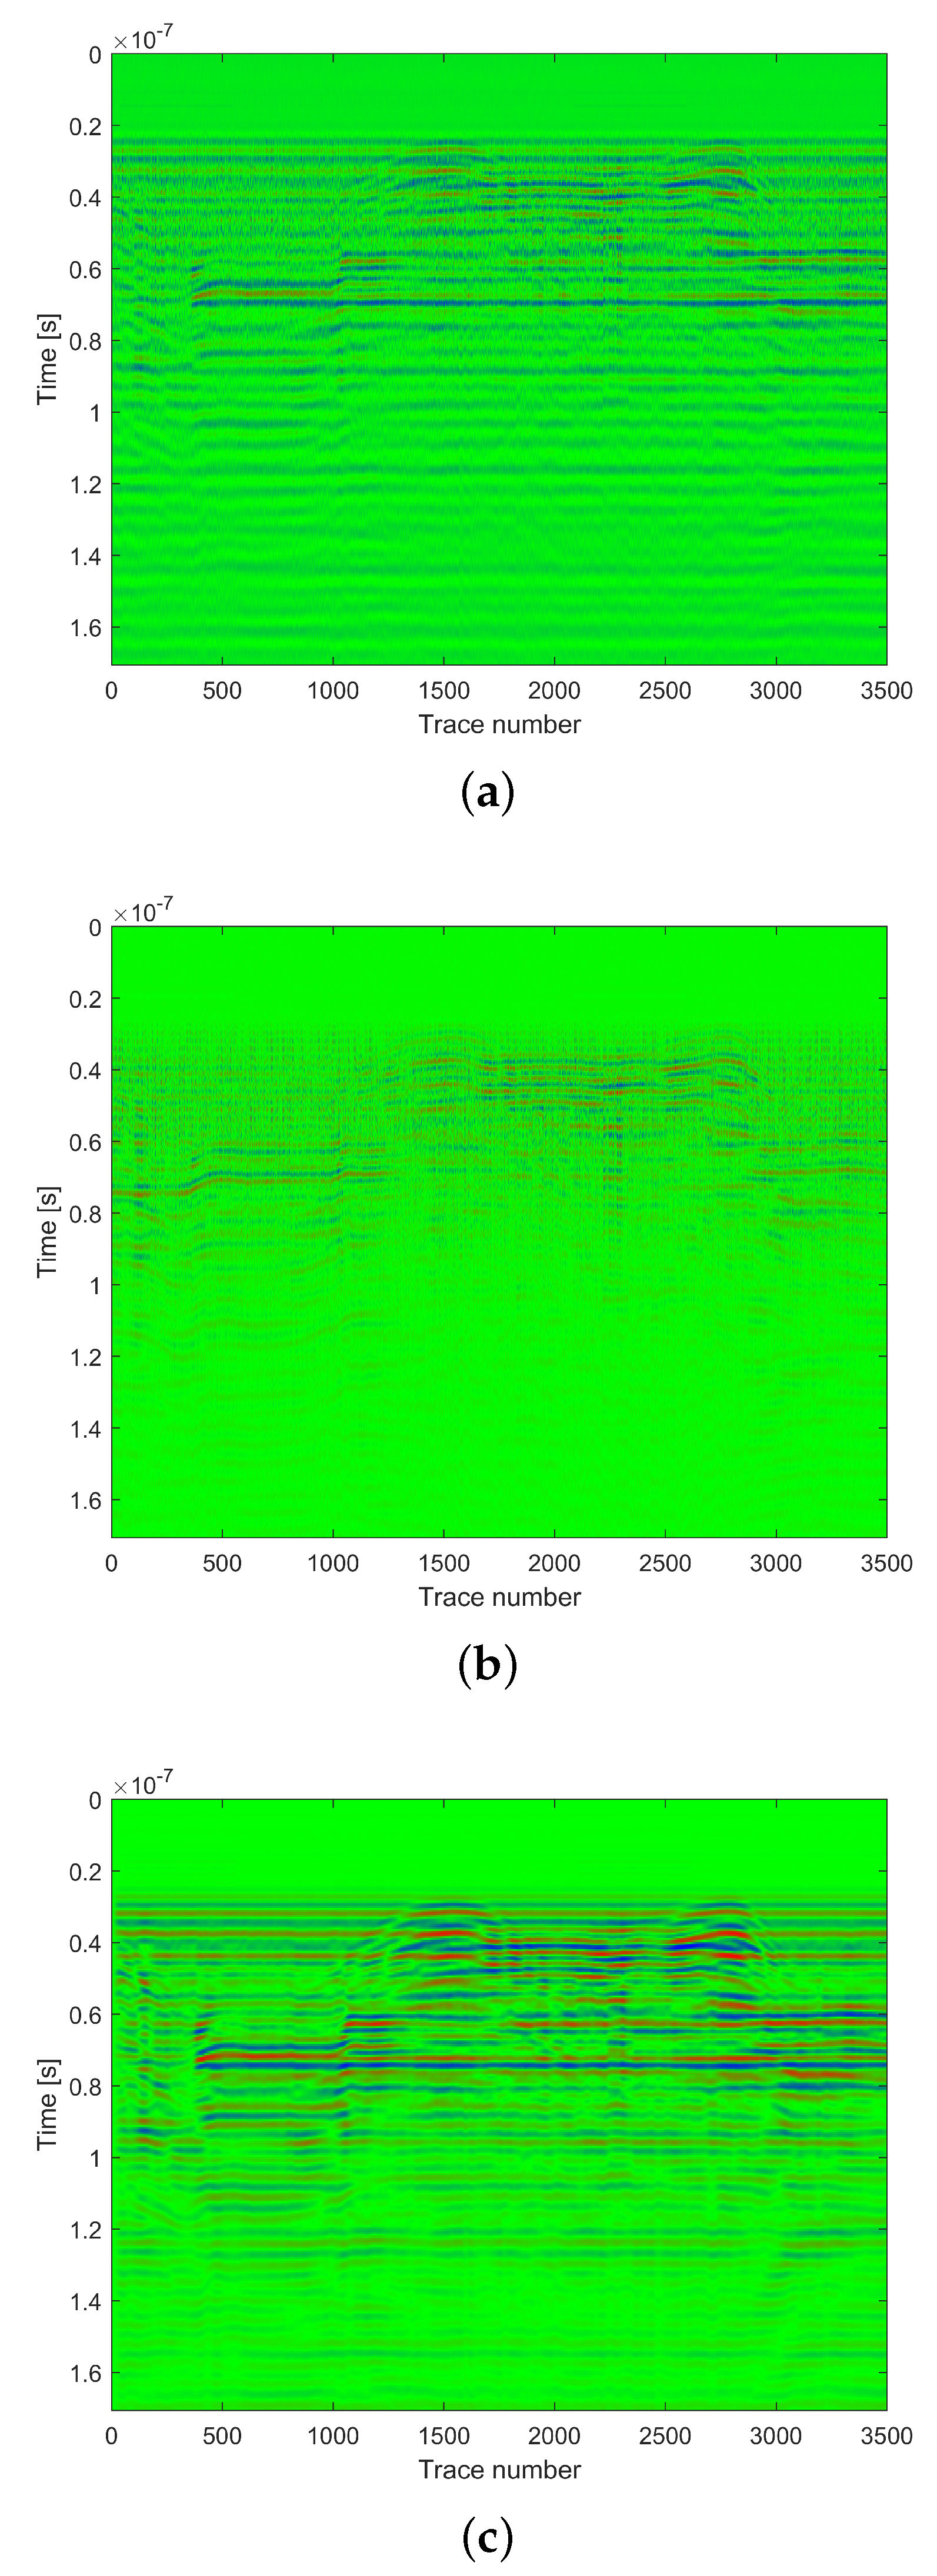
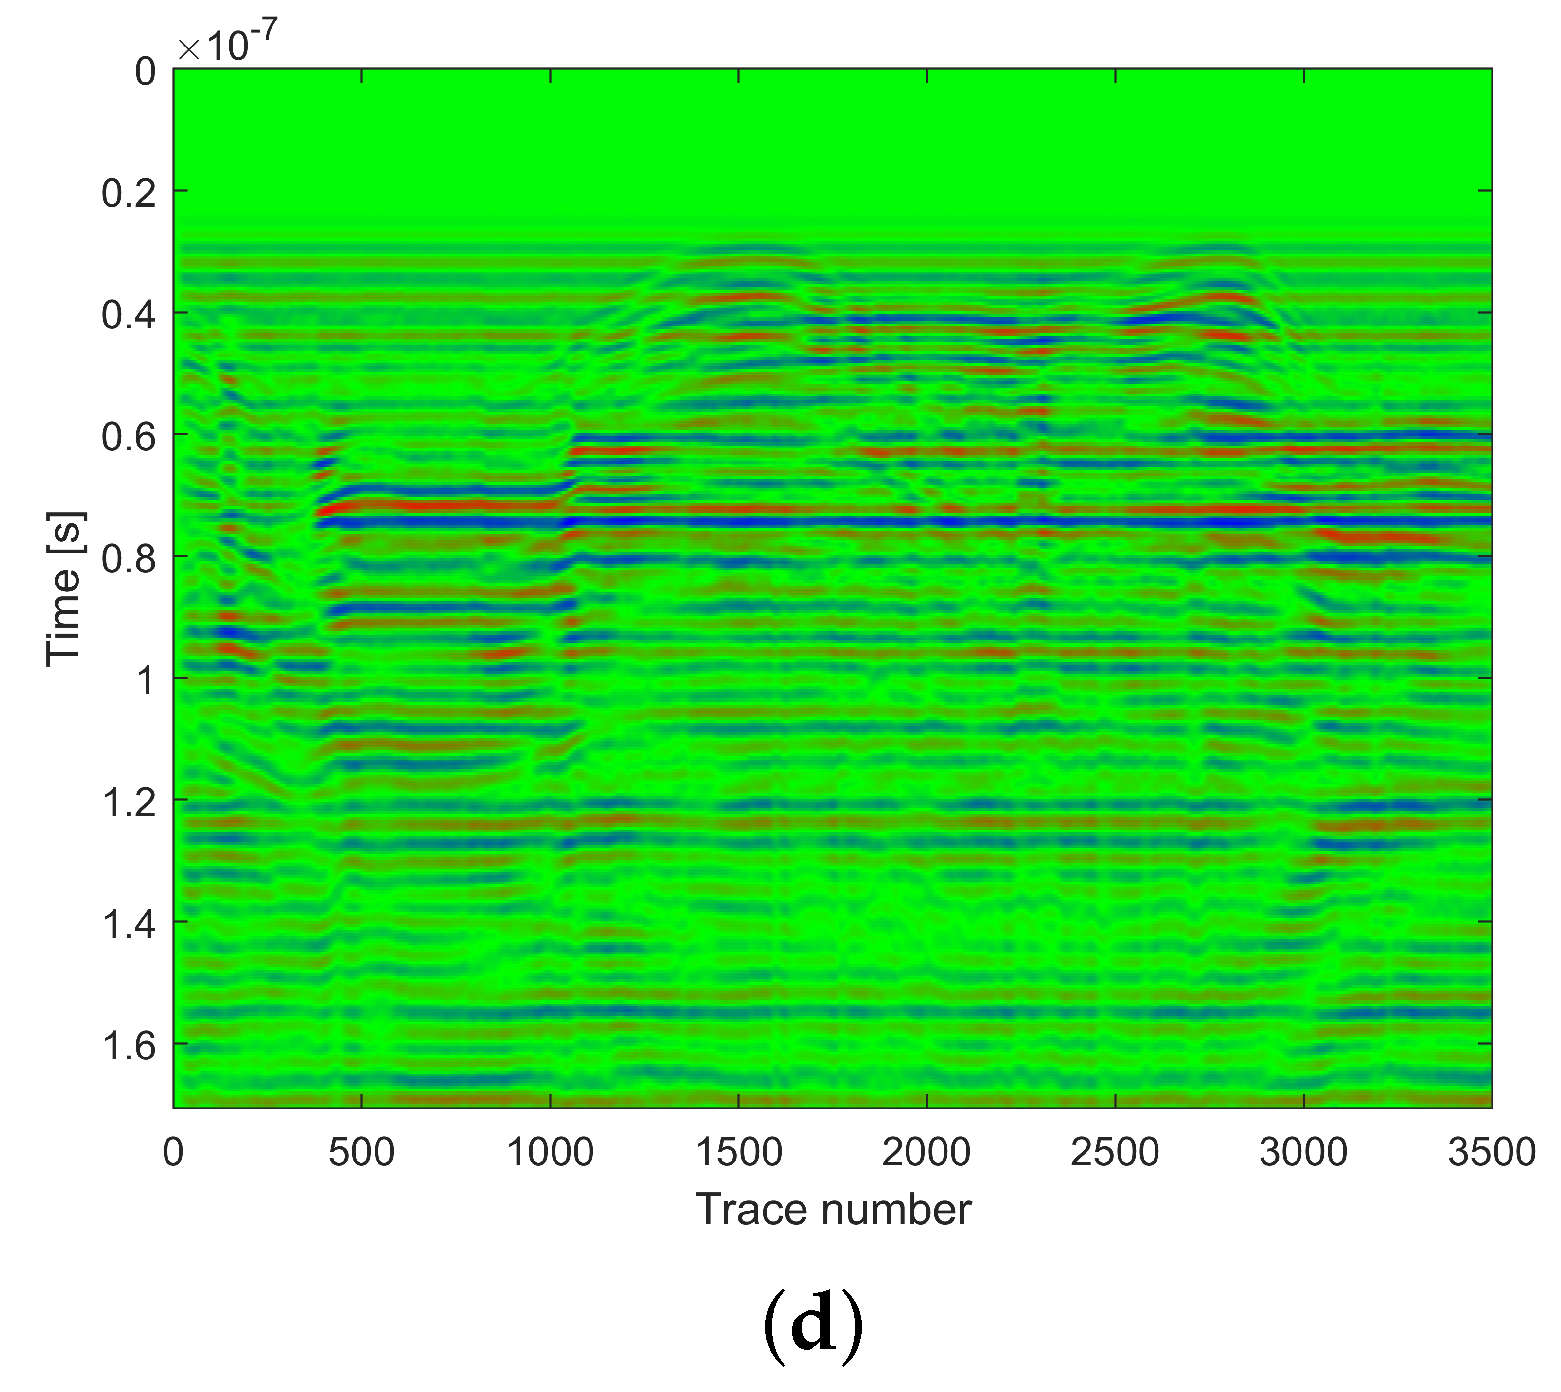
Furthermore, to verify the performance of the UAV-GPR system, the experiments on a bridge were conducted, as shown in Figure 15. The bridge is made of concrete with the width about 3 m, and the actual height of the bridge deck to the water surface is 2.87 m. For the sake of description, we define the direction along the bridge as the X-axis, the direction perpendicular to the bridge deck as the Y-axis, the Z-axis with X-axis and Y-axis forming a Cartesian coordinate system. The UAV flew across the bridge and river back and forth at the same height along the Z-axis direction, and the flight path is shown as the red arrows in Figure 15. The experimental results obtained by the different methods are shown in Figure 16. It is observed that the traditional methods (mean subtraction method and moving average method) can only see some targets above the bridge, such as the bridge deck. However, the proposed CCBS method can observe not only the bridge deck, but also the water surface with the detected depth of 2.868 m, showing a better performance than the two other methods. In addition, the processing results of each step corresponding to Figure 7 is shown in Figure 17 , verifying the effectiveness of proposed signal processing method.
From Figure 16d, it can be calculated that the time difference between the upper surface and lower surface of the bridge is expressed as s, and the time difference between the lower surface of the bridge and the surface of the water is expressed as s. The material of the bridge is mainly concrete, and its dielectric constant is about 8.5, which is calculated by the calibration method of measured radar data in the previous section. Consequently, the electromagnetic propagation speed in concrete v is calculated as
where c is the speed of light.
Then, according to the propagation speed of the electromagnetic wave in a medium and time difference, the height difference between the bridge deck and the water surface can be calculated as , approximately 2.868 m. It can be seen that the calculated result is similar to the actual value. The results of simulations and experiments have shown the effectiveness and superiority of the proposed method, and the penetrability of our UAV-GPR system has been verified.
The structural similarity (SSIM) is adopted to measure the relationship between the processed images and the original image. It uses the three indicators of brightness, contrast, and structure to evaluate the similarity between the two images. According to Figure 10, it can be seen that different algorithms lead to the transformation of underground structures, which is difficult for the eyes to distinguish. However, the similarity between them can be calculated through SSIM (range 0–1). The higher the similarity, the closer it is. We calculated the similarity between Figure 16b–d with Figure 16a. To avoid the influence of surface direct waves, only the underground part is calculated (the image below the surface direct wave is taken for calculation). The calculation results are shown in Table 1.
It can be seen from the calculation results that the CCBS method is the closest to the original image underground structure, which indicates that the algorithm can well preserve the shape and intensity of the underground structure. Although the mean subtraction method can retain good intensity, the average processing between adjacent echoes will change the structure. Moreover, the moving average method will change the intensity of the echo.
5.4. Discussion
Currently, the UAV-GPR is facing many challenges, so it is not used commercially. For the areas that cannot be reached by humans, the UAV-GPR can replace humans to work and detect underground structures, such as mines, marshes, underground cavities, and so on. This paper explores an integrated UAV-GPR and conducts the experimental verifications, but there are still many problems that need to be improved in the future.
(1) Because our UAV-GPR system works at low frequencies, the size of the antenna is very large. In this work, three transmitting antennas and three receiving antennas have realized the beam superposition through phase control to form an array. However, UAV-GPR can also be carried out through one transmitting multiple receiving, multiple transmitting one receiving, and other methods [29]. Moreover, the size and weight of the radars can be further reduced by using an integrated antenna module, thus improving the working efficiency of the UAV-GPR system. In addition, stepped frequency continuous wave (SFCW) radar [30] was a commonly used frequency domain transmitted signal, which is adopted to improve the resolution, to remove interference signals in the frequency domain and to improve the signal-to-noise ratio. Moreover, the measurement method in this work is a downward-looking measurement; that is, radar vertical receiving and transmitting pulses. Different measurement methods can be tried in the future, such as side fired measurement [31].
(2) In this paper, we propose a processing algorithm for the UAV-GPR system, which aims to remove interference signals and obtain the image of deep targets, and the algorithm provides an effective solution to suppress the interference with the multi-rotor UAV-GPR system. However, there are still some areas that can be improved. On the one hand, there is some distance between the radar and the ground, and the signal will be attenuated before reaching the ground surface. By compensating this attenuation, the radar image quality can be further improved. On the other hand, the UAV-GPR radar in this work can be regarded as a low-altitude synthetic aperture, and its resolution can be improved by using the synthetic aperture radar (SAR) technique [32]. Because SAR has a high transmitting and receiving efficiency, it can synthesize multiple signals to improve the azimuth resolution. However, the signal attenuates quickly in the soil. To solve the problem, a Wiener filter-based deconvolution technique [33] can be used. This method can improve the signal attenuation in soil and other lossy media. Moreover, the proposed CCBS method has no focus on the high-resolution imaging of underground targets. The migration algorithm can improve the focusing quality of images, such as Kirchhoff migration [34], phase shift migration [35], and frequency wavenumber (f-k) migration [36], which can be combined with the proposed method to improve the imaging quality of underground targets.
(3) Three experiments are designed in this work to study different characteristics of the UAV-GPR system. However, due to the complexity of the environment and the underground structure, some areas in images are difficult to explain. We consider performing some comparative experiments. The proposed processing method not only needs to consider the properties of the clutter, but also the applicability of scenes. In this work, the experiments were carried out for the relatively flat scenes. For the non-flat scenes, we will perform further research in our future work. In addition, some scene information concerning the bridge experiment is unknown, such as the internal structure of the bridge, the distance of the arch from the water, the thickness of the bridge deck, and so on. Furthermore, it is necessary to conduct some reference and contrast experiments. For instance, standard objects can be buried at a known depth for the verification of permittivity, and the same objects can be buried at different depths to verify the effectiveness of the proposed method and the penetration performance [37].
6. Conclusions
In this paper, we have developed a UAV-GPR system with miniaturization and penetrability. This system has the advantages of independent detection and data processing integration. Based on the system, a new CCBS method is proposed, and an interference suppression technique is adopted in the signal processing step. The proposed CCBS method takes advantage of the similarity between each A−Scan echo and a reference wave by establishing a background-removal model. Moreover, we have explored the effects of the electromagnetic interference in the environment, and the interference from the UAV rotor itself by practical testing. An LDF technique was adopted to effectively suppress the active interferences. In addition, a calibration method for measured data was introduced to calculate the dielectric constant of the measured medium. As a result, the simulations and experimental results indicated that the proposed method in terms of clutter subtraction has better performance than the traditional methods, and the penetrability of the UAV-GPR system was also validated. In this paper, experiments carried out in different scenarios provided meaningful reference for future research. However, the research of UAV-GPR still faces many challenges, such as environmental interference, signal attenuation, miniaturization, and security, which will be the subject of our next research article.
Author Contributions
Conceptualization, F.W.; Data curation, X.Z. and S.W.; Formal analysis, Z.L.; Funding acquisition, F.W.; Methodology, S.W., Z.L. and H.Y.; Validation, L.W.; Writing—review & editing, S.W., L.W., X.Z. and F.W. All authors have read and agreed to the published version of the manuscript.
Funding
This work was supported in part by the National Natural Science Foundation of China (Grant No. 61901122), the Natural Science Foundation of Shanghai (Grant No. 20ZR1406300) and the China High-resolution Earth Observation System (CHEOS)-Aerial Observation System Project (30-H30C01-9004-19/21).
Data Availability Statement
Data are available for research purposes upon request to the authors’ institutions.
Conflicts of Interest
The authors declare that there is no conflict of interest regarding the publication of this article.
References
- Liu, H.; Lu, H.; Lin, J.; Han, F.; Liu, C.; Cui, J.; Spencer, B.F. Penetration Properties of Ground Penetrating Radar Waves Through Rebar Grids. IEEE Geosci. Remote Sens. Lett. 2021, 18, 1199–1203. [Google Scholar] [CrossRef]
- Angelopoulos, M.C.; Pollard, W.H.; Couture, N.J. The application of CCR and GPR to characterize ground ice conditions at Parsons Lake, Northwest Territories. Cold Reg. Sci. Technol. 2013, 85, 22–33. [Google Scholar] [CrossRef]
- Pudova, N.; Urusova, A.; Shirobokov, M.; Marchkov, A. Developing GPR surveys, data processing and interpretation techniques for criminal gravesites location. In Proceedings of the 2016 16th International Conference on Ground Penetrating Radar (GPR), Hong Kong, 13–16 June 2016; pp. 1–5. [Google Scholar] [CrossRef]
- Zhang, D.; Zhao, M.; Cheng, E.; Chen, Y. GPR-Based EMI Prediction for UAV’s Dynamic Datalink. IEEE Trans. Electromagn. Compat. 2021, 63, 19–29. [Google Scholar] [CrossRef]
- Bhardwaj, A.; Sam, L.; Martín-Torres, F.J.; Kumar, R. UAVs as remote sensing platform in glaciology: Present applications and future prospects. Remote Sens. Environ. Interdiscip. J. 2016, 175, 196–204. [Google Scholar] [CrossRef]
- Ding, M.L.; Ding, C.B.; Tang, L.; Wang, X.M.; Wu, R. A W-Band 3-D Integrated Mini-SAR System with High Imaging Resolution on UAV Platform. IEEE Access 2020, 8, 113601–113609. [Google Scholar] [CrossRef]
- Xiao, J.; Zhang, S.; Dai, Y.; Jiang, Z.; Yi, B.; Xu, C. Multiclass Object Detection in UAV Images Based on Rotation Region Network. IEEE J. Miniat. Air Space Syst. 2020, 1, 188–196. [Google Scholar] [CrossRef]
- Honkavaara, E.; Eskelinen, M.A.; Polonen, I.; Saari, H.; Ojanen, H.; Mannila, R.; Holmlund, C.; Hakala, T.; Litkey, P.; Rosnell, T.; et al. Remote Sensing of 3-D Geometry and Surface Moisture of a Peat Production Area Using Hyperspectral Frame Cameras in Visible to Short-Wave Infrared Spectral Ranges Onboard a Small Unmanned Airborne Vehicle (UAV). IEEE Trans. Geosci. Remote Sens. 2016, 54, 5440–5454. [Google Scholar] [CrossRef] [Green Version]
- Bai, H.; Sinfield, J.V. Improved background and clutter reduction for pipe detection under pavement using Ground Penetrating Radar (GPR)—ScienceDirect. J. Appl. Geophys. 2020, 172, 103918. [Google Scholar] [CrossRef]
- Rashed, M.; Harbi, H. Background matrix subtraction (BMS): A novel background removal algorithm for GPR data. J. Appl. Geophys. 2014, 106, 154–163. [Google Scholar] [CrossRef]
- Karlsen, B.; Larsen, J.; Sorensen, H.B.; Jakobsen, K.B. Comparison of PCA and ICA based clutter reduction in GPR systems for anti-personal landmine detection. In Proceedings of the 11th IEEE Signal Processing Workshop on Statistical Signal Processing (Cat. No.01TH8563), Singapore, 8 August 2001; p. 1664. [Google Scholar]
- Lin, Z.; Jiang, W. Ground Penetrating Radar B-Scan Data Modeling and Clutter Suppression. In Proceedings of the 2015 Fifth International Conference on Instrumentation and Measurement, Computer, Communication and Control (IMCCC), Qinhuangdao, China, 18–20 September 2015; pp. 397–402. [Google Scholar] [CrossRef]
- Kovalenko, V.; Yarovoy, A.G.; Ligthart, L.P. A Novel Clutter Suppression Algorithm for Landmine Detection With GPR. IEEE Trans. Geosci. Remote Sens. 2007, 45, 3740–3751. [Google Scholar] [CrossRef]
- Catapano, I.; Affinito, A.; Moro, A.D.; Alli, G.; Soldovieri, F. Forward-Looking Ground-Penetrating Radar via a Linear Inverse Scattering Approach. IEEE Trans. Geosci. Remote Sens. 2015, 53, 5624–5633. [Google Scholar] [CrossRef]
- Garcia-Fernandez, M.; Lopez, Y.A.; Andres, L.H. Airborne Multi-Channel Ground Penetrating Radar for Improvised Explosive Devices and Landmine Detection. IEEE Access 2020, 8, 165927–165943. [Google Scholar] [CrossRef]
- Zoubir, A.; Chant, I.; Brown, C.; Barkat, B.; Abeynayake, C. Signal processing techniques for landmine detection using impulse ground penetrating radar. IEEE Sens. J. 2002, 2, 41–51. [Google Scholar] [CrossRef] [Green Version]
- Solimene, R.; Cuccaro, A.; DellAversano, A.; Catapano, I.; Soldovieri, F. Ground Clutter Removal in GPR Surveys. IEEE J. Sel. Top. Appl. Earth Obs. Remote Sens. 2014, 7, 792–798. [Google Scholar] [CrossRef]
- Chen, G.; Fu, L.; Chen, K.; Boateng, C.D.; Ge, S. Adaptive Ground Clutter Reduction in Ground-Penetrating Radar Data Based on Principal Component Analysis. IEEE Trans. Geosci. Remote Sens. 2019, 57, 3271–3282. [Google Scholar] [CrossRef]
- Aubry, A.; De Maio, A.; Huang, Y.; Piezzo, M. Robust Design of Radar Doppler Filters. IEEE Trans. Signal Process. 2016, 64, 5848–5860. [Google Scholar] [CrossRef]
- Warren, C.; Giannopoulos, A.; Giannakis, I. gprMax: Open source software to simulate electromagnetic wave propagation for Ground Penetrating Radar. Comput. Phys. Commun. 2016, 209, 163–170. [Google Scholar] [CrossRef] [Green Version]
- Abujarad, F.; Jostingmeier, A.; Omar, A.S. Clutter removal for landmine using different signal processing techniques. In Proceedings of the Tenth International Conference on Grounds Penetrating Radar, GPR 2004, Delft, The Netherlands, 21–24 June 2004; pp. 697–700. [Google Scholar]
- Brunzell, H. Detection of shallowly buried objects using impulse radar. IEEE Trans. Geosci. Remote Sens. 1999, 37, 875–886. [Google Scholar] [CrossRef]
- Abujarad, F.; Nadim, G.; Omar, A. Clutter reduction and detection of landmine objects in ground penetrating radar data using singular value decomposition (SVD). In Proceedings of the 3rd International Workshop on Advanced Ground Penetrating Radar, IWAGPR 2005, Delft, The Netherlands, 2–3 May 2005; pp. 37–42. [Google Scholar] [CrossRef]
- Nuzzo, L.; Quarta, T. Improvement in GPR coherent noise attenuation using ¦Ó and wavelet transforms. Geophysics 2004, 69, 67–71. [Google Scholar] [CrossRef]
- Dobson, M.C. Microwave Dielectric Behavior of Wet Soil-Part II: Dielectric Mixing Models. IEEE Trans. Geosci. Remote Sens. 1985, GE-23, 35–46. [Google Scholar] [CrossRef]
- Hallikainen, M.T.; Ulaby, F.T.; Dobson, M.C.; El-rayes, M.A.; Wu, L. Microwave Dielectric Behavior of Wet Soil-Part 1: Empirical Models and Experimental Observations. IEEE Trans. Geosci. Remote Sens. 1985, GE-23, 25–34. [Google Scholar] [CrossRef]
- Trabelsi, S.; Nelson, S.O. Influence of Nonequilibrated Water on Microwave Dielectric Properties of Wheat and Related Errors in Moisture Sensing. IEEE Trans. Instrum. Meas. 2007, 56, 194–198. [Google Scholar] [CrossRef]
- Warren, C.; Giannopoulos, A.; Gray, A.; Giannakis, I.; Patterson, A.; Wetter, L.; Hamrah, A. A CUDA-based GPU engine for gprMax: Open source FDTD electromagnetic simulation software. Comput. Phys. Commun. 2019, 237, 208–218. [Google Scholar] [CrossRef]
- Emanuele, P.M.F. Review of multi-offset GPR applications: Data acquisition, processing and analysis. In Signal Processing: The Official Publication of the European Association for Signal Processing (EURASIP); Elsevier: Amsterdam, The Netherlands, 2017. [Google Scholar]
- Ipo, D.; Duan, G. A Lightweight and Low-Power UAV-Borne Ground Penetrating Radar Design for Landmine Detection. Sensors 2020, 20, 2234. [Google Scholar]
- Luo, W.; Lee, Y.H.; Ow, L.F.; Yusof, M.L.M.; Yucel, A.C. Accurate Tree Roots Positioning and Sizing Over Undulated Ground Surfaces by Common Offset GPR Measurements. IEEE Trans. Instrum. Meas. 2022, 71, 1–11. [Google Scholar] [CrossRef]
- González-Díaz, M.; García-Fernández, M.; Lvarez-López, Y.; Las-Heras, F. Improvement of GPR SAR-Based Techniques for Accurate Detection and Imaging of Buried Objects. IEEE Trans. Instrum. Meas. 2020, 69, 3126–3138. [Google Scholar] [CrossRef] [Green Version]
- Fallahpour, M.; Case, J.T.; Ghasr, M.T.; Zoughi, R. Piecewise and Wiener Filter-Based SAR Techniques for Monostatic Microwave Imaging of Layered Structures. IEEE Trans. Antennas Propag. 2014, 62, 282–294. [Google Scholar] [CrossRef]
- Schneider, W.A. Integral formulation for migration in two and three dimensions. Geophysics 1978, 43, 49–76. [Google Scholar] [CrossRef]
- Gazdag, J. Wave equation migration with the phase-shift method. Geophysics 1978, 43, 1342–1351. [Google Scholar]
- Stolt, R.H. Migration by transform. Geophysics 1978, 43, 23–48. [Google Scholar] [CrossRef]
- Mostapha, A.; Alsharahi, G.; Faize, A.; Driouach, A. Effect of the Variation in Humidity of the Medium on the GPR Radar Response. Proceedings 2020, 63, 37. [Google Scholar]
Figure 1.
The real picture of UAV-GPR System. (a) The architecture of the system, including four modules: UAV platform, radar transceiver module, data acquisition module, and signal processing module. (b) The UAV-GPR system is in flight above the mountain.
Figure 1.
The real picture of UAV-GPR System. (a) The architecture of the system, including four modules: UAV platform, radar transceiver module, data acquisition module, and signal processing module. (b) The UAV-GPR system is in flight above the mountain.

Figure 2.
The ultra-wideband Vivaldi antennas. (a) The schematic of antennas with the total length of 30 cm and the total width of 25 cm. (b) The field structure of the antennas, where the electric field plane is parallel to the antenna plane, and the magnetic field plane is perpendicular to it.
Figure 2.
The ultra-wideband Vivaldi antennas. (a) The schematic of antennas with the total length of 30 cm and the total width of 25 cm. (b) The field structure of the antennas, where the electric field plane is parallel to the antenna plane, and the magnetic field plane is perpendicular to it.

Figure 3.
The test result of the second−order Gaussian pulse with some redundant tails, which does not affect the test performance of system.
Figure 3.
The test result of the second−order Gaussian pulse with some redundant tails, which does not affect the test performance of system.

Figure 4.
The spectrum components measured are plotted, and it can be observed that the bandwidths of the transmitted signal are wide.
Figure 4.
The spectrum components measured are plotted, and it can be observed that the bandwidths of the transmitted signal are wide.

Figure 5.
The antenna pattern of UAV−GPR system. The antenna has a good directivity, and the main lobe lies in near the position of 0 degrees.
Figure 5.
The antenna pattern of UAV−GPR system. The antenna has a good directivity, and the main lobe lies in near the position of 0 degrees.

Figure 6.
The schematic diagram of UAV−GPR system. A single radar echo is mainly composed of direct coupled wave between transmitter and receiver c(t), direct reflected wave from the ground , the echo of the underground target and the noise in environment .
Figure 6.
The schematic diagram of UAV−GPR system. A single radar echo is mainly composed of direct coupled wave between transmitter and receiver c(t), direct reflected wave from the ground , the echo of the underground target and the noise in environment .

Figure 7.
The diagram of signal processing, consisting of four processing steps: clutter subtraction, electromagnetic interference removal, rotor interference suppression, and gain processing.
Figure 7.
The diagram of signal processing, consisting of four processing steps: clutter subtraction, electromagnetic interference removal, rotor interference suppression, and gain processing.

Figure 8.
The A−Scans of water and soil, where the peak-to-peak values are extracted for permittivity estimation.
Figure 8.
The A−Scans of water and soil, where the peak-to-peak values are extracted for permittivity estimation.

Figure 9.
The model of simulations, including the transmitted antenna and received antenna, free space, metal cylinder, and wet sand.
Figure 9.
The model of simulations, including the transmitted antenna and received antenna, free space, metal cylinder, and wet sand.

Figure 10.
The visual results from simulated dataset. (a) Raw data image. (b) Mean subtraction method. (c) Moving average method. (d) Proposed CCBS method. By comparison, the proposed CCBS method can highlight the target position more clearly, and the better background removal effect is presented even in a noisy environment.

Figure 11.
The scene of rotor interference test in the case of (a) UAV-GPR with rotors and (b) UAV-GPR without rotors.
Figure 11.
The scene of rotor interference test in the case of (a) UAV-GPR with rotors and (b) UAV-GPR without rotors.

Figure 12.
The comparison results of rotor interference test (a) with rotors and the motors working and (b) without rotors but the motor working (c) under the case of (a) by LDF technique.
Figure 12.
The comparison results of rotor interference test (a) with rotors and the motors working and (b) without rotors but the motor working (c) under the case of (a) by LDF technique.

Figure 13.
The static experiments are implemented to verify the penetration of the GPR transceiver module with linearly polarized antennas, where the transceiver antennas are supported by a wooden frame. (a) The close-up photograph. (b) The full-scene photograph.
Figure 13.
The static experiments are implemented to verify the penetration of the GPR transceiver module with linearly polarized antennas, where the transceiver antennas are supported by a wooden frame. (a) The close-up photograph. (b) The full-scene photograph.

Figure 14.
The measurement results of static experiments.

Figure 15.
The experimental scene of a bridge. The UAV-GPR flies in Z direction, where the Z direction is pointing in the direction perpendicular to the page.
Figure 15.
The experimental scene of a bridge. The UAV-GPR flies in Z direction, where the Z direction is pointing in the direction perpendicular to the page.

Figure 16.
The measurement results of the bridge experiments. (a) Original data. (b) Mean subtraction method. (c) Moving average method. (d) Proposed CCBS method. The red line at the top of the figure refers to the ground location, which is used as the reference for underground targets. It is observed from Figure 16d that the proposed CCBS method not only look at the bridge deck, but also observe the water surface, showing a better performance than the two other methods.


Figure 17.
The results of each step corresponding to Figure 7. (a) CCBS clutter subtraction. (b) Electromagnetic interference removal. (c) Rotor interference suppression. (d) Gain processing. With the increase of processing steps, the clutter and some interference are gradually removed, and then the location of underground target is more and more prominent.


Table 1.
Performance comparison.
| Methods | SSIM |
|---|---|
| Mean subtraction method | 0.0479 |
| Moving average method | 0.7059 |
| CCBS | 0.9355 |
Publisher’s Note: MDPI stays neutral with regard to jurisdictional claims in published maps and institutional affiliations. |
© 2022 by the authors. Licensee MDPI, Basel, Switzerland. This article is an open access article distributed under the terms and conditions of the Creative Commons Attribution (CC BY) license (https://creativecommons.org/licenses/by/4.0/).
Share and Cite
MDPI and ACS Style
Wu, S.; Wang, L.; Zeng, X.; Wang, F.; Liang, Z.; Ye, H. UAV-Mounted GPR for Object Detection Based on Cross-Correlation Background Subtraction Method. Remote Sens. 2022, 14, 5132. https://doi.org/10.3390/rs14205132
AMA Style
Wu S, Wang L, Zeng X, Wang F, Liang Z, Ye H. UAV-Mounted GPR for Object Detection Based on Cross-Correlation Background Subtraction Method. Remote Sensing. 2022; 14(20):5132. https://doi.org/10.3390/rs14205132
Chicago/Turabian StyleWu, Shuxian, Longxiang Wang, Xiaozhen Zeng, Feng Wang, Zichang Liang, and Hongxia Ye. 2022. "UAV-Mounted GPR for Object Detection Based on Cross-Correlation Background Subtraction Method" Remote Sensing 14, no. 20: 5132. https://doi.org/10.3390/rs14205132
Note that from the first issue of 2016, this journal uses article numbers instead of page numbers. See further details here.