
Quantifying the Influence of Climate Change and Anthropogenic Activities on the Net Primary Productivity of China’s Grasslands
Abstract
:
1. Introduction
2. Materials and Methods
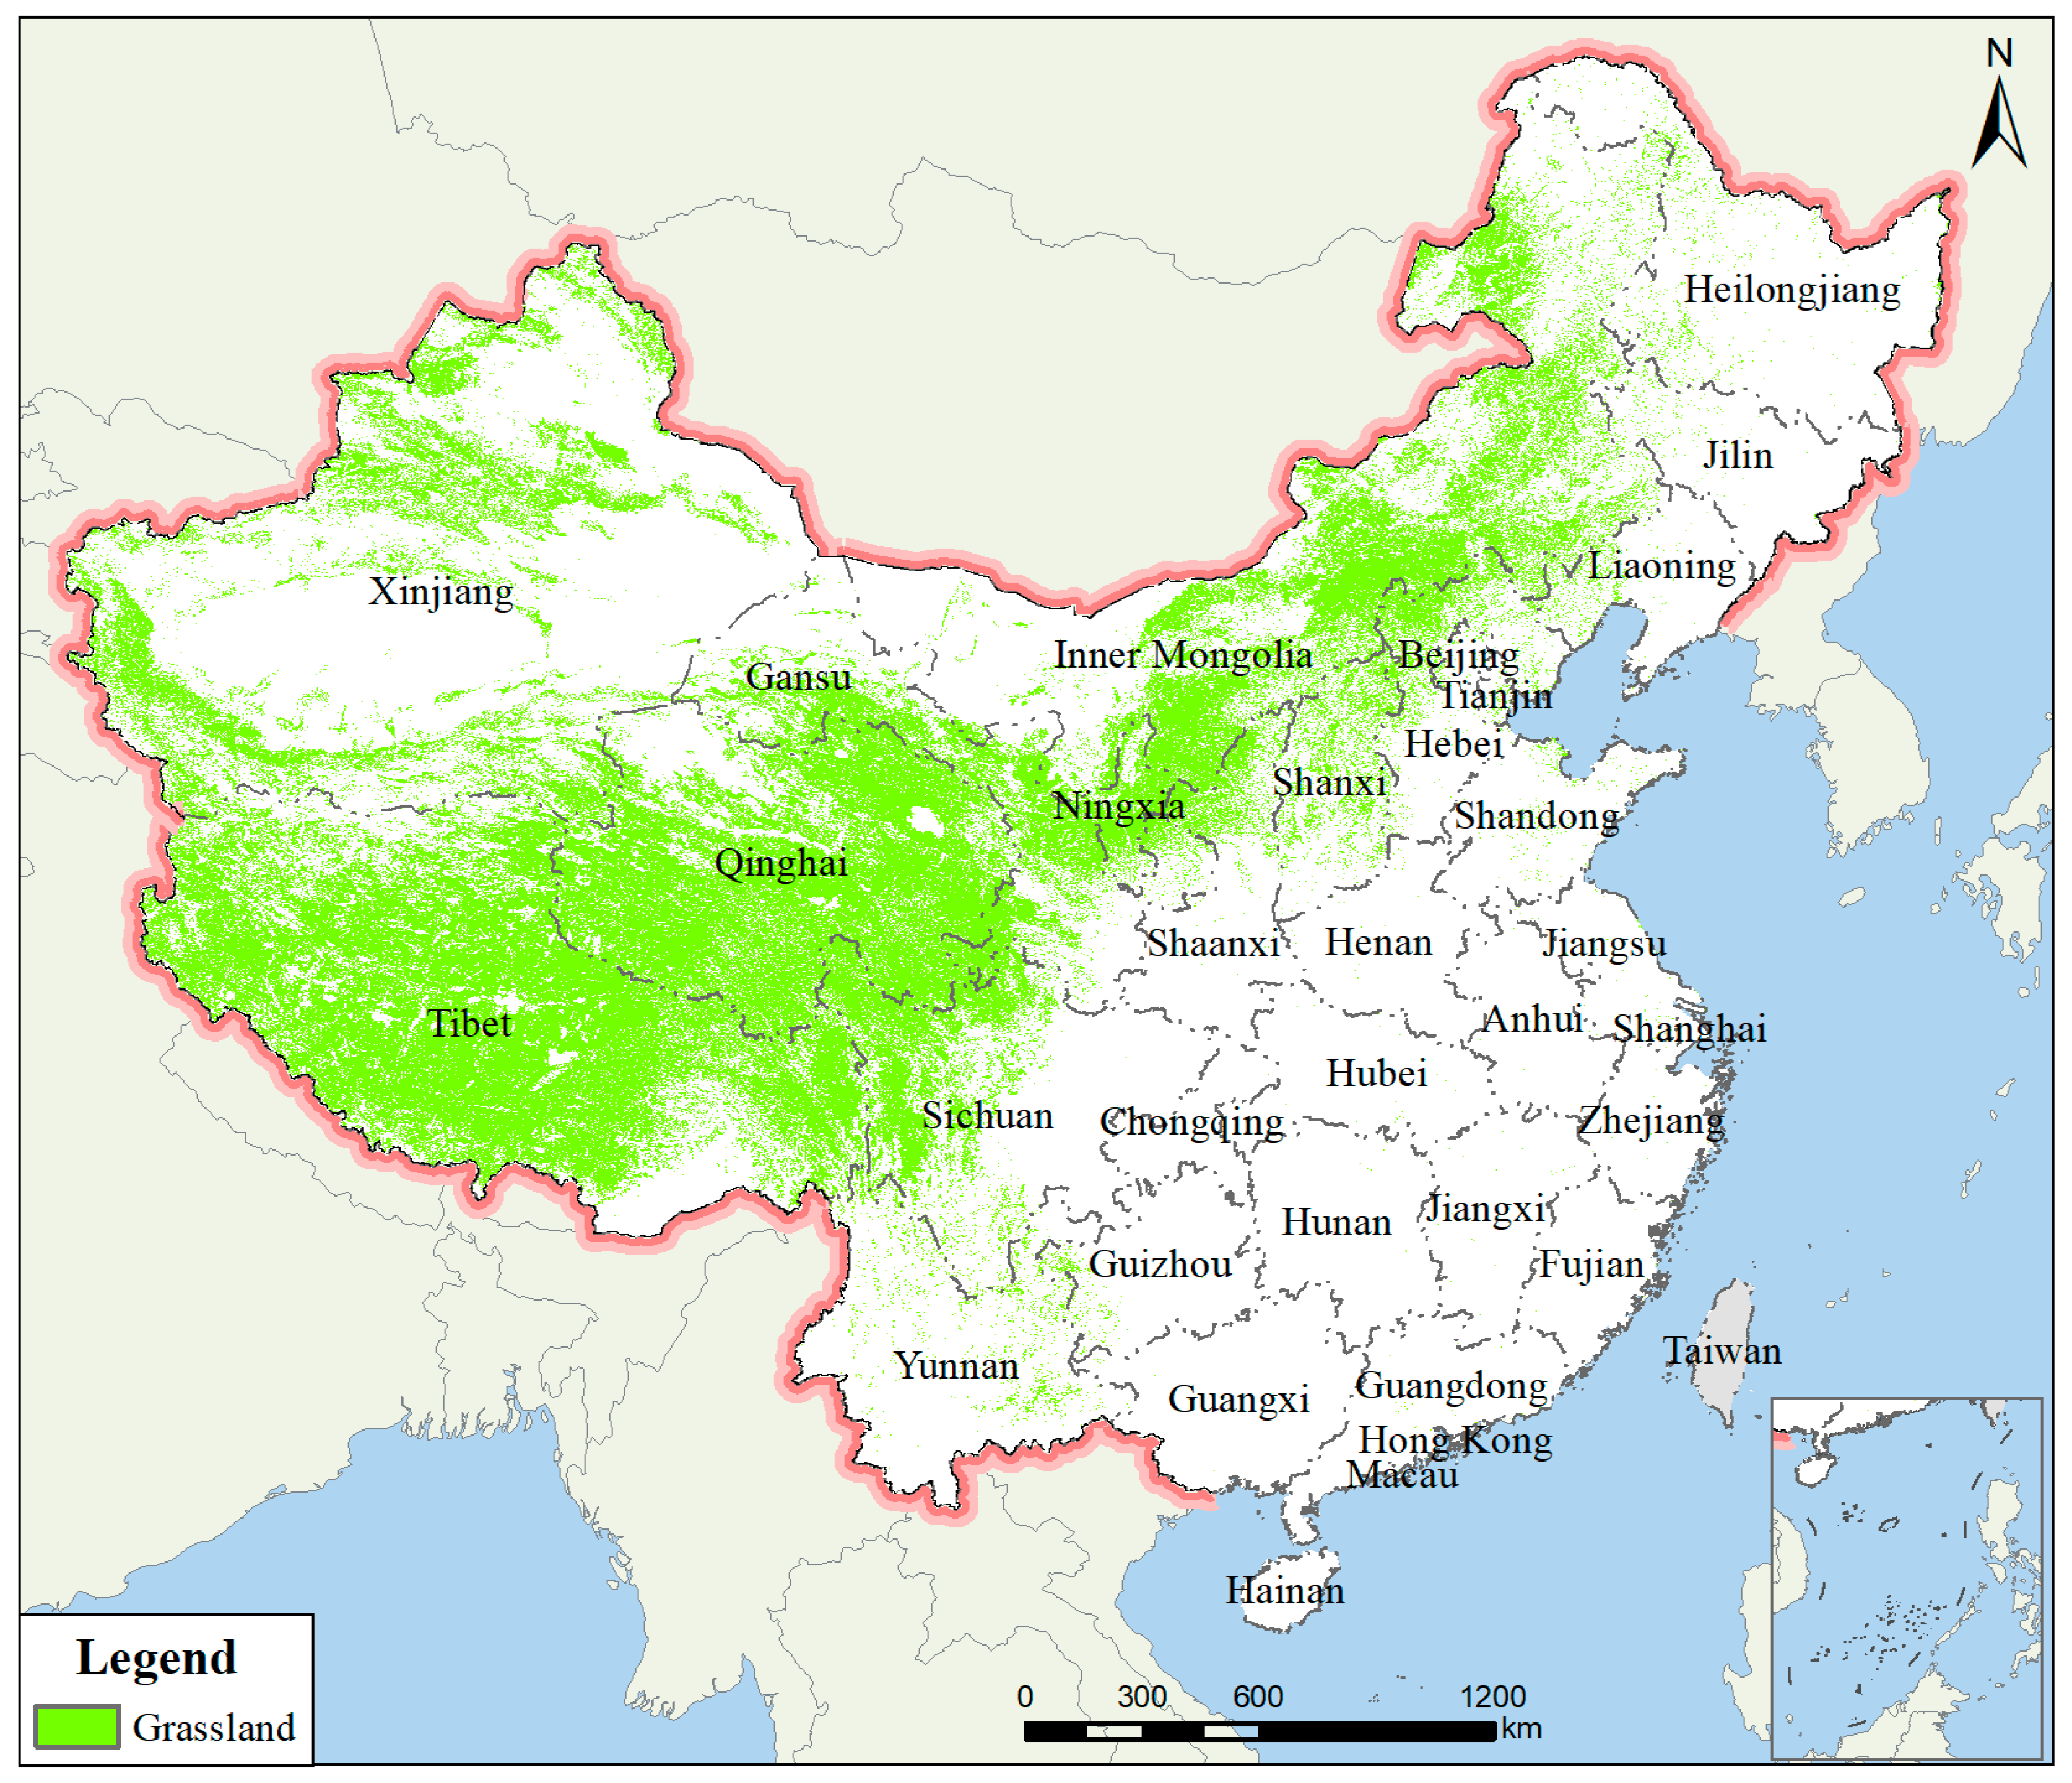
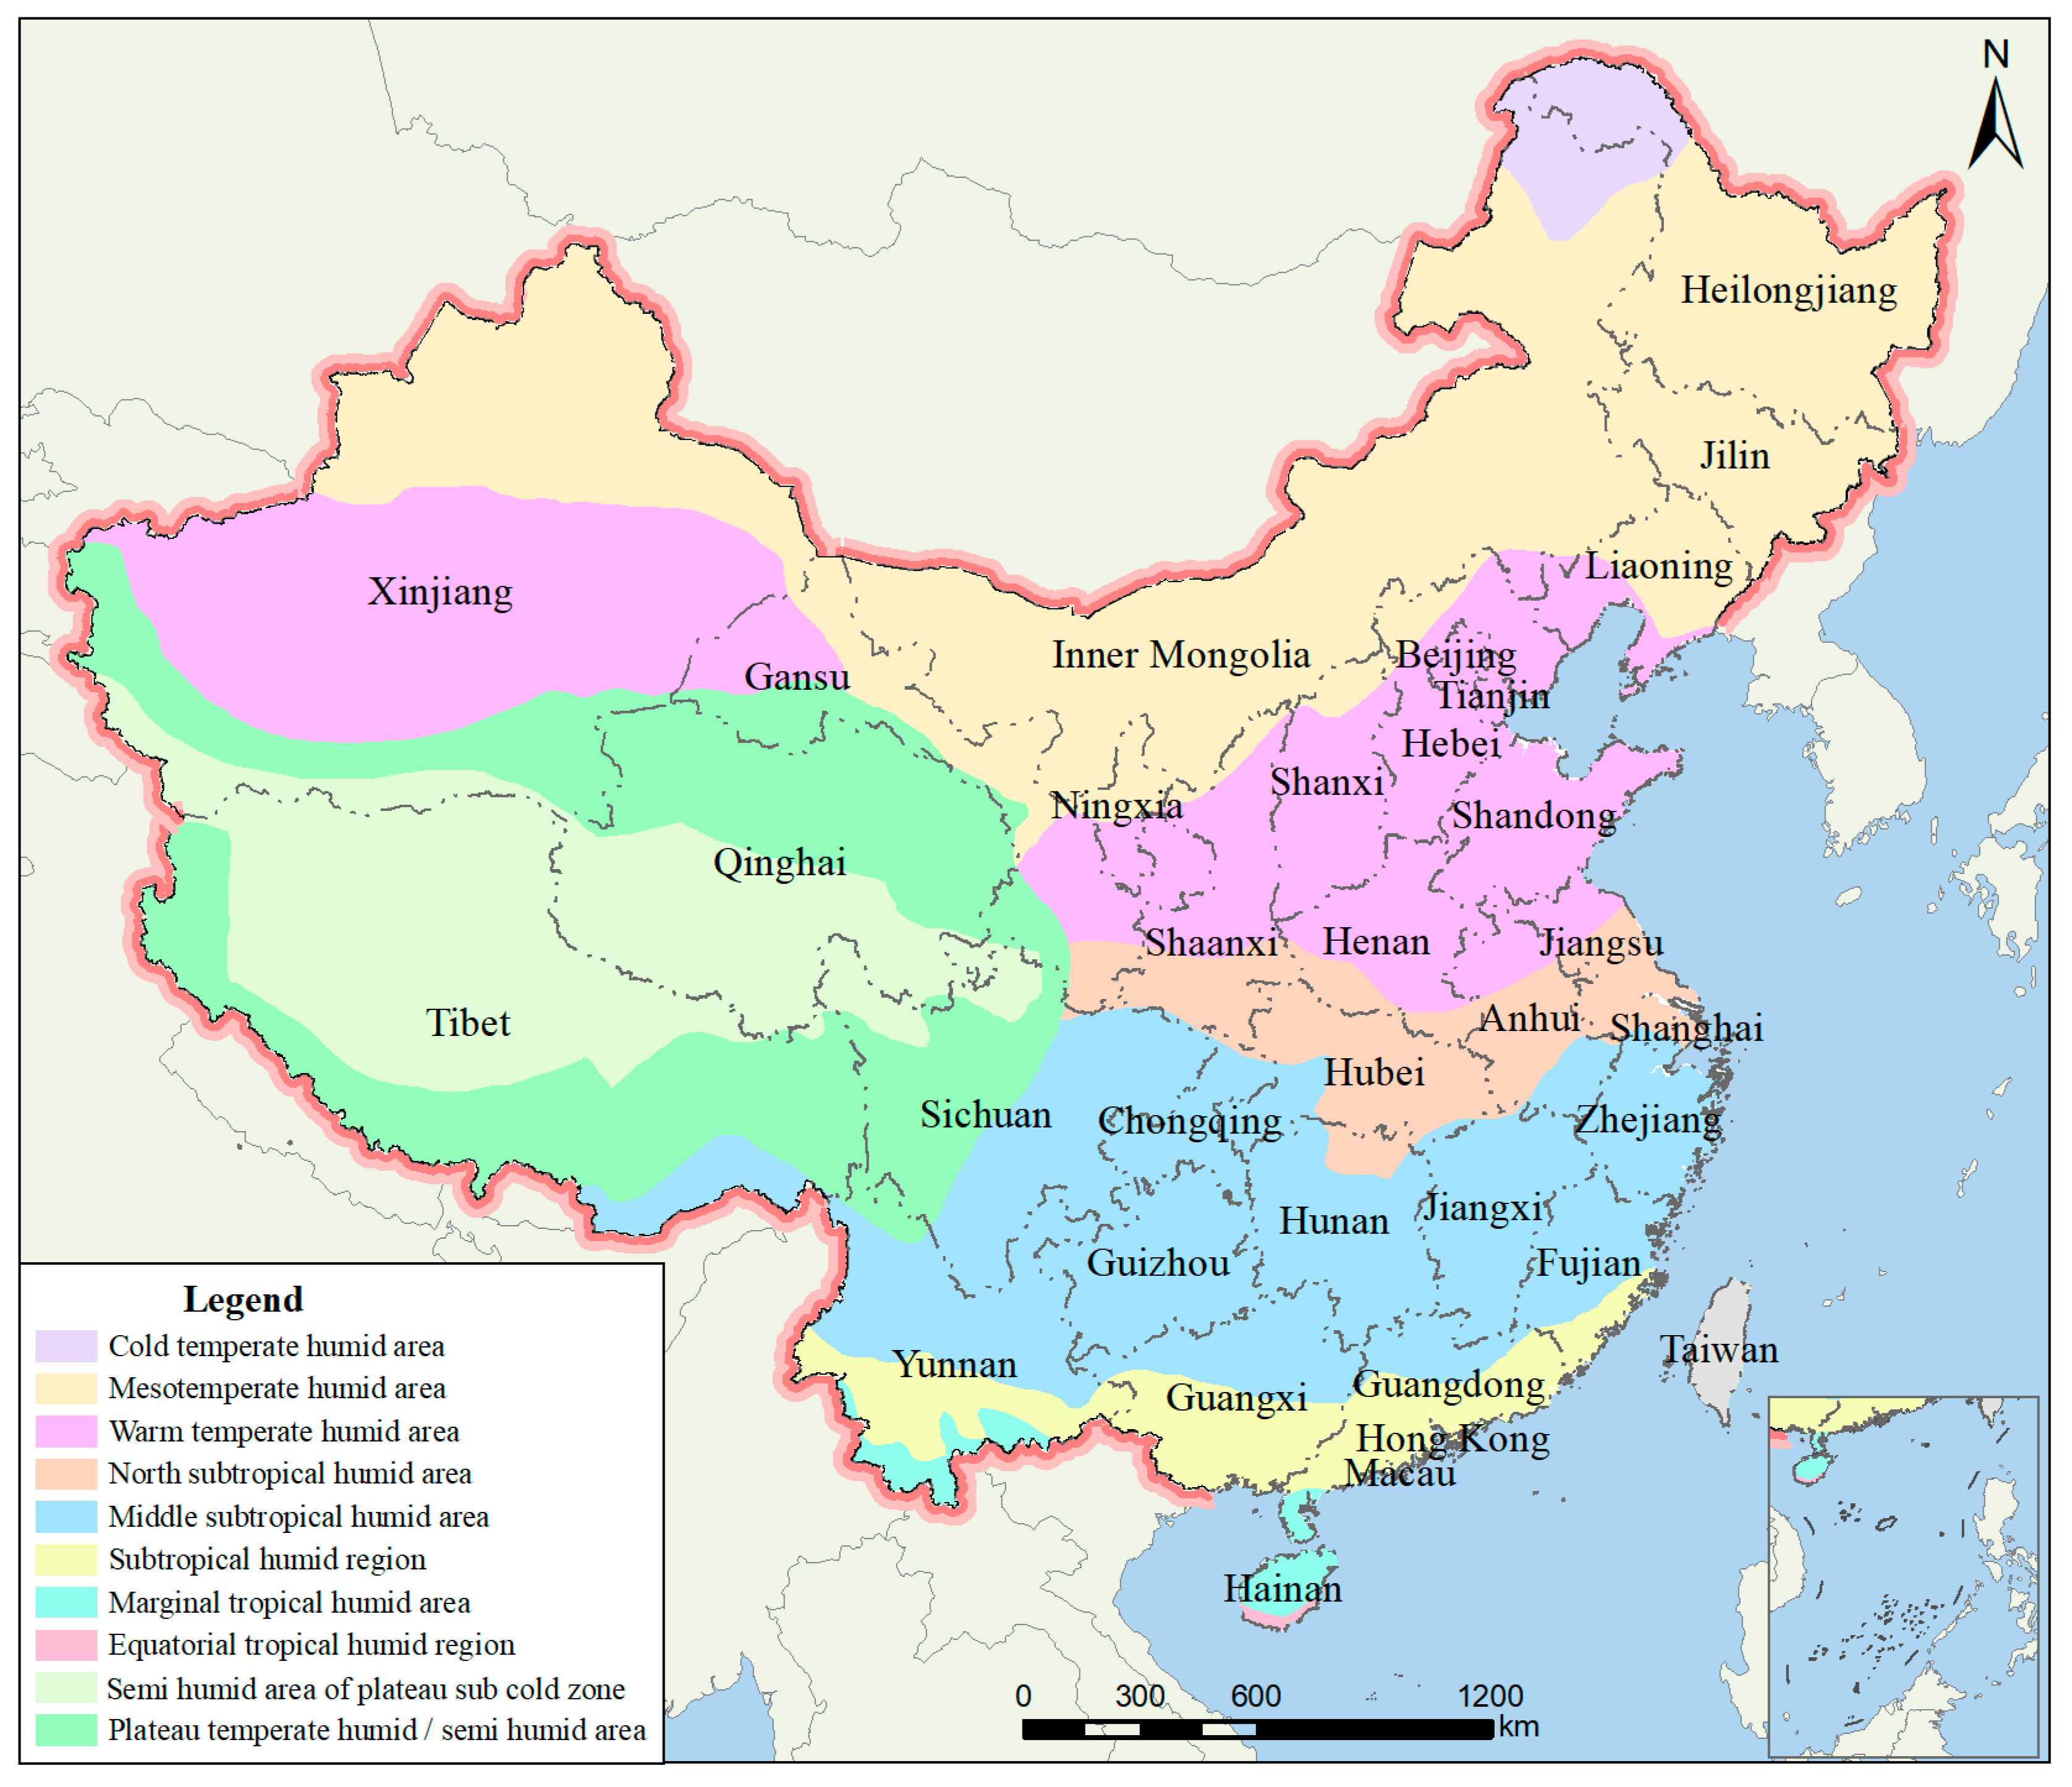
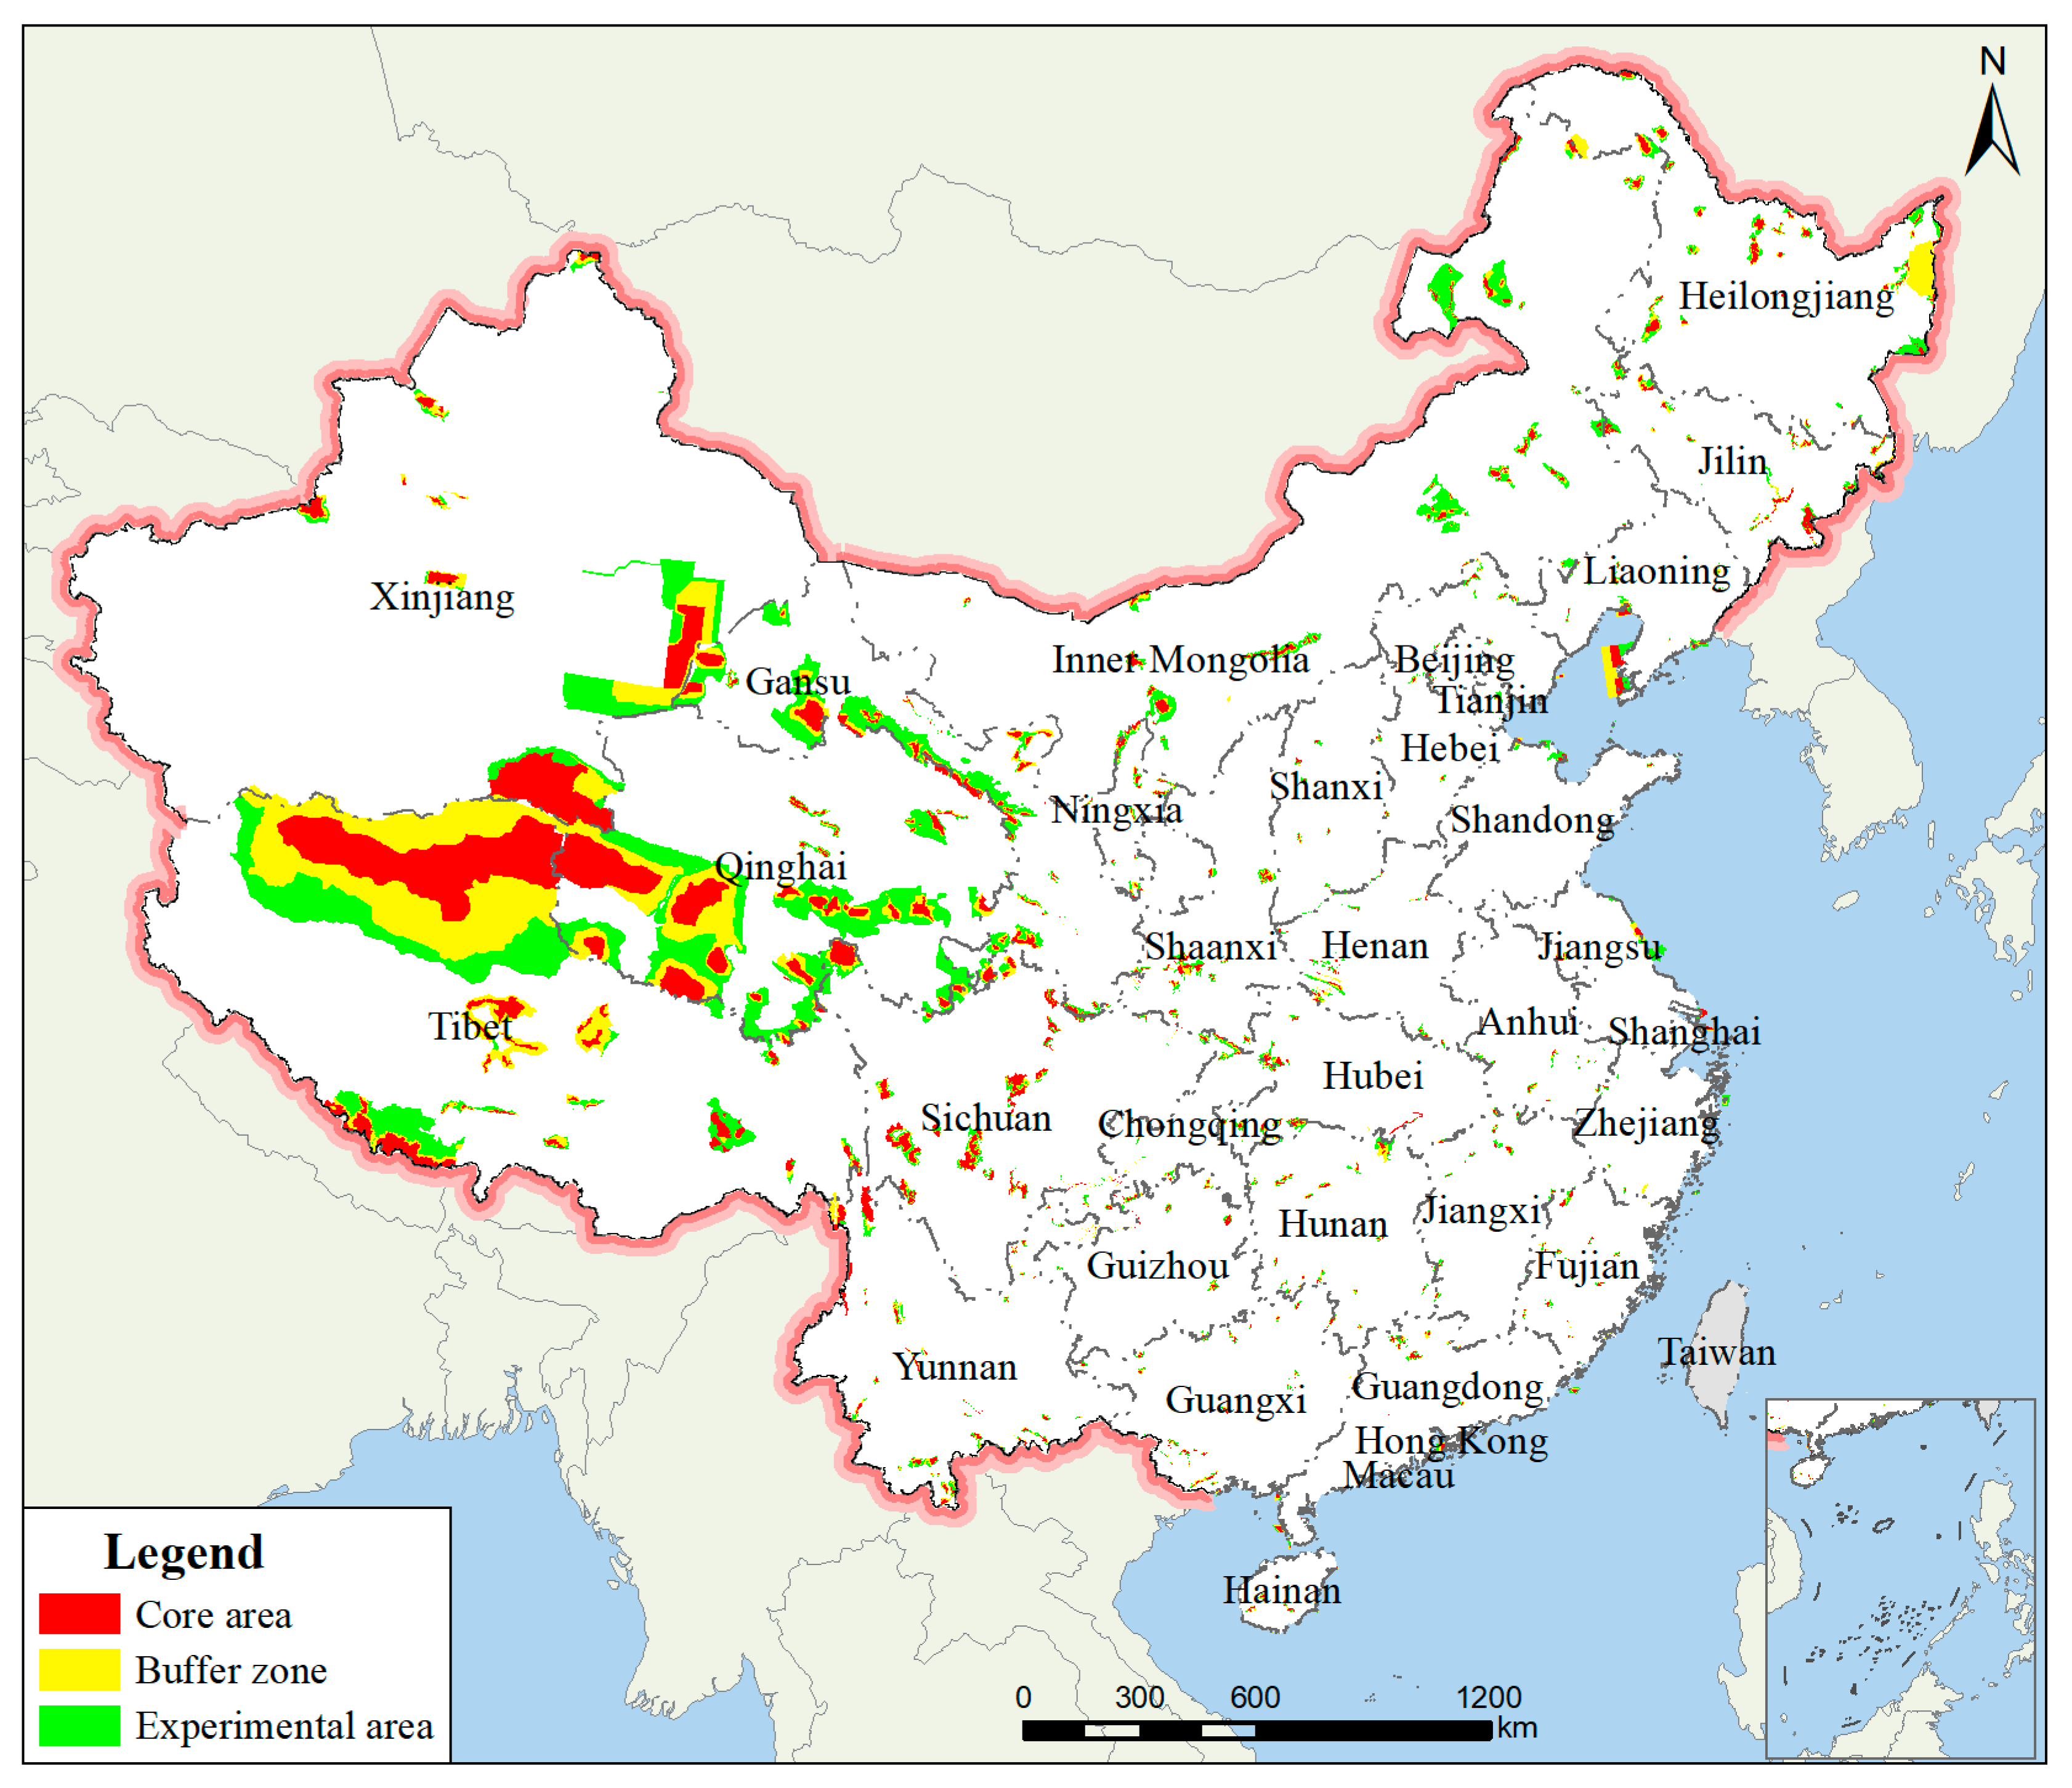
2.1. Study Area
2.2. Data Sources
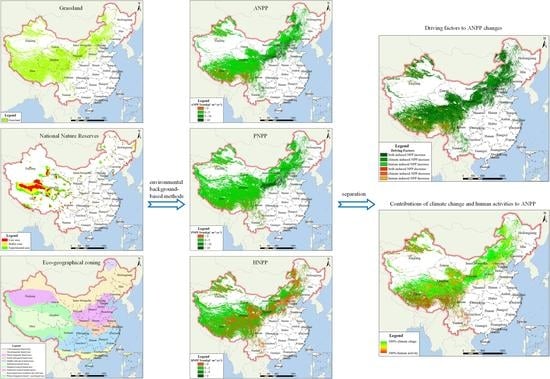
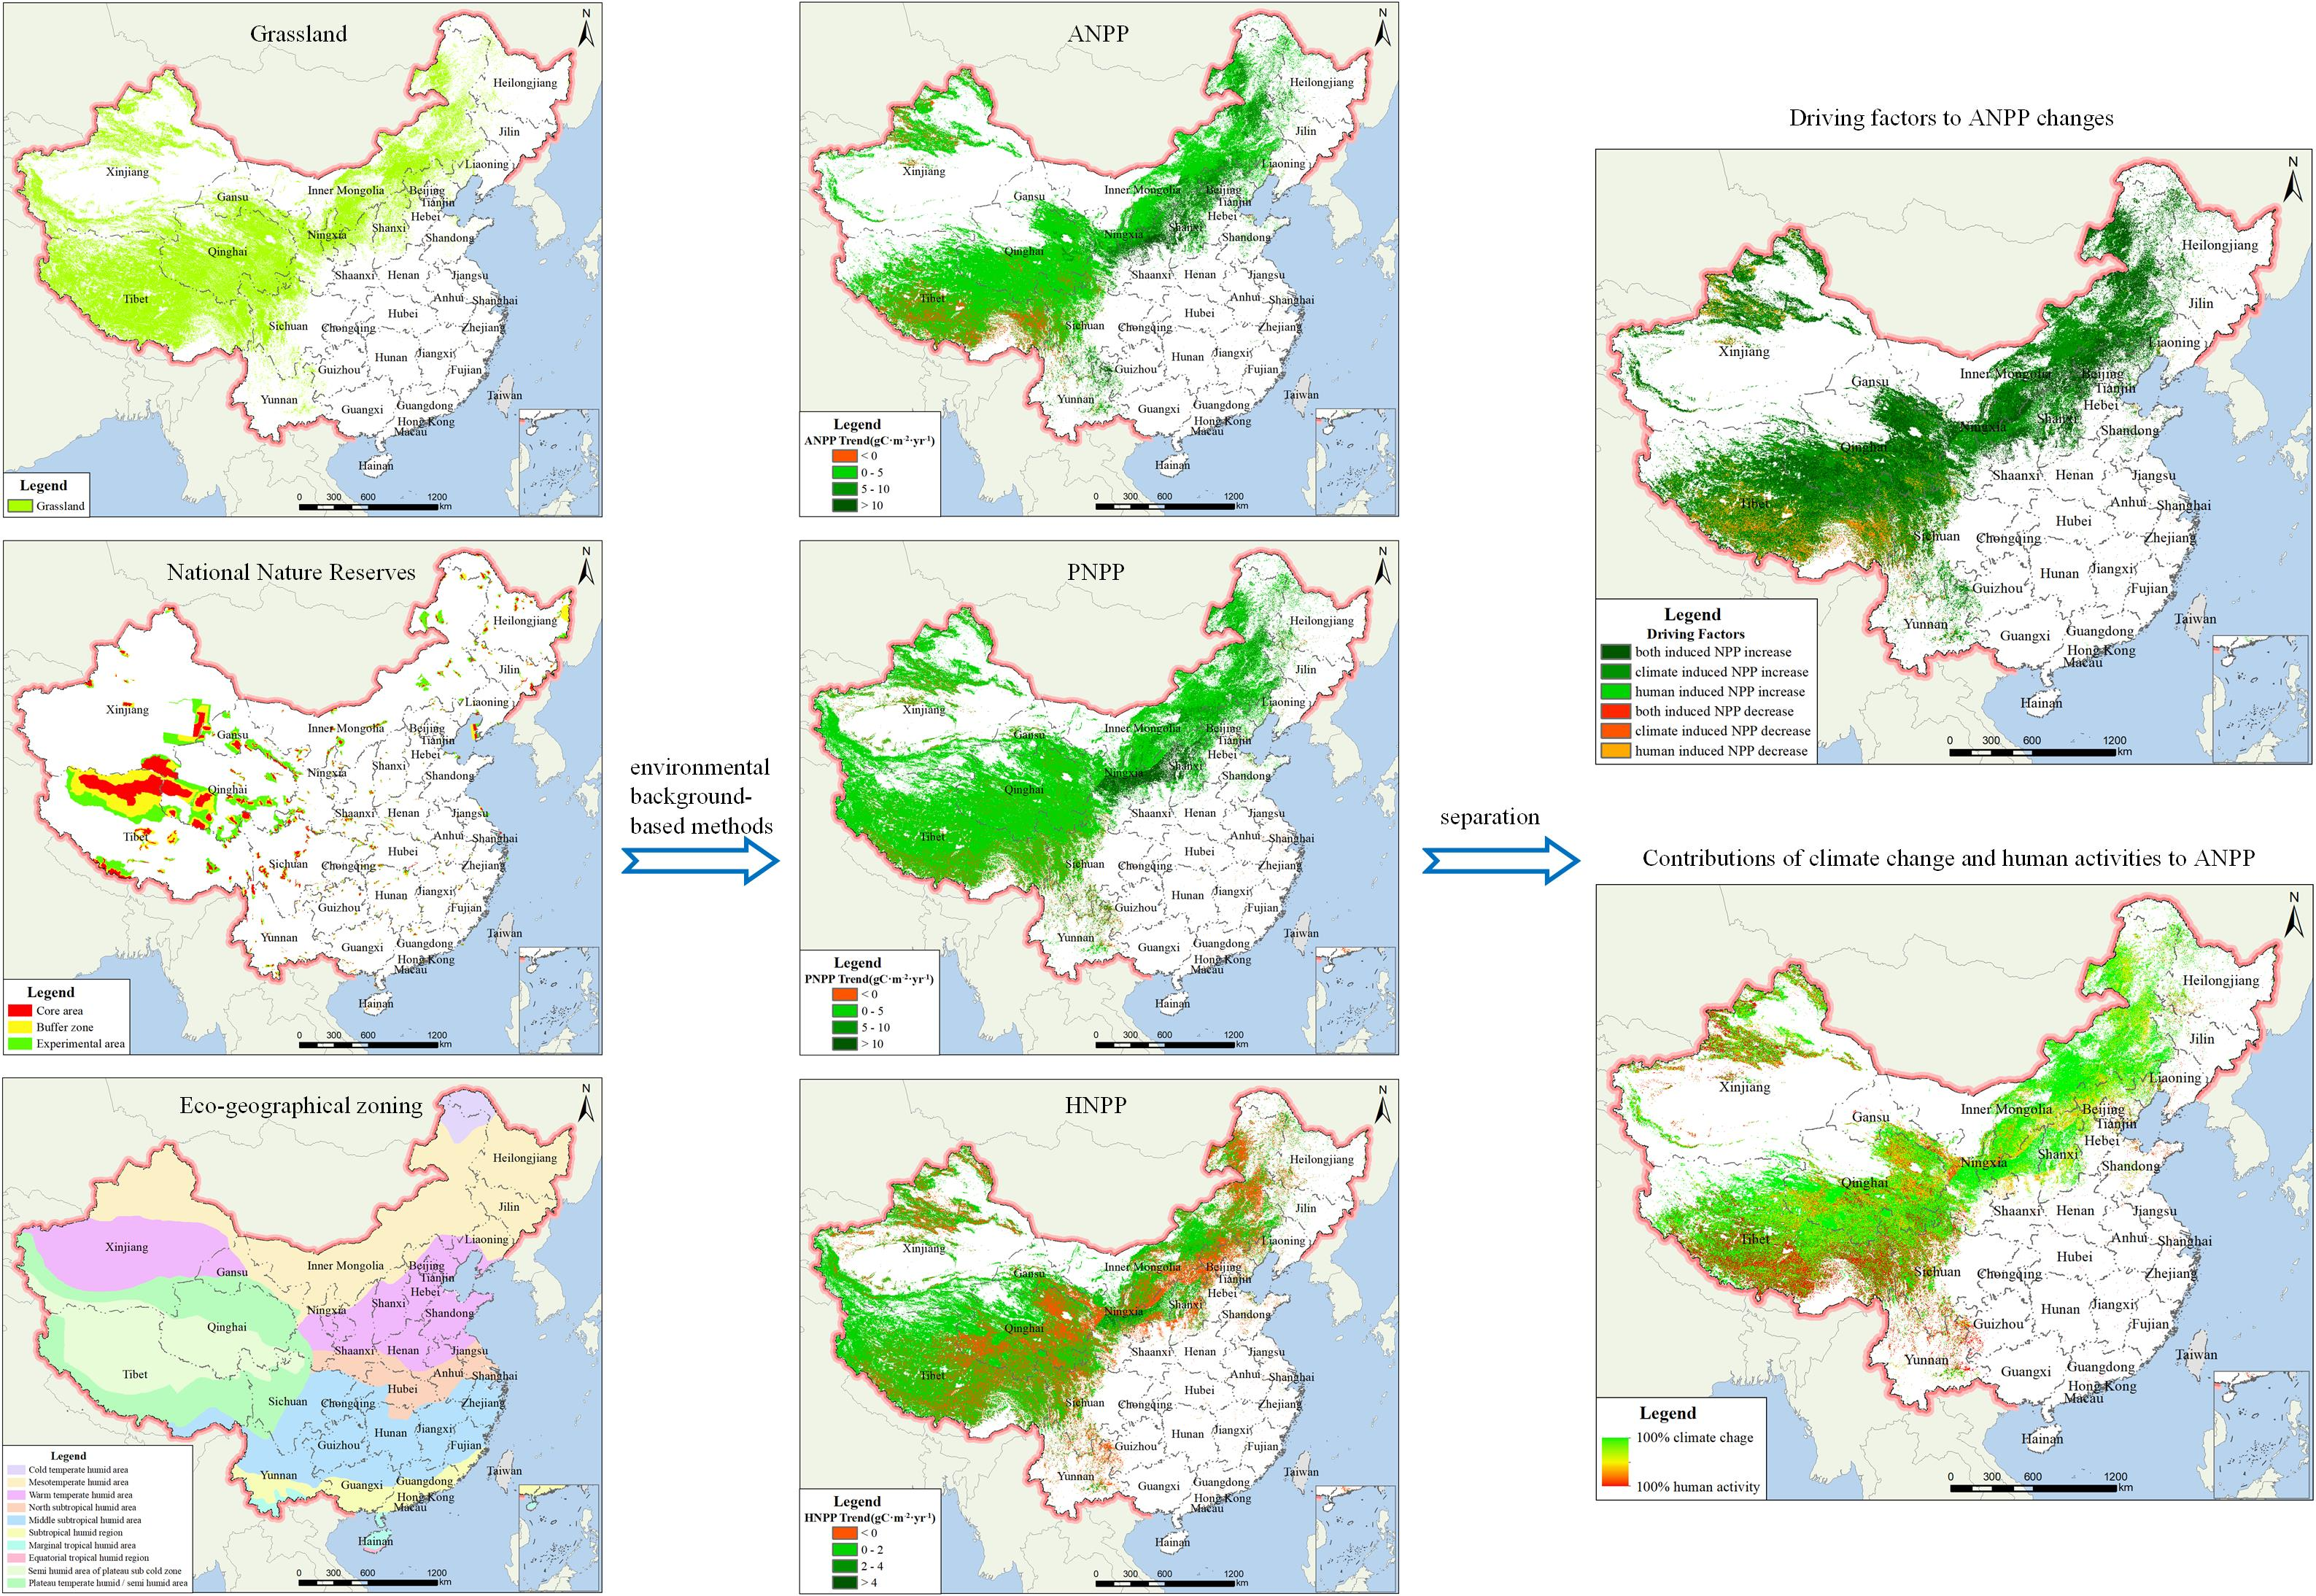
2.3. Methods
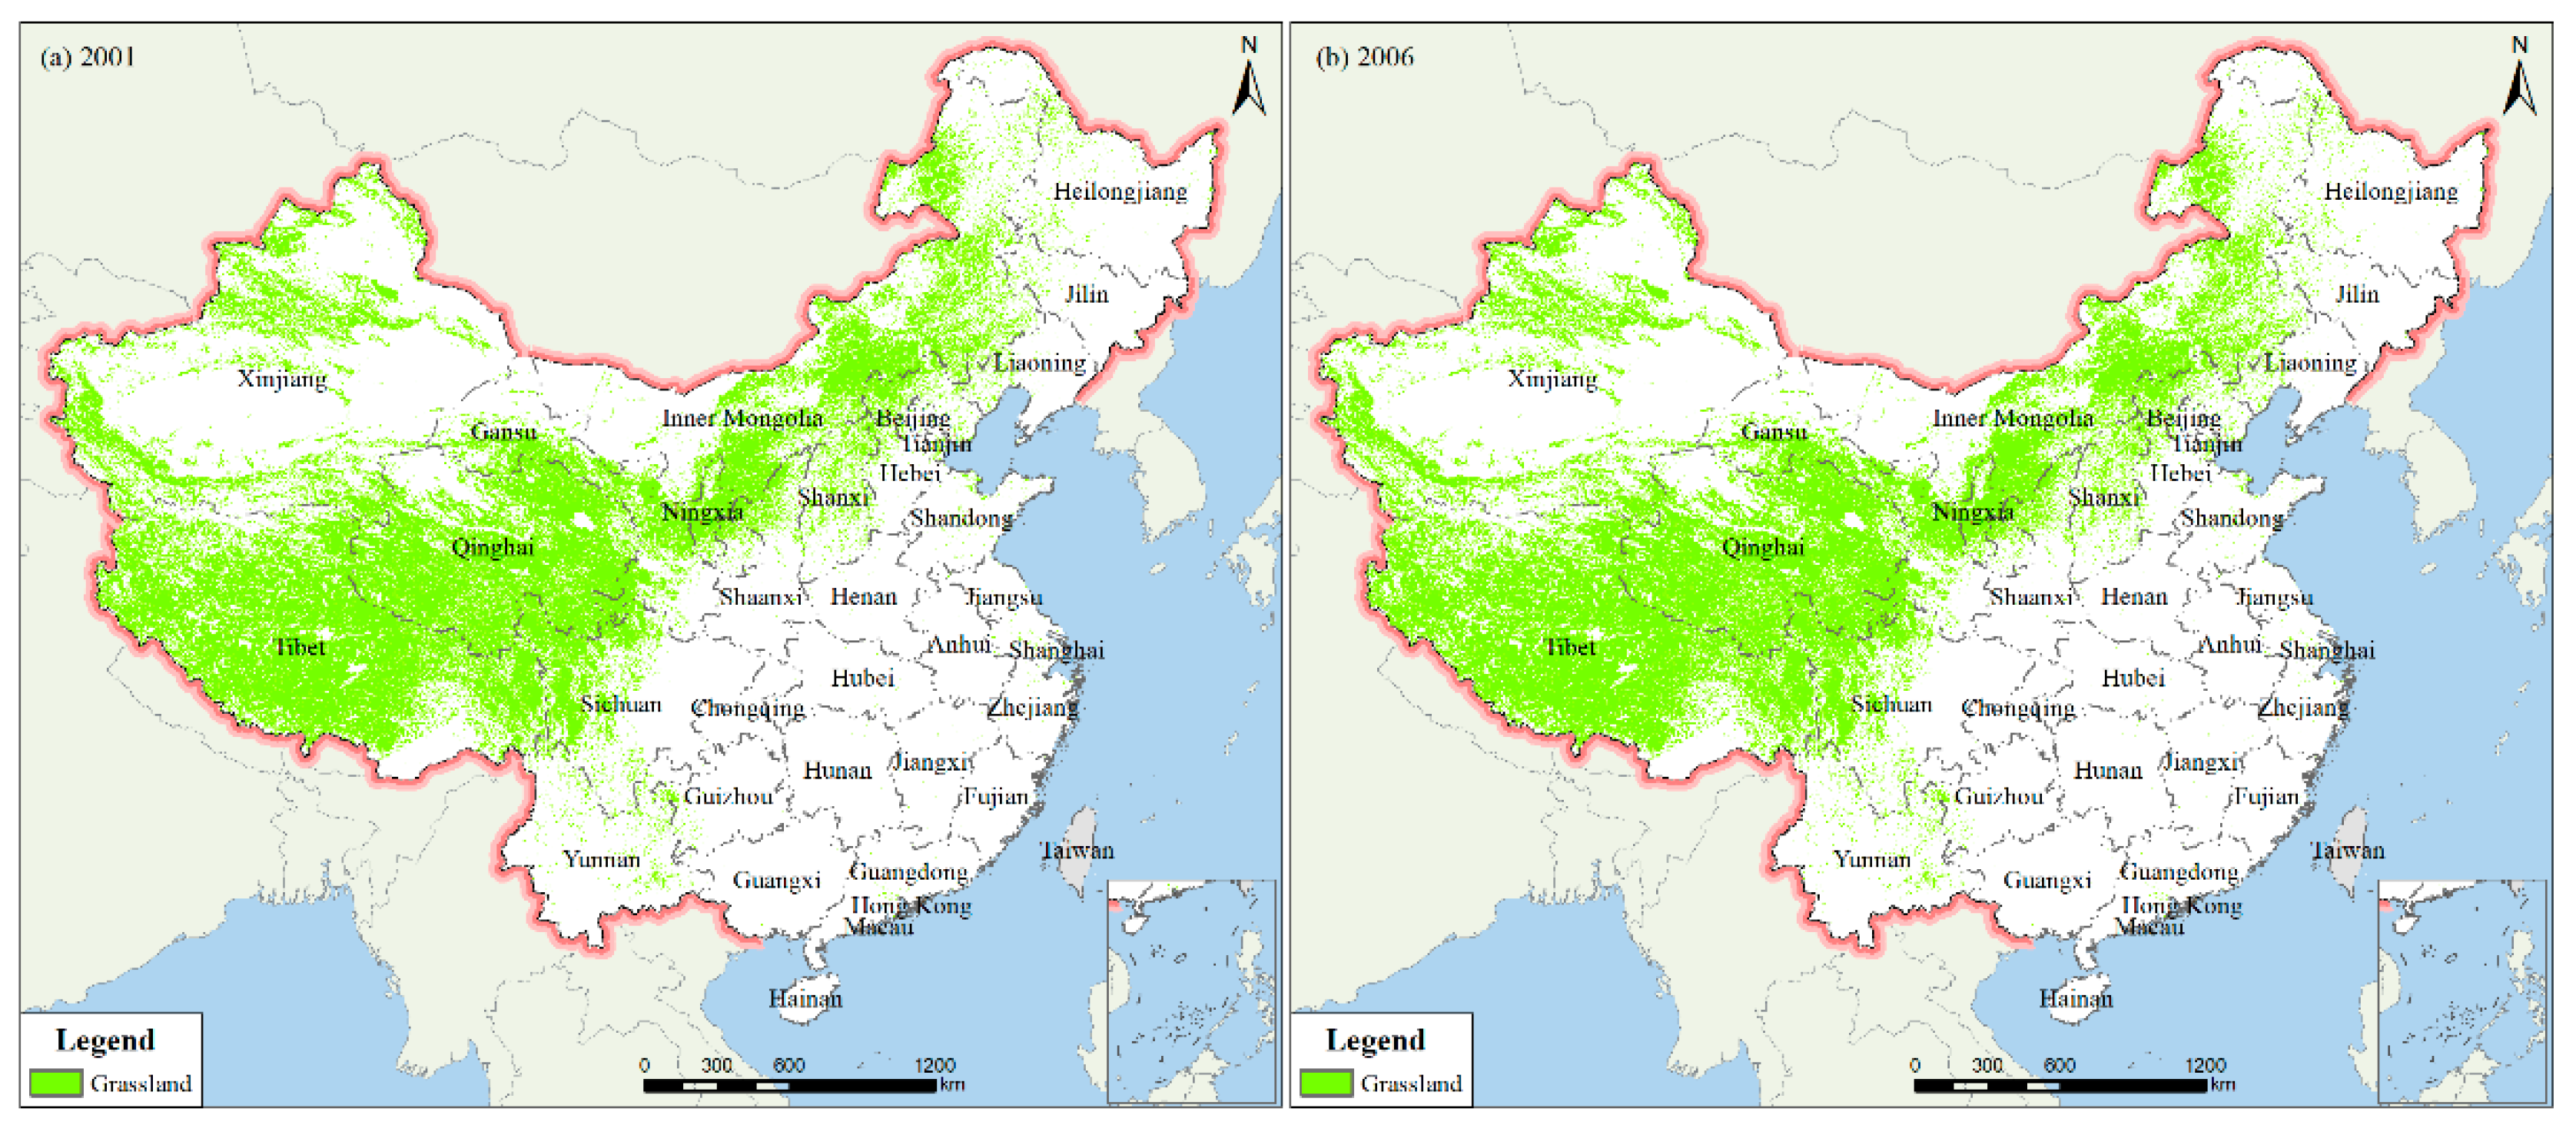
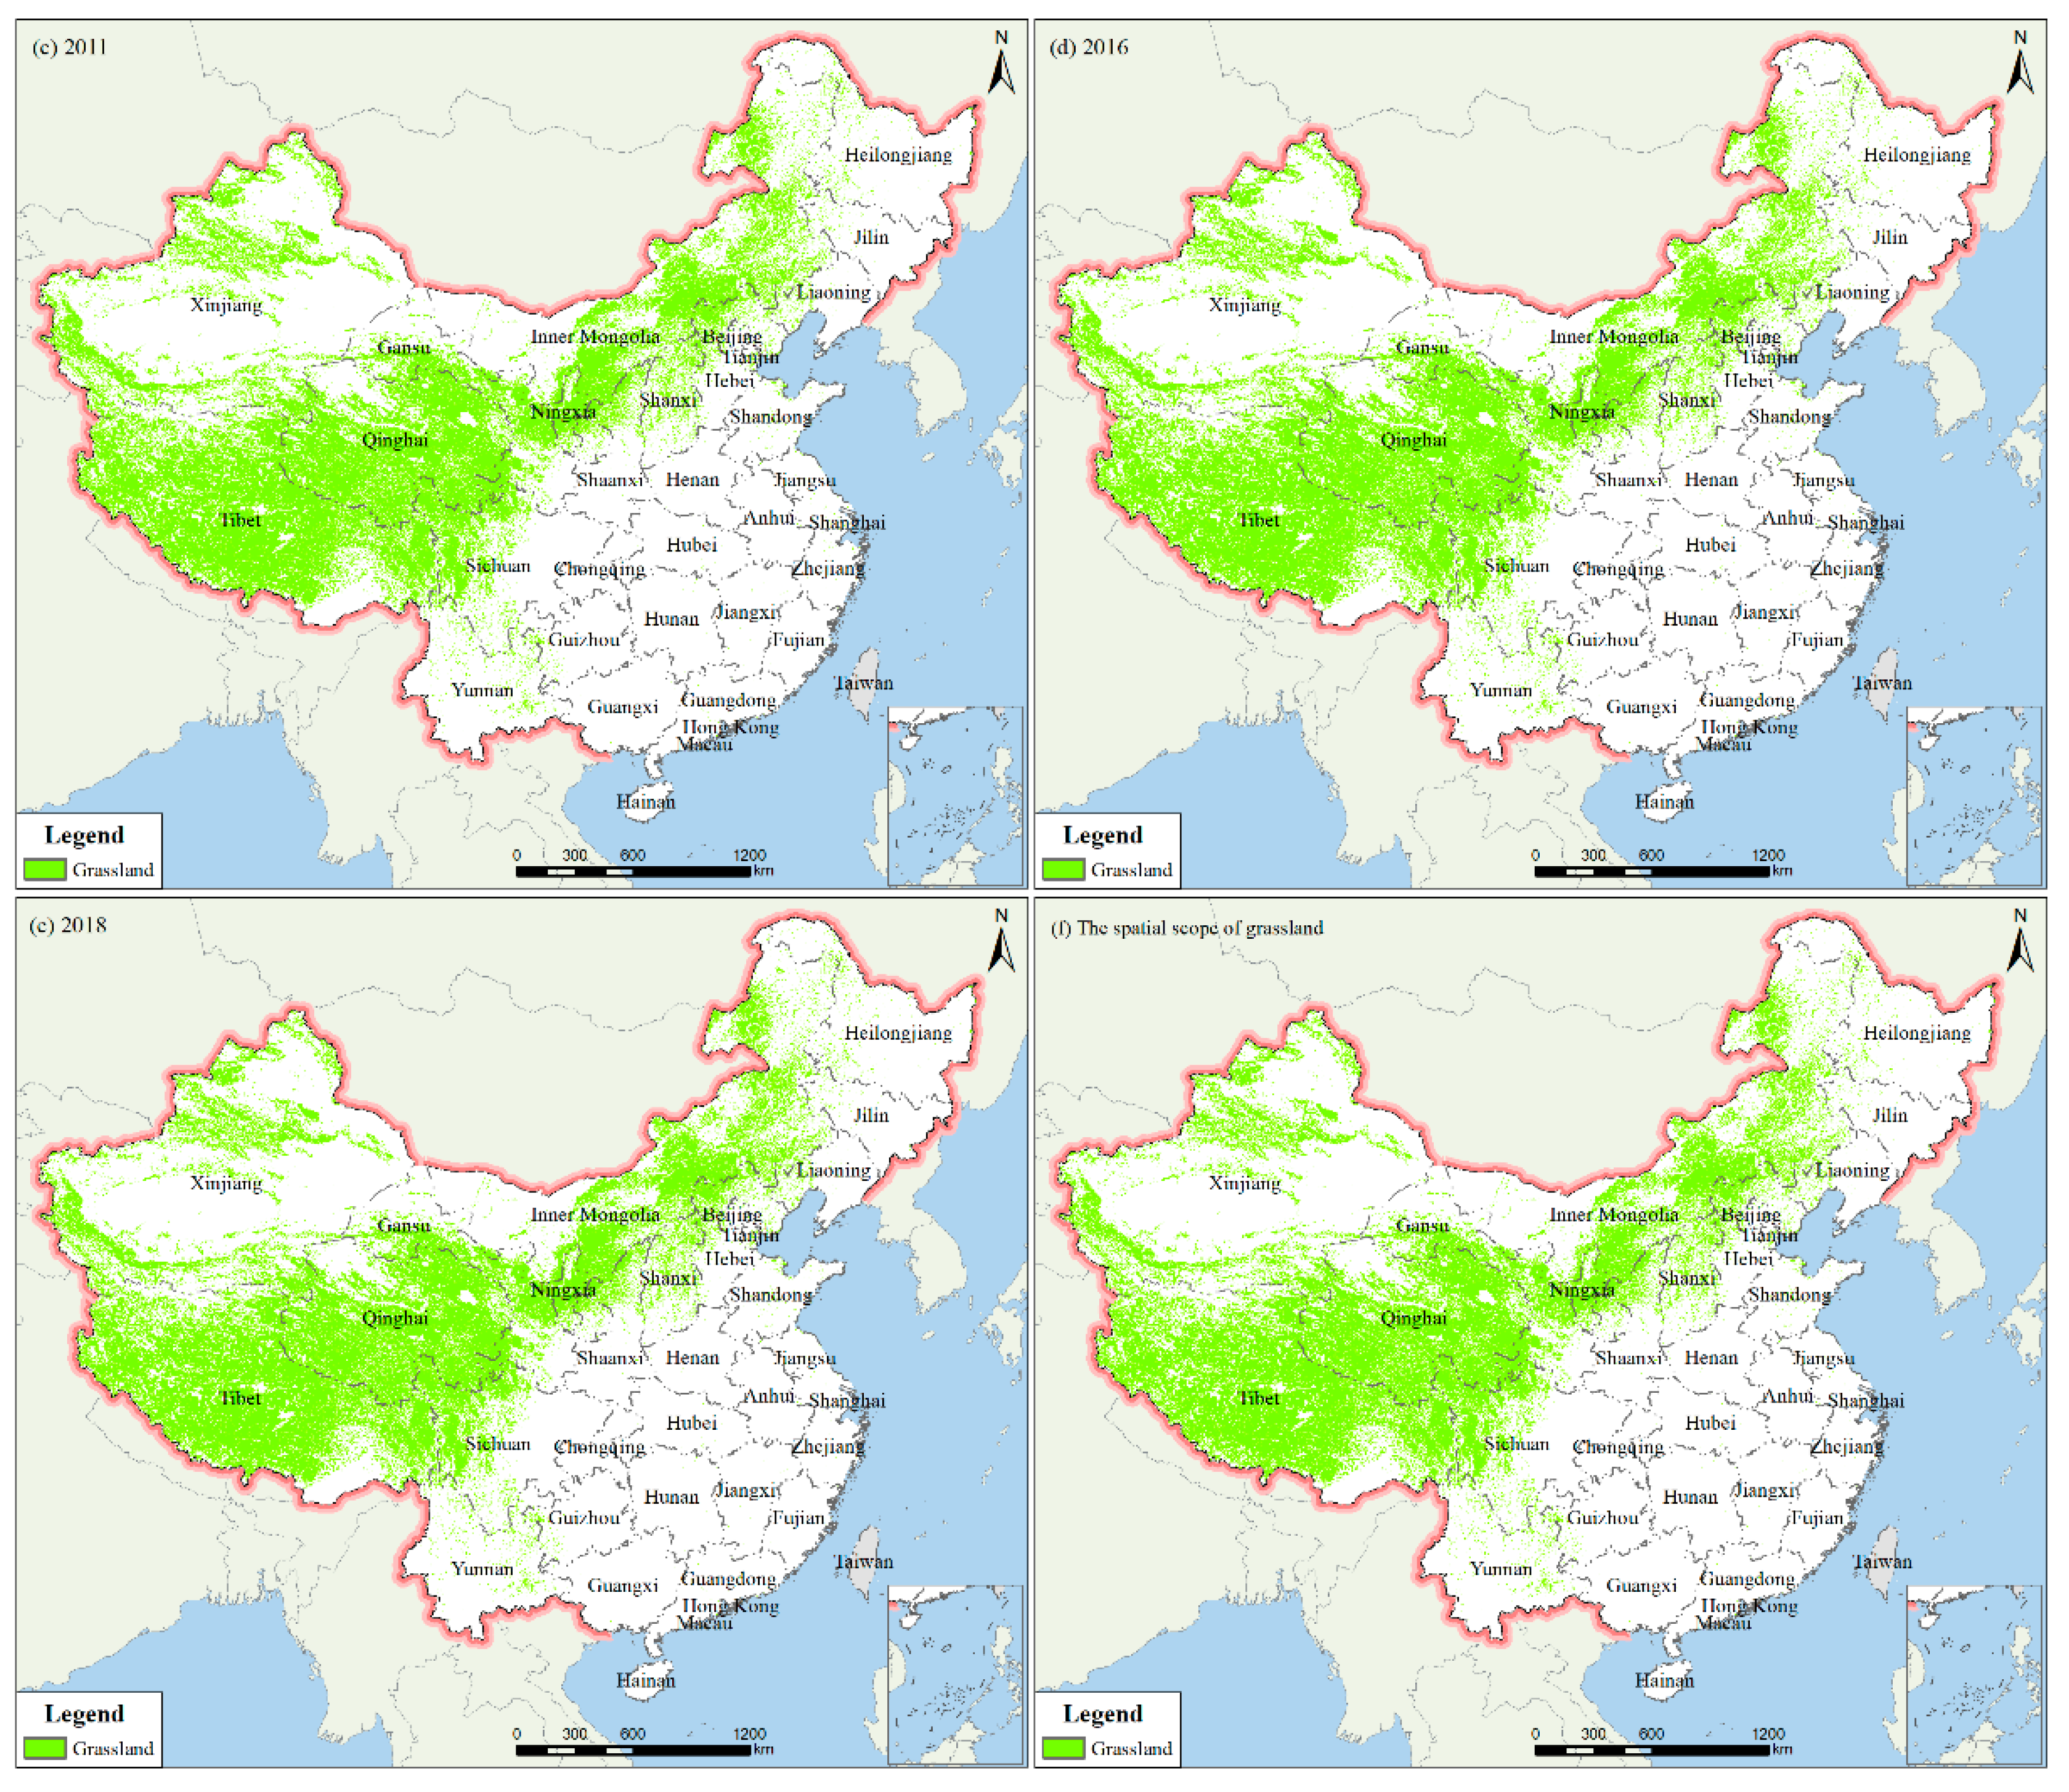
2.3.1. Extracting the Spatial Range of Grassland
2.3.2. Calculation of NPP
2.3.3. Trend Analysis
2.3.4. The Relative Contributions of CC and HA on ANPP
2.3.5. Correlation Analysis
3. Results
3.1. Spatiotemporal Characteristics of Grassland ANPP
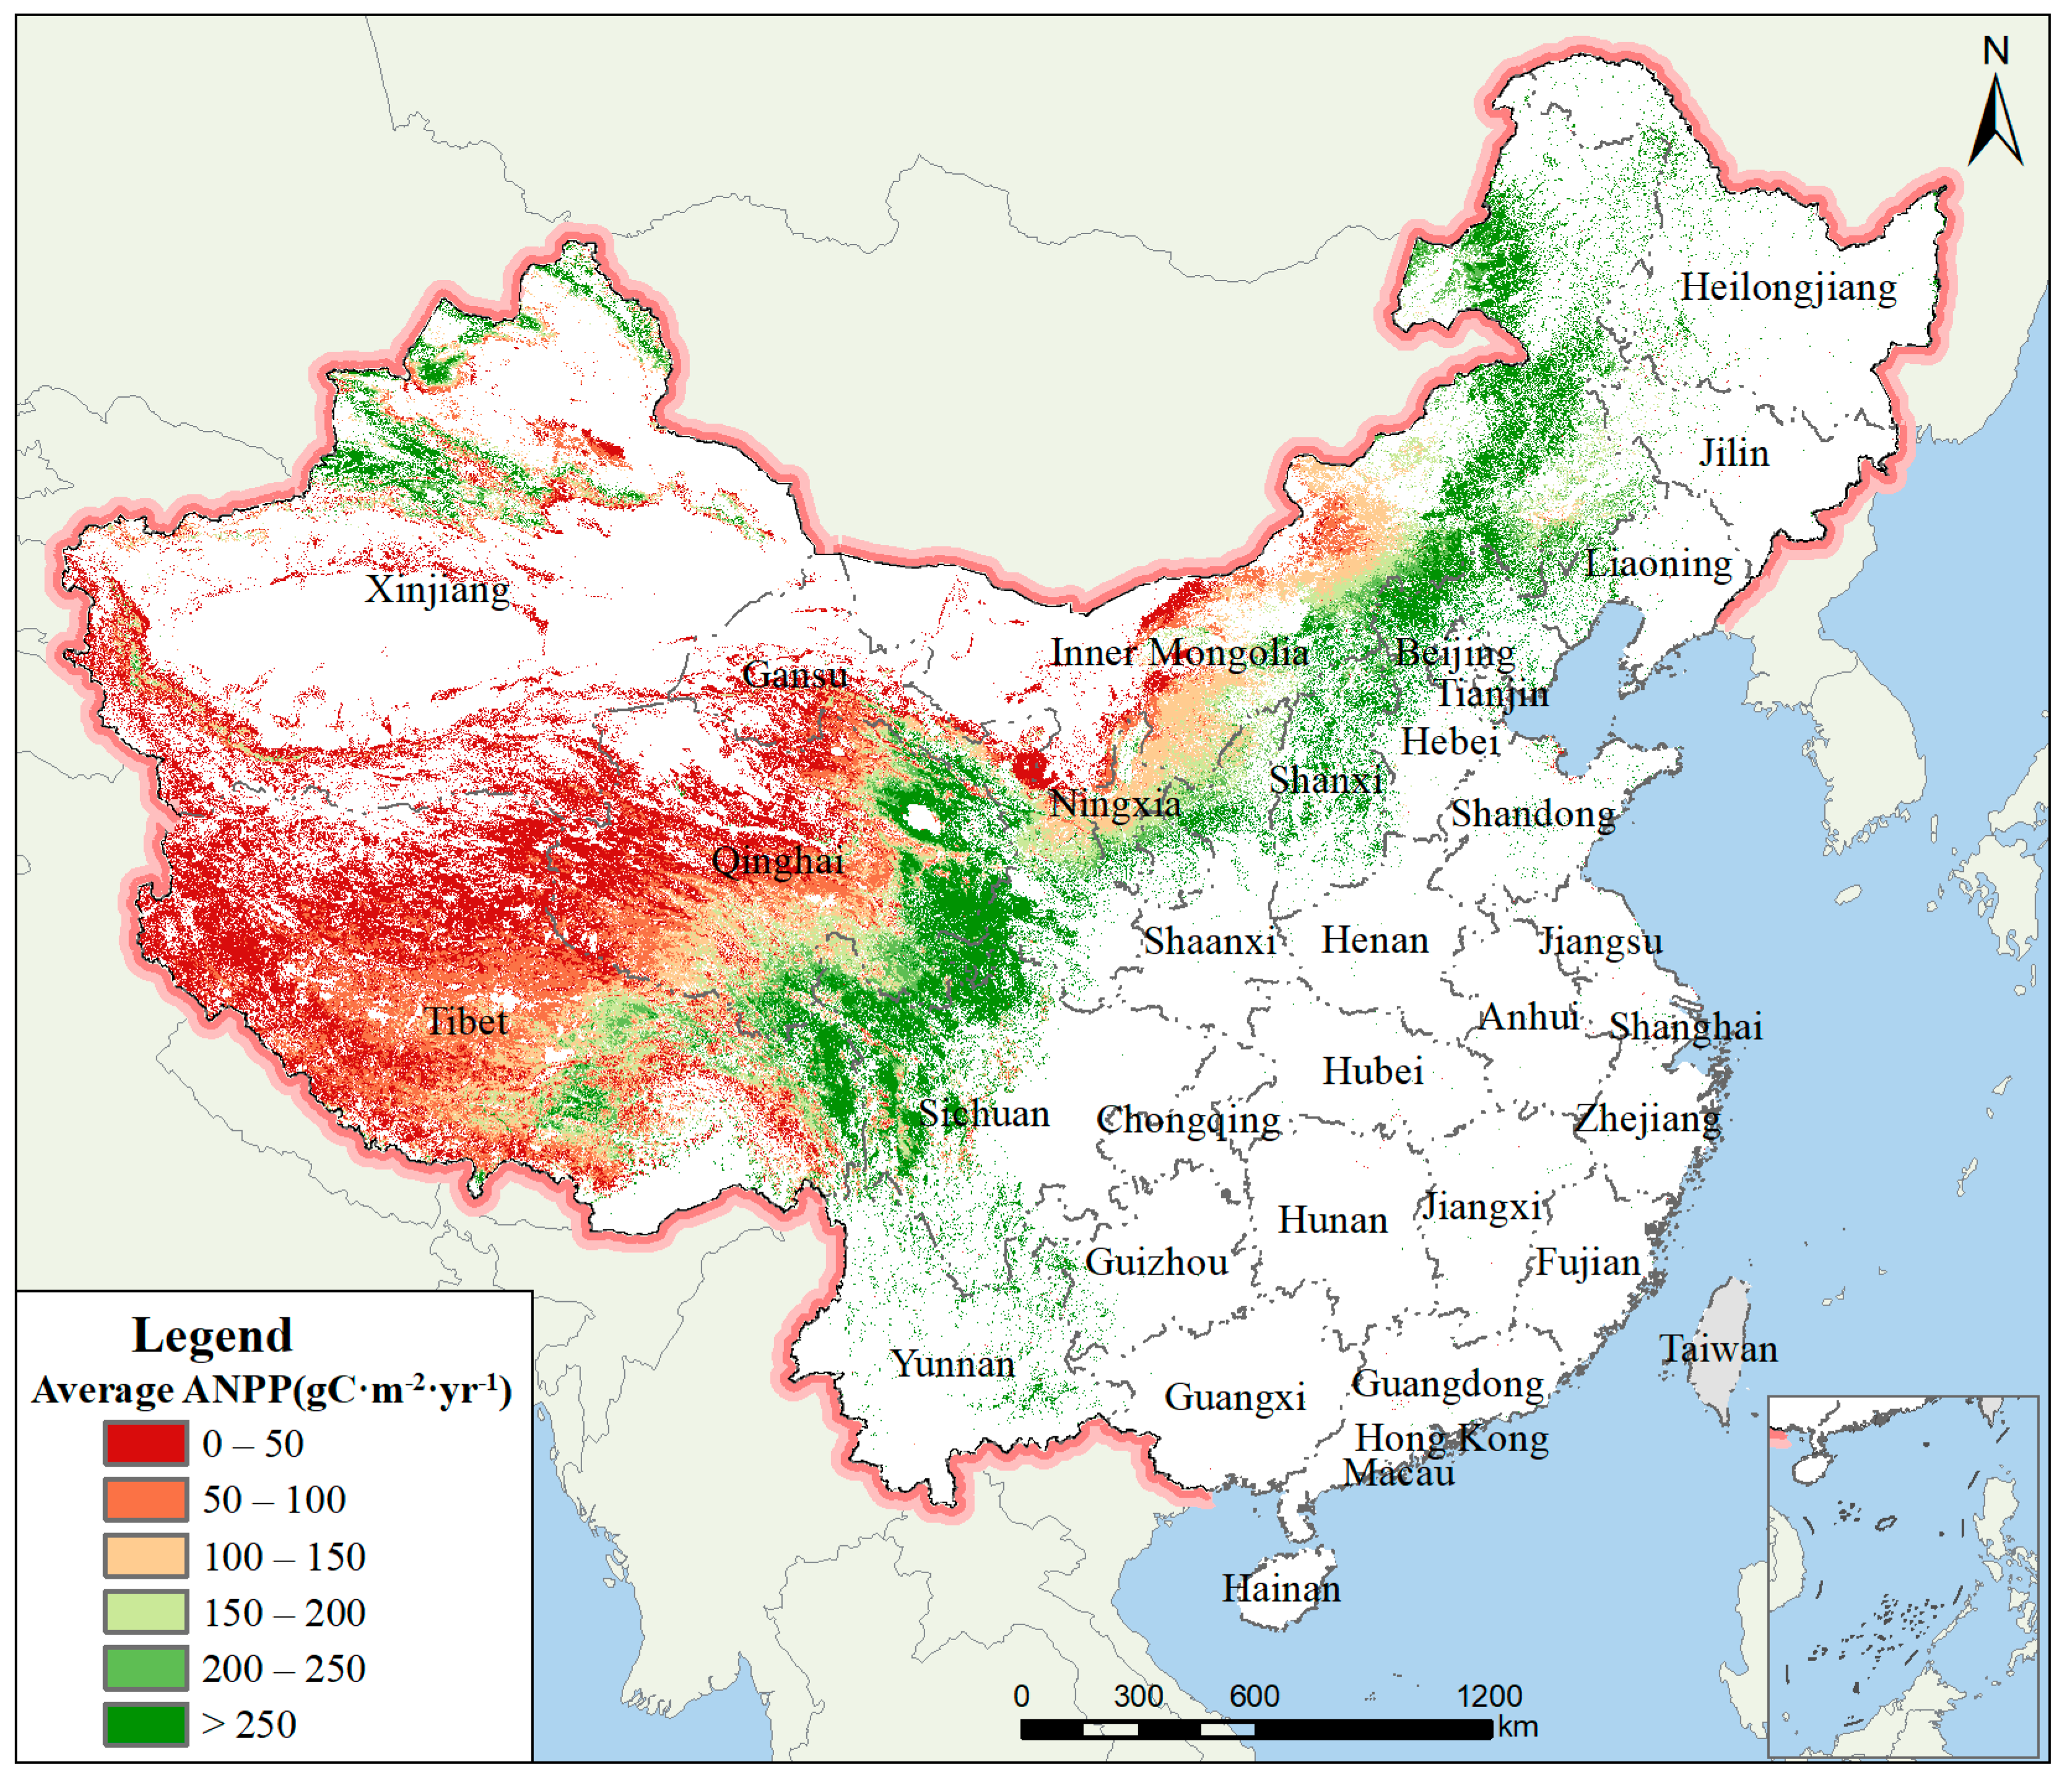
3.1.1. Spatial Heterogeneity Analysis of ANPP
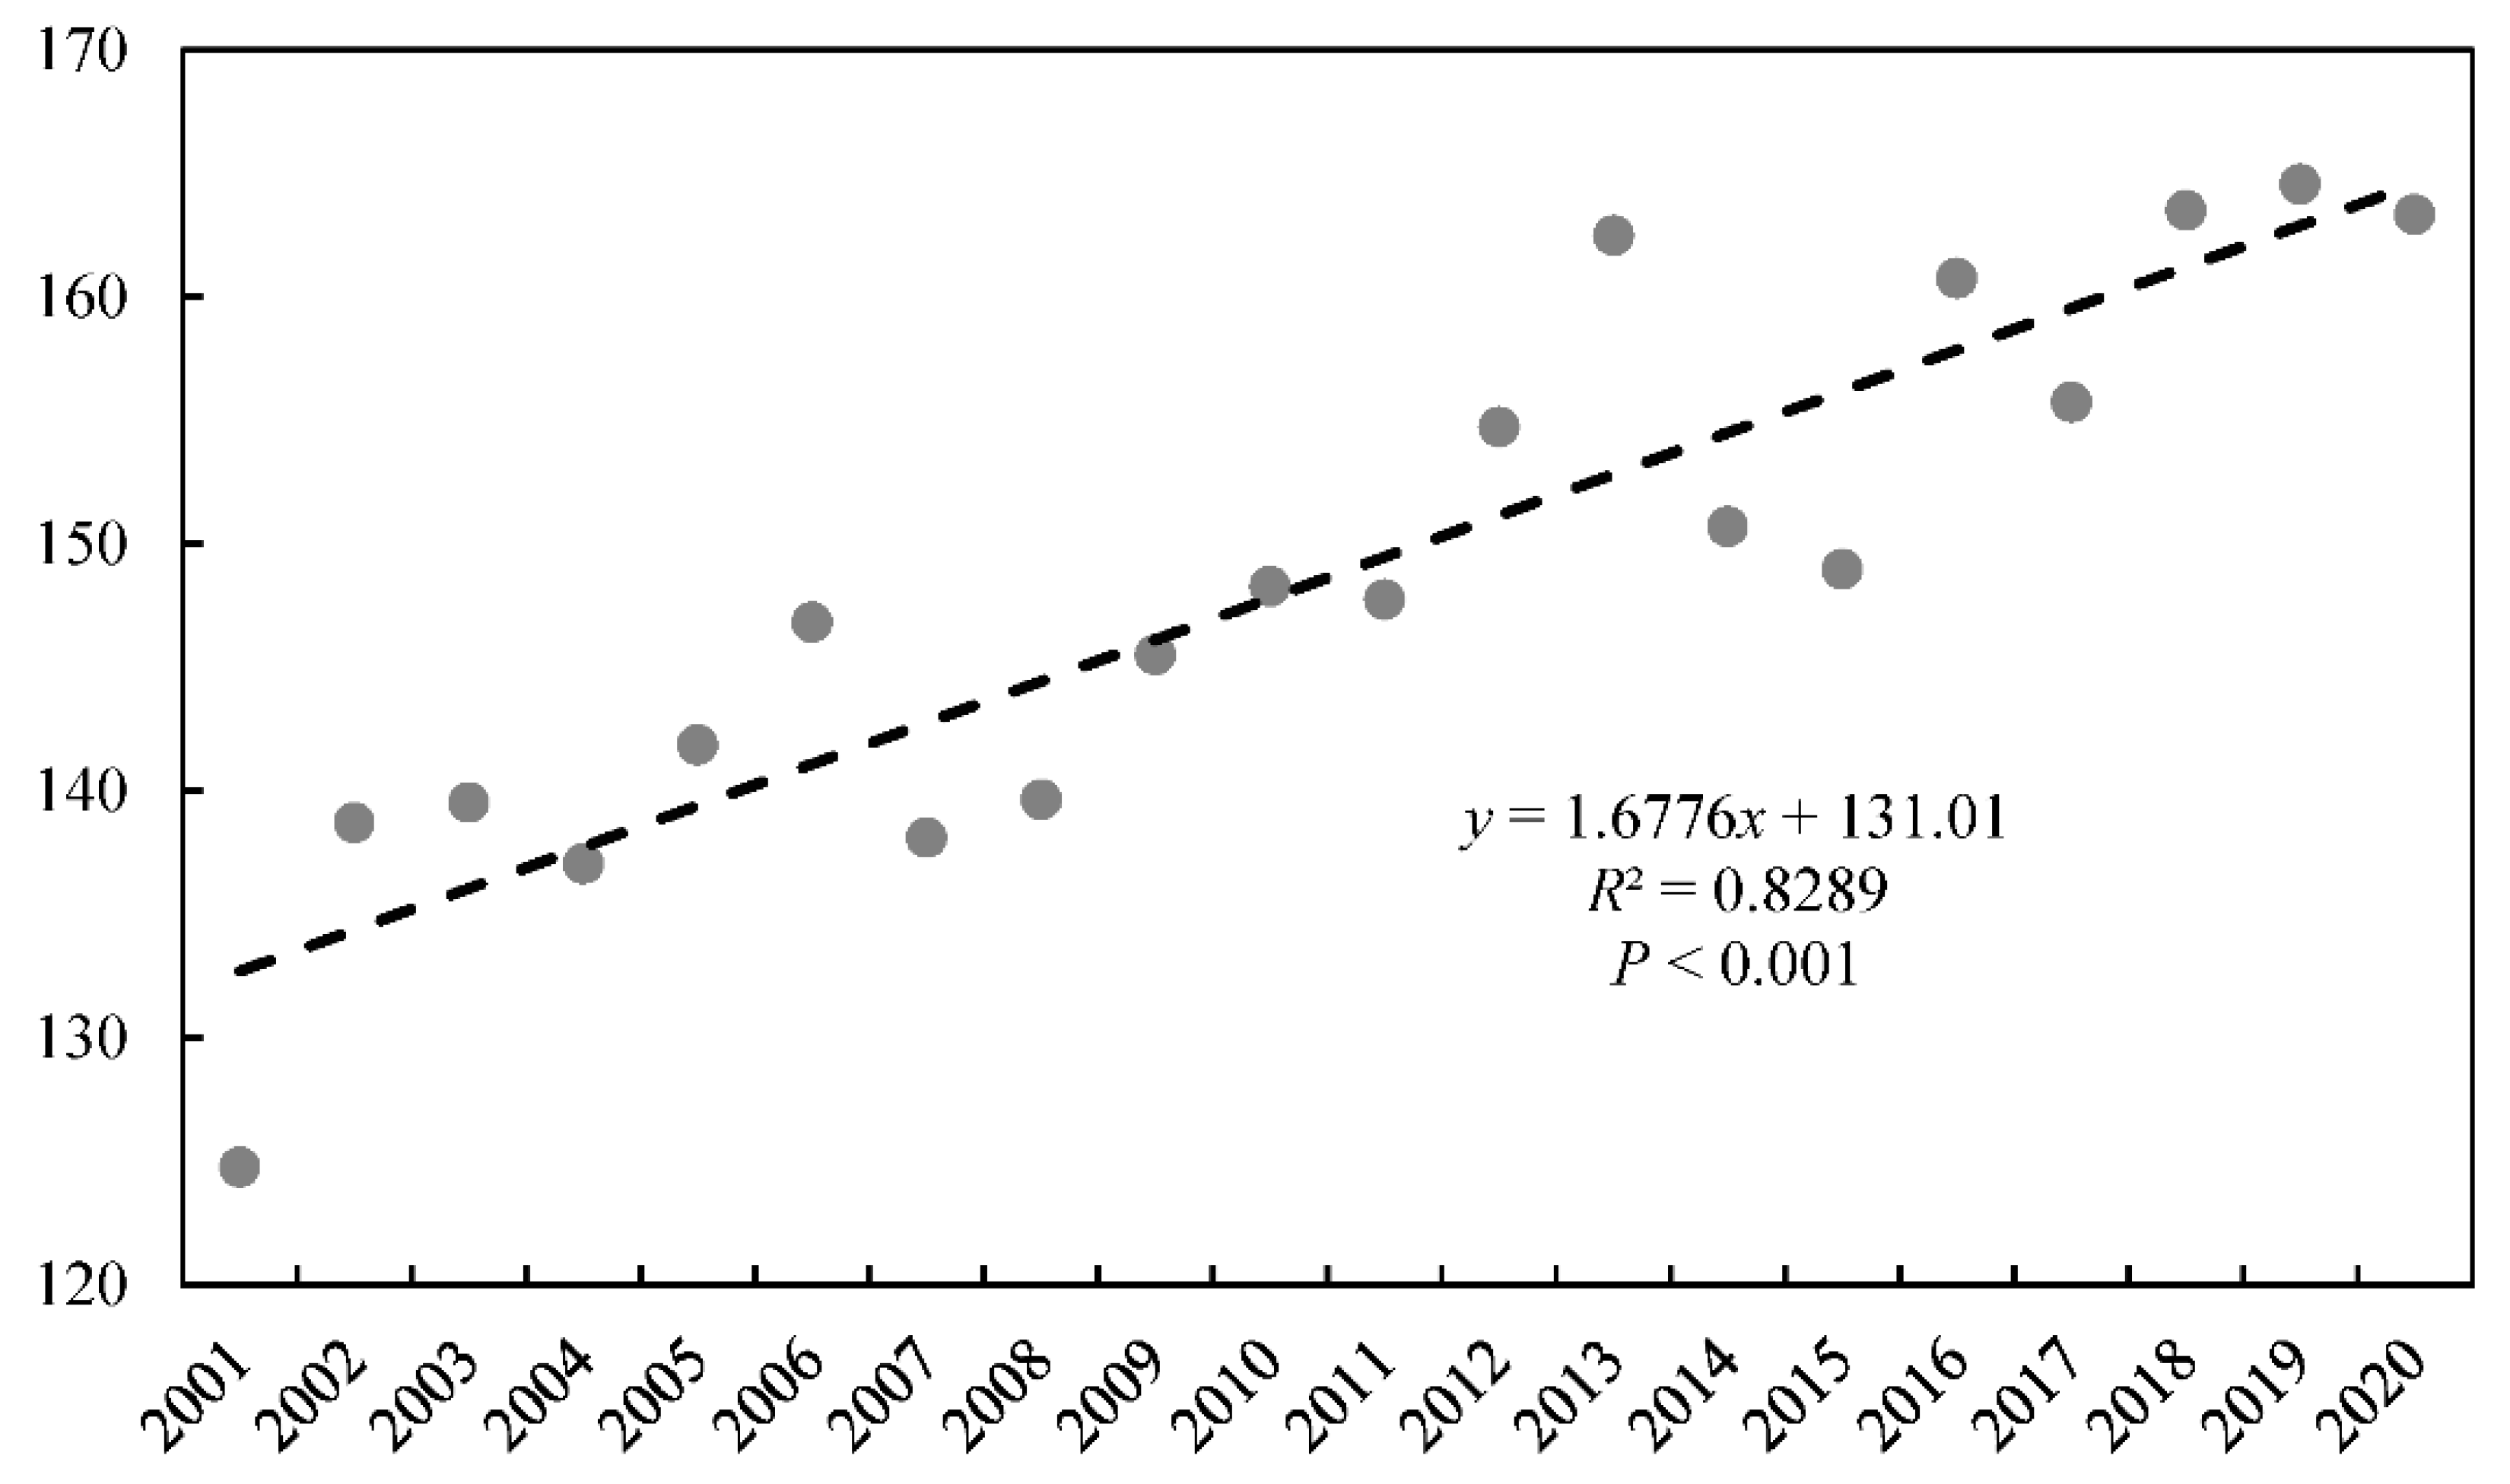
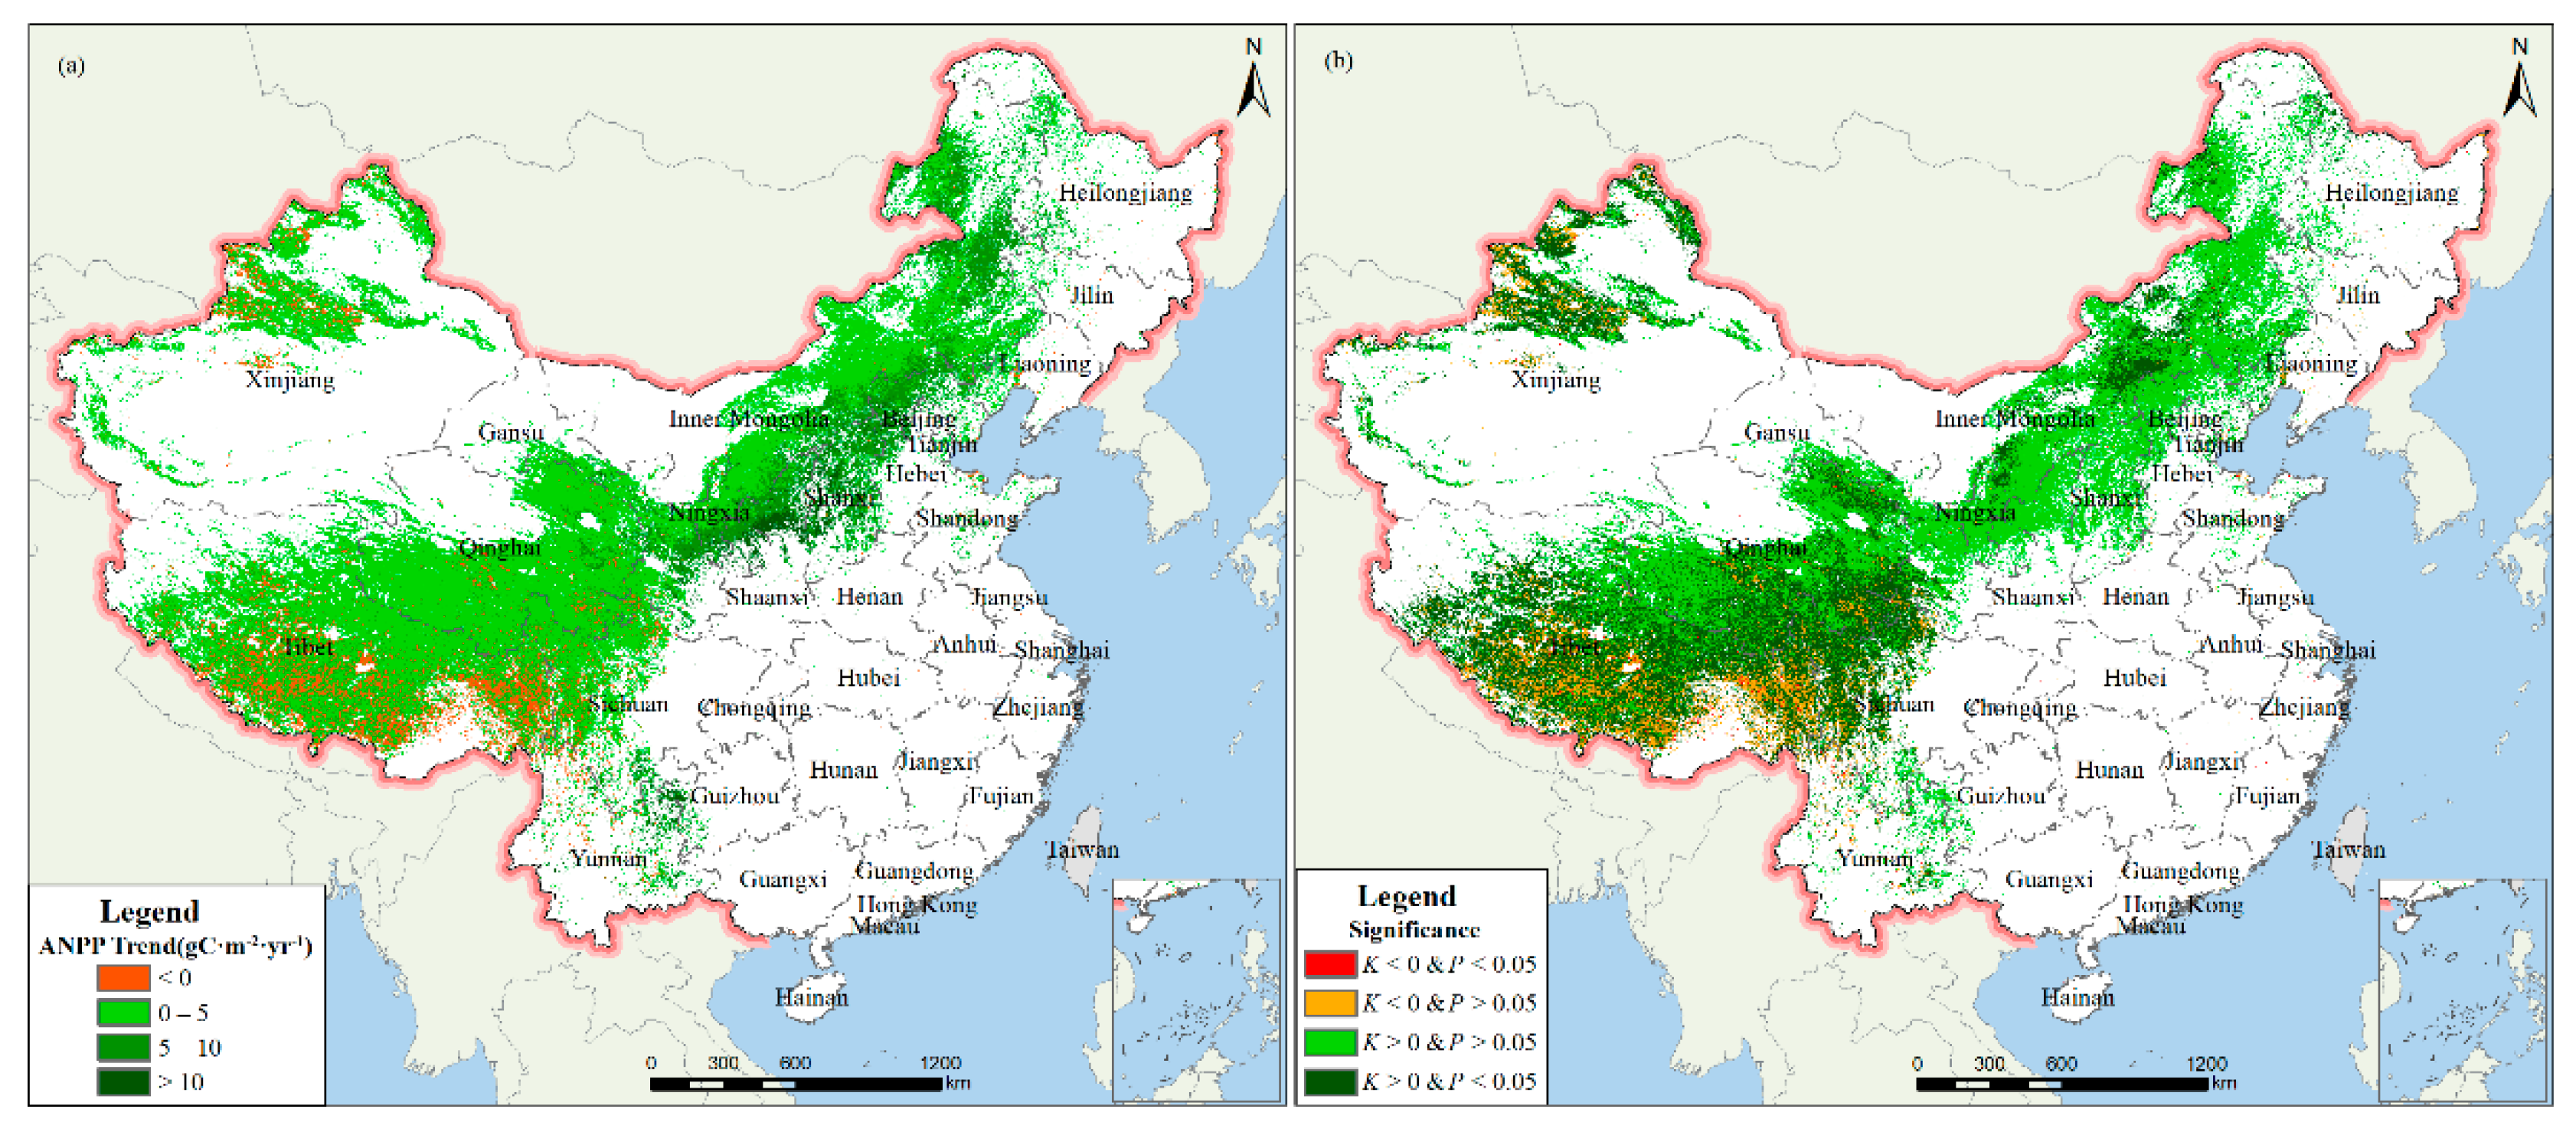
3.1.2. Spatiotemporal Variation of ANPP
3.2. Contributions of CC and HA to ANPP
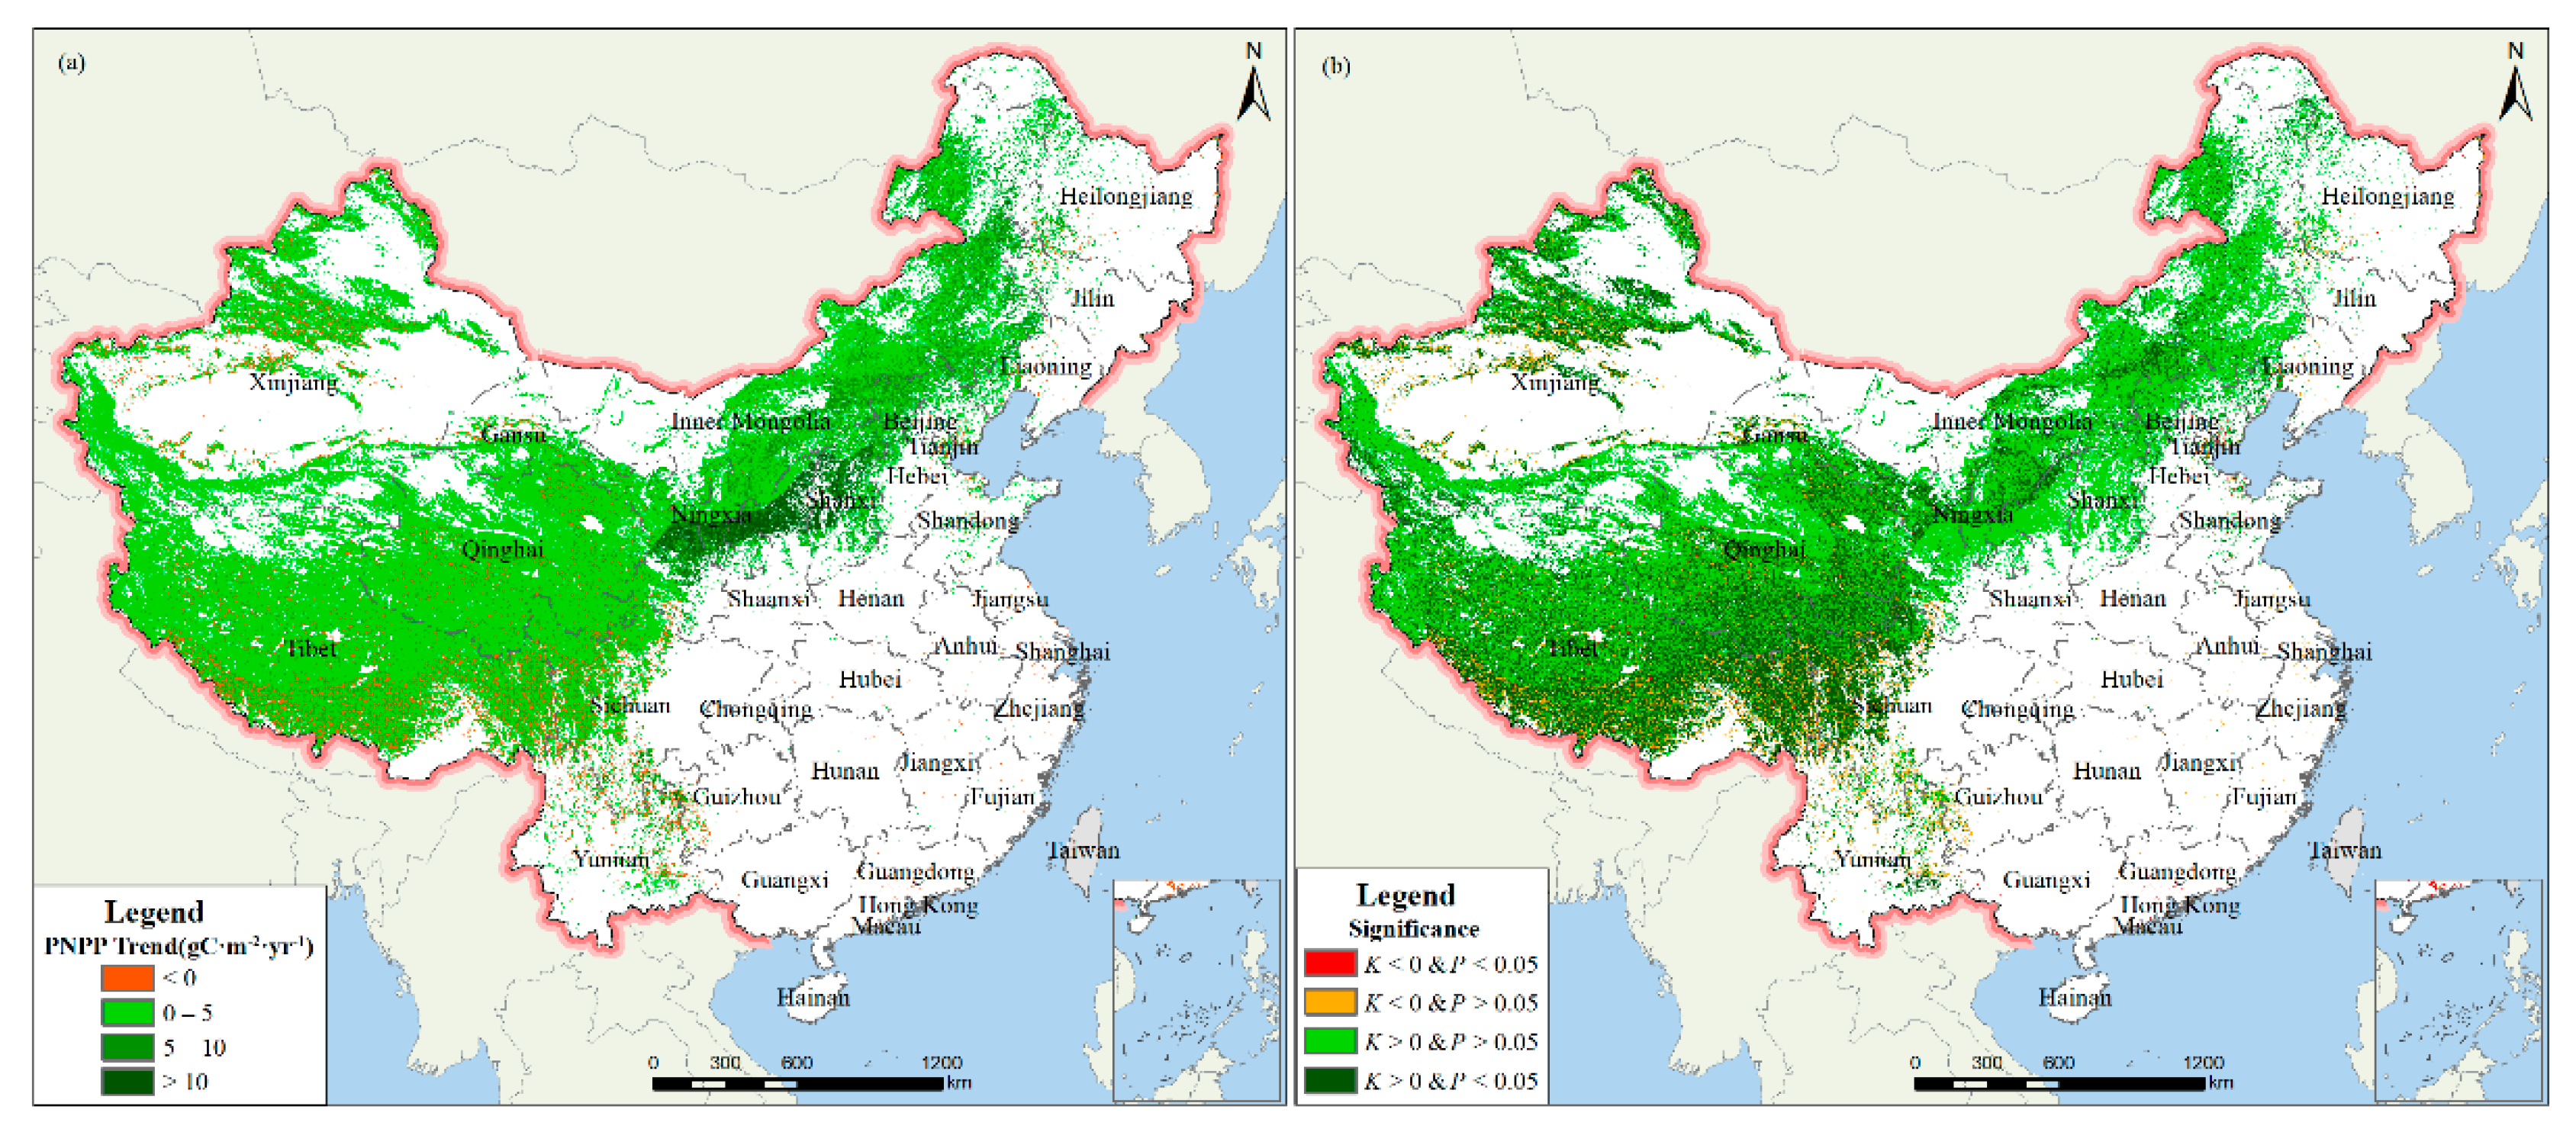
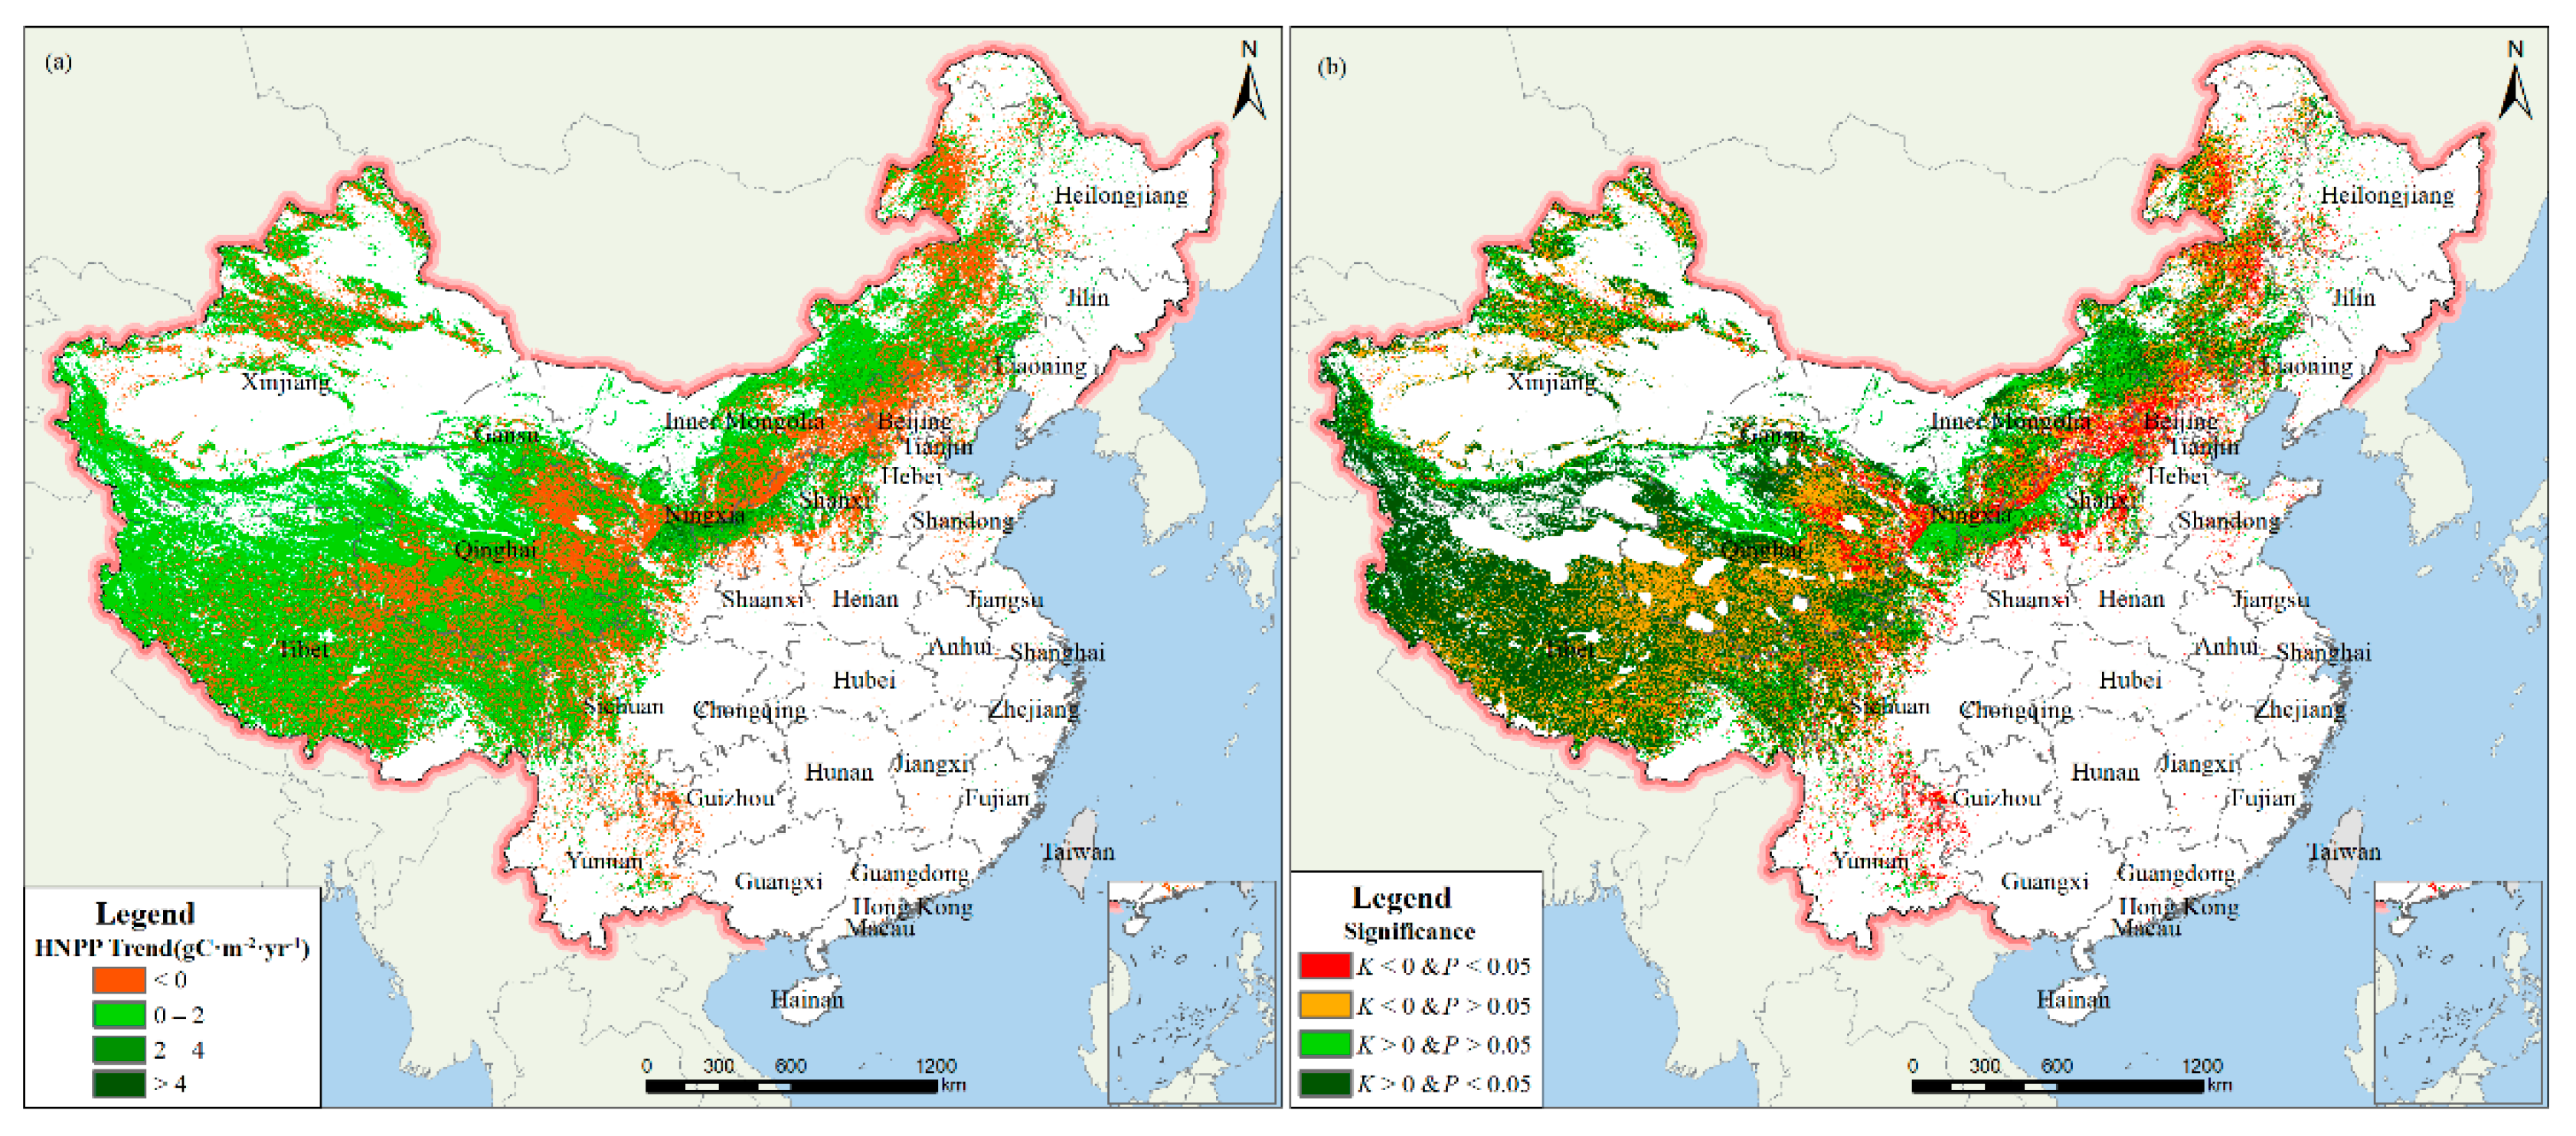
3.2.1. Changing Trends of PNPP and HNPP
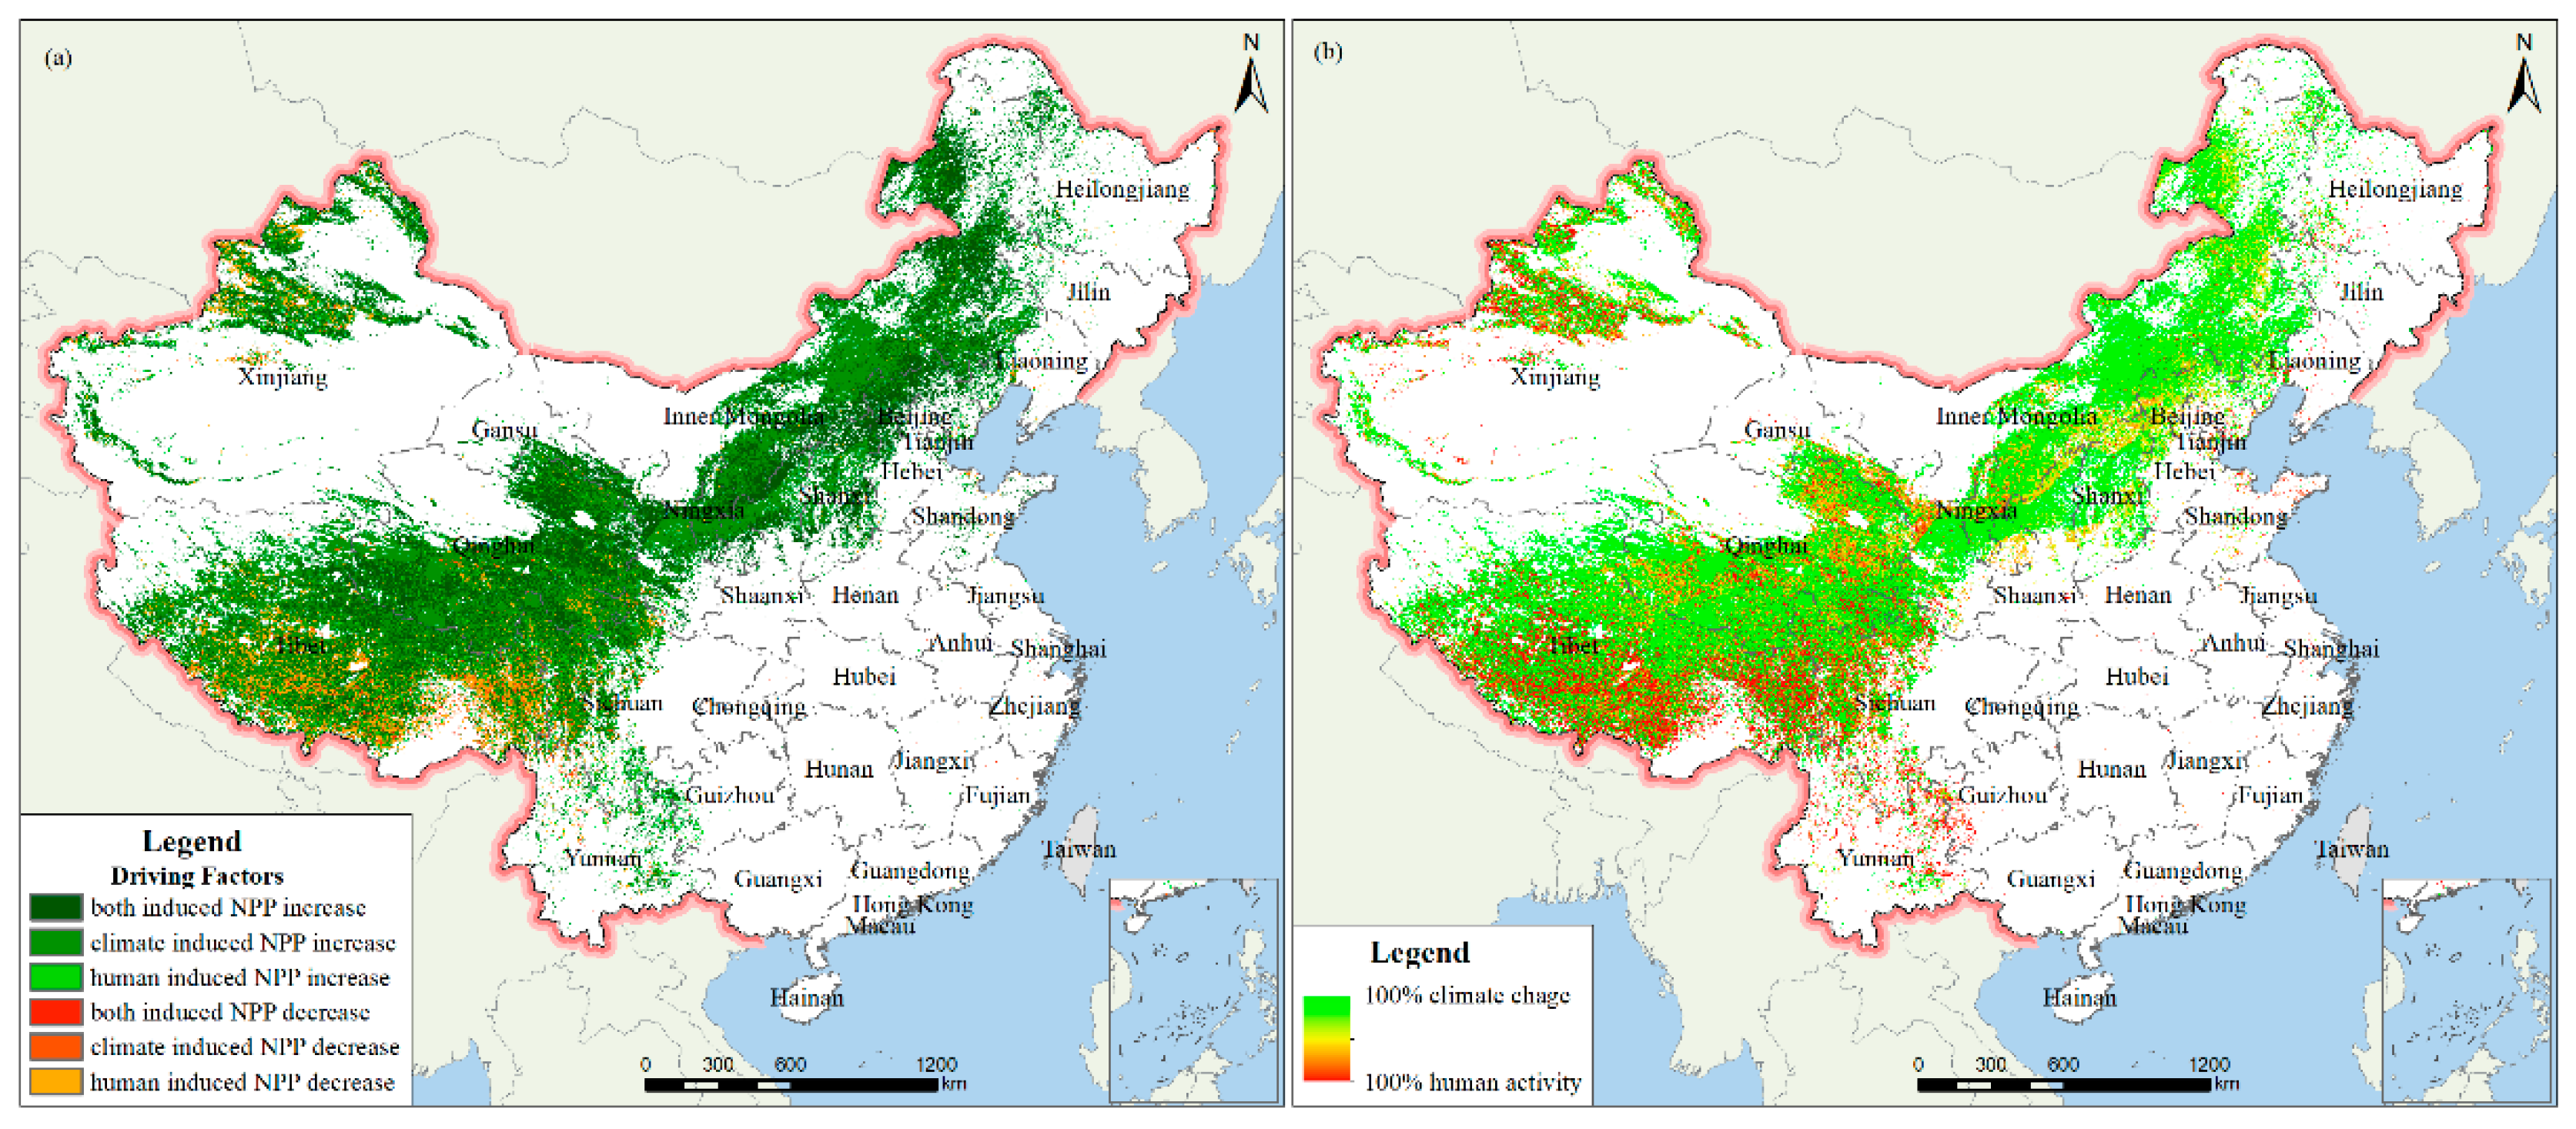
3.2.2. The Relative Contributions of CC and HA to ANPP
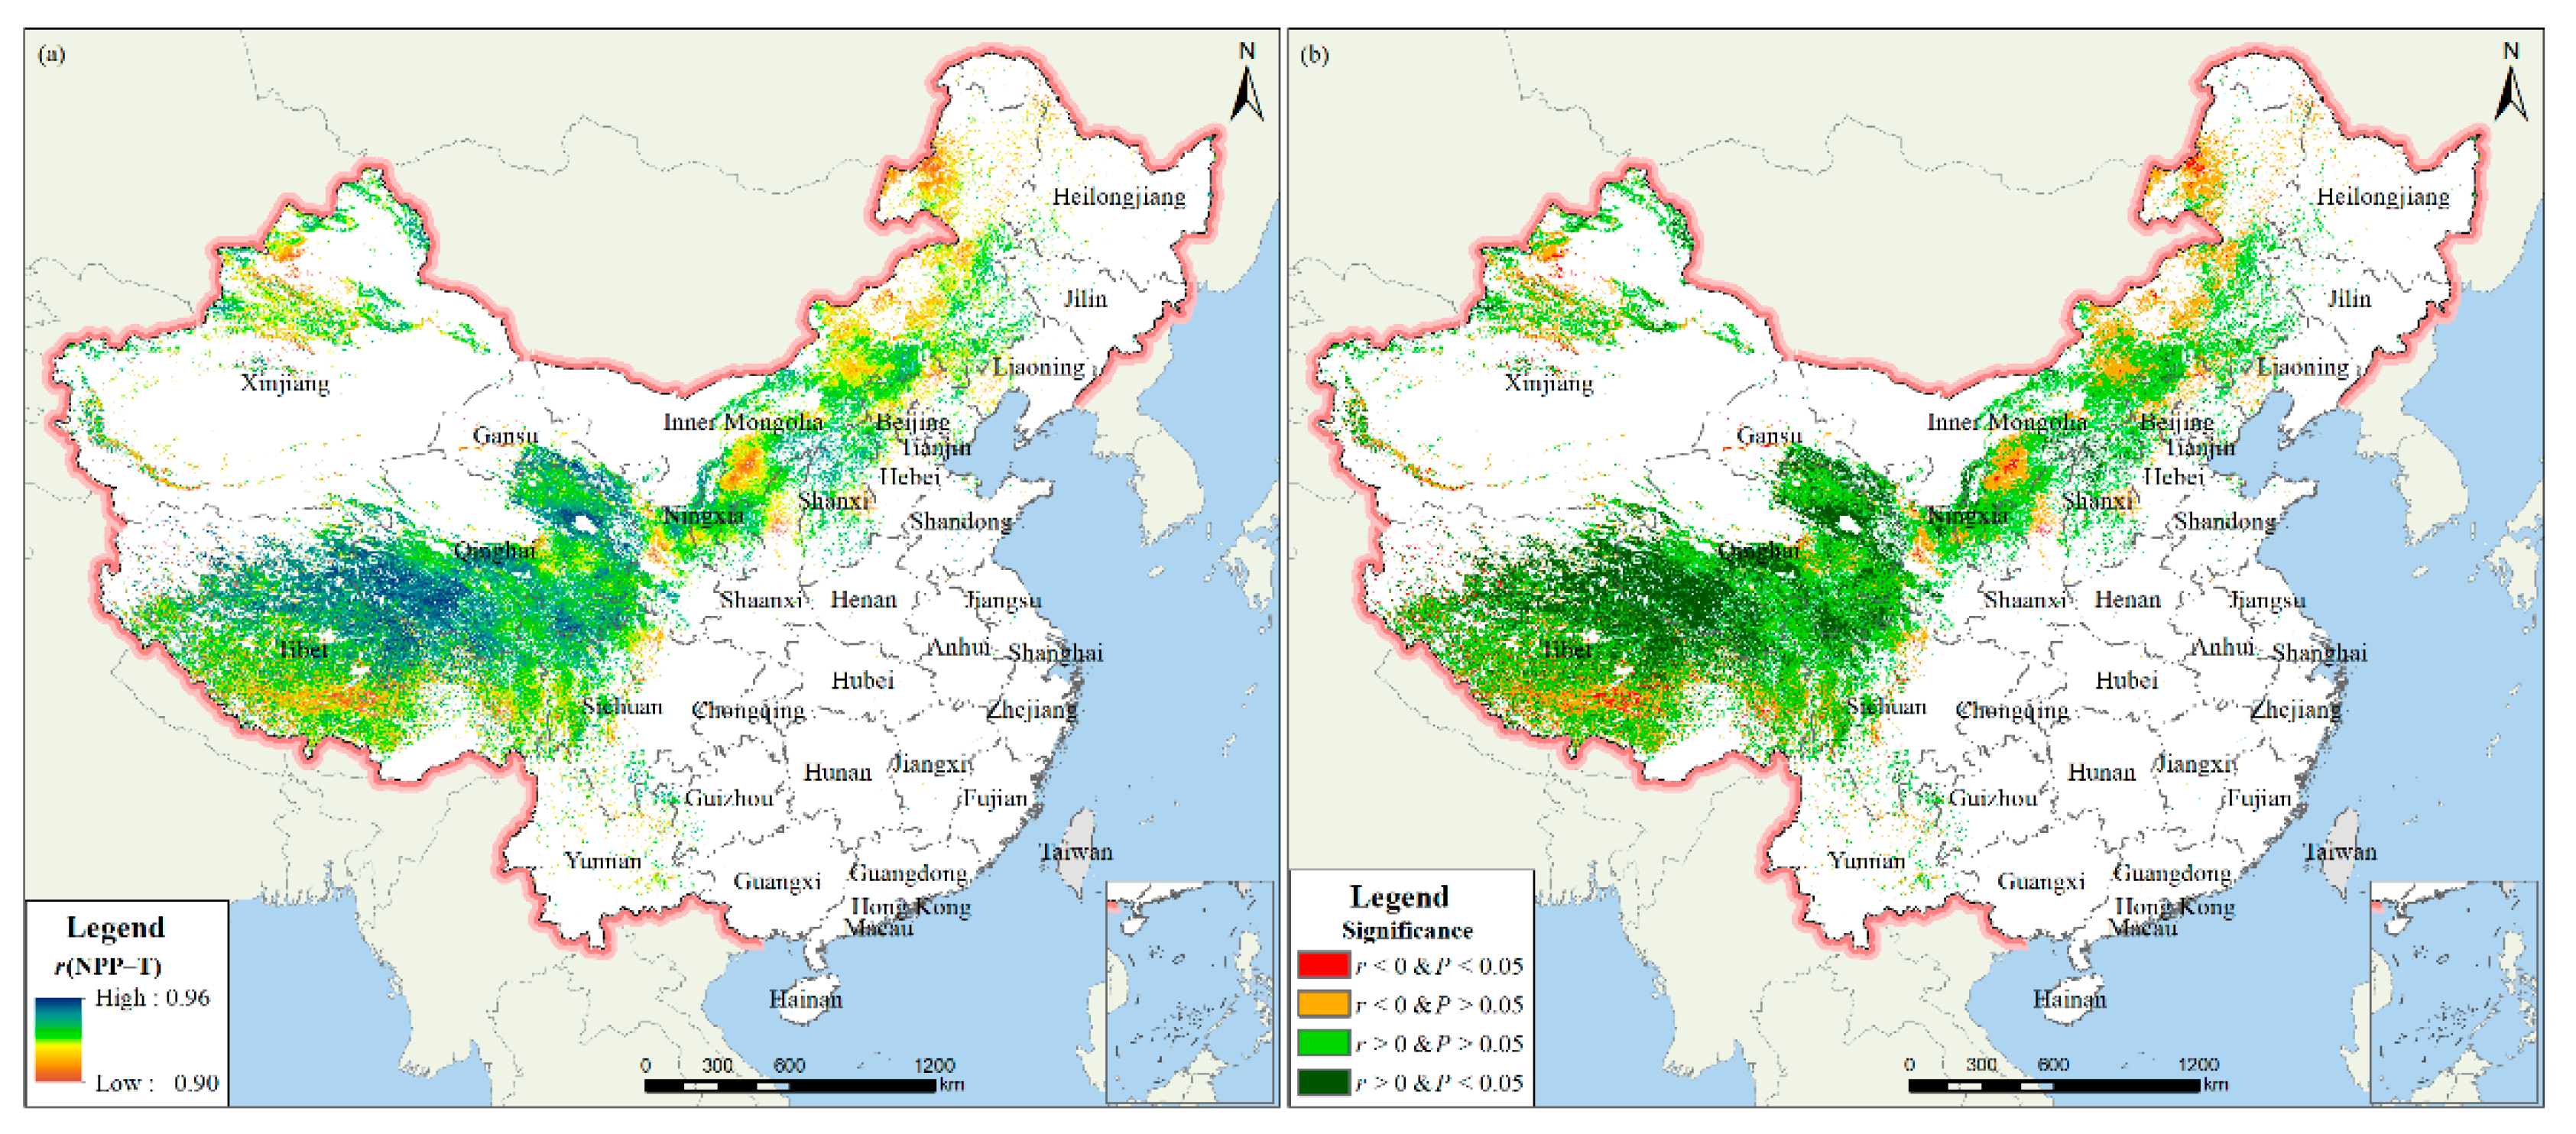
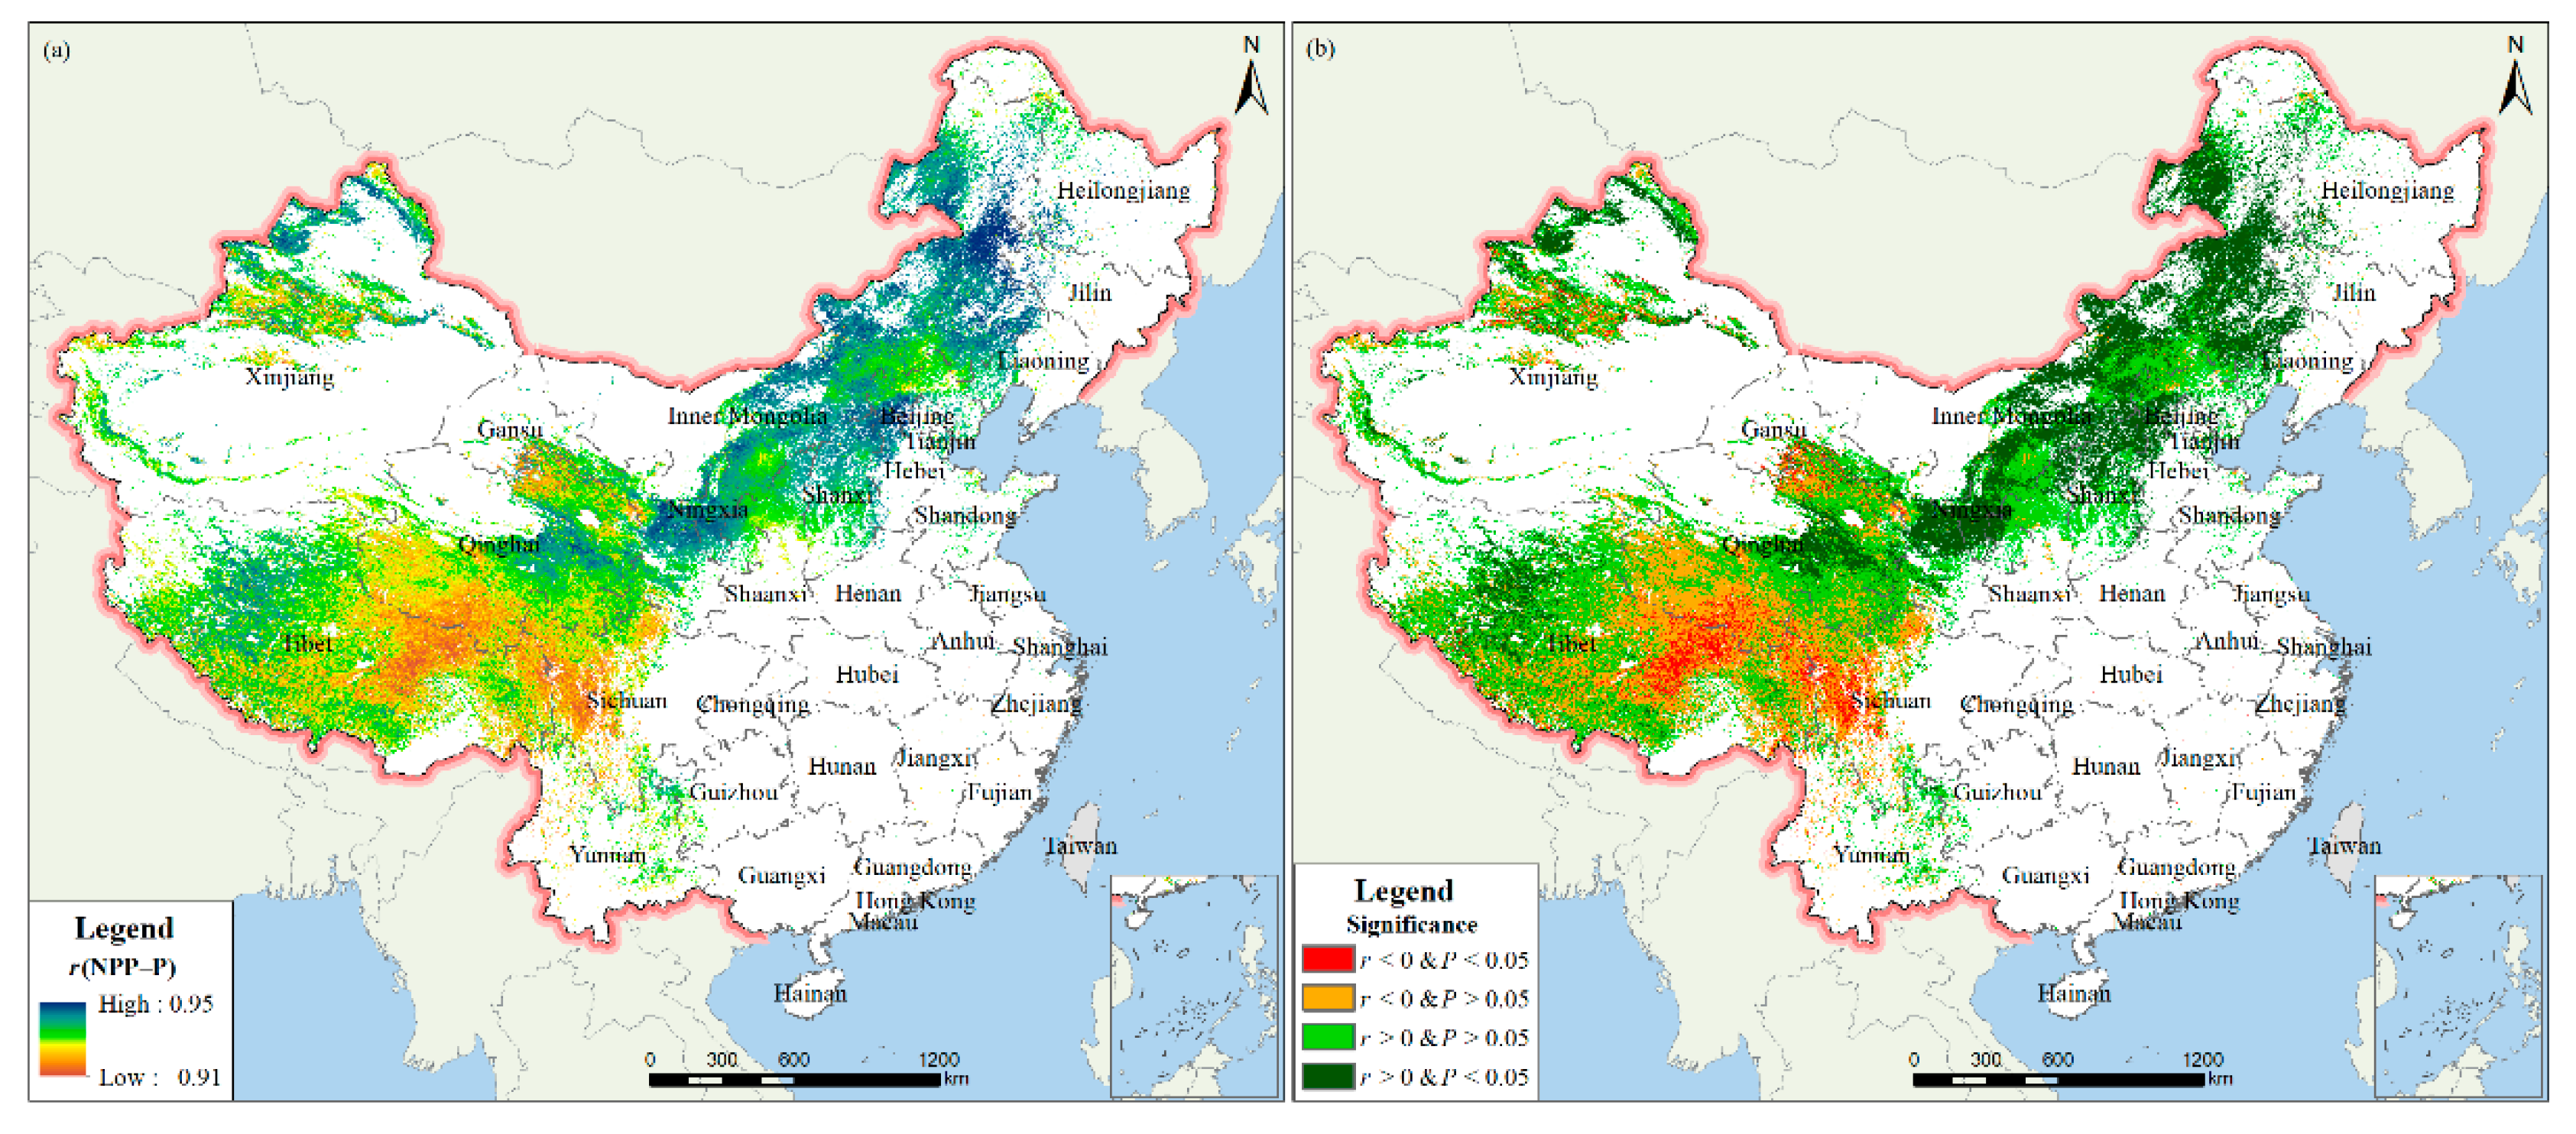
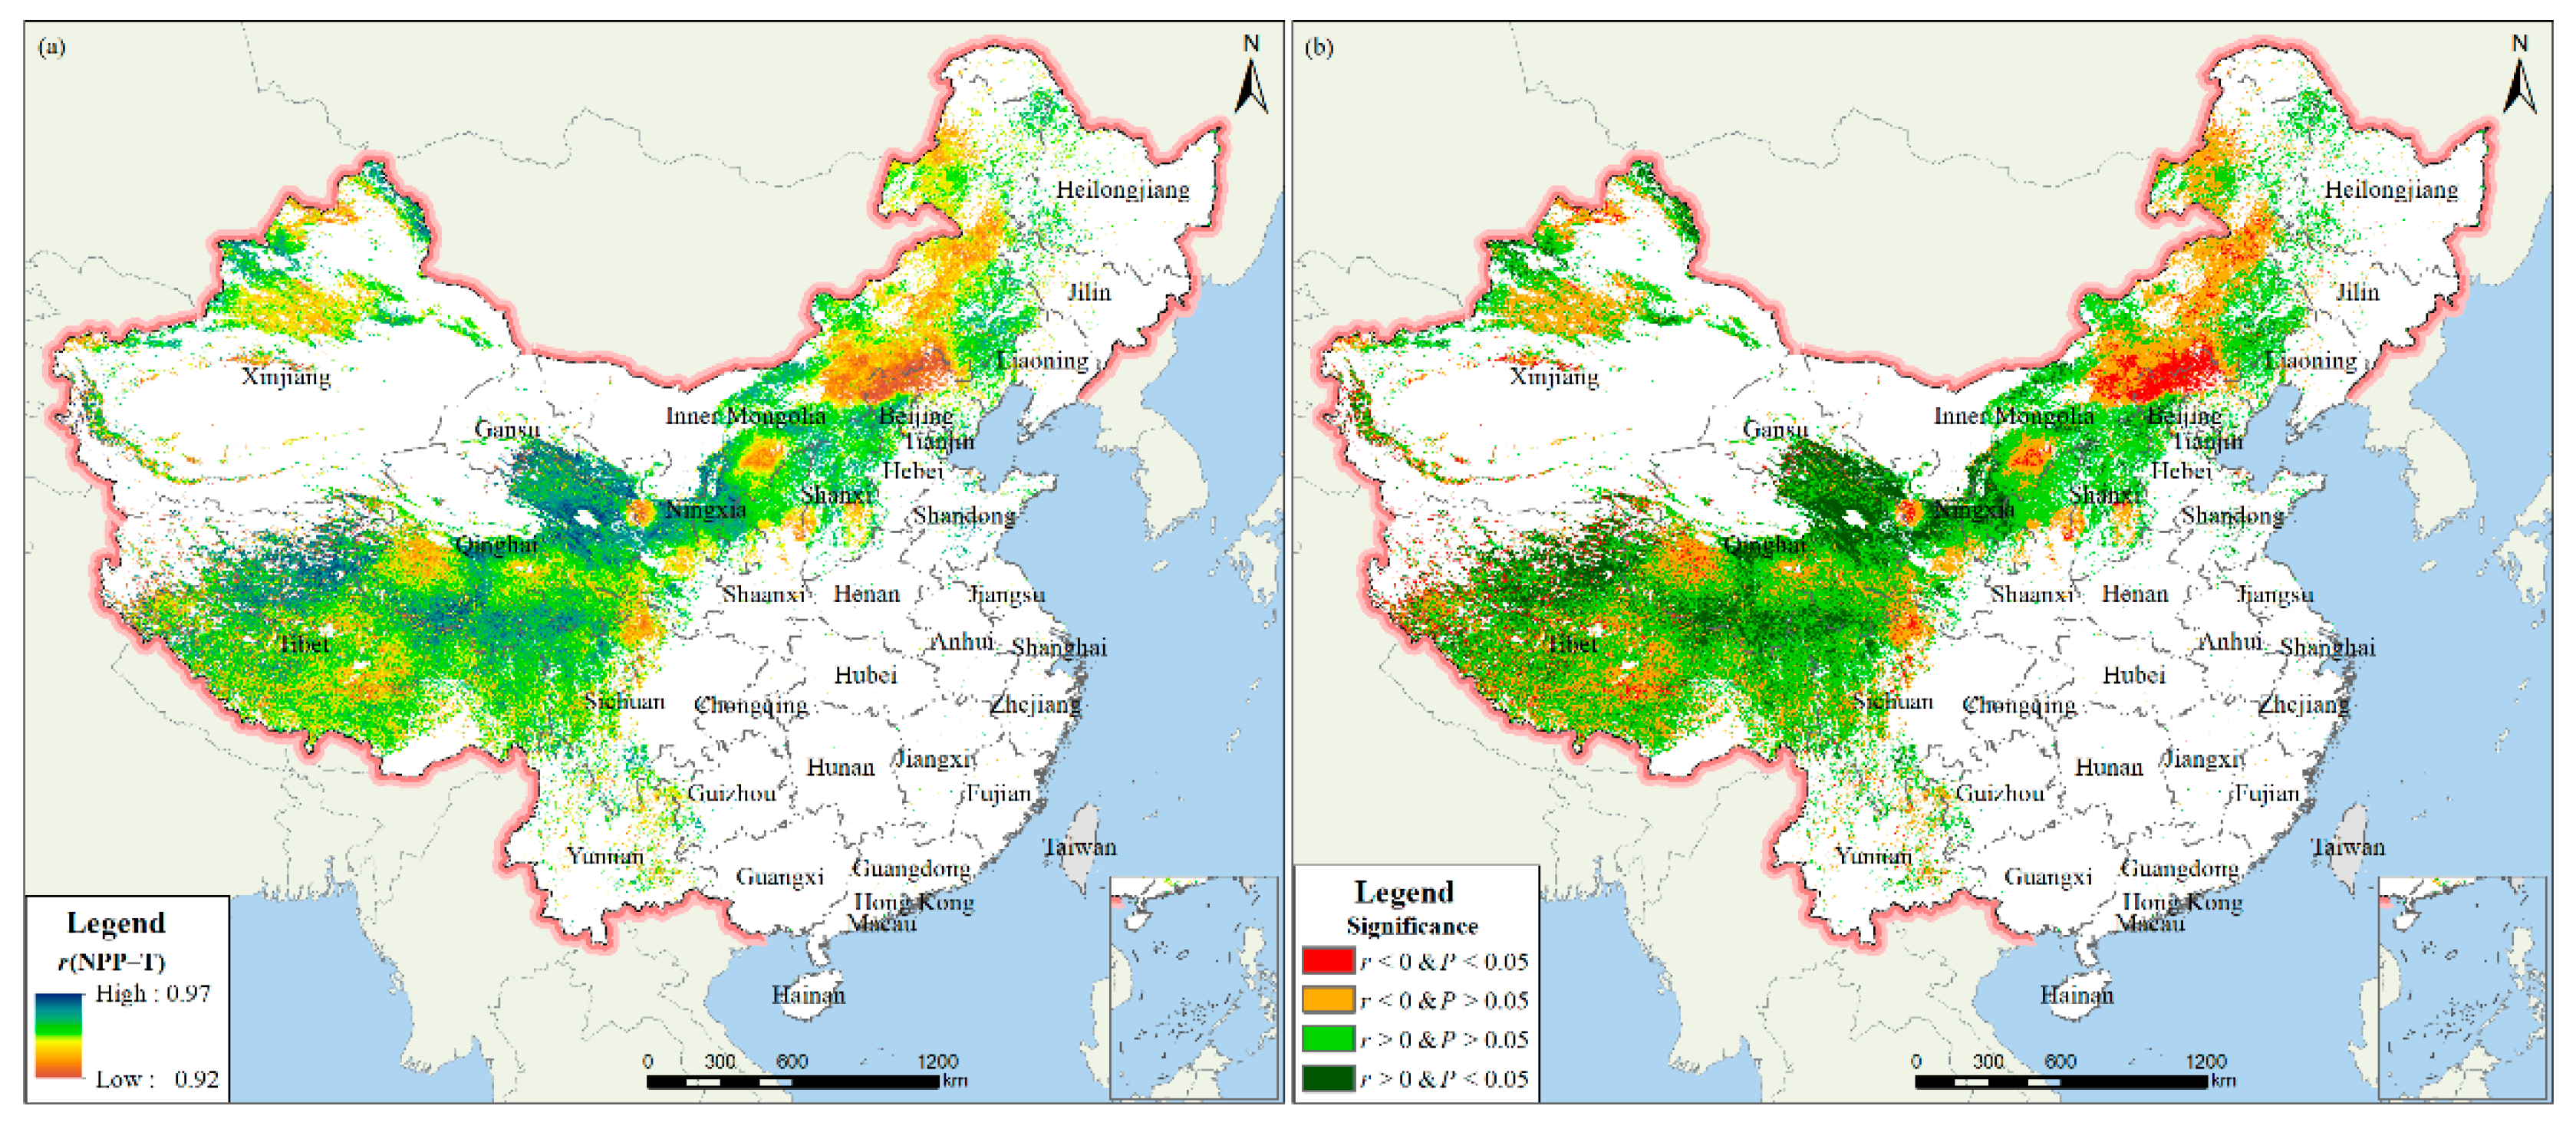
3.3. Relationships between ANPP and Climate Factors
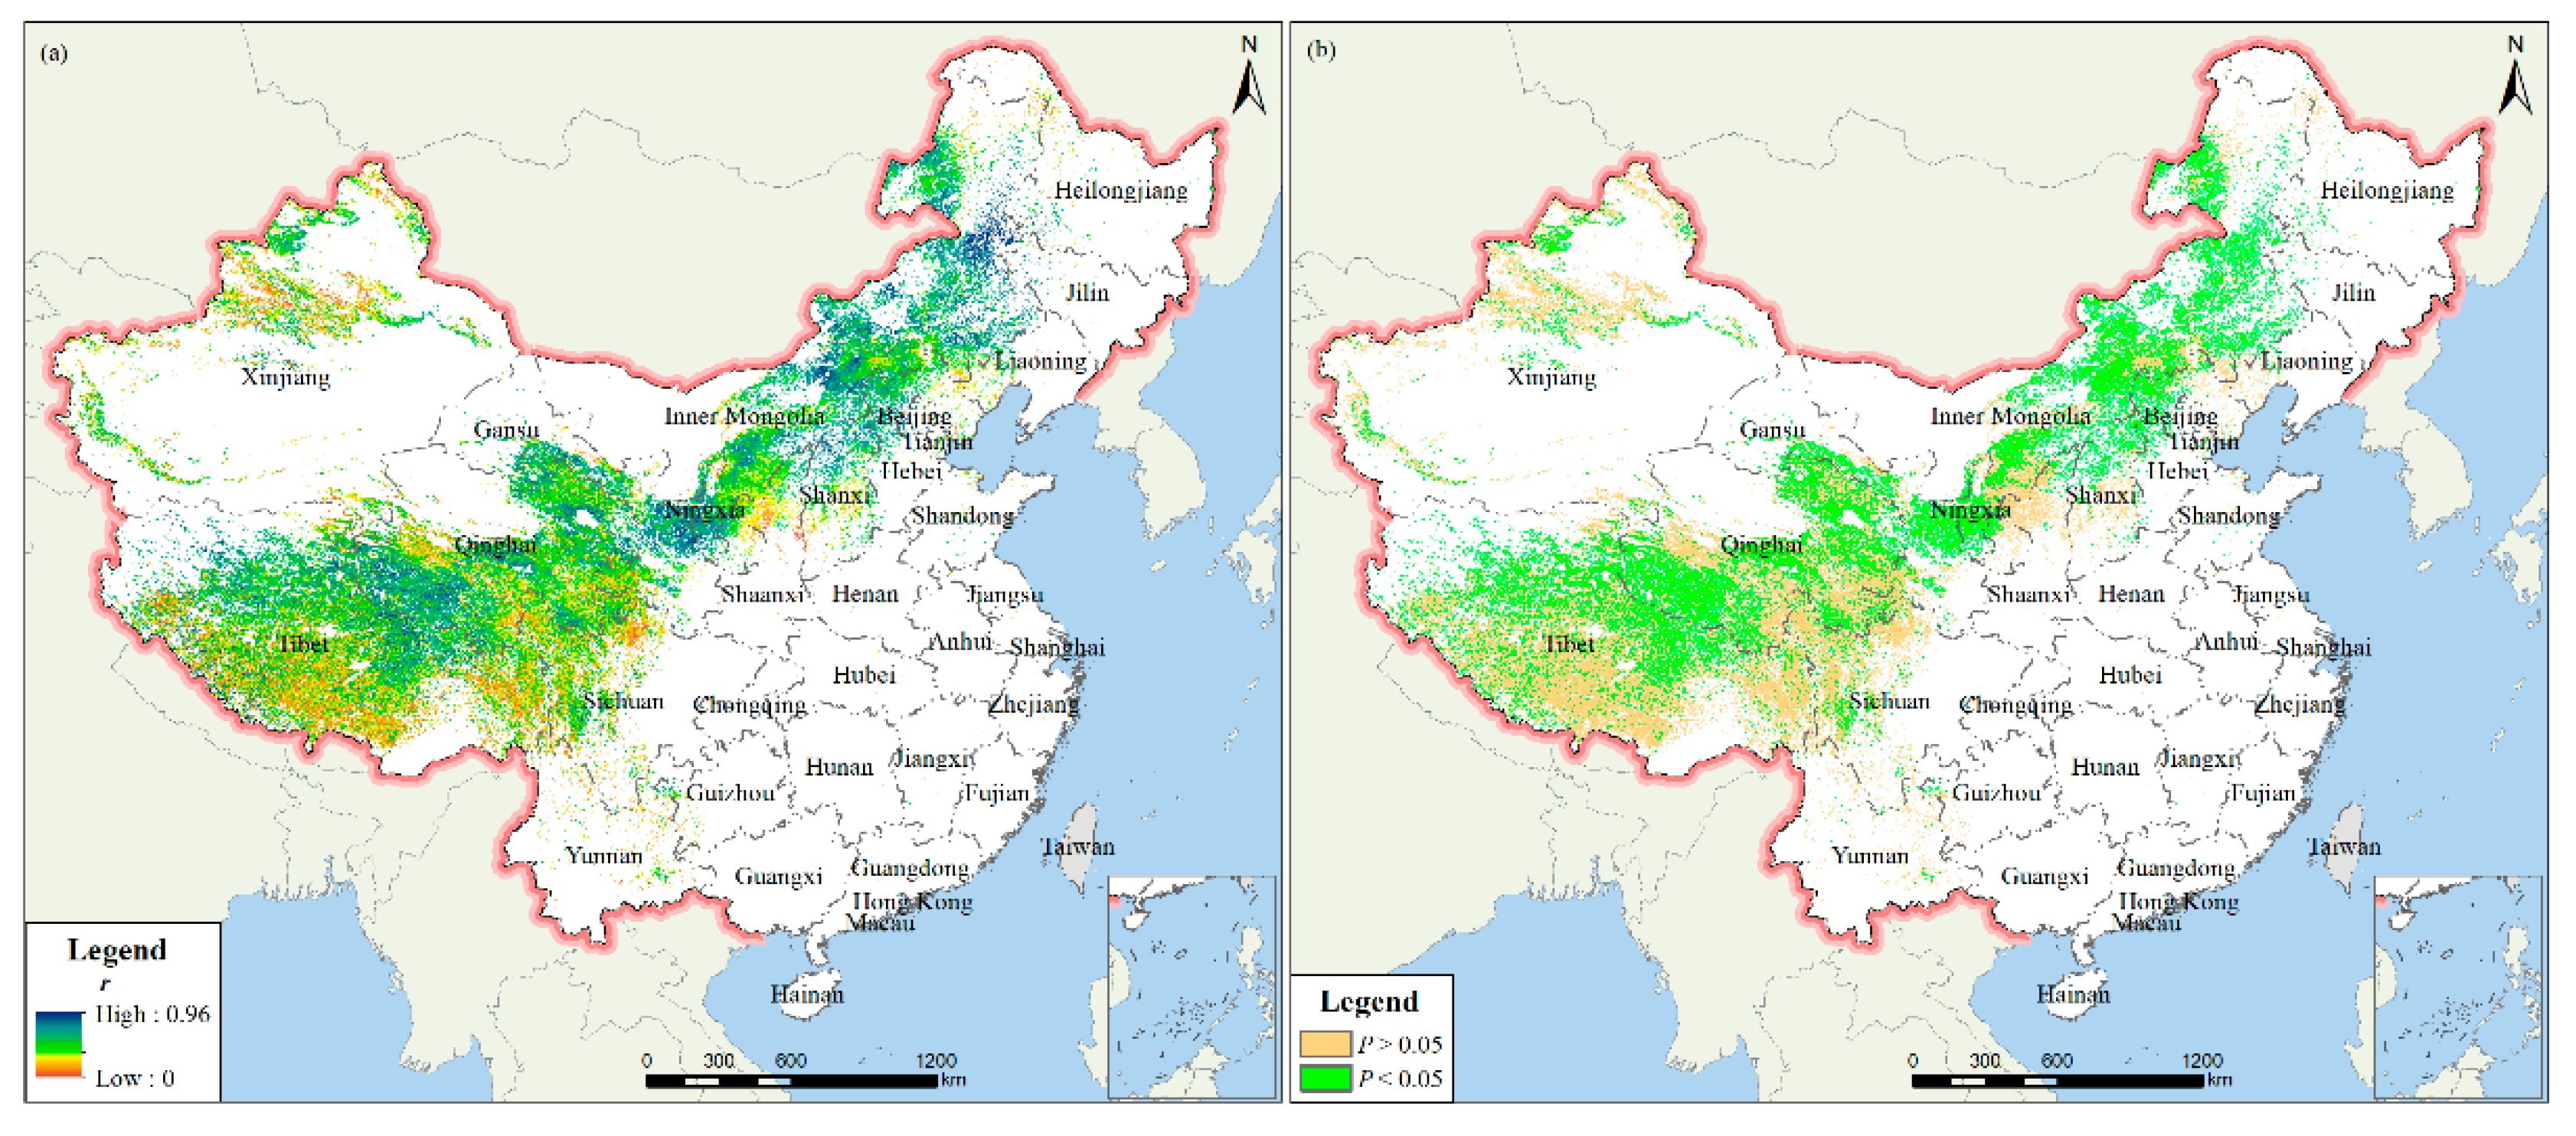
3.3.1. Multiple Correlations
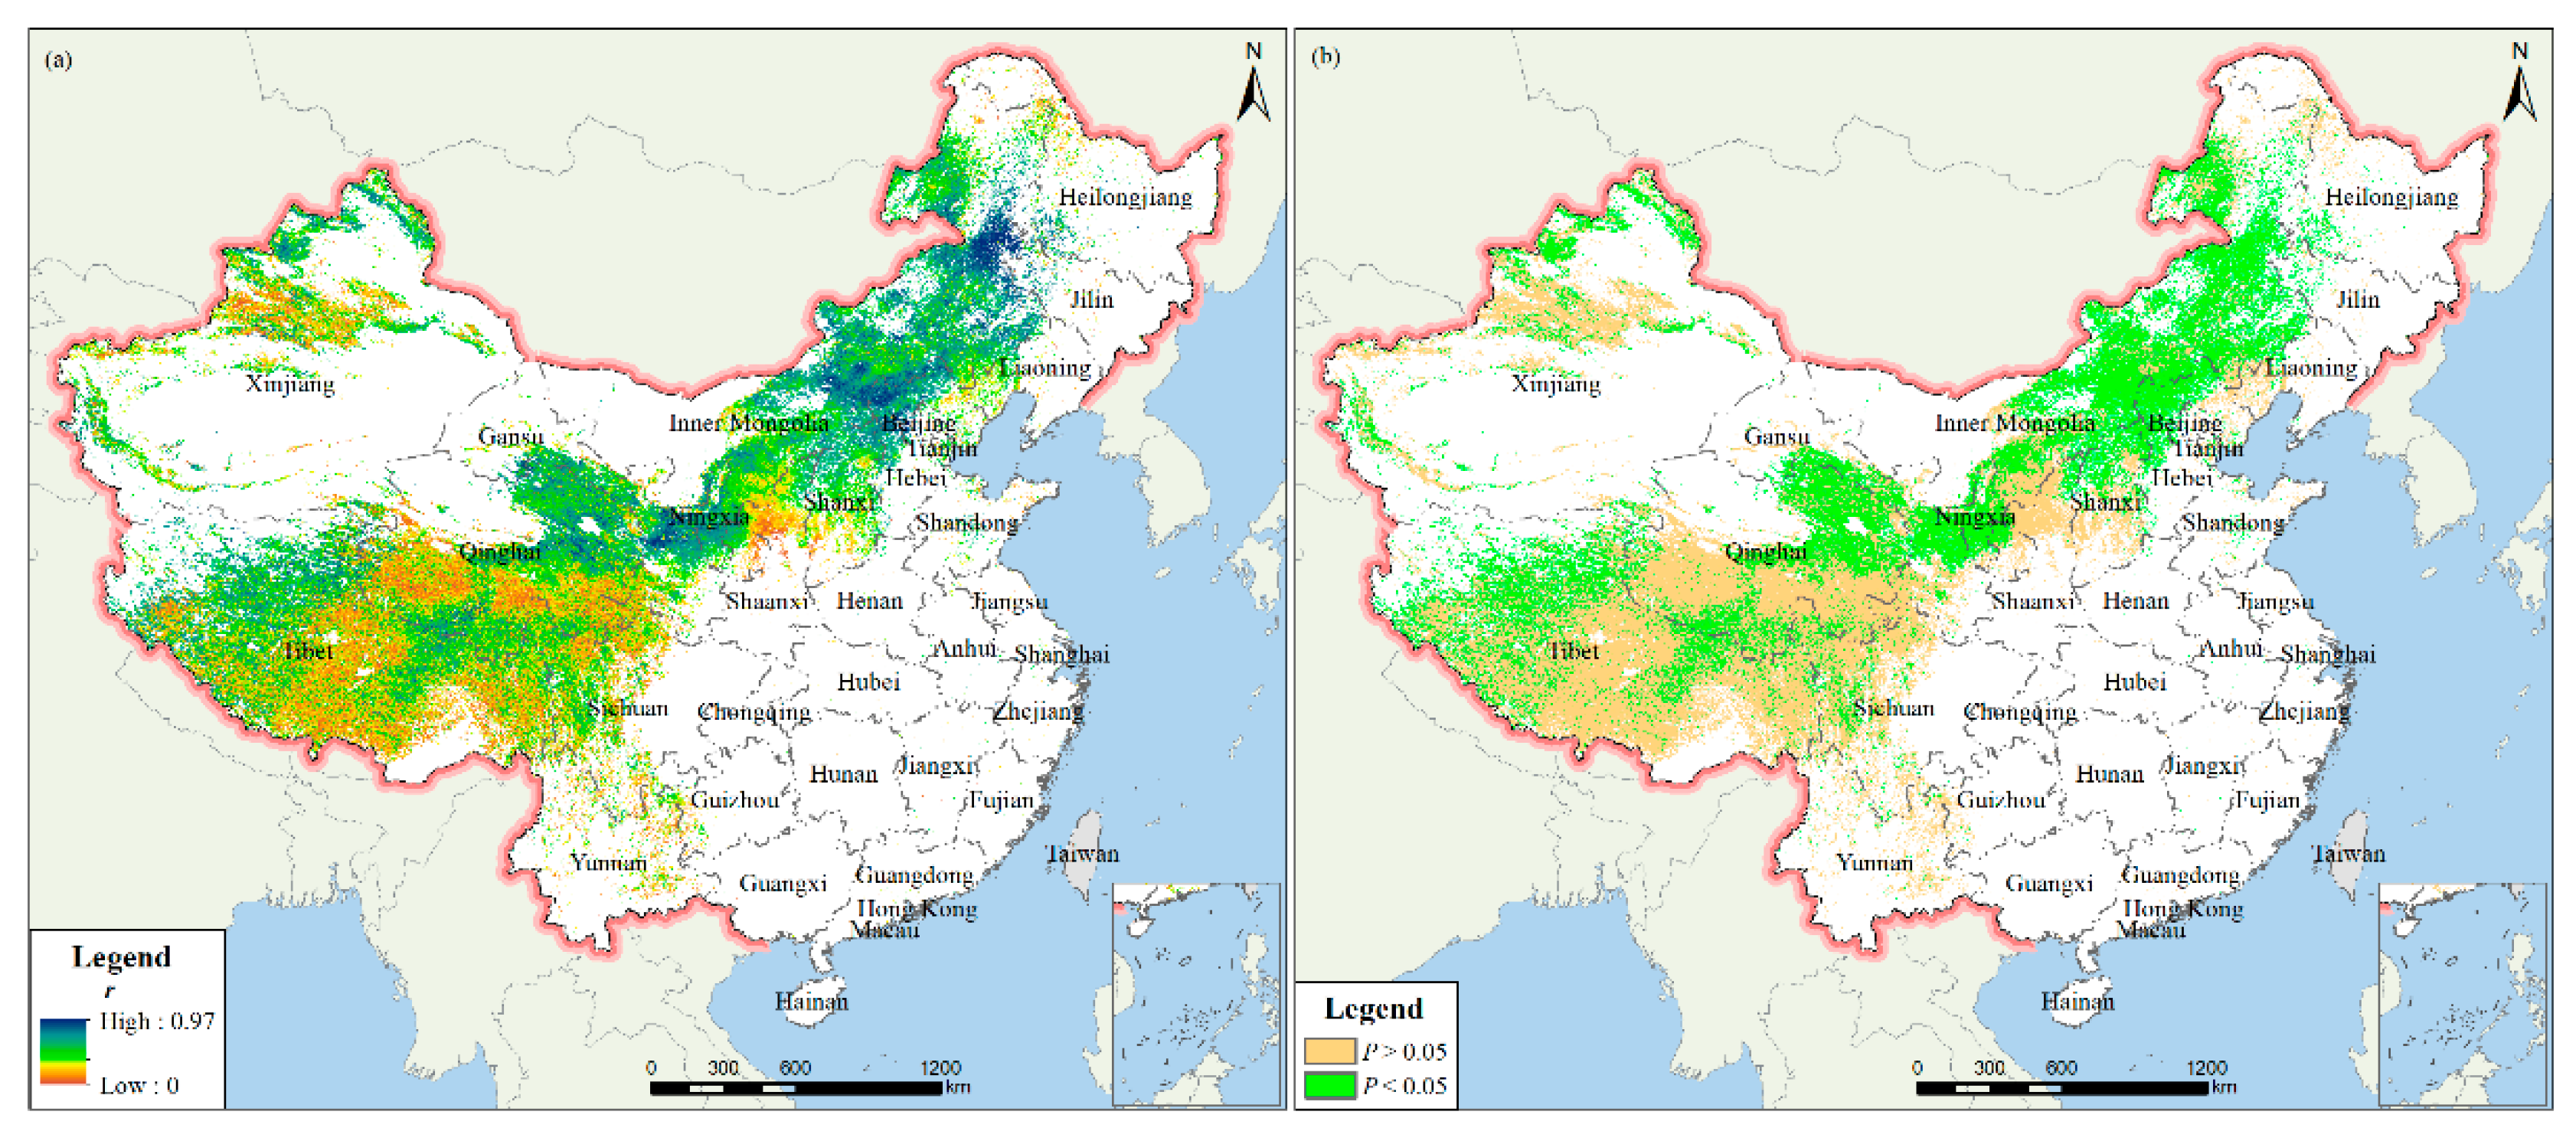
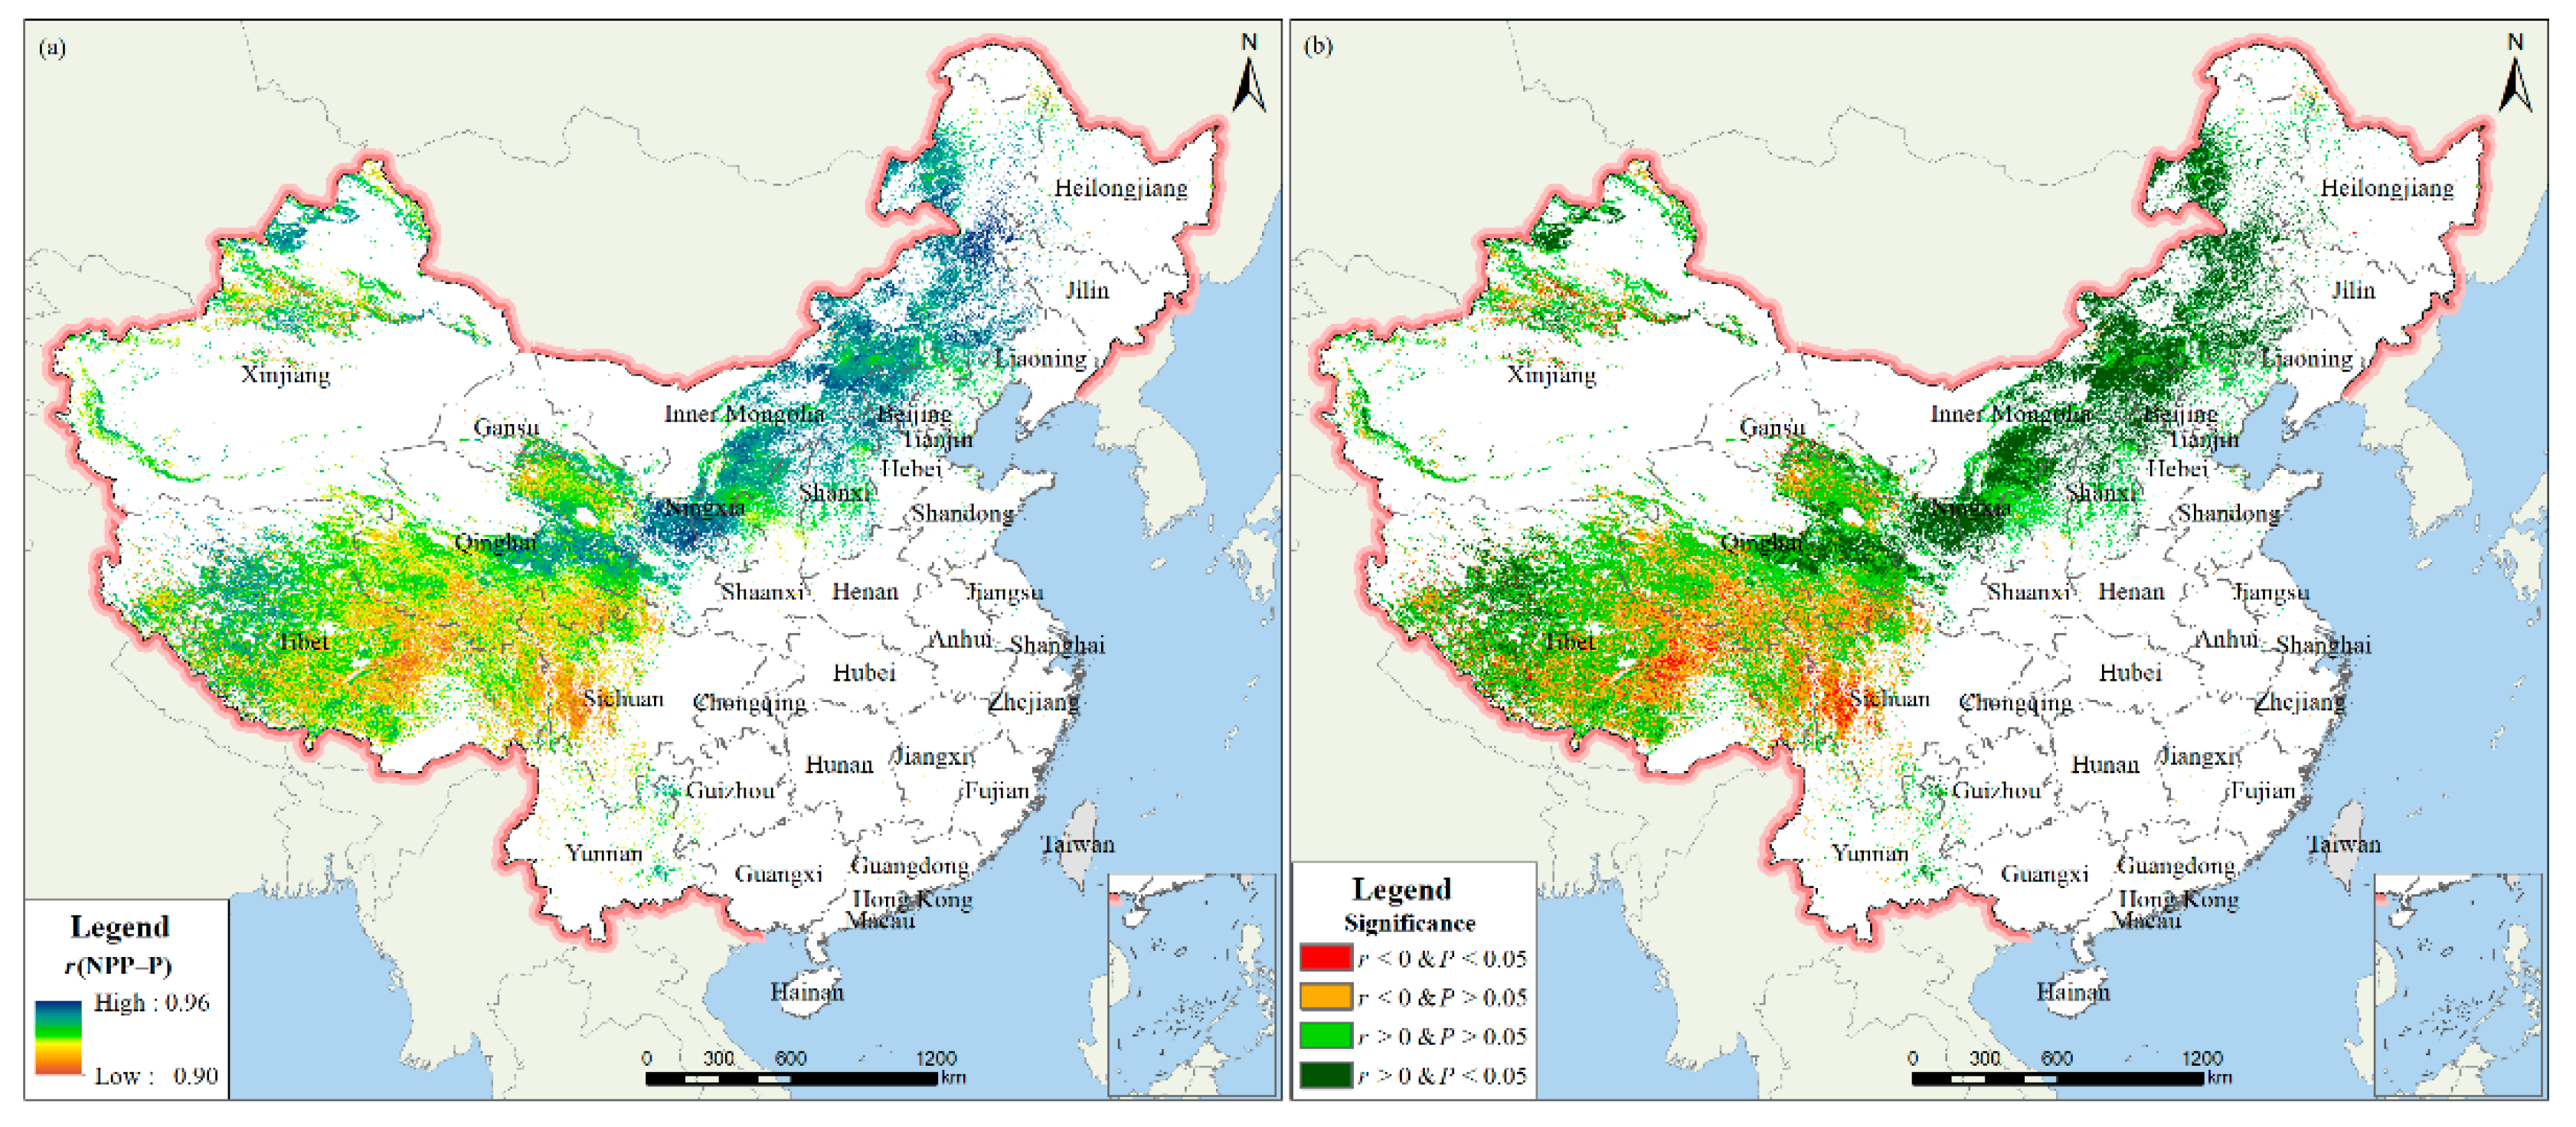
3.3.2. Partial Correlations
4. Discussion
4.1. Effects of CC on ANPP
4.2. Effects of HA on ANPP
4.3. Methods for Quantitative Assessment of the CC and HA Influence on Grassland ANPP
5. Conclusions
Author Contributions
Funding
Data Availability Statement
Acknowledgments
Conflicts of Interest
References
- Ge, W.; Deng, L.; Wang, F.; Han, J. Quantifying the contributions of human activities and climate change to vegetation net primary productivity dynamics in China from 2001 to 2016. Sci. Total Environ. 2021, 773, 145648. [Google Scholar] [CrossRef]
- Field, C.B.; Behrenfeld, M.J.; Randerson, J.T.; Falkowski, P. Primary production of the biosphere: Integrating terrestrial and oceanic components. Science 1998, 281, 237–240. [Google Scholar] [CrossRef] [PubMed]
- Zhai, D.; Gao, X.; Li, B.; Yuan, Y.; Jiang, Y.; Liu, Y.; Li, Y.; Li, R.; Liu, W.; Xu, J. Driving climatic factors at critical plant developmental stages for Qinghai-Tibet plateau alpine grassland productivity. Remote Sens. 2022, 14, 1564. [Google Scholar] [CrossRef]
- Wu, C.; Hou, X.; Peng, D.; Gonsamo, A.; Xu, S. Land surface phenology of China’s temperate ecosystems over 1999–2013: Spatial–temporal patterns, interaction effects, covariation with climate and implications for productivity. Agric. For. Meteorol. 2016, 216, 177–187. [Google Scholar] [CrossRef]
- Zhao, W.; Wu, J.; Shen, Q.; Liu, L.; Lin, J.; Yang, J. Estimation of the net primary productivity of winter wheat based on the near-infrared radiance of vegetation. Sci. Total Environ. 2022, 838, 156090. [Google Scholar] [CrossRef] [PubMed]
- Potter, C.; Klooster, S.; Genovese, V. Net primary production of terrestrial ecosystems from 2000 to 2009. Clim. Chang. 2012, 115, 365–378. [Google Scholar] [CrossRef]
- Yu, K.; Ciais, P.; Seneviratne, S.I.; Liu, Z.; Chen, H.Y.H.; Barichivich, J.; Allen, C.D.; Yang, H.; Huang, Y.; Ballantyne, A.P. Field-based tree mortality constraint reduces estimates of model-projected forest carbon sinks. Nat. Commun. 2022, 13, 2094. [Google Scholar] [CrossRef]
- Restrepo, H.I.; Montes, C.R.; Bullock, B.P.; Mei, B. The effect of climate variability factors on potential net primary productivity uncertainty: An analysis with a stochastic spatial 3-PG model. Agric. For. Meteorol. 2022, 315, 108812. [Google Scholar] [CrossRef]
- Xie, C.; Wu, S.; Zhuang, Q.; Zhang, Z.; Hou, G.; Luo, G.; Hu, Z. Where anthropogenic activity occurs, anthropogenic activity dominates vegetation net primary productivity change. Remote Sens. 2022, 14, 1092. [Google Scholar] [CrossRef]
- Zhang, Y.; Wang, Q.; Wang, Z.; Yang, Y.; Li, J. Impact of human activities and climate change on the grassland dynamics under different regime policies in the Mongolian Plateau. Sci. Total Environ. 2020, 698, 134304. [Google Scholar] [CrossRef]
- Hidalgo-Galvez, M.D.; Barkaoui, K.; Volaire, F.; Matias, L.; Cambrolle, J.; Fernandez-Rebollo, P.; Carbonero, M.D.; Perez-Ramos, I.M. Can trees buffer the impact of climate change on pasture production and digestibility of Mediterranean dehesas? Sci. Total Environ. 2022, 835, 155535. [Google Scholar] [CrossRef] [PubMed]
- Yang, G.; Hautier, Y.; Zhang, Z.; Lu, X.; Han, X. Decoupled responses of above- and below-ground stability of productivity to nitrogen addition at the local and larger spatial scale. Glob. Chang. Biol. 2022, 28, 2711–2720. [Google Scholar] [CrossRef] [PubMed]
- Zhao, M.; Running, S.W. Drought-Induced Reduction in Global Terrestrial Net Primary Production from 2000 through 2009. Science 2010, 329, 940–943. [Google Scholar] [CrossRef] [PubMed]
- Qu, S.; Wang, L.; Lin, A.; Yu, D.; Yuan, M.; Li, C. Distinguishing the impacts of climate change and anthropogenic factors on vegetation dynamics in the Yangtze River Basin, China. Ecol. Indic. 2020, 108, 105724. [Google Scholar] [CrossRef]
- Du, X.; Jin, X.; Yang, X.; Yang, X.; Zhou, Y. Spatial pattern of land use change and its driving force in Jiangsu province. Int. J. Environ. Res. Public Health 2014, 11, 3215–3232. [Google Scholar] [CrossRef]
- Del Grosso, S. Global potential net primary production predicted from vegetation class, precipitation, and temperature. Ecology 2008, 89, 2971. [Google Scholar] [CrossRef]
- Liu, G.; Shao, Q.; Fan, J.; Ning, J.; Rong, K.; Huang, H.; Liu, S.; Zhang, X.; Niu, L.; Liu, J. Change Trend and Restoration Potential of Vegetation Net Primary Productivity in China over the Past 20 Years. Remote Sens. 2022, 14, 1634. [Google Scholar] [CrossRef]
- Ouyang, L.; Ma, H.; Wang, Z.; Wang, Z.; Yu, X. Impacts of climate change and human activities on net primary productivity of grassland in the eastern Inner Mongolia. Acta Ecol. Sin. 2020, 40, 6912–6924. [Google Scholar]
- Mueller, T.; Dressler, G.; Tucker, C.J.; Pinzon, J.E.; Leimgruber, P.; Dubayah, R.O.; Hurtt, G.C.; Boehning-Gaese, K.; Fagan, W.F. Human Land-Use practices lead to global Long-Term increases in photosynthetic capacity. Remote Sens. 2014, 6, 5717–5731. [Google Scholar] [CrossRef]
- Yin, L.; Dai, E.; Zheng, D.; Wang, Y.; Ma, L.; Tong, M. What drives the vegetation dynamics in the Hengduan Mountain region, southwest China: Climate change or human activity? Ecol. Indic. 2020, 112, 106013. [Google Scholar] [CrossRef]
- Qi, X.; Jia, J.; Liu, H.; Lin, Z. Relative importance of climate change and human activities for vegetation changes on China’s silk road economic belt over multiple timescales. Catena 2019, 180, 224–237. [Google Scholar] [CrossRef]
- Li, X.; Luo, Y.; Wu, J. Decoupling Relationship between Urbanization and Carbon Sequestration in the Pearl River Delta from 2000 to 2020. Remote Sens. 2022, 14, 526. [Google Scholar] [CrossRef]
- Shi, Y.; Jin, N.; Ma, X.; Wu, B.; He, Q.; Yue, C.; Yu, Q. Attribution of climate and human activities to vegetation change in China using machine learning techniques. Agric. For. Meteorol. 2020, 294, 108146. [Google Scholar] [CrossRef]
- Teng, M.; Zeng, L.; Hu, W.; Wang, P.; Yan, Z.; He, W.; Zhang, Y.; Huang, Z.; Xiao, W. The impacts of climate changes and human activities on net primary productivity vary across an ecotone zone in Northwest China. Sci. Total Environ. 2020, 714, 136691. [Google Scholar] [CrossRef] [PubMed]
- Li, C.; Wang, Y.; Wu, X.; Cao, H.; Li, W.; Wu, T. Reducing human activity promotes environmental restoration in arid and semi-arid regions: A case study in Northwest China. Sci. Total Environ. 2021, 768, 144525. [Google Scholar] [CrossRef]
- Li, H.; Zhang, H.; Li, Q.; Zhao, J.; Guo, X.; Ying, H.; Deng, G.; Rihan, W.; Wang, S. Vegetation productivity dynamics in response to climate change and human activities under different topography and land cover in northeast china. Remote Sens. 2021, 13, 975. [Google Scholar] [CrossRef]
- Liu, H.; Hou, L.; Kang, N.; Nan, Z.; Huang, J. A meta-regression analysis of the economic value of grassland ecosystem services in China. Ecol. Indic. 2022, 138, 108793. [Google Scholar] [CrossRef]
- Huang, L.; Ning, J.; Zhu, P.; Zheng, Y.; Zhai, J. The conservation patterns of grassland ecosystem in response to the forage-livestock balance in North China. J. Geogr. Sci. 2021, 31, 518–534. [Google Scholar] [CrossRef]
- Yu, G.; Li, X.; Wang, Q.; Li, S. Carbon storage and its spatial pattern of terrestrial ecosystem in china. J. Resour. Ecol. 2010, 1, 97–109. [Google Scholar]
- Xu, L.; Yu, G.; He, N. Increased soil organic carbon storage in Chinese terrestrial ecosystems from the 1980s to the 2010s. J. Geogr. Sci. 2019, 29, 49–66. [Google Scholar] [CrossRef]
- Yan, Y.; Liu, X.; Wen, Y.; Ou, J. Quantitative analysis of the contributions of climatic and human factors to grassland productivity in northern China. Ecol. Indic. 2019, 103, 542–553. [Google Scholar] [CrossRef]
- Ge, J.; Hou, M.; Liang, T.; Feng, Q.; Meng, X.; Liu, J.; Bao, X.; Gao, H. Spatiotemporal dynamics of grassland aboveground biomass and its driving factors in North China over the past 20 years. Sci. Total Environ. 2022, 826, 154226. [Google Scholar] [CrossRef] [PubMed]
- Song, Z.; Wu, Y.; Yang, Y.; Zhang, X.; Van Zwieten, L.; Bolan, N.; Li, Z.; Liu, H.; Hao, Q.; Yu, C.; et al. High potential of stable carbon sequestration in phytoliths of China’s grasslands. Glob. Chang. Biol. 2022, 28, 2736–2750. [Google Scholar] [CrossRef] [PubMed]
- Zhou, W.; Gang, C.; Zhou, L.; Chen, Y.; Li, J.; Ju, W.; Odeh, I. Dynamic of grassland vegetation degradation and its quantitative assessment in the northwest China. Acta Oecol. 2014, 55, 86–96. [Google Scholar] [CrossRef]
- Guo, Y.; Li, R.; Yang, Y.; Ma, J.; Zheng, H. Integrating future grassland degradation risk to improve the spatial targeting efficiency of payment for ecosystem services. J. Environ. Manag. 2022, 317, 115490. [Google Scholar] [CrossRef]
- Zhou, W.; Yang, H.; Huang, L.; Chen, C.; Lin, X.; Hu, Z.; Li, J. Grassland degradation remote sensing monitoring and driving factors quantitative assessment in China from 1982 to 2010. Ecol. Indic. 2017, 83, 303–313. [Google Scholar] [CrossRef]
- Naeem, S.; Zhang, Y.; Tian, J.; Qamer, F.M.; Latif, A.; Paul, P.K. Quantifying the Impacts of Anthropogenic Activities and Climate Variations on Vegetation Productivity Changes in China from 1985 to 2015. Remote Sens. 2020, 12, 1113. [Google Scholar] [CrossRef]
- Wang, X.; Pan, S.; Pan, N.; Pan, P. Grassland productivity response to droughts in northern China monitored by satellite-based solar-induced chlorophyll fluorescence. Sci. Total Environ. 2022, 830, 154550. [Google Scholar] [CrossRef]
- Zhang, Y.; Du, R.; Chen, H.; Du, P.; Zhang, S.; Ren, W. Different characteristics of microbial diversity and special functional microbes in rainwater and topsoil before and after 2019 new coronavirus epidemic in Inner Mongolia Grassland. Sci. Total Environ. 2022, 809, 151088. [Google Scholar] [CrossRef]
- Lu, L.; Sun, Z.; Qimuge, E.; Ye, H.; Huang, W.; Nie, C.; Wang, K.; Zhou, Y. Using remote sensing data and Species-Environmental matching model to predict the potential distribution of grassland rodents in the northern china. Remote Sens. 2022, 14, 2168. [Google Scholar] [CrossRef]
- Jiang, H.; Xu, X.; Guan, M.; Wang, L.; Huang, Y.; Liu, Y. Simulation of spatiotemporal land use changes for integrated model of socioeconomic and ecological processes in china. Sustainability 2019, 11, 3627. [Google Scholar] [CrossRef]
- Wu, X.; Dang, X.; Meng, Z.; Fu, D.; Cong, W.; Zhao, F.; Guo, J. Mechanisms of grazing management impact on preferential water flow an infiltration patterns in a semi-arid grassland in northern China. Sci. Total Environ. 2022, 813, 152082. [Google Scholar] [CrossRef] [PubMed]
- Xu, J.; Sun, G.; Liu, Y. Diversity and complexity in the forms and functions of protected areas in china. J. Int. Wildl. Law Policy 2014, 17, 102–114. [Google Scholar] [CrossRef]
- Wandesforde-Smith, G.; Snyder, K.D.; Hart, L.A. Biodiversity conservation and protected areas in china: Science, law, and the obdurate Party-State. Soc. Sci. Electron. Publ. 2014, 17, 1476–1548. [Google Scholar] [CrossRef]
- Tobler, W. On the first law of geography: A reply. Ann. Assoc. Am. Geogr. 2004, 94, 304–310. [Google Scholar] [CrossRef]
- Wei, X.; Yang, J.; Luo, P.; Lin, L.; Lin, K.; Guan, J. Assessment of the variation and influencing factors of vegetation NPP and carbon sink capacity under different natural conditions. Ecol. Indic. 2022, 138, 108834. [Google Scholar] [CrossRef]
- Jiang, H.; Xu, X.; Guan, M.; Wang, L.; Huang, Y.; Jiang, Y. Determining the contributions of climate change and human activities to vegetation dynamics in agro-pastural transitional zone of northern China from 2000 to 2015. Sci. Total Environ. 2020, 718, 134871. [Google Scholar] [CrossRef]
- Wang, Y.; Zhang, Z.; Chen, X. The dominant driving force of forest change in the yangtze river basin, china: Climate variation or anthropogenic activities? Forests 2022, 13, 82. [Google Scholar] [CrossRef]
- Ma, R.; Xia, C.; Liu, Y.; Wang, Y.; Zhang, J.; Shen, X.; Lu, X.; Jiang, M. Spatiotemporal change of net primary productivity and its response to climate change in temperate grasslands of china. Front. Plant Sci. 2022, 13, 899800. [Google Scholar] [CrossRef]
- Ma, J.; Weng, B.; Bi, W.; Xu, D.; Xu, T.; Yan, D. Impact of climate change on the growth of typical crops in karst areas: A case study of guizhou province. Adv. Meteorol. 2019, 2019, 16. [Google Scholar] [CrossRef]
- Hoover, D.L.; Hajek, O.L.; Smith, M.D.; Wilkins, K.; Slette, I.J.; Knapp, A.K. Compound hydroclimatic extremes in a semi-arid grassland: Drought, deluge, and the carbon cycle. Glob. Chang. Biol. 2022, 28, 2611–2621. [Google Scholar] [CrossRef] [PubMed]
- Pan, Y.; Jackson, R.B.; Hollinger, D.Y.; Phillips, O.L.; Nowak, R.S.; Norby, R.J.; Oren, R.; Reich, P.B.; Luescher, A.; Mueller, K.E.; et al. Contrasting responses of woody and grassland ecosystems to increased CO2 as water supply varies. Nat. Ecol. Evol. 2022, 6, 315. [Google Scholar] [CrossRef] [PubMed]
- Wang, S.; Zhang, B.; Yang, Q.; Chen, G.; Yang, B.; Lu, L.; Shen, M.; Peng, Y. Responses of net primary productivity to phenological dynamics in the Tibetan Plateau, China. Agric. For. Meteorol. 2017, 232, 235–246. [Google Scholar] [CrossRef]
- Zhang, M.; Yuan, N.; Lin, H.; Liu, Y.; Zhang, H. Quantitative estimation of the factors impacting spatiotemporal variation in NPP in the Dongting Lake wetlands using Landsat time series data for the last two decades. Ecol. Indic. 2022, 135, 108544. [Google Scholar] [CrossRef]
- Ma, S.; Li, Y.; Zhang, Y.; Wang, L.; Jiang, J.; Zhang, J. Distinguishing the relative contributions of climate and land use/cover changes to ecosystem services from a geospatial perspective. Ecol. Indic. 2022, 136, 108645. [Google Scholar] [CrossRef]
- Chen, T.; Tang, G.; Yuan, Y.; Guo, H.; Xu, Z.; Jiang, G.; Chen, X. Unraveling the relative impacts of climate change and human activities on grassland productivity in Central Asia over last three decades. Sci. Total Environ. 2020, 743, 140649. [Google Scholar] [CrossRef]
- Wang, S.; Zhang, Q.; Yue, P.; Wang, J.; Yang, J.; Wang, W.; Zhang, H.; Ren, X. Precipitation-Use efficiency and its conversion with climate types in mainland china. Remote Sens. 2022, 14, 2467. [Google Scholar] [CrossRef]
- Zhou, Y.; Yue, D.; Guo, J.; Chao, Z.; Meng, X. Assessing the impact of land conversion and management measures on the net primary productivity in the Bailong River Basin, in China. Catena 2021, 207, 105672. [Google Scholar] [CrossRef]
- Liu, H.; Cao, L.; Jia, J.; Gong, H.; Qi, X.; Xu, X. Effects of land use changes on the nonlinear trends of net primary productivity in arid and semi-arid areas, China. Land Degrad. Dev. 2021, 32, 2183–2196. [Google Scholar] [CrossRef]
- Yan, W.; Wang, Y.; Chaudhary, P.; Ju, P.; Zhu, Q.; Kang, X.; Chen, H.; He, Y. Effects of climate change and human activities on net primary production of wetlands on the Zoige Plateau from 1990 to 2015. Glob. Ecol. Conserv. 2022, 35, e02052. [Google Scholar] [CrossRef]
- Xiong, Q.; Xiao, Y.; Liang, P.; Li, L.; Zhang, L.; Li, T.; Pan, K.; Liu, C. Trends in climate change and human interventions indicate grassland productivity on the Qinghai-Tibetan Plateau from 1980 to 2015. Ecol. Indic. 2021, 129, 108010. [Google Scholar] [CrossRef]
- Du, J.; Fu, Q.; Fang, S.; Wu, J.; He, P.; Quan, Z. Effects of rapid urbanization on vegetation cover in the metropolises of China over the last four decades. Ecol. Indic. 2019, 107, 105458. [Google Scholar] [CrossRef]
- Zhao, L.; Liu, Z.; Hu, Y.; Zhou, W.; Peng, Y.; Ma, T.; Liu, L.; Li, S.; Wang, L.; Mao, X. Evaluation of reasonable stocking rate based on the relative contribution of climate change and grazing activities to the productivity of alpine grasslands in Qinghai province. Remote Sens. 2022, 14, 1455. [Google Scholar] [CrossRef]
- Lei, T.; Wu, J.; Li, X.; Geng, G.; Shao, C.; Zhou, H.; Wang, Q.; Liu, L. A new framework for evaluating the impacts of drought on net primary productivity of grassland. Sci. Total Environ. 2015, 536, 161–172. [Google Scholar] [CrossRef] [PubMed]
- Gang, C.; Zhao, W.; Zhao, T.; Zhang, Y.; Gao, X.; Wen, Z. The impacts of land conversion and management measures on the grassland net primary productivity over the Loess Plateau, Northern China. Sci. Total Environ. 2018, 645, 827–836. [Google Scholar] [CrossRef] [PubMed]
- Zhou, Y.; Yue, D.; Li, C.; Mu, X.; Guo, J. Identifying the spatial drivers of net primary productivity: A case study in the Bailong River Basin, China. Glob. Ecol. Conserv. 2021, 28, e01685. [Google Scholar] [CrossRef]
- Pan, Y.; Yu, C.; Zhang, X.; Chen, B.; Wu, J.; Tu, Y.; Miao, Y.; Luo, L. A modified framework for the regional assessment of climate and human impacts on net primary productivity. Ecol. Indic. 2016, 60, 184–191. [Google Scholar] [CrossRef]


| Data | Website | Data Type | Resolution |
|---|---|---|---|
| LULC (CCI land cover) | https://www.esa-landcover-cci.org (4 January 2022) | raster | 300 m |
| NPP | https://lpdaacsvc.cr.usgs.gov (10 January 2022) | raster | 1 km |
| Precipitation and temperature | https://data.cma.cn/ (16 January 2022) | vector | |
| Eco-geographical zoning | https://www.resdc.cn/ (25 January 2022) | vector | |
| DEM | https://www.resdc.cn/ (27 January 2022) | raster | 1 km |
| National natural reserves | https://www.resdc.cn/ (28 January 2022) | vector |
| Scheme | Driving Factors | Contribution | ||
|---|---|---|---|---|
| Climate (%) | Human (%) | |||
| SANPP > 0 | SPNPP > 0, SHNPP < 0 | Both | ||
| SPNPP < 0, SHNPP < 0 | Human activities | 0 | 100 | |
| SPNPP > 0, SHNPP > 0 | Climate change | 100 | 0 | |
| SANPP < 0 | SPNPP < 0, SHNPP > 0 | Both | ||
| SPNPP > 0, SHNPP > 0 | Human activities | 0 | 100 | |
| SPNPP < 0, SHNPP < 0 | Climate change | 100 | 0 | |
Publisher’s Note: MDPI stays neutral with regard to jurisdictional claims in published maps and institutional affiliations. |
© 2022 by the authors. Licensee MDPI, Basel, Switzerland. This article is an open access article distributed under the terms and conditions of the Creative Commons Attribution (CC BY) license (https://creativecommons.org/licenses/by/4.0/).
Share and Cite
Zhou, X.; Peng, B.; Zhou, Y.; Yu, F.; Wang, X.-C. Quantifying the Influence of Climate Change and Anthropogenic Activities on the Net Primary Productivity of China’s Grasslands. Remote Sens. 2022, 14, 4844. https://doi.org/10.3390/rs14194844
Zhou X, Peng B, Zhou Y, Yu F, Wang X-C. Quantifying the Influence of Climate Change and Anthropogenic Activities on the Net Primary Productivity of China’s Grasslands. Remote Sensing. 2022; 14(19):4844. https://doi.org/10.3390/rs14194844
Chicago/Turabian StyleZhou, Xiafei, Binbin Peng, Ying Zhou, Fang Yu, and Xue-Chao Wang. 2022. "Quantifying the Influence of Climate Change and Anthropogenic Activities on the Net Primary Productivity of China’s Grasslands" Remote Sensing 14, no. 19: 4844. https://doi.org/10.3390/rs14194844