
Effect of Radio Frequency Interference-Contaminated AMSR2 Signal Restoration on Soil Moisture Retrieval

1
Center of Data Assimilation for Research and Application, Nanjing University of Information Science and Technology, Nanjing 210044, China
2
Collaborative Innovation Center on Forecast and Evaluation of Meteorological Disasters, Nanjing University of Information Science and Technology, Nanjing 210044, China
3
International Center for Climate and Environment Sciences, Institute of Atmospheric Physics, Chinese Academy of Sciences, Beijing 100029, China
*
Author to whom correspondence should be addressed.
Remote Sens. 2022, 14(19), 4796; https://doi.org/10.3390/rs14194796
Submission received: 29 August 2022
/
Revised: 22 September 2022
/
Accepted: 23 September 2022
/
Published: 26 September 2022
Abstract
:Soil moisture is a key variable of the climate system. Microwave remote sensing has become an essential means of obtaining soil moisture because of the unique advantages of its all-day and all-weather observation capability. Theoretically, low-frequency C-band observations are highly suitable for soil moisture retrieval because of their high sensitivity to soil moisture at vegetation roots. However, the quality of C-band observations suffers from radio frequency interference (RFI) over the United States. This paper used the iterative principal component analysis (PCA) method to repair RFI-contaminated second-generation Advanced Microwave Scanning Radiometer (AMSR-2) C-band observations, and the results of soil moisture retrieval based on restored data were evaluated. It was found that RFI could lead to nonconvergence in the retrieval of a large amount of data, and the application of repaired data in retrieval could result in the recovery of more than 80% of nonconvergent data, especially in spring and autumn. The retrieval results based on restored data attained a satisfactory correlation with ERA5 reanalysis data and European Space Agency Climate Change Initiative (ESA-CCI) soil moisture data and suitably agreed with precipitation observation data. Soil moisture generally exhibited a gradual increase from west to north and east. This feature was weakened due to the influence of monsoons in the east in summer. The western side of the Cascade Mountains is the wettest area of the United States, with soil moisture exceeding 0.4 m3 m−3. The driest region of the United States is located between the Rockies and Cordillera Mountains, and the soil moisture value is lower than 0.1 m3 m−3.
1. Introduction
Soil moisture is considered a key variable of the climate system; soil moisture can influence plant transpiration and photosynthesis and water, energy, and biogeochemical cycles [1]. In addition, soil moisture can provide a super self-memory capacity of up to several months to retain anomalous information such as precipitation and radiation and can influence climate change through a series of feedback mechanisms at regional and global scales, which plays an important role in climate change prediction [2]. Koster et al. [3] used the Global Land-Atmosphere Coupling Experiment (GLACE) model to quantify the predictive skill of soil moisture initialization in regard to subseasonal-scale precipitation and temperature and obtained significant improvements in many regions. Therefore, accurate soil moisture data are important for scientific research and practical applications [4], and the Global Climate Observing System recognizes soil moisture as an essential climate variable [5]. However, due to the complex temporal and spatial variation characteristics of soil moisture [6], the spatial coverage and representativeness of conventional observation data can hardly meet the needs of soil moisture research [7]. Microwave remote sensing can obtain all-day and nearly all-weather high-resolution surface radiation information. These characteristics ensure that microwave remote sensing provides unique advantages in the field of soil moisture retrieval [8].
The dielectric constant of soil is a function of several ground parameters (soil moisture, soil texture, capacitance, temperature, and salinity) and sensor parameters (frequency). It can be regarded as a complex number that contains a real and an imaginary part. The real part determines the propagation characteristics of energy as it passes upward through soil, while the imaginary part determines the energy loss [9]. At these frequencies, soil moisture is retrieved through the large difference in dielectric constant that exists between water and dry soil. An increase in water content increases the dielectric constant, which in turn affects the emissivity. The dependence of soil dielectric constant on moisture content increases as the microwave frequency decreases. In the X-band, the difference between the dielectric constant of dry soil (∼4) and pure water (∼80) is very large. Therefore, the moisture content of soil can be derived from the observations at this wavelength.
Many algorithms based on radiative transfer models for soil moisture retrieval have been proposed. Jackson et al. [10] proposed the single-channel algorithm (SCA) for soil moisture retrieval based on the empirical relationship between observation data and soil moisture. Njoku [11] proposed the NASA iterative four-channel retrieval algorithm. This retrieval algorithm is based on the cost function of the observed brightness temperature versus the simulated brightness temperature, which is then iterated to fit the minimum cost function to simultaneously retrieve multiple surface parameters. Owe [12] proposed the Land Parameter Retrieval Model (LPRM), which is a single-band dual-polarization channel algorithm. The LPRM algorithm optimizes the canopy optical depth and the soil dielectric constant by surface type and calculates the brightness temperature using a nonlinear iterative procedure through a forward modeling approach. Once the difference between the calculated brightness temperature and the observed brightness temperature reaches the convergence standard, the model derives the surface soil moisture from the optimized dielectric constant using a global database of soil physical properties and a soil dielectric model. This makes the model largely physically based, free of regional dependencies, and applicable to any microwave frequency suitable for soil moisture monitoring. These retrieval methods and satellite data are now widely used in scientific research. Wang et al. [13] found that soil moisture in Northeast China obtained via LPRM retrieval of the FY-3B brightness temperature exhibits a high correlation with station information. Many other scientists have developed various soil moisture retrieval methods with different physical and mathematical bases [14,15,16,17,18].
However, various instruments, such as TV, communication satellites, weather or military radar, GPS signals, and cell phones, occupy various low-frequency microwave channels. This means that in addition to the actual thermal radiation from the Earth’s surface, the on-board microwave radiometer also receives signals from active microwave transmitters on the Earth’s surface or signals reflected from the surface, collectively referred to as radio frequency interference (RFI) [19]. Since the thermal radiation from the Earth’s surface is relatively weak, it can be easily drowned out by the RFI signal, resulting in higher-than-normal brightness temperature in localized areas, thus contaminating the satellite data and leading to large retrieval errors. The instruments that are susceptible to RFI are mainly satellite observation instruments that contain low-frequency bands such as C-band, X-band, and L-band, including MIRAS of SMOS, AMSR-2 of GCOM-W1, AMSR-E of Aqua, and MWRI of Fengyun. Since the RFI causes a sharp increase in the thermal radiation received by the observation instruments, the soil parameters of the observed brightness temperature are difficult for the LPRM algorithm to converge during the iterative process correctly, so that the retrieved soil moisture cannot be given or the wrong results may be obtained.
Numerous studies [11,20] have demonstrated that RFI is widely present in low-frequency band observations, especially in the C-band (6 GHz) located over the United States. Therefore, the soil moisture products of the AMSR-E are obtained by retrieving the X-band (10 GHz) with less RFI contamination. In 2004, Li et al. [21] proposed that RFI signals of moderate and high intensities could be identified with the spectral difference method and determined that the United States was the most widely and severely RFI-disturbed region. Later, Li et al. [22] suggested the use of principal component analysis (PCA) to identify RFI signals on land and sea considering the correlation between each channel. However, since the identification performance of the PCA method is insufficient in winter, Zou et al. [23] proposed the normalized PCA (NPCA) method for RFI signal identification at high latitudes and complex snow and ice surfaces in winter. Zhao et al. [24] further established the dual PCA (DPCA) method regarding the RFI identification problem in complex surfaces covered with snow and sea ice. Zhang et al. [25] developed the modified PCA (MPCA) method using various RFI indices and two snow scattering indices to construct vectors for PCA. After the RFI signal has been effectively identified, it is highly important to consider the remediation of RFI-contaminated observations. Wu et al. [26] proposed a linear fitting method to restore RFI-contaminated information, which relied on a linear fitting method to obtain relationship curves between observation channels in the absence of RFI contamination based on the strong correlation between observations in different channels. Later, Shen et al. [27] established an iterative PCA method to restore RFI-contaminated observations, which fully considered the continuity between the spatial distribution of observations and their typical spatial distribution.
RFI severely restricts soil moisture retrieval of C-band microwaves. Although RFI restoration algorithms have been established by previous authors, further research is needed to verify whether the restored C-band brightness temperature can improve the soil moisture retrieval effect of C-band data. To address this issue, this paper chose the United States region as the main research area and used the iterative PCA method to restore RFI-contaminated data. Then, the LPRM algorithm was selected to retrieve the soil moisture based on C-band data. Retrieval results before and after RFI restoration were compared to clarify the applicability of restored data in soil moisture retrieval and finally provide a brief analysis of the soil moisture retrieval process.
2. Materials and Methods
2.1. Data
The AMSR-2 was launched in 2012 on board the GCOM-W1 satellite, which provides seven observation frequencies (6.9, 7.3, 10.7, 18.7, 23.8, 36.5, and 89.0 GHz), each with both horizontal and vertical polarization options, for a total of 14 channels. In this paper, whole-year L1R-level brightness temperature data covering the United States region of the AMSR-2 for 2016 were used for retrieval, which are resampled data, and all channels are therefore uniform at the same spatial resolution of 35 × 62 km similar to the 6.9 GHz channel.
To verify the effect of microwave imager information before and after restoration on the soil moisture inversion effect, European Space Agency Climate Change Initiative (ESA-CCI) and ERA5 soil moisture products were introduced in this paper for examination. The ESA-CCI soil moisture product is one of the important products initiated by the ESA Climate Change Association for the monitoring of feedback effects with climate change and represents a combined product of soil moisture based on the retrieval of three active and seven passive remote sensing probes on board the satellite. Among them, the active microwave remote sensing dataset is based on the C-band scatterometer on METOP-A satellite and the scatterometer SCAT observations on ERS-1 and ERS-2 to obtain soil moisture using the algorithm proposed by Wanger et al. [28]. The passive microwave dataset is based on the terrestrial parameter retrieval model algorithm proposed by Owe [12] and uses data observed by four instruments, the microwave imaging instrument TMI on board the TRMM satellite, the microwave radiometer SMMR on board the Nimbus, the channel-specific microwave imaging instrument SSM/I of the DMSP project, and the AMSR-E on board the Aqua satellite, to retrieve soil moisture. The dataset was started in November 1978 and has been continuously updated since then, with a spatial resolution of 0.25° × 0.25° and a daily temporal resolution. The ESA-CCI soil moisture version v06.1 was used in the study.
ERA5 is the fifth global reanalysis data set newly released by the European Centre for Medium-Range Weather Forecasts (ECMWF) using the four-dimensional variational data assimilation method of the Integrated Forecast System (IFS) CY41R2 to generate more climate-relevant driving fields. The employed ERA5 data are the latest soil moisture reanalysis data of the ECMWF, with a spatial resolution of 0.1° × 0.1°, divided vertically into four layers (7, 28, 100, and 289 cm). The first layer of these soil moisture reanalysis data was used in this study.
To determine the accuracy of the inversion results, this paper further analyzed the synergistic relationship between the retrieval products and precipitation, where the considered precipitation product encompasses Tropical Rainfall Measuring Mission (TRMM) precipitation data, generated through near-real-time 3 h TRMM multisatellite precipitation analysis with a spatial resolution of 0.25° × 0.25°.
2.2. Microwave Retrieved Method of Soil Moisture: LPRM
In this paper, we use the standard LRPM approach. The LPRM is an algorithm for soil moisture retrieval considering a single-band dual-polarization channel in the C- or X-band, which comprises two components based on a radiative transfer model for land surface thermal radiation simulation and a mixed-media model for surface soil water content estimation. Low-frequency channels can better penetrate the atmosphere with little opacity, so the influence of the atmosphere can be neglected in the calculation process, and the radiative transfer equation can be further simplified into the τ-ω model [29]. The brightness temperature can be estimated with τ-ω model to determine the surface emissivity, and the surface emissivity can be related to the permittivity via the reflectivity model [30]. Finally, the soil moisture can be calculated with the hybrid model [6]. The technical details of the LRPM method can be found in the literature [12].
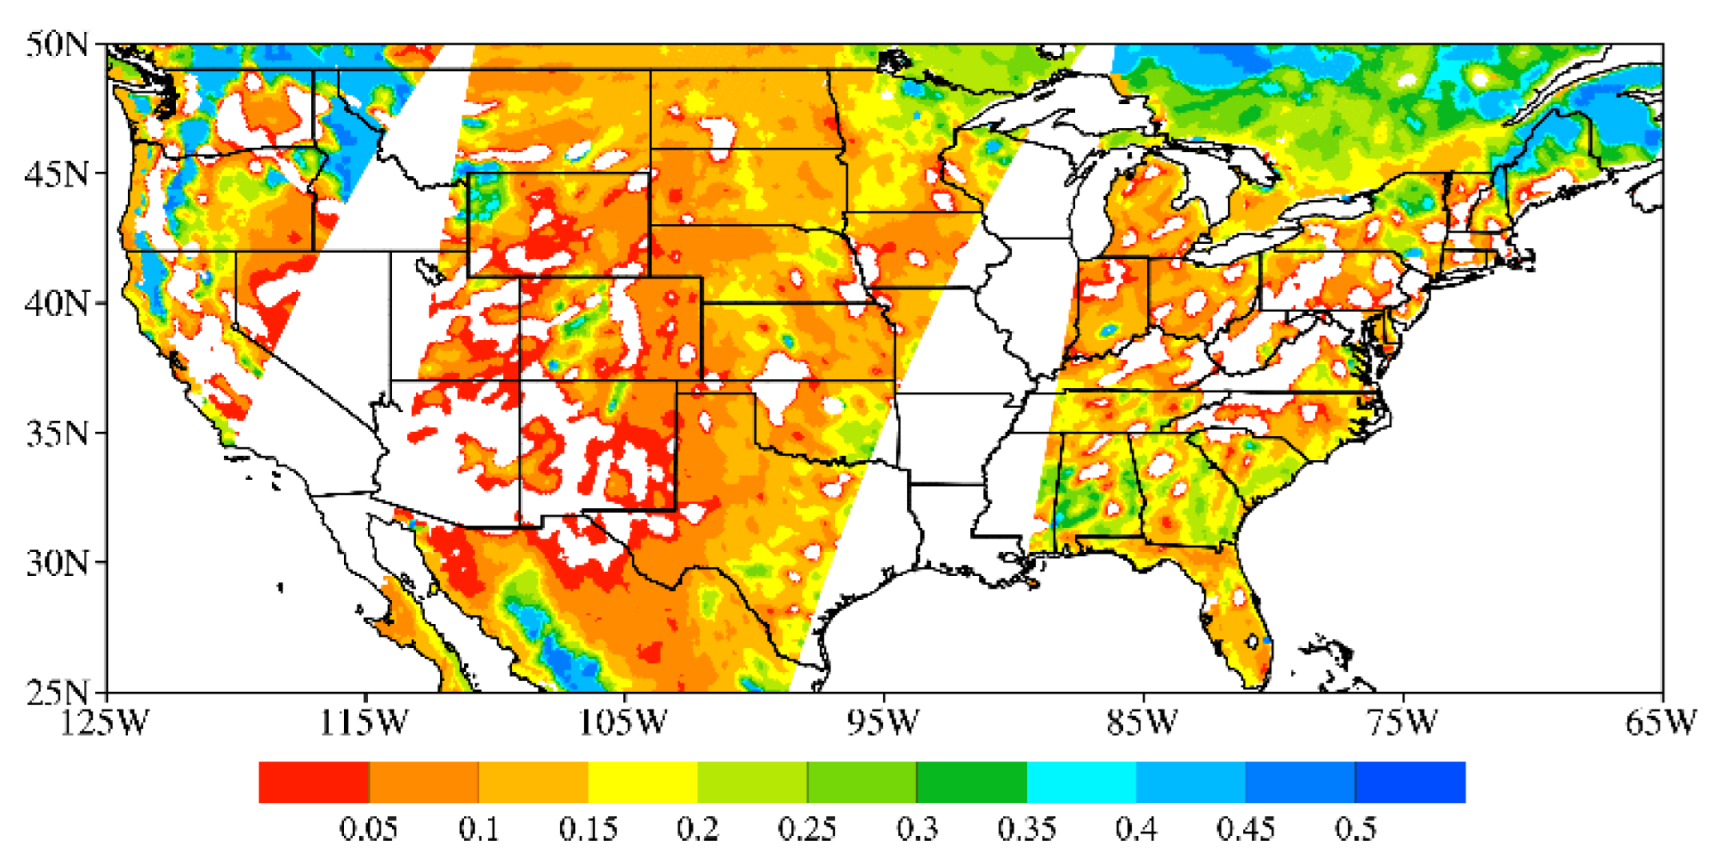
First, an attempt was made to directly retrieve the soil moisture in the United States using the 6 GHz brightness temperature on 18 June 2016. As shown in Figure 1, there remained a large number of blank areas in the retrieval results except for areas not covered by the satellite orbit, which indicates that the corresponding soil moisture cannot be obtained via retrieval in many metropolitan areas of the United States, which is especially obvious in the western part of the United States. Considering that the United States is the region where the 6 GHz brightness temperature is the most seriously contaminated by RFI [27] and the observed blank areas are mainly concentrated in large cities, it is determined that RFI contamination could lead to nonconvergence of soil moisture retrieval iterations, and the study of RFI identification and restoration is thus especially important for soil moisture retrieval in the C-band.
2.3. RFI Detection Method: NPCA
To better retrieve soil moisture, it is necessary to prevent RFI pollution of brightness temperature data, so the RFI pollution area should be first identified. RFI signals can cause an anomalous increase in the brightness temperature in low-frequency channels, which can reduce the correlation between the common frequency channel and other channels. The NPCA method uses the difference in brightness temperature between low- and high-frequency channels to construct an interference coefficient matrix [24] and can effectively identify RFI signals via PCA decomposition of the interference coefficient matrix. The specific calculation steps of the NPCA method are as follows:
The PCA method is used to identify RFI interference signals in 6 GHz horizontal polarization channels. The data matrix used for identification can be defined as follows:
where N denotes the total number of scanning points in the area used for identification, TB denotes the observed brightness temperature, the subscripts H and V denote horizontal and vertical polarization, respectively, and the numbers denote the frequency.
Then, the corresponding covariance matrix can be constructed, where i denotes the ith principal component, denotes the ith principal component mode, and denotes the contribution of the ith principal component mode to the total variance. Written in matrix form, the following can be obtained:
By projecting the data matrix A for identification purposes into the standard orthogonal space constructed by a set of basis vectors , the principal component coefficients can be obtained as follows:
where denotes the coefficients of the ith principal component mode. A large value of the first principal component coefficient indicates the presence of RFI signals.
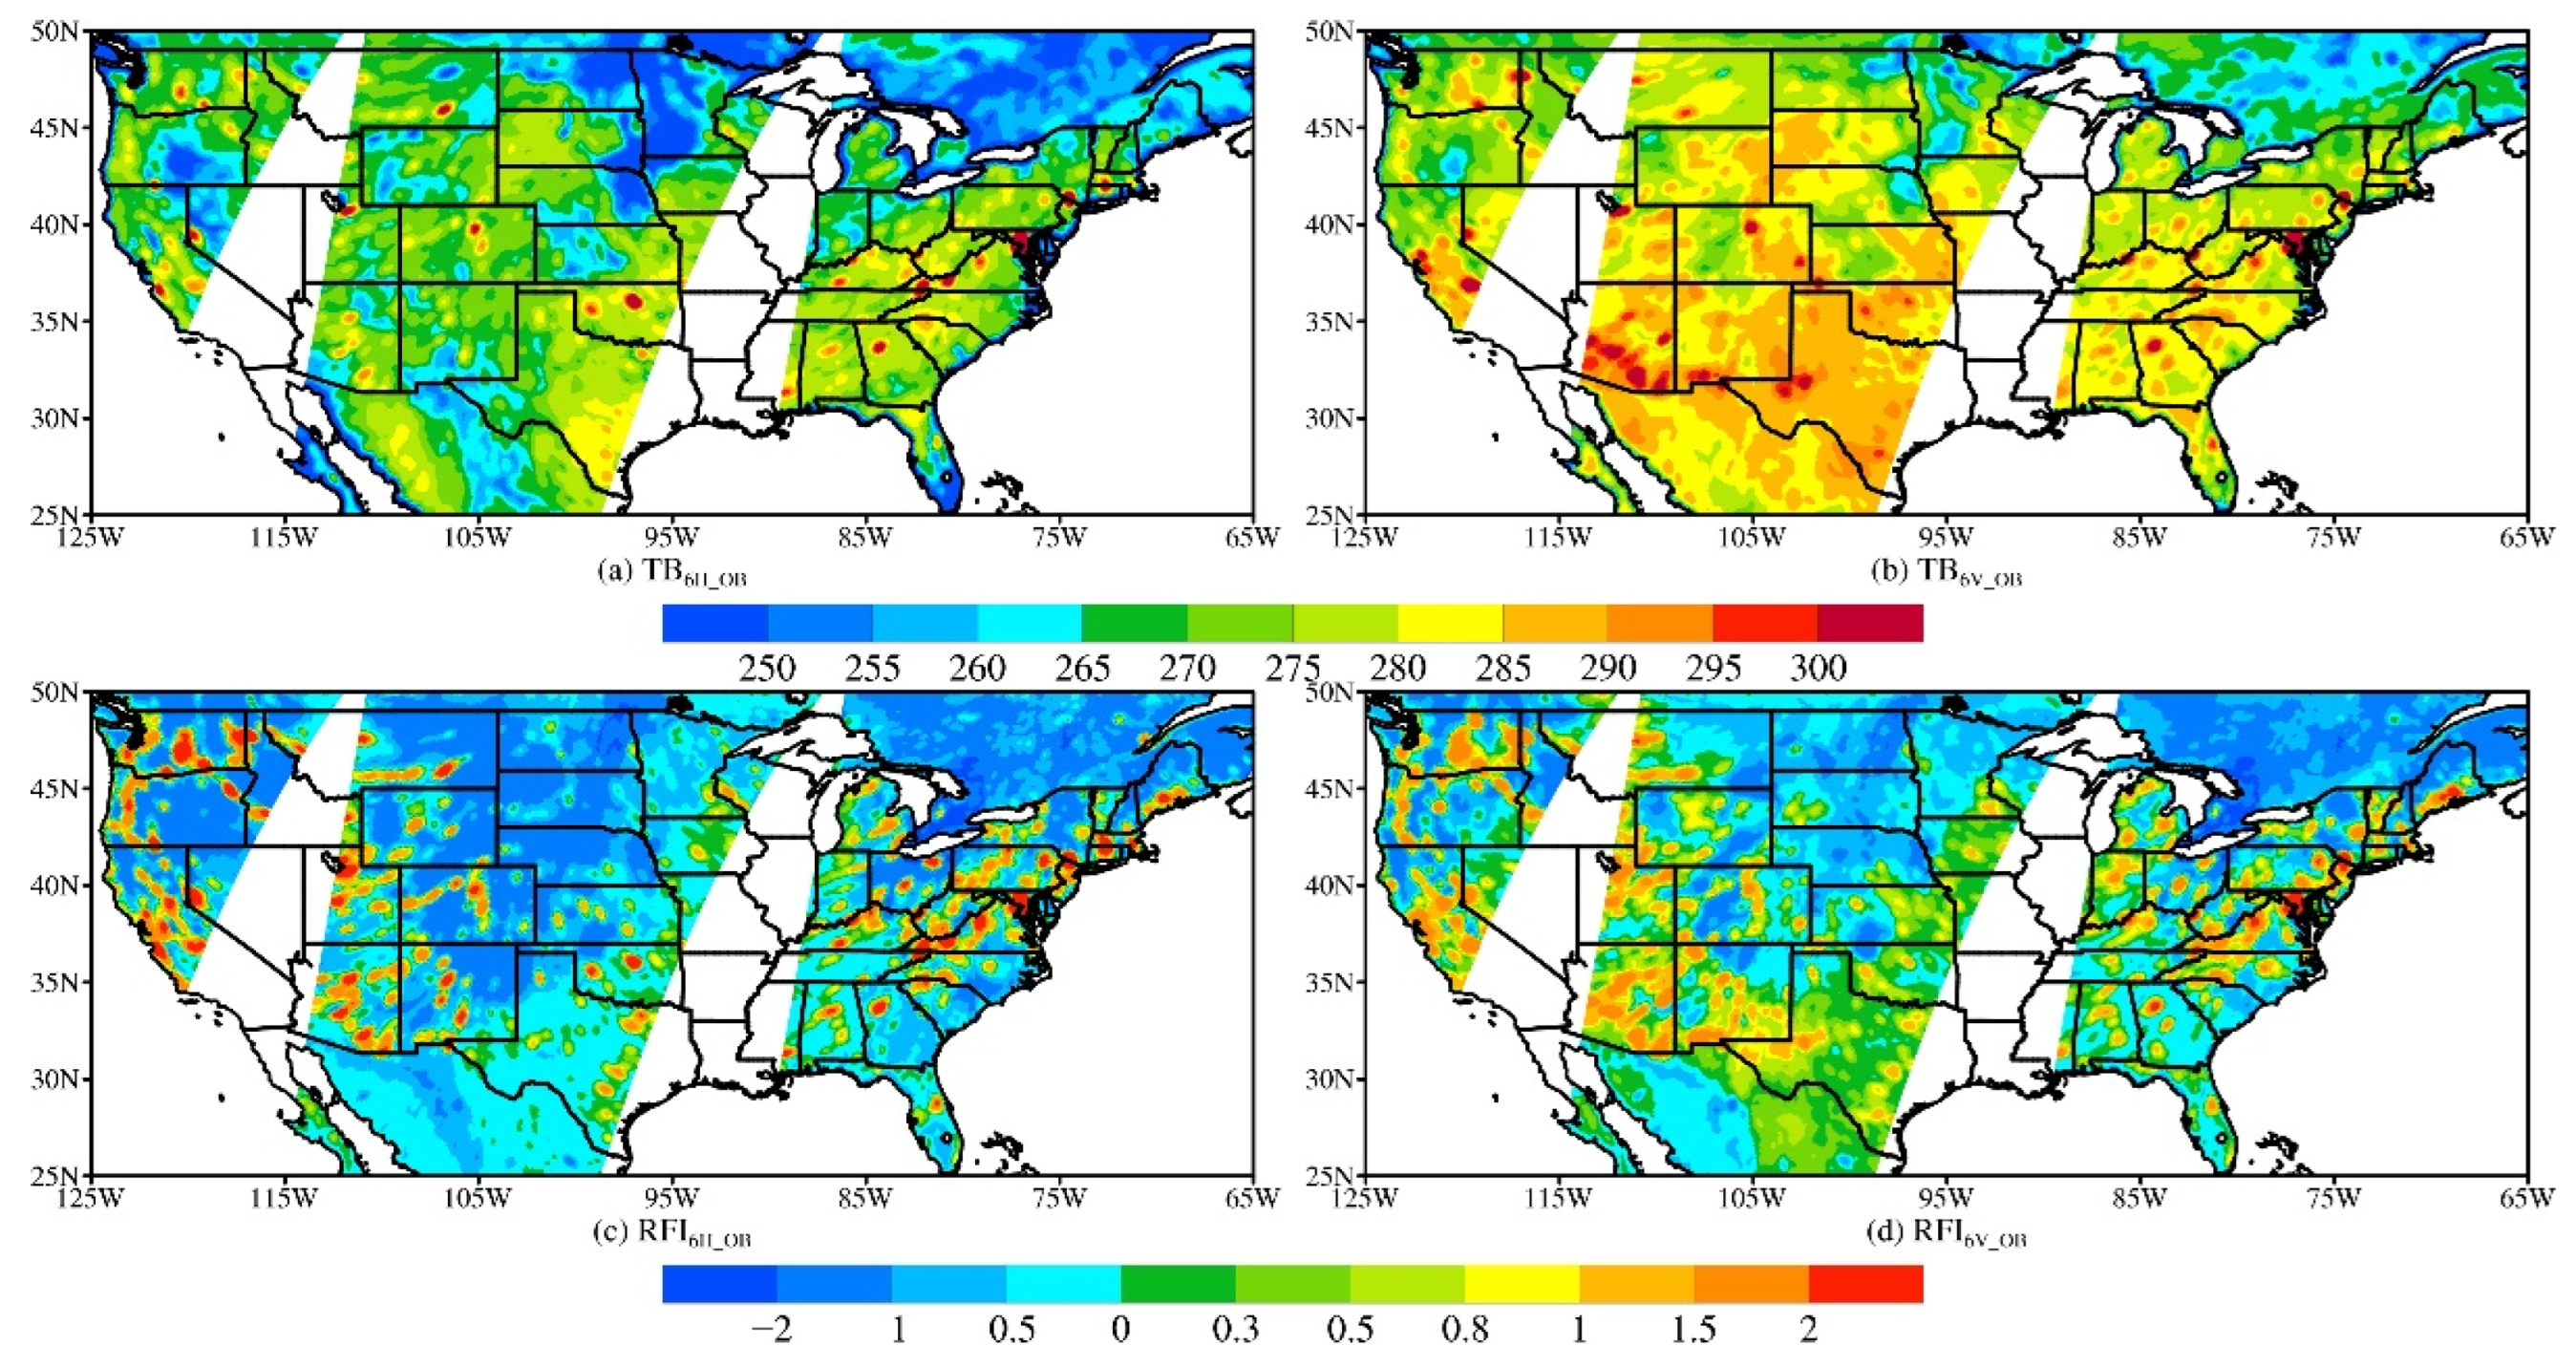
Descending orbit data of the AMSR-2 for the United States region on 18 June 2016 were used as an example to study RFI on a certain day. Figure 2a,b shows the spatial distribution of the brightness temperature along the two polarization directions on this day. The brightness temperature along the vertical polarization direction is higher than that along the horizontal polarization direction, and there are anomalous brightness temperature high-value areas distributed in both channels. These anomalous brightness temperature high-value areas exhibit a directional, narrow-band, and isolated distribution over the continuous and smooth brightness temperature distribution characteristics of other regions. The spatial distribution of RFI signals in the 6 GHz channel can be identified with the above-mentioned NPCA method, as shown in Figure 2c,d, where high values indicate areas with a high probability of RFI occurrence. A threshold value higher than 0.5 K is usually used to assess RFI signals [29]. Based on the RFI spatial distribution, it could be observed that the above-mentioned areas with abnormally high brightness temperatures are similar to those with identified RFI signals, mainly attributable to the RFI strengthening effect on surface microwave radiation detected by low-frequency channels, resulting in an increase in brightness temperature anomalies. RFI signals are evident in the majority of large cities in the United States, with the most serious radio interference in the western coast and cities along the U.S.–Mexico border. The RFI signals in the different polarization channels exhibit unique distribution characteristics, with the horizontally polarized channels characterized by isolated large-value areas and the vertically polarized channels characterized by RFI signals near anomalies along all directions.
2.4. RFI Restoration Method: Iterative PCA Method
The purpose of RFI identification is to better restore brightness temperature data polluted by RFI, and the iterative PCA restoration method is therefore introduced below. The PCA method can effectively separate different information scales, while RFI can lead to an abnormal rise in single low-frequency channel brightness temperature points. This small-scale anomalous feature cannot affect the first few PCA modes with large-scale information as their main feature. Therefore, the first few PCA modes can be employed to restore anomalous observation points, and restored data with main features can be obtained.
First, the data matrix for PCA can be established. Assuming that there are P RFI-contaminated points, observation points contaminated by RFI can be excluded in circular areas with a radius of 350 km centered on these P points, and the remaining observation points can be recorded as N (N is the size of the repair matrix, a moving window is used to build the repair matrix, which means the N changes with the location of the target observation.), while the data of 9 channels can be selected for each observation point. The data matrix for restoration can be expressed as :
The variables are the same as those of Equation (1), where is the 6 GHz horizontal polarization channel of observation point p, and can be set to strengthen the abnormal characteristics between the data and surrounding data. PCA decomposition of matrix A can be performed to obtain the following:
where is generally referred to as the modal vector, is the coefficient vector, and k denotes the kth mode. With the use of the first mode for reconstruction, we can obtain the following:
Although the first mode does not contain anomalous information, a value of 0 can cause first-mode information to be dispersed across other modes. Therefore, it is necessary to gradually improve the average feature represented by the first mode through iteration. Therefore, after obtaining , this value can be substituted into the data matrix in Equation (4) to establish a new data matrix A1, and matrix A1 can again be decomposed via PCA, as expressed in Equation (4). Finally, the matrix can be restored to obtain , and the above process is repeated. Because of the uniqueness of the true value, the first mode of PCA can gradually attain equilibrium in the iterative process. For , it can be considered that the average features of the first mode have been completely retained. Then, similar to the extraction of first-mode information, information on the other modes can be extracted in a stepwise manner until all modal information is included. Finally, reconstructed P-light temperature data can be obtained.
The range of 350 km is empirically determined. During the development of the method, sensitivity tests were conducted using observations from AMSR-2 channel 9, which is not subject to RFI interference, and the test results showed that a restoration radius of 350 km gives optimal restoration results, so the restoration radius was empirically determined to be 350 km.
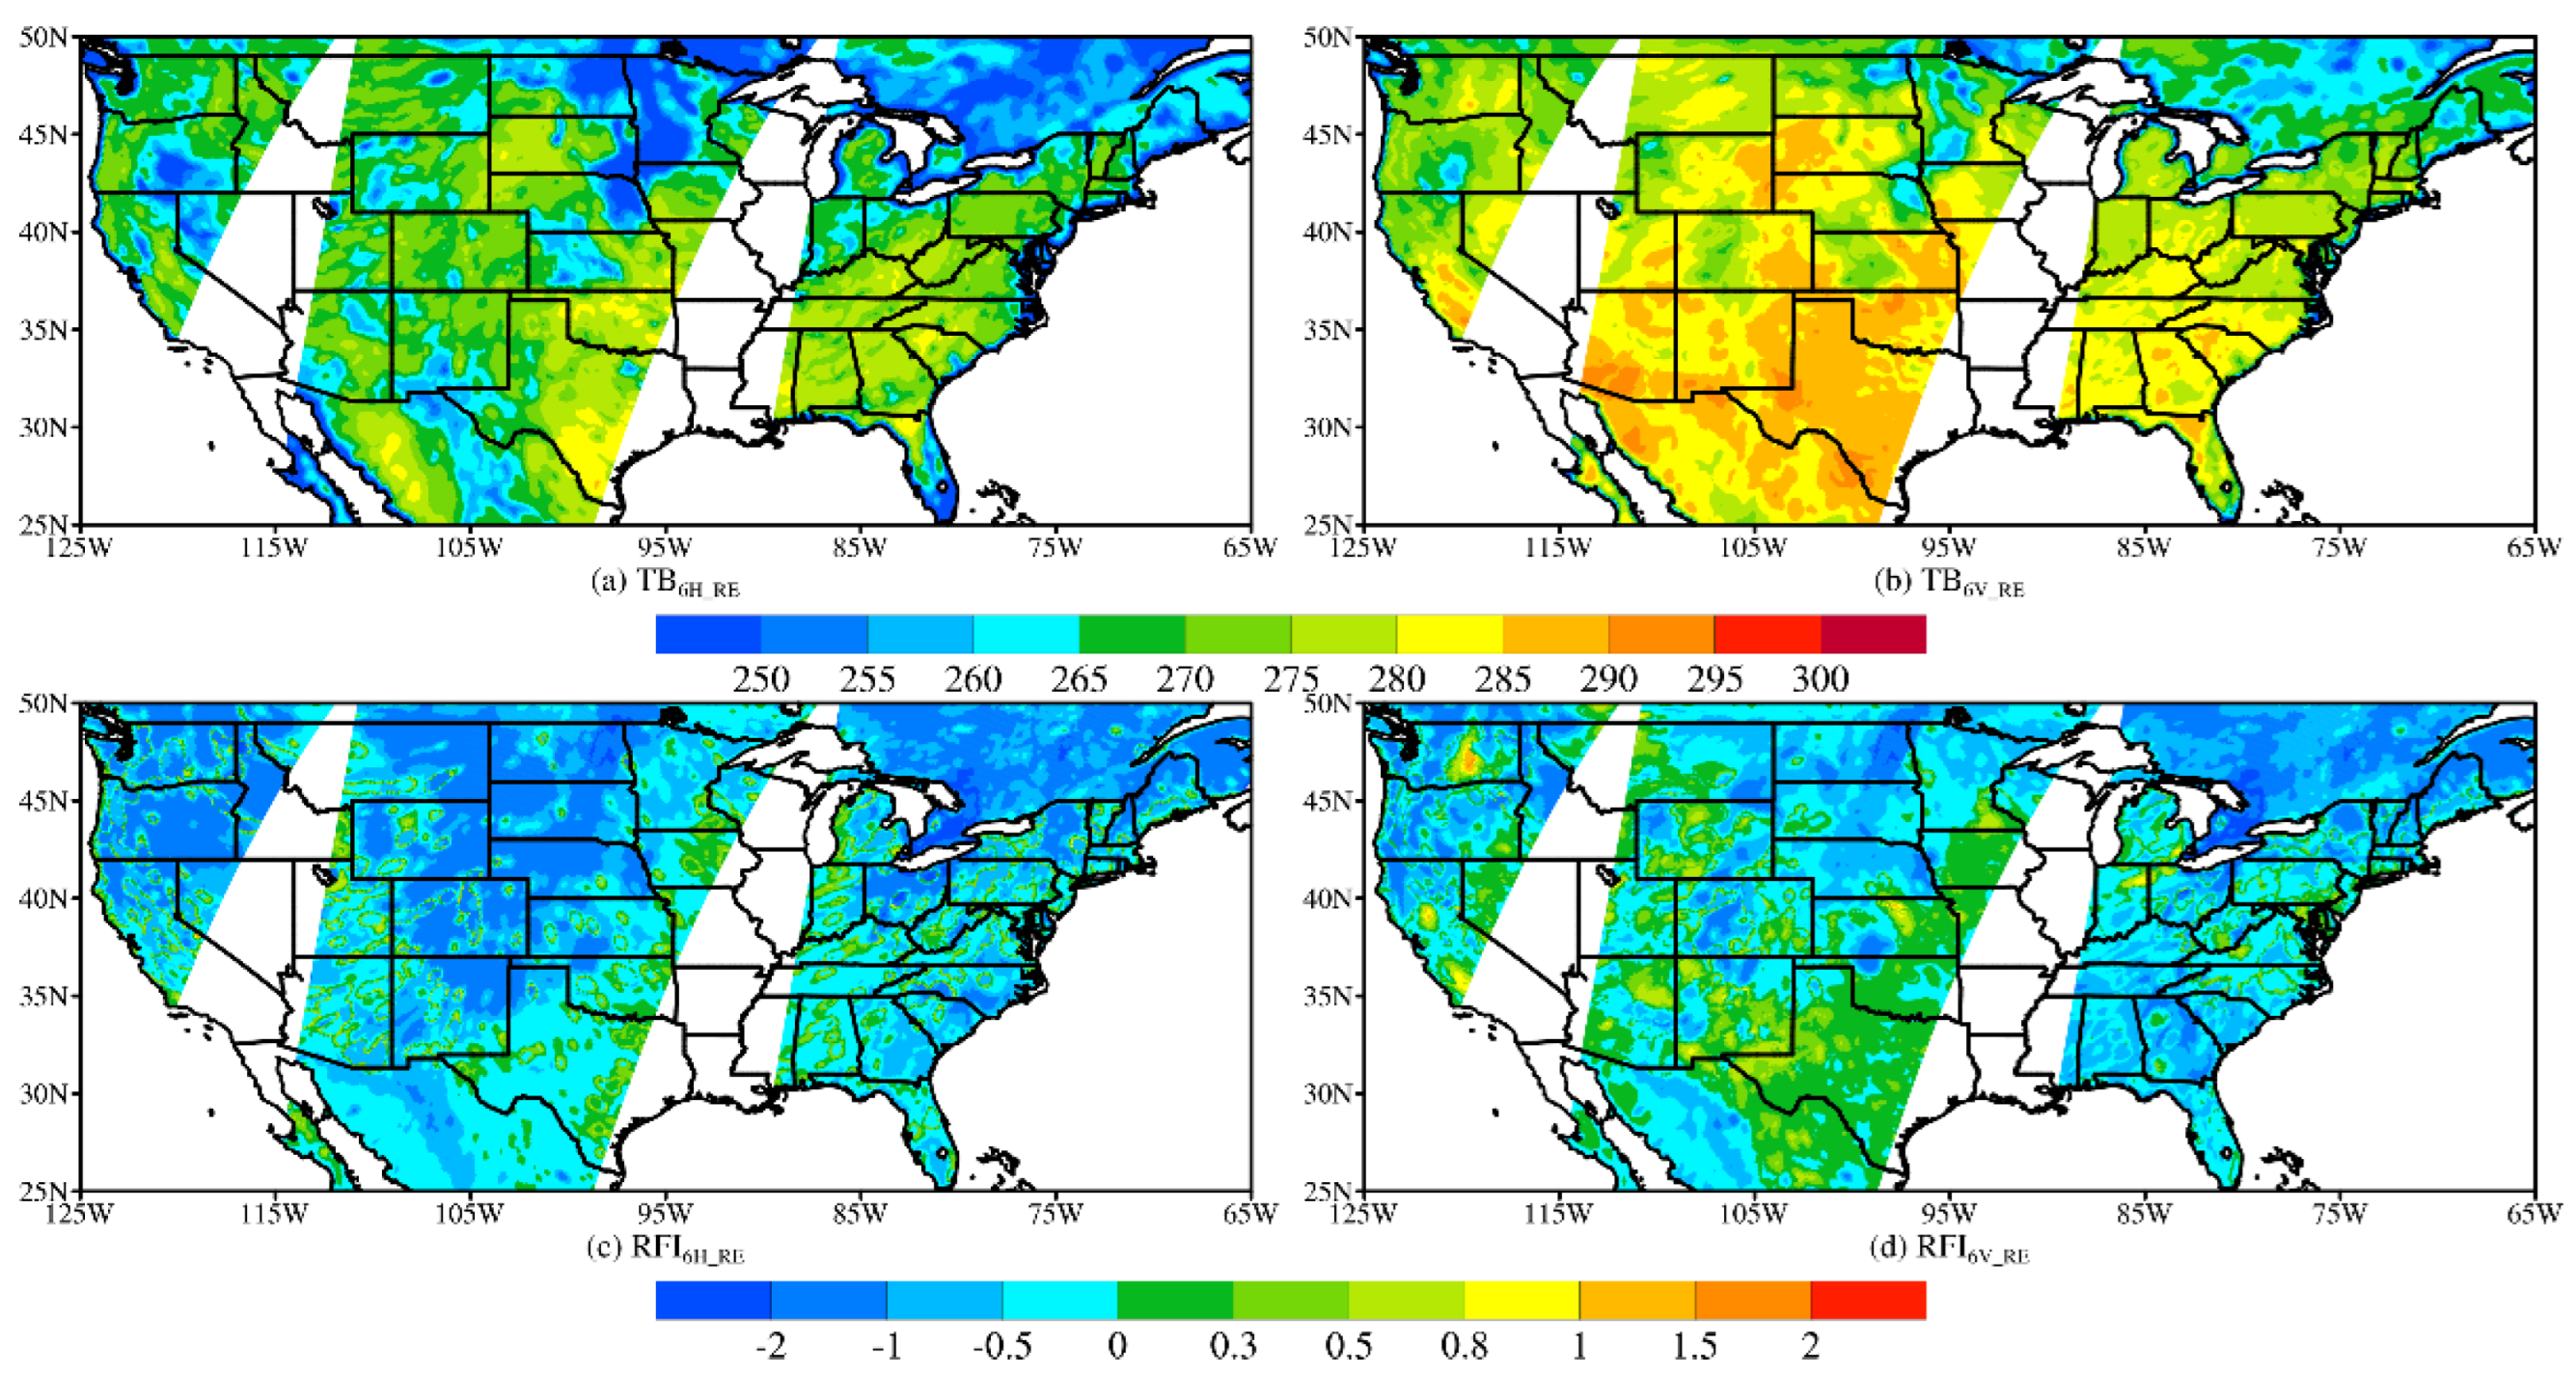
The iterative PCA method was used to restore the RFI-contaminated areas identified in Figure 2c,d. The spatial distribution of the brightness temperature after restoration and RFI distribution results determined with the NPCA method are shown in Figure 3. Figure 3a,b shows the spatial distribution of the brightness temperature after restoration under 6 GHz horizontal and vertical polarization, respectively. Compared to Figure 2a,b, the discontinuously distributed abnormal maximum points in the observation data were replaced by reasonable data obtained via iteration. The brightness temperature spatial distribution after restoration in the 6 GHz channels is more continuous and smoother, which better agrees with the characteristics of surface emission radiation. To more scientifically verify the effect of the restoration results, the NPCA method was used to identify the RFI phenomenon in the brightness temperature after restoration, and the results are shown in Figure 3c,d. The figure reveals that no RFI signals occur in the brightness temperature data after restoration in the 6 GHz horizontal polarization channel, and there are no clear RFI signals in the brightness temperature data of the vertical polarization channel. The restoration effect in the vertical polarization channel via the iterative PCA method is better than that in the horizontal polarization channel. Certain RFI signals can still be identified in areas of Central America, as shown in Figure 3d, but the signal intensity is lower than that before restoration.
3. Results
3.1. Comparison of the Retrieved Soil Moisture before and after Restoration
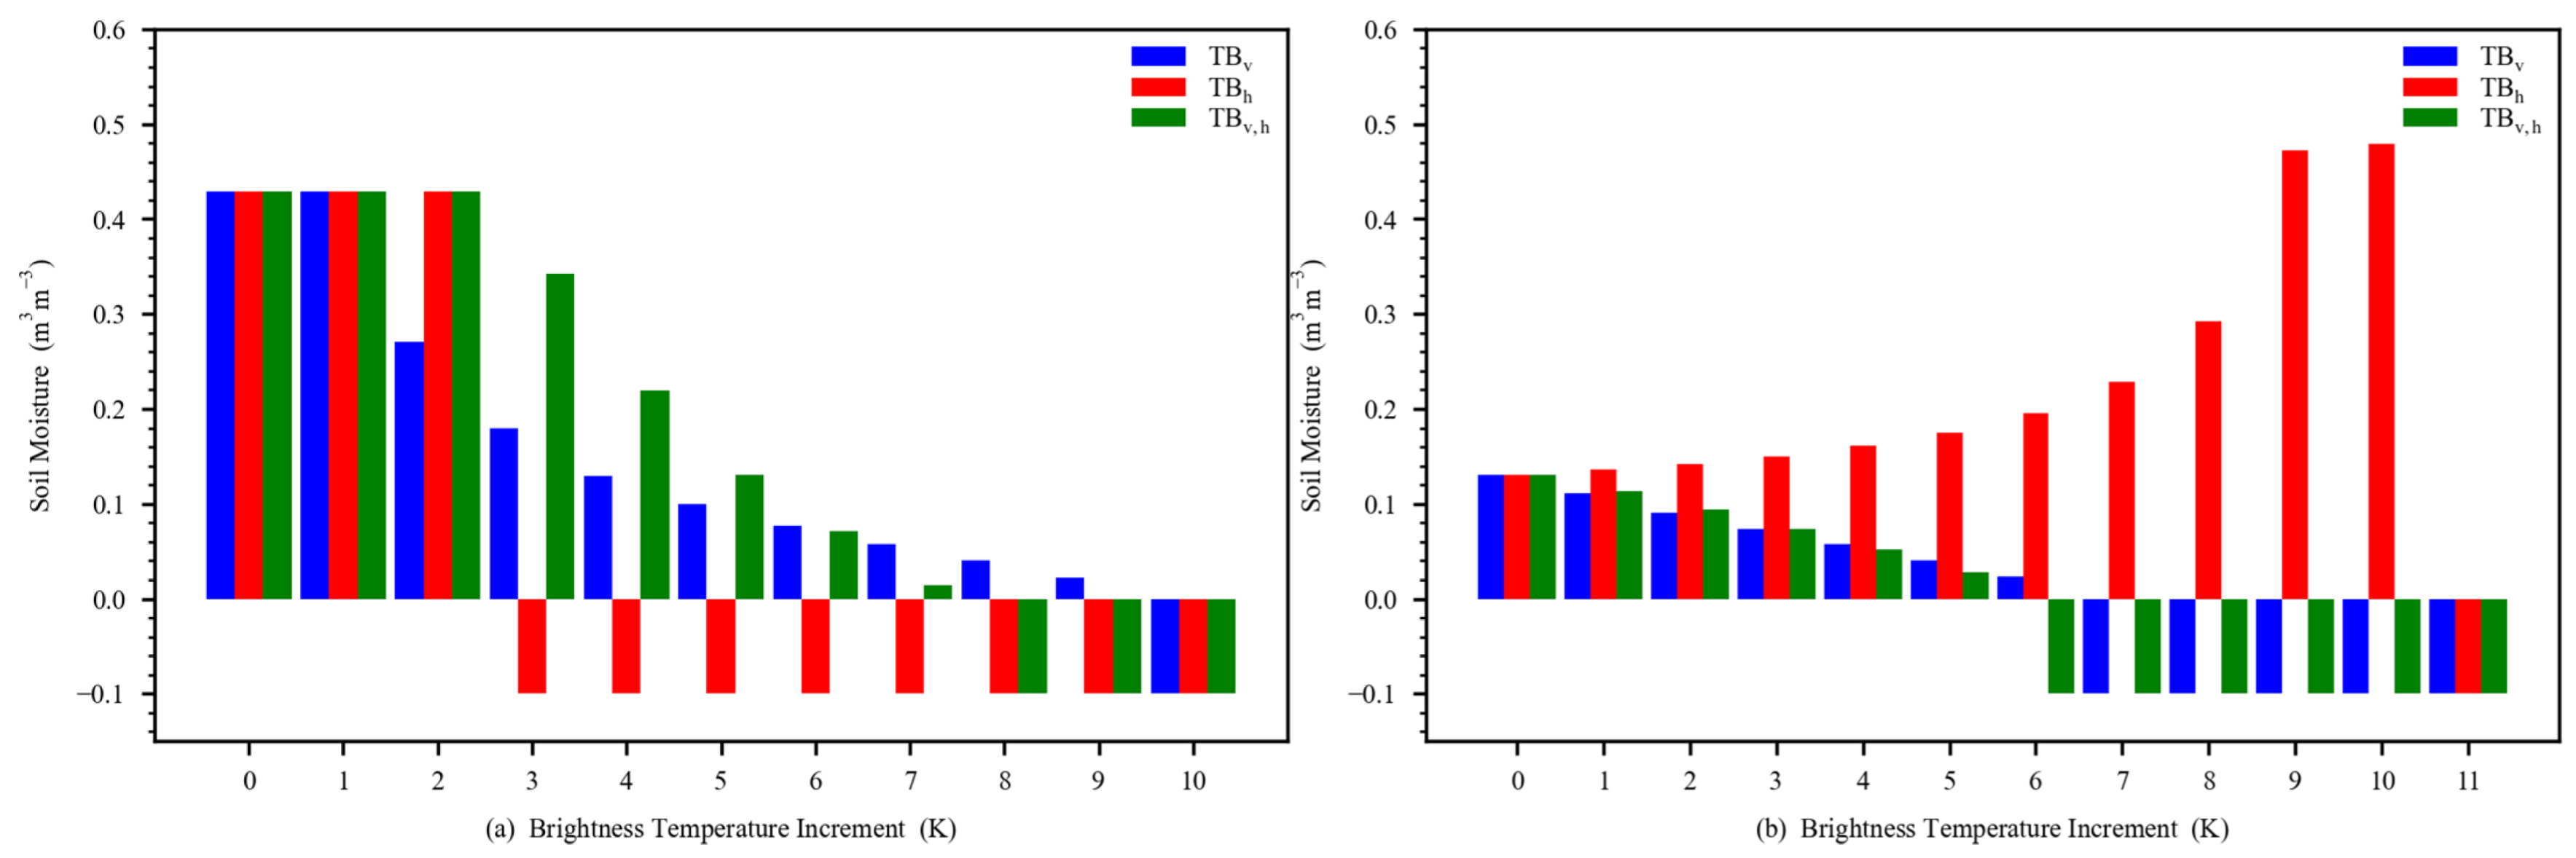
RFI increases the observed brightness temperature abnormally. In order to repro-duce the characteristics of the effect of increasing brightness temperature on soil moisture retrieval, a set of sensitivity tests is carried out to analyze the effect of RFI on the retrieval. Figure 4 shows the variation in the retrieved soil moisture with increasing brightness temperature. The blue bars represent only the increase of brightness temperature in the vertical-polarized channel, i.e., the case when only the vertical channel is disturbed by the RFI, the red bars represent the case when only the horizontal channel is disturbed, and the green bars represent the case when both the vertical-polarized and horizontal-polarized channels are disturbed. In order to increase the representativeness of the sensitivity test results, we also chose two cases, dry soil and wet soil, where the cutoff point for dry soil and wet soil is defined as the retrieved soil moisture of 0.2 m3 m−3. The retrieved results using data not interfered by RFI are 0.43 and 0.13 m3 m−3. Although the retrieved results cannot represent the true value of soil moisture, from the comparison results of these retrieved results, we can demonstrate the influence characteristics of different channels on the retrieved results after being interfered by RFI, which has important reference value for the evaluation and research of error characteristics of retrieved results.
As shown in Figure 4a, for the wet soil case, when the vertical channel brightness temperature gradually increases, the retrieved soil moisture then gradually decreases, and when the brightness temperature increases by 10 K, it causes the retrieved process to not converge. When the brightness temperature of both vertical and horizontal channels increases, the change is similar to the brightness temperature increase in the vertical channel only, except that it causes the retrieved process to not converge more quickly. In contrast, when only the horizontal channel brightness temperature increases, the situation is reversed and the soil moisture increases rapidly and causes the retrieved process not to converge more quickly. For dry soils, the influence of the horizontal-polarized channel is more obvious, and only when the horizontal channel is disturbed by RFI, the retrieved soil moisture gradually increases with the increase in the brightness temperature, and only when the brightness temperature increment reaches 11 K, the retrieval does not converge. The characteristics of the effect of increasing the brightness temperature of the vertical channel on dry and moist soil are also basically the same, except that the nonconvergence occurs when the brightness temperature of the vertical channel increases by about 6 K. The comparison shows that the brightness temperature of the vertical-polarized channel has a stronger effect on the retrieval results than that of the horizontal-polarized channel.
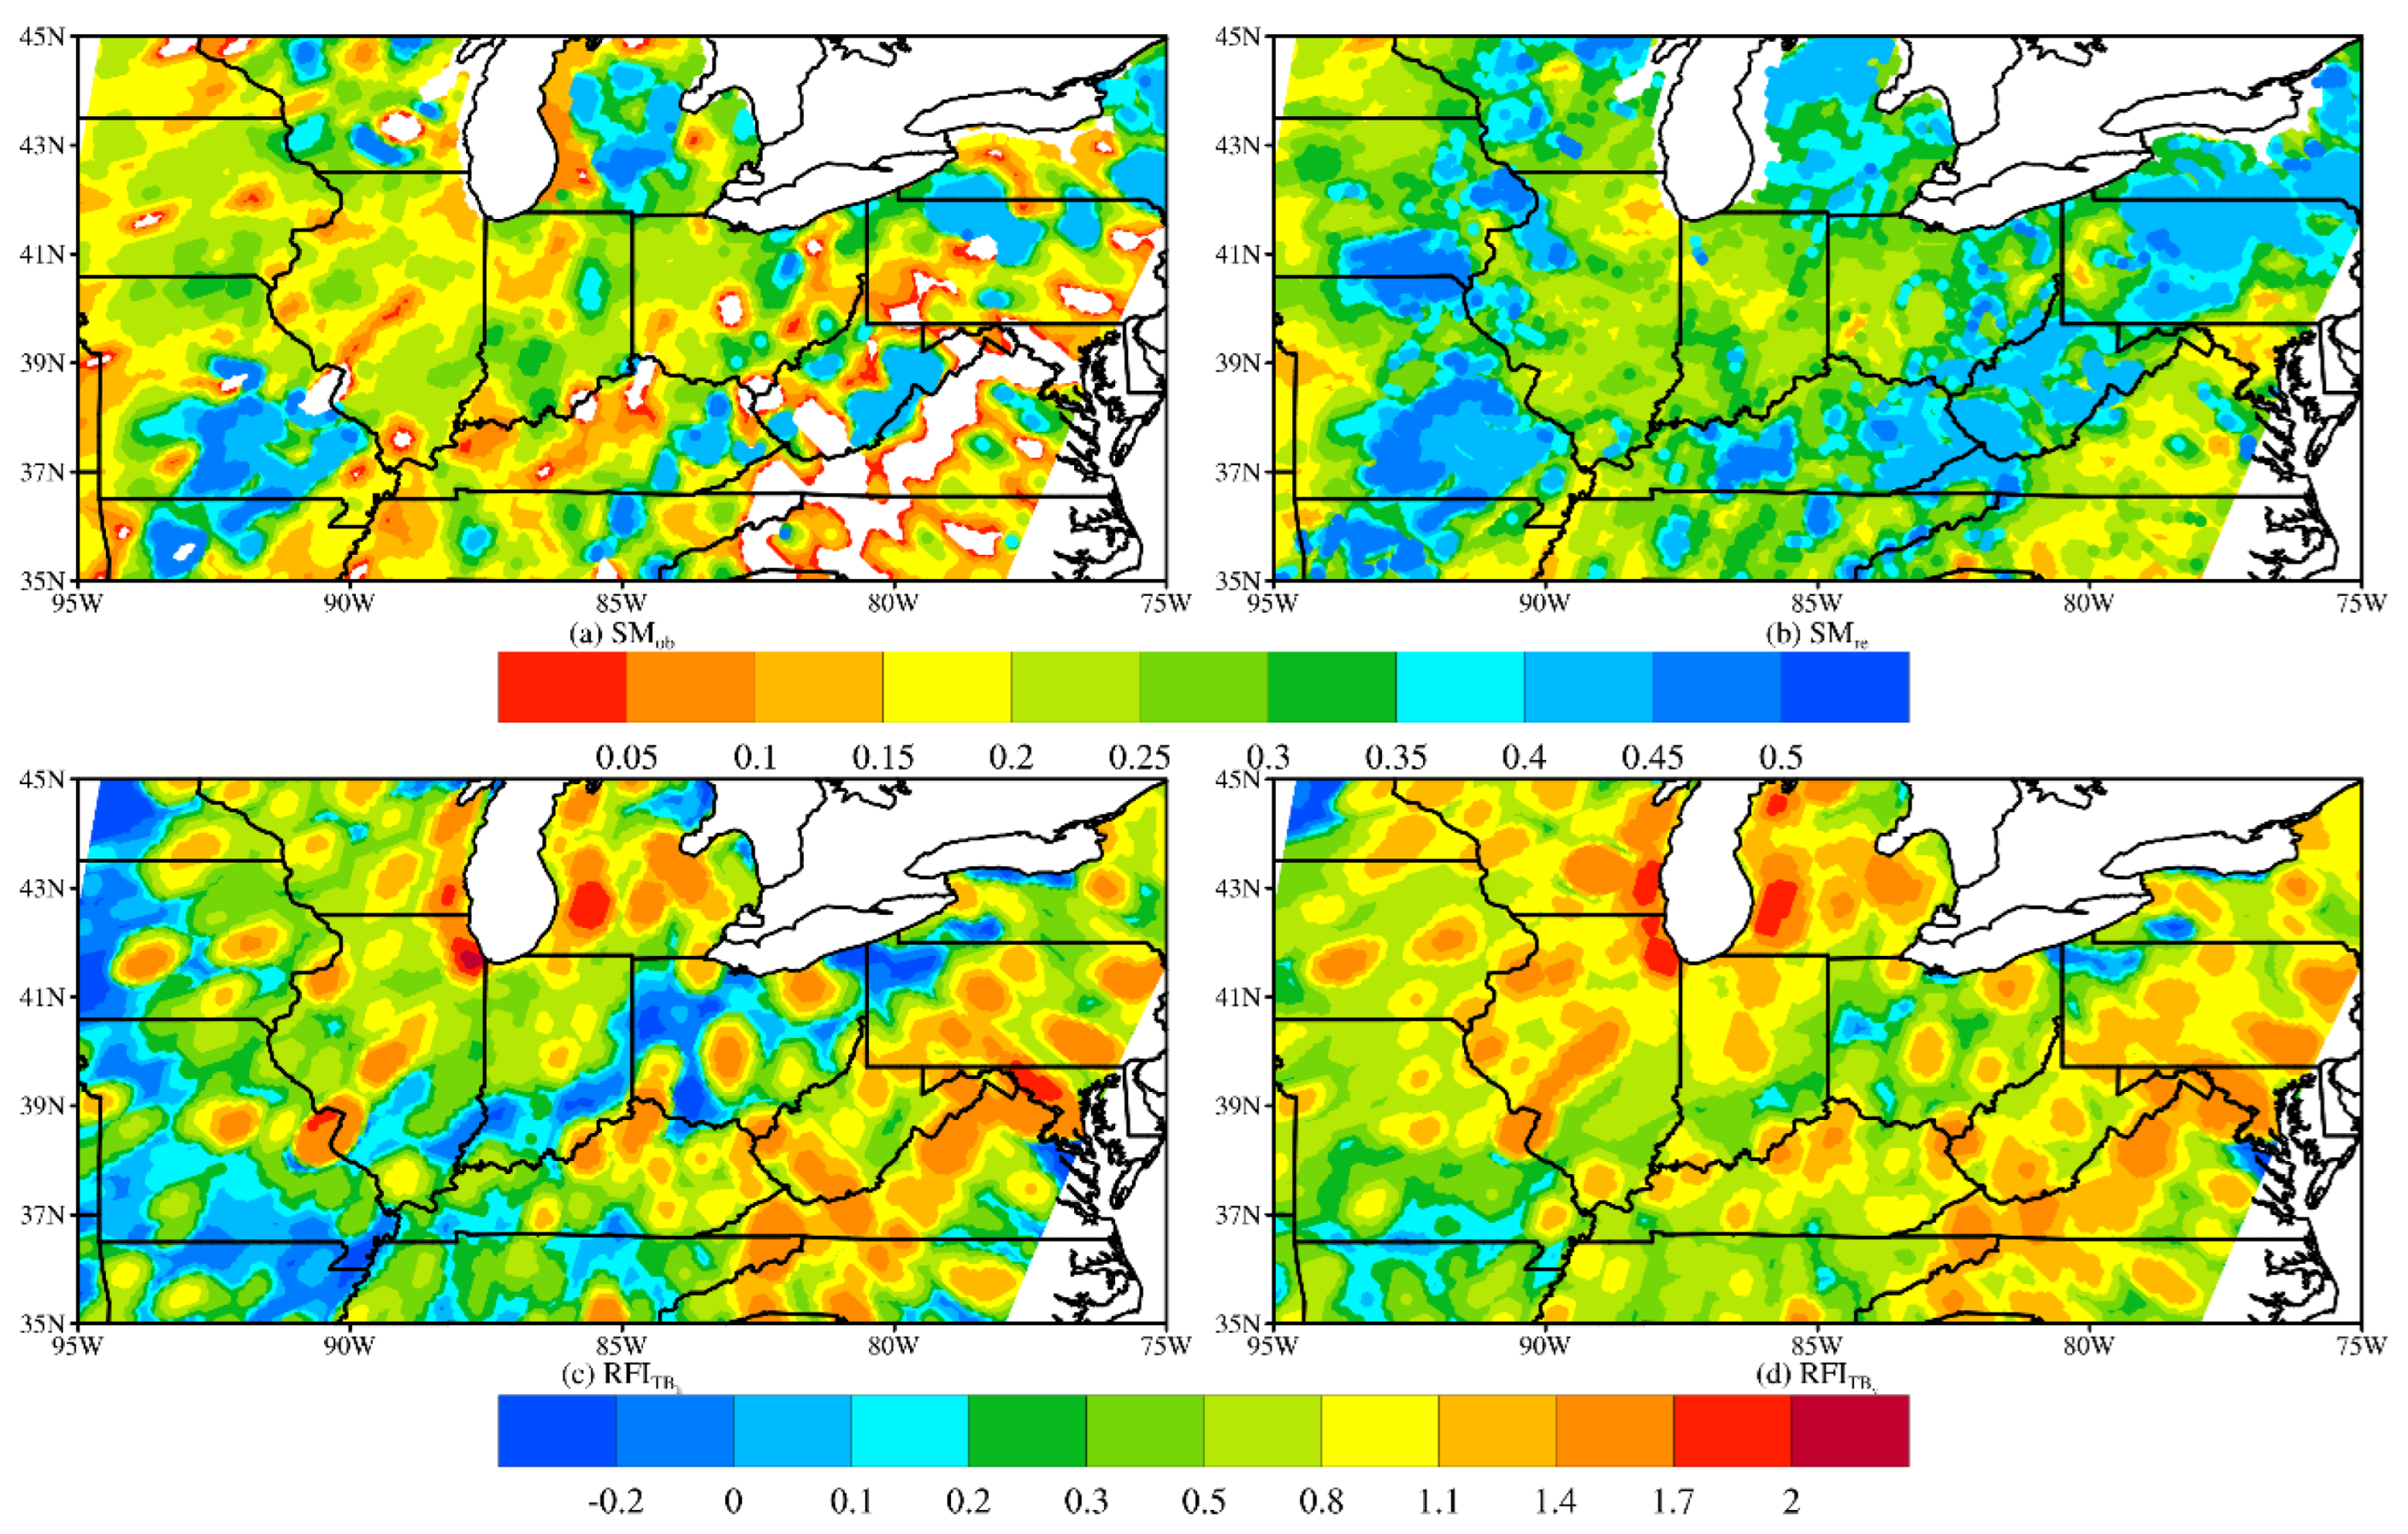
In summary, the characteristics of RFI effects on soil moisture can be divided into three types: (1) Severe RFI contamination in either horizontal for vertical channels will lead to nonconvergence of the soil moisture retrieval process and inability to obtain retrieved results. (2) When only the brightness temperature of the vertical channel is weakly affected by the RFI, and when brightness temperatures of both horizontal and vertical channels are contaminated at the same time, it will lead to abnormal low retrieved soil moistures. (3) While RFI influence on the horizontal channel leads to high soil moisture in the retrieval. Figure 5 shows the spatial distribution of retrieved soil moisture using the brightness temperature before and after remediation, and the RFI spatial distribution of the horizontal and vertical channels in the region is also shown. The comparison results can well reproduce the above three cases: Figure 5a represents the direct retrieval of soil moisture using the brightness temperature of the 6 GHz channel, and the retrieved soil moisture is discontinuous and has many missing values. For example, there is a large area of missing values in western Virginia, and the soil moisture values around the missing values are small (less than 0.05 m3 m−3). A comparison with Figure 5c,d shows that this area is heavily contaminated with RFI and is also a Type I case of the RFI impact. The area of missing soil moisture measurements caused by this effect is often an oval area and often corresponds to a Type II case of RFI influence around this area. There are parts of southern Michigan where the horizontal channel is more significantly contaminated by RFI than the vertical channel, and the retrieved soil moisture in this area tends to be high, which is more in line with the third type of RFI impact profile. The retrieved results of soil moisture based on the restored brightness temperature are presented in Figure 5b. The retrieved results are basically free of the missing measurements in Figure 5a, and the retrieved results are more continuous in spatial distribution. The restored retrieved results well reproduce the two soil moisture banded large-value areas on both sides of the study area, and low values in the central and south-eastern parts of the area also show good spatial continuity. In the following section, the effect of brightness temperature on soil moisture retrieved by remediating RFI contamination will be quantified in terms of the missing rate, defined as the number of observations that failed to invert soil moisture on daily descending orbits passing over land in the United States divided by the total number of observations that performed the retrieval.
The LPRM does not fully consider the influence of subsurface factors, such as snow and ice, in the retrieval process [31], so soil moisture in the northern United States due to snow cannot be estimated in winter. Table 1 also indicates that the missing rate of retrieval is 3–5 times higher in winter than that in the other seasons, so the retrieval process in the other seasons is mainly studied below. Table 1 reveals that the missing rate of soil moisture retrieval from 6 GHz brightness temperature data is the lowest in autumn, but the missing rate can still reach as high as 0.164, which is 0.06–0.09 higher than the missing rate of soil moisture retrieval from 10 GHz brightness temperature data. In particular, due to the occurrence of RFI signals, the soil moisture cannot be retrieved from at least 6%–9% of AMSR-2 6 GHz brightness temperature data. The missing rate of soil moisture retrieval from restored brightness temperature data is 0.05–0.07 lower than that from 6 GHz brightness temperature data, indicating that the iterative PCA method facilitates the use of at least 80% of RFI-contaminated brightness temperature data in soil moisture retrieval with the LPRM.
Figure 6 shows the daily missing rate of soil moisture retrieval for the different channels from March to November 2016, which is similar to the missing rate in the different seasons, as listed in Table 1. Due to the effect of snow on the ground attributed to the extremely cold air in early spring, the missing rate of soil moisture retrieval from the different channels is higher than 0.3. After April, the missing rate of soil moisture retrieval from the 10 GHz brightness temperature gradually decreases and is stably maintained at approximately 0.15, while the missing rate of soil moisture retrieval from the 6 GHz brightness temperature reaches approximately 0.2, which is significantly higher than that in the 10 GHz channel. In contrast, the missing rate of soil moisture retrieval from the restored brightness temperature varies between 0.1 and 0.15. The missing rate of soil moisture retrieval from the restored brightness temperature is similar to that of soil moisture retrieval from the 10 GHz brightness temperature. Moreover, the trend of the missing rate in March is almost the same as that for the 10 GHz channel but is significantly lower than that for the 10 GHz channel from April to September, which is consistent with the conclusion that the soil moisture can hardly be retrieved from 10 GHz waves during the vegetation-rich season, and the missing rate is slightly higher than that for the 10 GHz channel after mid-October. In autumn, the vegetation is not as luxuriant as that in spring and summer, and the 10 GHz brightness temperature can be used to iteratively retrieve the soil moisture in areas where the vegetation is luxuriant in the other seasons, while a part of the 6 GHz brightness temperature remains affected by RFI at this time, resulting in a slightly higher missing rate. This verifies that the restored 6 GHz brightness temperature via the iterative PCA method exhibits suitable application prospects in soil moisture retrieval, which can significantly reduce the effect of RFI contamination, and the retrieval effect is higher than that based on the 10 GHz brightness temperature, which is not contaminated by RFI in most months. The iterative PCA method is demonstrated to achieve a suitable stability in a one-year long-term test, but the effect is influenced by the threshold of RFI identification. However, the threshold of RFI identification can be adjusted in different seasons to obtain better effects.
3.2. Analysis of Soil Moisture Characteristics
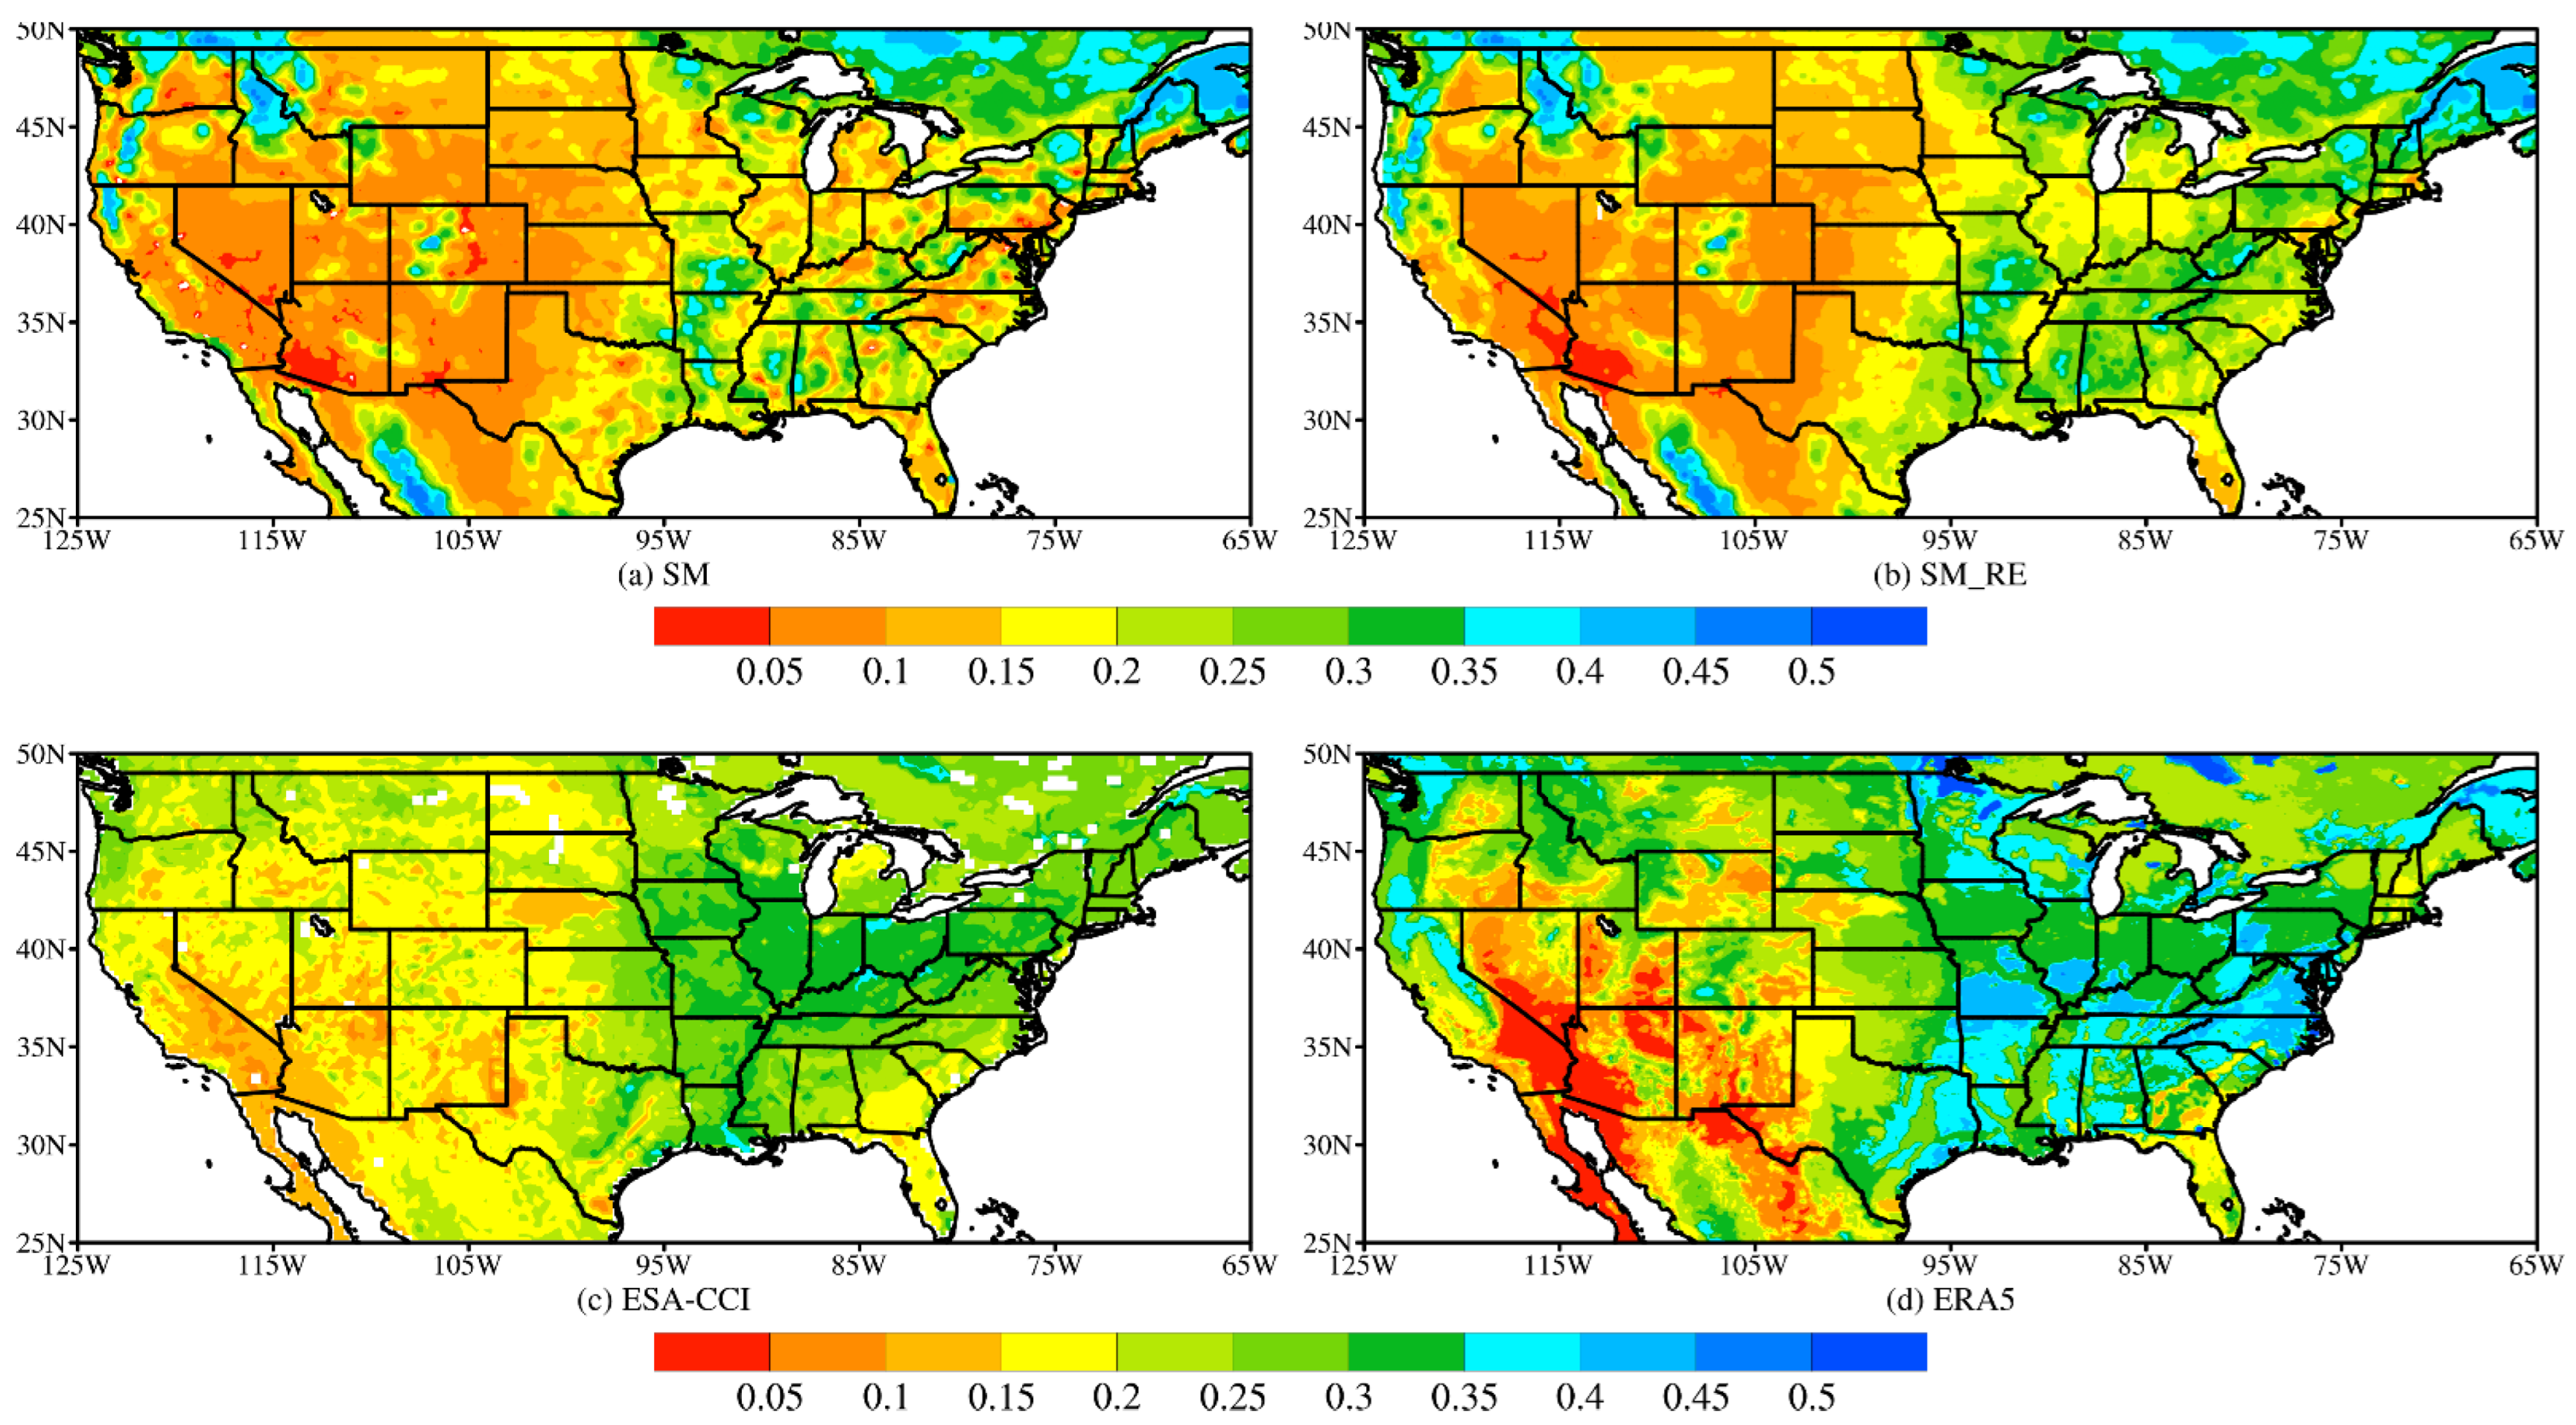
In order to further verify the improvement effect of the restoration method on the spatial structure of retrieved results, we also selected the ERA5 reanalysis data and multi-source fusion product ESA-CCI, two kinds of data with good spatial continuity, for further verification. Figure 7 shows the spatial distribution of the average soil moisture at 6 GHz before and after restoration from March to November 2016. The average retrieved soil moisture from 6 GHz data exhibits an extremely discontinuous distribution in RFI-contaminated areas, indicating anomalously dry conditions. This mainly occurs because the long-term series of soil moisture in the region under the influence of RFI contamination is discontinuous and therefore does not yield the correct long-term average soil moisture. The retrieved soil moisture from the brightness temperature mainly comprises the surface soil moisture with a high daily variation, and the MPDI value is low due to the RFI effect, which accordingly causes the retrieved soil moisture to be low, manifested as areas with abnormally low values. As shown in Figure 7b, which shows the spatial distribution of the retrieved average soil moisture from 6 GHz data after restoration, the soil moisture spatial distribution is more continuous, smoother, and more credible in the above-mentioned long-term RFI-affected areas, especially in the eastern plains of the United States. Compared to the reanalysis data depicted in Figure 7, the spatial distribution of the retrieved soil moisture from the restored 6 GHz data is also more consistent in general, and soil moisture high-value areas are mainly located in the plains of the eastern and western regions of the United States.
The spatial distribution is closer to that of the ERA5 reanalysis data, mainly exhibiting a gradual increase in soil moisture from west to east, a gradual decrease in soil moisture from north to south in the western United States, and a gradual increase in soil moisture from north to south in the eastern United States. Compared to ESA-CCI data, soil moisture in the eastern United States exhibits the opposite spatial distribution pattern involving soil moisture decrease from north to south. In terms of specific soil moisture values, the ERA-based soil moisture ranges from 0.35 to 0.4 m3 m−3 to the west of the western United States mountains and in the wetter regions of the eastern plains, while the ESA-CCI-based soil moisture ranges from 0.3 to 0.35 m3 m−3 in the wetter regions of the eastern plains of the United States. This occurs because the depths of the ERA5-based, ESA-CCI-based, and retrieved soil moisture values range from 0 to 7 cm, 0 to 5 cm, and 0 to 2 cm, respectively. In general, soil moisture increases with depth in the plains. These two reanalysis datasets contain daily average data, while the retrieved soil moisture pertains to the period from 6 to 10 UTC. In addition, although some evaluation studies have also demonstrated a certain accuracy of the ERA5 reanalysis data [32], the reanalysis data may inherently contain errors and uncertainties and thus cannot be absolutely referred to as ground truth [33], especially over the high altitudes during cold seasons [34]. Therefore, it should be emphasized that the comparison here is mainly to qualitatively verify the similarity of soil moisture spatial structure of different data, and quantitative comparison needs to introduce more site observation data.
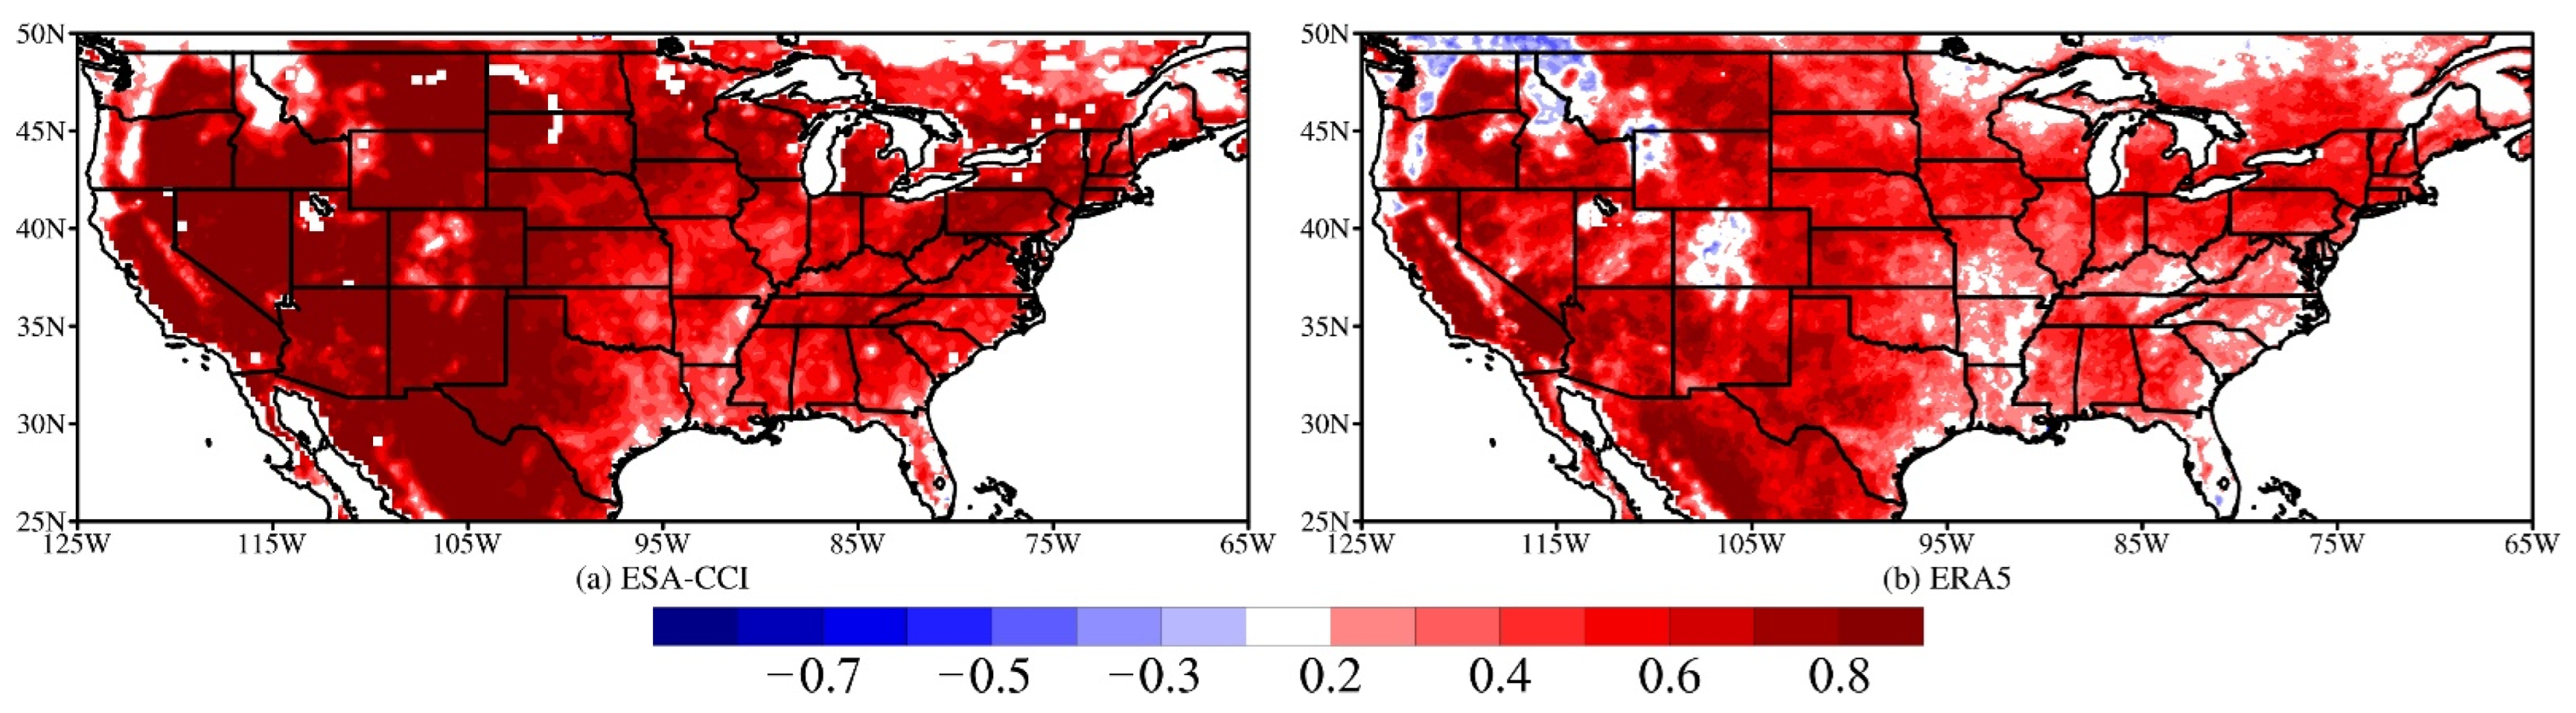
To compare the consistency among these three soil moisture datasets over time, the correlation coefficients between the retrieved soil moisture values from the 6 GHz channel and ESA-CCI (Figure 8a) and ERA5 data (Figure 8b) were calculated. This result is more consistent with the change in the ESA-CCI-based soil moisture over time; the correlation coefficient in the west and east is higher than 0.8, and the correlation coefficient is higher than 0.4 at the center. However, the correlation coefficient with the ERA5-based soil moisture is low, and the correlation coefficient decreases from west to east. Nevertheless, the value is generally positive, and the correlation coefficient remains higher than 0.4 in most areas. This indicates that a suitable correlation can be obtained between the retrieved soil moisture and reanalysis data after RFI restoration.
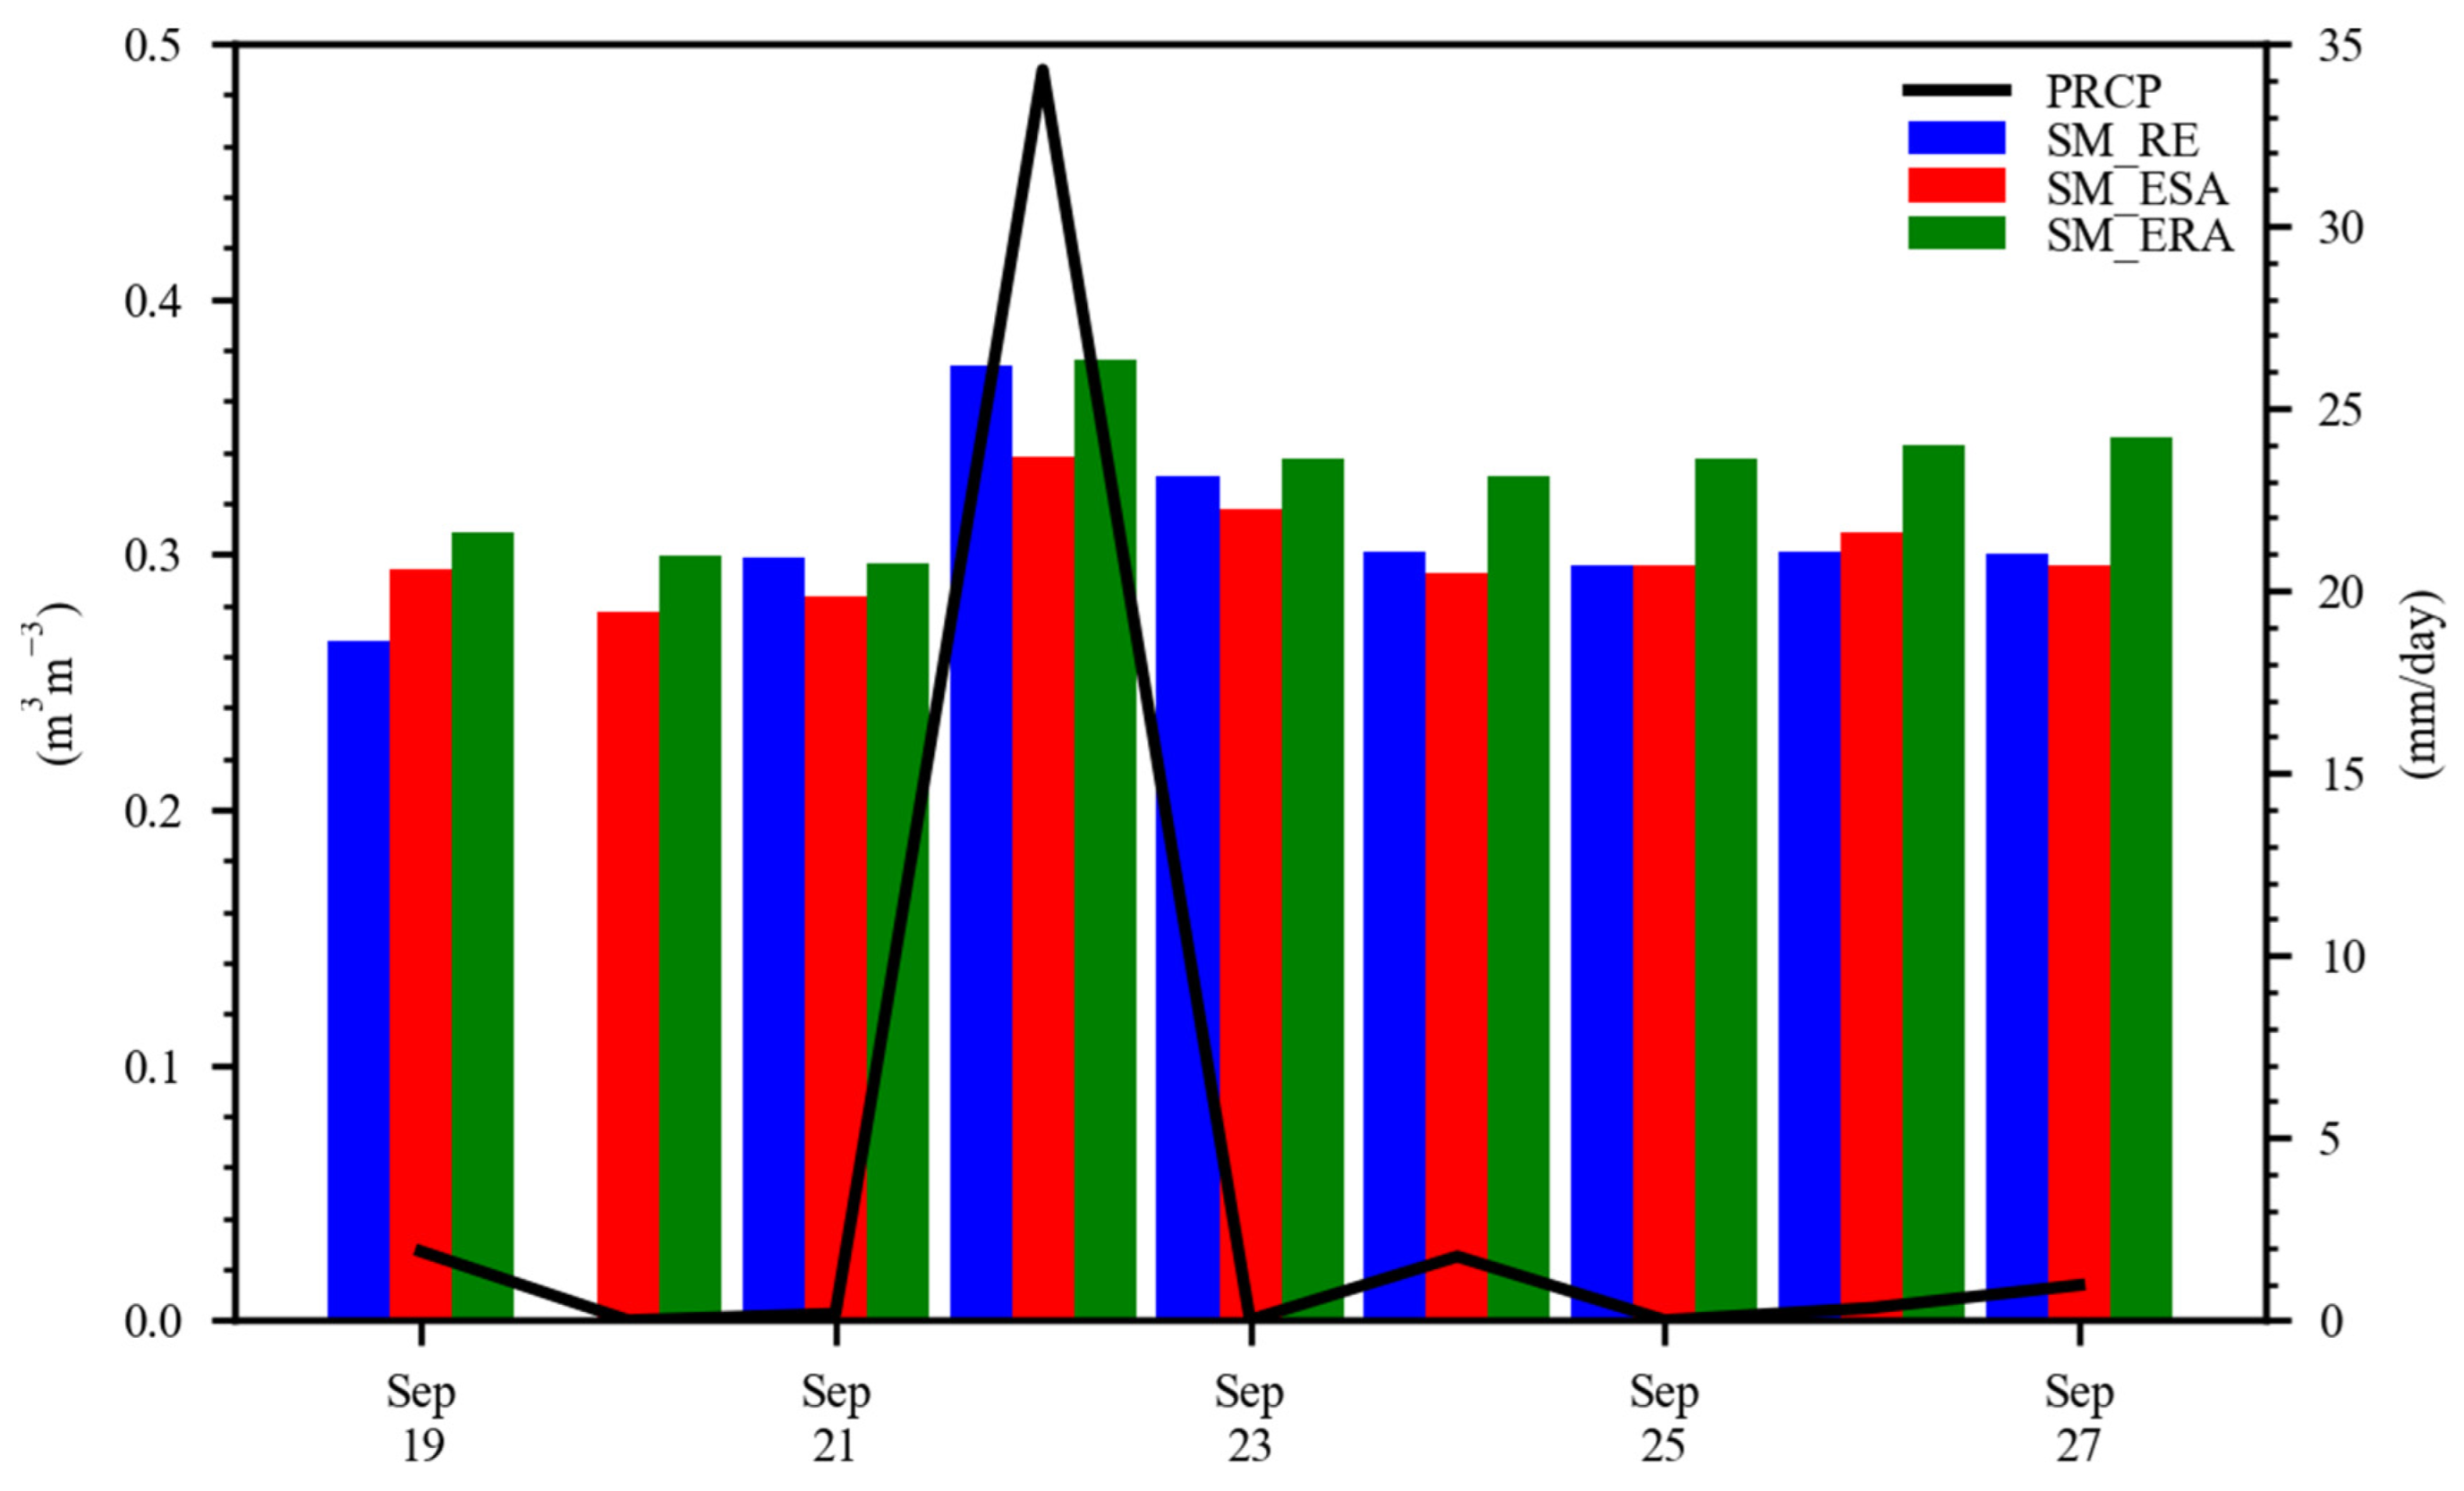
Since surface soil moisture is strongly influenced by precipitation and changes in soil moisture should vary with precipitation, a precipitation process in northern Wisconsin (45.5–46°N, 90–91°E) was selected for analysis. As shown in Figure 9, there occurred persistent precipitation from 19 to 27 September 2016, and the daily average precipitation exceeded 30 mm/day on 22 September. The retrieved soil moisture exhibited a similar trend to that of the daily average precipitation. The soil moisture reached 0.3 m3 m−3 before 22 September and increased by 0.08 to 0.38 m3 m−3 on 22 September, after which the soil moisture gradually decreased and stabilized at approximately 0.3 m3 m−3. However, the retrieved soil moisture was more variable than the ESA-CCI-based soil moisture, and the ERA5-based soil moisture was higher overall after 22 September. This occurred because the brightness temperature used for soil moisture retrieval was obtained from a satellite scan at 0700 UTC, and the highest precipitation intensity of 36.8 mm/h was found at 0700 UTC. In contrast, the other two datasets contained daily average values, and the deeper ERA5-based soil moisture indicated a higher water storage capacity. This verifies that the retrieved soil moisture data could more reasonably reflect the positive correlation between soil moisture and precipitation in the weather process.
3.3. Temporal and Spatial Variations in the Retrieved Soil Moisture
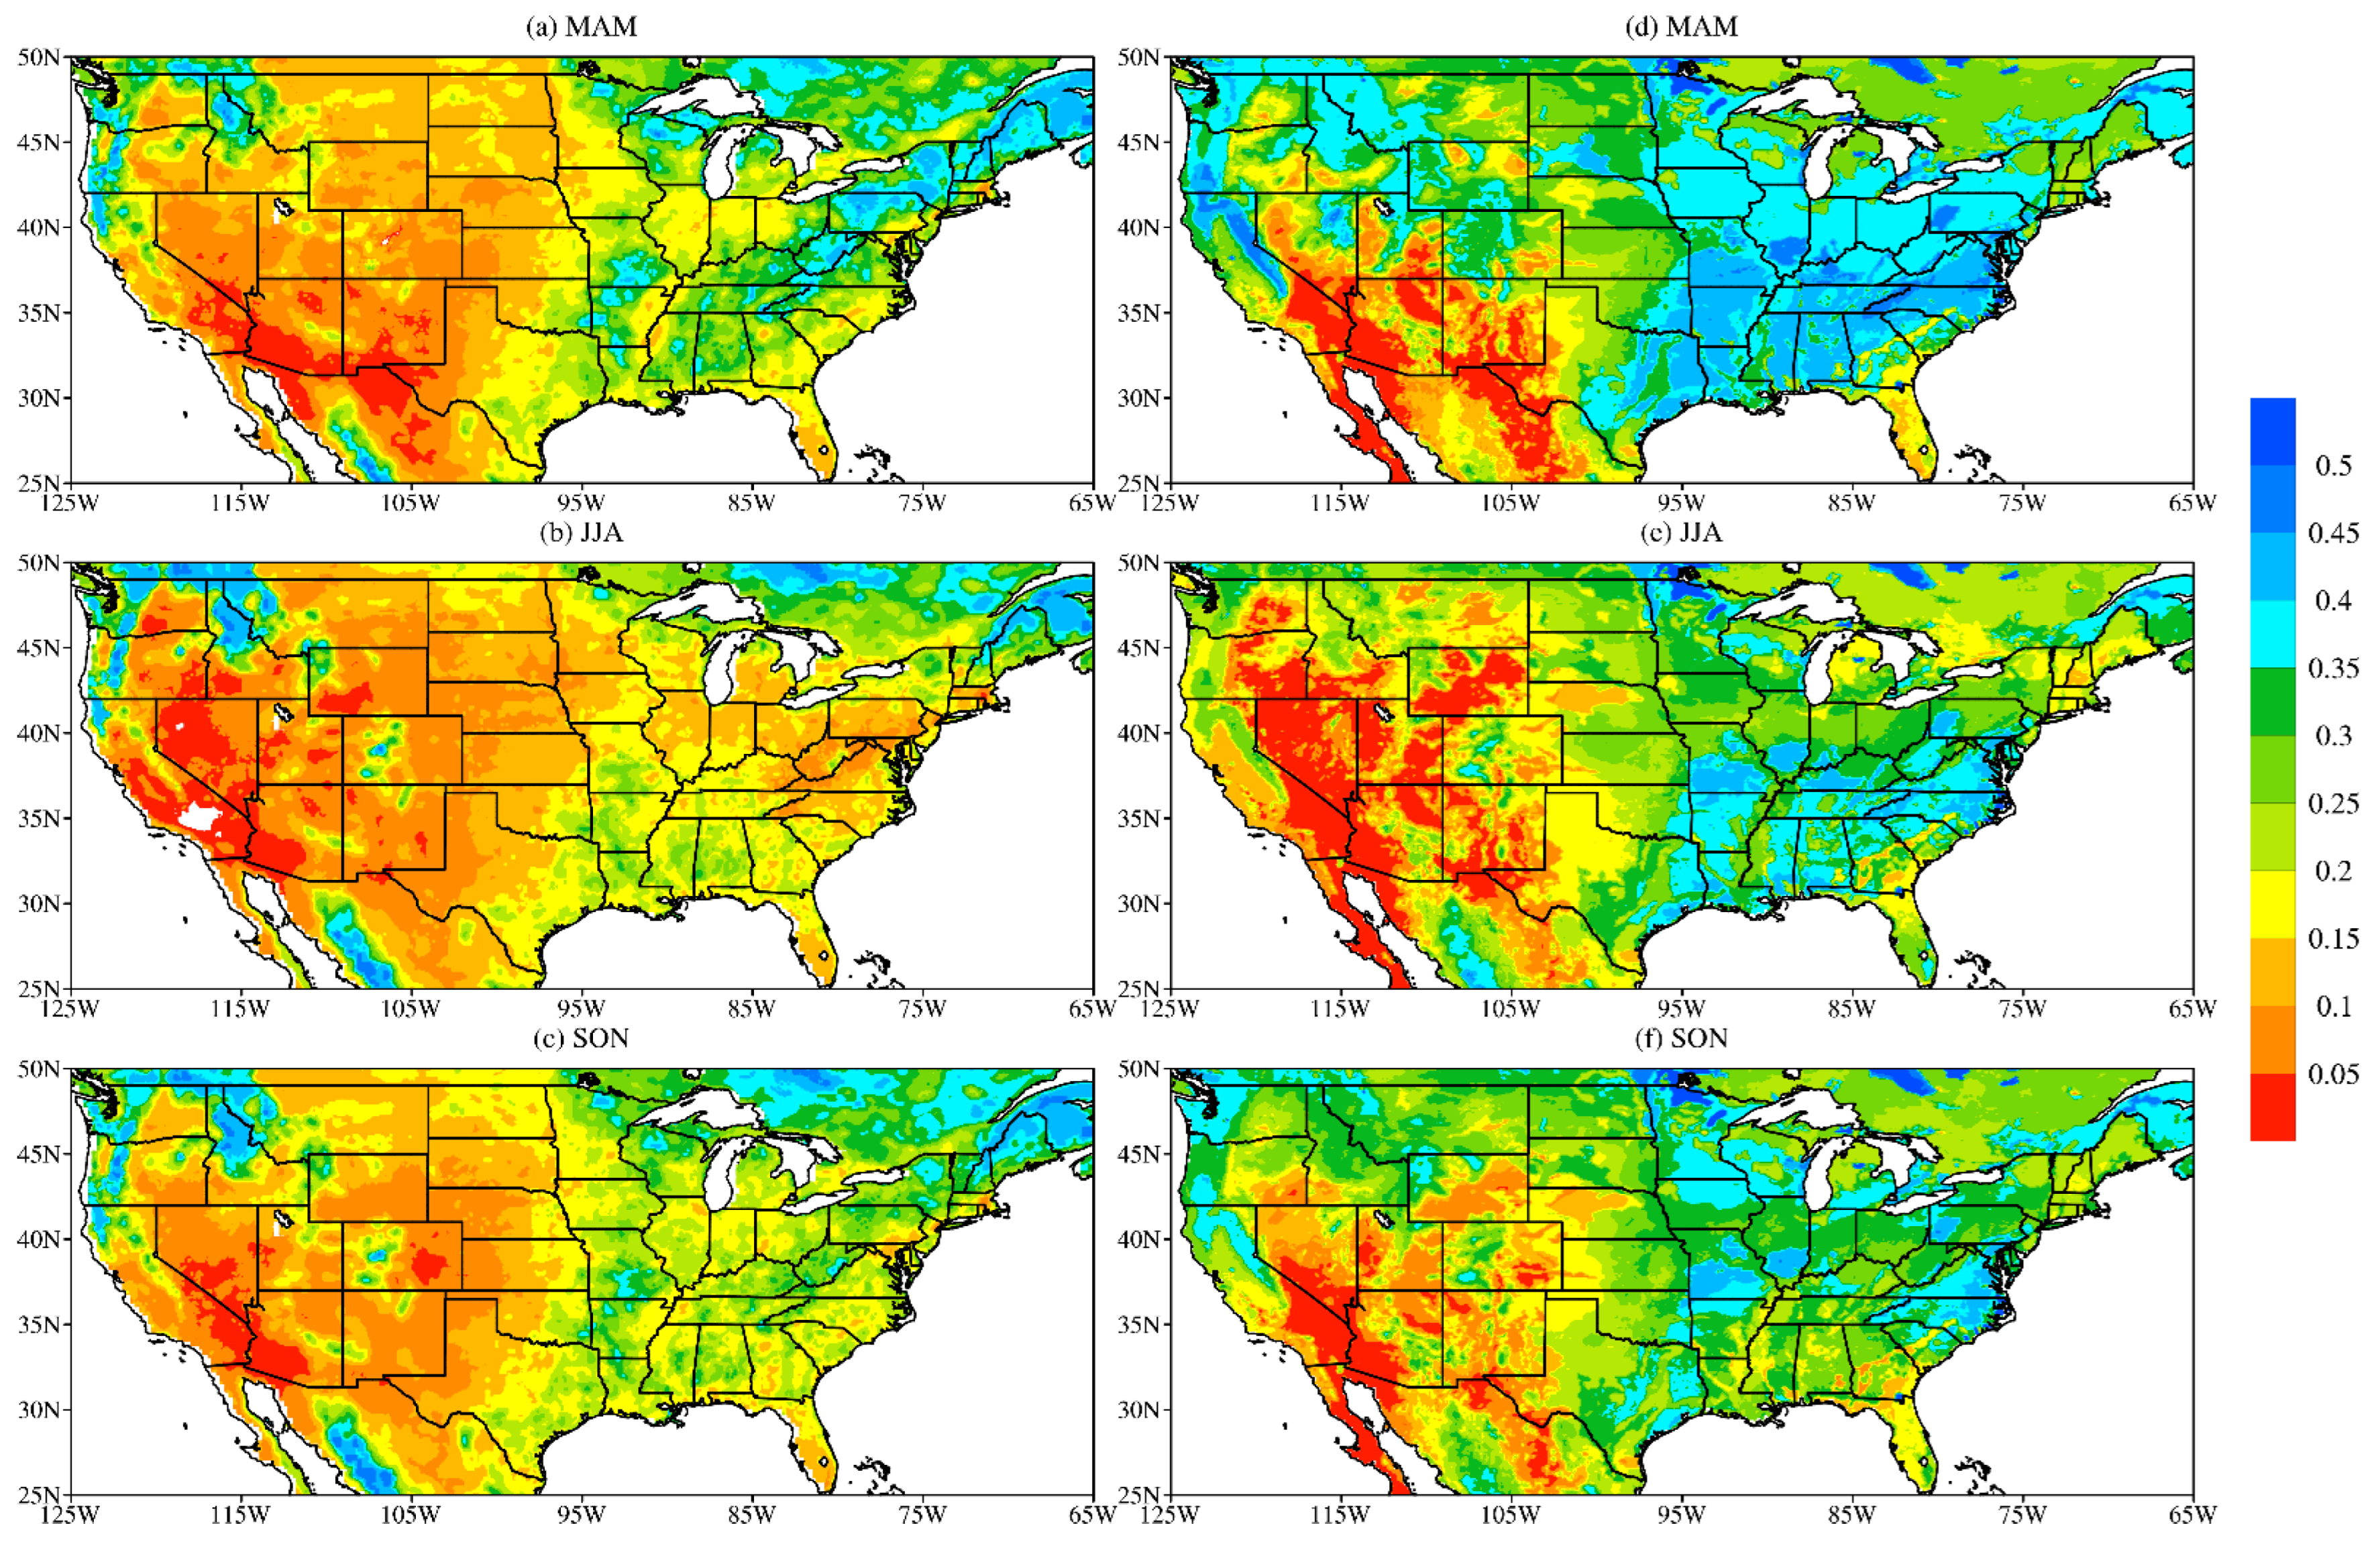
After validation of the retrieved soil moisture, the temporal and spatial distribution features of soil moisture in the United States were briefly analyzed based on these data. Figure 10a–c shows the spatial distribution of the average soil moisture in spring (March–May), summer (June–August), and autumn (September–November) in the United States in 2016. The soil moisture in each season exhibited the same characteristics involving a gradual increase from west to east, a gradual decrease from north to south in the west, and a gradual increase from north to south in the east, and the average soil moisture values in spring and autumn were highly similar. The wettest areas occurred on the western side of the Cascades Mountains in the northwestern U.S. and the Appalachians in the eastern U.S. The soil moisture ranged from 0.3 to 0.45 m3 m−3 in both regions in spring and from 0.3 to 0.45 m3 m−3 in the northwestern U.S. and from 0.2 to 0.3 m3 m−3 in the eastern U.S. in autumn. The Great Plains of the eastern–central United States were also relatively wet, with the soil moisture ranging from 0.2 to 0.3 m3 m−3. The driest areas were located in the western United States between the Rocky Mountains and Cordillera Mountains, with the soil moisture ranging from 0 to 0.15 m3 m−3. In summer, the soil moisture was similarly spatially distributed. However, the difference in soil moisture between the east and west was not significant. Compared to spring and autumn, the soil moisture was significantly lower in summer than that in spring and autumn, especially in the eastern Appalachians, and the soil moisture varied between 0.1 and 0.2 m3 m−3, while the variation in soil moisture in the west was not as pronounced. Thus, the seasonal variation in soil moisture in the drier western regions was not significant, while the seasonal variation in soil moisture in the eastern regions was extremely significant, with a significant decrease in summer. This occurred because the northeastern United States experiences a temperate continental monsoon climate with the highest summer precipitation levels and hot summers, and soil moisture is determined by both precipitation and evaporation. Soil moisture is influenced by the difference between precipitation and evapotranspiration. A large difference between these two variables can result in high soil moisture levels, and vice versa. Therefore, although more precipitation occurs in summer, instead, the difference between these two variables is smaller than that in spring and autumn due to the high temperature and evapotranspiration levels, which results in lower soil moisture levels in summer.
Compared to the spatial distribution of the ERA5-based soil moisture (Figure 10d–f), the retrieved soil moisture with the LPRM exhibited an overall low soil moisture but a similar seasonal variation to that in the ERA5-based soil moisture. In the western U.S., from spring to autumn, the driest areas were located in Arizona, and the driest areas were the largest in summer, extending into Nevada. In the eastern U.S., soil moisture increased from north to south, but the spatial distribution of the gradual increase from north to south was less pronounced in autumn than that in the other two seasons, and soil moisture was the lowest in the northeastern U.S. in summer.
4. Discussion
Currently, RFI-contaminated C-band brightness temperature data over the United States cannot be used for soil moisture retrieval, thus leaving a portion of brightness temperature data underutilized. To fully utilize this part of these data, we used the iterative PCA method to restore RFI-contaminated 6 GHz brightness temperature data and then used these restored brightness temperature data for soil moisture retrieval. It was found that the missing rate of soil moisture retrieval after brightness temperature data restoration was significantly lower than that before restoration, but the restoration effect was limited by the RFI detection method, which could be improved by adjusting the RFI identification threshold with the season. The retrieved soil moisture attained a satisfactory correlation with ERA5- and ESA-CCI-based soil moisture values and an especially high correlation with the ESA-CCI-based soil moisture. Finally, the variation characteristics of the retrieved soil moisture in spring, summer, and autumn 2016 were examined, and the underlying reasons were analyzed. Thus, the retrieved soil moisture from restored data could help to diversify the above datasets. However, a quantitative assessment of the accuracy of the retrieved soil moisture with reconstructed bright temperature in areas disturbed by RFI versus areas not disturbed by RFI is lacking; this will be further investigated in the follow-up research. As there are also many uncertainties in the soil moisture reanalysis data, the analysis in this study can only qualitatively display the spatial structure accuracy of the retrieved results, and the accuracy evaluation of the retrieved value needs to introduce more site observation data, which is also a problem that needs to be concerned in the follow-up research.
5. Conclusions
RFI contamination seriously hinders the retrieval application of the 6 GHz channel of the AMSR-2. In this paper, RFI signals in the 6 GHz channel were identified with the NPCA method, and the RFI-contaminated brightness temperature was restored via the iterative PCA method. Thereafter, the daily soil moisture in the United States in 2016 was retrieved from the 6 GHz brightness temperature before and after restoration and the 10 GHz brightness temperature with the LPRM. The retrieved soil moisture was further compared and analyzed to ERA5- and ESA-CCI-based soil moisture data, leading to the following main conclusions:
- C-band brightness temperatures over large- and medium-sized cities in the U.S. cannot be employed to calculate soil moisture at corresponding depths due to RFI contamination, resulting in dispersion in the iterative retrieval process of soil moisture with the LPRM. RFI can cause a 6–9% data loss over the retrieval results at other depths. The restored brightness temperature obtained via the iterative PCA method can be employed to iteratively retrieve the soil moisture at corresponding depths, thereby recovering approximately 80% of the lost data. In spring and autumn, during certain periods, all the lost data can be recovered.
- The retrieved soil moisture also exhibits a suitable correlation with ERA5 and ESA-CCI soil moisture data. The correlation between the retrieved soil moisture and ESA-CCI data is highly notable, exceeding 0.8 in both the east and west, and the correlation with ERA5 data also exceeds 0.4. This occurs because the ESA-CCI soil moisture data comprise a combination of the retrieved soil moisture from brightness temperatures scanned by active and passive satellite detectors. Then, a specific weather process is selected for analysis, which also demonstrates that the retrieved soil moisture can more reasonably reflect the positive correlation between soil moisture and precipitation in the considered weather process. Therefore, the retrieved soil moisture achieves a certain degree of credibility.
- The retrieved soil moisture reveals a spatial distribution that gradually increases from the southwest to the north and east, with lower soil moisture values in the western mountains and the wettest areas in the western Cascades Mountains in the northwest and Appalachian Mountains in the eastern United States. This spatial distribution is the most pronounced in spring and autumn, but the spatial variation decreases in summer due to the influence of hot and humid weather conditions in the east, resulting in a significant decrease in soil moisture.
Author Contributions
Conceptualization, Z.Q. and X.B.; methodology, Z.Q.; software, W.S.; validation, Z.Q. and Z.L.; formal analysis, Z.Q.; investigation, X.B.; resources, Z.Q.; data curation, Z.L.; writing—original draft preparation, X.B.; writing—review and editing, Z.Q.; visualization, X.B.; supervision, Z.L.; project administration, Z.L.; funding acquisition, Z.Q. All authors have read and agreed to the published version of the manuscript.
Funding
This research was jointly funded by the National Key R&D Program of China (Grant 2017YFA0604304) and the Nanjing Joint Center of the Atmospheric Research Program (Project NJCAR2018ZD01).
Data Availability Statement
ERA5-Land hourly data: https://cds.climate.copernicus.eu/cdsapp#!/dataset/reanalysis-era5-land?tab=form (accessed on 13 July 2021); ESA-CCI SM data: https://esa-soilmoisture-cci.org (accessed on 13 July 2021); AMSR-2 brightness temperature data: https://gportal.jaxa.jp/gpr/search?tab=0 (accessed on 13 July 2021); TRMM multisatellite precipitation analysis data: https://disc.gsfc.nasa.gov/datasets/TRMM3B427/summary?keywords=trmm (accessed on 13 July 2021).
Acknowledgments
We are grateful to the High-Performance Computing Centre of the Nanjing University of Information Science and Technology for performing numerical calculations in this study using its blade cluster system.
Conflicts of Interest
The authors declare that no conflict of interest exist.
References
- Teuling, A.J.; Hirschi, M.; Ohmura, A.; Wild, M.; Reichstein, M.; Ciais, P.; Buchmann, N.; Ammann, C.; Montagnani, L.; Richardson, A.D.; et al. A Regional Perspective on Trends in Continental Evaporation. Geophys. Res. Lett. 2009, 36, L02404. [Google Scholar] [CrossRef]
- Seneviratne, S.I.; Corti, T.; Davin, E.L.; Hirschi, M.; Jaeger, E.B.; Lehner, I.; Orlowsky, B.; Teuling, A.J. Investigating Soil Moisture–Climate Interactions in a Changing Climate: A Review. Earth-Sci. Rev. 2010, 99, 125–161. [Google Scholar] [CrossRef]
- Koster, R.D.; Mahanama, S.P.P.; Yamada, T.J.; Balsamo, G.; Berg, A.A.; Boisserie, M.; Dirmeyer, P.A.; Doblas-Reyes, F.J.; Drewitt, G.; Gordon, C.T.; et al. The Second Phase of the Global Land–Atmosphere Coupling Experiment: Soil Moisture Contributions to Subseasonal Forecast Skill. J. Hydrometeorol. 2011, 12, 805–822. [Google Scholar] [CrossRef]
- Petropoulos, G.; Griffiths, H.; Dorigo, W.; Xaver, A.; Gruber, A. Surface Soil Moisture Estimation: Significance, Controls, and Conventional Measurement Techniques. In Remote Sensing of Energy Fluxes and Soil Moisture Content; CRC Press: Boca Raton, FL, USA, 2013; pp. 29–48. ISBN 978-1-4665-0578-0. [Google Scholar]
- Al-Yaari, A.; Wigneron, J.-P.; Ducharne, A.; Kerr, Y.H.; Wagner, W.; De Lannoy, G.; Reichle, R.; Al Bitar, A.; Dorigo, W.; Richaume, P.; et al. Global-Scale Comparison of Passive (SMOS) and Active (ASCAT) Satellite Based Microwave Soil Moisture Retrievals with Soil Moisture Simulations (MERRA-Land). Remote Sens. Environ. 2014, 152, 614–626. [Google Scholar] [CrossRef]
- Wang, J.R.; Schmugge, T.J. An Empirical Model for the Complex Dielectric Permittivity of Soils as a Function of Water Content. IEEE Trans. Geosci. Remote Sens. 1980, GE-18, 288–295. [Google Scholar] [CrossRef]
- Srivastava, P.K.; Han, D.; Rico Ramirez, M.A.; Islam, T. Appraisal of SMOS Soil Moisture at a Catchment Scale in a Temperate Maritime Climate. J. Hydrol. 2013, 498, 292–304. [Google Scholar] [CrossRef]
- Kong, X.; Dorling, S.R. Near-surface Soil Moisture Retrieval from ASAR Wide Swath Imagery Using a Principal Component Analysis. Int. J. Remote Sens. 2008, 29, 2925–2942. [Google Scholar] [CrossRef]
- Jackson, T.J.; Cosh, M.H.; Bindlish, R.; Starks, P.J.; Bosch, D.D.; Seyfried, M.; Goodrich, D.C.; Moran, M.S.; Du, J. Validation of Advanced Microwave Scanning Radiometer Soil Moisture Products. IEEE Trans. Geosci. Remote Sens. 2010, 48, 4256–4272. [Google Scholar] [CrossRef]
- Jackson, T.J., III. Measuring Surface Soil Moisture Using Passive Microwave Remote Sensing. Hydrol. Process. 1993, 7, 139–152. [Google Scholar] [CrossRef]
- Njoku, E.G.; Li, L. Retrieval of Land Surface Parameters Using Passive Microwave Measurements at 6-18 GHz. IEEE Trans. Geosci. Remote Sens. 1999, 37, 79–93. [Google Scholar] [CrossRef] [Green Version]
- Owe, M.; de Jeu, R.; Holmes, T. Multisensor Historical Climatology of Satellite-Derived Global Land Surface Moisture. J. Geophys. Res. 2008, 113, F01002. [Google Scholar] [CrossRef]
- Wang, G.; Qi, D.; Wang, L.; Tan, Y.; Xue, F. Soil Moisture Retrieval over Northeast China Based on Microwave Brightness Temperature of FY3B Satellite and Its Comparison with Other Datasets. Chin. J. Atmos. Sci. 2016, 40, 792–804. [Google Scholar] [CrossRef]
- Shi, J.; Jiang, L.; Zhang, L.; Chen, K.S.; Wigneron, J.P.; Chanzy, A.; Jackson, T.J. Physically Based Estimation of Bare-Surface Soil Moisture with the Passive Radiometers. IEEE Trans. Geosci. Remote Sens. 2006, 44, 3145–3153. [Google Scholar] [CrossRef]
- Peng, L.; Li, W.; Liu, H. Estimation of the Soil Moisture Using FY-3A/MWRI Data over Semiarid Areas. Acta Sci. Nat. Univ. Pekin. 2011, 47, 797–804. [Google Scholar] [CrossRef]
- Bao, Y.; Mao, F.; Min, J.; Wang, D.; Yan, J. Retrieval of Bare Soil Moisture from FY-3B/MWRI Data. Remote Sens. Land Resour. 2014, 26, 131–137. [Google Scholar] [CrossRef]
- Wei, B.; Yu, S.; Jia, X.; Bao, Y.; Na, R.; Yin, S. Analysis of Soil Moisture Retrieval and Response to Meteorological Factors Using AMSR-2. Chin. J. Eco-Agric. 2016, 24, 837–845. [Google Scholar] [CrossRef]
- Shi, C.; Xie, Z.; Qian, H.; Liang, M.; Yang, X. China Land Soil Moisture EnKF Data Assimilation Based on Satellite Remote Sensing Data. Sci. China Earth Sci. 2011, 41, 375–385. [Google Scholar] [CrossRef]
- Wu, Y.; Weng, F. Applications of an AMSR-E RFI Detection and Correction Algorithm in 1-DVAR over Land. J. Meteorol. Res. 2014, 28, 645–655. [Google Scholar] [CrossRef]
- Ellingson, S.W.; Johnson, J.T. A Polarimetric Survey of Radio-Frequency Interference in C- and X-Bands in the Continental United States Using WindSat Radiometry. IEEE Trans. Geosci. Remote Sens. 2006, 44, 540–548. [Google Scholar] [CrossRef]
- Li, L.; Njoku, E.G.; Im, E.; Chang, P.S.; Germain, K.S. A Preliminary Survey of Radio-Frequency Interference Over the U.S. in Aqua AMSR-E Data. IEEE Trans. Geosci. Remote Sens. 2004, 42, 380–390. [Google Scholar] [CrossRef]
- Li, L.; Gaiser, P.W.; Bettenhausen, M.H.; Johnston, W. WindSat Radio-Frequency Interference Signature and Its Identification over Land and Ocean. IEEE Trans. Geosci. Remote Sens. 2006, 44, 530–539. [Google Scholar] [CrossRef]
- Zou, X.; Zhao, J.; Weng, F.; Qin, Z. Detection of Radio-Frequency Interference Signal Over Land From FY-3B Microwave Radiation Imager (MWRI). IEEE Trans. Geosci. Remote Sens. 2012, 50, 4994–5003. [Google Scholar] [CrossRef]
- Zhao, J.; Zou, X.; Weng, F. WindSat Radio-Frequency Interference Signature and Its Identification Over Greenland and Antarctic. IEEE Trans. Geosci. Remote Sens. 2013, 51, 4830–4839. [Google Scholar] [CrossRef]
- Zhang, Z.; Lan, H.; Zhao, T. Detection and Mitigation of Radiometers Radio-Frequency Interference by Using the Local Outlier Factor. Remote Sens. Lett. 2017, 8, 311–319. [Google Scholar] [CrossRef]
- Wu, Y.; Jiang, S.; Wang, Z. Effect of Radio-frequency Interference on the Retrieval of Land Surface Temperature from Microwave Radiation Imager. Remote Sens. Land Resour. 2018, 30, 90–96. [Google Scholar] [CrossRef]
- Shen, W.; Qin, Z.; Lin, Z. A New Restoration Method for Radio Frequency Interference Effects on AMSR-2 over North America. Remote Sens. 2019, 11, 2917. [Google Scholar] [CrossRef]
- Wagner, W. Evaluation of the Agreement between the First Global Remotely Sensed Soil Moisture Data with Model and Precipitation Data. J. Geophys. Res. 2003, 108, 4611. [Google Scholar] [CrossRef]
- Cressman, G.P. AN OPERATIONAL OBJECTIVE ANALYSIS SYSTEM. Mon. Weather. Rev. 1959, 87, 367–374. [Google Scholar] [CrossRef]
- Kim, S.; Liu, Y.Y.; Johnson, F.M.; Parinussa, R.M.; Sharma, A. A Global Comparison of Alternate AMSR2 Soil Moisture Products: Why Do They Differ? Remote Sens. Environ. 2015, 161, 43–62. [Google Scholar] [CrossRef]
- Holmes, T.R.H.; De Jeu, R.A.M.; Owe, M.; Dolman, A.J. Land Surface Temperature from Ka Band (37 GHz) Passive Microwave Observations. J. Geophys. Res. 2009, 114, D04113. [Google Scholar] [CrossRef] [Green Version]
- Beck, H.E.; Pan, M.; Miralles, D.G.; Reichle, R.H.; Dorigo, W.A.; Hahn, S.; Sheffield, J.; Karthikeyan, L.; Balsamo, G.; Parinussa, R.M.; et al. Evaluation of 18 Satellite- and Model-Based Soil Moisture Products Using in Situ Measurements from 826 Sensors. Hydrol. Earth Syst. Sci. 2021, 25, 17–40. [Google Scholar] [CrossRef]
- Li, M.; Wu, P.; Ma, Z. A Comprehensive Evaluation of Soil Moisture and Soil Temperature from Third-generation Atmospheric and Land Reanalysis Data Sets. Int. J. Climatol. 2020, 40, 5744–5766. [Google Scholar] [CrossRef]
- Ma, H.; Zeng, J.; Chen, N.; Zhang, X.; Cosh, M.H.; Wang, W. Satellite Surface Soil Moisture from SMAP, SMOS, AMSR2 and ESA CCI: A Comprehensive Assessment Using Global Ground-Based Observations. Remote Sens. Environ. 2019, 231, 111215. [Google Scholar] [CrossRef]
Figure 1.
Spatial distribution of the retrieved soil moisture using AMSR-2 vertical polarization channel 1 at 6 GHz on 18 June 2016 with the LPRM.
Figure 1.
Spatial distribution of the retrieved soil moisture using AMSR-2 vertical polarization channel 1 at 6 GHz on 18 June 2016 with the LPRM.

Figure 2.
Spatial distribution of the brightness temperature (a,b) and RFI (c,d) under 6 GHz horizontal polarization (a,c) and vertical polarization (b,d) on 18 June 2016.
Figure 2.
Spatial distribution of the brightness temperature (a,b) and RFI (c,d) under 6 GHz horizontal polarization (a,c) and vertical polarization (b,d) on 18 June 2016.

Figure 3.
Spatial distribution of the brightness temperature (a,b) and RFI (c,d) after restoration under 6 GHz horizontal polarization (a,c) and vertical polarization (b,d) on 18 June 2016.
Figure 3.
Spatial distribution of the brightness temperature (a,b) and RFI (c,d) after restoration under 6 GHz horizontal polarization (a,c) and vertical polarization (b,d) on 18 June 2016.

Figure 4.
The trend of the retrieved soil moisture with increasing brightness temperature for wet point (a) and dry point (b). Blue, red, and green indicate vertical brightness temperature, horizontal brightness temperature, and both simultaneously, respectively. Negative numbers indicate that the retrieved process does not converge.

Figure 5.
Spatial distribution of soil moisture retrieved from 6 GHz brightness temperatures before (a) and after restoration (b) and the spatial distribution of RFI in the horizontal channel (c) and vertical channel (d) in the region on 27 October 2016.
Figure 5.
Spatial distribution of soil moisture retrieved from 6 GHz brightness temperatures before (a) and after restoration (b) and the spatial distribution of RFI in the horizontal channel (c) and vertical channel (d) in the region on 27 October 2016.

Figure 6.
Daily missing rate of soil moisture retrieval for the different channels from March to November 2016. The blue curve indicates the 6 GHz results before restoration, the red curve indicates the 6 GHz results after restoration, and the black curve indicates the 10 GHz results.
Figure 6.
Daily missing rate of soil moisture retrieval for the different channels from March to November 2016. The blue curve indicates the 6 GHz results before restoration, the red curve indicates the 6 GHz results after restoration, and the black curve indicates the 10 GHz results.

Figure 7.
Spatial distribution of the average soil moisture at 6 GHz before restoration (a) and at 6 GHz after restoration (b) and based on ESA (c) and ERA5 reanalysis data (d) from March to November 2016 (units: m3 m−3).
Figure 7.
Spatial distribution of the average soil moisture at 6 GHz before restoration (a) and at 6 GHz after restoration (b) and based on ESA (c) and ERA5 reanalysis data (d) from March to November 2016 (units: m3 m−3).

Figure 8.
Spatial distribution of the correlation coefficient between the retrieved soil moisture from restored 6 GHz data and ESA (a) and ERA5 (b) reanalysis data.
Figure 8.
Spatial distribution of the correlation coefficient between the retrieved soil moisture from restored 6 GHz data and ESA (a) and ERA5 (b) reanalysis data.

Figure 9.
Soil moisture variation over time in the course of a rainy event. The blue bars indicate the retrieved soil moisture, the red bars indicate the ESA-CCI-based soil moisture, and the green bars indicate the ERA-based soil moisture. The solid curve indicates the daily precipitation amount.
Figure 9.
Soil moisture variation over time in the course of a rainy event. The blue bars indicate the retrieved soil moisture, the red bars indicate the ESA-CCI-based soil moisture, and the green bars indicate the ERA-based soil moisture. The solid curve indicates the daily precipitation amount.

Figure 10.
Spatial distribution of the seasonally averaged soil moisture in the United States in spring (a,d), summer (b,e), and autumn (c,f) in 2016. (a–c) show the LPRM-based retrieval results, and (d–f) show the ERA5-based retrieval results (units: m3 m−3).
Figure 10.
Spatial distribution of the seasonally averaged soil moisture in the United States in spring (a,d), summer (b,e), and autumn (c,f) in 2016. (a–c) show the LPRM-based retrieval results, and (d–f) show the ERA5-based retrieval results (units: m3 m−3).


Table 1.
Missing rate of soil moisture retrieval from the different channels.
| Retrieved Channel | Winter | Spring | Summer | Autumn |
|---|---|---|---|---|
| 6.925 GHz | 0.530 | 0.241 | 0.188 | 0.164 |
| re_6.925 GHz | 0.507 | 0.190 | 0.117 | 0.118 |
| 10.65 GHz | 0.507 | 0.209 | 0.134 | 0.108 |
Publisher’s Note: MDPI stays neutral with regard to jurisdictional claims in published maps and institutional affiliations. |
© 2022 by the authors. Licensee MDPI, Basel, Switzerland. This article is an open access article distributed under the terms and conditions of the Creative Commons Attribution (CC BY) license (https://creativecommons.org/licenses/by/4.0/).
Share and Cite
MDPI and ACS Style
Bai, X.; Qin, Z.; Lin, Z.; Shen, W. Effect of Radio Frequency Interference-Contaminated AMSR2 Signal Restoration on Soil Moisture Retrieval. Remote Sens. 2022, 14, 4796. https://doi.org/10.3390/rs14194796
AMA Style
Bai X, Qin Z, Lin Z, Shen W. Effect of Radio Frequency Interference-Contaminated AMSR2 Signal Restoration on Soil Moisture Retrieval. Remote Sensing. 2022; 14(19):4796. https://doi.org/10.3390/rs14194796
Chicago/Turabian StyleBai, Xuesong, Zhengkun Qin, Zhaohui Lin, and Wangbin Shen. 2022. "Effect of Radio Frequency Interference-Contaminated AMSR2 Signal Restoration on Soil Moisture Retrieval" Remote Sensing 14, no. 19: 4796. https://doi.org/10.3390/rs14194796
Note that from the first issue of 2016, this journal uses article numbers instead of page numbers. See further details here.