Article

Dominant Impacting Factors on Water-Use Efficiency Variation in Inner Mongolia from 2001 to 2018: Vegetation or Climate?

1
College of Earth Science, Chengdu University of Technology, Chengdu 610059, China
2
College of Tourism and Urban-Rural Planning, Chengdu University of Technology, Chengdu 610059, China
3
Geological Engineering Department, Montana Technological University, Butte, MT 59701, USA
4
State Environmental Protection Key Laboratory of Synergetic Control and Joint Remediation for Soil & Water Pollution, Chengdu University of Technology, Chengdu 610059, China
5
College of Ecological Environment, Chengdu University of Technology, Chengdu 610059, China
*
Author to whom correspondence should be addressed.
Remote Sens. 2022, 14(18), 4541; https://doi.org/10.3390/rs14184541
Submission received: 10 August 2022 / Revised: 7 September 2022 / Accepted: 8 September 2022 / Published: 11 September 2022

Abstract

:
Water-use efficiency (WUE) is not only an important indicator to connect the carbon and water cycles of a terrestrial ecosystem, but also a key parameter for an ecosystem to respond to climate change. It is crucial for understanding the mechanism of regional ecosystem response to environmental change by researching the influences of vegetation and climate change on WUE variation and revealing its drivers. Based on trend analysis, grey relational analysis, and ridge-regression analysis, this study analyzed the spatiotemporal variation characteristics of WUE in Inner Mongolia (IM) from 2001 to 2018 and determined the dominant influencing factors of WUE variation. The results showed that the annual mean WUE in IM was 1.39 g C m−2 mm−1 and it generally presented a rising trend, with an increasing rate of 0.0071 g C m−2 mm−1 yr−1. Leaf-area index (LAI) and precipitation were the most important factors influencing WUE in IM, followed by relative humidity and wind speed. Temperature, water vapor pressure and sunshine duration slightly influenced WUE and they were relatively less important. According to the ridge-regression analysis, LAI, precipitation and relative humidity had a positive contribution to WUE variation, while the wind speed had a negative contribution. Regionally, LAI was the dominant cause of WUE variation. The contribution and relative contribution rate of LAI to WUE variation were 0.008 g C m−2 mm−1 yr−1 and 44.57%, which were significantly higher than those of precipitation, relative humidity, and sunshine duration. Thus, vegetation primarily dominated WUE variability during the study period. The relative contribution rate of LAI varied across the different vegetation types and ranged from 25.26% in swamps to 51.29% in meadows. Our results improve the understanding of the effects of driving factors on WUE, which can help policymakers with water resource management and ecological restoration.

1. Introduction

On an ecosystem level, water-use efficiency (WUE) relates carbon assimilation to the water consumption of vegetation [1,2,3] and it is usually calculated as the ratio of gross primary productivity (GPP) to evapotranspiration (ET) [4,5,6]. As an important parameter that connects the carbon and water cycles of a terrestrial ecosystem [7,8,9], WUE not only reflects the interaction between the carbon and water cycles [10,11,12], but is also a key variable indicating the responses of an ecosystem to global climate change [13,14,15]. The accurate quantization of spatiotemporal variations in WUE and revealing its drivers are conducive to understanding the mechanism of an ecosystem response to environmental change [16,17,18]. It has important significance for regional vegetation growth management, and the reasonable allocation and protection of water resources in an ecosystem [19].
The Inner Mongolia (IM) in China is located in a semi-arid and arid agropastoral ecotone and it is one of the most sensitive regions to climate change with a vulnerable ecological environment [20,21]. Since the 1970s, the central and local governments have implemented a series of ecological restoration projects, which have improved the local vegetation coverage to different extents [22,23,24]. These projects have also changed the local hydrological circulation, thus resulting in WUE variation [25,26,27]. Large-scale afforestation in semi-arid and arid regions could cause excessive water consumption, which may further influence the carbon and water cycles of an ecosystem [28,29,30,31]. Therefore, a quantitative assessment of the spatiotemporal variation of WUE and its cause in IM is vital to understanding the interaction between a local ecosystem and environmental change and to formulate water-conservation protection schemes.
Spatiotemporal variations of WUE are influenced by biotic and abiotic factors [1,5,32]. The WUE of different vegetation types responds differently to climate change and hydrological conditions [11,12,15]. Previous studies have mainly focused on the variation of WUE and its relationship with air temperature, precipitation and drought. For example, based on eddy flux measurement data, Hu et al. [3] found a good correlation between WUE and leaf-area index (LAI) in IM, and the WUE of meadows could be predicted by LAI. Liu et al. [33] assessed the responses of WUE to drought and found that the WUE in the middle of IM often increased upon the occurrence of drought events. Guo et al. [34] found a rising trend of WUE in the Beijing–Tianjin Sandstorm Source Region from 1982 to 2015, during which WUE was positively correlated with temperature and precipitation. However, such correlations only came from a simple correlation or partial correlation analysis, in which it was assumed that sample variables met the joint normal distribution, and that the analysis results could easily be influenced by sample size and extreme values of samples [35,36,37]. Grey relational analysis can solve the poor reliability of results caused by a small sample size, missing information and atypical distribution, and can measure the relation strength among different variables [38,39,40]. In addition, the contributions of climate and vegetation to the variation of WUE remain unclear. The multiple-regression residual analysis and path analysis have been widely used to quantify the contributions of independent variables to dependent variables [5,41,42,43]. However, complicated multicollinearity is a common issue in multiple linear regression [44,45], which can be solved by ridge regression [27,46].
In this study, the Global Land Surface Satellite (GLASS) products were used to study the spatial pattern of the WUE in IM from 2001 to 2018. By using statistical analysis methods, we aimed to: (1) analyze the spatiotemporal changes in WUE in IM from 2001 to 2018, (2) evaluate the influences of vegetation and climate factors on WUE, and (3) quantify the contributions of important influencing factors to the WUE trend and identify the dominant influencing factors of the WUE variation.

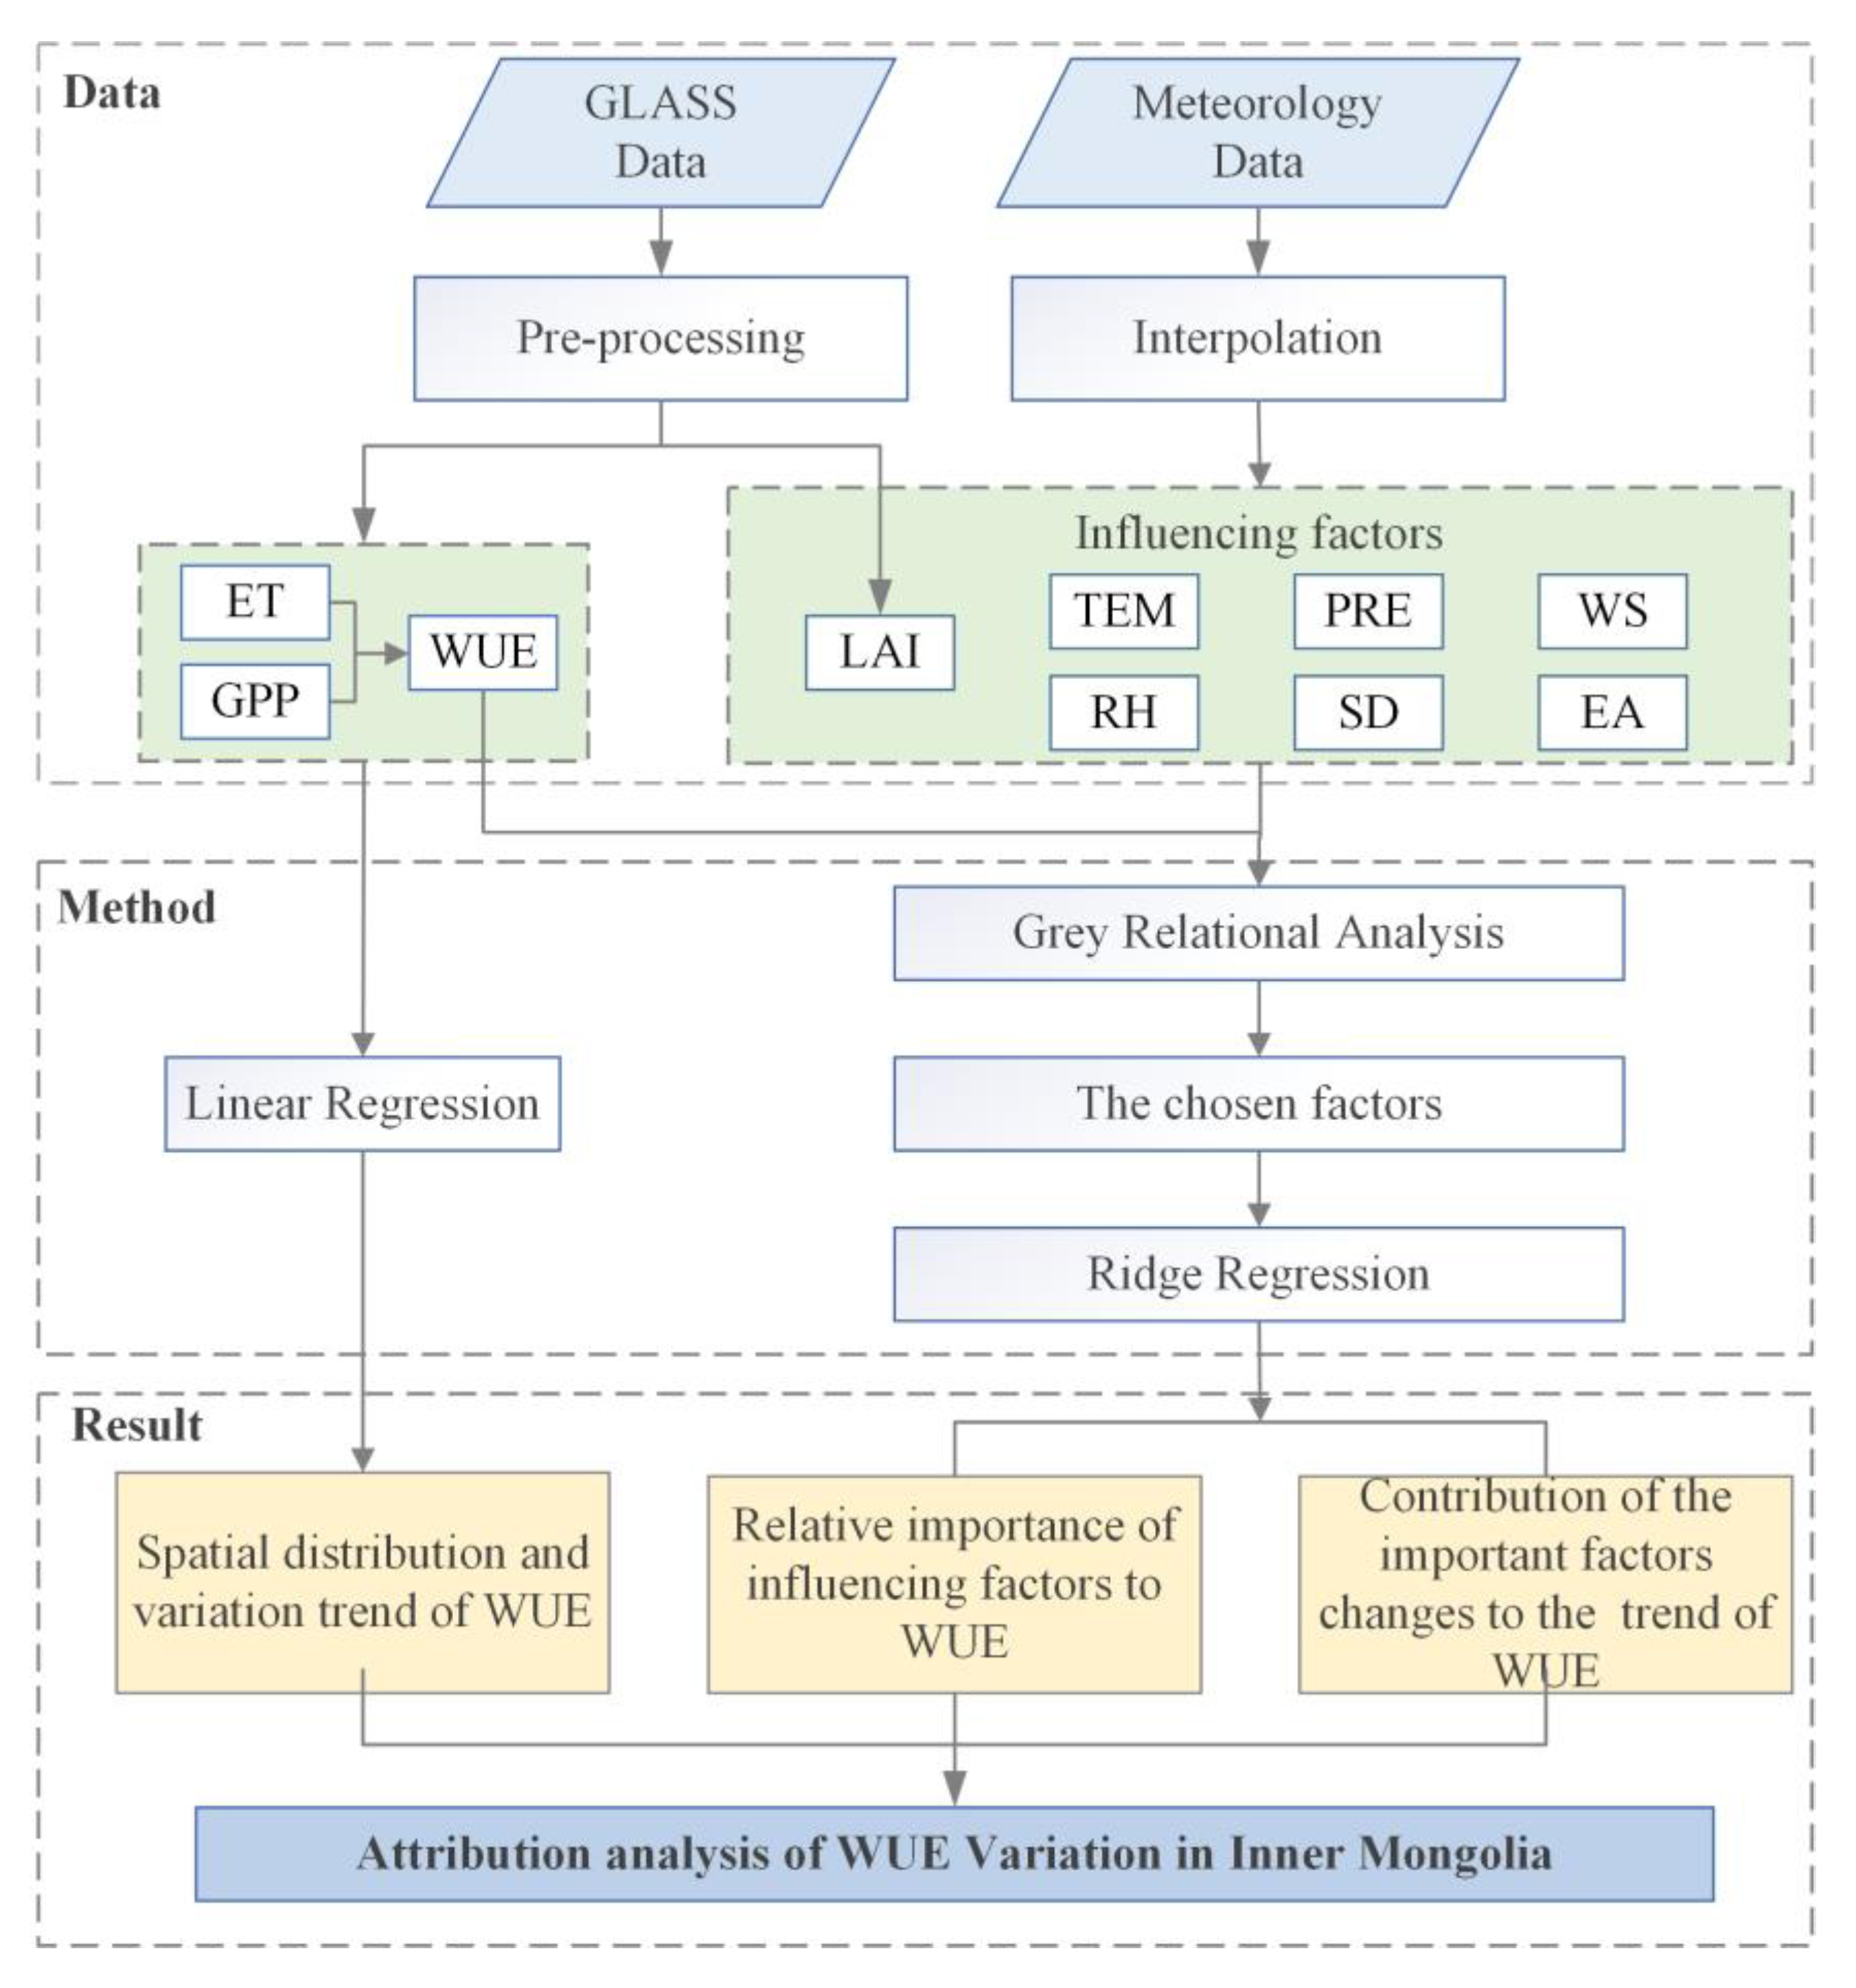
2. Materials and Methods
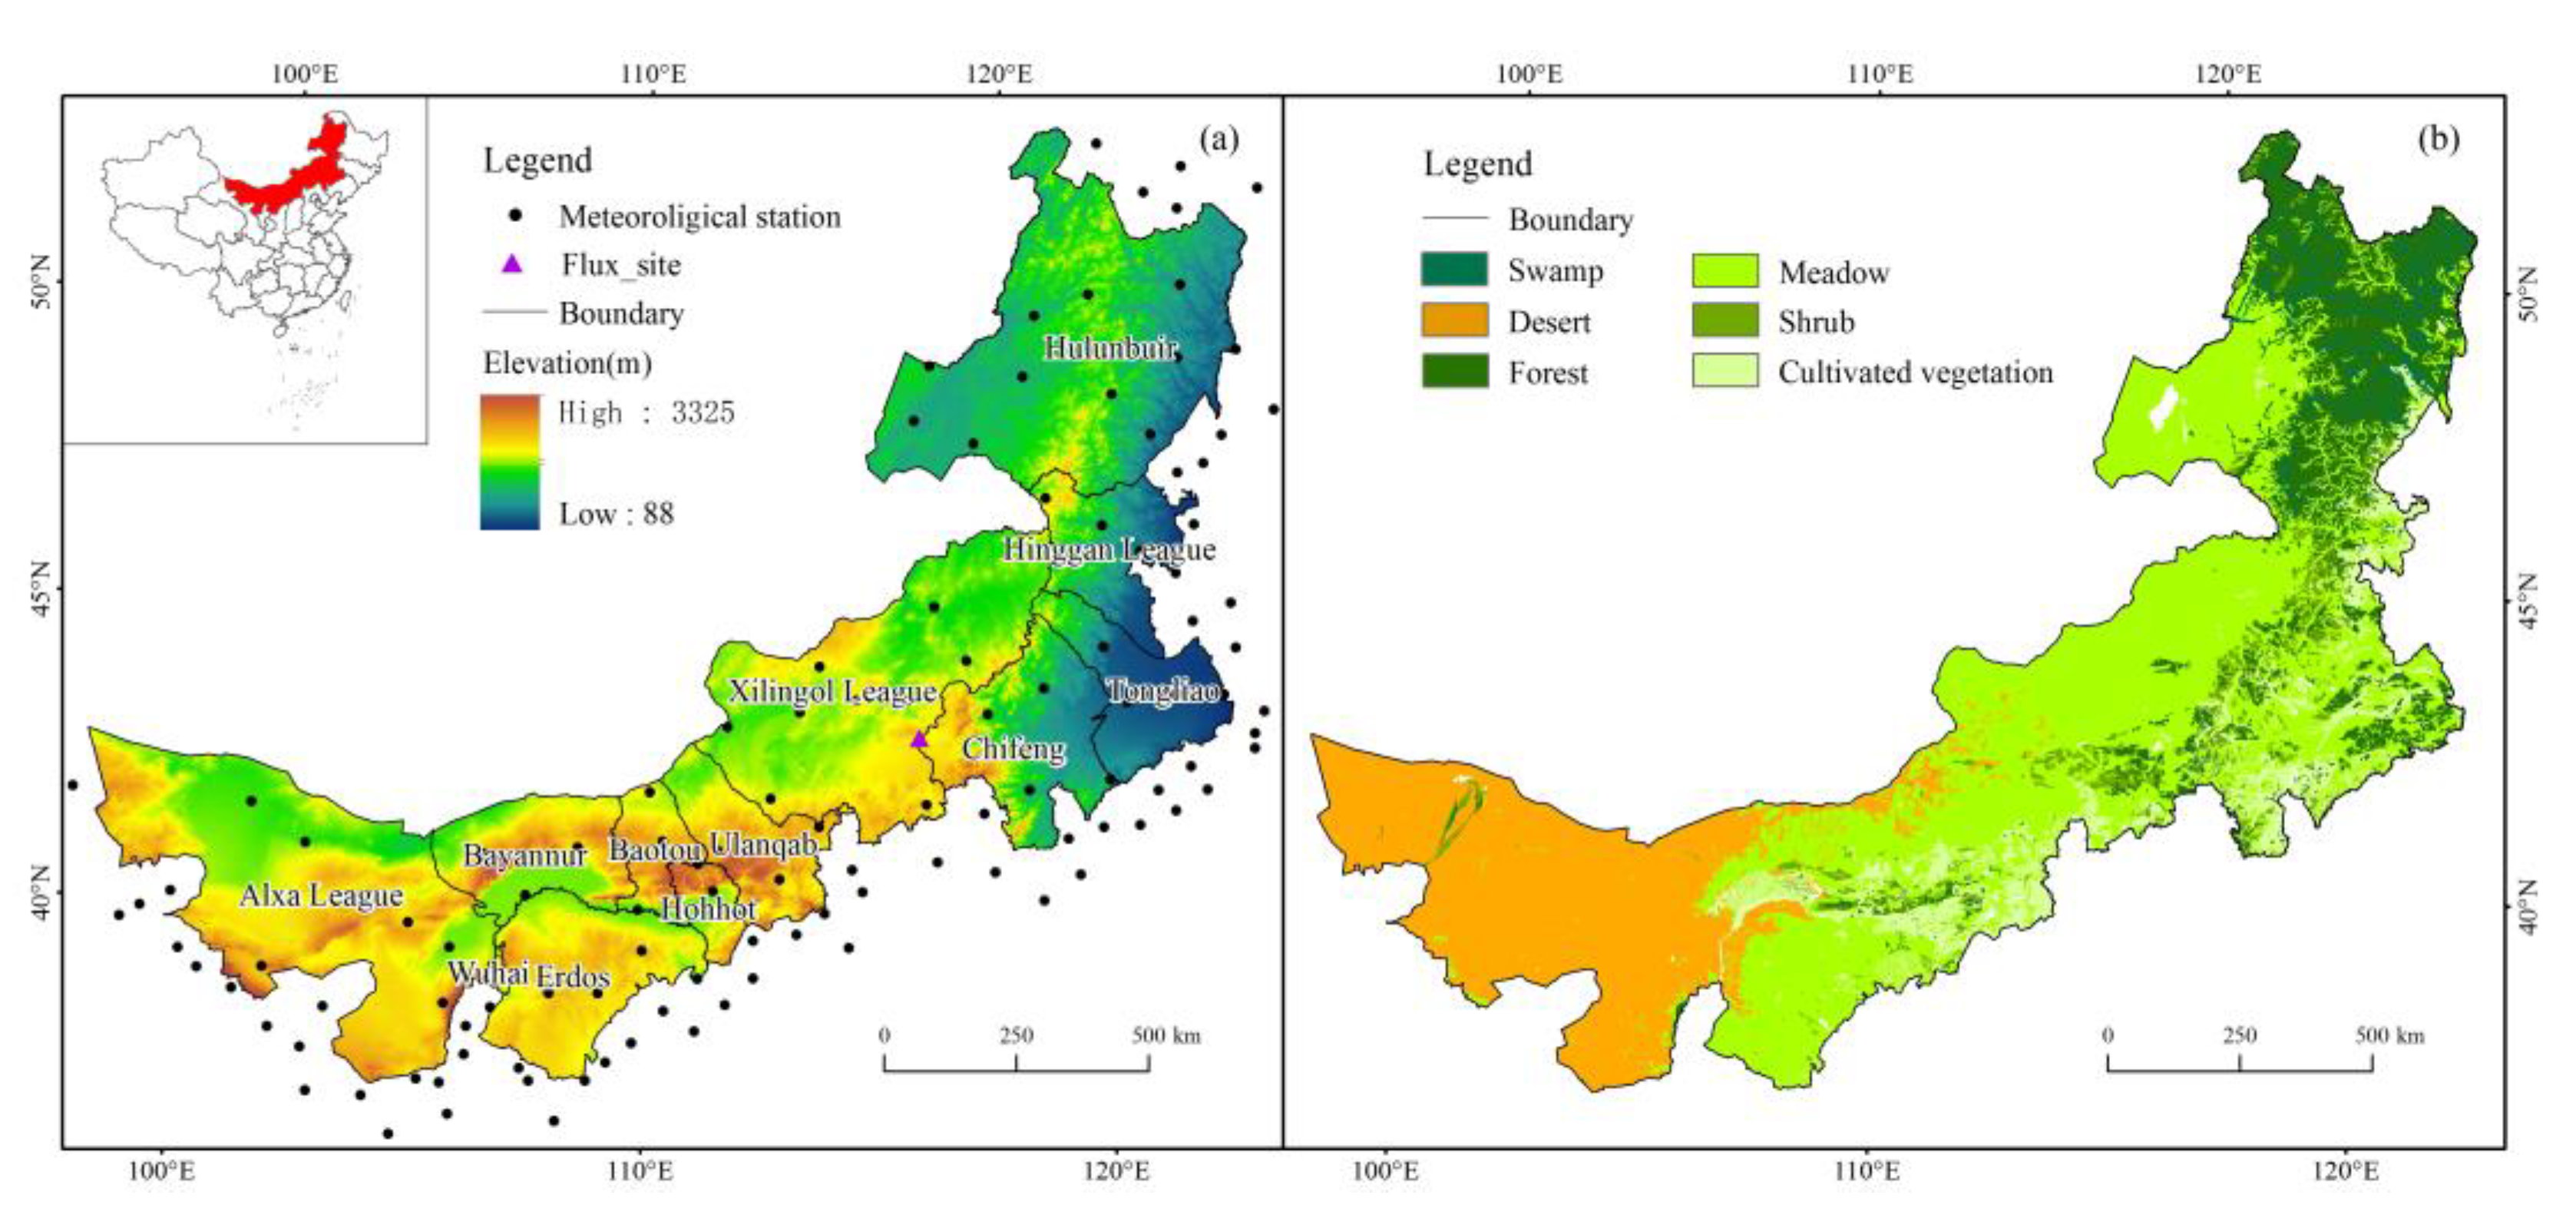
2.1. Study Area

Located on the northern border of China, IM (97°12′–126°04′E, 37°24′–53°23′N) has 12 prefecture-level districts and 103 county-level districts, covering an area of 1.18 million km2 and accounting for 12.3% of the whole territory area in China. The study area is a typical Mongolian plateau, with a mean elevation of about 1000 m. There are complex landforms in IM, including plains, mountains and high plains from east to west (Figure 1a). IM is located in the transition belt from the subhumid climate in Eastern China to the semi-arid and arid climates in Western China. IM belongs to the temperate continental monsoon climate with the annual mean temperature being 3–6 °C, decreasing from south to north. Its annual precipitation is 50–550 mm, decreasing gradually from northeast to southwest. The vegetation in the region is characterized by longitudinal zonality and there is forest, meadow and desert from northeast to southwest as the precipitation decreases (Figure 1b). Among them, meadow is the major vegetation type, accounting for about 40.9% of the study area [21].

2.2. Data and Preprocessing

GPP, ET and LAI data used in this study were from the GLASS products (http://www.glass.umd.edu/, accessed on 12 March 2022). The latest GLASS GPP data were generated based on the revised light-use efficiency model by taking several environmental variables into account, such as CO2 concentration, radiation components and atmospheric water vapor pressure [47,48]. The results described the spatial, interannual, and seasonal variations of global GPP. These GLASS GPP data were superior to those generated by the original eddy covariance–light-use efficiency model (EC–LUE) in terms of data accuracy. The ET product with high reliability and accuracy was generated by integrating five common latent-heat-flux algorithms using the Bayesian model-averaging (BMA) method and combing AVHRR (advanced very-high-resolution radiometer), MODIS (moderate-resolution imaging spectroradiometer), and MERRA (modern-era retrospective analysis for research and applications) reanalysis data [49,50,51]. In order to verify the accuracy of the GLASS data for the reliability of the subsequent analyses, we assessed the GLASS data using the measured flux data over grassland at observation stations at Xilingol League (http://www.cnern.org.cn/index.jsp, accessed on 12 March 2022) for site-level validation at the 8-day scale (Figure S1). Data accuracy was assessed by the determination coefficient (R2) and root-mean-square errors (RMSEs). The results demonstrated that the R2 between the GLASS GPP data and the flux data was 0.92 and the RMSE was 0.33 g C m−2 8d−1 (Figure S1a). The R2 between the ET data and the flux data was 0.82 and the RMSE was 0.29 mm 8d−1 (Figure S1b). The estimated R2 between the estimated WUE by the ET data and the flux data was 0.87 and the RMSE was 0.25 g C m−2 mm−1 8d−1 (Figure S1c). This indicated that the GLASS data were highly consistent with the measured data and that they were applicable to estimate WUE. Therefore, we used the GPP and ET data from 2001 to 2018 to calculate the WUE in IM.
The annual mean LAI was calculated using data with a temporal resolution of 8 d and a spatial resolution of 500 m. The DEM data came from the SRTM digital elevation product of National Aeronautics and Space Administration, with a spatial resolution of 90 m (https://earthexplorer.usgs.gov/, accessed on 12 March 2022). Vegetation types were obtained from China’s vegetation-type map (1:1,000,000) from the Data Center of the Chinese Academy of Sciences (https://www.resdc.cn/, accessed on 12 March 2022). In the study area, the vegetation was divided into six types, including forest, swamp, shrub, meadow, cultivated vegetation, and desert. We only focused on the first five in this study (Figure 1b). Meteorological data came from China National Meteorological Science Data Sharing Service Platform (http://data.cma.cn, accessed on 12 March 2022). A statistical analysis on annual mean temperature (°C), annual accumulated precipitation (mm), annual mean wind speed (m s−1), annual mean relative humidity (%), annual mean sunshine duration (h), and annual mean water vapor pressure (hPa) at 118 stations in IM and surrounding areas from 2001 to 2018 was carried out. The temperature data were interpolated through the thin plate spline function by using the DEM as covariable [40], and the other climate variables were interpolated using the Kriging method. The resolution of all data was 1 km.

2.3. Methods

The data-processing flow is shown in Figure 2. Following the figure from top to bottom, first the GLASS data were preprocessed to extract ET, GPP, and LAI data. The WUE was then calculated from the GPP and ET data and the climate factors such as temperature, precipitation, wind speed, relative humidity, sunshine duration, and water vapor pressure were interpolated from the original climate data at the meteorology stations. Next, the spatial distribution and variation trend of the WUE were calculated using the linear-regression method. After that, grey relational analysis method was performed to analyze the importance of all influencing factors to WUE and the important factors were chosen. Finally, ridge regression was carried out using the WUE and the selected factors. The contributions of important influencing factors to the WUE trend were quantified. Based on this, the dominant influencing factors of the WUE variation was determined.

2.3.1. WUE Trend Analysis

The variation trend of the WUE was calculated by the simple linear regression [11]:
slope = n   × i = 1 n i   × X i     i = 1 n i i = 1 n X i n   × i = 1 n i 2     ( i = 1 n i ) 2
where n refers to the length of the time series. Xi refers to the WUE value of the i-th year. The slope is the linear-regression coefficient and it represents the WUE trend. If the slope > 0, then the WUE presents an increasing trend; otherwise, a decreasing trend. The significance of the linear trend was checked by the F-test method [52].

2.3.2. Grey Relational Analysis

The correlation degrees of the WUE with the LAI and climate factors were quantified through grey relational analysis. The importance of the influencing factors to the WUE was determined. The time series of the WUE was chosen as the reference factor sequence {X0(t)} (t = 0, 1, 2, …, m), while LAI, temperature, precipitation, wind speed, relative humidity, sunshine duration, and water vapor pressure were used as the comparative factor sequence {Xi(t)} (t = 0, 1, 2, …, m; i = 1, 2, …, n). For the comparison of the variables with different units and orders of magnitude, the factor sequence was first normalized:
X = X X σ
where X’ refers to the normalized value of the factor sequence. X is the factor sequence. X is the mean of the factor sequence and σ is the standard deviation of the factor sequence. The grey relational coefficient is calculated as follows:
ξ 0 i ( t ) = min i ( min t ( | X 0 ( t ) X i ( t ) | ) ) + ε max i ( max t ( | X 0 ( t ) X i ( t ) | ) ) | X 0 ( t ) X i ( t ) | + ε max i ( max t ( | X 0 ( t ) X i ( t ) | ) )
where X 0 (t) is the normalized reference factor-sequence value at t. X i (t) refers to the normalized comparative factor-sequence value at t. i represents the influencing factors. ε is the differential coefficient and it is usually 0.5 [37,38,39,40]. ξ0i refers to the grey relational coefficient of the WUE and Xi(t) at t. Generally speaking, a grey relational degree is the mean of the full-process correlation coefficient. Since there are differences among the indicators or spatial importance, it is necessary to calculate the weighted mean of the grey relational coefficient during the computation of the correlation degree. The weights of the indicators can be determined through the entropy-weight method [53,54]. The procedure to determine the weights is as follows:
r i ( t ) = X i ( t ) i = 1 n X i ( t )
z ( t ) = - ln ( n ) 1   ×   i = 1 n r i ( t )   ×   lnr i ( t )
λ ( t ) = 1   -   z ( t ) t = 1 m ( 1   -   z ( t ) )
where λ(t) is the weights of indicators. The grey relational degree was calculated according to the weights:
G 0 i = t = 1 m λ ( t ) ξ 0 i ( t )
where G0i is the grey relational degree between the WUE and Xi(t) after the weighted mean of ξ0i was calculated, with a range of 0~1. The influencing factor becomes more important to the WUE as G0i approaches 1 [35].

2.3.3. Ridge Regression

In a multiple linear regression, the collinearity issues among several independent variables may lead to errors of the least-square estimation [44,55]. Ridge regression is often applied to eliminate collinearity among independent variables. The general estimation of the ridge-regression coefficient is:
β ^ ( k ) = ( X T X + k × I ) 1 X T Y
where X is the observation matrix of the independent variables. Y is the observation matrix of the dependent variable. I is the unit matrix. k (≥0) is a ridge parameter. The ridge-regression coefficient is the sensitivity coefficient of the independent variables to a dependent variable. According to the ridge-regression coefficient and the linear trend of the independent variables, the contributions of the changes in the independent variables to the trend of dependent variable were calculated as [27,45]:
C i = β i   ×   slope Xi _ S   ×   slope Y slope Y _ S
where βi is the normalized ridge-regression coefficient of the independent variable i. slopeXi_S is the linear trend of the independent variable i after normalization. slopeY is the linear trend of the dependent variable. slopeY_S is the linear trend of the dependent variable after normalization. Ci denotes the contribution of the changes in the independent variable i to the variation trend of the dependent variable. If Ci > 0, then the change in the independent variable i has a positive contribution to the trend of the dependent variable; otherwise, the contribution is negative. According to the contributions of all variables, the relative contribution rate can be calculated as:
R i = 100   ×   C i 1 n | C i |
where Ri is the relative contribution rate of the changes in the independent variable i to the trend of the dependent variable. The dependent variable with the maximum relative contribution rate was chosen as the dominant factor over the trend of the dependent variable. In this study, the WUE was the dependent variable, whereas the influencing factors, which were chosen according to the grey relational analysis results, were the independent variables.

3. Results

3.1. Spatial and Temporal Characteristics of WUE

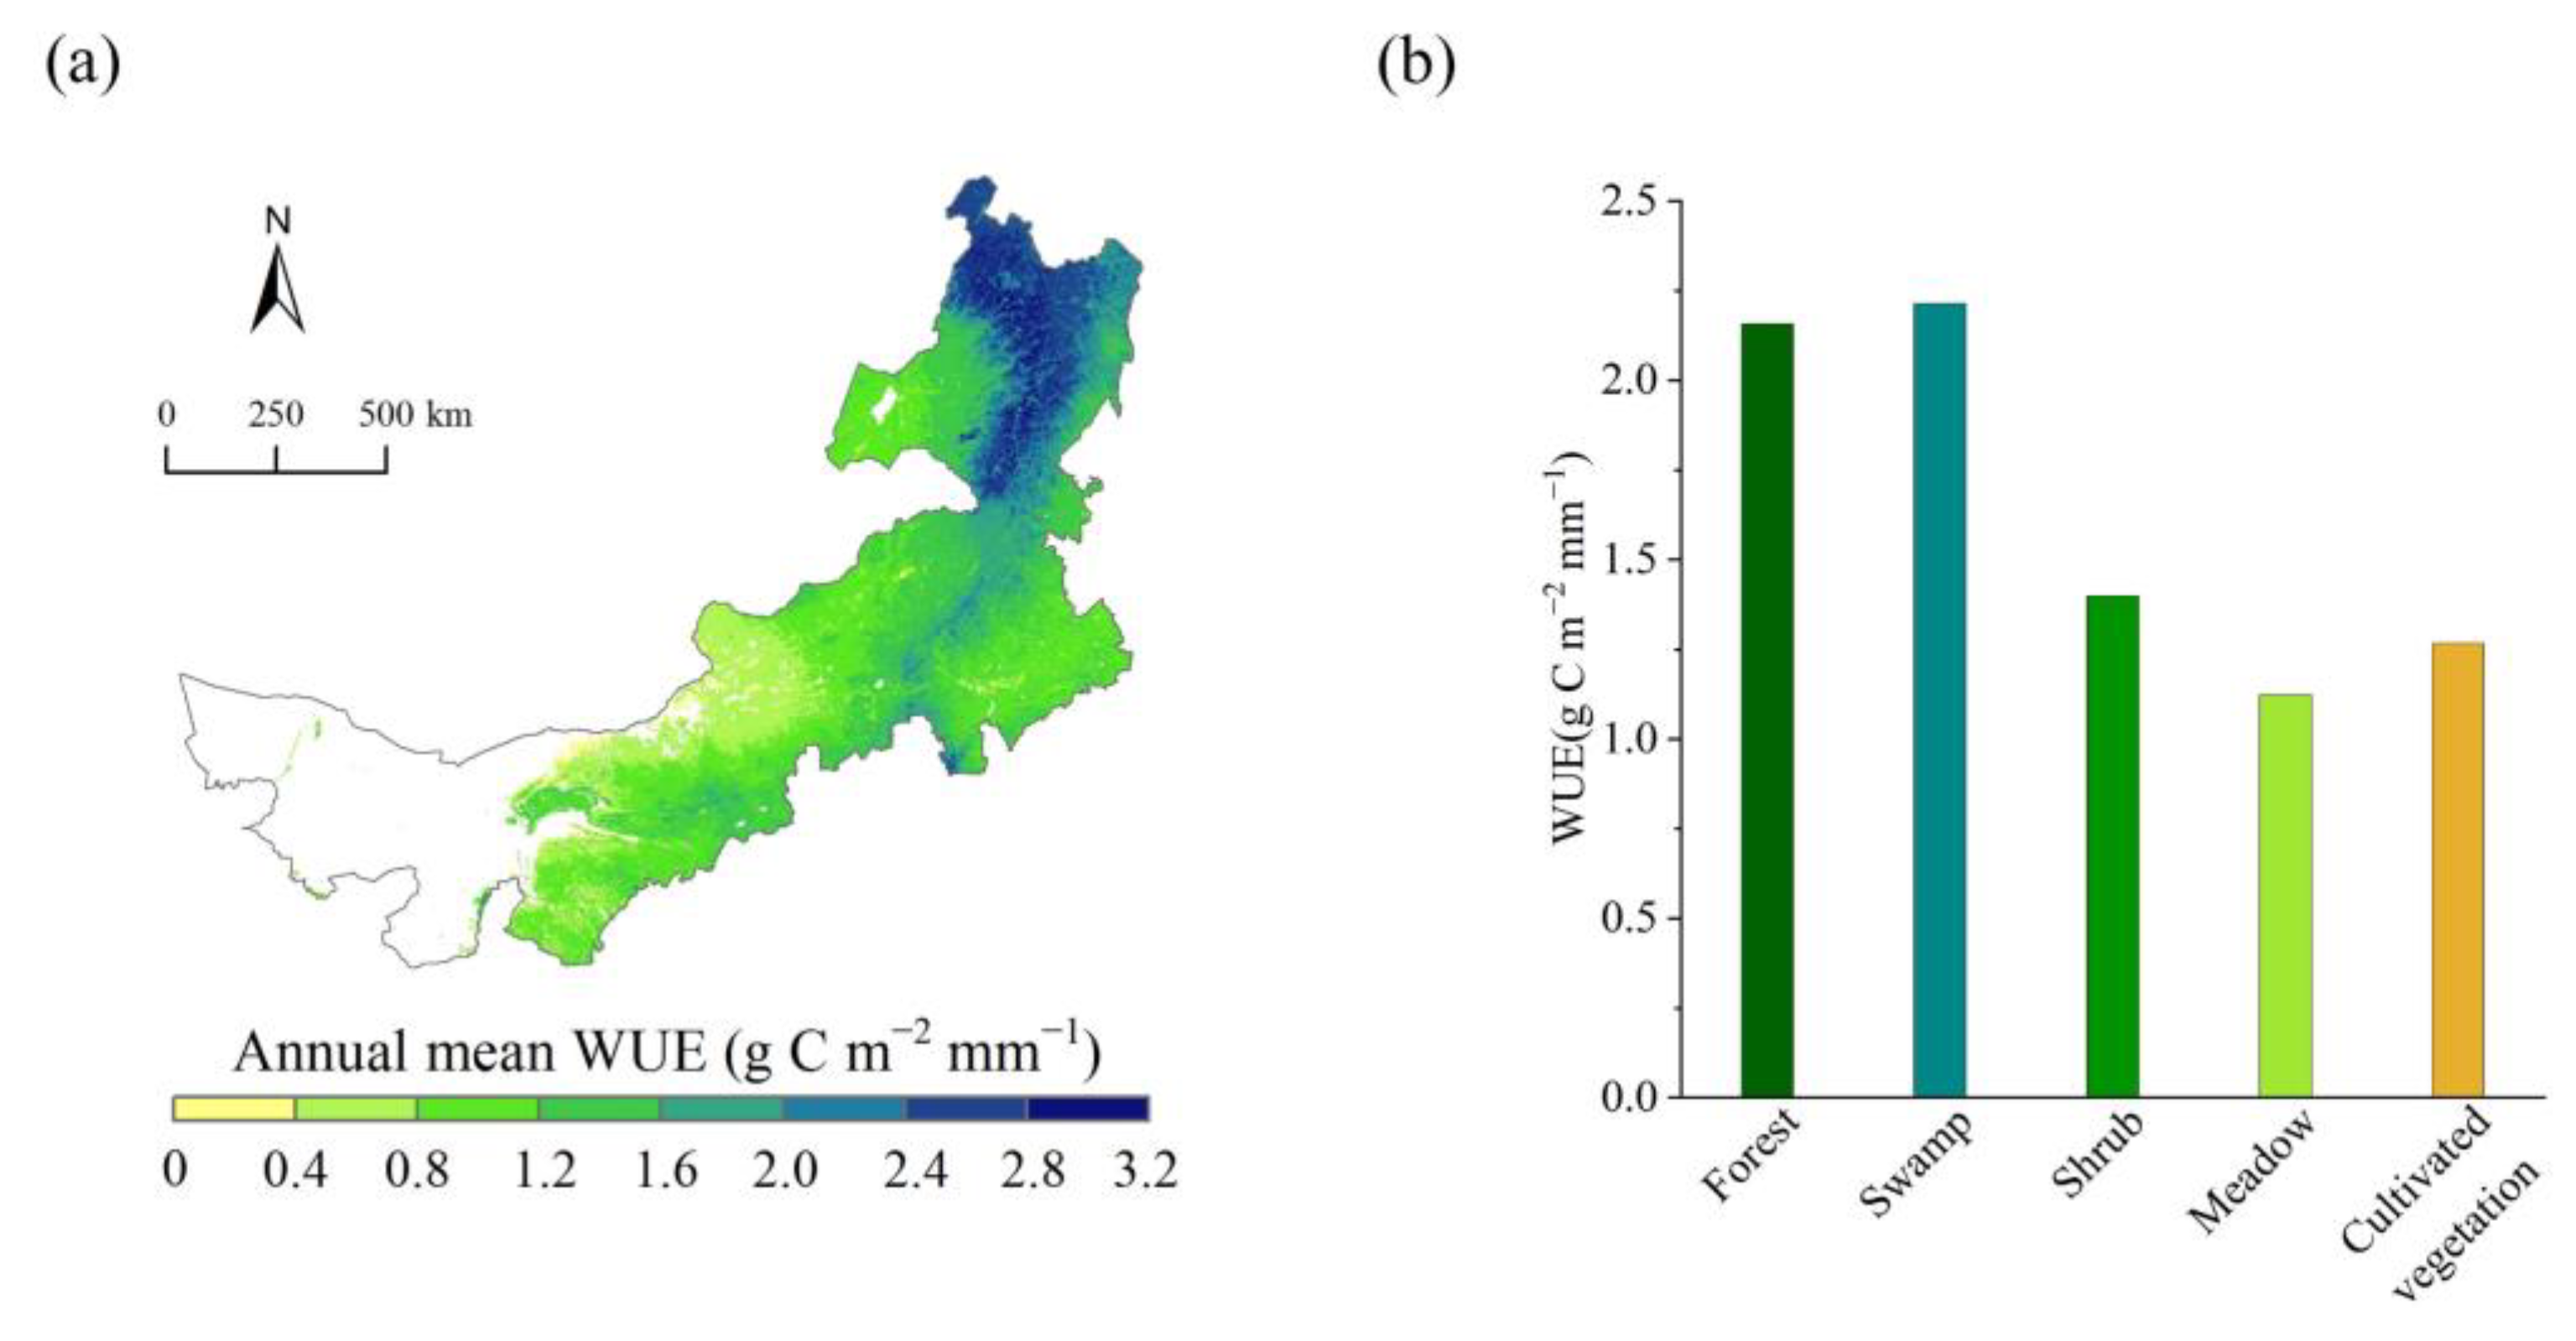
3.1.1. Spatial Distribution of WUE

The spatial distribution of the annual mean WUE in IM from 2001 to 2018 is shown in Figure 3a. The annual mean WUE was 1.39 g C m−2 mm−1, ranging within 0~3.03 g C m−2 mm−1. The WUE increased from southwest to northeast. The WUE was high in the northeast of the study area where there was low air temperature, sufficient precipitation, and extensive forests. The WUE was low in the meadow in western Xilingol League where precipitation was relatively low. Figure 3b shows the dependence of the WUE on the vegetation types in the following decreasing order: swamp (2.21 g C m−2 mm−1), forest (2.16 g C m−2 mm−1), shrub (1.40 g C m−2 mm−1), cultivated vegetation (1.27 g C m−2 mm−1), and meadow (1.12 g C m−2 mm−1).

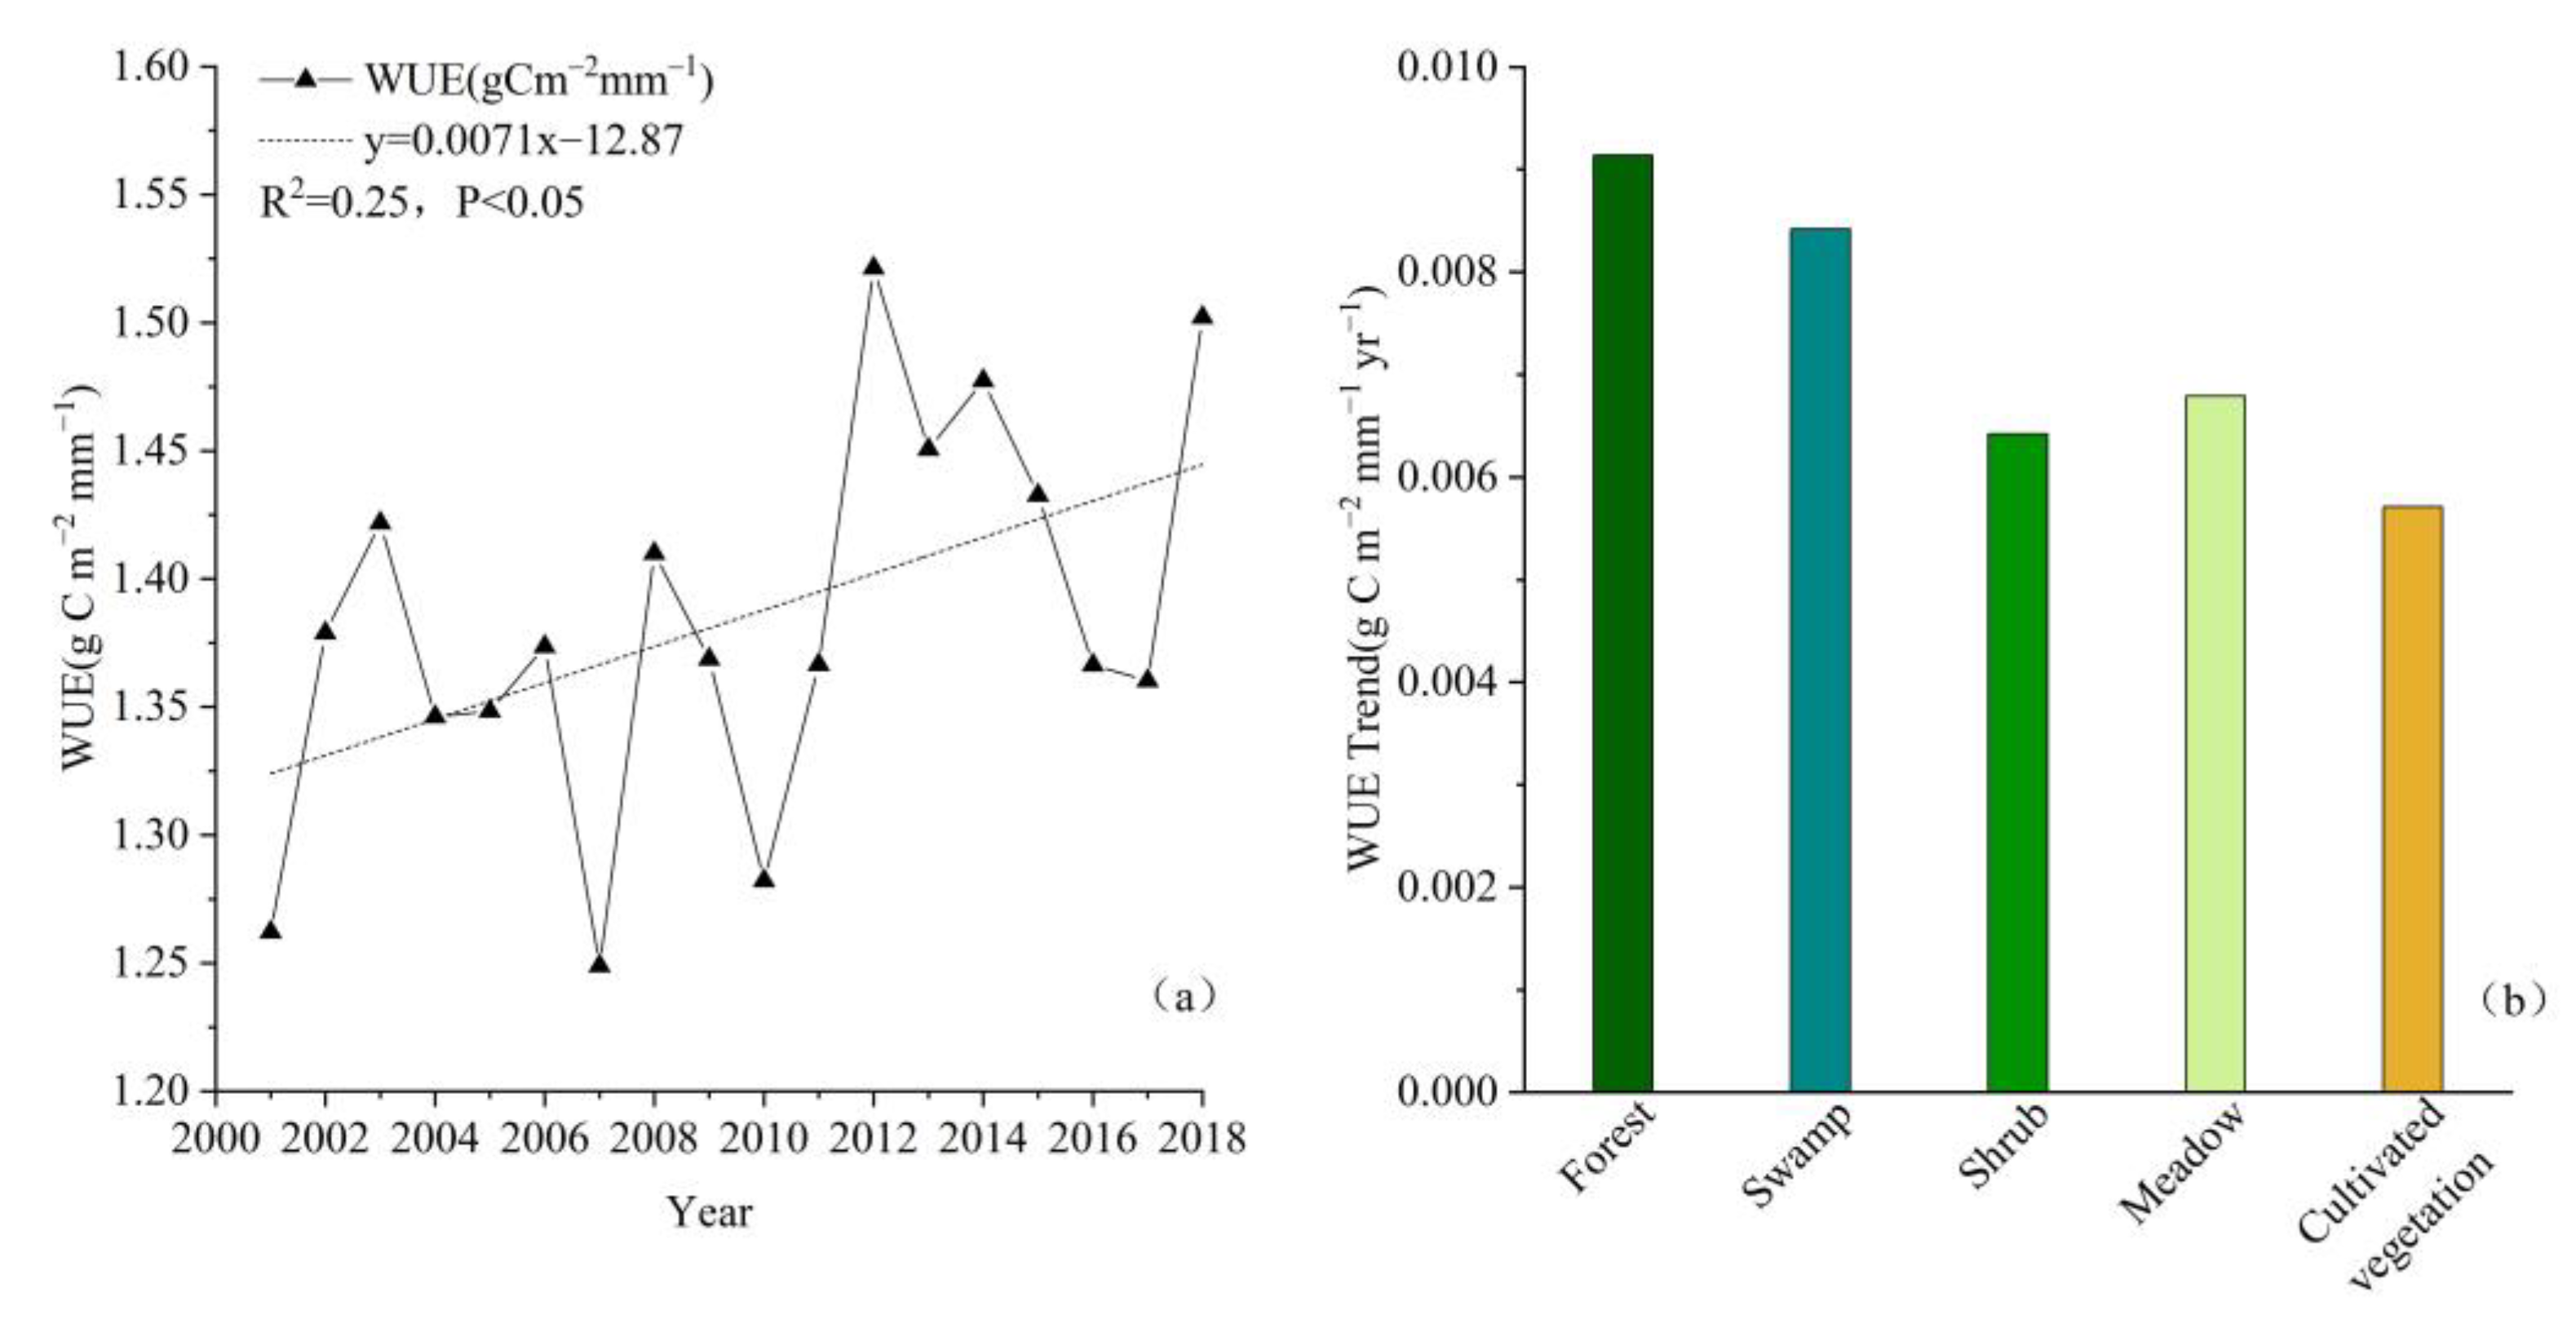
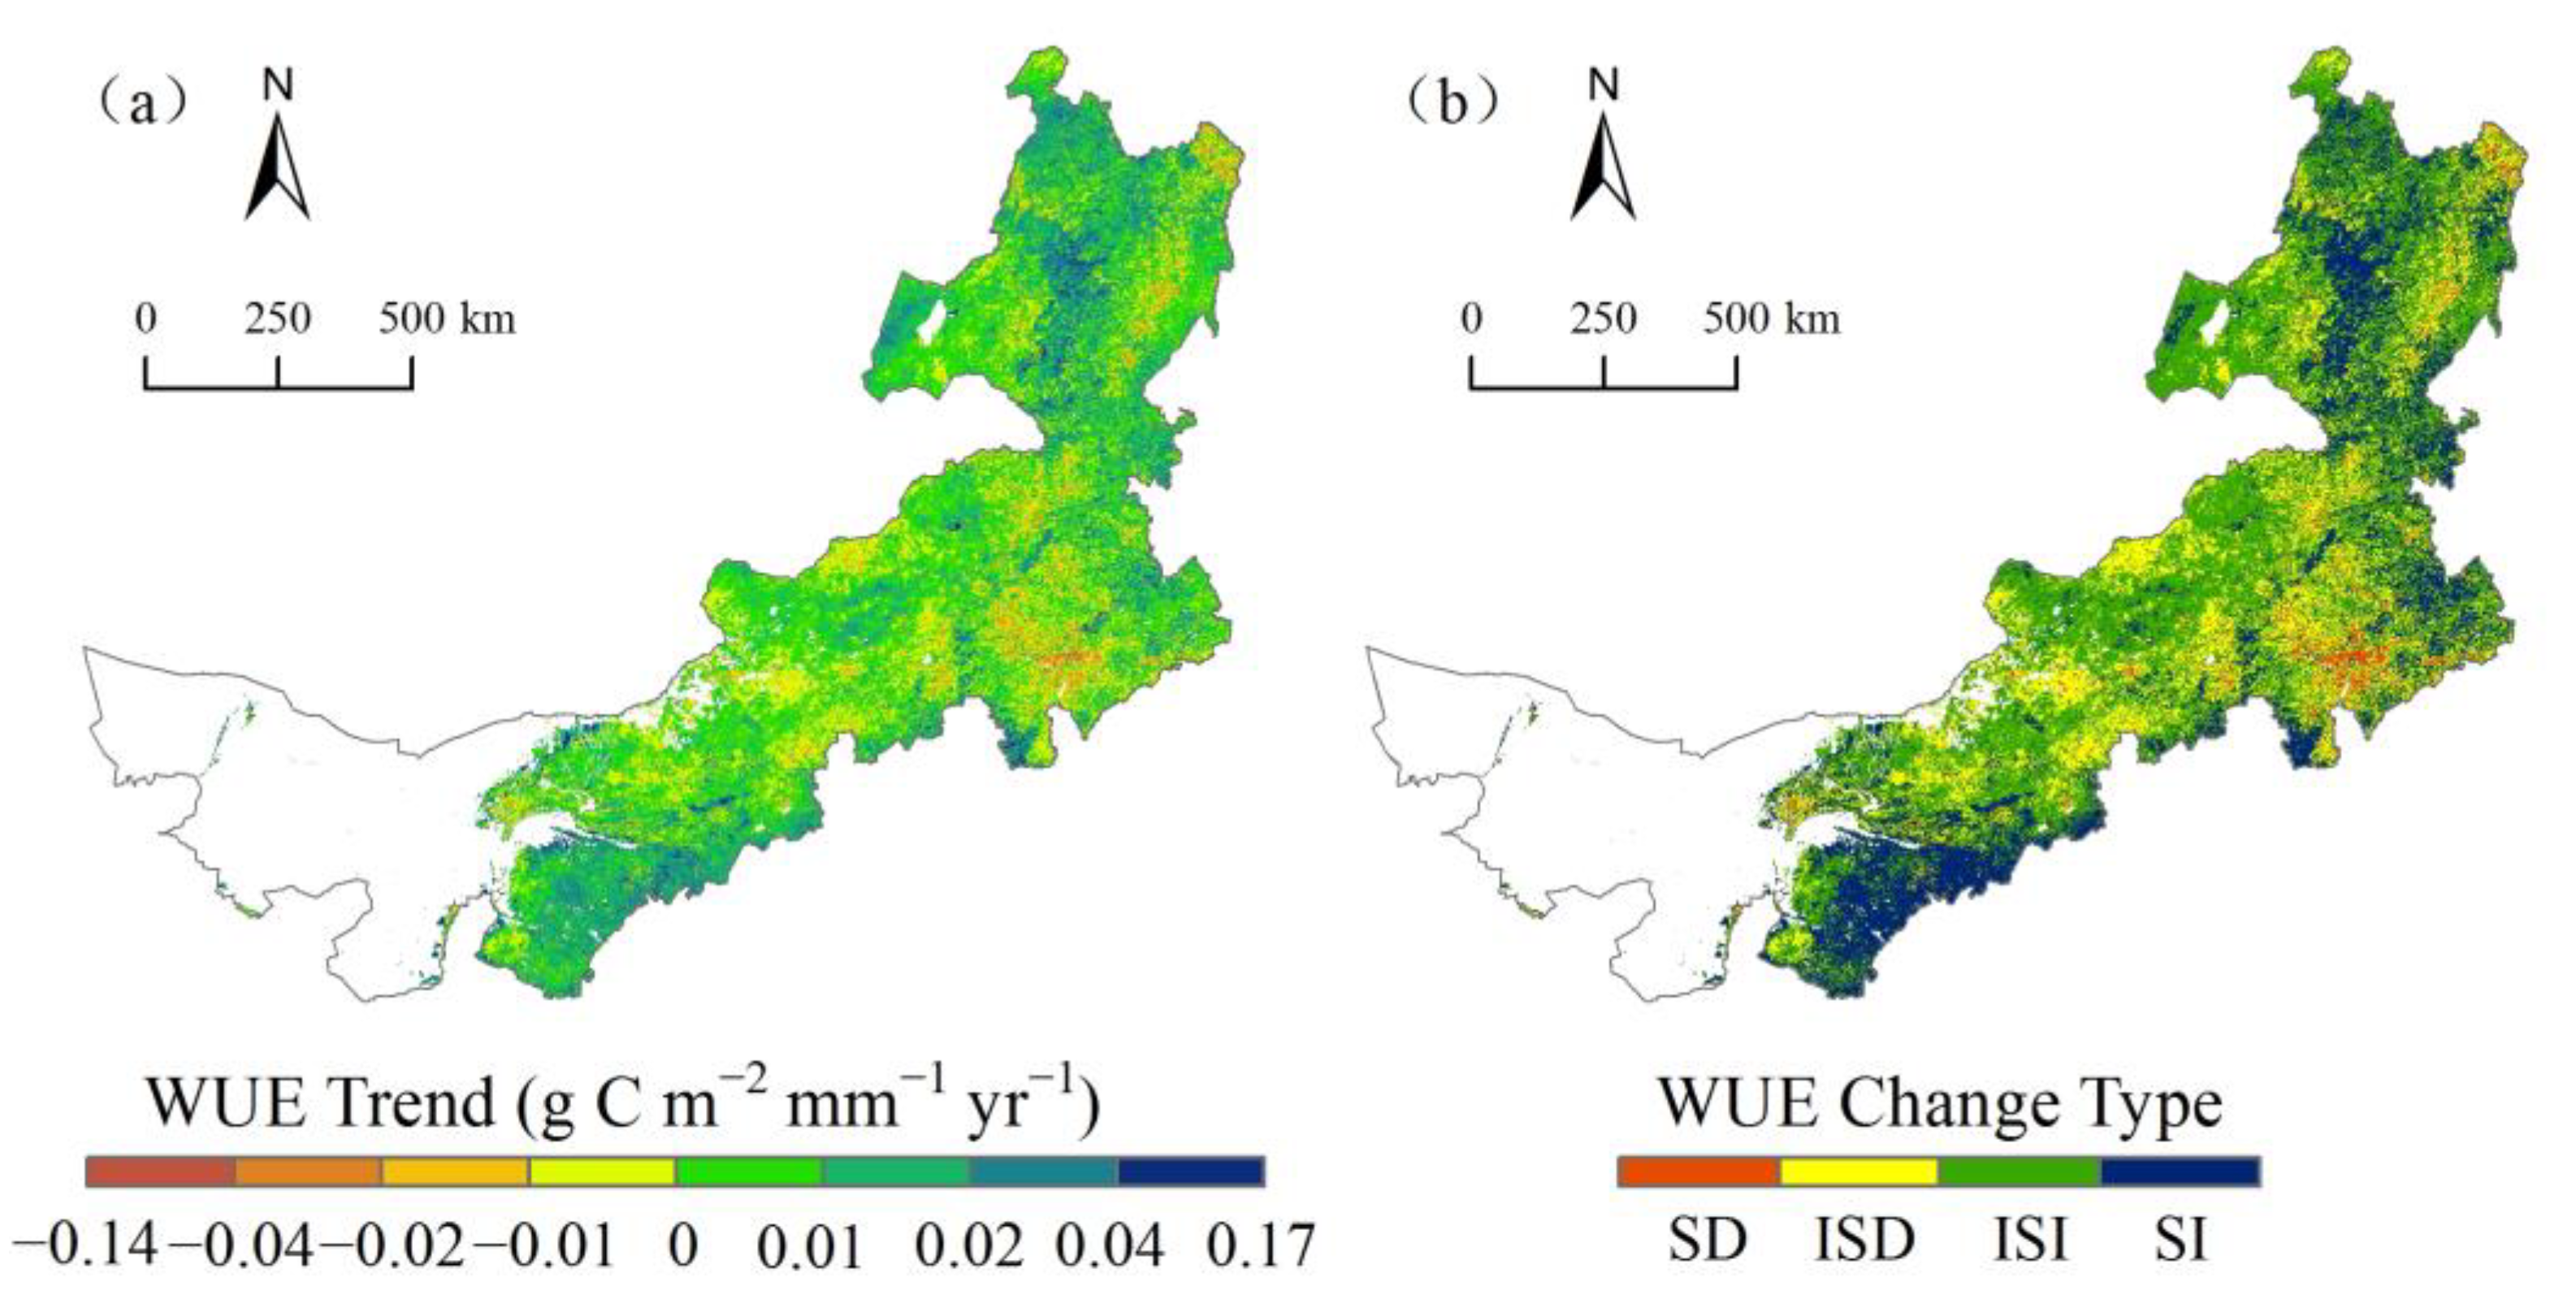
3.1.2. Variation Trend of WUE

The WUE in IM showed an increasing trend from 2001 to 2018 (Figure 4). The mean WUE of all the vegetation types in the study area increased significantly (p < 0.05), with an increasing rate of 0.0071 g C m−2 mm−1 yr−1. The minimum in WUE occurred in 2007 (1.24 g C m−2 mm−1), while the maximum occurred in 2012 (1.52 g C m−2 mm−1) (Figure 4a). Similarly, a rising trend was observed in the mean WUE of different vegetation types. Figure 4b shows the dependence of the WUE trend on the vegetation types in the following descending order: forest (0.0091 g C m−2 mm−1 yr−1), swamp (0.0084 g C m−2 mm−1 yr−1), meadow (0.0068 g C m−2 mm−1 yr−1), shrub (0.0064 g C m−2 mm−1 yr−1), and cultivated vegetation (0.0057 g C m−2 mm−1 yr−1).
Spatially, the time rate of the mean WUE varied between −0.14~0.17 g C m−2 mm−1 yr−1 (Figure 5a). Areas with increasing WUE accounted for about 74.14% of the study area, mainly in the southeast and northeast regions. Areas with a decreasing WUE accounted for about 25.86%, mainly in Baotou, southwest Xilingol League, middle Chifeng, west Hinggan League and east Hulunbuir. According to the WUE trend and F-test results, the variation trend of the WUE was divided into four classes according to the significance level of p < 0.05: significant increase, insignificant increase, significant decrease and insignificant decrease (Figure 5b). The results showed that 28.08% of the total area passed through the significance test. Specifically, areas with significant increases in WUE accounted for 24.47% of the study area, mainly in Erdos and Hohhot in the southwest, southwest Chifeng, north Tongliao, east Hinggan League, middle and north Hulunbuir, and the vegetation types were mainly meadow, forest and cultivated vegetation. Areas with significant decreases in WUE accounted for 3.61%, mainly in meadows in the middle Chifeng and forests in northeast Hulunbuir. Areas with insignificant increases and insignificant decreases in WUE accounted for 49.67% and 22.25%, respectively.

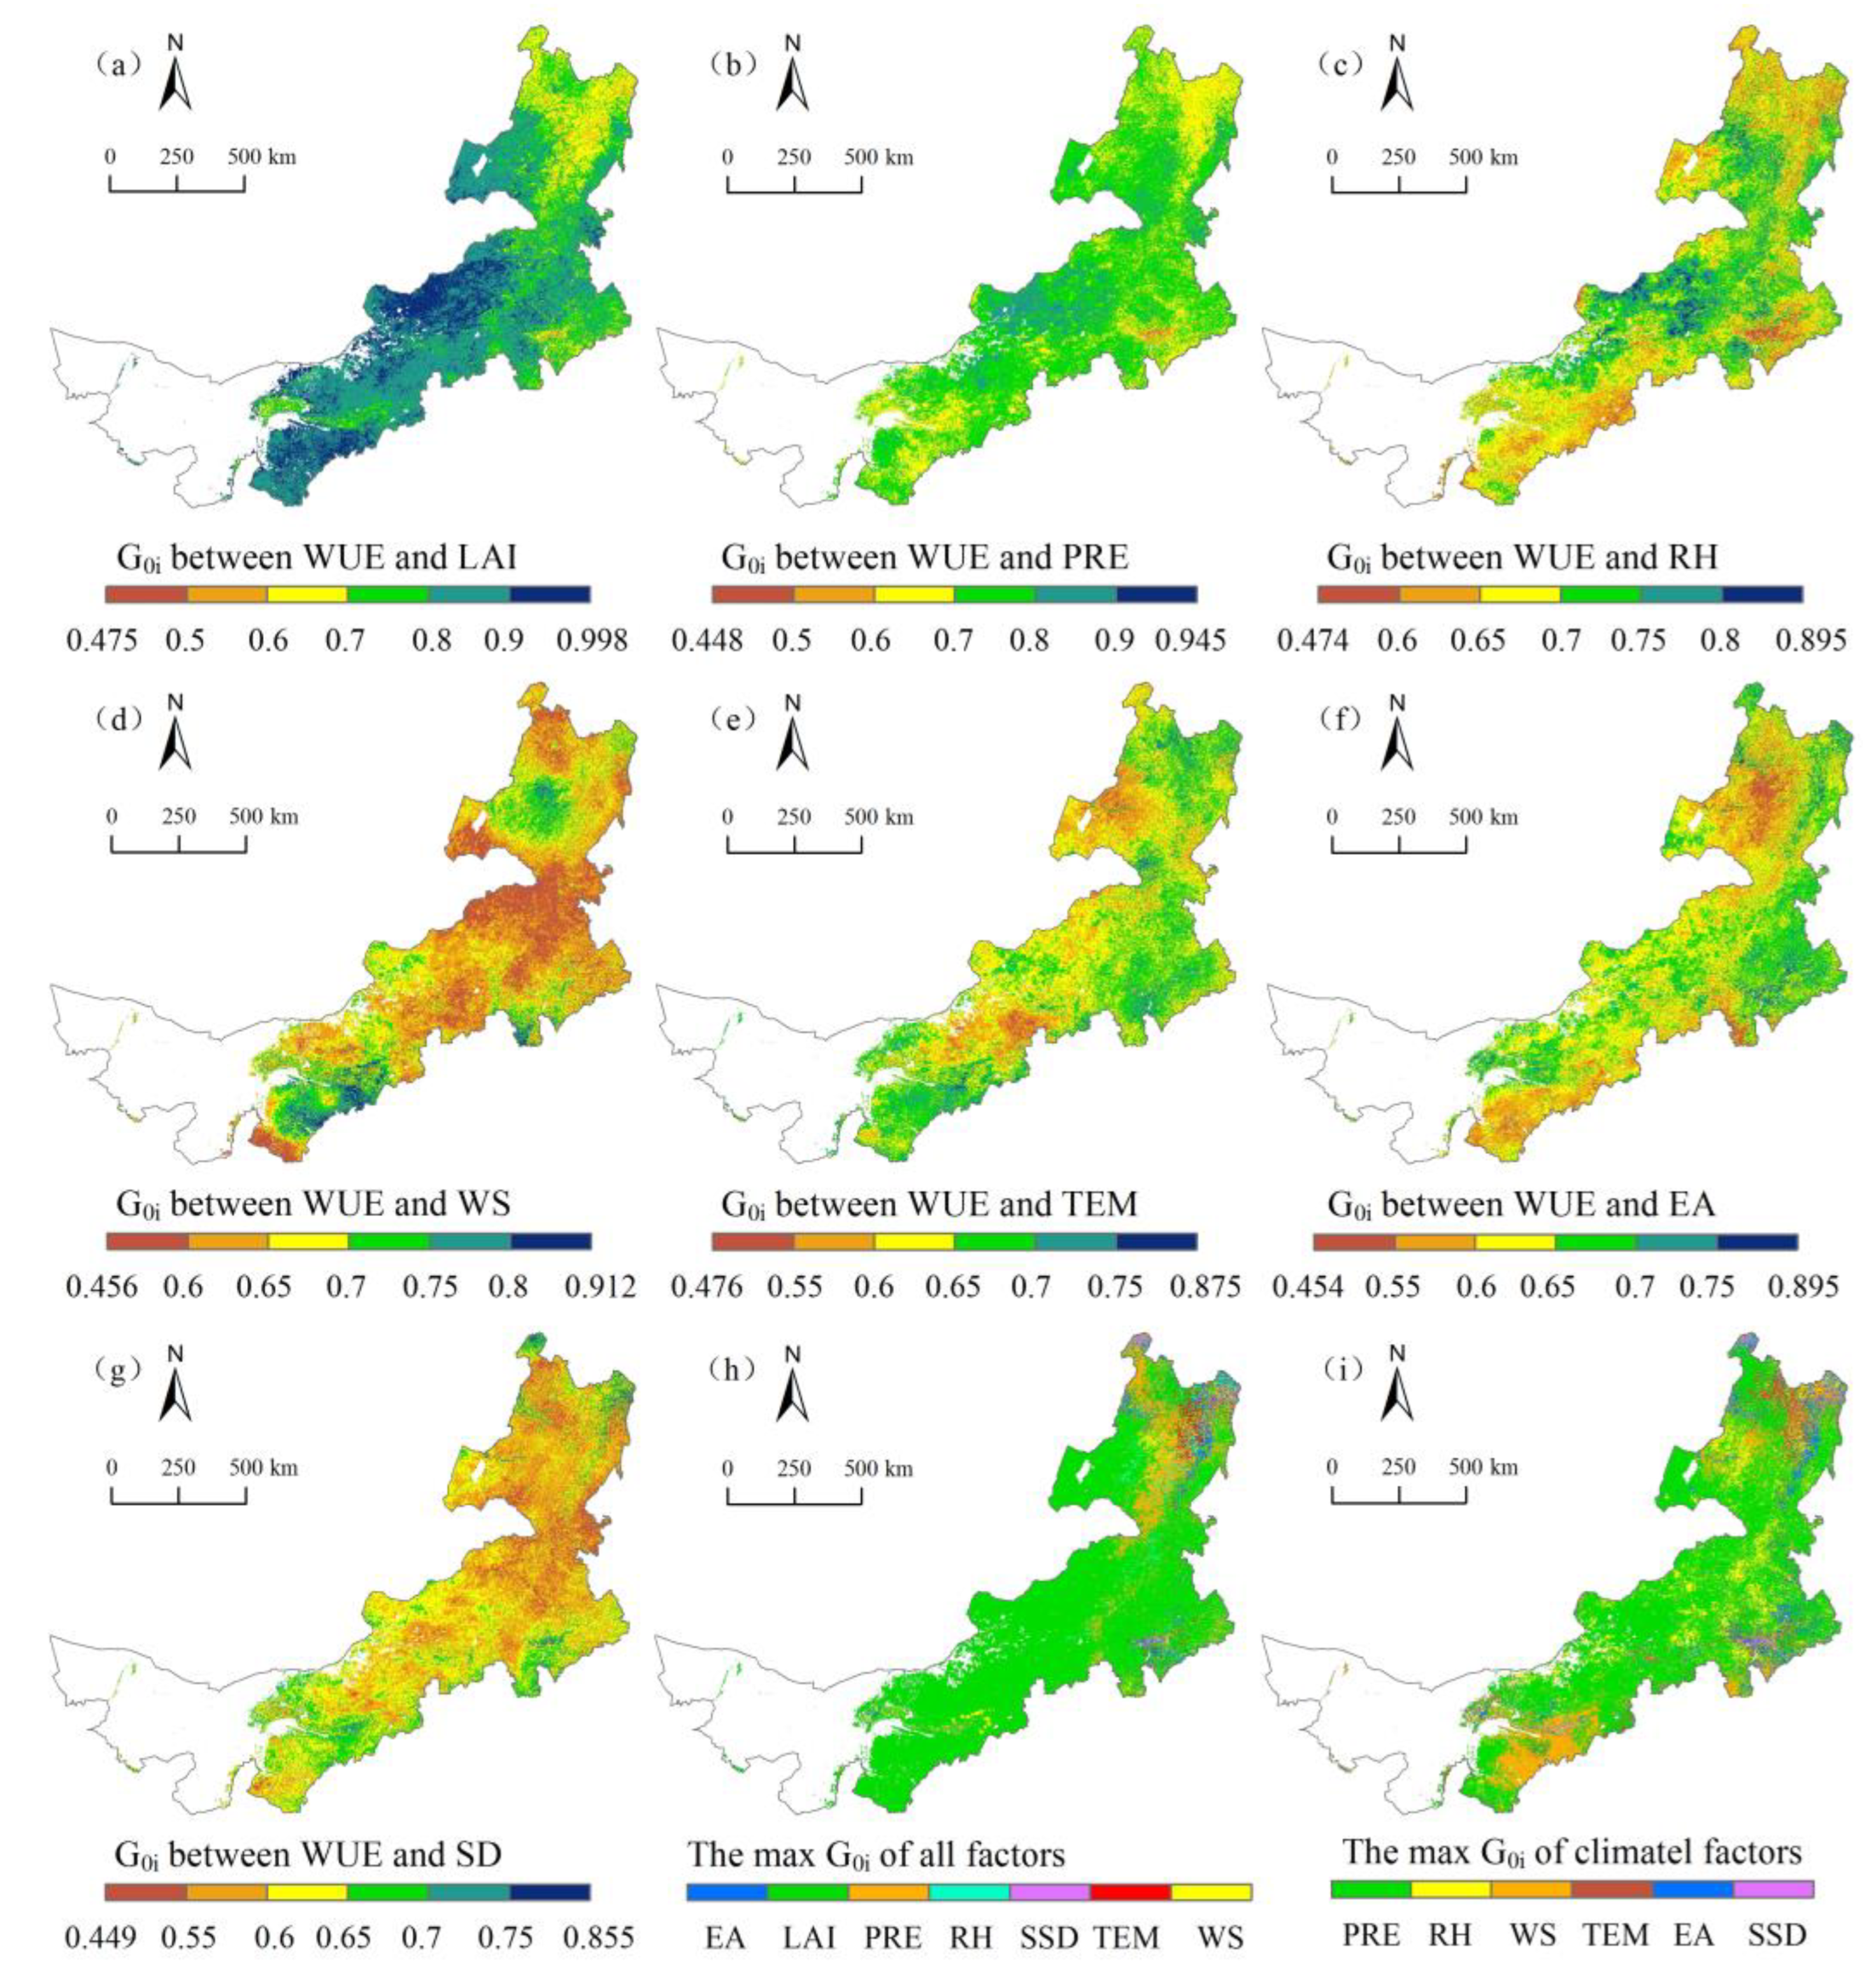
3.2. Effects of LAI and Climatic Factors on WUE

The study area was divided into high-correlation (G0i > 0.7) and low-correlation (G0i < 0.7) areas according to threshold (0.7) of the grey relational degree between the WUE and the influencing factors [37]. Generally speaking, there was significant regional differences in the grey relational degrees between the WUE and the influencing factors (Figure 6). The grey relational degree between the WUE and LAI was between 0.475~0.998, averaging 0.816 (Figure 6a). The high-correlation areas accounted for 85.87% of the study area, and meadow, shrub and cultivated vegetation were major vegetation types with a mean LAI of about 0.6. The grey relational degree between the WUE and LAI in Erdos and middle Xilingol League was higher than 0.9. The low-correlation areas accounted for 14.13%, mainly including cultivated vegetation in south Bayannur, meadow in southeast Chifeng and forest and swamp in central Hulunbuir with a mean LAI of over 1.5. Areas with a large LAI had a low grey relational degree between the WUE and LAI. These areas often had high precipitation or were mainly irrigated agricultural areas, indicating a weak influence of LAI on the WUE under sufficient water content. The values of the grey relational degree between WUE and the following climate factors were as follows in decreasing order: precipitation (0.730), relative humidity (0.689), wind speed (0.649), temperature (0.640), water vapor pressure (0.634), and sunshine duration (0.606). The areal proportions of high correlation between the WUE and the climate factors in descending order were: precipitation (70.72%), relative humidity (41.25%), wind speed (18.76%), temperature (9.51%), water vapor pressure (8.61%), and sunshine duration (3.05%). The areas of high correlation between the WUE and precipitation were concentrated in east Bayannur, north Baotou, north Ulanqab, Xilingol League and west Hulunbuir (Figure 6b), while those of low correlation were in southeast Chifeng, northeast Hulunbuir, south Erdos and south Bayannur. The grey relational degree between the WUE and precipitation in meadow in the southeast Chifeng was relatively low. The areas of high correlation between the WUE and relative humidity were mainly concentrated in north Baotou, north Ulanqab, central Xilingol League, north Chifeng, Hinggan League and southwest Hulunbuir (Figure 6c), while those of low correlation were in southwest Erdos, Hohhot, south Ulanqab, south Tongliao as well as west and north Hulunbuir. The areas of high correlation between the WUE and wind speed were mainly distributed in Erdos, Hohhot and central Hulunbuir, with some areas scattered in northwest Xilingol League and south Chifeng (Figure 6d). The areas of high correlation between the WUE and temperature were in north Hulunbuir, south Chifeng and east Erdos (Figure 6e). The areas of high correlation between the WUE and water vapor pressure were in east Chifeng and central Tongliao (Figure 6f). The areas of high correlation between the WUE and sunshine duration were only scattered in west Hohhot, southeast Chifeng and north Hulunbuir (Figure 6g). After the comprehensive comparison of the grey relational degree between the WUE and all the factors (Figure 6h), LAI was the most strongly correlated with WUE in about 78.54% of the study area. The proportions of areas where precipitation, relative humidity, water vapor pressure, wind speed, temperature and sunshine duration were most strongly correlated with WUE were 10.23%, 2.99%, 2.74%, 2.56%, 2.13% and 0.92%, respectively. Precipitation was the most strongly correlated factor with WUE in the central and north Hulunbuir, as temperature was in the northeast Hulunbuir. According to the statistics on the grey relational degree between the WUE and any of the climate factors at the same place, the areas where precipitation, relative humidity, wind speed, temperature, water vapor pressure and sunshine duration were the most strongly correlated climate factors with WUE accounted for 62.41%, 12.99%, 11.52%, 5.67%, 5.61% and 1.79% of the study area, respectively (Figure 6i). Relative humidity was the most strongly correlated climate factor with WUE in north Baotou, west Xilingol League, east Hinggan League, and north Chifeng. Wind speed was the most strongly correlated climate factor with WUE in Erdos, Hohhot, south Chifeng and central Hulunbuir.
Among all the vegetation types, meadow showed the highest grey relational degree between WUE and LAI (0.852), which was significantly higher than those of forest (0.724) and swamp (0.711) (Table 1). The correlation of the WUE with precipitation was next to that with LAI in all the vegetation types. The grey relational degree between the WUE and precipitation was relatively high in meadow and shrub, but it was the lowest in swamp; that between the WUE and relative humidity was the highest in meadow, but the lowest in swamp. The grey relational degrees of the WUE of all the vegetation types with temperature, wind speed, sunshine duration, and water vapor pressure were lower than 0.66. Sunshine duration was the least correlated with WUE in all the vegetation types. Temperature was more strongly correlated with the WUE of forest and shrub than wind speed. However, opposite phenomena were observed in meadow and cultivated land. To summarize, the grey relational degrees of the WUE of all the vegetation types, except swamp with LAI and precipitation, were higher than 0.7, showing strong correlations. In other words, LAI and precipitation were strongly correlated with WUE and they were more important to WUE than other factors, followed by relative humidity and wind speed. Temperature, water vapor pressure and sunshine duration were less important to WUE.

3.3. Contributions of Changes in Important Influencing Factors to WUE Trend

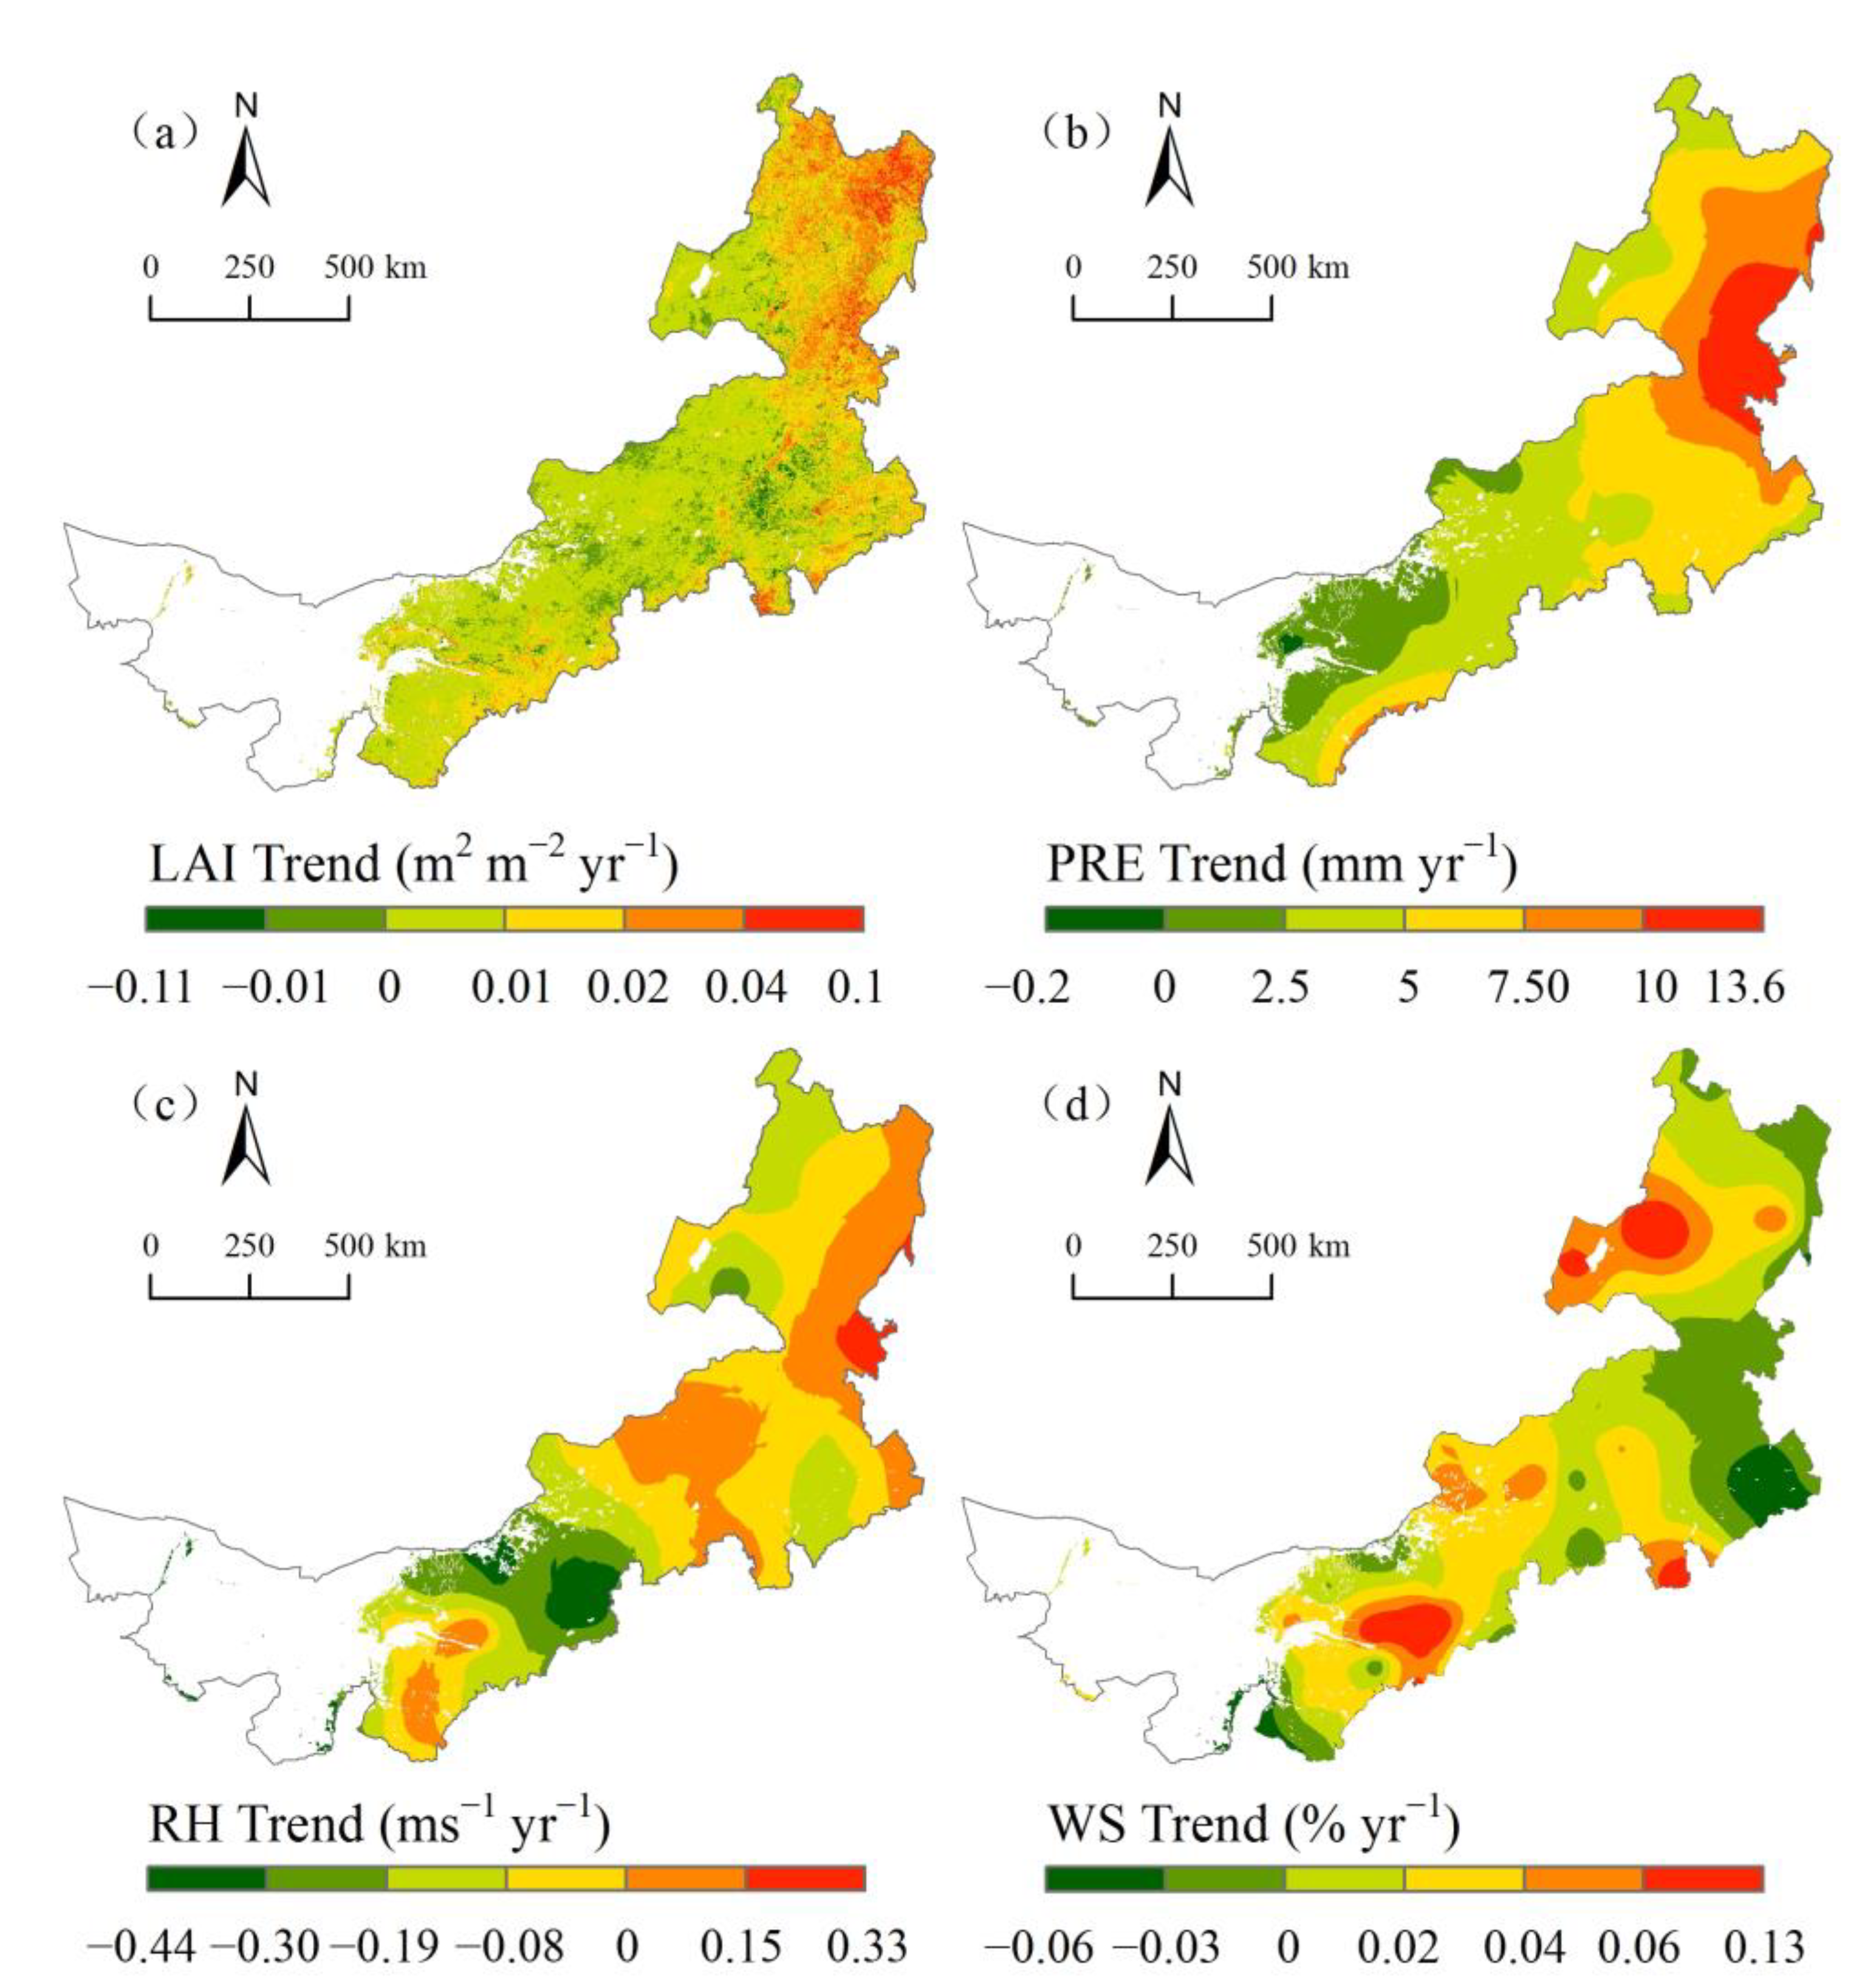
3.3.1. Variation Trend of Important Influencing Factors

According to the grey relational analysis results of WUE with LAI and climatic factors, LAI, precipitation, relative humidity, and wind speed were chosen for the ridge-regression analysis with WUE by combining the biological and physical significance of the factors. The contributions of the changes in the influencing factors to the variation trend of WUE were calculated.
The spatial distributions of the annual variation trend of the influencing factors are shown in Figure 7. The variation trend of LAI from 2001 to 2018 was between −0.11~0.10 m2 m−2 yr−1 (Figure 7a). Areas with increasing or decreasing LAI accounted for 89.76% and 10.24%, respectively. Moreover, areas with a significant increase in LAI accounted for 45.66%. The variation trend of precipitation was −0.20~13.52 mm yr−1 (Figure 7b). Areas with significantly increasing precipitation accounted for 32.06%, concentrated in the east of the study area. The variation trend of relative humidity was −0.43~0.32% yr−1 (Figure 7c). There was a decreasing trend of relative humidity in 71.51% of the study area. Areas with significantly increasing or decreasing wind speed accounted for 51.17% and 10.94%, with a variation trend of −0.06~0.11 m s−1 yr−1 (Figure 7d).

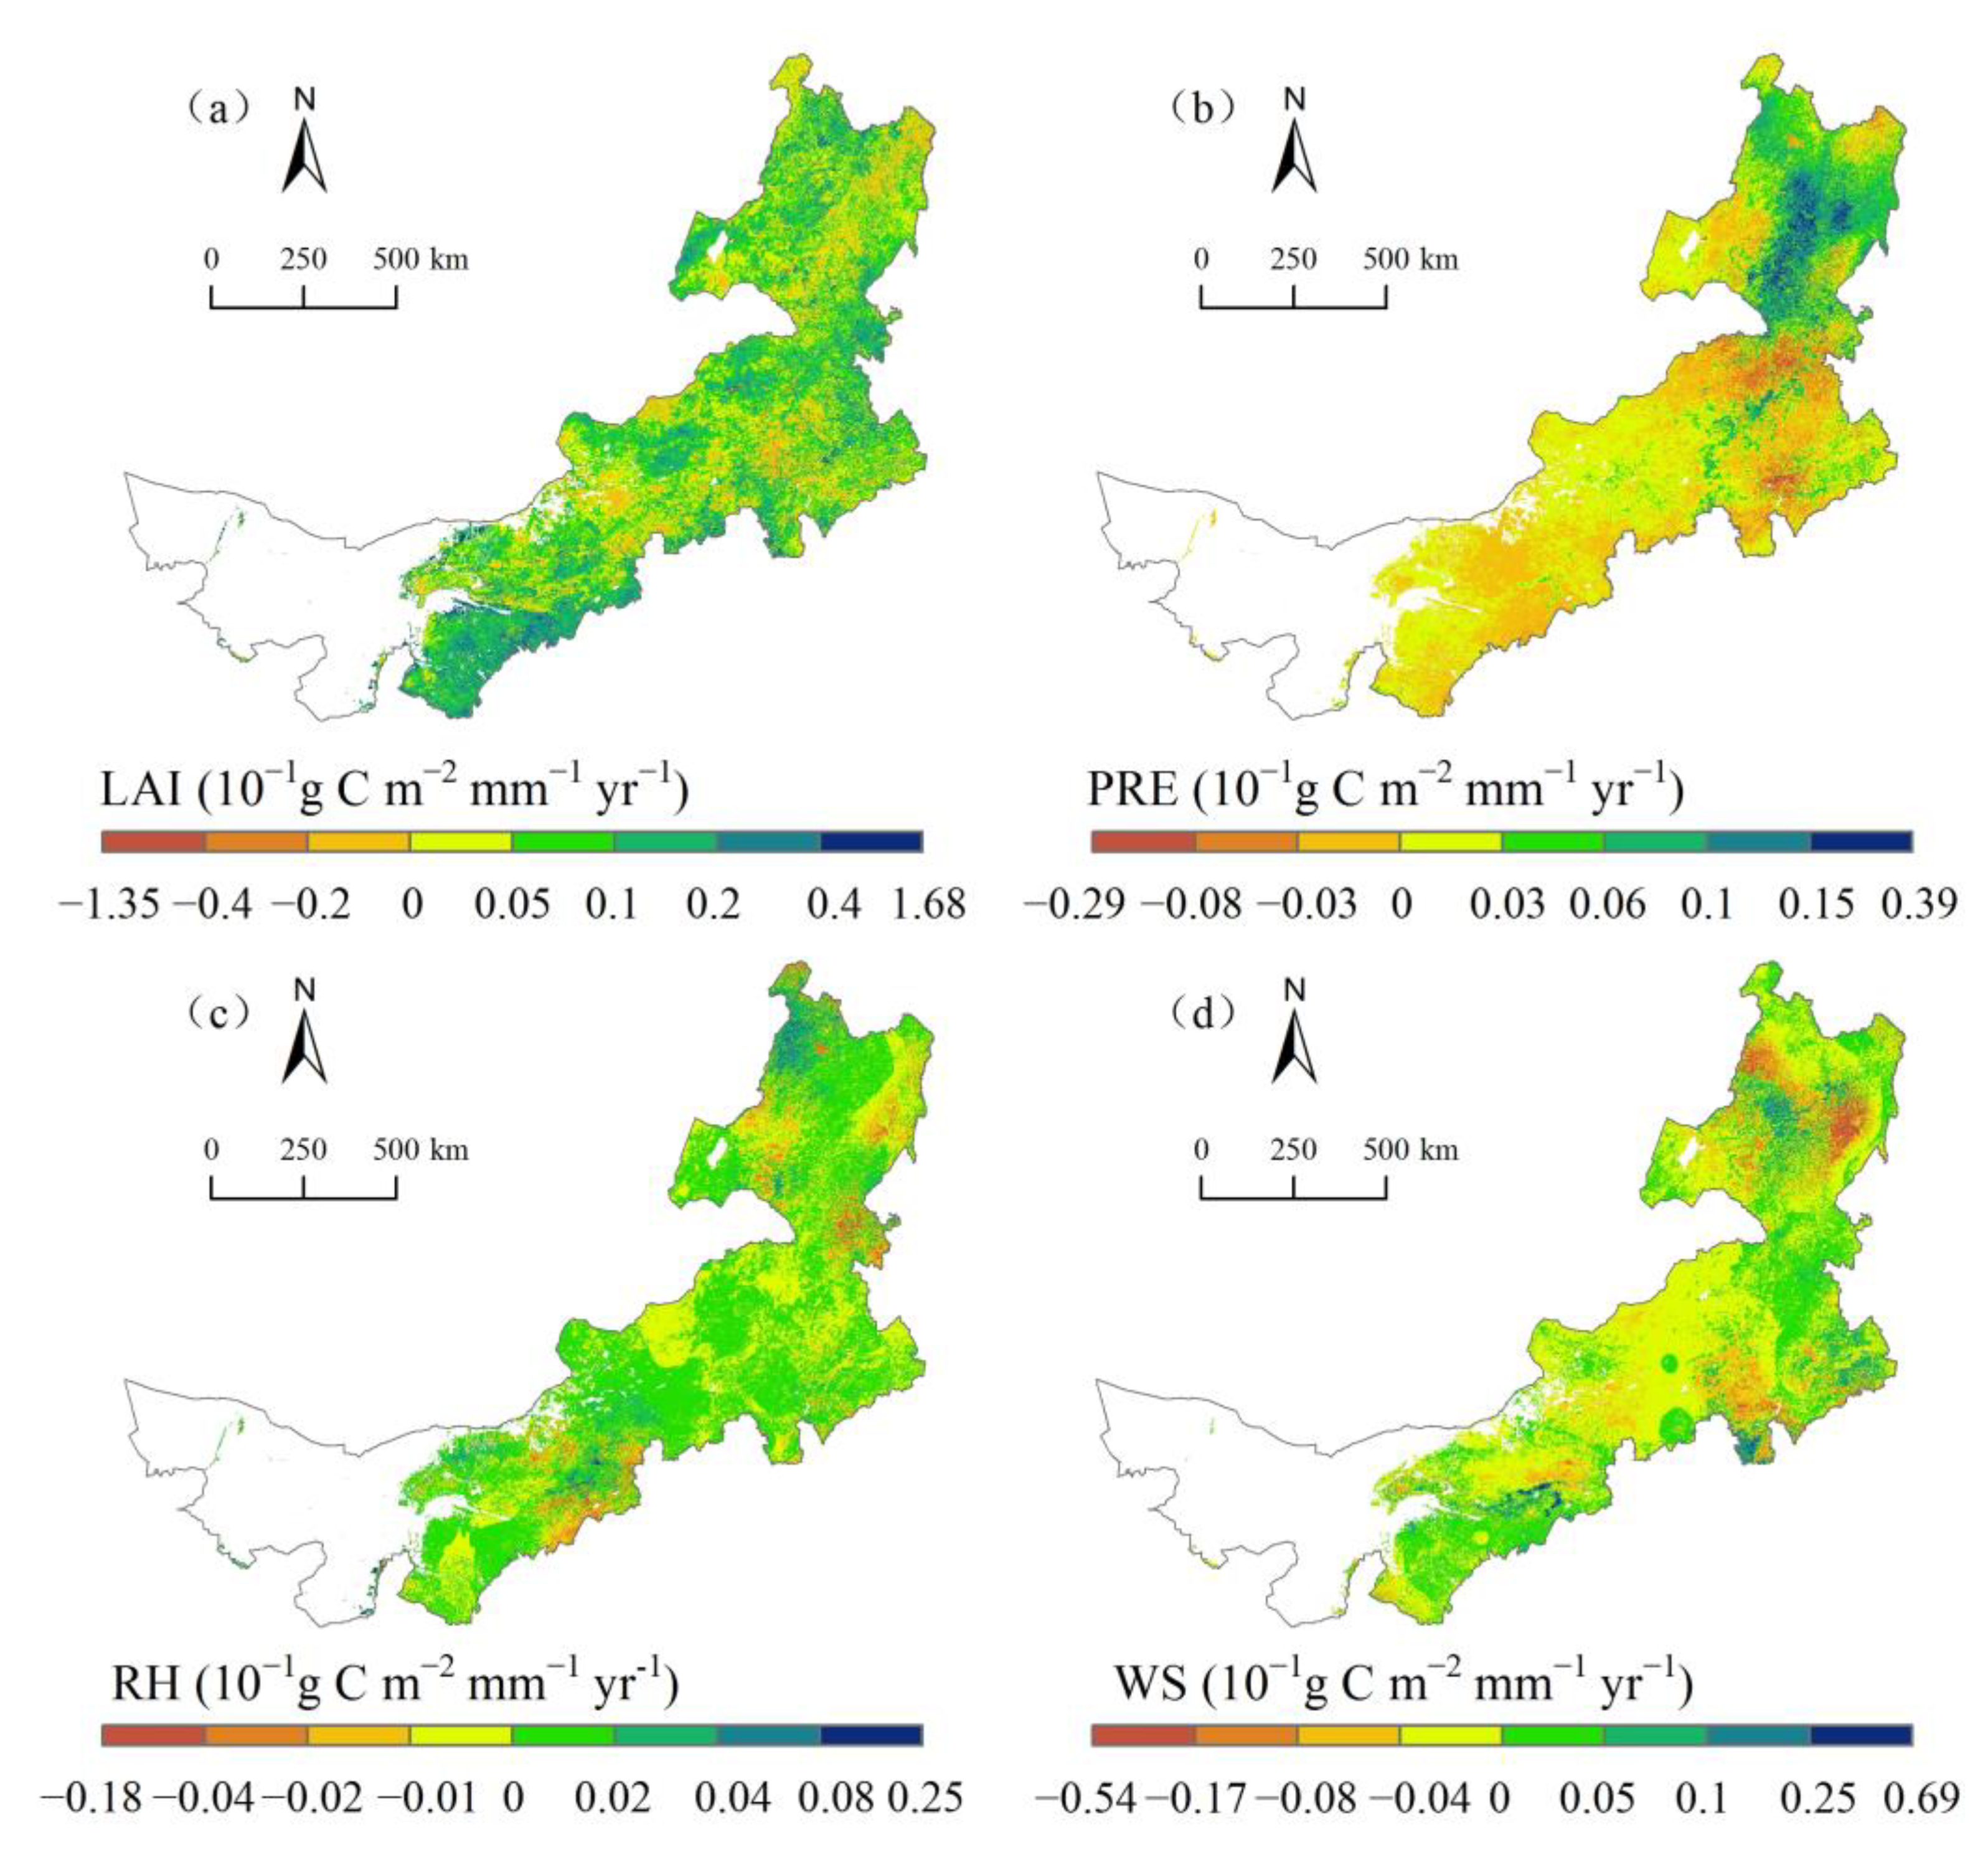
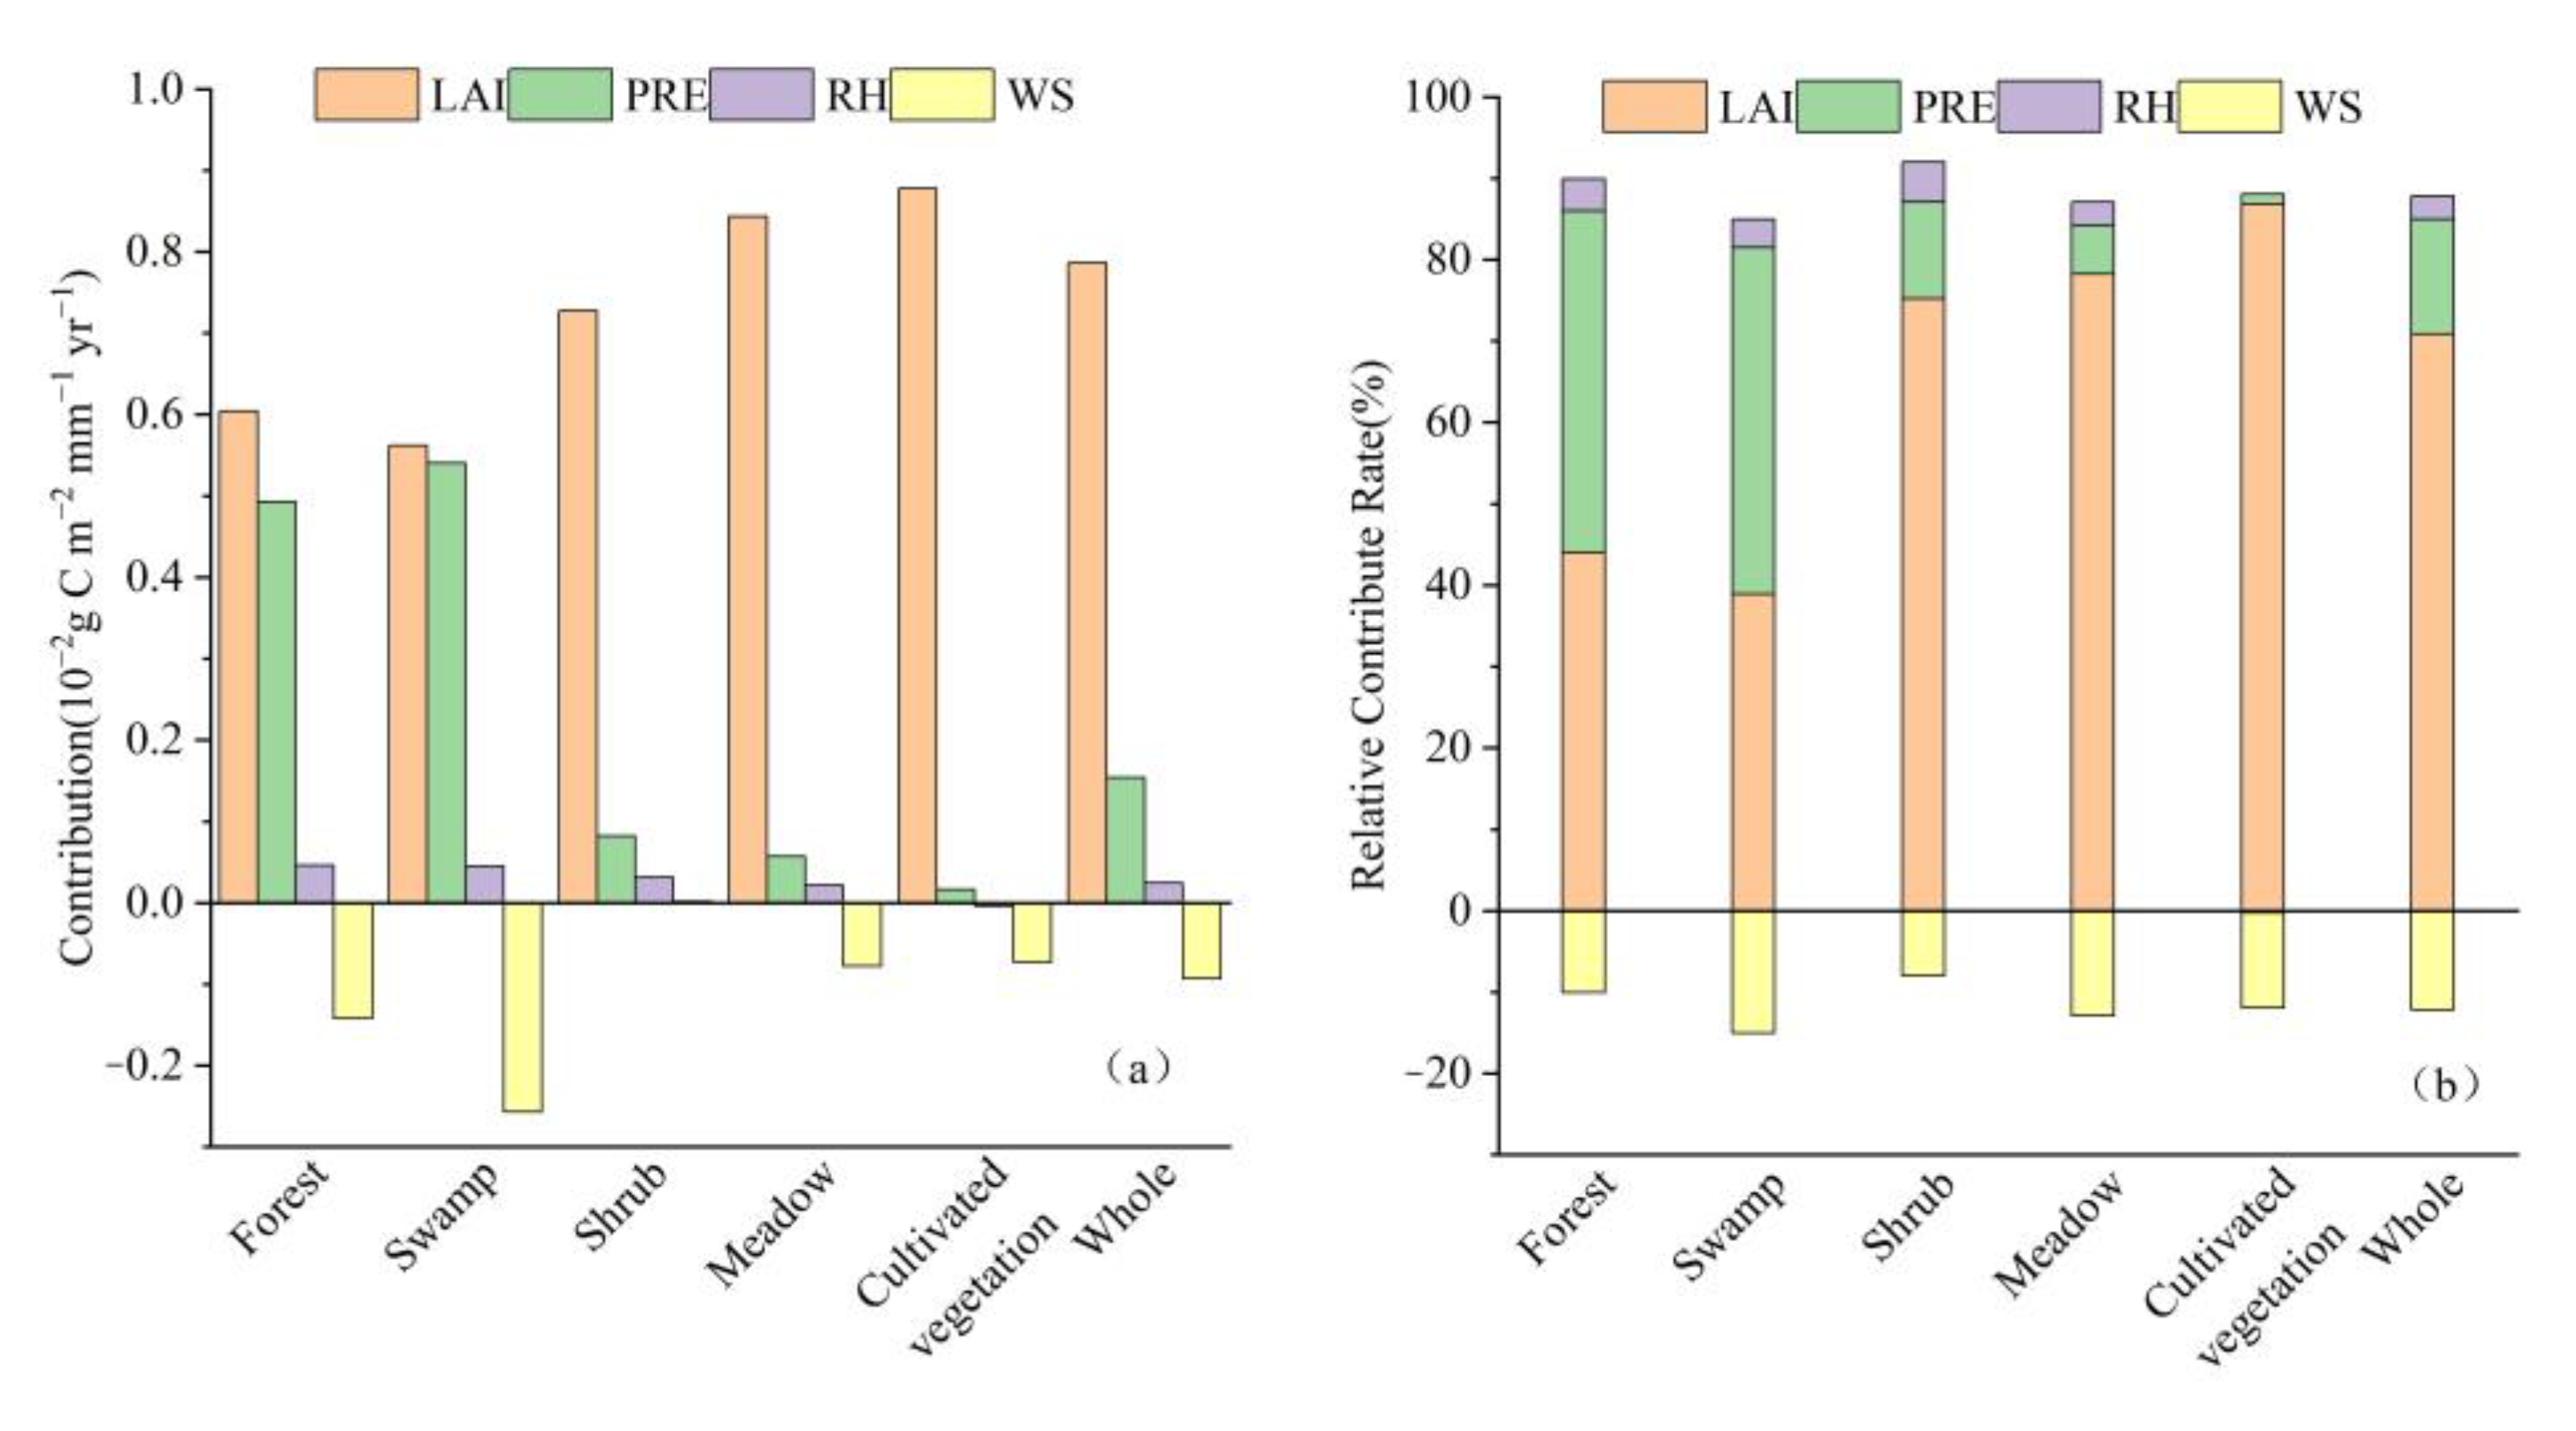
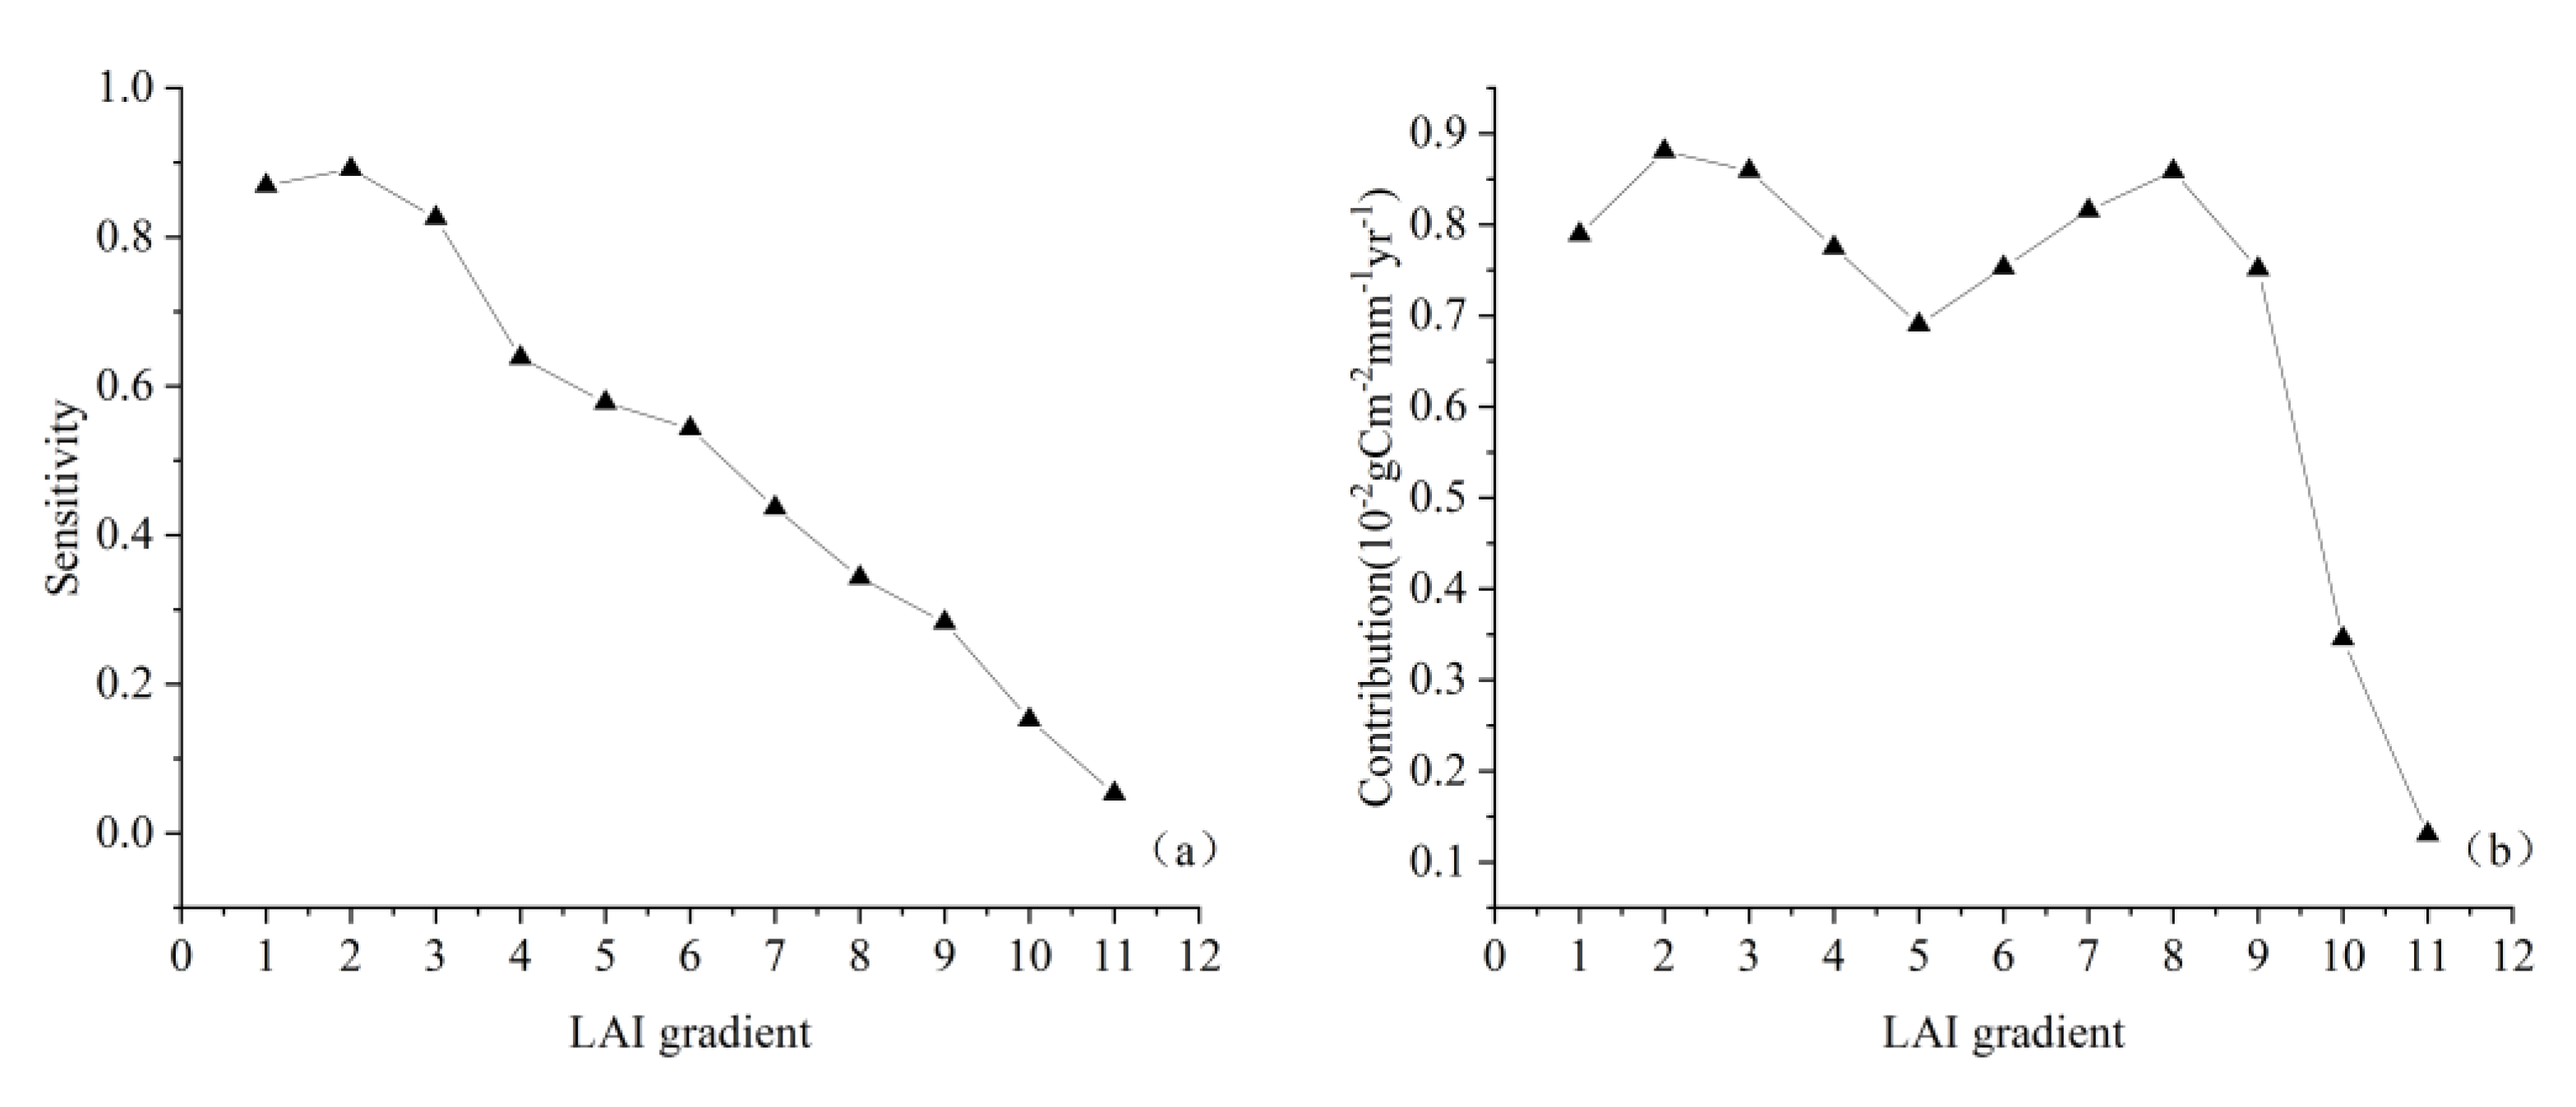
3.3.2. Contributions of Important Influencing Factors to WUE Trend

According to Equations (9) and (10), the contributions of LAI and climatic-factor variations to the WUE trend were calculated according to the normalized ridge-regression coefficient and the linear trend of the variables (Figure 8). The contribution of LAI changes to the WUE trend was between −0.135 and 0.168 g C m−2 mm−1 yr−1 (Figure 8a). Areas with positive and negative contributions accounted for 85.15% and 14.85% of the whole study area, respectively. LAI mainly had a positive effect on the WUE trend. There was an increasing trend of LAI in 85.03% of the study area, and LAI had positive effects on the WUE trend (Table 2). The regions of high contributions were mainly in Erdos, Hohhot, south Ulanqab, central Xilingol League, Hinggan League and west Hulunbuir, with contribution values over 0.008 g C m−2 mm−1 yr−1. There was a decreasing trend of LAI in only 9.86% of the study area, where LAI had a negative contribution to the WUE trend. These areas were mainly distributed in southwest Hulunbuir, north Chifeng and southwest Xilingol League.
The contribution of annual precipitation to the WUE trend was −0.029~0.039 g C m−2 mm−1 yr−1 (Figure 8b). There was an increasing trend of precipitation in 62.84% of the study area, where there was positive contribution to the WUE trend (Table 2). High-contribution areas were concentrated in central Hulunbuir, indicating that increasing precipitation might have had positive effects on the local WUE variation. Increasing precipitation had a negative contribution to the WUE in 36.95% of the study area, mainly in Baotou, Hohhot, northeast Xilingol League, south Hinggan League along Chifeng, as well as west and northeast Hulunbuir. The areas where there were positive and negative effects of relative humidity on WUE accounted for 59.60% and 40.40%, respectively (Table 2). Relative humidity decreased in Bayannur, south Ulanqab, west Xilingol League and north Hulunbuir, which had a positive contribution to the WUE trend (Figure 8c). Increasing relative humidity had a negative contribution to the WUE trend in Hinggan League and east Hulunbuir. The contribution of wind speed was within 0.054~0.069 g C m−2 mm−1 yr−1 (Figure 8d). Wind speed increased in central Hulunbuir and Erdos, and its contribution to the WUE trend was positive, accounting for 22.68% of the study area (Table 2). Areas where there was a negative contribution of wind speed to the WUE trend accounted for about 63.75% of the study. Increasing wind speed had a negative contribution to the WUE in Xilingol League and Erdos. The maximum negative contribution was observed in Hulunbuir.
The contributions of the changes in different influencing factors to the WUE trend for different vegetation types as well as the relative contribution rates are shown in Figure 9. The changes in LAI and precipitation had a positive contribution to the WUE trend of all the vegetation types (Figure 9a). In forest and swamp, LAI had a slightly greater contribution to the WUE variation than precipitation. In meadow, shrub and cultivated vegetation, LAI had a greater contribution than precipitation. The difference between the contributions of LAI and precipitation to the WUE trend of cultivated vegetation was the largest. Changes in relative humidity had a positive contribution to the WUE trend of forest, swamp, shrub and meadow, but they had a negative contribution to the WUE of cultivated vegetation. Wind speed had a greatly negative contribution to the WUE in all the vegetation types except for shrub. Regionally, LAI was the primary contributor to the WUE trend (0.008 g C m−2 mm−1 yr−1), followed by precipitation (0.002 g C m−2 mm−1 yr−1). The mean contribution of wind speed to the WUE trend of the study area was negative (−0.001 g C m−2 mm−1 yr−1).
For the whole region, LAI had the maximum relative contribution rate (44.57%) to the WUE trend (Figure 9b). The relative contribution rates of wind speed and precipitation to the WUE trend were −7.66% and 8.88%, respectively. The contribution rate of relative humidity was less than 5%. The relative contribution rate of LAI was relatively high in cultivated vegetation and meadow, but low in forest and swamp, similar with that of precipitation. The relative contribution rates of precipitation in forest and swamp were significantly higher than those in the other three vegetation types. Relative humidity had a limited contribution rate to all the vegetation types. The relative contribution rates of wind speed to the WUE trend of all the vegetation types were negative, especially in swamp.

4. Discussion

4.1. Spatial Heterogeneity of WUE

IM, spanning 19 degrees longitude from east to west, is located in the transition zone from a humid climate to semi-arid and arid climates. The interaction of climate, terrain and land coverage resulted in the zonal distribution of vegetation types [56]. In this study, there was a spatial distribution pattern of high WUE in the east but low in the west of IM, decreasing with decreasing precipitation from northeast to southwest and increasing with decreasing temperature from south to north (Figure 3). This was similar to the existing research results [5,26,41]. There were great differences in WUE among different vegetation types, which reflected differences in the carbon–water coupling of vegetation in different regions and under different climatic conditions. We found that the WUE was relatively high in forest and swamp in the study area, but relatively low in meadow. According to the definition and calculation formula, WUE is the product of the ratio between carbon assimilation and plant transpiration (GPP/T) as well as the ratio between the plant transpiration and gross evapotranspiration (T/ET) [3]. GPP/T mainly reflects the adaption of vegetation to environment, while T/ET represents redistribution of water in the physical and biological processes of an ecosystem [7,57], and its variation is mainly dominated by LAI [11]. The annual mean LAI in IM was between 0~2.64, which had a similar spatial pattern with WUE. This was similar to the result in the humid regions of China, where vegetation indices can explain more than 80% of the spatial variations in WUE [58]. In terms of LAI values in different vegetation types, swamp showed the highest, followed by forest, shrub, cultivated vegetation, and meadow, successively. Forest was the dominant vegetation in the east of study area. Under moisture conditions, a higher LAI resulted in stronger photosynthesis and a higher T/ET [3]. Due to the high canopy cover of forest, plant-transpiration-induced water losses and vegetation interception evaporation were intensified. However, it also intercepted more solar radiation and decreased soil evaporation, which could offset the increase in gross ET caused by plant-transpiration-induced water losses [7,11]. Additionally, the fractional vegetation coverage showed a linear growth with LAI when LAI was lower than 3 [59]. The high fractional vegetation coverage of forest in the northeast might weaken the runoff caused by precipitation, thus decreasing the nutrient loss in soil. Hence, forest can absorb groundwater and nutrients to support growth through the developed root system, finally resulting in a relatively higher WUE [60]. Although, there was sufficient water in the growing environment of swamp, which could lead to a higher ET. The ET process was restricted by the relatively lower temperature in northeastern IM [61]. Moreover, the relatively high WUE in northeastern IM may have been due to the high GPP value of swamp. In western IM, meadow was the dominant vegetation type, in which there was low precipitation and high soil evaporation, thus making water difficult to be fully used. In addition, the relatively high altitude restricted the growth of vegetation [12,16] in western IM, resulting in the low T/ET and WUE. The WUE of cultivated vegetation was higher than that of surrounding vegetation as there were sufficient nutrients in its growing environment, and water input from irrigation activities ensured effective plant growth [7].

4.2. Effects of LAI and Climate Change on WUE Variation

The contributions of changes in influencing factors to the WUE trend were determined by the variation degree of these factors and the sensitivity of the WUE to these changes. Previous studies have demonstrated that LAI, temperature, precipitation, wind speed, air pressure, relative humidity and sunshine duration can all influence the WUE trend [11,45,60]. In this study, grey relational analyses of WUE with LAI and six climate factors were carried out. According to the grey relational analysis results, LAI, precipitation, wind speed, and relative humidity were found to be the relatively important influencing factors to the WUE. They represented vegetation, water and evaporation conditions, respectively. LAI is closely related to photosynthesis of vegetation and plant transpiration, and it directly or indirectly influences the carbon–water exchange between vegetation and the atmosphere [62]. Studies based on eddy covariance flux sites demonstrated that LAI influenced the WUE strongly and it was the dominant factor that influenced seasonal and interannual changes in the WUE in meadow [3,63]. The current study showed that the grey relational degree between the WUE and LAI was the highest (Figure 6a, Table 1). Regionally, LAI variation was the dominant cause of WUE variation (Figure 9). It showed the highest contribution and relative contribution rate to the WUE variation. In the past decades, ecological restoration projects in northern China have expanded forest and meadow areas, bringing about a significant growth of LAI [29,64]. On one hand, increasing LAI is conducive to plant absorption of CO2 and the production of more biomass. On the other hand, LAI controls the relative magnitude of plant transpiration and indirectly impacts soil evaporation. Increases in LAI lead to increases in T/ET, thus resulting in the increase in WUE. Nevertheless, Kato et al. [65] and Liu et al. [33] found a threshold in the positive effect of LAI on the WUE. When LAI was lower than this threshold, the WUE quickly increased with the increase in LAI; otherwise, the WUE slowly increased and even decreased. In this study, we divided LAI into increments of 0.2 (Figure 10). According to the statistics on the sensitivity coefficient of the WUE to LAI under different gradients as well as the contribution of LAI to the WUE variation, we found that with the increase in LAI, the sensitivity of the WUE to LAI decreased (Figure 10a), and the contribution curve of LAI showed double peaks occurring in ranges of 0.2~0.4 and 1.4~1.6, respectively (Figure 10b). As LAI increased from 0 to 1.6, the contribution of LAI changes to the WUE first increased and then decreased, and finally increased. The overall variation trend was not significant, but the contribution was relatively high. When LAI > 1.6, its contribution to WUE quickly decreased, leading to less of a contribution by LAI to the WUE trend of forest and swamp than other vegetation types (Figure 9a).
By contrast, climate change had a smaller contribution to the WUE variation than LAI. The influences of climate factors on the WUE were related to the vegetation type or water conditions [15]. In semi-arid and arid regions, increasing precipitation is conducive to maintaining vegetation growth and the increase in WUE [32]. This study recognized a rising trend of precipitation in IM, while the areas that had positive and negative effects of precipitation variation on the WUE trend accounted for 62.77% and 36.94% of the study areas (Table 2), respectively. This agrees with the conclusions by Chang et al. [60]. In arid regions, changes in precipitation can lead to changes in the community structure of vegetation, dominant species and distribution [12]. Vegetation must change its structure and physiological function to adapt to the arid environment, and its water-use mode is different from that in other regions. In these regions, soil evaporation is intensified by excessive precipitation since precipitation may be asynchronous with water needs for vegetation growth. Zhang et al. [66] and Sun et al. [67] found that increasing precipitation might facilitate the growth of ET under extremely arid conditions, but it slightly influenced GPP, consequently decreasing the WUE. It is interesting that increasing precipitation can result in a relatively higher contribution to the WUE trend of forest and swamp in northeast IM. This might be because the WUE and precipitation formed a positive correlation under the background of low temperature, which limits ET. Meanwhile, increasing precipitation may increase soil volumetric water content and thereby facilitate the photosynthesis-induced carbon assimilation of vegetation, finally increasing WUE [68].
Soil erosion caused by wind is one of the major environmental issues in IM. Increasing wind speed may facilitate the increase in ET and extreme wind erosion may blow away organics and nutrients in soils, thereby deteriorating soil fertility and influencing vegetation growth [21]. Our study found that wind speed had the largest negative effects on the WUE. Increasing wind speed had a negative contribution to the WUE in 52.19% of the study area (Table 2). In arid regions, increasing relative humidity might increase ET [69], and we found that a decrease in relative humidity had a positive contribution to the increase in WUE. In summary, the influences of the changes in different factors on the WUE variation can reflect different responses of an ecosystem to climate change to some extent.
In addition to LAI and climate factors, other factors such as elevated atmospheric CO2 concentration can have an impact on the WUE variation. Elevated CO2 can influence the changes in GPP and ET, thereby influencing the WUE [70,71,72]. Previous studies found that increased CO2 dominated the increased global WUE over the last three decades [73,74]. In the southern region of China, CO2 is the driving factor with the highest contribution rate over four seasons in a year [67]. However, the carbon balance of ecosystems in semi-arid regions is strongly influenced by climate change [75]. Xie et al. [27] found that the increase in GPP and ET in the Mongolia–Xinjiang sub-region is attributed to the increase in precipitation. Yang et al. [19] found the contribution of increased atmospheric CO2 on the WUE was limited in northwest China. Zhang et al. [76] showed that the WUE variations in most of the tropical forests were dominated by the increased CO2, while those in the semi-arid regions and boreal forests were dominated by the LAI or climate change. Thus, the increased CO2 may only have a weak impact on the WUE variation, relative to that of vegetation or climate factors in our study region.

4.3. Uncertainty Analysis and Future Improvements

The spatiotemporal characteristics of the WUE in IM in the last 18 years as well as the corresponding influencing factors were analyzed in this study. We found that LAI played a dominant role in the WUE variation. However, there are still some limitations and uncertainties. Firstly, the WUE was calculated according to GPP/ET; the accuracy of GPP and ET data can lead to uncertainties in estimation of WUE. Although the availability of the data was verified through flux stations, there are still some uncertainties in data verification due to limitation in station number and distribution. Secondly, the annual variables at stations were interpolated. The spatial distribution of stations in the study area and the interpolation method may influence the results to some extent. Finally, other factors, such as human activities, nitrogen sedimentation, and soil water changes may also influence the WUE of vegetation. These factors could be considered holistically in future studies.

5. Conclusions

In this study, the spatiotemporal variation of WUE in IM from 2001 to 2018 was analyzed using a trend analysis. A quantitative analysis of the importance of vegetation and climatic factors on the WUE was carried out through grey relational analyses. Relatively important influencing factors of WUE were identified and chosen and their contributions to the WUE trend were quantified using ridge-regression analyses. Our results revealed that the multiyear average value of the WUE in IM was 1.39 g C m−2 mm−1 with an annual average increasing rate of 0.0071 g C m−2 mm−1 yr−1 during 2001–2018. In terms of driving factors, LAI and precipitation were the most important factors affecting the WUE in IM, followed by relative humidity and wind speed. Air temperature, water vapor pressure, and sunshine duration were relative less important to the WUE. According to the independent contributions of important influencing factors to the WUE, changes in LAI showed the highest contribution (0.008 g C m−2 mm−1 yr−1) and a relative contribution rate of 44.57%, which were significantly higher than that of precipitation, relative humidity, and sunshine duration. It indicated that LAI was the primary contributor to, and vegetation change was the dominant factor of the regulation of the WUE variation in IM. The relative contribution rates of LAI were different in different vegetation types, with the value in swamp the smallest and meadow the largest. These results will deepen our understanding on the carbon–water coupling process of terrestrial ecosystems under environmental change.

Supplementary Materials

The following supporting information can be downloaded at: https://www.mdpi.com/article/10.3390/rs14184541/s1, Figure S1: Evaluation of GLASS eight-day composite 1 km resolution (a) GPP, (b) ET, and (c) WUE products against flux observations.

Author Contributions

Conceptualization, H.L.; Formal analysis, T.Z.; Funding acquisition, G.Y.; Methodology, G.Y.; Software, H.L.; Supervision, P.L.; Validation, X.B. and X.Z.; Visualization, J.L.; Writing—original draft, H.L.; Writing—review & editing, X.B., X.Z. and T.Z. All authors have read and agreed to the published version of the manuscript.

Funding

This research was funded by the National Natural Science Foundation of China (41801099), the second Tibetan Plateau Scientific Expedition and Research Program (2019QZKK0307), and the Key Research and Development Program of Sichuan (2022YFS0491).

Data Availability Statement

The GLASS data are available at http://www.glass.umd.edu/Download.html, accessed on 12 March 2022. The meteorological data are available at http://data.cma.cn, accessed on 12 March 2022. The vegetation types data are available at https://www.resdc.cn/, accessed on 12 March 2022. The DEM are available at https://earthexplorer.usgs.gov/, accessed on 12 March 2022. The flux data are available at http://www.cnern.org.cn/, accessed on 12 March 2022.

Acknowledgments

We would like to thank the University of Maryland for supporting the data availability of the GPP, ET and LAI data. The author thanks anonymous reviewers for providing invaluable comments on the original manuscript.

Conflicts of Interest

The authors declare no conflict of interest.

References

  1. Zhao, J.; Xu, T.; Xiao, J.; Liu, S.; Mao, K.; Song, L.; Yao, Y.; He, X.; Feng, H. Responses of Water Use Efficiency to Drought in Southwest China. Remote Sens. 2020, 12, 199. [Google Scholar] [CrossRef]
  2. Yu, G.; Wang, Q.; Zhuang, J.i.e. Modeling the Water Use Efficiency of Soybean and Maize Plants under Environmental Stresses: Application of a Synthetic Model of Photosynthesis-Transpiration Based on Stomatal Behavior. J. Plant Physiol. 2004, 161, 303–318. [Google Scholar] [CrossRef] [PubMed]
  3. Hu, Z.; Yu, G.; Fu, Y.; Sun, X.; Li, Y.; Shi, P.; Wang, Y.; Zhang, Z. Effects of Vegetation Control on Ecosystem Water Use Efficiency within and among Four Grassland Ecosystems in China. Glob. Chang. Biol. 2008, 14, 1609–1619. [Google Scholar] [CrossRef]
  4. Yang, S.; Zhang, J.; Han, J.; Wang, J.; Zhang, S.; Bai, Y.; Cao, D.; Xun, L.; Zheng, M.; Chen, H.; et al. Evaluating Global Ecosystem Water Use Efficiency Response to Drought Based on Multi-Model Analysis. Sci. Total Environ. 2021, 778, 146356. [Google Scholar] [CrossRef] [PubMed]
  5. Li, G.; Chen, W.; Li, R.; Zhang, X.; Liu, J. Assessing the Spatiotemporal Dynamics of Ecosystem Water Use Efficiency across China and the Response to Natural and Human Activities. Ecol. Indic. 2021, 126, 107680. [Google Scholar] [CrossRef]
  6. Wang, L.; Li, M.; Wang, J.; Li, X.; Wang, L. An Analytical Reductionist Framework to Separate the Effects of Climate Change and Human Activities on Variation in Water Use Efficiency. Sci. Total Environ. 2020, 727, 138306. [Google Scholar] [CrossRef] [PubMed]
  7. Zheng, H.; Lin, H.; Zhou, W.; Bao, H.; Zhu, X.; Jin, Z.; Song, Y.; Wang, Y.; Liu, W.; Tang, Y. Revegetation Has Increased Ecosystem Water-Use Efficiency during 2000–2014 in the Chinese Loess Plateau: Evidence from Satellite Data. Ecol. Indic. 2019, 102, 507–518. [Google Scholar] [CrossRef]
  8. Zhang, L.; Tian, J.; He, H.; Ren, X.; Sun, X.; Yu, G.; Lu, Q.; Lv, L. Evaluation of Water Use Efficiency Derived from MODIS Products against Eddy Variance Measurements in China. Remote Sens. 2015, 7, 11183–11201. [Google Scholar] [CrossRef]
  9. El Masri, B.; Stinchcomb, G.E.; Cetin, H.; Ferguson, B.; Kim, S.L.; Xiao, J.; Fisher, J.B. Linking Remotely Sensed Carbon and Water Use Efficiencies with In Situ Soil Properties. Remote Sens. 2021, 13, 2593. [Google Scholar] [CrossRef]
  10. Wang, Q.; Yu, D.; Dai, L.; Zhou, L.; Zhou, W.; Qi, G.; Qi, L.; Ye, Y. Research Progress in Water Use Efficiency of Plants under Global Climate Change. Chin. J. Appl. Ecol. 2010, 11, 3255–3265. (In Chinese) [Google Scholar]
  11. Cao, R.; Hu, Z.; Jiang, Z.; Yang, Y.; Zhao, W.; Wu, G.; Feng, X.; Chen, R.; Hao, G. Shifts in Ecosystem Water Use Efficiency on China’s Loess Plateau Caused by the Interaction of Climatic and Biotic Factors over 1985–2015. Agric. For. Meteorol. 2020, 291, 108100. [Google Scholar] [CrossRef]
  12. Bai, Y.; Zha, T.; Bourque, C.P.-A.; Jia, X.; Ma, J.; Liu, P.; Yang, R.; Li, C.; Du, T.; Wu, Y. Variation in Ecosystem Water Use Efficiency along a Southwest-to-Northeast Aridity Gradient in China. Ecol. Indic. 2020, 110, 105932. [Google Scholar] [CrossRef]
  13. Ito, A.; Inatomi, M. Water-Use Efficiency of the Terrestrial Biosphere: A Model Analysis Focusing on Interactions between the Global Carbon and Water Cycles. J. Hydrometeorol. 2012, 13, 681–694. [Google Scholar] [CrossRef]
  14. Tian, F.; Zhang, Y.; Lu, S. Spatial-Temporal Dynamics of Cropland Ecosystem Water-Use Efficiency and the Responses to Agricultural Water Management in the Shiyang River Basin, Northwestern China. Agric. Water Manag. 2020, 237, 106176. [Google Scholar] [CrossRef]
  15. Tesfaye, S.; Taye, G.; Birhane, E.; van der Zee, S.E.A.T. Spatiotemporal Variability of Ecosystem Water Use Efficiency in Northern Ethiopia during 1982–2014. J. Hydrol. 2021, 603, 126863. [Google Scholar] [CrossRef]
  16. Zhu, X.; Yu, G.; Wang, Q.; Hu, Z.; Zheng, H.; Li, S.; Sun, X.; Zhang, Y.; Yan, J.; Wang, H.; et al. Spatial Variability of Water Use Efficiency in China’s Terrestrial Ecosystems. Glob. Planet. Chang. 2015, 129, 37–44. [Google Scholar] [CrossRef]
  17. Hu, X.; Lei, H. Fifteen-Year Variations of Water Use Efficiency over a Wheat-Maize Rotation Cropland in the North China Plain. Agric. For. Meteorol. 2021, 306, 108430. [Google Scholar] [CrossRef]
  18. Yu, G.; Song, X.; Wang, Q.; Liu, Y.; Guan, D.; Yan, J.; Sun, X.; Zhang, L.; Wen, X. Water-Use Efficiency of Forest Ecosystems in Eastern China and Its Relations to Climatic Variables. New Phytol. 2008, 177, 927–937. [Google Scholar] [CrossRef]
  19. Yang, L.; Feng, Q.; Wen, X.; Barzegar, R.; Adamowski, J.F.; Zhu, M.; Yin, Z. Contributions of Climate, Elevated Atmospheric CO2 Concentration and Land Surface Changes to Variation in Water Use Efficiency in Northwest China. CATENA 2022, 213, 106220. [Google Scholar] [CrossRef]
  20. Yin, H.; Pflugmacher, D.; Li, A.; Li, Z.; Hostert, P. Land Use and Land Cover Change in Inner Mongolia—Understanding the Effects of China’s Re-Vegetation Programs. Remote Sens. Environ. 2018, 204, 918–930. [Google Scholar] [CrossRef]
  21. Zhang, H.; Fan, J.; Cao, W.; Harris, W.; Li, Y.; Chi, W.; Wang, S. Response of Wind Erosion Dynamics to Climate Change and Human Activity in Inner Mongolia, China during 1990 to 2015. Sci. Total Environ. 2018, 639, 1038–1050. [Google Scholar] [CrossRef]
  22. He, B.; Chen, A.; Wang, H.; Wang, Q. Dynamic Response of Satellite-Derived Vegetation Growth to Climate Change in the Three North Shelter Forest Region in China. Remote Sens. 2015, 7, 9998–10016. [Google Scholar] [CrossRef]
  23. Liu, W.; Zhu, J.; Jia, Q.; Zheng, X.; Li, J.; Lou, X.; Hu, L. Carbon Sequestration Effects of Shrublands in Three-North Shelterbelt Forest Region, China. Chin. Geogr. Sci. 2014, 24, 444–453. [Google Scholar] [CrossRef]
  24. Peng, D.; Wu, C.; Zhang, B.; Huete, A.; Zhang, X.; Sun, R.; Lei, L.; Huang, W.; Liu, L.; Liu, X.; et al. The Influences of Drought and Land-Cover Conversion on Inter-Annual Variation of NPP in the Three-North Shelterbelt Program Zone of China Based on MODIS Data. PLoS ONE 2016, 11, e0158173. [Google Scholar] [CrossRef] [PubMed]
  25. Tian, H.; Lu, C.; Chen, G.; Xu, X.; Liu, M.; Ren, W.; Tao, B.; Sun, G.; Pan, S.; Liu, J. Climate and Land Use Controls over Terrestrial Water Use Efficiency in Monsoon Asia. Ecohydrology 2011, 4, 322–340. [Google Scholar] [CrossRef]
  26. Du, X.; Zhao, X.; Zhou, T.; Jiang, B.; Xu, P.; Wu, D.; Tang, B. Effects of Climate Factors and Human Activities on the Ecosystem Water Use Efficiency throughout Northern China. Remote Sens. 2019, 11, 2766. [Google Scholar] [CrossRef]
  27. Xie, S.; Mo, X.; Hu, S.; Liu, S. Contributions of Climate Change, Elevated Atmospheric CO2 and Human Activities to ET and GPP Trends in the Three-North Region of China. Agric. For. Meteorol. 2020, 295, 108183. [Google Scholar] [CrossRef]
  28. Cao, S.; Zhang, J.; Chen, L.; Zhao, T. Ecosystem Water Imbalances Created during Ecological Restoration by Afforestation in China, and Lessons for Other Developing Countries. J. Environ. Manag. 2016, 183, 843–849. [Google Scholar] [CrossRef]
  29. Meng, S.; Xie, X.; Zhu, B.; Wang, Y. The Relative Contribution of Vegetation Greening to the Hydrological Cycle in the Three-North Region of China: A Modelling Analysis. J. Hydrol. 2020, 591, 125689. [Google Scholar] [CrossRef]
  30. Wang, Z.; Peng, D.; Xu, D.; Zhang, X.; Zhang, Y. Assessing the Water Footprint of Afforestation in Inner Mongolia, China. J. Arid Environ. 2020, 182, 104257. [Google Scholar] [CrossRef]
  31. Hoek van Dijke, A.J.; Herold, M.; Mallick, K.; Benedict, I.; Machwitz, M.; Schlerf, M.; Pranindita, A.; Theeuwen, J.J.E.; Bastin, J.-F.; Teuling, A.J. Shifts in Regional Water Availability Due to Global Tree Restoration. Nat. Geosci. 2022, 15, 363–368. [Google Scholar] [CrossRef]
  32. Zhang, H.; Zhan, C.; Xia, J.; Yeh, P.J.-F.; Ning, L.; Hu, S.; Wang, X.-S. The Role of Groundwater in the Spatio-Temporal Variations of Vegetation Water Use Efficiency in the Ordos Plateau, China. J. Hydrol. 2022, 605, 127332. [Google Scholar] [CrossRef]
  33. Liu, Y.; Xiao, J.; Ju, W.; Zhou, Y.; Wang, S.; Wu, X. Water Use Efficiency of China’s Terrestrial Ecosystems and Responses to Drought. Sci. Rep. 2015, 5, 13799. [Google Scholar] [CrossRef] [PubMed]
  34. Guo, L.; Shan, N.; Zhang, Y.; Sun, F.; Liu, W.; Shi, Z.; Zhang, Q. Separating the Effects of Climate Change and Human Activity on Water Use Efficiency over the Beijing-Tianjin Sand Source Region of China. Sci. Total Environ. 2019, 690, 584–595. [Google Scholar] [CrossRef]
  35. Liu, Y.; Liu, S.; Sun, Y.; Li, M.; An, Y.; Shi, F. Spatial Differentiation of the NPP and NDVI and Its Influencing Factors Vary with Grassland Type on the Qinghai-Tibet Plateau. Environ. Monit. Assess. 2021, 193, 48. [Google Scholar] [CrossRef] [PubMed]
  36. He, D.; Huang, X.; Tian, Q.; Zhang, Z. Changes in Vegetation Growth Dynamics and Relations with Climate in Inner Mongolia under More Strict Multiple Pre-Processing (2000–2018). Sustainability 2020, 12, 2534. [Google Scholar] [CrossRef]
  37. He, D.; Yi, G.; Zhang, T.; Miao, J.; Li, J.; Bie, X. Temporal and Spatial Characteristics of EVI and Its Response to Climatic Factors in Recent 16 Years Based on Grey Relational Analysis in Inner Mongolia Autonomous Region, China. Remote Sens. 2018, 10, 961. [Google Scholar] [CrossRef]
  38. Liu, Z.; Wang, S.; Chen, B. Spatial and Temporal Variations of Frozen Ground and Its Vegetation Response in the Eastern Segment of China-Mongolia-Russia Economic Corridor from 2000 to 2015. Acta Geogr. Sin. 2021, 76, 14. (In Chinese) [Google Scholar]
  39. Wong, H.; Hu, B.Q.; Ip, W.C.; Xia, J. Change-Point Analysis of Hydrological Time Series Using Grey Relational Method. J. Hydrol. 2006, 324, 323–338. [Google Scholar] [CrossRef]
  40. Lu, H.; Yi, G.; Zhang, T.; Li, J.; Wang, G.; Qin, Y.; Wen, B. Variations in Vegetation CUE with Climate Change and Human Activity during Growing Seasons in the Western Sichuan Plateau, China. Remote Sens. Lett. 2021, 12, 419–428. [Google Scholar] [CrossRef]
  41. Zhang, Q.; Chen, W. Ecosystem Water Use Efficiency in the Three-North Region of China Based on Long-Term Satellite Data. Sustainability 2021, 13, 7977. [Google Scholar] [CrossRef]
  42. Kang, F.; Li, X.; Du, H.; Mao, F.; Zhou, G.; Xu, Y.; Huang, Z.; Ji, J.; Wang, J. Spatiotemporal Evolution of the Carbon Fluxes from Bamboo Forests and Their Response to Climate Change Based on a BEPS Model in China. Remote Sens. 2022, 14, 366. [Google Scholar] [CrossRef]
  43. Gang, C.; Wang, Z.; You, Y.; Liu, Y.; Xu, R.; Bian, Z.; Pan, N.; Gao, X.; Chen, M.; Zhang, M. Divergent Responses of Terrestrial Carbon Use Efficiency to Climate Variation from 2000 to 2018. Glob. Planet. Chang. 2022, 208, 103709. [Google Scholar] [CrossRef]
  44. Hoerl, A.E.; Kennard, R.W. Ridge Regression: Biased Estimation for Nonorthogonal Problems. Technometrics 1970, 12, 55–67. [Google Scholar] [CrossRef]
  45. Liu, W.; Mo, X.; Liu, S.; Lin, Z.; Lv, C. Attributing the Changes of Grass Growth, Water Consumed and Water Use Efficiency over the Tibetan Plateau. J. Hydrol. 2021, 598, 126464. [Google Scholar] [CrossRef]
  46. Ji, Z.; Pei, T.; Chen, Y.; Wu, H.; Hou, Q.; Shi, F.; Xie, B.; Zhang, J. The Driving Factors of Grassland Water Use Efficiency along Degradation Gradients on the Qinghai-Tibet Plateau, China. Glob. Ecol. Conserv. 2022, 35, e02090. [Google Scholar] [CrossRef]
  47. Zheng, Y.; Shen, R.; Wang, Y.; Li, X.; Liu, S.; Liang, S.; Chen, J.M.; Ju, W.; Zhang, L.; Yuan, W. Improved Estimate of Global Gross Primary Production for Reproducing Its Long-Term Variation, 1982–2017. Earth Syst. Sci. Data 2020, 12, 2725–2746. [Google Scholar] [CrossRef]
  48. Yuan, W.; Liu, S.; Yu, G.; Bonnefond, J.-M.; Chen, J.; Davis, K.; Desai, A.R.; Goldstein, A.H.; Gianelle, D.; Rossi, F.; et al. Global Estimates of Evapotranspiration and Gross Primary Production Based on MODIS and Global Meteorology Data. Remote Sens. Environ. 2010, 114, 1416–1431. [Google Scholar] [CrossRef]
  49. Guo, X.; Yao, Y.; Zhang, Y.; Lin, Y.; Jiang, B.; Jia, K.; Zhang, X.; Xie, X.; Zhang, L.; Shang, K.; et al. Discrepancies in the Simulated Global Terrestrial Latent Heat Flux from GLASS and MERRA-2 Surface Net Radiation Products. Remote Sens. 2020, 12, 2763. [Google Scholar] [CrossRef]
  50. Yao, Y.; Liang, S.; Li, X.; Hong, Y.; Fisher, J.B.; Zhang, N.; Chen, J.; Cheng, J.; Zhao, S.; Zhang, X.; et al. Bayesian Multimodel Estimation of Global Terrestrial Latent Heat Flux from Eddy Covariance, Meteorological, and Satellite Observations. J. Geophys. Res. Atmos. 2014, 119, 4521–4545. [Google Scholar] [CrossRef]
  51. Yao, Y.; Liang, S.; Li, X.; Chen, J.; Wang, K.; Jia, K.; Cheng, J.; Jiang, B.; Fisher, J.B.; Mu, Q.; et al. A Satellite-Based Hybrid Algorithm to Determine the Priestley–Taylor Parameter for Global Terrestrial Latent Heat Flux Estimation across Multiple Biomes. Remote Sens. Environ. 2015, 165, 216–233. [Google Scholar] [CrossRef]
  52. BOX, G.E.P. Non-Normality and Tests on Variances. Biometrika 1953, 40, 318–335. [Google Scholar] [CrossRef]
  53. Sun, C.C. Combining Grey Relation Analysis and Entropy Model for Evaluating the Operational Performance: An Empirical Study. Qual. Quant. 2014, 48, 1589–1600. [Google Scholar] [CrossRef]
  54. Li, G.; Fu, Q. Grey Relational Analysis Model Based on Weighted Entropy and Its Application. In Proceedings of the 2007 International Conference on Wireless Communications, Networking and Mobile Computing, Shanghai, China, 21–25 September 2007; pp. 5500–5503. [Google Scholar]
  55. García, C.; Gómez, R.S.; García, C.B. Choice of the Ridge Factor from the Correlation Matrix Determinant. J. Stat. Comput. Simul. 2019, 89, 211–231. [Google Scholar] [CrossRef]
  56. MU, S.; Zhou, K.; Qi, Y.; Chen, Y.; Fang, Y.; Zhu, C. Spatio-Temporal Patterns of Precipitation-Use Efficiency of Vegetation and Their Controlling Factors in Inner Mongolia. Chin. J. Plant Ecol. 2014, 038, 1–16. (In Chinese) [Google Scholar]
  57. Wang, L.; Good, S.P.; Caylor, K.K. Global Synthesis of Vegetation Control on Evapotranspiration Partitioning. Geophys. Res. Lett. 2014, 41, 6753–6757. [Google Scholar] [CrossRef]
  58. Gan, G.; Zhao, X.; Fan, X.; Xie, H.; Jin, W.; Zhou, H.; Cui, Y.; Liu, Y. Estimating the Gross Primary Production and Evapotranspiration of Rice Paddy Fields in the Sub-Tropical Region of China Using a Remotely-Sensed Based Water-Carbon Coupled Model. Remote Sens. 2021, 13, 3470. [Google Scholar] [CrossRef]
  59. Fang, H.; Li, S.; Zhang, Y.; Wei, S.; Wang, Y. New Insights of Global Vegetation Structural Properties through an Analysis of Canopy Clumping Index, Fractional Vegetation Cover, and Leaf Area Index. Sci. Remote Sens. 2021, 4, 100027. [Google Scholar] [CrossRef]
  60. Chang, X.; Wang, Z.; Wei, F.; Xiao, P.; Shen, Z.; Lv, X.; Shi, Y. Determining the Contributions of Vegetation and Climate Change to Ecosystem WUE Variation over the Last Two Decades on the Loess Plateau, China. Forests 2021, 12, 1442. [Google Scholar] [CrossRef]
  61. Wang, M.; Lu, H.; Cheng, D.; Zheng, Y.; Zhong, Q.; Guo, B.; Ma, Y.; Jin, B. Effects of Precipitation and Temperature on Rain-Use Efficiency of China’s Forests. Chin. J. Appl. Environ. 2018, 24, 5. (In Chinese) [Google Scholar] [CrossRef]
  62. Zhang, W.; Jin, H.; Shao, H.; Li, A.; Li, S.; Fan, W. Temporal and Spatial Variations in the Leaf Area Index and Its Response to Topography in the Three-River Source Region, China from 2000 to 2017. ISPRS Int. J. Geo-Inf. 2021, 10, 33. [Google Scholar] [CrossRef]
  63. Zhu, X.; Yu, G.; Wang, Q.; Hu, Z.; Han, S.; Yan, J.; Wang, Y.; Zhao, L. Seasonal Dynamics of Water Use Efficiency of Typical Forest and Grassland Ecosystems in China. J. For. Res. 2014, 19, 70–76. [Google Scholar] [CrossRef]
  64. Deng, C.; Zhang, B.; Cheng, L.; Hu, L.; Chen, F. Vegetation Dynamics and Their Effects on Surface Water-Energy Balance over the Three-North Region of China. Agric. For. Meteorol. 2019, 275, 79–90. [Google Scholar] [CrossRef]
  65. Kato, T.; Kimura, R.; Kamichika, M. Estimation of Evapotranspiration, Transpiration Ratio and Water-Use Efficiency from a Sparse Canopy Using a Compartment Model. Agric. Water Manag. 2004, 65, 173–191. [Google Scholar] [CrossRef]
  66. Zhang, X.; Tan, Y.; Li, A.; Ren, T.; Chen, S.; Wang, L.; Huang, J. Water and Nitrogen Availability Co-Control Ecosystem CO2 Exchange in a Semiarid Temperate Steppe. Sci. Rep. 2015, 5, 15549. [Google Scholar] [CrossRef] [PubMed]
  67. Sun, H.; Bai, Y.; Lu, M.; Wang, J.; Tuo, Y.; Yan, D.; Zhang, W. Drivers of the Water Use Efficiency Changes in China during 1982–2015. Sci. Total Environ. 2021, 799, 149145. [Google Scholar] [CrossRef] [PubMed]
  68. Ma, J.; Jia, X.; Zha, T.; Bourque, C.P.-A.; Tian, Y.; Bai, Y.; Liu, P.; Yang, R.; Li, C.; Li, C.; et al. Ecosystem Water Use Efficiency in a Young Plantation in Northern China and Its Relationship to Drought. Agric. For. Meteorol. 2019, 275, 1–10. [Google Scholar] [CrossRef]
  69. Yang, L.; Feng, Q.; Zhu, M.; Wang, L.; Alizadeh, M.R.; Adamowski, J.F.; Wen, X.; Yin, Z. Variation in Actual Evapotranspiration and Its Ties to Climate Change and Vegetation Dynamics in Northwest China. J. Hydrol. 2022, 607, 127533. [Google Scholar] [CrossRef]
  70. Wang, S.; Zhang, Y.; Ju, W.; Chen, J.M.; Ciais, P.; Cescatti, A.; Sardans, J.; Janssens, I.A.; Wu, M.; Berry, J.A.; et al. Recent Global Decline of CO2 Fertilization Effects on Vegetation Photosynthesis. Science 2020, 370, 1295–1300. [Google Scholar] [CrossRef]
  71. Zeng, S.; Du, H.; Xia, J.; Wu, J.; Yang, L. Attributions of Evapotranspiration and Gross Primary Production Changes in Semi-Arid Region: A Case Study in the Water Source Area of the Xiong’an New Area in North China. Remote Sens. 2022, 14, 1187. [Google Scholar] [CrossRef]
  72. Liu, X.; Feng, X.; Fu, B. Changes in Global Terrestrial Ecosystem Water Use Efficiency Are Closely Related to Soil Moisture. Sci. Total Environ. 2020, 698, 134165. [Google Scholar] [CrossRef] [PubMed]
  73. Cheng, L.; Zhang, L.; Wang, Y.-P.; Canadell, J.G.; Chiew, F.H.S.; Beringer, J.; Li, L.; Miralles, D.G.; Piao, S.; Zhang, Y. Recent Increases in Terrestrial Carbon Uptake at Little Cost to the Water Cycle. Nat. Commun. 2017, 8, 110. [Google Scholar] [CrossRef] [PubMed]
  74. Huang, M.; Piao, S.; Sun, Y.; Ciais, P.; Cheng, L.; Mao, J.; Poulter, B.; Shi, X.; Zeng, Z.; Wang, Y. Change in Terrestrial Ecosystem Water-Use Efficiency over the Last Three Decades. Glob. Chang. Biol. 2015, 21, 2366–2378. [Google Scholar] [CrossRef] [PubMed]
  75. Yin, Y.; Deng, H.; Ma, D. Complex Effects of Moisture Conditions and Temperature Enhanced Vegetation Growth in the Arid/Humid Transition Zone in Northern China. Sci. Total Environ. 2022, 805, 150152. [Google Scholar] [CrossRef]
  76. Zhang, X.; Zhang, Y.; Tian, J.; Ma, N.; Wang, Y.-P. CO2 Fertilization Is Spatially Distinct from Stomatal Conductance Reduction in Controlling Ecosystem Water-Use Efficiency Increase. Environ. Res. Lett. 2022, 17, 54048. [Google Scholar] [CrossRef]
Figure 1. (a) Digital elevation model (DEM) and (b) vegetation types in Inner Mongolia.
Remotesensing 14 04541 g001
Figure 2. Flowchart of the study. LAI: leaf-area index; PRE: precipitation; TEM: temperature; WS: wind speed; RH: relative humidity; SD: sunshine duration; EA: water vapor pressure.
Remotesensing 14 04541 g002
Figure 3. Spatial distribution of (a) annual mean WUE and (b) its dependence on different vegetation types in Inner Mongolia over 2001–2018.
Remotesensing 14 04541 g003
Figure 4. Variation of (a) annual mean WUE and (b) the dependence of WUE trend on different vegetation types in Inner Mongolia from 2001 to 2018.
Remotesensing 14 04541 g004
Figure 5. Spatial distribution of (a) WUE variation trends and (b) variation types for the period of 2001–2018 over Inner Mongolia. SD = significant decrease; ISD = insignificant decrease; ISI = insignificant increase; SI = significant increase.
Remotesensing 14 04541 g005
Figure 6. Spatial distribution of grey relational degree between WUE and (a) LAI, (b) PRE, (c) RH, (d) WS, (e) TEM, (f) EA, and (g) SD and spatial patterns of the max grey relational degree in (h) all factors and (i) all climate factors.
Remotesensing 14 04541 g006
Figure 7. Spatial distribution of variation trends of (a) LAI, (b) PRE, (c) RH, and (d) WS.
Remotesensing 14 04541 g007
Figure 8. Spatial distribution of the contributions to WUE trends contributed by the changes in (a) LAI, (b) PRE, (c) RH, and (d) WS.
Remotesensing 14 04541 g008
Figure 9. (a) Contributions and (b) relative contribution rates of changes in LAI, PRE, RH, and WS to WUE trends for different vegetation types.
Remotesensing 14 04541 g009
Figure 10. (a) Sensitivity of WUE to LAI and (b) contributions of LAI to WUE trends under different LAI gradients. 1: 0~0.2, 2: 0.2~0.4, 3: 0.4~0.6 …… and so on.
Remotesensing 14 04541 g010
Table 1. Grey relational degrees between WUE and LAI and climate factors for different vegetation types.
Influencing FactorsVegetation Types
ForestSwampShrubMeadowCultivated Vegetation
LAI0.7240.7110.8260.8520.813
PRE0.7110.6990.7290.7410.719
TEM0.6510.6470.6470.6330.649
WS0.6450.6530.6350.6500.655
SD0.6000.5990.5990.6070.618
RH0.6770.6710.6900.6970.678
EA0.6320.6300.6360.6320.645
Table 2. Proportion of the contributions of LAI, PRE, RH, and WS variations to the WUE trend.
Contribution TypeInfluencing FactorsIncreasing Trend (%)Decreasing Trend (%)Sum (%)
Positive contributionLAI85.030.1285.15
PRE62.780.0662.84
RH12.6246.9859.60
WS22.6813.5736.25
Negative contributionLAI4.999.8614.85
PRE36.950.2137.16
RH15.8624.5440.40
WS52.8410.9163.75
Publisher’s Note: MDPI stays neutral with regard to jurisdictional claims in published maps and institutional affiliations.

