
Unsupervised Change Detection around Subways Based on SAR Combined Difference Images


1
College of Geography and Environment, Shandong Normal University, Jinan 250358, China
2
Shandong Rail Transit Survey and Design Company Limited, Jinan 250101, China
3
Wuhan Botanical Garden, Chinese Academy of Sciences, Wuhan 430074, China
4
Sino-Africa Joint Research Center, Chinese Academy of Sciences, Wuhan 430074, China
5
School of Life Science, Faculty of Science, University of Technology Sydney, Sydney, NSW 2007, Australia
*
Author to whom correspondence should be addressed.
Remote Sens. 2022, 14(17), 4419; https://doi.org/10.3390/rs14174419
Submission received: 24 August 2022
/
Revised: 31 August 2022
/
Accepted: 2 September 2022
/
Published: 5 September 2022
Abstract
:Prompt and precise acknowledgement of surface change around subways is of considerable significance in urban rail protection and local environmental management. Research has proven the considerable potential of synthetic aperture radar (SAR) images for detecting such information; however, previous studies have mostly focused on change intensity using single Difference images (DIs), e.g., difference value DI (DVDI) and mean value DI (MVDI). With the aim of more accurate information with respect to surface changes around subways, in this study, we proposed a novel SAR detection method that involved three steps: (1) the calculation of three single DIs, (2) the combination of the single DIs and (3) the delineation of the changed area. Compared to existing detection methods, the proposed method represents three major improvements. First, both the intensity information and phase information were applied by combining the DVDI, MVDI and coherent difference images (CDIs). Secondly, a local energy weight (LEW) approach was proposed to combine single DIs instead of the normally used equal weights. Because the changed area often comprises continuous rather than discrete pixels, a combined DI with the LEW (“CoDI-LEW” hereafter) fully considers the attributes of adjacent pixels and enhances the signal-to-noise ratio of SAR images. Thirdly, the FCM algorithm, instead of the widely used threshold methods, was applied to distinguish changed areas from unchanged areas. An experimental comparison with several existing detection methods showed that the proposed method could delineate changed areas with higher accuracy in terms of both quality and quantity. Furthermore, it can effectively execute detection under diverse surface change conditions with good feasibility and applicability.
1. Introduction
In recent decades, a considerable amount of subways have been constructed in urban areas and become one of the major modes of daily travel for urban residents. Multifunctional communities have been formed centered around subway stations, meeting the needs of residence, work, shopping, entertainment, travel, rest, etc. [1,2]. Therefore, the completion of subway systems drives the construction of surrounding commercial and residential buildings. Within a certain range, the changes in the surrounding surface affects the safety of the subway system. Moreover, change detection around subways is conducive to guiding and controlling land development along the track [3,4]. Therefore, quickly and accurately locating the change area is the focus of change detection surrounding subways.
At present, multiple datasets have been used for change detection research, such as optical images (e.g., [5]), light detection and ranging (LIDAR) (e.g., [6]) and synthetic aperture radar (SAR) (e.g., [7]). Among them, optical images at low, medium and high spatial resolutions generally show the richest spectral information, which has been widely applied to extracting newly expanded urban land [8], distinguishing unreasonable housing construction [9] and monitoring the degradation of urban greenspace [10]. However, the precision of the detected results is highly dependent on weather conditions, with interference from cloud and shadow. Due to the strong penetrability and three-dimensional attributes of ground objects, LIDAR (i.e., images obtained from unmanned aerial vehicle) surface detection and manual patrol have become vital ways to recognize surface change around urban rail transit [11,12,13]. However, these methods lead to relatively low detection efficiency due to the difficulty in obtaining data in with long time series and wide coverages [12]. Recently, many researches have proven the potential of synthetic aperture radar (SAR) images to detect such information, providing an opportunity to master the impact of subway construction on urban development and the urban environment, serving as basic data for the coordinated development of urban rail transit and land use and promoting urban sustainable development [14,15]. This is due to the fact that SAR can work at any time of the day or night and under all weather conditions.
A large number of traditional and state-of-the-art methods have been applied to detect change areas using SAR images, including but not limited to algebraic operation [16,17], image transformation [18], image classification [19] and clustering [20] methods. Among these methods, the deep learning method has received considerable attention in the field of image change detection [21,22,23]. There are two main detection methods based on deep learning. One is two-stage detectors based on a convolutional neural network (CNN). For instance, Liu et al. [24] designed a dual-channel convolutional neural network (CNN) model and proved its superiority relative to other up-to-date methods, Radarsart-1 and ERS-2 SAR images. Tang et al. [25] proposed the use of revised Bhattacharyya distance to detect large-difference-scale targets and obtained progressive detection results. The other deep learning detection method is one-stage detectors based on CNN. For instance, Zhao et al. [26] proposed a novel open set domain adaptation classification method for unlabeled SAR images containing unknown classes using Sentinel-1 and Gaofen-3 satellite datasets. These existing publications strongly support the powerful ability of deep learning methods to automatically learn and extracting the required context features [27,28,29]. However, such methods face considerable difficulties in implementation due to their high computational and spatial complexity [23,30]. Although the deep features extracted from pretrained networks have shown excellent performance in solving such problems, their efficiency and effectiveness are generally dependent on a number of prior samples. In particular, detection precision and accuracy are limited when the study coverage area is too small to provide enough sample pixels for training [31,32,33]. Therefore, traditional methods are another good choice when focusing on surface change in a small study area that lacks sufficient sample pixels.
Traditional methods of change detection based on SAR images can be divided into two types according to whether prior knowledge is required, i.e., supervised and unsupervised techniques [14,34,35,36]. Compared to the supervised technique, which is time-consuming and labor-intensive due to its reliance on real reference data [37], the unsupervised change detection method is more widely used in practice [19,38]. For example, Gong et al. proposed a ratio method based on a neighborhood to generate difference images to detect the changed area [39,40]. Although this method is superior the traditional method of generating difference images, its detection results are seriously disturbed by noise, and the denoising effect is not ideal. The use of unsupervised techniques to distinguish change areas involves two key steps: first, the acquisition of the difference image (DI), and second, the analysis of the DI to detect changes [41,42]. DI acquisition is an extremely important step in the research of unsupervised change detection, which directly determines the detection accuracy [35]. Difference or ratio arithmetics are commonly used to generate DIs, e.g., difference value difference images (DVDIs) or mean value difference images (MVDIs). Building DVDIs based on the difference arithmetic is easy to implement, but this method ignores the neighborhood information of each pixel in the image [38]. Therefore, multiplicative noises cannot be effectively suppressed. Superior to DVDI, the construction method of MVDI considers the neighborhood information of pixels in the image, making it robust to noise. Given their advantages and limitations, many researchers have attempted to improve the DVDI and MVDI methods with the aim of more accurate surface change detection. For instance, Hou and Wei [42] proposed an unsupervised detection method based on Gauss-log ratio image fusion, which is regarded an improvement of the DVDI method.
In order to exploit the advantages of different single DIs, some researchers have attempted to combine single DIs when executing surface change detection. For example, Ma et al. [43] fused the logarithmic ratio operator and the mean ratio operator to obtain a DI, and Zheng et al. [44] proposed an unsupervised image change detection method based on PPB filter denoising and K-means clustering to generate combined difference images. In view of existing relevant publications, multiple DIs are often combined in a simple linear manner, whereas the weights of different DIs are not fully considered [45,46,47]. Among such research, the most common method is to set equal weights for the DIs, the detection accuracy of which is limited because the value of each pixel and its neighborhood are neglected [48,49]. In addition, SAR images contain valuable information on both amplitude (i.e., intensity) and phase [50]. However, existing SAR change detection algorithms are usually based on intensity information but ignore phase information [15,51]. Many researches have proven that the application of intensity information is subject many limitations when retrieving soil moisture information of complex underground structures due to its sensitivity to dielectric constant [52,53,54]. Taking the underground cavity as an example, its soil moisture generally appears differently from the surroundings. This phenomenon leads to false change detection results if only using intensity information. Previous studies have confirmed that small changes in surface moisture can maintain high coherence between two SAR images [55]. Therefore, our aim was to improve this detection error by adding phase information.
Based on the above analysis, in the present study, we propose a novel approach to SAR change detection. The Jinan Rail Transit Line R1 (“Line R1” hereafter) was selected as the study area. Using multitemporal Sentinel-1 SAR data, in this study, we aimed to obtain more accurate information with respect to surface changes around this subway. The basic workflow comprised (1) generating single DIs with intensity and phase information, (2) combining different DIs using the local energy weight (LEW) method and (3) detecting the changed area using a fuzzy c-means (FCM) algorithm. Compared to the aforementioned methods, the proposed method offers three major improvements. First, considering the complex underground structure in Jinan City, i.e., rich in underground springs and shallow burial, both intensity information and phase information were applied to reduce the false detection caused by changes in the underground structure. In this study, the former was adopted to generate DVDIs and MVDIs, whereas the latter was adopted to generate coherent difference images (CDIs). Secondly, in contrast to previous studies in which single DIs or Dis combined them with equal weights were directly applied, in this study, we proposed a local energy weight (LEW) approach. Because the changed area often comprises continuous rather than discrete pixels, a combined DI with LEW (“CoDI-LEW” hereafter) fully considers the attributes of adjacent pixels and enhances the signal-to-noise ratio of SAR images. Thirdly, when delineating the changed areas from the CoDI-LEW, we applied the FCM algorithm instead of the widely used threshold method. Finally, the feasibility and applicability of the proposed approach was verified by executing comparisons with several existing SAR change detection methods.
The remainder of this paper is structured as follows. In Section 2, we introduce the study area and datasets. In Section 3, we introduce the methodology and accuracy estimation. In Section 4, we introduce the detected results of single and combined difference images and comparisons with other existing methods. In Section 5, we provide a discussion. Finally, in Section 6, we draw our conclusions.
2. Study Area and Datasets
2.1. Study Area
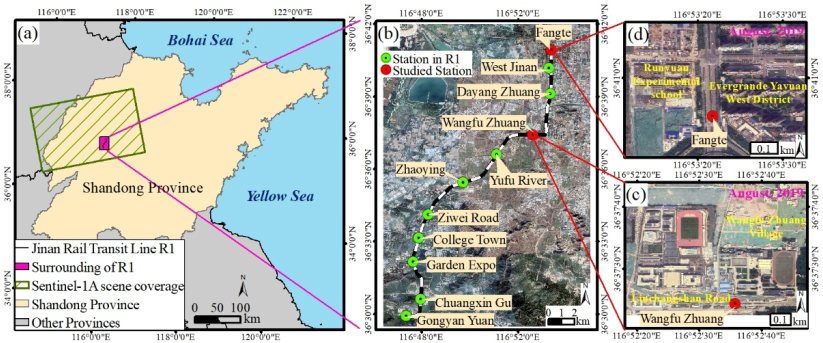
Line R1 is located in Jinan, a four-seasons city in the north temperate zone. As the capital city of Shandong Province in China, Jinan has a large population and relatively congested transportation. As the first subway line opened on 1 January 2019, Line R1 passes through the most densely populated counties of Jinan, relieving local traffic pressure. Line R1 contains four underground stations and seven ground stations, with a total length of 26.1 km from the southwest to northeast direction. In addition to daily travel, the operation of Line R1 has also had a significant impact on the surrounding surface. After confirming with Shandong Rail Transit Survey and Design Company Limited, a subway construction unit, the ground surface of Wangfu Zhuang Station and Fangte Station have changed significantly from 2019 to 2020 compared with the other nine stations in the system. The Wangfu Zhuang Station and Fangte Station on Line R1 were selected as the study areas to execute change detection (Figure 1). The former is an underground and transfer station, whereas the latter is an underground station, as well as the terminal of Line R1. Surrounded by apparently distinct features, these two stations have exhibited diverse surface changes in recent years. For instance, the Wangfu Zhuang Station is located on relatively flat terrain and mainly surrounded by villages, farmland and schools. Along with the operation of Line R1, large amounts of farmlands have been occupied by rural construction, e.g., the newly developed residential building and parks in Wangfu Zhuang Village and the widening of Liuchangshan Road, as shown in Figure 1c. In contrast, Fangte Station is surrounded by urban residences and a business district, with the rapid emergence of schools and commercial buildings, such as the Runyuan Experimental School and Evergrande YaYuan West District, as well as some hotels and small supermarkets under construction (Figure 1d).
2.2. Data Acquisition and Preprocessing
In this study, the experimental data were obtained from the European Space Agency’s Sentinel-1 SAR satellite. Sentinel-1 is a C-band SAR sensor with dual polarimetric capabilities (VV + VH). Previous studies have proven that the echo intensity of ground objects in VH mode is much lower than that in VV mode [51]. In order to enhance the image feature difference between changed and unchanged areas, VV polarization mode was selected for the construction and processing of DIs in this study.
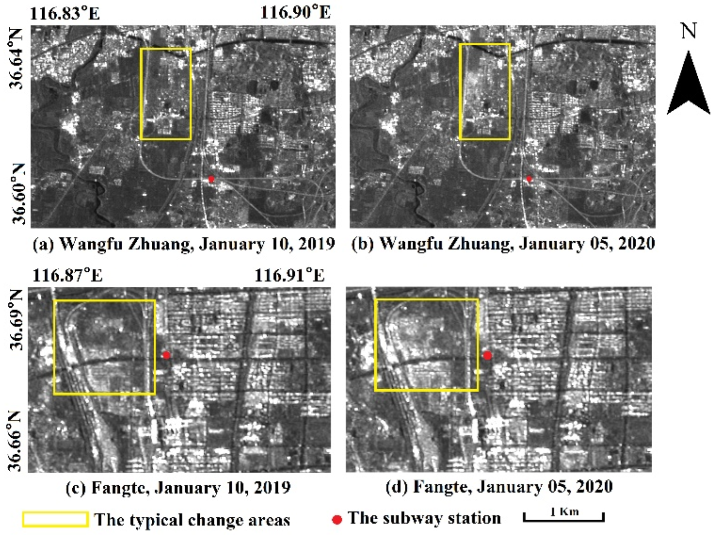
We used Sentinel-1A interferometric wide (IW) swath mode, VV polarization and single-look complex (SLC) products. A total of three scene images were used for change detection, with imaging times of 10 January 2019, 22 January 2019 and 5 January 2020, respectively. According to the weather website, there was no rainfall or snow in the entire coverage area of Line R1 from 10 December 2018 to 22 January 2019 and from 5 December 2019 to 5 January 2020. The time interval between 10 January 2019 and 22 January 2019 was just 12 days; therefore, the surface change during this period might be negligible based on prior knowledge. Because all data were collected in winter, the vegetation was withered. The spatial resolution of Sentinel-1′s IW products was 2.3 m × 13.9 m (range × azimuth), and the incidence angle was 39.1768°. Data preprocessing included track correction, coregistration, filtering, geocoding and clipping. Track correction needs to be completed with precise orbit data (https://qc.sentinel1.eo.esa.int, accessed on 20 August 2021). In the coregistration operation, the SAR image collected on 10 January 2019 was selected as the master image. During the filtering processing, the frost method was selected, and the filtering window was set to 5 × 5. The image sizes of Wangfu Zhuang Station and Fangte Station after pre-processing were 488 × 325 pixels and 286 × 174 pixels, respectively (Figure 2).
Two Sentinel-2 level 1C images collected on 5 January 2019 and 23 December 2019 were used for accuracy estimation. Sentinel-2 images have a total of 13 spectral bands, with a spatial resolution of up to 10 m and a playback period of 10 days. Data preprocessing include image resampling, band composition and visual interpretation. The visually interpreted changed areas were applied as the reference maps for accuracy estimation.
3. Methodology and Accuracy Estimation
3.1. Methodology
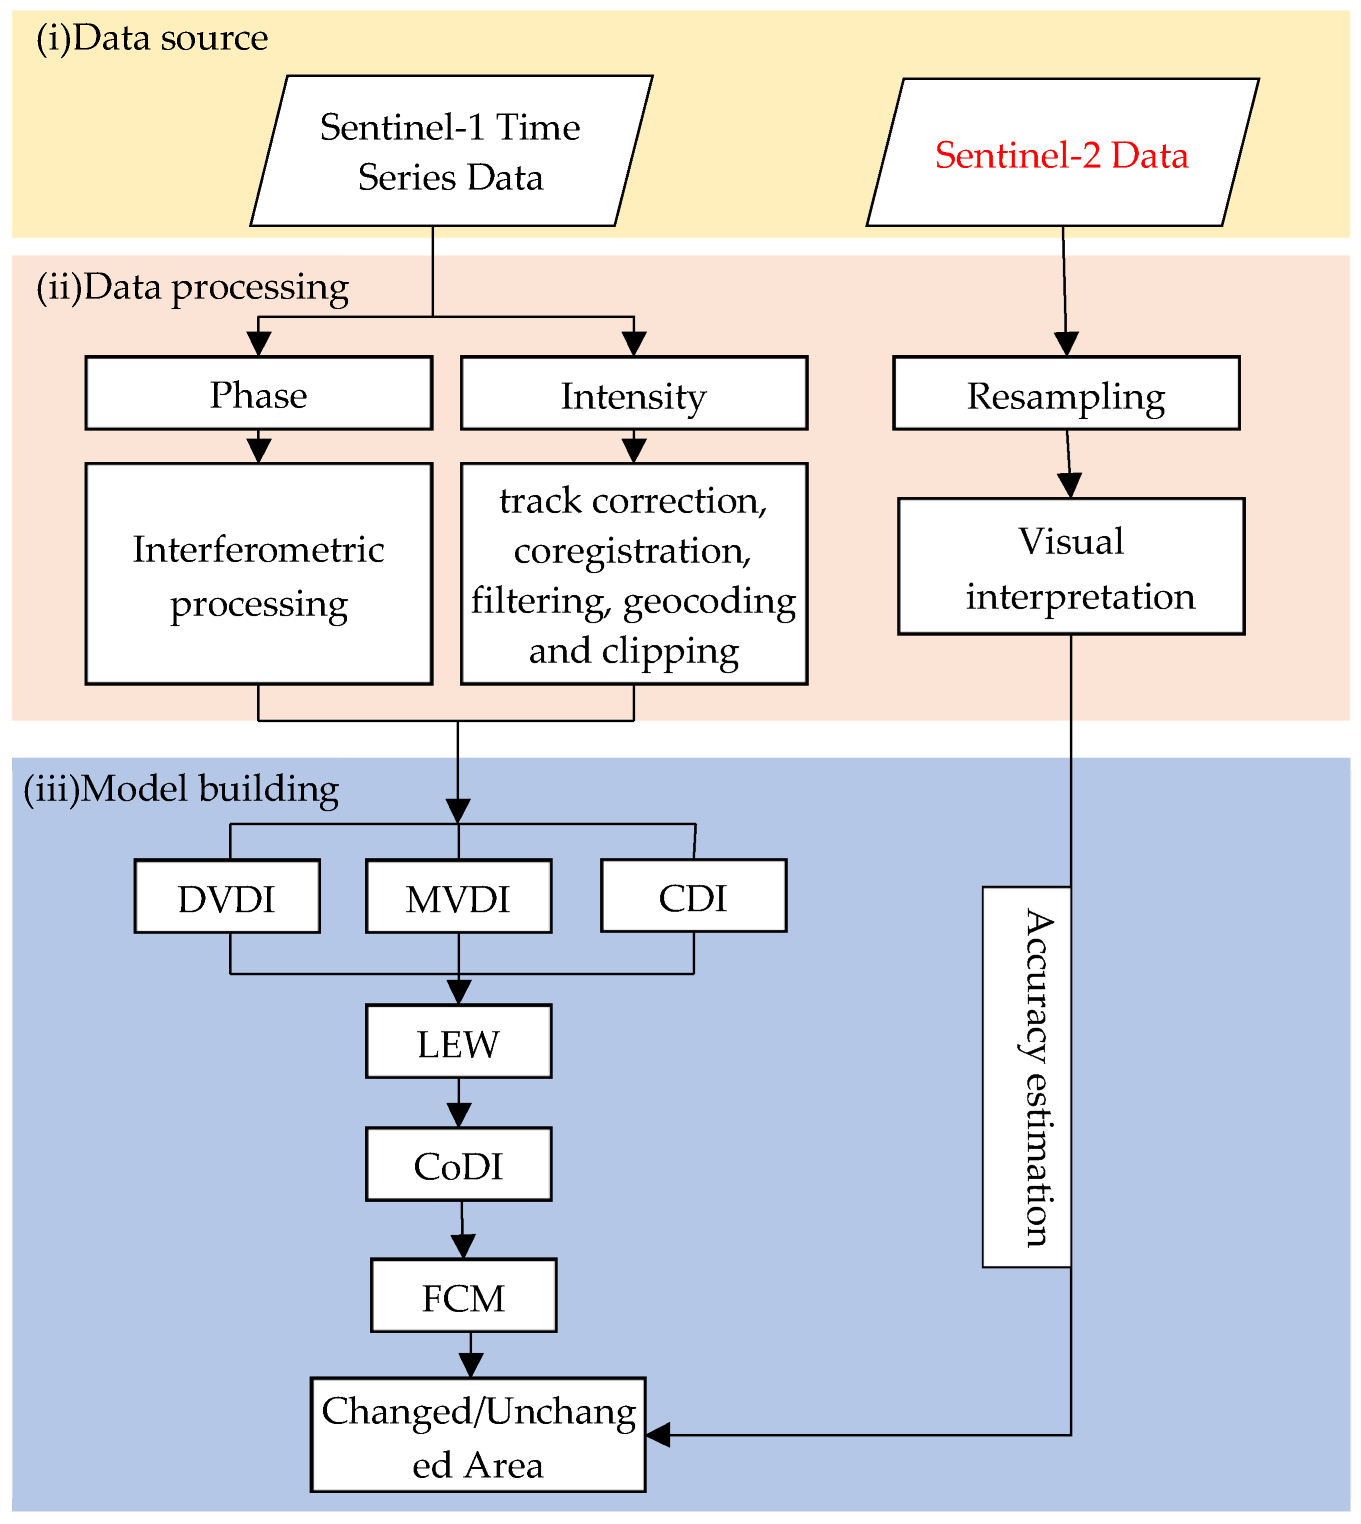
Given the individual advantages of three single DIs, including DVDI, MVDI and CDI, in this study, we proposed an LEW method to combine these three DIs. The workflow involves three key steps: (1) the calculation of three single DIs (Section 3.1.1), (2) the combination of single DIs based on the LEW method (“CoDI-LEW” hereafter) (Section 3.1.2) and (3) the FCM clustering of changed and unchanged area (Section 3.1.3). The workflow is shown in Figure 3. Building the CoDI-LEW is the most vital step, which determines the weights of each pixel in the single DIs according to its “energy”. The aim of this step is to increase the difference between changed areas and unchanged areas in SAR images. A detailed explanation is illustrated in Section 3.1.2. In order to investigate the advantages of the proposed SAR detection method, the accuracy of its detected changed area was compared with those detected using single DIs or other combinations of DIs with equal weights. In addition, in order to validate the advantages of the FCM clustering method, the widely used Otsu and iteration methods were selected to for comparison with our detection results. Furthermore, the applicability the proposed method was explored by observing the detection results across additional selected regions.
3.1.1. Single Difference Image (DI) Build Method
Given the individual advantages of the DVDI, MVDI and CDI methods analyzed in the Introduction, three single DIs were built for combination in this study. Among the three types of DIs, DVDIs and MVDIs mainly involve the intensity information of SAR images. DVDIs and MVDIs are regarded as “difference of SAR intensity images” and “ratio of SAR intensity images”, respectively. The two DIs were constructed as follows:
where and indicate the DVDI and MVDI, respectively; and indicate the amplitudes of SAR images obtained on 22 January 2019 and 5 January 2020, respectively; and and indicate the local mean value of pixel (, ) of and , respectively. The values of and range from 0 to 1. High pixel values in and represent relatively apparent surface change during the monitoring phase, with low values indicating few apparent surfaces changes.
CDIs involve phase information. In this study, a difference arithmetic between two groups of coherence coefficients was used to construct the CDI as follows:
where indicates the CDI, indicates the coherence coefficients between SAR images obtained on 10 January 2019 and 22 January 2019 with a temporal baseline of 12 days and indicates the coherence coefficients between SAR images obtained on 22 January 2019 and 5 January 2020 with a temporal baseline of 348 days. The value of ranges from 0 to 1. High coherence coefficients represent high consistency between of each two SAR images, that is, areas that have undergone considerable surface change present with low coherence coefficients.
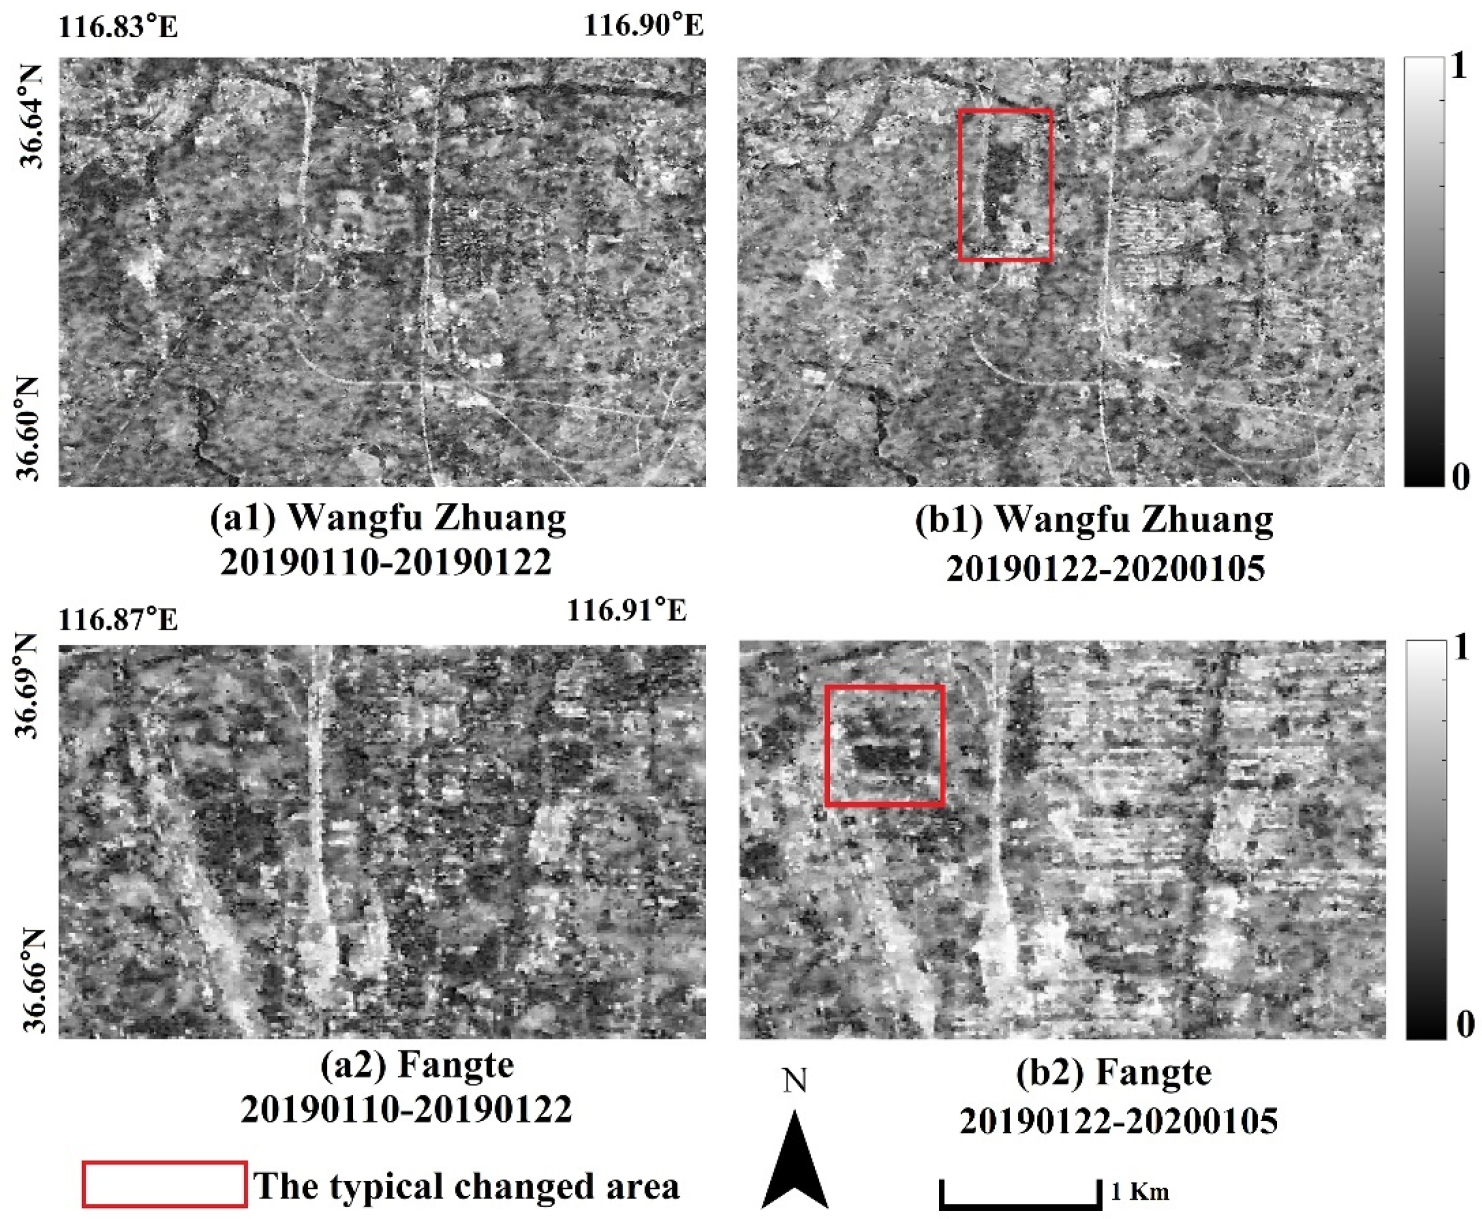
According to prior knowledge, the spatiotemporal baseline and surface moisture are important factors causing incoherence [56]. In terms of the temporal baselines of selected SAR images, we assume that the surface change during the period of 10–22 January 2019 was negligible, whereas that during the period between 10 January 2019 and 5 January 2020 was relatively apparent. The spatial baselines of two coherence coefficient images were 100 m and 117 m, respectively. The spatial baseline of the coherence images was far less than 1/10 of the limit vertical baseline (5720 m), satisfying the demand of coherence of SAR images. In terms of the surface moisture, as introduced in Section 2.2, it was not affected by rainy or snowy weather at least 20 days in advance of the SAR image acquisition dates. In total, based on the premise that the influence of the spatiotemporal baseline and surface moisture can be neglected, the decoherence of the study area could be attributed to the surface changes. Therefore, the difference algorithm between and in Formula (3) could express the changes in the surrounding surface one year after the operation of Line R1. Figure 4 presents the coherence coefficients of SAR images around Wangfu Station and Fangte Station. The subgraphs imply that under the condition of a short temporal baseline, the surface changes are not significant, with relatively coherent coefficients within the entire region (Figure 4a1,a2). The surface changes are significant with low coherent coefficients within the entire region with a long temporal baseline (Figure 4b1,b2).
3.1.2. Local Energy Weight (LEW) Method
In SAR images, the changed area usually covers multiple pixels that are continuously distributed in space. These pixels appear as neighborhoods with strong correlations instead of isolated points distributed far from one another. As the detection accuracy of the combined DI is sensitive to the weight of single DIs, we proposed the LEW method to determine their weights by considering the neighborhood effects. This method involves a total of three steps.
First, each pixel value in the three single DIs was recalculated as follows:
where indicates the recalculated pixel value of the pixel located in line and row (“pixel” hereafter), in the single DI, indicates the value of its neighbor pixel located in line and row and indicates the calculation window size. In this study, represents the recalculated DVDI (“” hereafter), MVDI (“” hereafter) and CDI (“” hereafter). Furthermore, was set as 3. Importantly, the changed area generally shows higher pixel values than the unchanged area. Due to the continuous distribution, pixels in the changed area are mostly surrounded by neighbor pixels, the values of which are also high. That is, their recalculated pixel values are higher than those located within the unchanged area. Therefore, by implementing this step, the differences in pixel values between changed areas and unchanged areas in the single DIs were enhanced. We named this phenomenon “local energy enhancement” in this study.
Secondly, the recalculated pixel value was normalized to 0~1 as follows:
where indicates the normalized value of the recalculated pixel in the single DI.
Thirdly, the pixel values in the combined DI were calculated as follows:
where indicates the values of pixel in the combined DI; , and indicate the combination coefficients; , and indicate the recalculated value of Pixel in the DVDI, MVDI and CDI, separately. , and were calculated as follows:
where , and were calculated by using Formula (5) and indicate the normalized value of the recalculated pixel in the DVDI, MVDI and CDI separately; . In view of Formulas (6)–(9), it is obvious that the combination coefficient is strongly related to the values of . By implementing this step, the differences in pixel values between changed areas and unchanged areas in the combined DI were enhanced. We named this phenomenon “local energy enhancement again” in this study. Therefore, the LEW method can increase the difference between changed areas and unchanged areas in SAR images.
3.1.3. Fuzzy C-Means Method
When analyzing the DIs, the changed area we are interested in is the target, and the unchanged areas is the background. Considerable differences in the pixel values of the background and foreground are conducive to the identification of changed areas. Effective and accurate identification of the changed area from the background is one of the key steps of surface change detection.
The fuzzy c-means (FCM) algorithm considers the statistical characteristics of the image and calculates the membership of each sample to all classes [20,57,58]. After the DIs were obtained, the classical FCM algorithm was used to detect the changed area. This algorithm minimizes an objective function that calculates the within-group sum of squared distances from each data example to each cluster center. FCM alternates between calculating cluster centers, given the membership values of each data example, and calculating the membership values, given the cluster centers. If data samples are defined as feature vectors xk in RS, the objective function (Jm) is expressed as Formula (10).
The formulae to determine membership values and cluster centers are as follows:
where U and V indicate the set of cluster centers and membership matrix, respectively; n and c indicate the number of samples and clusters, respectively; vi indicates the ith cluster center; uik indicates the membership value of the kth data example (xk) for the ith cluster; and Dik (xk, vi) indicates the squared distance between the kth data example and the ith cluster center. Any inner product-induced distance metric can be used.
In this study, the Euclidean distance was used to calculate the distance between each pixel and the cluster center. The clustering number (c) of the FCM algorithm was 2 (changed/unchanged). In order to suppress noise and improve calculation efficiency, the weighting index m of the FCM algorithm was set to 2, and the maximum number of iterations was set to 50 [43,59].
3.2. Accuracy Estimation
The detection results of the single and combined DIs were objectively analyzed by four indices, including the number of false positives (FPs), overall errors (OEs), percentage correct classification (PCC), and kappa coefficient (K). K indicates the consistency between the generated change detection map and ground truth, both of which have a value of falling into the interval [0,1]. The formulae of the four indices are as follow:
where P12 indicates the number of unchanged pixels that were misjudged as changed pixels; P21 indicates the number of changed pixels that were misjudged as unchanged pixels; P11 indicates the number of changed pixels extracted by the different methods; P22 indicates the number of unchanged pixels extracted by the different methods; and P1 and P2 indicate the number of changed/unchanged pixels in the reference truth map, respectively. The higher the PCC value, the better the change detection performance. n indicates the number of pixels.
4. Results and Analysis
4.1. Combined Difference Images of the Proposed CoDI-LEW
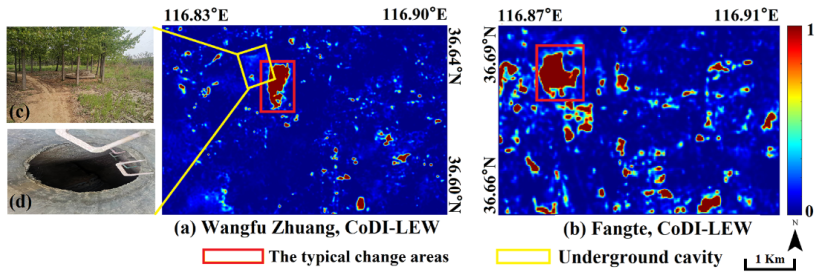
The CoDI-LEWs of Wangfu Station and Fangte Station along Line R1 are shown in Figure 5. This method combined DVDI, MVDI and CDI using the LEW algorithm, which considers both phase and intensity information of SAR images. The pixel weight in each DI was determined based on the local energy of each pixel and its neighborhood pixels. The pixel values of the CoDI-LEW show severe polarization, mostly close to 1 or 0, whereas values ranging from 0.3 to 0.7 are negligible. The mean and variance of CoDI-LEW of Wangfu and Fangte reach 0.0739, 0.0274 and 0.1133, 0.0283, respectively. The difference between the unchanged and changed area is obvious. The two most obvious regions with high CoDI-LEW values are marked by red rectangles; the one in Figure 5a represents the Wangfu Village round Wangfu Zhuang Station, whereas that in Figure 5b corresponds to the Runyuan Experimental School around Fangte Station. These two places are also the main changed areas around the two subway stations from 2019 to 2020. This indicates that the use of CoDI-LEW is feasible to determine the changed area in SAR images.
A special phenomenon is shown in Figure 5a and marked by a yellow rectangle. During the field investigation, we found an underground cavity surrounding Wangfu Village. Although it is falsely recognized as a changed area in the single DIs of DVDI, MVDI and other combined DIs (as elaborated in Section 4.2), it appears as an unchanged area in the CoDI-LEW. The existence of underground cavities causes the surface moisture to differ from that of the surrounding surface, although the difference is not obvious under the condition of a lack of precipitation for a long time. Although not shown in the single SAR image (Figure 2a,b), it is obvious in the intensity difference images (i.e., DVDI and MVDI). The addition of phase information weakens the performance of the underground cavity on the intensity difference images. Results show that the CoDI-LEW can effectively suppresses the speckle noise of SAR images.
4.2. Other Difference Images of the CoDI-DM, CoDI-DMC, DVDI and MVDI
4.2.1. Single Difference Images of the DVDI and MVDI
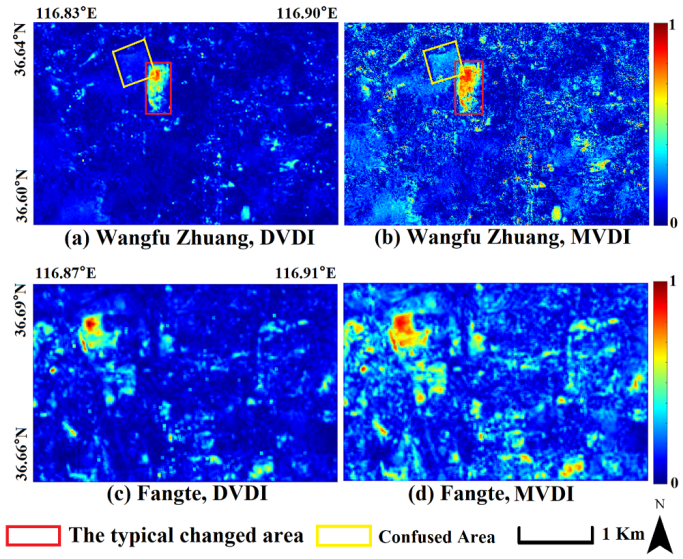
The intensity images collected on 22 January 2019 and 5 January 2020 were used to construct single DIs of Wangfu Zhuang Station and Fangte Station. Figure 6 shows that most pixels of DVDI and MVDI around these two stations are concentrated near 0, indicating that most surrounding surfaces remained relatively stable during the operation of Line R1. However, partial pixels located around Wangfu Village and Beiyuan Viaduct exhibit relatively high values of more than 0.6. Limited pixels show high values close to 1, as shown in Figure 6a,b and marked by a red rectangle. These high values of DVDI and MVDI imply that the operation of Line R1 resulted in dramatic surface changes within local regions.
According to the statistics, Fangte Station has relatively higher DVDI values, with a mean of 0.1173 and a variance of 0.0095; in comparison, the mean DVDI value and variance of Wangfu Zhuang Station are slightly lower, at 0.0829 and 0.0050, respectively. This indicates that Fangte Station underwent more apparent surface change during the monitoring phase. The MVDI exhibits a better ability to distinguish between changed and unchanged features, although with more noise than DVDI. With respect to Fangte Station, the mean pixel value of MVDI was 0.2110, whereas the pixel values of MVDI around Wangfu Zhuang Station were concentrated around 0.1, with a mean of 0.1592. Although the MVDI shows more obvious surface change than the DIVI, it is more discrete than the DVDI, with a higher variance of 0.0171 around Fangte Station and 0.0103 around Wangfu Zhuang Station. Therefore, false information is inevitable, especially in the MVDI. The MVDI uses the local mean to replace the value of the original pixel, considers the spatial neighborhood information of the pixel and plays a role in suppressing noise. However, the introduction of local neighborhood information cannot clearly exhibit the boundary between background area and changed area, which is not conducive to executing the subsequent classification.
Compared to the CoDI-LEW, the mean values of the DVDI and MVDI are both higher, implying that the two single DIs can represent more changed areas. The underground cavity shown within the yellow rectangle seems to have higher pixel values in the DVDI (Figure 6a) than in the CoDI-LEW (Figure 5a). The false detection in the MVDI as indicated by the yellow rectangle in Figure 6b is much more apparent. This phenomenon indicates that single DIs only focusing on intensity information cannot efficiently distinguishing between changed and unchanged areas, especially in relatively complex underground structures.
4.2.2. Combined Difference Images of the CoDI-DM and CoDI-DMC
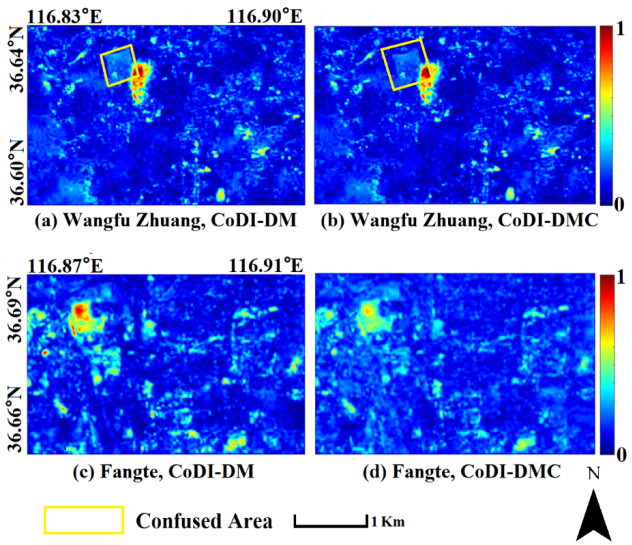
Two combined DIs with equal weights were built to explore the superiority of the LEW method proposed in this study (Figure 7). On the one hand, the CoDI-DM was built by only focusing on the intensity information of SAR images, which combined the DVDI and MVDI with equal weights. On the other hand, the CoDI-DMC was built by focusing on both intensity and phase information of SAR images, combining the DVDI, MVDI and CDI with equal weights.
The CoDI-DMs around Wangfu Zhuang Station and Fangte Station are shown in Figure 7a and Figure 7c, respectively. According to the statistics, the mean and variance of the CoDI-DM in Wangfu Zhuang Station and Fangte Station reach 0.1211, 0.0092 and 0.1641, 0.1410, respectively. The mean values were higher than those in the CoDI-LEWs but lower than those in the DVDIs. There were no rules to follow with respect to the variance of the CoDI-DMs. The CoDI-DMCs around Wangfu Zhuang Station and Fangte Station are shown in Figure 7b and Figure 7d, respectively. The CDI was obtained by the difference algorithm of two coherence coefficient images, i.e., 20190110–20190122 and 20190110–20200105. Compared to the CoDI-DMs, the CoDI-DMCs have higher mean values of 0.1938, 0.2366 and lower variances of 0.0066, 0.0102. This implies that the contrast of changed areas and unchanged areas in the CoDI-DMCs were more obvious than that in the CoDI-DM. The underground cavity indicated by yellow rectangles, was considerably suppressed in the CoDI-DMCs relative to the CoDI-DM. This indicates that although the CoDI-DM is normally superior to the CoDI-DMC in detecting changed areas, the application of the CDI could suppress the false detection of complex underground structures.
In summary, the combined DIs of the CoDI-DM and CoDI-DMC showed different advantages in SAR change detection with respect to normal and complex underground structures, respectively. However, compared to the CoDI-LEW, the two combined DIs with equal weights both resulted in increased false detection with higher means and variances.
4.3. Comparisons of the Detection Results between the Proposed CoDI-LEW and Other DIs
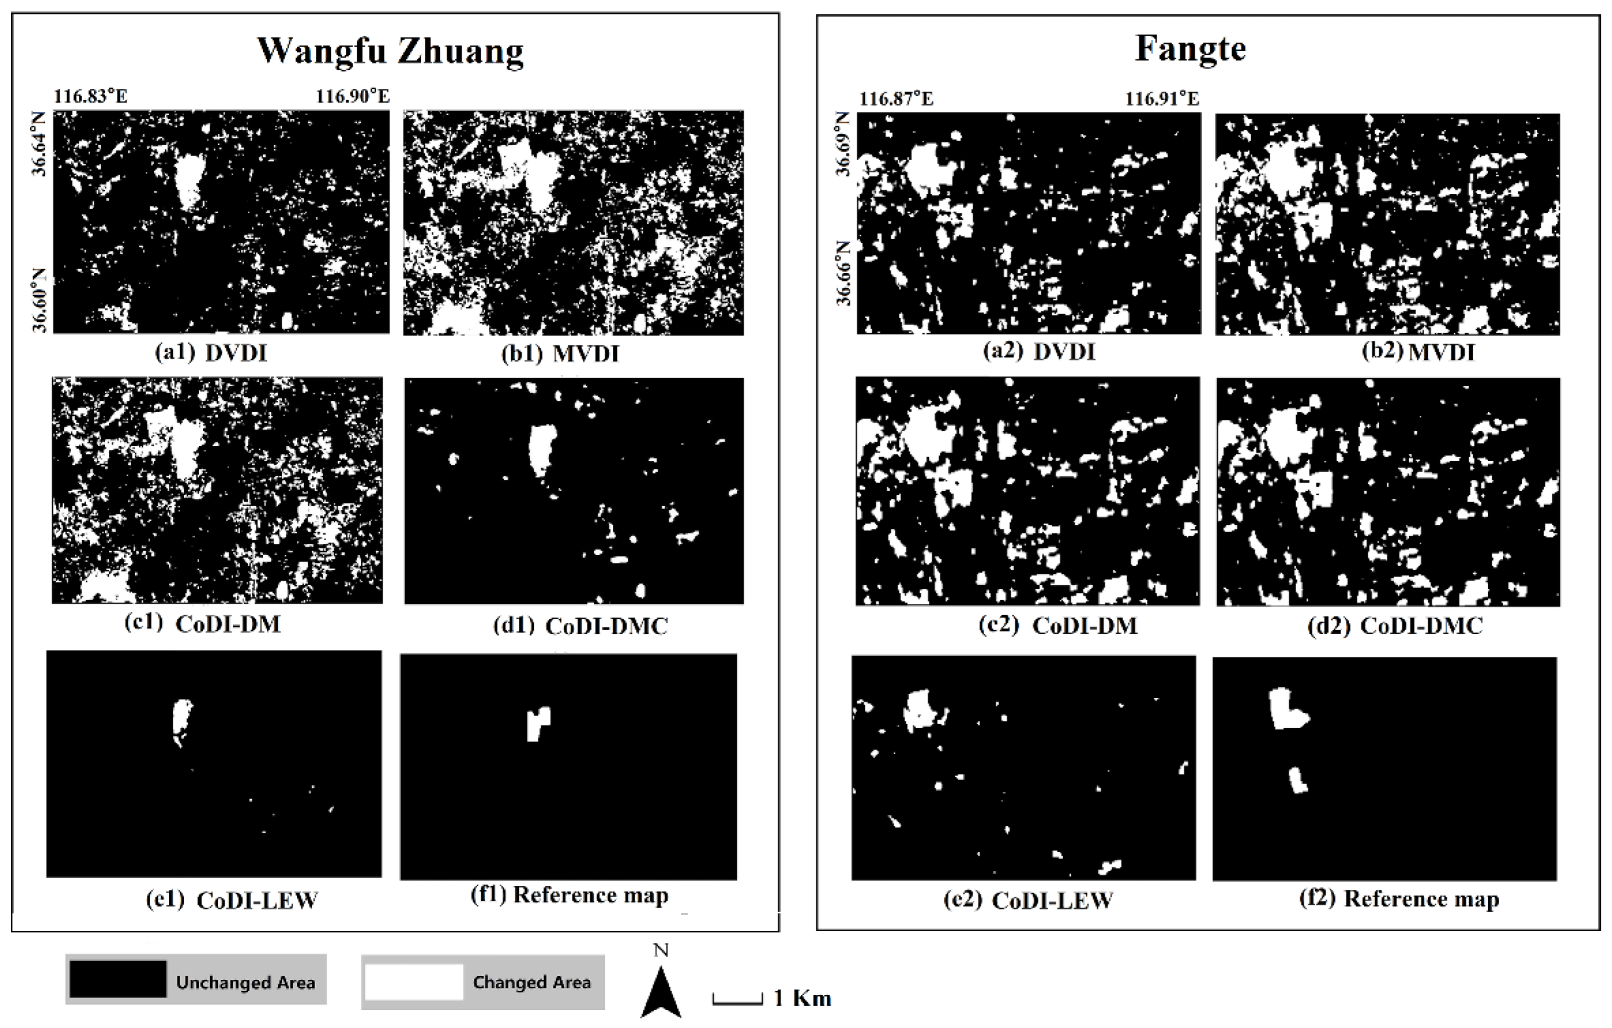
The detection results generated by the single and combined DIs of Wangfu Zhuang Station and Fangte Station are shown in Figure 8. For all these subgraphs, the FCM method was used for cluster analysis, and the changed areas are marked in white. Figure 8f was visually interpreted based on the Sentinel-2 images during the period of 2019–2020 and taken as the reference map in this study. Pixel numbers recognized as the changed areas in these two stations are 1629 and 844, respectively.
At a first glance of the detected changed areas from the five Dis, as shown in Figure 8a–e, only those detected from the CoDI-LEWs exhibited relatively consistent spatial distributions with the reference maps. The detected changed areas from the DVDI, MVDI, CoDI-DM and CoDI-DMC appear much larger than the reference maps in space. According to the statistics, the most misjudged pixels occurred in the MVDI. A total of 43,779 pixels around Wangfu Zhuang Station and 10,235 pixels around Fangte Station were detected as changed areas, which are much larger areas than the actual changed areas (i.e., 1629 and 844 pixels, respectively). Fewer pixels were misjudged in the detection results of the DVDI, i.e., nearly 20,177 pixels around Wangfu Zhuang Station and 6521 pixels around Fangte Station were detected as changed areas. By combining the DVDI and MVDI with equal weights, the pixel numbers of the changed areas were considerably limited to 37,748 and 8539 around Wangfu Zhuang Station and Fangte Station, respectively. However, although the CoDI-DM is superior to the MVDI in suppressing misjudgment of changed areas, the number of misjudged pixels is still considerable, even exceeding the number of pixels misjudged in the DVDI. By combing the three single DIs with equal weights, the CoDI-DMC exhibited a superior ability to distinguish between changed and unchanged areas. For Wangfu Zhuang Station, 24,102 pixels were detected as changed area, whereas the number of pixels detected as changed area for Fangte Station was 6108. Compared to the abovementioned DIs, the CoDI-LEW identified the fewest pixels as changed area, i.e., 2664 pixels around Wangfu Zhuang Station and 2564 pixels around Fangte Station.
Quantitative analysis results are shown in Table 1. The total number of error pixels of the CoDI-LEW method was 920 and 909 for Wangfu Zhuang Station Fangte Station, respectively, representing the fewest errors of the five methods, considerably reducing the false-alarm rate and missed detection rate of the detection results. The PCC of the detection results of the DVDI were as high as 91.3% and 88.31% because the difference operation can be subtracted pixel by pixel, and the detailed information of the weak change region was retained. However, the total number of errors detected by DVDI, MVDI, CoDI-DM and CoDI-DMC was higher than that of CoDI-LEW. Moreover, the PCC and K of the first four DIs were lower than those of the LEW method. Combination of the CDI effectively reduced the FP and OE reduced. Furthermore, the PCC and K were improved to 99.11%, 0.6274 and 98.17%, 0.5297, respectively. Accuracy analysis showed that the LEW approach not only suppressed the influence of noise on the detection results to a considerable extent but also had better detection accuracy than other methods. Moreover, the addition of phase information made the detection results more accurate.
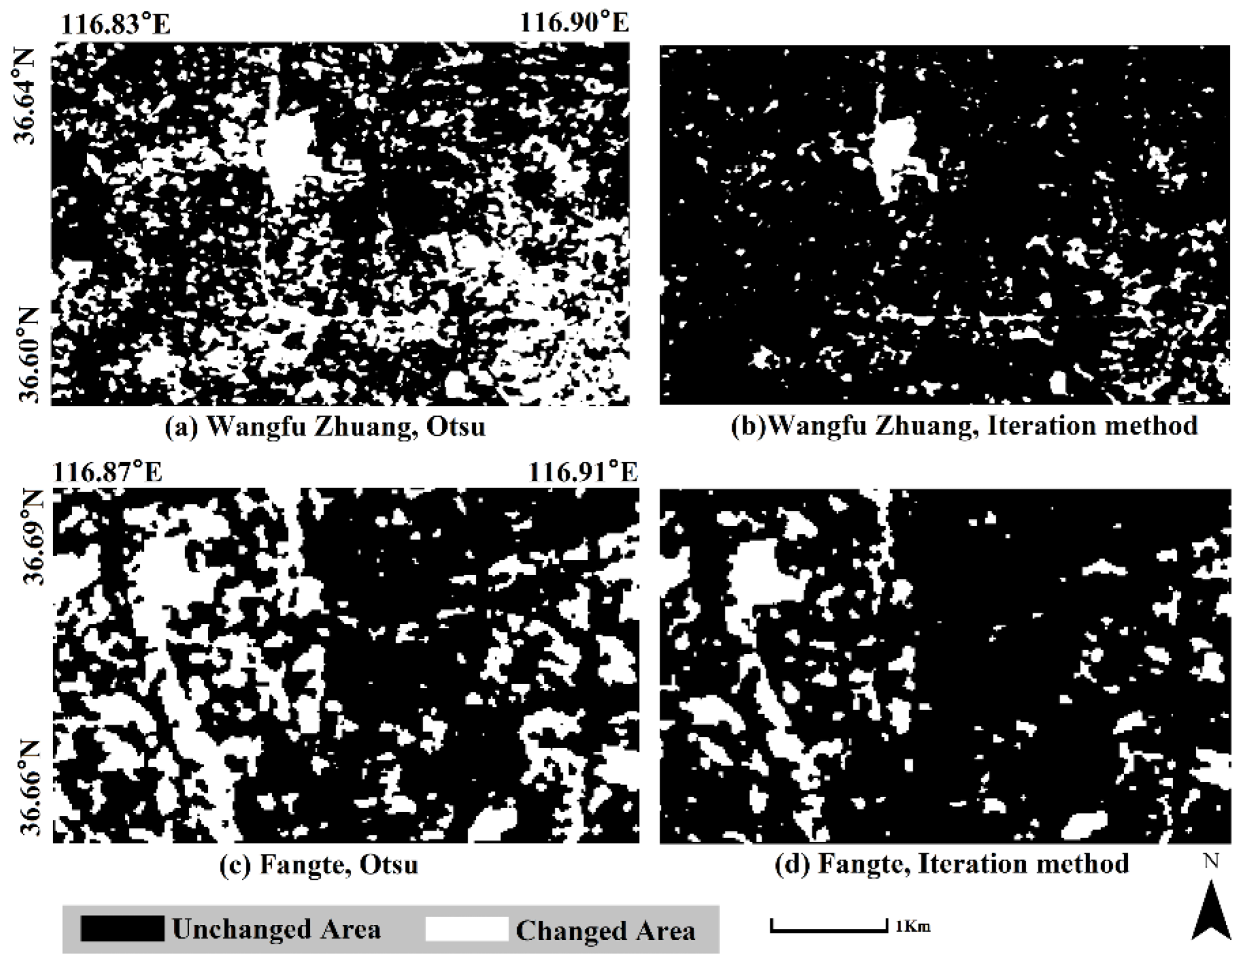
4.4. Comparisons of the Detection Results between the FCM and Other Existing Methods
In addition to the qualitative and quantitative estimation of the proposed CoDI-LEW, in this study, we also explored the availability of the FCM method by comparison with two classic threshold methods. Figure 9 shows the detected areas of the CoDI-LEW using the Otsu method and the global threshold iteration method according to [60,61]. According to the Otsu threshold method, 55,880 and 15,587 pixels were recognized as changed areas around Wangfu Zhuang Station and Fangte Station, respectively. The FP, OE, PCC and K reached 97.12%, 54,293; 66.08%, 0.0369; 95.22%, 14,941; and 69.98%, 0.0604, respectively. In comparison, the numbers of pixels in the detected areas around Wangfu Zhuang Station and Fangte Station using the global threshold iteration method were 15,944 and 8572, respectively, which are much lower than those detected by the Otsu method, in addition to lower FP, OE, PCC and K values of 91.01%, 14707; 90.81%, 0.1473; 92.03%, 8050; and 83.82%, 0.1178, respectively. However, the accuracy was still considerably lower than that of the FCM method, indicating that the proposed FCM method is superior to the classic threshold methods in suppressing noise in SAR images.
4.5. The Applicability of the Proposed SAR Detection Method
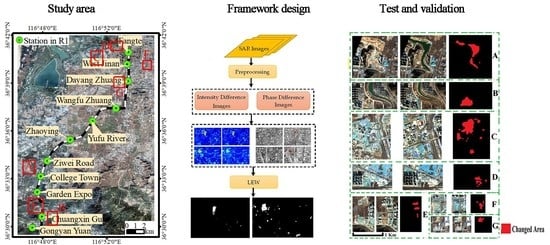
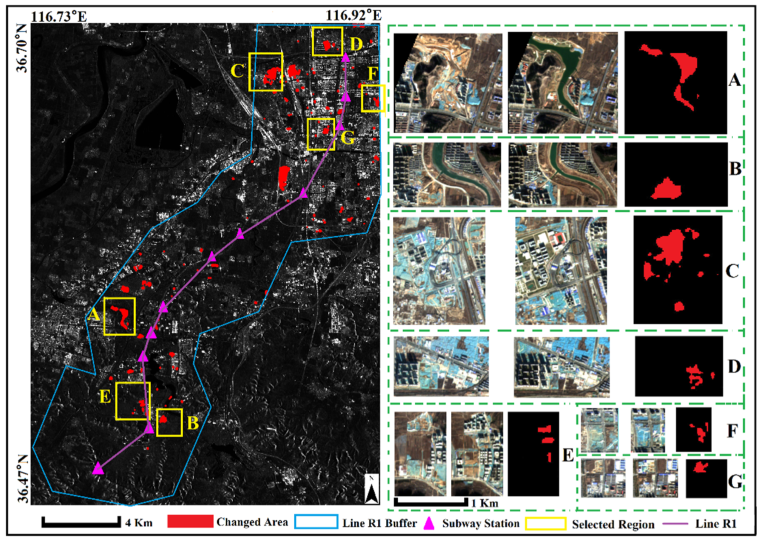
In order to investigate the applicability of the proposed SAR detection method, we applied it to a wider coverage area along Line R1. A buffer of two kilometers centered on Line R1, far beyond Wangfu Zhuang Station and Fangte Station, was selected to execute CoDI-LEW generation and surface change detection (Figure 10). Results show that the number of pixels detected as changed area was 6388, with a changed area covering approximately 2.5 km2. In general, from 2019 to 2020, the surface changes around Line R1 were mainly concentrated in around the northern stations, e.g., Fangte Station, West Jinan Station, Dayang Zhuang Station and Wangfu Zhuang Station. The southwest and central stations of Line R1 show a relatively small changed area, which may be related to the topography of the study area. The terrain in the southwest fluctuates considerably, whereas the urban area is mainly concentrated in the north. We selected seven typical regions and intercepted Sentinel-2 images of corresponding time phases. Figure 10 shows that that the detected changed areas are spatially consistent with actual surface changes, although the types of surface changes differ in these changed areas. For example, Zone A corresponds to a change from bare land to artificial water, and the detection result adequately represented the shape of the changed area. Zones B, D, E, F and G correspond to the construction of new residential buildings. Zone C corresponds to a change from bare land to artificial buildings and playgrounds. In total, the surface change around Line R1 was mainly manifested as transformation of bare land into artificial buildings. In particular, the detection results in Zones E, F and G imply that the surface changes in small regions can be successfully delineated using the proposed SAR detection method. Therefore, we suggest that the proposed SAR detection method can efficiently monitor surface changes with diverse underground structure.
5. Discussion
The detection of surface change along urban rail transit plays an important role in monitoring environmental dynamics, recognizing land use change and assessing disasters. The aim of the present study was to detect surface changes around Wangfu Zhuang Station and Fangte Station one year after the operation of Jinan Rail Transit Line R1. SAR images from Sentinel-1A operated under the Copernicus program were selected as the experimental data. We proposed a novel SAR detection method to delineate the changed areas around Wangfu Zhuang Station and Fangte Station along Line R1.
The workflow involved the three steps of single DI building, CoDI-LEW generation and changed area extraction. In the first step, despite the commonly used DVDI and MVDI referring to the intensity information of SAR images, another single DI named “CDI” referring to the phase information of SAR images was built. The CDI was generated using the difference arithmetic between two groups of coherence coefficients, reflecting the surface change according to analysis of the spatiotemporal baseline and surface moisture conditions, as elaborated in Section 3.1.1. In the second step, we proposed an LEW method to combine the three single DIs, i.e., the DVDI, MVDI and CDI. In this study, the basic purpose of applying the LEW method was to increase the difference between changed areas and unchanged areas in SAR images, as elaborated in Section 3.1.2. One the one hand, by executing Formula (4), the difference of pixel values between changed areas and unchanged areas in the three single DIs was separately enhanced. One the other hand, by implementing Formulas (5)–(9), the difference in pixel values between changed areas and unchanged areas in the combined DI was further enhanced. Finally, the CoDI-LEW was generated according to local energy weights, including both neighborhood information and intensity-phase information. In the third step, we applied the FCM method to delineate the changed areas. The purpose of implementing the FCM method was to cluster the pixels in the CoDI-LEW into the surface changed category and unchanged category, as elaborated in Section 3.1.3, guaranteeing the difference between these two categories as much as possible. Based on the three steps, the changed areas were successfully detected with relatively high accuracy.
The proposed method was assessed with respect to three aspects. First, the detection results and accuracy (Section 4.3) of the proposed CoDI-LEW were compared with two commonly used single Dis, DVDI and MVDI, and two other combined DIs with equal weights, CoDI-DM and CoDI-DMC. Results show that the changed areas detected from the proposed CoDI-LEW present the highest consistency with actual changes (Section 4.1 and Section 4.2). In particular, the application of the CDI efficiently suppressed misjudgments of complex underground structures, e.g., underground cavities. The detection results of the CoDI-LEW contained the fewest misjudged pixels and the highest percentage correct classification and Kappa coefficient (Section 4.3). Secondly, the advantage of combing three single DIs using the LEW method was proven by executing a comparison with two classic threshold methods. Results show that the LEW method improved the detection accuracy in space relative to the Otsu or global threshold iteration method (Section 4.4). Thirdly, the applicability of the proposed SAR detection method was validated by applying it to a 2 km buffer around Line R1. Further observation of eight regions that underwent different surface changes during the monitoring phase revealed that the proposed method can help to delineate the changed areas resulting from diverse kinds of surface changes.
However, the present study is subject to limitations that need to be improved in the future. (1) The change detection around the subway, especially for the subway reserve, requires a short period and frequent detection. However, our method depends on the revisit period of sensors. (2) Given that the VH echo intensity of ground objects is much lower than that of VV polarization, only VV was used in the present study. Therefore, in follow-up research, we will continue to analyze differences in ground object coherence under different polarization conditions. (3) For the clustering method, we used the classical FCM in the present study. We will consider the optimization of the clustering method in future work. (4) In addition, whether the proposed method can be combined with other methods, e.g., deep-feature-based methods, also needs to be explored.
6. Conclusions
In this study, a novel SAR detection method was proposed to delineate the changed areas around Wangfu Zhuang Station and Fangte Station along Jinan Rail Transit Line R1. The workflow comprised three steps: (1) the calculation of the DVDI, MVDI and CDI; (2) the combination of single DIs with the LEW; and (3) FCM clustering of changed and unchanged areas. This method made full use of the intensity and phase information of moderate–high-spatial-resolution SAR images and can be used for time series change detection. The detailed information of the image was preserved, and the noise was suppressed to the greatest extent possible, improving the change detection specificity while retaining detailed information of the changed area. In order to estimate the advantages and applicability of the proposed method, its detection results were compared with those obtained using other existing methods. Experimental results showed that the addition of the CDI and application of the LEW and FCM methods considerable improved the detection accuracy in terms of both quality and quantity. The proposed method is simple and easy to implement, and it is effective for the detection of diverse and complex surface changes around linear features.
Author Contributions
Conceptualization, A.J.; Data curation, A.J., J.D. and B.Z.; Formal analysis, A.J., S.Y., Q.X. and H.Z.; Methodology, A.J. and S.Y.; Software, A.J. and B.Z.; Supervision, S.Y.; Validation, A.J. and J.D.; Writing—original draft, A.J.; Writing—review & editing, A.J., J.D., S.Y., Q.X. and H.Z. All authors have read and agreed to the published version of the manuscript.
Funding
This research was funded by the National Natural Science Foundation of China (grant number 42001364).
Data Availability Statement
Not applicable.
Acknowledgments
The authors would like to acknowledge the data provided by the European Space Agency.
Conflicts of Interest
The authors declare no conflict of interest.
References
- Tamakloe, R.; Hong, J.; Tak, J. Determinants of transit-oriented development efficiency focusing on an integrated subway, bus and shared-bicycle system: Application of Simar-Wilson's two-stage approach. Cities 2021, 108, 102988. [Google Scholar] [CrossRef]
- Wang, H.; Feng, G.; Xu, B.; Yu, Y.; Li, Z.; Du, Y.; Zhu, J. Deriving spatio-temporal development of ground subsidence due to subway construction and operation in delta regions with PS-InSAR data: A case study in Guangzhou, China. Remote Sens. 2017, 9, 1004. [Google Scholar] [CrossRef]
- Jun, M.-J.; Choi, K.; Jeong, J.-E.; Kwon, K.-H.; Kim, H.-J. Land use characteristics of subway catchment areas and their influence on subway ridership in Seoul. J. Transp. Geogr. 2015, 48, 30–40. [Google Scholar] [CrossRef]
- Lin, J.-J.; Gau, C. A TOD planning model to review the regulation of allowable development densities around subway stations. Land Use Policy 2006, 23, 353–360. [Google Scholar] [CrossRef]
- Wang, P.; Wang, L.; Leung, H.; Zhang, G. Super-Resolution Mapping Based on Spatial–Spectral Correlation for Spectral Imagery. IEEE Trans. Geosci. Remote Sens. 2021, 59, 2256–2268. [Google Scholar] [CrossRef]
- Ye, L.; Gu, G.; He, W.; Dai, H.; Lin, J.; Chen, Q. Adaptive Target Profile Acquiring Method for Photon Counting 3-D Imaging Lidar. IEEE Photonics J. 2016, 8, 6805510. [Google Scholar] [CrossRef]
- Ahmed, O.S.; Wulder, M.A.; White, J.C.; Hermosilla, T.; Coops, N.C.; Franklin, S.E. Classification of annual non-stand replacing boreal forest change in Canada using Landsat time series: A case study in northern Ontario. Remote Sens. Lett. 2017, 8, 29–37. [Google Scholar] [CrossRef]
- Yu, S.; Zhang, Z.; Liu, F.; Wang, X.; Hu, S. Urban expansion in the megacity since 1970s: A case study in Mumbai. Geocarto Int. 2021, 36, 603–621. [Google Scholar] [CrossRef]
- Shi, L.; Leichtle, T.; Wurm, M.; Taubenböck, H. The “ghost neighborhood” phenomenon in China—geographic locations and intra-urban spatial patterns. Environ. Plan. B Urban Anal. City Sci. 2022. [Google Scholar] [CrossRef]
- Kasim, A.; Binti, J.; Yusof, M.; Shafri, H. Urban green space degradation: An experience of Kuala Lumpur City. Environ. Manag. Sustain. Dev. 2018, 8, 27. [Google Scholar] [CrossRef]
- Kwon, J.; Kim, Y.; Choi, S.-H. Airspace map design to implement customer-friendly service on unmanned aerial vehicles. Spat. Inf. Res. 2018, 27, 87–95. [Google Scholar] [CrossRef]
- Lingxin, Z.; Junkai, S.; Baijie, Z. A review of the research and application of deep learning-based computer vision in structural damage detection. Earthq. Eng. Eng. Vib. 2022, 21, 1–21. [Google Scholar] [CrossRef]
- Shukla, A.; Jain, K. Automatic extraction of urban land information from unmanned aerial vehicle (UAV) data. Earth Sci. Inform. 2020, 13, 1225–1236. [Google Scholar] [CrossRef]
- Cui, J.; Zhang, X.; Wang, W.; Wang, L. Integration of optical and SAR remote sensing images for crop-type mapping based on a novel object-oriented feature selection method. Int. J. Agric. Biol. Eng. 2020, 13, 178–190. [Google Scholar] [CrossRef]
- Manzoni, M.; Monti-Guarnieri, A.; Molinari, M.E. High-Resolution Sar Coherent Change Detection in Urban Environment. Int. Arch. Photogramm. Remote Sens. Spat. Inf. Sci. 2020, 43, 1569–1575. [Google Scholar] [CrossRef]
- Alberga, V. Similarity Measures of Remotely Sensed Multi-Sensor Images for Change Detection Applications. Remote Sens. 2009, 1, 122–143. [Google Scholar] [CrossRef]
- Hussain, M.; Chen, D.; Cheng, A.; Wei, H.; Stanley, D. Change detection from remotely sensed images: From pixel-based to object-based approaches. ISPRS J. Photogramm. Remote Sens. 2013, 80, 91–106. [Google Scholar] [CrossRef]
- Ma, J.; Gong, M.; Zhou, Z. Wavelet fusion on ratio images for change detection in SAR images. IEEE Geosci. Remote Sens. Lett. 2012, 9, 1122–1126. [Google Scholar] [CrossRef]
- Bergamasco, L.; Saha, S.; Bovolo, F.; Bruzzone, L. Unsupervised change-detection based on convolutional-autoencoder feature extraction. In Image and Signal Processing for Remote Sensing XXV, Proceedings of the SPIE Remote Sensing, Strasbourg, France, 9–12 September 2019; SPIE: Bellingham, WA, USA, 2019; pp. 325–332. [Google Scholar]
- Krinidis, S.; Chatzis, V. A robust fuzzy local information C-means clustering algorithm. IEEE Trans. Image Process. 2010, 19, 1328–1337. [Google Scholar] [CrossRef]
- Wang, R.; Wang, L.; Wei, X.; Chen, J.-W.; Jiao, L. Dynamic graph-level neural network for SAR image change detection. IEEE Geosci. Remote Sens. Lett. 2021, 19, 1–5. [Google Scholar] [CrossRef]
- Li, X.; Du, Z.; Huang, Y.; Tan, Z. A deep translation (GAN) based change detection network for optical and SAR remote sensing images. ISPRS J. Photogramm. Remote Sens. 2021, 179, 14–34. [Google Scholar] [CrossRef]
- Gong, M.; Zhao, J.; Liu, J.; Miao, Q.; Jiao, L. Change Detection in Synthetic Aperture Radar Images Based on Deep Neural Networks. IEEE Trans. Neural Netw. Learn. Syst. 2016, 27, 125–138. [Google Scholar] [CrossRef] [PubMed]
- Liu, T.; Li, Y.; Xu, L. Dual-channel convolutional neural network for change detection of multitemporal SAR images. In Proceedings of the 2016 International Conference on Orange Technologies (ICOT), Melbourne, Australia, 17–20 December 2016; pp. 60–63. [Google Scholar]
- Tang, J.; Cheng, J.; Xiang, D.; Hu, C. Large-Difference-Scale Target Detection Using a Revised Bhattacharyya Distance in SAR Images. IEEE Geosci. Remote Sens. Lett. 2022, 19, 4506205. [Google Scholar] [CrossRef]
- Zhao, S.; Zhang, Z.; Zhang, T.; Guo, W.; Luo, Y. Transferable SAR Image Classification Crossing Different Satellites under Open Set Condition. IEEE Geosci. Remote Sens. Lett. 2022, 19, 4506005. [Google Scholar] [CrossRef]
- Kipf, T.N.; Welling, M. Semi-supervised classification with graph convolutional networks. arXiv 2016, arXiv:1609.02907. [Google Scholar]
- Saha, S.; Mou, L.; Zhu, X.X.; Bovolo, F.; Bruzzone, L. Semisupervised change detection using graph convolutional network. IEEE Geosci. Remote Sens. Lett. 2020, 18, 607–611. [Google Scholar] [CrossRef]
- Qi, X.; Liao, R.; Jia, J.; Fidler, S.; Urtasun, R. 3d graph neural networks for rgbd semantic segmentation. In Proceedings of the 2017 IEEE International Conference on Computer Vision, Venice, Italy, 22–29 October 2017; pp. 5199–5208. [Google Scholar]
- Wanab, L.; Maab, L.; Guoad, J.; Liuac, M.; Ab, D.Y. Slow Feature Analysis Based on Convolutional Neural Network for SAR Image Change Detection. In Proceedings of the 2021 IEEE International Geoscience and Remote Sensing Symposium (IGARSS), Brussels, Belgium, 11–16 July 2021; pp. 3805–3808. [Google Scholar]
- Muhammad, U.; Wang, W.; Chattha, S.P.; Ali, S. Pre-trained VGGNet architecture for remote-sensing image scene classification. In Proceedings of the 24th International Conference on Pattern Recognition (ICPR), Beijing, China, 20–24 August 2018; pp. 1622–1627. [Google Scholar]
- Chaib, S.; Yao, H.; Gu, Y.; Amrani, M. Deep feature extraction and combination for remote sensing image classification based on pre-trained CNN models. In Proceedings of the Ninth International Conference on Digital Image Processing (ICDIP 2017), Hong Kong, China, 19–22 May 2017. [Google Scholar]
- Ge, Y.; Jiang, S.; Xu, Q.; Jiang, C.; Ye, F. Exploiting representations from pre-trained convolutional neural networks for high-resolution remote sensing image retrieval. Multimed. Tools Appl. 2018, 77, 17489–17515. [Google Scholar] [CrossRef]
- Carincotte, C.; Derrode, S.; Bourennane, S. Unsupervised change detection on SAR images using fuzzy hidden Markov chains. IEEE Trans. Geosci. Remote Sens. 2006, 44, 432–441. [Google Scholar] [CrossRef]
- Chen, P.; Jia, Z.; Yang, J.; Kasabov, N. Unsupervised Change Detection of SAR Images Based on an Improved NSST Algorithm. J. Indian Soc. Remote Sens. 2018, 46, 801–808. [Google Scholar] [CrossRef]
- Xu, S.; Liao, Y.; Yan, X.; Zhang, G. Change detection in SAR images based on iterative Otsu. Eur. J. Remote Sens. 2020, 53, 331–339. [Google Scholar] [CrossRef]
- Dai, K.; Li, Z.; Tomás, R.; Liu, G.; Yu, B.; Wang, X.; Cheng, H.; Chen, J.; Stockamp, J. Monitoring activity at the Daguangbao mega-landslide (China) using Sentinel-1 TOPS time series interferometry. Remote Sens. Environ. 2016, 186, 501–513. [Google Scholar] [CrossRef] [Green Version]
- Bazi, Y.; Bruzzone, L.; Melgani, F. An unsupervised approach based on the generalized Gaussian model to automatic change detection in multitemporal SAR images. IEEE Trans. Geosci. Remote Sens. 2005, 43, 874–887. [Google Scholar] [CrossRef]
- Gong, M.; Cao, Y.; Wu, Q. A Neighborhood-Based Ratio Approach for Change Detection in SAR Images. IEEE Geosci. Remote Sens. Lett. 2012, 9, 307–311. [Google Scholar] [CrossRef]
- Mian, A.; Ginolhac, G.; Ovarlez, J.-P.; Atto, A.M. New Robust Statistics for Change Detection in Time Series of Multivariate SAR Images. IEEE Trans. Signal Process. 2019, 67, 520–534. [Google Scholar] [CrossRef]
- Ekinci, A.; Muturi, T.; Ferreira, P.M.V. Aerial Close-Range Photogrammetry to Quantify Deformations of the Pile Retaining Walls. J. Indian Soc. Remote Sens. 2021, 49, 1051–1066. [Google Scholar] [CrossRef]
- Hou, B.; Wei, Q.; Zheng, Y.; Wang, S. Unsupervised Change Detection in SAR Image Based on Gauss-Log Ratio Image Fusion and Compressed Projection. IEEE J. Sel. Top. Appl. Earth Obs. Remote Sens. 2014, 7, 3297–3317. [Google Scholar] [CrossRef]
- Ma, W.; Li, X.; Wu, Y.; Jiao, L.; Xing, D. Data Fusion and Fuzzy Clustering on Ratio Images for Change Detection in Synthetic Aperture Radar Images. Math. Probl. Eng. 2014, 2014, 403095. [Google Scholar] [CrossRef]
- Yaoguo, Z.; Xiangrong, Z.; Biao, H.; Ganchao, L. Using Combined Difference Image and $k$ -Means Clustering for SAR Image Change Detection. IEEE Geosci. Remote Sens. Lett. 2014, 11, 691–695. [Google Scholar] [CrossRef]
- Shi, J.; Liu, X.; Lei, Y. SAR Images Change Detection Based on Self-Adaptive Network Architecture. IEEE Geosci. Remote Sens. Lett. 2021, 18, 1204–1208. [Google Scholar] [CrossRef]
- Shi, J.; Liu, X.; Yang, S.; Lei, Y.; Tian, D. An initialization friendly Gaussian mixture model based multi-objective clustering method for SAR images change detection. J. Ambient Intell. Humaniz. Comput. 2021. [Google Scholar] [CrossRef]
- Song, S.; Jin, K.; Zuo, B.; Yang, J. A novel change detection method combined with registration for SAR images. Remote Sens. Lett. 2019, 10, 669–678. [Google Scholar] [CrossRef]
- Zhang, K.; Fu, X.; Lv, X.; Yuan, J. Unsupervised Multitemporal Building Change Detection Framework Based on Cosegmentation Using Time-Series SAR. Remote Sens. 2021, 13, 471. [Google Scholar] [CrossRef]
- Zhao, C.; Zhang, Q.; He, Y.; Peng, J.; Yang, C.; Kang, Y. Small-scale loess landslide monitoring with small baseline subsets interferometric synthetic aperture radar technique—case study of Xingyuan landslide, Shaanxi, China. J. Appl. Remote Sens. 2016, 10, 026030. [Google Scholar] [CrossRef]
- Papila, I.; Alganci, U.; Sertel, E. Sentinel-1 Based Flood Mapping Using Interferometric Coherence and Intensity Change Detection Approach. Int. Arch. Photogramm. Remote Sens. Spat. Inf. Sci. 2020, 43, 1697–1703. [Google Scholar] [CrossRef]
- Malmgren-Hansen, D.; Sohnesen, T.; Fisker, P.; Baez, J. Sentinel-1 Change Detection Analysis for Cyclone Damage Assessment in Urban Environments. Remote Sens. 2020, 12, 2409. [Google Scholar] [CrossRef]
- Bauer-Marschallinger, B.; Freeman, V.; Cao, S.; Paulik, C.; Schaufler, S.; Stachl, T.; Modanesi, S.; Massari, C.; Ciabatta, L.; Brocca, L. Toward global soil moisture monitoring with Sentinel-1: Harnessing assets and overcoming obstacles. IEEE Trans. Geosci. Remote Sens. 2018, 57, 520–539. [Google Scholar] [CrossRef]
- Balenzano, A.; Satalino, G.; Lovergine, F.; Rinaldi, M.; Iacobellis, V.; Mastronardi, N.; Mattia, F. On the use of temporal series of L-and X-band SAR data for soil moisture retrieval. Capitanata plain case study. Eur. J. Remote Sens. 2013, 46, 721–737. [Google Scholar] [CrossRef]
- Balenzano, A.; Mattia, F.; Satalino, G.; Davidson, M.W. Dense temporal series of C-and L-band SAR data for soil moisture retrieval over agricultural crops. IEEE J. Sel. Top. Appl. Earth Obs. Remote Sens. 2010, 4, 439–450. [Google Scholar] [CrossRef]
- Yin, Q.; Li, Y.; Huang, P.; Lin, Y.; Hong, W. Analysis of InSAR Coherence Loss Caused by Soil Moisture Variation. J. Radars 2015, 4, 689–697. [Google Scholar] [CrossRef]
- Ferretti, A.; Prati, C.; Rocca, F. Nonlinear subsidence rate estimation using permanent scatterers in differential SAR interferometry. IEEE Trans. Geosci. Remote Sens. 2000, 38, 2202–2212. [Google Scholar] [CrossRef]
- Ahmed, M.N.; Yamany, S.M.; Mohamed, N.; Farag, A.A.; Moriarty, T. A modified fuzzy c-means algorithm for bias field estimation and segmentation of MRI data. IEEE Trans. Med. Imaging 2002, 21, 193–199. [Google Scholar] [CrossRef] [PubMed]
- Cai, W.; Chen, S.; Zhang, D. Fast and robust fuzzy c-means clustering algorithms incorporating local information for image segmentation. Pattern Recognit. 2007, 40, 825–838. [Google Scholar] [CrossRef]
- Parker, J.K.; Hall, L.O. Accelerating Fuzzy-C Means Using an Estimated Subsample Size. IEEE Trans. Fuzzy Syst. 2014, 22, 1229–1244. [Google Scholar] [CrossRef]
- He, P.; Shi, W.; Zhang, H.; Hao, M. A novel dynamic threshold method for unsupervised change detection from remotely sensed images. Remote Sens. Lett. 2014, 5, 396–403. [Google Scholar] [CrossRef]
- Ridd, M.K.; Liu, J. A comparison of four algorithms for change detection in an urban environment. Remote Sens. Environ. 1998, 63, 95–100. [Google Scholar] [CrossRef]
Figure 1.
Study area: (a) location of Jinan Rail Transit Line R1, (b) location of the Fangte and Wangfu Zhuang Stations and (c,d) their surroundings.
Figure 1.
Study area: (a) location of Jinan Rail Transit Line R1, (b) location of the Fangte and Wangfu Zhuang Stations and (c,d) their surroundings.

Figure 2.
Sentinel-1 A intensity images around (a,b) Wangfu Zhuang Station and (c,d) Fangte Station.
Figure 2.
Sentinel-1 A intensity images around (a,b) Wangfu Zhuang Station and (c,d) Fangte Station.

Figure 3.
Flow chart of LEW change detection using Sentinel-1 SAR data.

Figure 4.
Coherent difference images around (a) Wangfu Zhuang Station and (b) Fangte Station. Note: (a1,b1) indicate the coherence coefficients between SAR images obtained on 10 January 2019 and 22 January 2019; (a2,b2) indicate the coherence coefficients between SAR images obtained on 10 January 2019 and 5 January 2020. Regions within the red rectangles underwent apparent surface changes during the monitoring phase.

Figure 5.
CoDI-LEWs of (a) Wangfu Zhuang Station and (b) Fangte Station. Note: the CoDI-LEWs are combined by the DVDI, MVDI and CDI with local energy weights. (c,d) Underground cavity around Wangfu Village.
Figure 5.
CoDI-LEWs of (a) Wangfu Zhuang Station and (b) Fangte Station. Note: the CoDI-LEWs are combined by the DVDI, MVDI and CDI with local energy weights. (c,d) Underground cavity around Wangfu Village.

Figure 6.
Single difference images: (a) DVDI and (b) MVDI around Wangfu Zhuang Station and (c) DVDI and (d) MVDI around Fangte Station. Note: these images were derived from SAR images captured during the period between 22 January 2019 and 5 January 2020.
Figure 6.
Single difference images: (a) DVDI and (b) MVDI around Wangfu Zhuang Station and (c) DVDI and (d) MVDI around Fangte Station. Note: these images were derived from SAR images captured during the period between 22 January 2019 and 5 January 2020.

Figure 7.
Combined difference images including (a) CoDI-DM and (b) CoDI-DMC at Wangfu Zhuang Station and (c) CoDI-DM and (d) CoDI-DMC at Fangte Station. Note: the CoDI-DMs combine by the DVDI and MVDI with equal weights, whereas the CoDI-DMCs combine by the DVDI, MVDI and CDI with equal weights.
Figure 7.
Combined difference images including (a) CoDI-DM and (b) CoDI-DMC at Wangfu Zhuang Station and (c) CoDI-DM and (d) CoDI-DMC at Fangte Station. Note: the CoDI-DMs combine by the DVDI and MVDI with equal weights, whereas the CoDI-DMCs combine by the DVDI, MVDI and CDI with equal weights.

Figure 8.
Changed areas detected from multiple difference images around Wangfu Zhuang Station (a1–f1) and Fangte Station (a2–f2). Note: (a,b) are detected from single difference images of the DVDI and MVDI, and (c–e) are detected from combined difference images. The CoDI-DM combines by the DVDI and MVDI with equal weights, the CoDI-DMC combines the DVDI, MVDI and CDI with equal weights and the CoDI-LEW combines the DVDI, MVDI and CDI with local energy weights.

Figure 9.
Detection results obtained threshold methods around (a,b) Wangfu Zhuang Station and (c,d) Fangte Station. Note: (a,c) were detected using the Otsu method, whereas (b,d) were detected using the iteration method.
Figure 9.
Detection results obtained threshold methods around (a,b) Wangfu Zhuang Station and (c,d) Fangte Station. Note: (a,c) were detected using the Otsu method, whereas (b,d) were detected using the iteration method.

Figure 10.
Detection results by LEW method along Jinan Rail Transit Line R1. Note: Regions (A–G) represent eight selected regions with different surface changes during the monitoring phase.
Figure 10.
Detection results by LEW method along Jinan Rail Transit Line R1. Note: Regions (A–G) represent eight selected regions with different surface changes during the monitoring phase.


Table 1.
The accuracy of change detection based on different methods in Fangte and Wangfu Zhuang Stations.
Table 1.
The accuracy of change detection based on different methods in Fangte and Wangfu Zhuang Stations.
| DI | FP (Pixels) | OE (Pixels) | PCC (%) | K | ||||
|---|---|---|---|---|---|---|---|---|
| Wangfu ZHUANG | Fangte | Wangfu Zhuang | Fangte | Wangfu Zhuang | Fangte | Wangfu Zhuang | Fangte | |
| DVDI | 13,053 | 5725 | 13,311 | 5760 | 91.30 | 88.31 | 0.1729 | 0.1808 |
| MVDI | 40,902 | 9548 | 41,067 | 9471 | 73.81 | 80.71 | 0.0548 | 0.1140 |
| CoDI-DM | 33,937 | 7745 | 34,109 | 7799 | 78.19 | 84.33 | 0.0689 | 0.1424 |
| CoDI-DMC | 27,962 | 6915 | 31,300 | 6258 | 80.23 | 85.97 | 0.0723 | 0.1569 |
| CoDI-LEW | 250 | 595 | 920 | 909 | 99.11 | 98.17 | 0.6274 | 0.5297 |
Publisher’s Note: MDPI stays neutral with regard to jurisdictional claims in published maps and institutional affiliations. |
© 2022 by the authors. Licensee MDPI, Basel, Switzerland. This article is an open access article distributed under the terms and conditions of the Creative Commons Attribution (CC BY) license (https://creativecommons.org/licenses/by/4.0/).
Share and Cite
MDPI and ACS Style
Jiang, A.; Dai, J.; Yu, S.; Zhang, B.; Xie, Q.; Zhang, H. Unsupervised Change Detection around Subways Based on SAR Combined Difference Images. Remote Sens. 2022, 14, 4419. https://doi.org/10.3390/rs14174419
AMA Style
Jiang A, Dai J, Yu S, Zhang B, Xie Q, Zhang H. Unsupervised Change Detection around Subways Based on SAR Combined Difference Images. Remote Sensing. 2022; 14(17):4419. https://doi.org/10.3390/rs14174419
Chicago/Turabian StyleJiang, Aihui, Jie Dai, Sisi Yu, Baolei Zhang, Qiaoyun Xie, and Huanxue Zhang. 2022. "Unsupervised Change Detection around Subways Based on SAR Combined Difference Images" Remote Sensing 14, no. 17: 4419. https://doi.org/10.3390/rs14174419
Note that from the first issue of 2016, this journal uses article numbers instead of page numbers. See further details here.