
Spatio-Temporal Patterns and Driving Factors of Vegetation Change in the Pan-Third Pole Region

1
Shaanxi Key Laboratory of Earth Surface System and Environmental Carrying Capacity, College of Urban and Environmental Sciences, Northwest University, Xi’an 710127, China
2
Key Laboratory of National Forestry Administration on Ecological Hydrology and Disaster Prevention in Arid Regions, Northwest University, Xi’an 710127, China
*
Author to whom correspondence should be addressed.
Remote Sens. 2022, 14(17), 4402; https://doi.org/10.3390/rs14174402
Submission received: 20 July 2022
/
Revised: 28 August 2022
/
Accepted: 30 August 2022
/
Published: 4 September 2022
(This article belongs to the Special Issue Correlation between NDVI and Crop Production)
Abstract
:The Pan-Third Pole (PTP) region, one of the areas with the most intense global warming, has seen substantial changes in vegetation cover. Based on the GIMMS NDVI3g and meteorological dataset from 1982 to 2015, this study evaluated the spatio-temporal variation in fractional vegetation coverage (FVC) by using linear regression analysis, standard deviation, correlation coefficient, and multiple linear regression residuals to explore its response mechanism to climate change and human activities. The findings showed that: (1) the FVC was progressively improved, with a linear trend of 0.003•10a−1. (2) The largest proportion of the contribution to FVC change was found in the unchanged area (39.29%), followed by the obvious improvement (23.83%) and the mild improvement area (13.53%). (3) The impact of both climate change and human activities is dual in FVC changes, and human activities are increasing. (4) The FVC was positively correlated with temperature and precipitation, with a stronger correlation with temperature, and the climate trend was warm and humid. The findings of the study serve to understand the impacts of climate change and human activities on the dynamic changes in the FVC and provide a scientific foundation for ecological conservation and sustainable economic development in the PTP region.
1. Introduction
Vegetation is a natural link between soil, atmosphere, and water. It plays a crucial role in energy exchange, water cycling, and biogeochemical cycling on the land surface and is sensitive to the stressful effects of human activities [1,2]. The quantitative assessment of the Intergovernmental Panel on Climate Change (IPCC) Fifth Assessment Report states that, “human activities are likely to have contributed to more than half of the increase in global mean surface temperature (GMST) from 1951 to 2010” [3]. The recently released IPCC AR6 Working Group I report demonstrated that human activities have led to the warming of the atmosphere, oceans, and land since the industrial revolution [4,5]. In the middle-high latitudes of the Northern Hemisphere, previous studies determined that global warming is the primary driving force of prolonged vegetation growth periods [6,7,8,9]. Climate change directly influences vegetation growth by changing vegetation metabolism [10]. Vegetation change is extremely sensitive to climate change, exhibiting dynamic and evolutionary traits, and is employed as an “indicator” of global climate change research [11,12,13]. The fractional vegetation coverage (FVC), which is typically defined as the vertical projection of vegetation (including leaves, stems, and branches) on the ground as a percentage of the total statistical area, represents the density of vegetation and the size of the photosynthetic area of plants [14]. It is an enhancement to the normalized difference vegetation index (NDVI), which partially solves the problem of NDVI easily saturating vegetation with high coverage and makes it difficult to distinguish vegetation with low coverage. It is widely used in remote sensing-based ecological and environmental change monitoring [15,16]. The Pan-Third Pole (PTP) region is experiencing rapid global warming [17]. The Third Pole, with the Tibetan Plateau as the core, is the region with the strongest global warming and the greatest uncertainty about future global climate change impacts [18]. Furthermore, the projected warming of some areas of the PTP region will exceed the 2 °C goal set by the Paris Agreement of the United Nations Framework Convention on Climate Change [17]. There is great uncertainty about the serious consequences of such drastic climate change on the ecology and on human activities in the PTP region [17]. The PTP region is the core area of “the Belt and Road region”, and is also the most fragile ecological environment and the region with the strongest impact of human activities on earth, which is important for human existence and sustainable development [19]. The vegetation in the PTP region is sensitive to climate change and human activities [20]. Climate change is the internal factor driving vegetation change, whereas human activity is an external factor [21,22,23,24]. Under the influence of global climate change and human activities, it is crucial to investigate the spatial and temporal characteristics of vegetation cover in the PTP region and to quantify the correlation between human activities and different climate variables and vegetation cover to understand the environmental conditions, environmental protection, and environmental restoration in the PTP region.
The long time series of NDVI data is useful tools for researching the history of vegetation, monitoring current conditions, and expressing concern about its future [25]. The Global Inventory Monitoring and Modeling System (GIMMS) NDVI3g dataset is the NDVI data with the longest time-series and the broadest coverage, which has obvious advantages in reflecting the dynamic changes in vegetation and is one of the best datasets to describe the dynamic changes in the growth of vegetation [26,27,28]. Currently, many studies have been using this NDVI long-term archive to detect changes and trends from regional level to global level. In particular, many papers have focused on the core area of the Third Pole region—the Tibetan plateau [29,30,31,32]—and the NDVI showed an overall increasing trend. The vegetation cover shows a trend of greening in the middle and high latitudes of the Northern Hemisphere [33,34]. In the Silk Road Economic Belt region, greening and browning of the vegetation coexisted, with the shift occurring in 2000 [35]. In Central Asia, a general increasing trend was found in the NDVI [36,37,38], but Hao et al. (2020) found that the vegetation greening and browning initially coexisted until reaching a turning point in 1994, after which browning dominated [39]. Furthermore, Liu et al. (2021) found that High Mountain Asia (HMA) has generally followed a “warm-wet” trend, but the vegetation after 1998 has been browning; the main reason for the browning is the dual effects of warming and precipitation changes [40]. In northern Eurasia, there was a trend of greening to browning in vegetation cover, but a general trend of greening [41,42]. In addition, the vegetation cover in Inner Mongolia and Mongolia is severely degraded due to overgrazing [43,44]. Additional to the above hotspots, Rustanto et al. (2022) studied the correlation between NDVI and aerosol optical depth (AOD) in the Middle East region, which confirms the significant effect of vegetation cover as having an essential role in dust storm fluctuations [45]. Even detecting long-term trends in NDVI on a global scale, the results show a coexistence of positive and negative trends [46,47,48,49]. The existing research results show that there are variations in the trends in NDVI across different regions, differences in the influencing factors of NDVI changes in vegetation in different regions, and that the main influencing factors also differ across time periods. Small regional studies lack general applicability, whereas large regional studies obfuscate regional peculiarities and fail to provide a clear explanation of the evolutionary characteristics and influencing factors of vegetation in the Pan-Third Pole region. This study analyzed the spatio-temporal changes in the FVC and focused on interactions of climate change and human activities in the process of vegetation growth using GIMMS NDVI3g and meteorological dataset from 1982 to 2015 with linear regression analysis, standard deviation, multiple regression residuals and other methods. The first aim was to understand the driving mechanism of spatio-temporal changes in FVC in the PTP region with a fragile ecological environment and strong human-land interaction. The second aim was to identify the main control areas of climate change and human activities to provide a scientific basis and decision support for the conservation of vegetation resources and the mechanisms of vegetation-climate system interaction and feedback.
2. Materials and Methods
2.1. Study Area
The PTP is in the hinterland of Asia and Europe, with the Tibetan Plateau as the majority of the Third Pole extending westward and including, the Tibetan Plateau, Pamirs Plateau, Hindu Kush, Tian Shan, Iranian Plateau, Caucasus, and Carpathians [17]. The PTP region hosts a substantial part of the “Silk Road Economic Belt” and consists of over 20 countries and regions with an area of 20 million square kilometers and a population of over 3 billion [17]. The terrain of the PTP region is complex and dominated by mountains, hills, and plains, extending from the Third Pole and expanding to the west and north. The massive mountain system that runs east to west generates the skeleton of the PTP landscape. The climate type is complicated, dominated by a normal monsoon-arid climate system, and the substratum is intricate, diverse, and vulnerable [50]. The temperature varies by up to 30 °C from north to south. Precipitation is affected by the monsoon system and annual precipitation varies significantly by region, with a maximum of 4800 mm in the southern Tibetan Plateau, South Asia, and central Europe, and minimum of less than 500 mm in the Middle East and Central Asia [50]. Forest ecosystem types predominate in Southeast Asia, Russia, and Europe; grassland and desert ecosystem types in Central Asia; farmland ecosystem types in South Asia; and farmland, forest, grassland, and desert ecosystem types are roughly proportional in East Asia [51]. Due to regional differences in climate change, the study area was divided into seven subregions (Figure 1) based on physical geography, socioeconomic development characteristics, and the degree of close exchange and co-operation with China to better highlight the spatial and temporal evolution characteristics of the FVC in different regions: East Asia (EAS), South Asia (SAS), Southeast Asia (SEA), Central Asia (CAS), West Asia (WAS), Central and Eastern Europe (excluding Russia) (CEU), and Russia (RUS).
2.2. Materials
NDVI data were obtained from the GIMMS NDVI3g dataset with a spatial resolution of 8 km and temporal resolution of 15 days (http://ecocast.arc.nasa.gov/pub/gimms/, accessed on 19 July 2022) (January 1982 to October 2015). During the synthesis and calculation process, the GIMMS dataset was pre-processed using radiometric correction, geometric correction, atmospheric correction, and co-ordinate conversion to ensure the quality of the data was guaranteed [36]. Because the maximum NDVI value composite (MVC) (a maximum daily NDVI value every 15 days) minimizes atmospheric effects, scan angle effects, cloud contamination, and solar zenith angle effects [52], we used the largest 15-day MVC for a month to produce the monthly NDVI dataset. Land cover data were obtained from the MODIS standard land cover product MCD12Q1, with an International Geosphere–Biosphere Programme (IGBP) classification scheme and 8 km spatial resolution. Meteorological data (temperature and precipitation) with a spatial resolution of 5 km were obtained from Google Earth Engine (GEE) (http://earthengine.google.com, accessed on 19 July 2022) (January 1982 to October 2015) using the “TerraClimate: Monthly Climate and Climate Water Balance for Global Terrestrail Surface, University of Idaho” dataset. The spatial resolution was resampled to 8 km and projected as a cylindrical equal area.
2.3. Methods
In this paper, linear regression analysis, standard deviation, multiple regression residuals, and partial correlation analysis were used to analyze the spatio-temporal evolution characteristics and driving factors of vegetation change in PTP region. The workflow of this study is shown in Figure 2:
2.3.1. Dimidiate Pixel Model
The FVC can effectively reduce the uncertainty caused by the spectral characteristics of the unvegetated regions and improve the accuracy of the analysis and has been widely used in previous studies [36,53,54]. Therefore, the FVC of the image is equal to the difference between the vegetation index and bare ground vegetation index [55]. The calculation formula is as follows:
where FVC is the fractional vegetation cover (%), NDVI is the normalized vegetation index value of the image element, NDVIsoil (NDVImin) is the NDVI value of pure soil pixels, and NDVIveg (NDVImax) is the NDVI value of pure vegetation pixels. Because of the inherent noise in the image, the extreme NDVI values are not always NDVImax and NDVImin, hence, the values are decided by the image scale and image quality. In the absence of measured data, the NDVImax and NDVImin values are considered as the maximum and minimum values within the confidence interval for a certain confidence level of the image. In this study, NDVImax is defined as NDVI values at a 95% cumulative frequency in forest, and NDVImin is defined as NDVI values at a 5% cumulative frequency in bare land and sparse vegetation.
FVC = (NDVI − NDVIsoil)/(NDVIveg − NDVIsoil)
2.3.2. Trend Analysis
In this study, the spatial and temporal evolution trends of vegetation cover in the PTP region were analyzed using one-dimensional linear regression analysis from 1982 to 2015 and the stability of the FVC in the PTP region was expressed as standard deviation (SD).
- (1)
- Theil–Sen median trend analysis and Mann–Kendall significance test
Theil–Sen median trend analysis is a robust non-parametric statistical trend method that can be used to reflect the FVC trend [56,57]. In this study, the Theil–Sen median trend analysis was used to simulate the spatial and temporal trends of vegetation cover in the PTP from 1982 to 2015 and a raster-by-raster simulation of the trends of the FVC in the study area. The calculation formulae are as follows:
where SFVC is the median slope of n(n−1)/2 data combinations, and FVCi and FVCj are the average image element values for years i and j (1982 ≤ i ≤ j ≤ 2015), respectively. When > 0, the FVC tends to increase; otherwise, the FVC tends to decrease.
Mann–Kendall is a non-parametric test that may be used to determine if time-series data are trending upward or downward because it does not require the sample to follow a particular distribution and is unaffected by a few abnormalities [58,59]. The calculation formula is as follows:
Setting {FVCi}, i = 1982, 1983, …, 2015, define the Z-statistic as:
where n is the length of the year and sgn is the sign function. In this study, the significance test of FVC change trends was judged by a = 0.05. The trend of vegetation cover change in the study area over 34 years was classified into five classes by combining SFVC and Z values (Table 1).
- (2)
- Standard deviation (SD)
SD is a commonly employed measure of variation and diversity that demonstrates how much variation or dispersion exists around the mean (mean or expected value) [60]. A low standard deviation indicates that the FVC values of each image element tend to be very close to the mean, whereas a high standard deviation indicates that the FVC of each image element is farther from the mean.
where Si is the standard deviation (SD), i is the study year, FVCi is the FVC value in year i, and is the multi-year average vegetation cover for the study period. The larger the SD value, the greater the variation indicated, and vice versa. The Natural Breaks (Jenks) method was used to classify the SD into five categories: High fluctuation (Si > 0.185), higher fluctuation (0.052 < Si < 0.185), moderate fluctuation (0.032 < Si < 0.052), lower fluctuation (0.015 < Si < 0.032), and low fluctuation (0 < Si < 0.015).
2.3.3. Multiple Regression Residual Analysis
Multiple regression residual analysis is a prevalent technique for analyzing the impacts and relative contributions of human activities and climate change on plant cover change [61,62]. The method had three steps: (1) based on the FVC in the growing season and the time-series data of annual mean temperature and annual precipitation, a binary linear regression model was established with FVC as the dependent variable and temperature and precipitation as the independent variables, and the parameters in the model were calculated. (2) Based on the temperature and precipitation data and the parameters of the regression model, the predicted value of the FVC (FVCCC) was calculated, which represents the influence of climate factors on vegetation FVC. (3) The difference between the observed value of the FVC (FVCobs) and the predicted value of the FVC (FVCCC), that is, the FVC residual (FVCHA), was calculated to represent the influence of human activities on the FVC. The specific calculation formula was as follows:
where FVCobs and FVCCC represent the observed value of the FVC based on remote sensing images and the predicted value of the FVC based on regression models (dimensionless), respectively; a, b, and c are model parameters; T and P is the average temperature and accumulated precipitation of the growing season in °C and mm, respectively; and FVCHA is the residual. FVCHA > 0 indicates a positive impact of human activities, FVCHA < 0 indicates a negative impact of human activities, and FVCHA = 0 indicates a relatively weak impact of human activities.
FVCCC = a × T + b × P + c
FVCHA = FVCobs − FVCCC
2.3.4. Partial Correlation Analysis
The geographic system is a complex multifactor system, especially in the system composed of many factors, and change in one variable will inevitably impact another variable. When two variables are associated with a third variable, partial correlation analysis disregards the influence of the third variable and focuses on the correlation between the first two [63]. The partial correlation coefficients of the FVC with precipitation and temperature were calculated as follows:
where rxy is the partial correlation coefficient between the two variables x and y, whose value ranges from −1 to 1; xi and yi are the FVC in the ith year and mean temperature or precipitation, respectively; x is the mean FVC from 1982 to 2015; and is the mean of the temperature or precipitation in the growing season. The partial correlation coefficients passed the significance level determined using the t-test.
2.3.5. Driving Factors of FVC Change
The linear trend rates of FVCCC and FVCHA in the PTP region from 1982 to 2015 were calculated using Equation (2), showing the trends in FVC changes due to climate change and human activities, respectively. When Slope > 0, climatic change or human activities had a positive effect on vegetation growth; conversely, when Slope < 0, they had a suppressive effect. To properly analyze the impacts of climate change and human activities on vegetation growth status, Table 2 identifies the main drivers of FVC changes throughout the PTP growing season [64].
3. Results
3.1. Spatial and Temporal Evolution Characteristics of the FVC
3.1.1. Changes in Overall Characteristics
The statistical chart of the annual average value of the FVC in the PTP region over 34 years showed a fluctuating and slowly increasing trend (Figure 3a), with a value range of 43.79–47.59% and multi-year average of 45.65%. The FVC reached its highest value in 1994 and lowest value in 1985 and fluctuated around 45.5% until the year 2000 when it stabilized. From 1982 to 2015, the average FVC trend rate in the PTP region was 0.003•10a−1, showing greater growth in the FVC in the studied area. At the same time, a phase change in the rising trend of FVC is observable, with 1982 to 1994 being a rapid rising period, with a growth rate of 0.0018•a−1; from 1994 to 2003, the vegetation browns, with a decline rate of −0.0008•a−1; and after 2003, the vegetation gradually greens, with a growth rate of 0.0008•a−1.
During the PTP region growing season from 1982 to 2015, the range of the FVC standard deviation values was between 0 and 0.49, with an average SD value of 0.03, which is near to a normal distribution. The spatial stability pattern shows that there were significant regional variances in FVC stability (Figure 3b). The proportions in each classification were ranked as low fluctuation (37.41%) > moderate fluctuation (32.73%) > lower fluctuation (23.56%) > higher fluctuation (6.24%) > high fluctuation (0.06%). The low fluctuation region was found primarily in the Central Siberian Plateau, east Siberian Mountains, and northern Central Asia; the moderate fluctuation region was distributed in the primarily southern West Siberian Plain, Eastern European Plain, and middle and lower Yangtze River Plain in China; the lower fluctuation region was mostly in the Qinghai–Tibet Plateau, Iranian Plateau, West Asia, and Southeast Asia; and the higher fluctuation and high fluctuation region was more scattered and lacked agglomeration.
Figure 3c shows the spatial pattern of multi-year average FVC in the PTP region, with a mean FVC of 45.58%, which is a medium-low cover level. The high-value regions were mostly in the middle-lower Yangtze River Plain, Eastern European Plain, and southern Siberian Plain, whereas the low-value regions were primarily in western Mongolia, Qinghai–Tibet Plateau, Central Asia, West Asia, and Eastern and Northern Russia (excluding Russia). Overall, the lack of light and heat energy caused by the perennial low temperature in the high-latitude regions is not suitable for the growth of vegetation and the FVC value was lower. The mixed forests and evergreen needle-leaf forests in the middle-latitude regions occupy a larger area and, thus, the FVC value was moderate in these regions. Low-latitude regions are dominated by evergreen needle-leaf forests and evergreen broad-leaf forests in the east and, thus, the FVC value was higher.
A statistical multi-year trend rate (Slope) by pixel for FVC in the PTP region shows that average trend rate of 0.003•10a−1 over 34 years (Figure 3d). The spatial pattern evolution characteristics were as follows: (1) the proportion of serious degradation was 12.19% and the proportion of slightly degradation was 11.16%, with concentrations in the middle Siberian Plateau, Northeast Plain, western Saudi Arabia, Kazakhstan, and eastern Aral Sea; (2) the proportion of unchanged was 39.29%, primarily in northwestern China, northern Central Asia, western South Asia; (3) the proportion of obvious improvement was 39.29% and the proportion of mild improvement was 13.53%, mostly found in East Siberian highlands, Eastern European plains, India, and north-central China at high latitudes. Overall, there was high stability of the FVC in the study area over 34 years, with twice as many obvious improvements as serious degradation, a slow increase in the FVC, and gradual ecological improvements.
3.1.2. Trend Analysis of Subregions
The multi-year mean FVC in subregions was ranked as Southeast Asia (94.16%) > Central and Eastern Europe (excluding Russia) (78.38%) > South Asia (51.15%) > Russia (46.95%) > East Asia (40.88%) > Central Asia (24.91%) > West Asia (17.08%). The average trend rate (Slope) of the FVC in subregions was ranked as South Asia (0.68•10a−1) > Central and Eastern Europe (excluding Russia) (0.47•10a−1) > West Asia (0.44•10a−1) > East Asia (0.18•10a−1) > Russia (0.17•10a−1) > Central Asia (0.12•10a−1) > Southeast Asia (0.01•10a−1), with South Asia increasing the fastest and Southeast Asia increasing the slowest but still with an overall growing trend (Figure 4). The spatial-temporal variation in the FVC in subregions was statistically analyzed (Table 3). The largest proportion of obvious improvement was in South Asia (33.98%) and the smallest in Southeast Asia (8.19%). The largest proportion of serious degradation was in Central Asia (14.96%), while Central and Eastern Europe (excluding Russia) had the smallest proportion (6.32%). Southeast Asia had the highest vegetation stability with 67.22% and Central and Eastern Europe (excluding Russia) had the lowest vegetation stability with the smallest proportion (25.22%). Figure 3d shows the significant geographic variation in FVC trends within the subregions, and seven sample regions were selected for assessment based on land use types (Figure 5). Sample6 showed the most obvious greening trend with a slope of 0.015•10a−1; followed by sample1, with a slope of 0.012•10a−1. Sample4 showed the most obvious browning tendency (Slope =−0.015•10a−1), followed by the slope of sample2 is −0.014•10a−1 (Figure 6). The mean FVC was stable or slightly increasing in all subregions. However, the percentage of degraded areas may be about 30% in Central Asia, 28.87% in Russia, and 24.34% in East Asia. The browning of vegetation is a much more important issue that must be given attention. In general, the regions where the FVC tended to improve were in shrubs and mixed forests at middle and high latitudes, whereas the FVC in humid and semi-humid regions at relatively low elevations in Southeast Asia and Central Asia showed a degradation trend. Global warming may have improved vegetation growth conditions in high-altitude and cold regions, while the degradation of vegetation in regions with lower altitudes and better climatic conditions may be caused by human activities.
3.2. Analysis of the Driving Factors of the FVC
3.2.1. Response of FVC Change to Climate Change
From 1982 to 2015, the geographic variability of FVCCC in the PTP region was significant, ranging from 0.078 to 0.25•10a−1 and with a mean value of 0.0013•10a−1 (Figure 7). Central and Eastern Europe (excluding Russia) experienced the greatest rate of increase in the FVC (Slope = 0.0061•10a−1), followed by East Asia (Slope = 0.0014•10a−1) and Central Asia (Slope = 0.00059•10a−1), and only Southeast Asia exhibited a decreasing trend in FVCCC under the influence of climate change (Slope =−0.00032•10a−1). Statistical analysis showed that the proportion of climate change having a suppressive effect on the increase in vegetation cover was 42.41% and was found mostly in the northeastern Aral Sea, southern West Asia, central Russia, and Southeast Asia. The proportion of climate change contributing to the increase in the FVC was 57.59%, found mostly in northern Russia, Central and Eastern Europe, eastern China, and northern West Asia. The trend of FVCCC shows that, except Southeast Asia, all subregions were positively affected by climate change.
The FVCCC trends (Slope) were computed for the subregions (Figure 8), showing that climate change had the greatest suppression on the increase in vegetation in Southeast Asia, with the proportion of suppression as high as 71.38%. Climate change had the most obvious promoting effect on the increase in the FVC in Central and Eastern Europe (excluding Russia), with the percentage of promoting growth reaching 84.63%, and the suppressing and promoting effects of climate change on the increase in vegetation cover in South Asia, West Asia, and Central Asia were comparable. Climate change promoted the growth of vegetation at high latitudes but suppressed the growth of vegetation at low latitudes, while vegetation changes in mid latitudes responded insignificantly to climate change.
3.2.2. Response of the FVC Change to Human Activities
The FVCHA in the PTP region gradually increased from 1982 to 2015, ranging from −0.14 to 0.40•10a−1 and with a mean value of 0.0011•10a−1 (Figure 9). South Asia had the highest rate of FVCHA (Slope = 0.0068•10a−1), followed by West Asia (Slope = 0.0024•10a−1), and Southeast Asia had the slowest rate (Slope = 0.0002•10a−1). Conversely, the FVCHA in Central and Eastern Europe (excluding Russia), East Asia, and Central Asia showed a decreasing trend as a result of human activities, with the greatest rate of decrease found in Central and Eastern Europe (excluding Russia) (Slope =−0.0008•10a−1), followed by Central Asia (Slope =−0.0006•10a−1) and East Asia (Slope =−0.0003•10a−1). Statistical analysis showed that the proportion of the area where human activities had a suppressing effect on the increase in the FVC was 47.11%, mainly in Southeast Asia, central Russia, and northeastern East Asia. These regions have more developed economies and higher population densities and economic growth, including engineering and construction activities, which has decreased the FVC. Due to human activities, the FVC has risen by 52.89%, primarily in eastern China, northern West Asia, southern South Asia, and northeastern Russia. In these regions, the implementation of ecological projects has a significant impact on ecological engineering and human activities that promote vegetation growth.
Statistics on the trends (Slope) of FVCHA in the subregions are shown in Figure 10, which reveals that human activities had the greatest suppressing effect on the increase in vegetation cover in Central Asia, with the proportion of suppression up to 56.26%. Human activities had the most obvious promoting effect on the increase in vegetation cover in South Asia, with the proportion of promoted growth up to 67.63%. Human activities had comparable suppressing and promoting effects on the vegetation cover in East Asia, Russia, and Central and Eastern Europe (excluding Russia). The suppressive and promoting effects of human activities on the FVC increase were comparable. Human activities had a promoting effect on vegetation restoration in the middle and low latitudes, while the suppressing effect on vegetation cover in arid and semi-arid areas at low latitudes and sparse shrubs at high latitudes was obvious. The positive driving and negative suppressing effects of human activities on vegetation growth co-exist, while the promoting effect was greater than the suppressing effect.
3.2.3. Driving Factors of FVC Change
The effects of climate change and human activities on the FVC variability in the PTP region showed significant spatial variation (Figure 11) and the effects of the two factors on FVC variations in the same region were significantly different. Among the seven subregions, the trend rate (Slope) of FVC change was greater than 0. South Asia had the greatest increase in the FVC (Slope = 0.0079•10a−1), followed by Central and Eastern Europe (excluding Russia) (Slope = 0.0061•10a−1), whereas Central Asia had the slowest increase in the FVC (Slope = 0.0002•10a−1). In general, (1) climate change contributes to the increase in the FVC in approximately 34.71% of regions, primarily in southeastern and western Russia, northern West Asia, eastern China, and India; the proportion of regions in which climate change suppressed the increase in the FVC was nearly 6.32%, primarily in northern Russia and northern South Asia and dispersed in other regions. The area where human activities promoted an increase in the FVC was nearly 8.58%, primarily in northern South Asia, northern East Asia, and the south-central region of Russia; (2) the area of 1.75% of the decreasing FVC in the entire PTP region was the result of the combined effect of climate and human activities; with climate change playing a dominant role in 5.93%, primarily in Southeast Asia. Human activities dominated in 12.51% of regions, mostly in the northeastern portion of East Asia and northwestern portion of Russia; (3) the 30.2% change in vegetation cover in the PTP region was unrelated to climate change or human activities and was mostly found in the north of Central Asia, Central Asia, the Qinghai–Tibet Plateau, and other areas with low vegetation cover and population density.
According to the statistical results in Table 4, climate change and human activities were the primary driving forces of increasing FVC in South Asia, West Asia, and Russia; climate change was the primary driving force of increasing FVC in Central and Eastern Europe (excluding Russia), East Asia, and Central Asia; and human activities were the main driving force for increasing FVC in Southeast Asia. In the past 34 years, climate change and human activities contributed more to the increase in the FVC in the PTP region than they suppressed it, resulting in a gradual increase in the FVC.
3.3. Correlation Analysis of the FVC and Climatic Factors
3.3.1. Characteristics of Inter-Annual Variability of Climate Factors
During the 34-year period, the mean temperature in the PTP region was 4.86 °C, with an average trend rate of 0.326 °C•10a−1 and a generally slow increasing trend (Figure 12a), accompanied by a warming trend in the general climatic background. Since 1982, the highest temperature was 5.99 °C in 2007, which was 23% above the mean temperature, whereas the lowest temperature was 3.88 °C in 1987, which was 20% below the mean temperature. The annual mean temperature and trend of change in the study area varied significantly in space and time (Figure 13a,b), ranging from −21.01 to 30.28 °C and decreasing with latitude (the average altitude of the Qinghai–Tibet Plateau is above 4000 m, which causes the annual mean temperature to be lower) and temperature at high latitudes to gradually decrease with increasing longitude, showing general trends of decreasing from south to north. From southwest to northeast, the main tendency was downward. Additionally, there were significant regional differences in annual mean temperatures among the seven subregions, in the following order: Southeast Asia (24.08 °C) > South Asia (20.71 °C) > West Asia (20.11 °C) > Central and Eastern Europe (excluding Russia) (8.98 °C) > Central Asia (8.44 °C) > East Asia (5.56 °C) > Russia (−4.78 °C). The high-temperature regions were mainly in the lower latitudes of the Indian Peninsula and Arabian Peninsula, while temperature zones with low values were found in the Qinghai–Tibet Plateau and the majority of northern Mongolia and Siberia.
The spatial variability in the inter-annual rate of temperature change (Slope) was evident in the PTP region (Figure 13b), with values ranging from −0.19 to 0.57 °C•10a−1 and a mean value of 0.08 °C•10a−1. The zonal statistics in Figure 13b show that the inter-annual rate of temperature change (Slope) was as follows: Central Asia (0.14 °C•10a−1) > West Asia (0.13 °C•10a−1) > Russia (0.08 °C•a−1) > Central and Eastern Europe (excluding Russia) (0.07 °C•a−1) > South Asia (0.06 °C•a−1) > East Asia (0.04 °C•a−1) > Southeast Asia (0.02 °C•a−1), showing that high latitudes warmed more rapidly than low latitudes.
From 1982 to 2015, the average annual precipitation in the PTP region was 567.72 mm, with an average trend rate of 10.09 mm•10a−1 and showing a steady increasing trend (Figure 12b). The driest year was 1992, with an annual precipitation of 536.23 mm, which was 5.51% below the average precipitation; the year with the heaviest precipitation was 2010, which was 7.13% above the average precipitation. Based on the annual mean precipitation (Figure 14a) and the significance of the changing trend (Figure 14b), the annual precipitation ranged from 15.23 to 8253.12 mm. The average annual precipitation for the subregions was ranked as follows: Southeast Asia (2355.86 mm) > South Asia (910.06 mm) > Central and Eastern Europe (excluding Russia) (644.35 mm) > East Asia (506.45 mm) > Russia (439.81 mm) > Central Asia (251.47 mm) > West Asia (214.37 mm). Indonesia had the highest annual precipitation with a multi-year average of 5000 mm. The Arabian Peninsula, Iran, Russia, and northern China had low precipitation. Turkey and Georgia are affected by the Mediterranean climate and, thus, had higher annual precipitation than the surrounding regions.
Regional differences in the inter-annual precipitation change rate (Slope) in the PTP region were obvious (Figure 14b), with values ranging from −35.82 to 78.63•10a−1, with a mean of 9.6 mm•10a−1. Zonal statistics for Figure 14b shows that the inter-annual rate of precipitation changes (Slope) is as follows: Southeast Asia (58.52•10a−1) > Central and Eastern Europe (excluding Russia) (28.21•10a−1) > South Asia (12.15•10a−1) > Russia (10.56•10a−1) > Central Asia (3.67•10a−1) > East Asia (−3.38•10a−1) > West Asia (−7.56•10a−1), with precipitation decreasing in East and West Asia and increasing in the other five regions. Precipitation tends to increase at high and low latitudes and decrease at mid-latitudes.
3.3.2. Spatial Correlation between FVC and Hydrothermal Conditions
Figure 15a, b show the correlation coefficients and the level of significance between the FVC and temperature in the study area over 34 years. The correlation coefficients were mostly positive, ranging from −0.78 to 0.81, with an average of 0.13. In the seven subregions, the correlation coefficients between FVC and temperature were ranked as follows: Russia (0.24) > Central and Eastern Europe (excluding Russia) (0.22) > Central Asia (0.07) > East Asia (0.05) > Southeast Asia (0.02) > West Asia (0.01) > South Asia (−0.13), showing that the FVC was significantly correlated with temperature (excluding South Asia). The proportion of the FVC positively correlated with temperature was 70.30%, which was mostly found in high latitudes, such as Asia and Europe, the Siberian plains, and the middle and lower reaches of the Yangtze River in China. The proportion of the FVC that was negatively correlated with temperature was 29.6%, mainly found in the middle and low latitudes and near the equator. The proportion of significant positive, weak and significant negative correlations between FVC and air temperature were 20.41%, 75.43%, and 4.16%, respectively. In regions with a significant positive correlation, 28.73% of the region was covered by sparse shrubs, 26.69% by mixed forests, 9.27% by grasslands, 7.19% by cropland, and 28.12% by other land uses. In regions with a significant negative correlation, 37.19% was occupied by barren land, 28.92% by cropland, 14.51% by grasslands, 7.55% by sparse shrubs, and 11.83% by other land uses. In regions with weak correlations, grassland occupied 19.01% of the area, sparse shrubs covered 18.22%, agriculture covered 10.2%, barren land covered 14.93%, croplands covered 11.98%, mixed forests covered 10.38%, and 25.48% was covered by other land uses.
The correlation coefficients and significance levels between FVC and precipitation during the 34-year period are shown in Figure 16a, b. The regional correlation coefficients between FVC and precipitation were mainly positive, ranging from −0.76 to 0.85, with a mean value of 0.05. Among the seven subregions, the correlation between FVC and precipitation was ranked as follows: Central Asia (0.31) > Central and Eastern Europe (excluding Russia) (0.23) > South Asia (0.12) > West Asia (0.09) > East Asia (0.06) > Southeast Asia (0.05) > Russia (−0.04). Most regions in Russia are influenced by polar atmospheric circulation and have an extremely cold climate, with heat being the predominant factor preventing plant growth. Precipitation was positively correlated with 54.5% of the FVC, mostly in Central Asia and the northern Black Sea, where vegetation cover is sparse and moisture is the most significant factor restricting plant growth. Precipitation was negatively correlated with 45.5% of the FVC in southern China, the high-latitude Siberian plains, Asia, and Europe. The results of the correlation between the FVC and precipitation indicated that the FVC and precipitation were significantly positively correlated in 13.1%, weakly correlated in 82.8%, and significantly negatively correlated in 4.1% of the study area, respectively. Of the regions with a significant positive correlation, 41.77% were grasslands, 19.95% were croplands, 9.67% were sparse shrubs, and 13.32% were other land-use types. In regions with a significant negative correlation, the proportion of mixed forest was 44.03%, the proportion of sparse shrubs was 10.56%, the proportion of evergreen needle-leaf forests was 8.42%, the proportion of croplands and natural vegetation mosaics was 6.69%, the proportion of evergreen broad-leaf forests was 5.92%, and 24.38% was covered by other land-use types. In regions with a weak correlation, the proportion of sparse shrubs was 21.95%, the proportion of grasslands was 13.37%, the proportion of barren land was 13.71%, the proportion of mixed forests was 13.63%, the proportion of cropland was 10.68%, and 26.66% was covered by other land-use types.
4. Discussion
4.1. Topographic Differentiation Effect on FVC
The PTP region is typical of ecological regions in which topography, climate, and human activities interact. Topography (elevation, aspect, and slope) is one of the most significant non-zonal factors influencing vegetation distribution. It affects vegetation growth and geographical distribution by regulating light, heat, precipitation, and soil conditions [65,66]. Furthermore, elevation is the most important explanatory variable in topographic effects, which not only affects the distribution of temperature and moisture but also constrain human activities, resulting in vertical zonal changes in the distribution of vegetation. In the PTP region, the correlation coefficient between FVC and elevation was −0.31, with a negative correlation [24,65]. The FVC varies with the elevation gradient (Figure 17). Below 1400 m, the value of FVC increases with elevation; between 1400 and 2600 m, the value of FVC is flat and then slowly increases with elevation; and above 3500 m, the value of FVC is the lowest, close to 20%. The vegetation degradation type tends to decrease as elevation increases, the unchanged type increases gradually, and the vegetation improvement type first increases and then decreases (Figure 18). The trend of FVC (Slope) increases with elevation and, subsequently, decreases, with a maximum value of 0.039•10a−1 for elevations between 1600 and 1800, followed by a value of 0.037•10a−1 for elevations between 1200 and 1400, and a minimum value of 0.0015•10a−1 for elevations more than 3500 m. With the change in elevation, the difference in vegetation cover is greatly associated with the natural environment and human activities. The temperature was colder at the higher elevations, where the vegetation growth was primarily limited by the lower temperature and not easily disturbed by human activities, with the strongest stability and the smallest proportion of vegetation improvement [67]. Regions with an elevation of less than 600 m are suitable for vegetation growth in terms of temperature and moisture, but they are also most vulnerable to human activities, and the stability of vegetation is low, but the vegetation cover has a greening trend in general; elevations between 1200 and 2000 m have a better ecological environment, with less human activity and the most obvious trend of vegetation greening. Therefore, we should be cautious of the browning trend in low elevation areas due to human activities in the PTP region.
Changes in FVC from 1982 to 2015 were complex and spatially variable, with a slowly greening trend. Except for West Asia and South Asia, where the FVC decreased, the FVC increased in the other five subregions. Land use in West Asia and South Asia consists primarily of sparse grassland and bare land, with sparse surface vegetation. Grassland is significantly influenced by precipitation and human activities (over-cultivation, over-grazing, return to grass, etc.), making West Asia and South Asia vulnerable to global change. The other five subregions had modest increases in the FVC, whereas Central and Eastern Europe (excluding Russia) and Russia experienced the most rapid growth. The predominant land-use types in these regions are mixed forests, forested grasslands, sparse shrubs, farmland, and natural vegetation. Temperature was the primary controlling factor for vegetation growth in these two regions and the increase in temperature in the PTP region resulted in varying degrees of growth of temperate forests at high latitudes [68]. Usually, the SD is used to assess the variability of the long-term FVC. The geographic variability in SD is related to land-use type (Figure 5), and the land-use type in the low fluctuation region is mostly barren land, which is consistent with the fact that it will not change in a short period [61,62,69]. The majority of land-use types in low-fluctuation regions were forests, which tend to gradually increase the FVC in the absence of human activities. The FVC in grassland, scrub, and tundra, on the other hand, was affected by temperature, precipitation, and human activities and varies from year to year, showing moderate fluctuations. Wetland-water and urban land have a greater correlation with climate and human activities and their ecosystems are fragile and highly fluctuant.
4.2. Spatial and Temporal Evolution Characteristics of the FVC under the Impact of Climate Change and Human Activities
FVC is influenced by the climate, solar radiation, CO2 concentration, human activities, topography, etc., with temperature and precipitation playing the most critical roles [70]. Climate change is an internal factor driving vegetation change, whereas human activities is an external factor, variations in land use induced by human activities, such as agriculture and urbanization, are important factors affecting the spatial patterns of vegetation [23], and the significance of human activities on vegetation change can no longer be underestimated [21,24]. The sixth IPCC report made it evident that human activities have been warming the atmosphere, oceans, and land for more than a century. As the signal of human influence has intensified, vegetation cover changes have strongly recorded the imprint of human activities, and the driving impacts of human construction and destruction activities on vegetation succession have become more significant [71,72]. Consequently, vegetation cover tends to be high in the east and low in the west, high in the south and low in the north, and decreases from east to west in the PTP region.
This study showed that the vegetation in the PTP region had a greening trend from 1982 to 2015 but with a high degree of regional variability; the main driving factors of the FVC increase in 34.71% of the study area were the combined effects of climate change and human activities. On the one hand, the surface temperature in the PTP region is on the rise, which prolongs the plant growth cycle and accelerates the decomposition of soil organic matter and the release of nutrients, thus, promoting the growth of vegetation. On the other hand, human activities could effectively increase vegetation cover at the local or even regional scale by improving agricultural management (e.g., fertilization and irrigation) and implementing vegetation construction projects.
Under the influence of climate change, the increasing and decreasing trends of FVCCC co-existed in the PTP region from 1982 to 2015. The FVCCC in Central and Eastern Europe (excluding Russia) increased the most significantly, followed by Russia. Warmer temperatures could enhance the activity of photosynthetic enzymes, slow the speed of chlorophyll degradation, and promote vegetation growth [73], especially in the northern high latitudes [41]. In contrast, the FVCCC of Southeast Asia is decreasing, and the land use types are mainly evergreen broad-leaf forests and evergreen needle-leaf forests. The sustained increase in temperature can lead to “physiological drought” of plants, which inhibits photosynthesis and growth rate, and may cause browning of vegetation, which is consistent with the found of Liu et al. (2022) that tropical vegetation tended to undergo browning in recent years [74]. Under the influence of human activities, the FVCHA in the PTP region showed a co-existing trend of increasing and decreasing from 1982 to 2015. FVCHA in Central and Eastern Europe (excluding Russia), East Asia and Central Asia is decreasing. In Central Asia, the FVCHA has shown an obvious decreasing trend due to rapid growth and population explosion, industrialization, urbanization, and the continuous degradation of the Aral Sea, an increasingly serious degree of desertification and a deteriorating ecological environment. Meanwhile, considering that the Central Asia countries experienced large changes in land-use followed by socio-economic disturbance after the Union of Soviet Socialist Republics (USSR) collapse (e.g., wars, revolutions, policy changes, and economic crises), these socio-economic factors are also likely to have contributed to the browning trend [39,75,76,77,78]. The vegetation in Inner Mongolia has been damaged by inappropriate mining, overgrazing, and other construction activities [43]. Hilker et al. (2014) showed that overgrazing is the single most important reason for desertification of the Mongolian Steppe [44]. Through economic expansion and urban construction, the FVC in Central and Eastern Europe (excluding Russia) has also shown a trend of degradation. In general, climate change influenced the increase in vegetation cover in the PTP region, but human activities positively influenced the growth of vegetation in the study area. Both climate change and human activities impacted the spatial-temporal evolution of the FVC in the PTP region.
4.3. Response of the FVC to Changes in Hydrothermal Conditions
The annual mean temperature and annual precipitation in the study area from 1982 to 2015 showed a fluctuating increasing trend and the climatic background was warm and humid, which provided good conditions for the growth of vegetation. The influence of temperature was generally greater than that of precipitation, which provided good conditions for vegetation growth, similar to the findings of previous studies [46,48]. The spatial pattern of the correlation between the FVC and temperature, precipitation had obvious spatial diversity and its spatial pattern was consistent with studies of global vegetation change [46,79,80]. The FVC was positively correlated with temperature in the temperate continental climate of the Asian and Siberian plains which have long and cold winters and short and warm summers but are affected by polar air masses year-round, resulting in an extremely frigid climate. The increase in temperature primarily promotes the growth of vegetation at high latitudes in the Northern Hemisphere in three ways: (1) the increase in temperature prolongs the growth period of plants in the Northern Hemisphere, consequently, enhancing the production of vegetation; (2) the increase in temperature improves nutrient effectiveness by promoting biogeochemical feedback; and (3) warming increases photosynthesis efficiency and water utilization [81]. For regions with high temperatures at low latitudes, near the equator, and other high-temperature water-scarce regions, an increase in temperature may increase the evaporation of soil water, resulting in a decrease in soil water moisture, which causes “physiological drought” of vegetation and suppresses photosynthesis and growth speed of plants. In these regions, only an increase in precipitation may promote plant growth [82], demonstrating an obvious negative correlation between temperature and plant growth. The lower elevation of the middle and lower sections of the Yangtze River Plain, as well as its relatively humid climate and sufficient precipitation, are suitable for plant growth. However, excessive precipitation will lead to an increase in cloudiness and a decrease in solar radiation, while the increase in soil moisture causes a relative increase in the evaporation of surface latent heat, all of which lower the temperature and decreases the photosynthetic rate, thus, suppressing the growth of vegetation. Consequently, plant growth in this region is more sensitive to temperature. The FVC is positively correlated with precipitation in arid and semi-arid regions, such as Central Asia and the northern Black Sea, where the annual precipitation is less than 300 mm. Vegetation change is more influenced by moisture than by other factors and an increase in precipitation substantially enhances vegetation growth [79]. In contrast, forests and shrubs in eastern China have dense vegetation and stable ecosystems that are not susceptible to changes in precipitation. The high-latitude plains of Siberia, Asia, and Europe have low temperatures year-round and heavy precipitation leads to an increase in cloudiness and a reduction in solar radiation, which lowers the temperature and is detrimental to plant growth. From the entire study area, the area of negative correlation between the FVC and temperature coincided with the area of positive correlation between the FVC and precipitation.
Significance testing of the FVC with temperature and precipitation showed that the proportion of the FVC with a significant positive association with temperature was greater than that with precipitation alone. Based on the correlation coefficient and significance of the FVC with temperature and precipitation, it is reasonable to conclude that temperature is the primary controlling factor of FVC change at high latitudes in the PTP region, which is consistent with the findings of Tucker et al. [34], Zhou et al. [83], and Piao et al. [84]. However, the response of vegetation to climate change is a nonlinear process with a compound impact, in which an increase in temperature enhances photosynthesis until the plant reaches the optimal temperature for photosynthesis. When the optimal temperature is exceeded, the temperature increase promotes crop respiration and accelerated nutrient consumption but also increases evapotranspiration and reduces organic matter accumulation. Moreover, maximum and minimum temperatures affect vegetative activities in a variety of ways. Changes in water may have some effect on vegetation activities; however, an increase in water can reduce vegetative activities by increasing cloudiness and humidity. Precipitation is the most influential factor for plant growth in arid and semi-arid regions [14,85,86,87]. The threshold of hydrothermal conditions on vegetation change and the effect of non-climatic factors on vegetation change require further in-depth study in future research.
4.4. Limitations
This study provided a preliminary understanding of the spatial and temporal variability characteristics of FVC and its response to climate change and human activities in the PTP region and a basis for scientific assessment and decision support of regional ecological civilization-related resources and environmental issues that must be addressed urgently in the construction of the Green Silk Road. However, there were some limitations in this study: (1) Semi-monthly FVC was used to calculate the PTP region trend of vegetation cover. Because of the influence of snow cover, atmospheric aerosols, dust, and clouds, the semi-monthly FVC values often deviate from their nominal values, and the FVC trend may also be affected. Some other disturbances, such as forest fire, flood, soil moisture, overgrazing, drought, human activities, etc., also affected the trend of the FVC. However, these factors were not taken into account in this study, and future research will focus on them. (2) The spatial resolutions of the obtained NDVI, temperature, and precipitation data were inconsistent, and the analysis process was resampled to 8 km. There may be an effect on the accuracy of the results with mixed pixels in the data resampling process for monitoring FVC changes in the study area. However, in the future, more accurate change monitoring can be obtained using higher spatial resolution data to obtain more robust results. (3) When analyzing the association between the FVC and land-use types, only one-period land-use data were used and the impact of land-use type changes on FVC was not fully taken into account. (4) Partial correlation analysis and multiple regression residual analysis were used to analyze the relationships between vegetation cover, climatic factors, and human activities. Although the driving factors of vegetation cover have been identified, geographic detectors and machine learning methods for the quantitative analysis of the driving factors are a future research focus. To predict vegetation change trends, which are crucial for the advancement of vegetation restoration, future studies should consider more influencing factors and screen out those with greater contribution rates. (5) In this study, only NDVI was used to calculate FVC, which is insufficient. Some other formulations of FVC should be taken into consideration in future studies. For example, Jiang et al. (2006) found that scaled difference vegetation index (SDVI), a scale-invariant index based on linear spectral mixing of red and near-infrared reflectance, is a more suitable and robust approach for retrieval of vegetation fraction with remote sensing data, particularly over heterogeneous surfaces [88]. Furthermore, the various methods should be compared to choose the optimal solution to calculate the FVC.
5. Conclusions
The spatio-temporal succession characteristics of the FVC in the PTP region and the correlation coefficient between the FVC and climate factors and human activities were analyzed based on the GIMMS NDVI3g dataset from 1982 to 2015, combined with precipitation and temperature data for the same period. The following main conclusions were drawn:
- (1)
- The average FVC over the past 34 years in the PTP region was 45.65%, with significant regional differences in macroscopic patterns, with Southeast Asia having the highest average FVC at 94.16% and West Asia the lowest at 17.08%.
- (2)
- During the 34 years, the slope of the FVC change in the PTP region fluctuated between −0.15•10a−1 and 0.36•10a−1, with an average slope of 0.003•10a−1. The FVC change may be roughly divided into three phases: the fast-rising phase from 1982 to 1994; the browning phase from 1994 to 2003; and the steady greening phase after 2003. The proportions of areas with obvious improvement, mild improvement, unchanged, slight degradation, and serious degradation in the FVC were 23.83%, 13.53%, 39.29%, 11.16%, and 12.19%, respectively. In subregions, the trend of change (Slope) in the FVC was greater than zero, with the greatest increasing trend in South Asia (Slope = 0.0078•10a−1) and the lowest in Central Asia (Slope = 0.0002•10a−1). Overall, vegetation in the Pan-Third Pole region showed a greening trend over the 34-year period.
- (3)
- The effects of climate change and human activities on the FVC in the PTP region were spatially heterogeneous but were mainly positive. In the PTP region, the impacts of climate change and human activities on the average growing season FVC changes from 1982 to 2015 were 0.0013•10a−1 and 0.0011•10a−1, respectively. Climate change and human activities were the driving factors of the FVC increases in South Asia, West Asia, and Russia; climate change was the driving factor of the FVC increase in Central and Eastern Europe (excluding Russia), East Asia, and Central Asia; and human activities were the driving factors of the FVC increase in Southeast Asia.
- (4)
- From 1982 to 2015, the climate of the PTP region tended to be warm and humid, with 70.3% of the FVC positively correlated with temperature and 54.5% of the FVC positively correlated with precipitation. In the growing season, the FVC was positively correlated with the annual mean temperature at high latitudes, while for arid and semi-arid regions in the low and middle latitudes, the FVC during the growing season was negatively correlated with temperature and positively correlated with precipitation.
Author Contributions
Conceptualization, X.Y. and Q.Y.; methodology, X.Y. and M.Y.; software, X.Y.; investigation, M.Y.; resources, X.Y. and M.Y.; data curation, X.Y. and Q.Y.; writing—original draft preparation, X.Y.; writing—review and editing, Q.Y.; project administration, Q.Y.; research group leader, Q.Y. All authors have read and agreed to the published version of the manuscript.
Funding
This research was supported by the Strategic Priority Research Program of Chinese Academy of Sciences, Grant No. XDA20040202.
Data Availability Statement
Not applicable.
Conflicts of Interest
The authors declare no conflict of interest.
References
- Zhang, M.; Lin, H.; Long, X.; Cai, Y. Analyzing the spatiotemporal pattern and driving factors of wetland vegetation changes using 2000–2019 time-series landsat data. Sci. Total Environ. 2021, 780, 146615. [Google Scholar] [CrossRef]
- Liu, Y.; Lei, H. Responses of natural vegetation dynamics to climate drivers in China from 1982 to 2011. Remote Sens. Basel 2015, 7, 10243–10268. [Google Scholar] [CrossRef]
- Bindoff, N.L.; Stott, P.A.; Achutarao, K.M.; Allen, M.R.; Gillett, N.; Gutzler, D.; Hansingo, K.; Hegerl, G.; Hu, Y.Y.; Jain, S.; et al. Detection and attribution of climate change: From global to regional. In Climate Change 2013: The Physical Science Basis. Contribution of Working Group I to the Fifth Assessment Report of the Intergovernmental Panel on Climate Change; Cambridge University Press: New York, NY, USA, 2013. [Google Scholar]
- Zhou, T. New physical science behind climate change: What does IPCC AR6 tell us? Innovation 2021, 2, 100173. [Google Scholar] [PubMed]
- Masson-Delmotte, V.; Zhai, P.; Pirani, A.; Connors, S.L.; Péan, C.; Berger, S.; Caud, N.; Chen, Y.; Goldfarb, L.; Gomis, M.I.; et al. IPCC. summary for policymakers. In Climate Change 2021: The Physical Science Basis, Contribution of Working Group I to the Sixth Assessment Report of the Intergovernmental Panel on Climate, Change; Cambridge University Press: New York, NY, USA, 2021; pp. 3–32. [Google Scholar]
- Myneni, R.; Keeling, C.D.; Tucker, C.J.; Asrar, G.; Nemani, R. Increased plant growth in the northern high latitudes from 1981 to 1991. Nature 1997, 386, 698–702. [Google Scholar] [CrossRef]
- Zhou, L.M.; Tucker, C.J.; Kaufmann, R.K. Variations in northern vegetation activity inferred from Variations in northern vegetation activity inferred from satellite data of vegetation index during 1981 to 1999. J. Geophys. Res. Atmos. 2001, 106, 20069–20083. [Google Scholar]
- Jeong, S.J.; Ho, C.H.; Gim, H.J.; Brown, M.E. Phenology shifts at start vs. end of growing season in temperate vegetation over the northern hemisphere for the period 1982–2008. Glob. Chang. Biol. 2011, 17, 2385–2399. [Google Scholar]
- Xu, L.; Myneni, R.; Iii, F.S.C.; Callaghan, T.V.; Pinzon, J.E.; Tucker, C.J.; Zhu, Z.; Bi, J.; Ciais, P.; Tømmervik, H.; et al. Temperature and vegetation seasonality diminishment over northern lands. Nat. Clim. Chang. 2013, 3, 581–586. [Google Scholar] [CrossRef]
- Parmesan, C.; Yohe, G. A globally coherent fingerprint of climate change impacts across natural systems. Nature 2003, 421, 37–42. [Google Scholar] [CrossRef]
- Chen, X.; Hu, B.; Yu, R. Spatial and temporal variation of phenological growing season and climate change impacts in temperate eastern China. Glob. Chang. Biol. 2005, 11, 1118–1130. [Google Scholar] [CrossRef]
- Jorda-Capdevila, D.; Gampe, D.; Huber García, V.; Ludwig, R.; Sabater, S.; Vergoñós, L.; Acuña, V. Impact and mitigation of global change on freshwater-related ecosystem services in southern Europe. Sci. Total Environ. 2019, 651, 895–908. [Google Scholar]
- Faour, G.; Mhawej, M.; Nasrallah, A. Global trends analysis of the main vegetation types throughout the past four decades. Appl. Geogr. 2018, 97, 184–195. [Google Scholar] [CrossRef]
- Gitelson, A.A.; Kaufman, Y.J.; Stark, R.; Rundquist, D. Novel algorithms for remote estimation of vegetation fraction. Remote Sens. Environ. 2002, 80, 76–87. [Google Scholar] [CrossRef]
- Zeng, X.B.; Dickinson, R.E.; Walker, A.; Shaikh, M.; DeFries, R.S. Derivation and evaluation of global 1-km fractional vegetation cover data for land modeling. J. Appl. Meteorol. 2000, 39, 826–839. [Google Scholar]
- Qi, J.; Marsett, R.; Moran, M.; Goodrich, D.; Heilman, P.; Kerr, Y.; Dedieu, G.; Chehbouni, A.; Zhang, X. Spatial and temporal dynamics of vegetation in the san pedro river basin area. Agric. For. Meteorol. 2000, 105, 55–68. [Google Scholar] [CrossRef] [Green Version]
- Yao, T.D.; Chen, F.H.; Cui, P.; Ma, M.Y.; Xu, B.Q.; Zhu, L.P.; Zhang, F.; Wang, W.C.; Ai, L.K.; Yang, X.X. From tibetan plateau to third pole and pan-third pole. Bull. Chin. Acad. Sci. 2017, 32, 925–931. (In Chinese) [Google Scholar]
- Zhang, R.H.; Zhou, S.W. Temperature trends on the Qinghai-Tibet plateau and other regions in the same latitudinal zone and the possible impact of ozone. J. Meteorol. Res. Prc. 2008, 66, 916–925. (In Chinese) [Google Scholar]
- Chen, F.H.; An, C.B.; Dong, G.H.; Zhang, D.J. Human activities, environmental changes, and rise and decline of silk road civilization in pan-third pole region. Bull. Chin. Acad. Sci. 2018, 32, 967–975. (In Chinese) [Google Scholar]
- Lloret, F.; Escudero, A.; Iriondo, J.; Martinez-Vilalta, J.; Valladares, F. Extreme climatic events and vegetation: The role of stabilizing processes. Glob. Chang. Biol. 2011, 18, 797–805. [Google Scholar] [CrossRef]
- Wang, J.; Wang, K.L.; Zhang, M.Y.; Zhang, C.H. Impacts of climate change and human activities on vegetation cover in hilly southern China. Ecol. Eng. 2015, 81, 451–461. [Google Scholar] [CrossRef]
- Wang, S.; Huang, G.H.; Baetz, B.W.; Huang, W. A polynomial chaos ensemble hydrologic prediction system for efficient parameter inference and robust uncertainty assessment. J. Hydrol. 2015, 530, 716–733. [Google Scholar] [CrossRef]
- Piao, S.; Fang, J.; Liu, H.; Zhu, B. NDVI-indicated decline in desertification in China in the past two decades. Geophys. Res. Lett. 2005, 32, 347–354. [Google Scholar] [CrossRef]
- Qu, S.; Wang, L.C.; Lin, A.W.; Yu, D.; Yuan, M.X.; Li, C.A. Distinguishing the impacts of climate change and anthropogenic factors on vegetation dynamics in the Yangtze River Basin, China. Ecol. Indic. 2020, 108, 105724. [Google Scholar] [CrossRef]
- Willem, J.D.; Van, L.W.; Barron, J.O.; Stuart, E.M. Multi-sensor NDVI data continuity: Uncertainties and implications for vegetation monitoring applications. Remote Sens. Environ. 2006, 100, 67–81. [Google Scholar]
- Beck, H.E.; McVicar, T.R.; Van Dijk, A.I.; Schellekens, J.; de Jeu, R.A.; Bruijnzeel, L.A. Global evaluation of four AVHRR–NDVI data sets: Intercomparison and assessment against landsat imagery. Remote Sens. Environ. 2011, 115, 2547–2563. [Google Scholar] [CrossRef]
- Pettorelli, N.; Ryan, S.; Mueller, T.; Bunnefeld, N.; Jedrzejewska, B.; Lima, M.; Kausrud, K. The normalized difference vegetation index (NDVI): Unforeseen successes in animal ecology. Clim. Res. 2011, 46, 15–27. [Google Scholar] [CrossRef]
- Pettorelli, N.; Vik, J.O.; Mysterud, A.; Gaillard, J.-M.; Tucker, C.J.; Stenseth, N.C. Using the satellite-derived NDVI to assess ecological responses to environmental change. Trends Ecol. Evol. 2005, 20, 503–510. [Google Scholar] [CrossRef] [PubMed]
- Liang, S.H.; Chen, J.; Jin, X.M.; Wan, L.; Gong, B. Regularity of vegetation coverage changes in the Tibetan plateau over the last 21 years. Adv. Earth Sci. 2007, 22, 33–40. [Google Scholar]
- Wang, C.Y.; Wang, J.N.; Naudiyal, N.; Wu, N.; Cui, X.; Wei, Y.Q.; Chen, Q.T. Multiple effects of topographic factors on spatiotemporal variations of vegetation patterns in the three parallel rivers region, southeast Qinghai-Tibet plateau. Remote Sens. 2021, 14, 151–169. [Google Scholar]
- Xiong, Q.; Xiao, Y.; Halmy, M.W.A.; Dakhil, M.A.; Liang, P.; Liu, C.; Zhang, L.; Pandey, B.; Pan, K.; El Kafraway, S.B.; et al. Monitoring the impact of climate change and human activities on grassland vegetation dynamics in the northeastern Qinghai-Tibet plateau of China during 2000–2015. J. Arid Land 2019, 11, 637–651. [Google Scholar] [CrossRef]
- Xu, W.; Liu, X. Response of vegetation in the Qinghai-Tibet plateau to global warming. Chin. Geogr. Sci. 2007, 17, 151–159. [Google Scholar] [CrossRef]
- Xue, S.-Y.; Xu, H.-Y.; Mu, C.-C.; Wu, T.-H.; Li, W.-P.; Zhang, W.-X.; Streletskaya, I.; Grebenets, V.; Sokratov, S.; Kizyakov, A.; et al. Changes in different land cover areas and NDVI values in northern latitudes from 1982 to 2015. Adv. Clim. Chang. Res. 2021, 12, 456–465. [Google Scholar] [CrossRef]
- Tucker, C.J.; Slayback, D.; Pinzon, J.E.; Los, S.; Myneni, R.; Taylor, M.G. Higher northern latitude normalized difference vegetation index and growing season trends from 1982 to 1999. Int. J. Biometeorol. 2001, 45, 184–190. [Google Scholar] [CrossRef] [PubMed]
- Xu, X.; Liu, H.; Jiao, F.; Gong, H.; Lin, Z. Time-varying trends of vegetation change and their driving forces during 1981–2016 along the silk road economic belt. Catena 2020, 195, 104796. [Google Scholar] [CrossRef]
- Luo, M.; Sa, C.; Meng, F.; Duan, Y.; Liu, T.; Bao, Y. Assessing extreme climatic changes on a monthly scale and their implications for vegetation in central Asia. J. Clean. Prod. 2020, 271, 122396. [Google Scholar] [CrossRef]
- Yang, Y.; Zhao, C.; Han, M.; Li, Y.; Yang, R. Temporal patterns of shrub vegetation and variation with precipitation in Gurbantunggut Desert, central Asia. Adv. Meteorol. 2015, 2015, 157245. [Google Scholar] [CrossRef]
- Yin, G.; Hu, Z.; Chen, X.; Tiyip, T. Vegetation dynamics and its response to climate change in central Asia. J. Arid Land 2016, 8, 375–388. [Google Scholar] [CrossRef]
- Hao, H.; Chen, Y.; Xu, J.; Li, Z.; Li, Y.; Kayumba, P.M. Water deficit may cause vegetation browning in central Asia. Remote Sens. 2022, 14, 2574. [Google Scholar] [CrossRef]
- Liu, Y.; Li, Z.; Chen, Y. Continuous warming shift greening towards browning in the southeast and northwest high mountain Asia. Sci. Rep. 2021, 11, 17920. [Google Scholar] [CrossRef]
- Piao, S.; Wang, X.; Ciais, P.; Zhu, B.; Wang, T.; Liu, J. Changes in satellite-derived vegetation growth trend in temperate and boreal eurasia from 1982 to 2006. Glob. Chang. Biol. 2011, 17, 3228–3239. [Google Scholar] [CrossRef]
- Dass, P.; Rawlins, M.A.; Kimball, J.S.; Kim, Y. Environmental controls on the greening of terrestrial vegetation across northern Eurasia. Biogeosci. Discuss. 2015, 12, 9121–9162. [Google Scholar]
- Gong, L.S.; Harazono, Y.; Oikawa, T.; Zhao, H.L.; Ying, H.Z.; Chang, X.L. Grassland desertification by grazing and the resulting micrometeorological changes in innermongolia. Agr. Forest Meteorol. 2000, 102, 125–137. [Google Scholar] [CrossRef]
- Hilker, T.; Natsagdorj, E.; Waring, R.H.; Lyapustin, A.; Wang, Y. Satellite observed widespread decline in mongolian grass-lands largely due to overgrazing. Glob. Chang. Biol. 2014, 20, 418–428. [Google Scholar] [PubMed]
- Namdari, S.; Alnasrawi, A.I.Z.; Ghorbanzadeh, O.; Sorooshian, A.; Kamran, K.V.; Ghamisi, P. Time series of remote sensing data for interaction analysis of the vegetation coverage and dust activity in the middle east. Remote Sens. 2022, 14, 2963. [Google Scholar] [CrossRef]
- Ichii, K.; Kawabata, A.; Yamaguchi, Y. Global correlation analysis for NDVI and climatic variables and NDVI trends: 1982–1990. Int. J. Remote Sens. 2002, 23, 3873–3878. [Google Scholar] [CrossRef]
- Fensholt, R.; Proud, S.R. Evaluation of earth observation based global long term vegetation trends—Comparing GIMMS and MODIS global NDVI time series. Remote Sens. Environ. 2012, 119, 131–147. [Google Scholar] [CrossRef]
- Zeng, F.-W.; Collatz, G.J.; Pinzon, J.E.; Ivanoff, A. Evaluating and quantifying the climate-driven interannual variability in global inventory modeling and mapping studies (GIMMS) normalized difference vegetation index (NDVI3g) at global scales. Remote Sens. 2013, 5, 3918–3950. [Google Scholar] [CrossRef]
- Guo, M.; Li, J.; He, H.; Xu, J.; Jin, Y. Detecting global vegetation changes using mann-kendal (MK) trend test for 1982–2015 time period. Chin. Geogr. Sci. 2018, 28, 907–919. [Google Scholar] [CrossRef]
- Liu, Q.H.; Wu, J.J.; Li, L. Ecological environment monitoring for sustainable development goals in the Belt and Road region. Natl. Remote Sens. Bull. 2018, 22, 686–698. [Google Scholar]
- Wang, F.; Ding, J.L.; Wei, Y. Analysis of drought characteristics over countries and regions of “the Belt and Road Initiatives” in recent one hundred years. J. Geogr. Sci. 2017, 19, 1442–1455. [Google Scholar]
- Holben, B.N. Characteristics of maximum-value composite images from temporal AVHRR data. Int. J. Remote Sens. 1986, 7, 1417–1434. [Google Scholar] [CrossRef]
- Lü, Y.; Zhang, L.; Feng, X.; Zeng, Y.; Fu, B.; Yao, X.; Li, J.; Wu, B. Recent ecological transitions in China: Greening, browning and influential factors. Sci. Rep. UK 2015, 5, 8732. [Google Scholar] [CrossRef] [PubMed]
- Jiang, Z.Y.; Huete, A.R. Linearization of NDVI based on its relationship with vegetation fraction. Photogramm. Eng. Remote Sens. 2010, 76, 965–975. [Google Scholar] [CrossRef]
- Gutman, G.; Ignatov, A. The derivation of the green vegetation fraction from NOAA/AVHRR data for use in numerical weather prediction models. Int. J. Remote Sens. 1998, 19, 1533–1543. [Google Scholar] [CrossRef]
- Liu, Y.; Li, L.H.; Chen, X.; Zhang, R.; Yang, J. Temporal-spatial variations and influencing factors of vegetation cover in Xinjiang from 1982 to 2013 based on GIMMS-NDVI3g. Glob. Planet. Chang. 2018, 169, 145–155. [Google Scholar] [CrossRef]
- Li, M.; Chu, R.H.; Shen, S.H.; Islam, A.R.M.T. Dynamic analysis of pan evaporation variations in the Huai River Basin, a climate transition zone in eastern China. Sci. Total Environ. 2018, 625, 496–509. [Google Scholar] [CrossRef]
- Wakes, A.; Sauvage, S.; Borbon, A.E.A. Multi-year levels and trends of non-methane hydrocarbon concentrations observed in ambient air in France. Atmos. Environ. 2016, 141, 263–275. [Google Scholar]
- Song, X.Y.; Song, S.B.; Sun, W.Y.E.A. Recent changes in extreme precipitation and drought over the Songhua River Basin, China, during 1960–2013. Atmos. Res. 2015, 157, 137–152. [Google Scholar] [CrossRef]
- Xu, J.H. Mathematical Methods in Gontemporary Geography, 3rd ed.; Higher Education Press: Beijing, China, 2016. [Google Scholar]
- Evans, J.; Geerken, R. Discrimination between climate and human-induced dryland degradation. J. Arid Environ. 2004, 57, 535–554. [Google Scholar] [CrossRef]
- Wessels, K.J.; Prince, S.D.; Malherbe, J.; Small, J.; Frost, P.E.; VanZyl, D. Can human-induced land degradation be distinguished from the effects of rainfall variability? A case study in south Africa. J. Arid Environ. 2007, 68, 271–297. [Google Scholar] [CrossRef]
- Zhang, G.L.; Xu, X.L.; Zhou, C.P.E.A. Responses of vegetation changes to climatic variations in Hulun Buir grassland in past 30 years. Acta. Geographica. Sinica. 2011, 66, 47–58. [Google Scholar]
- Sun, W.; Song, X.; Mu, X.; Gao, P.; Wang, F.; Zhao, G. Spatiotemporal vegetation cover variations associated with climate change and ecological restoration in the loess plateau. Agric. For. Meteorol. 2015, 209–210, 87–99. [Google Scholar] [CrossRef]
- Riihimäki, H.; Heiskanen, J.; Luoto, M. The effect of topography on arctic-alpine aboveground biomass and NDVI patterns. Int. J. Appl. Earth Obs. Geoinf. ITC J. 2017, 56, 44–53. [Google Scholar] [CrossRef]
- Matsushita, B.; Yang, W.; Chen, J.; Onda, Y.; Qiu, G.Y. Sensitivity of the enhanced vegetation index (EVI) and normalized difference vegetation index (NDVI) to topographic effects: A case study in high-density cypress forest. Sensors 2007, 7, 2636–2651. [Google Scholar] [CrossRef] [PubMed]
- Gao, M.; Piao, S.; Chen, A.; Yang, H.; Liu, Q.; Fu, Y.H.; Janssens, I.A. Divergent changes in the elevational gradient of vegetation activities over the last 30 years. Nat. Commun. 2019, 10, 2970. [Google Scholar] [CrossRef] [PubMed]
- Wu, S.; Liu, L.; Liu, Y.; Gao, J.; Dai, E.; Feng, A.; Wang, W. The Belt and Road: Geographical pattern and regional risks. J. Geogr. Sci. 2019, 29, 483–495. [Google Scholar] [CrossRef] [Green Version]
- Li, S.; Yan, J.; Liu, X.; Wan, J. Response of vegetation restoration to climate change and human activities in Shaanxi-Gansu-Ningxia region. J. Geogr. Sci. 2013, 23, 98–112. [Google Scholar] [CrossRef]
- Wang, C.; Liang, W.; Yan, J.; Jin, Z.; Zhang, W.; Li, X. Effects of vegetation restoration on local microclimate on the loess plateau. J. Geogr. Sci. 2022, 32, 291–316. [Google Scholar] [CrossRef]
- Wang, Q.; Bo, Z.; Zhang, Z.Q. The three-north shelterbelt program and dynamic changes in vegetation cover. J. Resour. Ecology. 2014, 5, 53–59. [Google Scholar]
- Zhou, G.S.; Wang, Y.H.; Bai, L.P.; Xu, Z.Z.; Shi, R.X. Study on the interaction between terrestrial ecosystems and global change. Acta. Meteorol. Sin. 2004, 62, 692–707. [Google Scholar]
- Liu, Q.; Fu, Y.; Zeng, Z.; Huang, M.; Li, X.; Piao, S. Temperature, precipitation, and insolation effects on autumn vegetation phenology in temperate China. Glob. Chang. Biol. 2015, 22, 644–655. [Google Scholar] [CrossRef]
- Liu, C.Y.; Liu, J.Y.; Zhang, Q.; Ci, H.; Gu, X.H.; Gulakhmadov, A. Attribution of NDVI dynamics over the globe from 1982 to 2015. Remote Sens. 2022, 14, 2706. [Google Scholar] [CrossRef]
- Martens, P.T. Maastricht school of management the political economy of water insecurity in central Asia given the Belt and Road initiative. Cent. Asian J. Water Res. 2018, 4, 79–94. [Google Scholar] [CrossRef]
- Zhou, Y.; Zhang, L.; Fensholt, R.; Wang, K.; Vitkovskaya, I.; Tian, F. Climate contributions to vegetation variations in central Asian drylands: Pre- and post-USSR collapse. Remote Sens. 2015, 7, 2449–2470. [Google Scholar] [CrossRef]
- Hostert, P.; Kuemmerle, T.; Prishchepov, A.; Sieber, A.; Lambin, E.F.; Radeloff, V.C. Rapid land use change after socio-economic disturbances: The collapse of the soviet Union versus Chernobyl. Environ. Res. Lett. 2011, 6, 67–81. [Google Scholar] [CrossRef]
- Luan, W.; Li, X. Rapid urbanization and its driving mechanism in the pan-third pole region. Sci. Total Environ. 2020, 750, 141270. [Google Scholar] [CrossRef]
- Piao, S.L.; Fang, J.Y.; Ji, W.; Guo, Q.H.; Ke, J.H.; Tao, S. Variation in a satellite-based vegetation index in relation to climate in China. J. Veg. Sci. 2004, 15, 219–226. [Google Scholar] [CrossRef]
- Gao, Q.Z.; Schwartz, M.; Zhu, W.Q.; Wan, Y.F.; Qin, X.B.; Ma, X.; Liu, S.; Williamson, M.; Peters, C.; Li, Y. Changes in global grassland productivity during 1982 to 2011 attributable to climatic factors. Remote Sens. 2016, 8, 384. [Google Scholar] [CrossRef] [Green Version]
- Piao, S.L.; Friedlingstein, P.; Ciais, P.; Viovy, N.; Demarty, J. Growing season extension and its impact on terrestrial carbon cycle in the northern hemisphere over the past 2 decades. Glob. Biogeochem. Cycles 2007, 21, 1–11. [Google Scholar] [CrossRef]
- Herrmann, S.M.; Anyamba, A.; Tucker, C.J. Recent trends in vegetation dynamics in the African Sahel and their relationship to climate. Glob. Environ. Chang. 2005, 15, 394–404. [Google Scholar] [CrossRef]
- Zhou, L.; Kaufmann, R.K.; Tian, Y.; Myneni, R.B.; Tucker, C.J. Relation between interannual variations in satellite measures of northern forest greenness and climate between 1982 and 1999. J. Geophys. Res. Earth Surf. 2003, 108, ACL 3-1–ACL 3-16. [Google Scholar] [CrossRef]
- Piao, S.L.; Ciais, P.; Huang, Y.; Shen, Z.H.; Peng, S.S.; Li, J.S.; Zhou, L.P.; Liu, H.Y.; Ma, Y.C.; Ding, Y.H.; et al. The impacts of climate change on water resources and agriculture in China. Nature 2010, 467, 43–51. [Google Scholar] [CrossRef] [PubMed]
- Gong, X.L.; Du, S.P.; Li, F.Y.; Ding, Y.B. Study of mesoscale NDVI prediction models in arid and semiarid regions of China under changing environments. Ecol. Indic. 2021, 131, 108198. [Google Scholar] [CrossRef]
- Ren, K.; Huang, S.; Huang, Q.; Wang, H.; Leng, G.Y.; Cheng, L.Y.; Fang, W.; Li, P. A nature-based reservoir optimization model for resolving the conflict in human water demand and riverine ecosystem protection. J. Clean. Prod. 2019, 231, 406–418. [Google Scholar] [CrossRef]
- Zhang, Y.L.; Gao, J.G.; Liu, L.S.; Wang, Z.F.; Ding, M.J.; Yang, X.C. NDVI-based vegetation changes and their responses to climate change from 1982 to 2011: A case study in the Koshi River Basin in the middle Himalayas. Glob. Planet. Chang. 2013, 108, 139–148. [Google Scholar] [CrossRef]
- Jiang, Z.Y.; Huete, A.R.; Chen, J.; Chen, Y.H.; Li, J.; Yan, G.G.; Zhang, X.Y. Analysis of NDVI and scaled difference vegetation index retrievals of vegetation fraction. Remote Sens. Environ. 2006, 101, 366–378. [Google Scholar] [CrossRef]
Figure 1.
Subregions map in the Pan-Third Pole region.

Figure 2.
Map showing flowchart of this study.

Figure 3.
Inter-annual variations in annual mean FVC in the Pan-Third Pole region during 1982–2015 (a); inter-annual variations standard deviation of FVC (b); spatial pattern in mean FVC (c); and change trend of FVC based on pixels (d).
Figure 3.
Inter-annual variations in annual mean FVC in the Pan-Third Pole region during 1982–2015 (a); inter-annual variations standard deviation of FVC (b); spatial pattern in mean FVC (c); and change trend of FVC based on pixels (d).

Figure 4.
Inter-annual variations in annual mean FVC of subregions.

Figure 5.
Samples and Land use map of Pan-Third Pole region based on IGBP.

Figure 6.
Histograms of FVC trend in seven samples (S1–S7 denote Sample1–7, respectively).


Figure 7.
Change trends of FVCCC in the Pan-Third Pole region.

Figure 8.
Impact of climate changes on FVCCC in subregions.

Figure 9.
Change trends of FVCHA in the Pan-Third Pole region.

Figure 10.
Impact of human activities on FVCHA in subregions.

Figure 11.
Spatial distribution of driving factors of FVC changes in the Pan-Third Pole region from 1982 to 2015 (CC and HA represent climate change and human activities, respectively).
Figure 11.
Spatial distribution of driving factors of FVC changes in the Pan-Third Pole region from 1982 to 2015 (CC and HA represent climate change and human activities, respectively).

Figure 12.
Inter-annual variations in annual mean temperature in subregions (a); inter-annual variations in annual precipitation in subregions (b).
Figure 12.
Inter-annual variations in annual mean temperature in subregions (a); inter-annual variations in annual precipitation in subregions (b).

Figure 13.
Distribution of annual mean temperature from 1982 to 2015 (a); change trend of annual mean temperature from 1982 to 2015 (b).
Figure 13.
Distribution of annual mean temperature from 1982 to 2015 (a); change trend of annual mean temperature from 1982 to 2015 (b).

Figure 14.
Distribution of annual precipitation from 1982 to 2015 (a); change trend of annual precipitation from 1982 to 2015 (b).
Figure 14.
Distribution of annual precipitation from 1982 to 2015 (a); change trend of annual precipitation from 1982 to 2015 (b).

Figure 15.
Correlation coefficient between FVC and temperature in the Pan-Third Pole region (a); test of significance between FVC and temperature in the Pan-Third Pole region (b).
Figure 15.
Correlation coefficient between FVC and temperature in the Pan-Third Pole region (a); test of significance between FVC and temperature in the Pan-Third Pole region (b).

Figure 16.
Correlation coefficient between FVC and precipitation in the Pan-Third Pole region (a); test of significance between FVC and precipitation in the Pan-Third Pole region (b).
Figure 16.
Correlation coefficient between FVC and precipitation in the Pan-Third Pole region (a); test of significance between FVC and precipitation in the Pan-Third Pole region (b).

Figure 17.
FVC change with elevation in PTP region.

Figure 18.
Area proportion of FVC change types at different elevation gradients in PTP region.


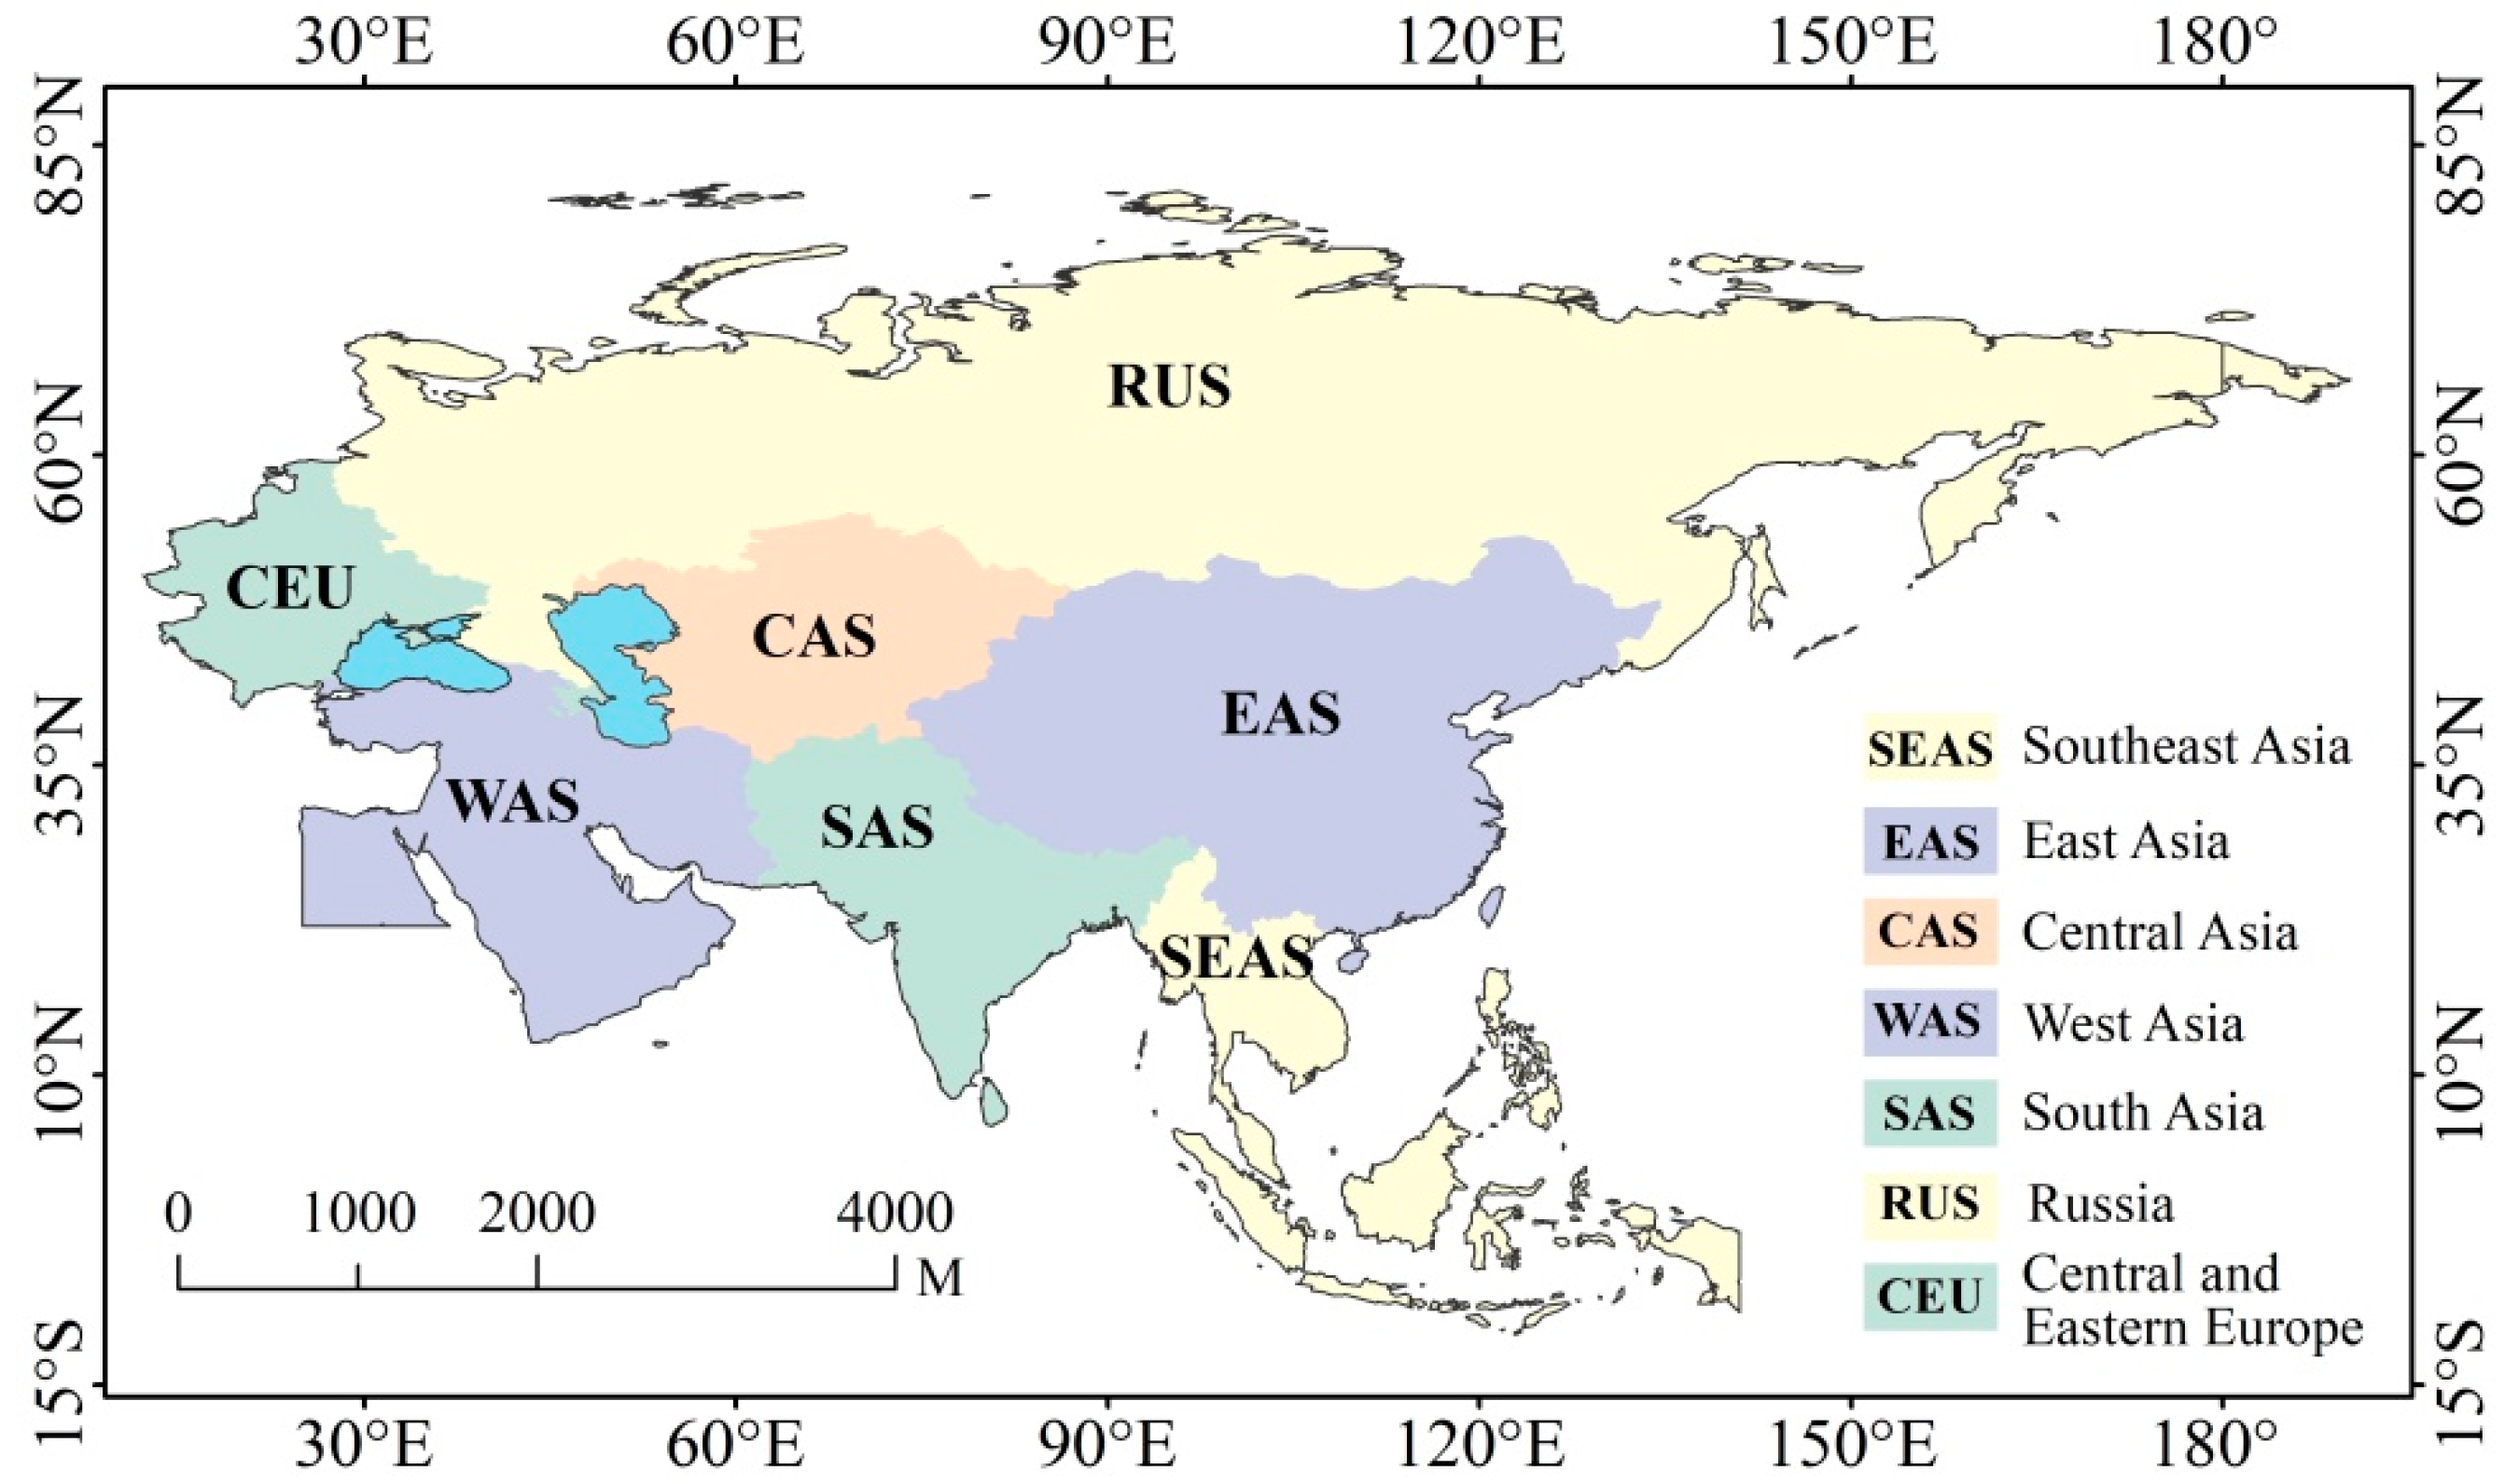
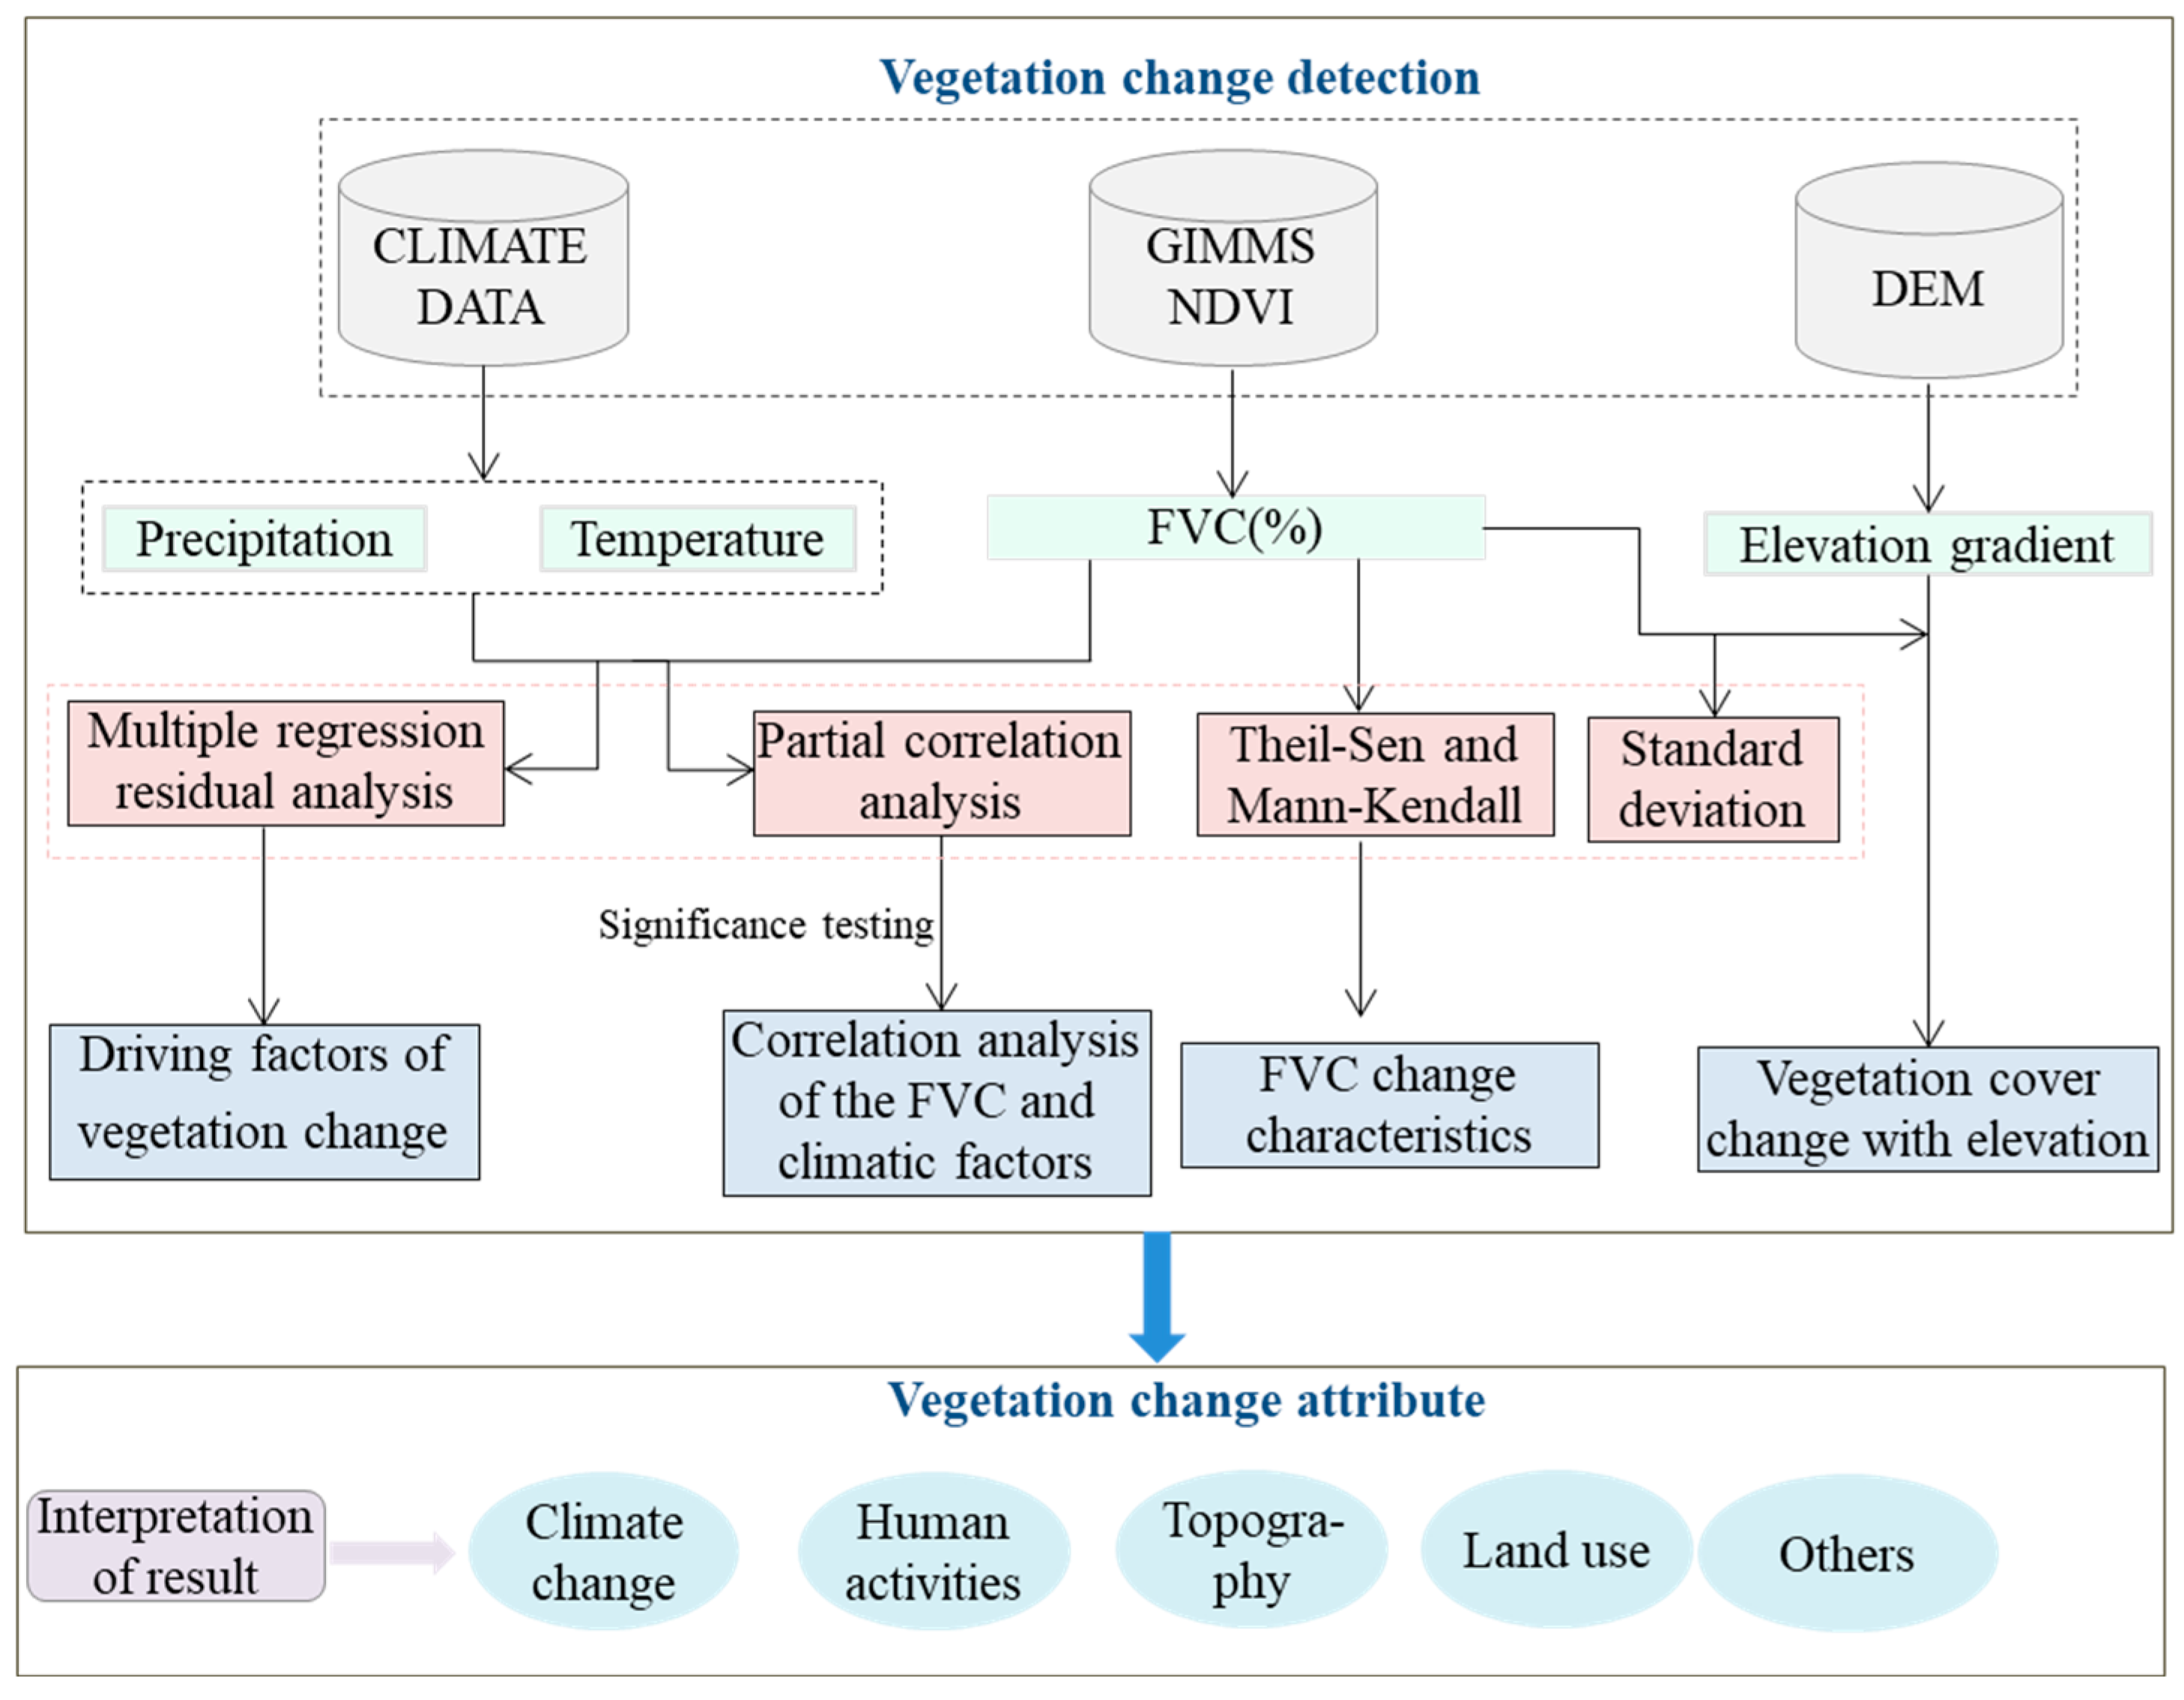
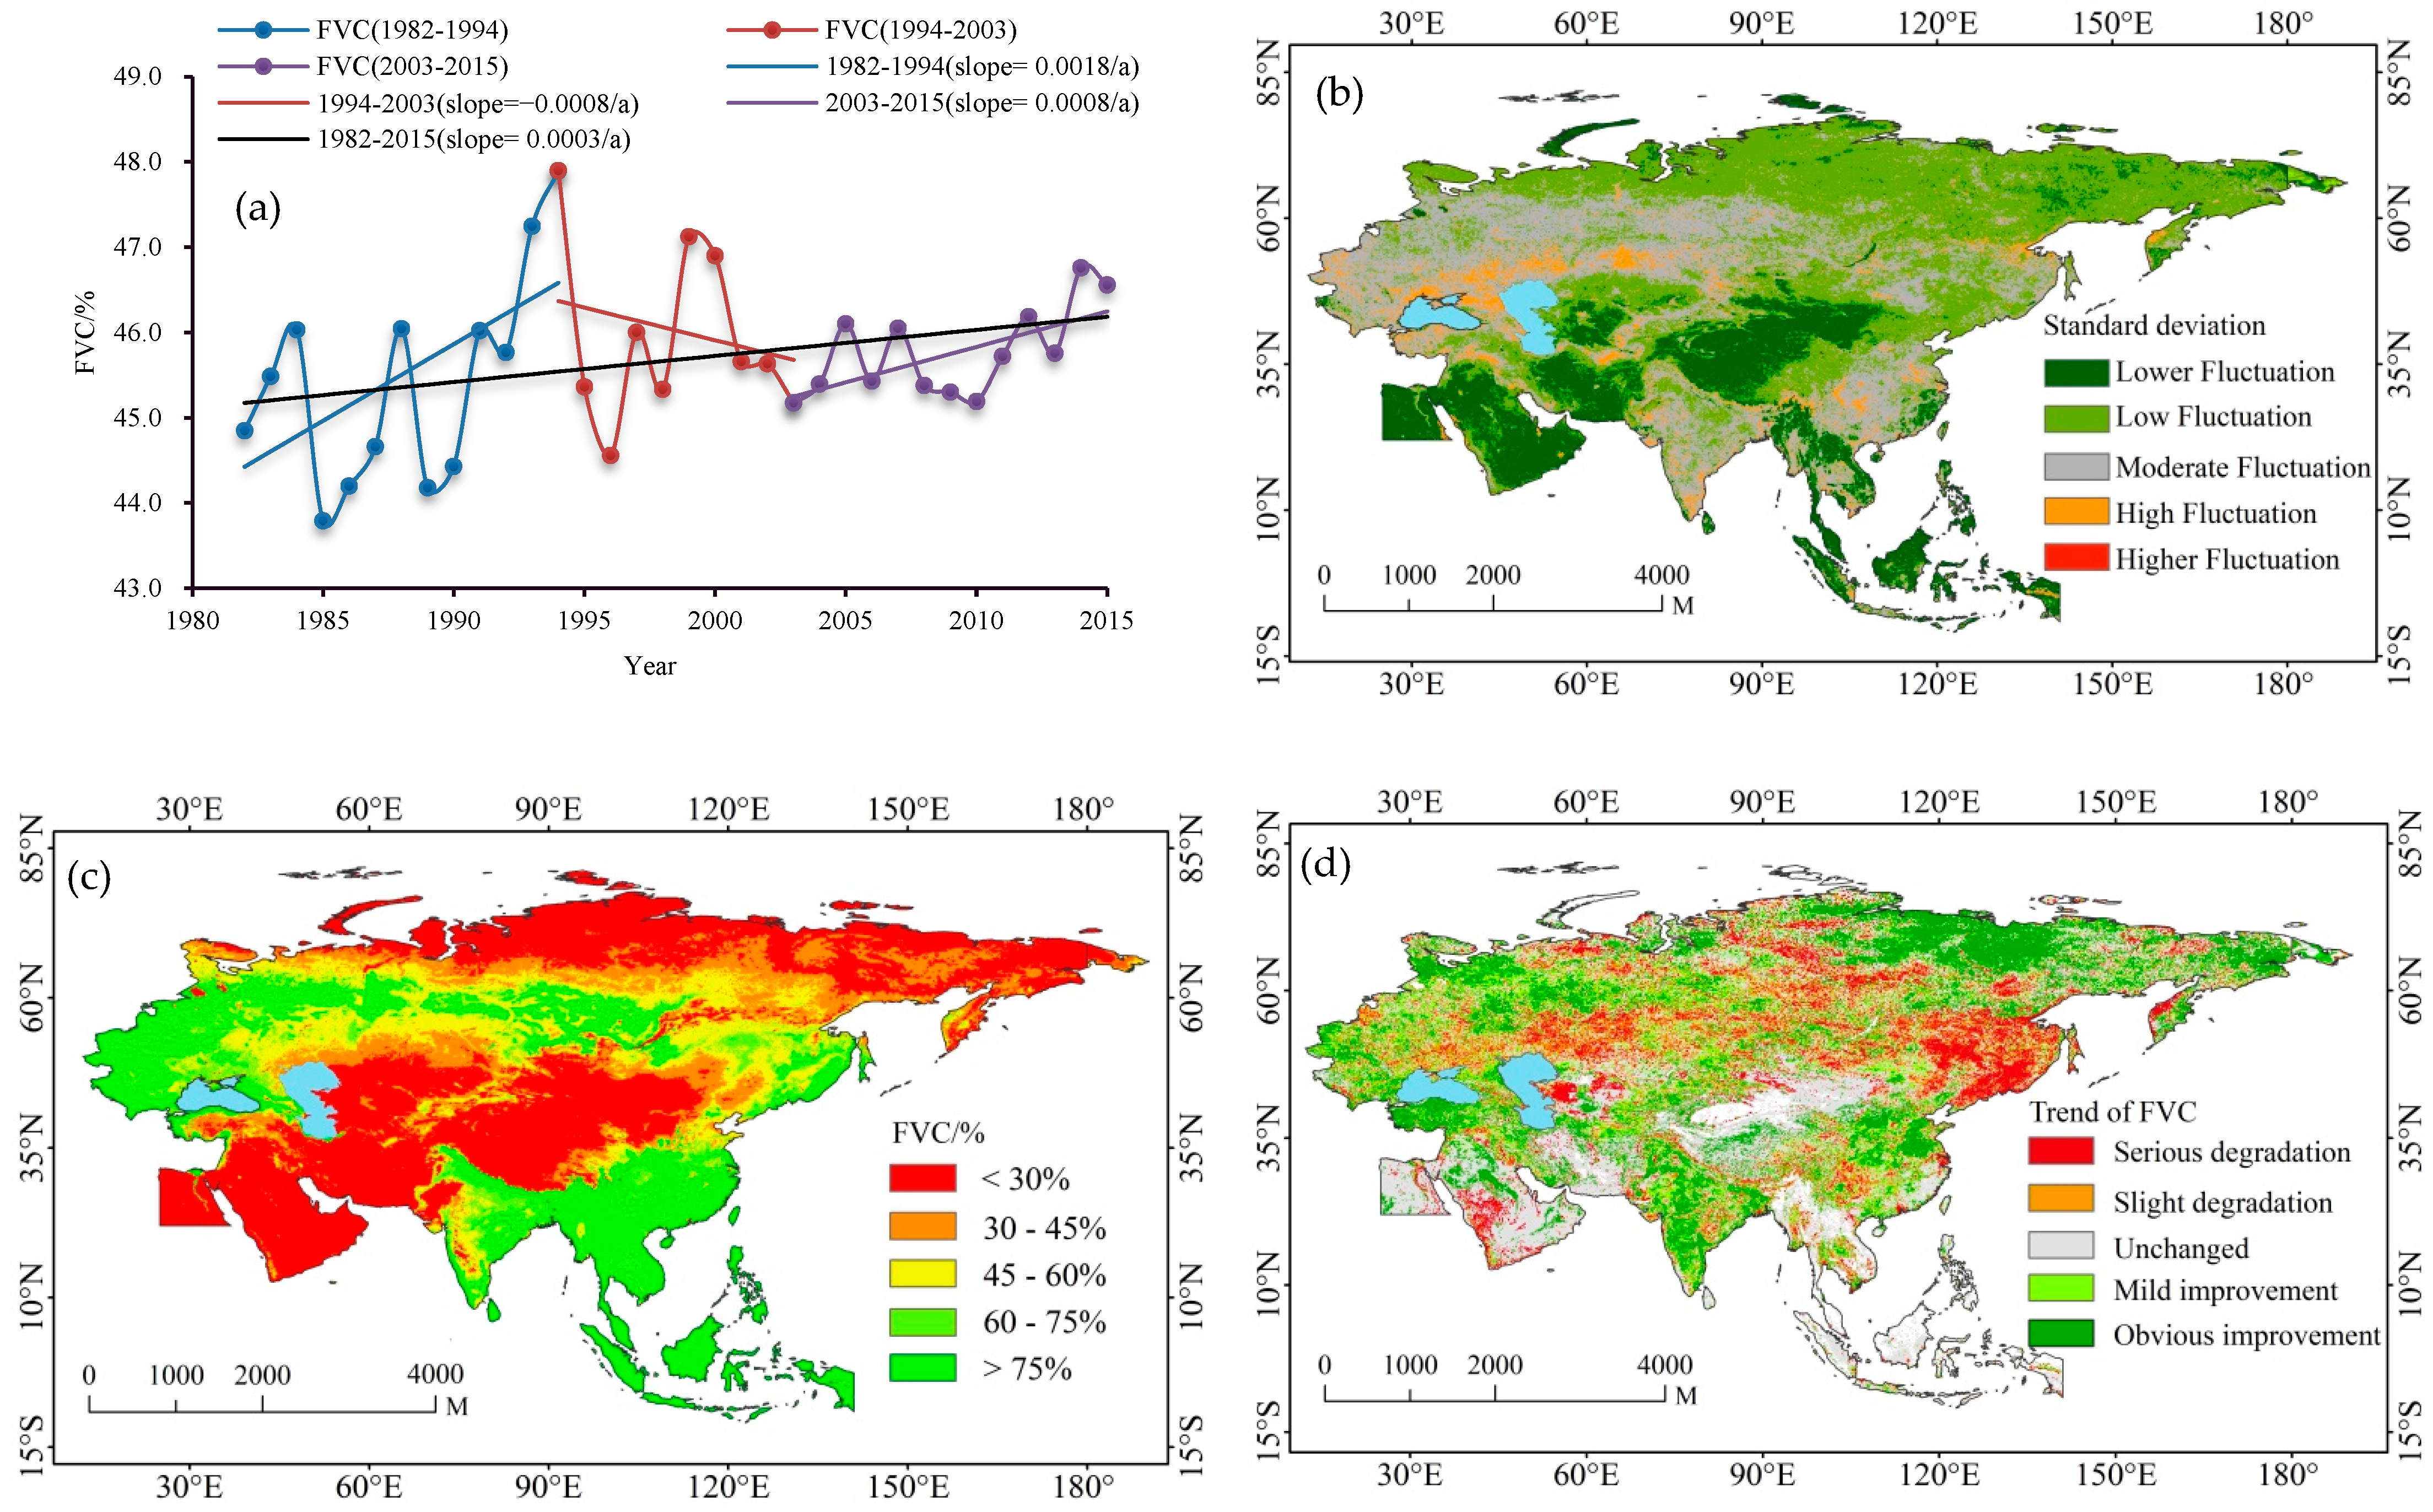
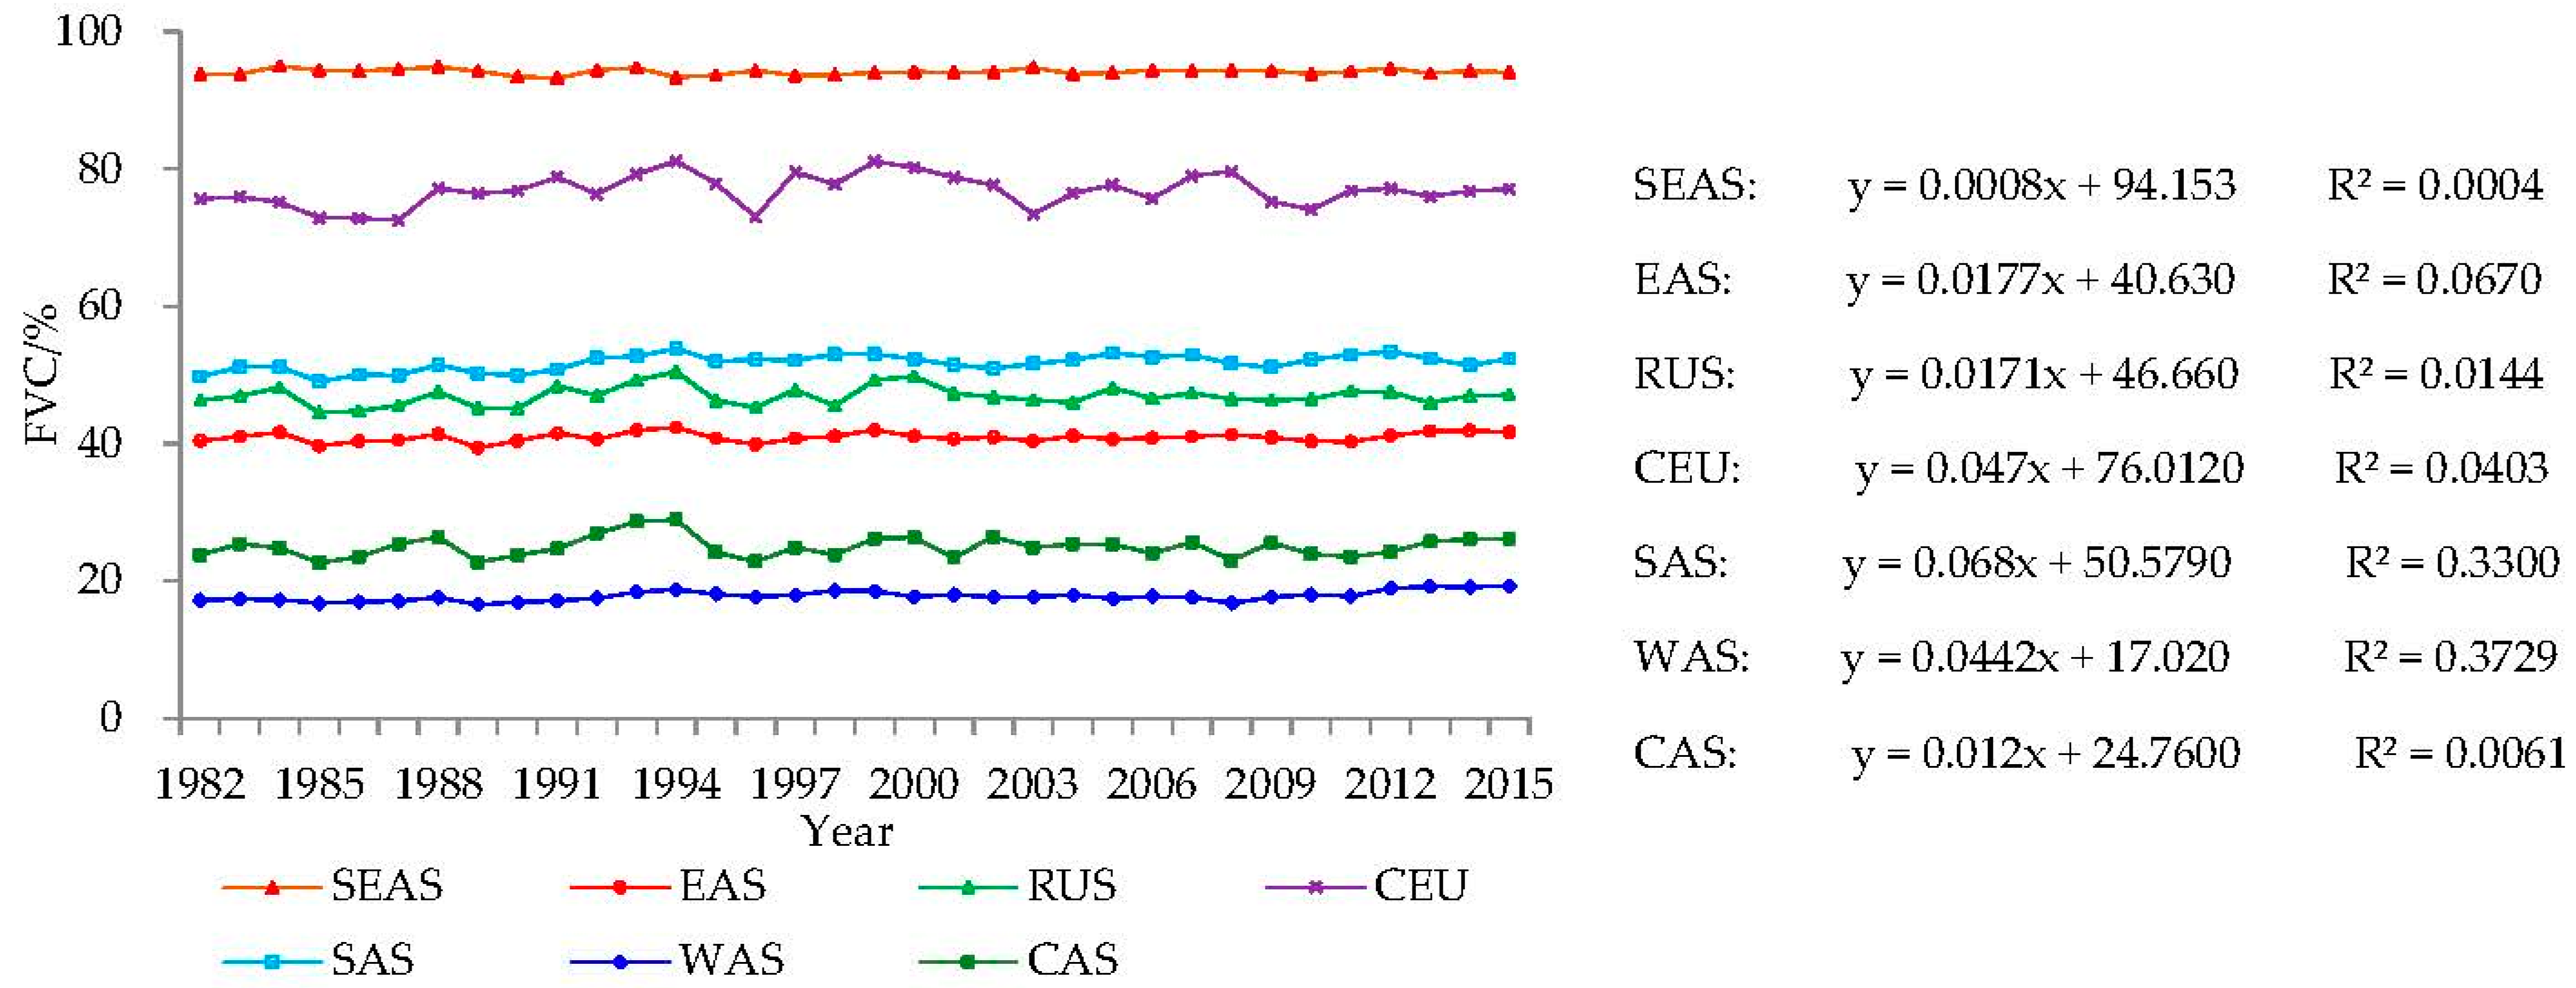
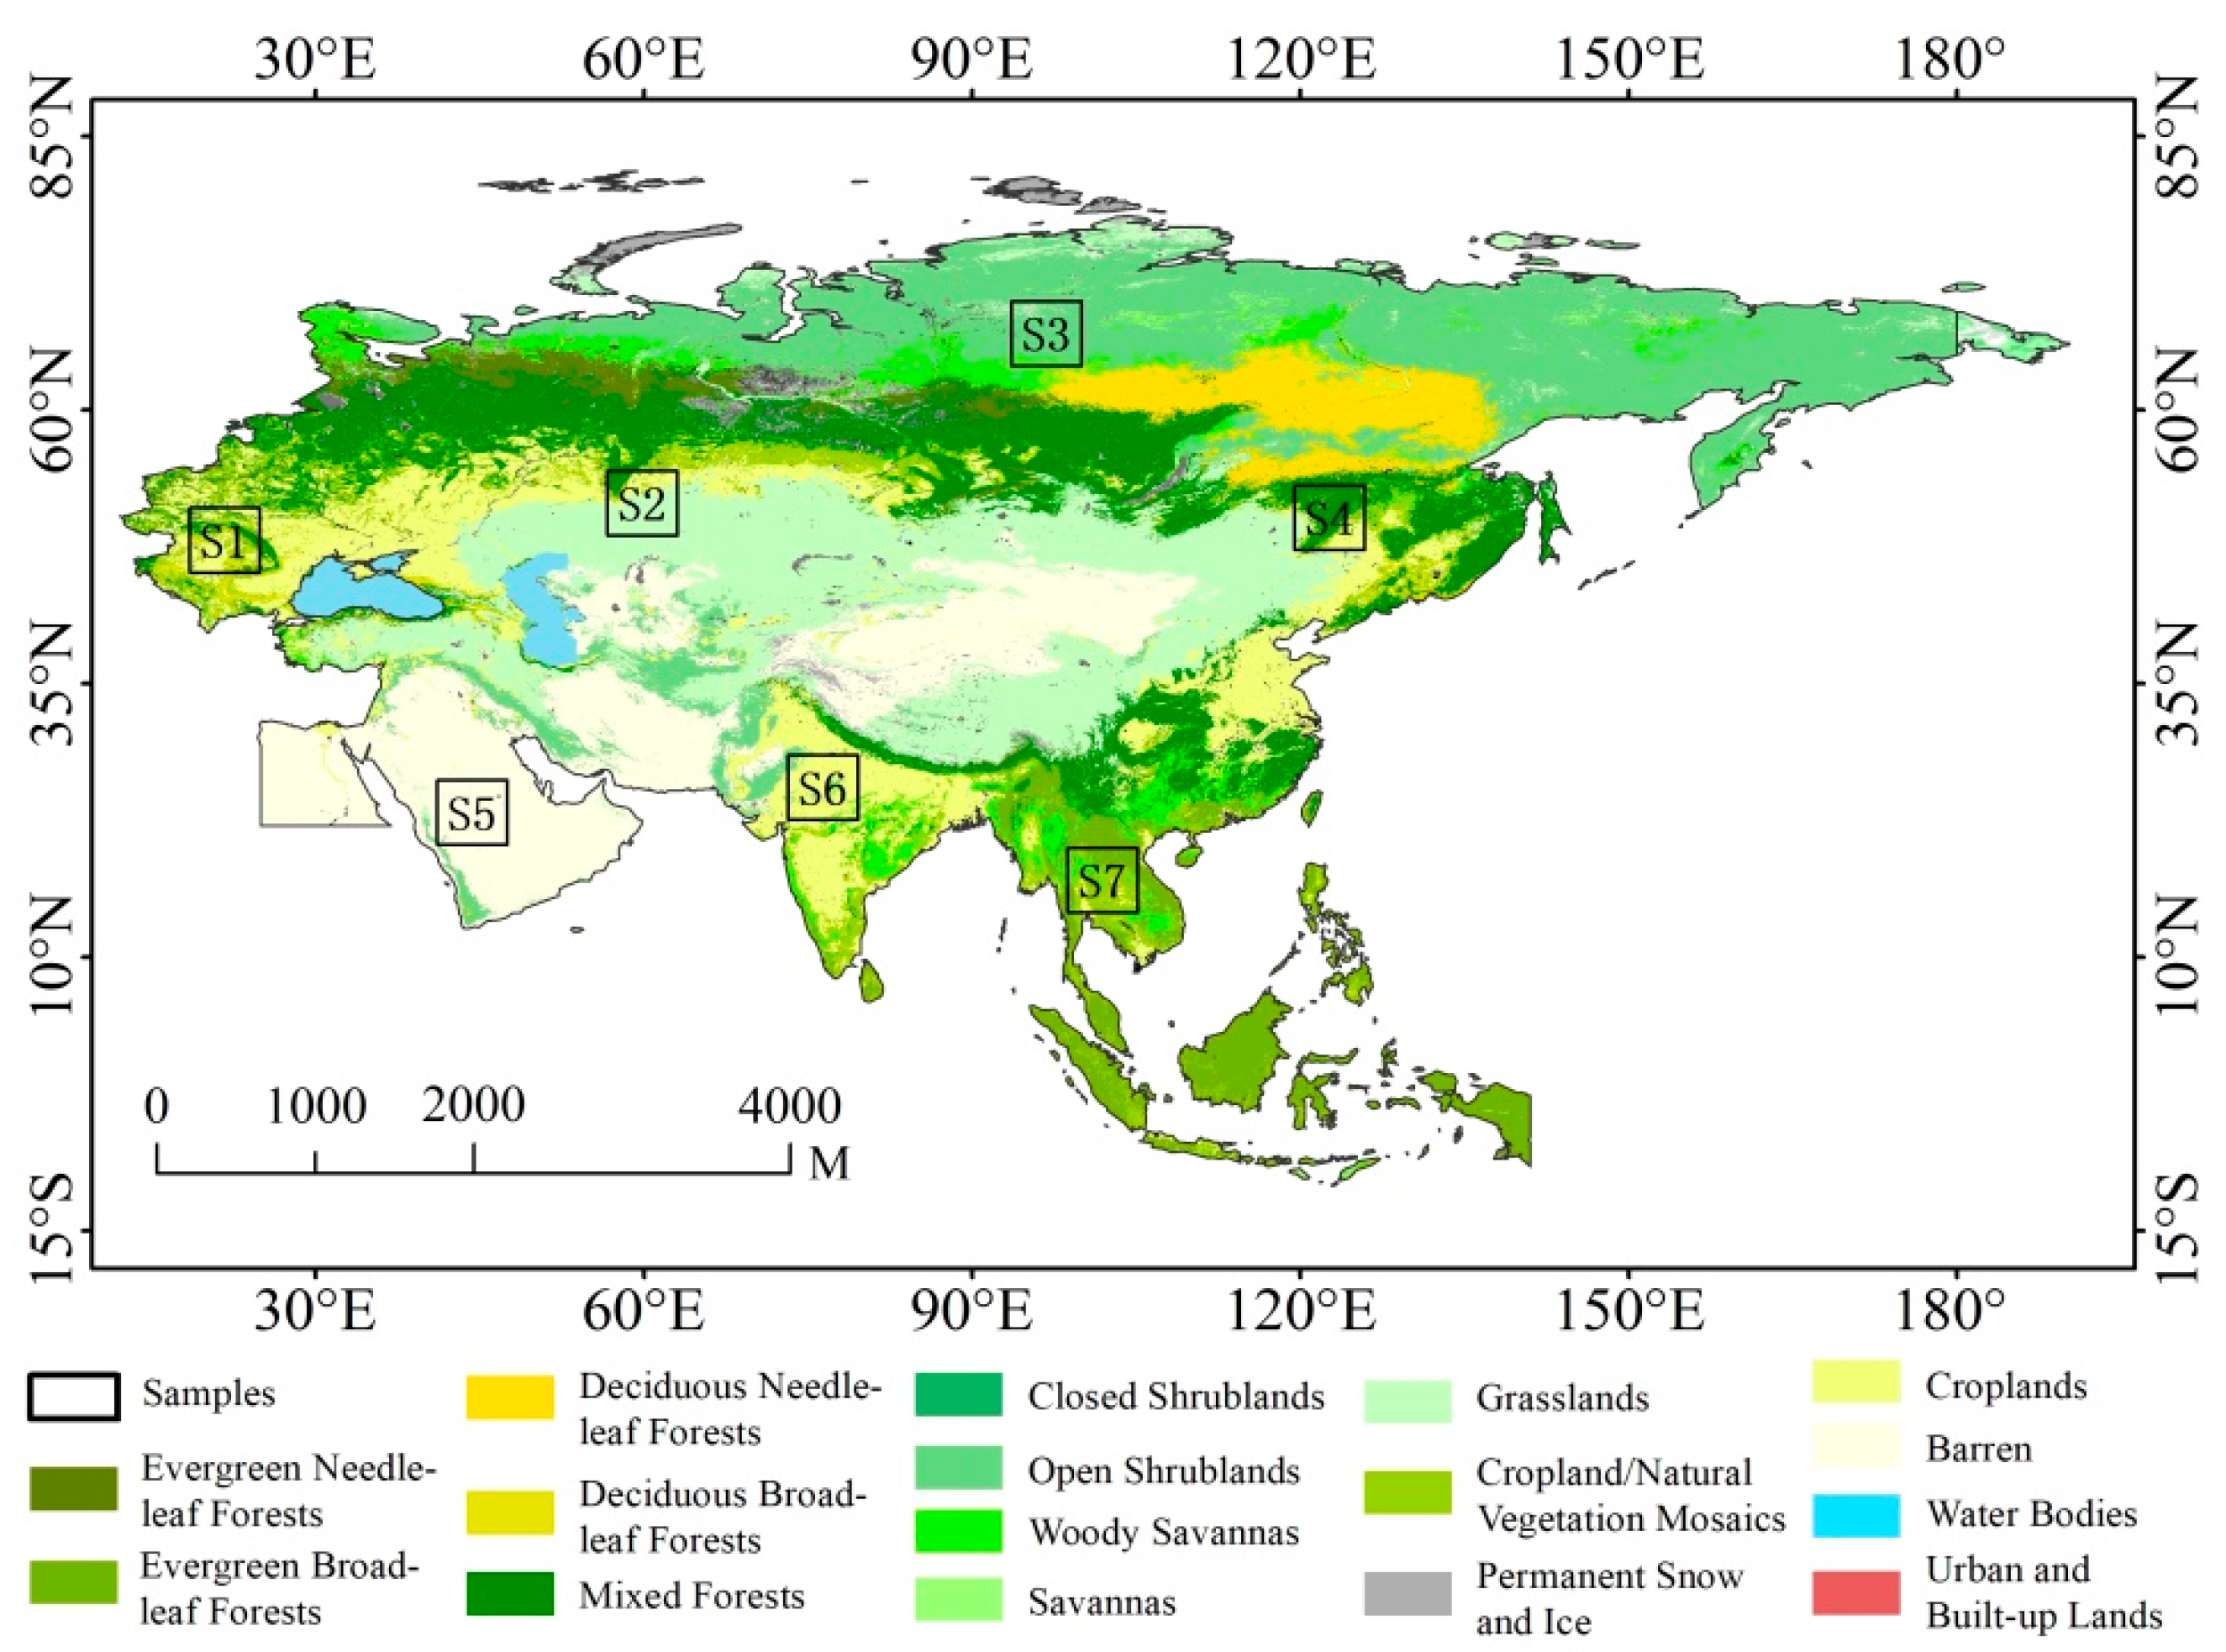
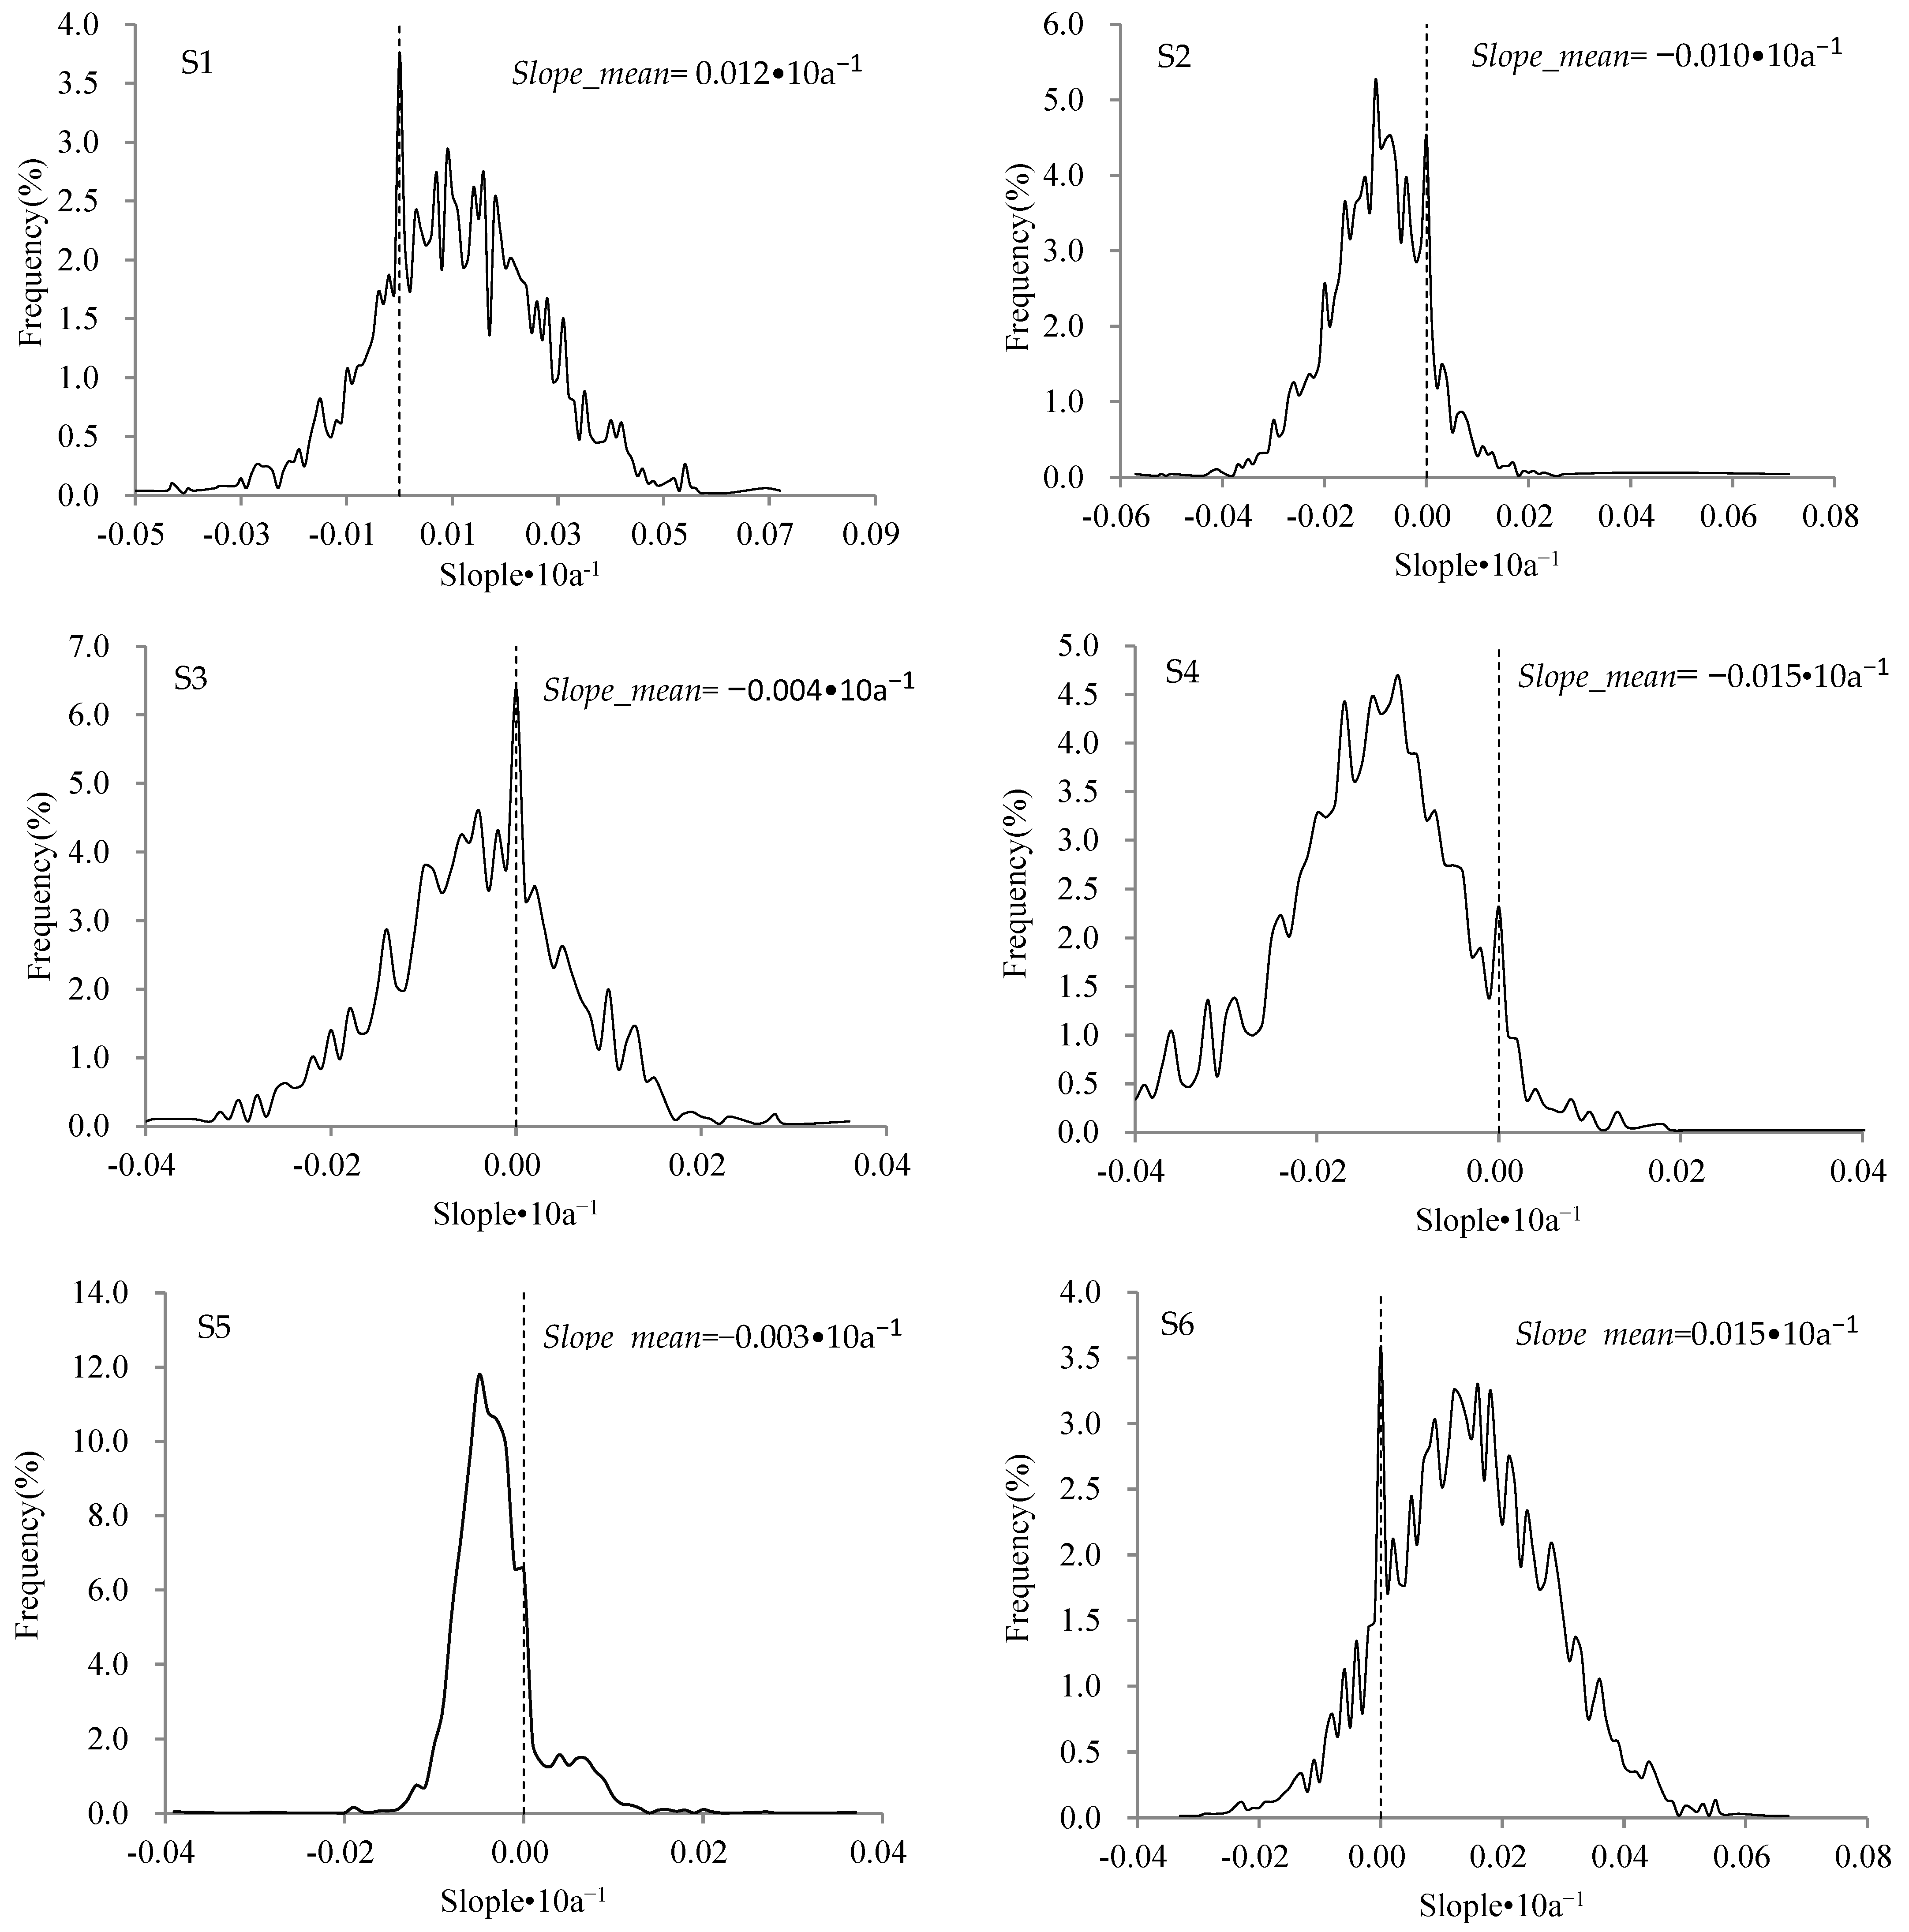
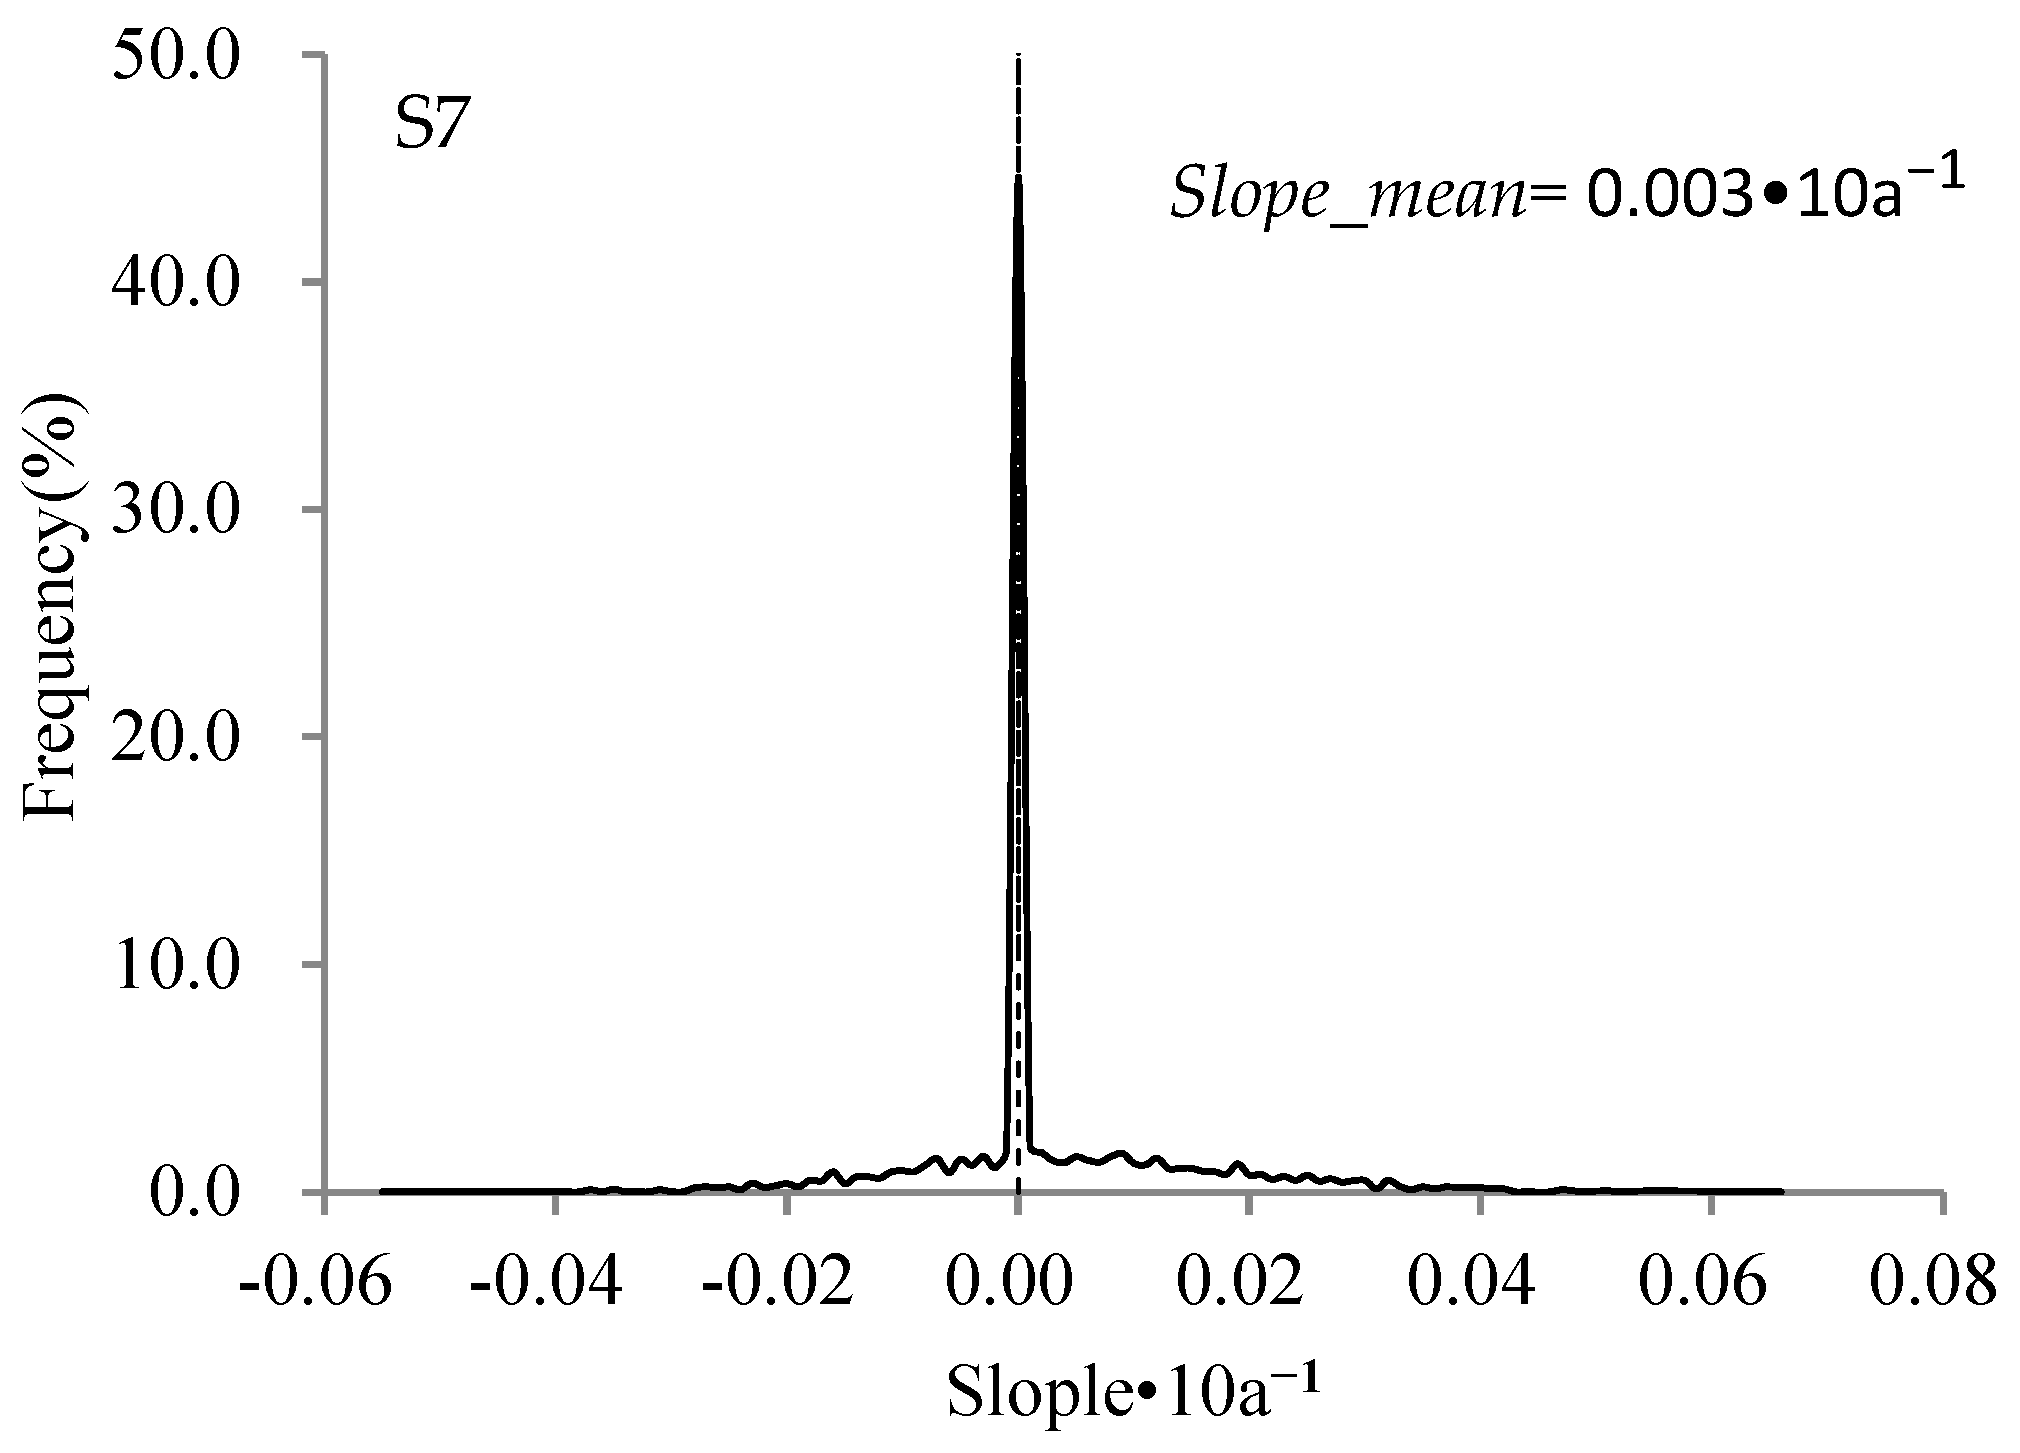
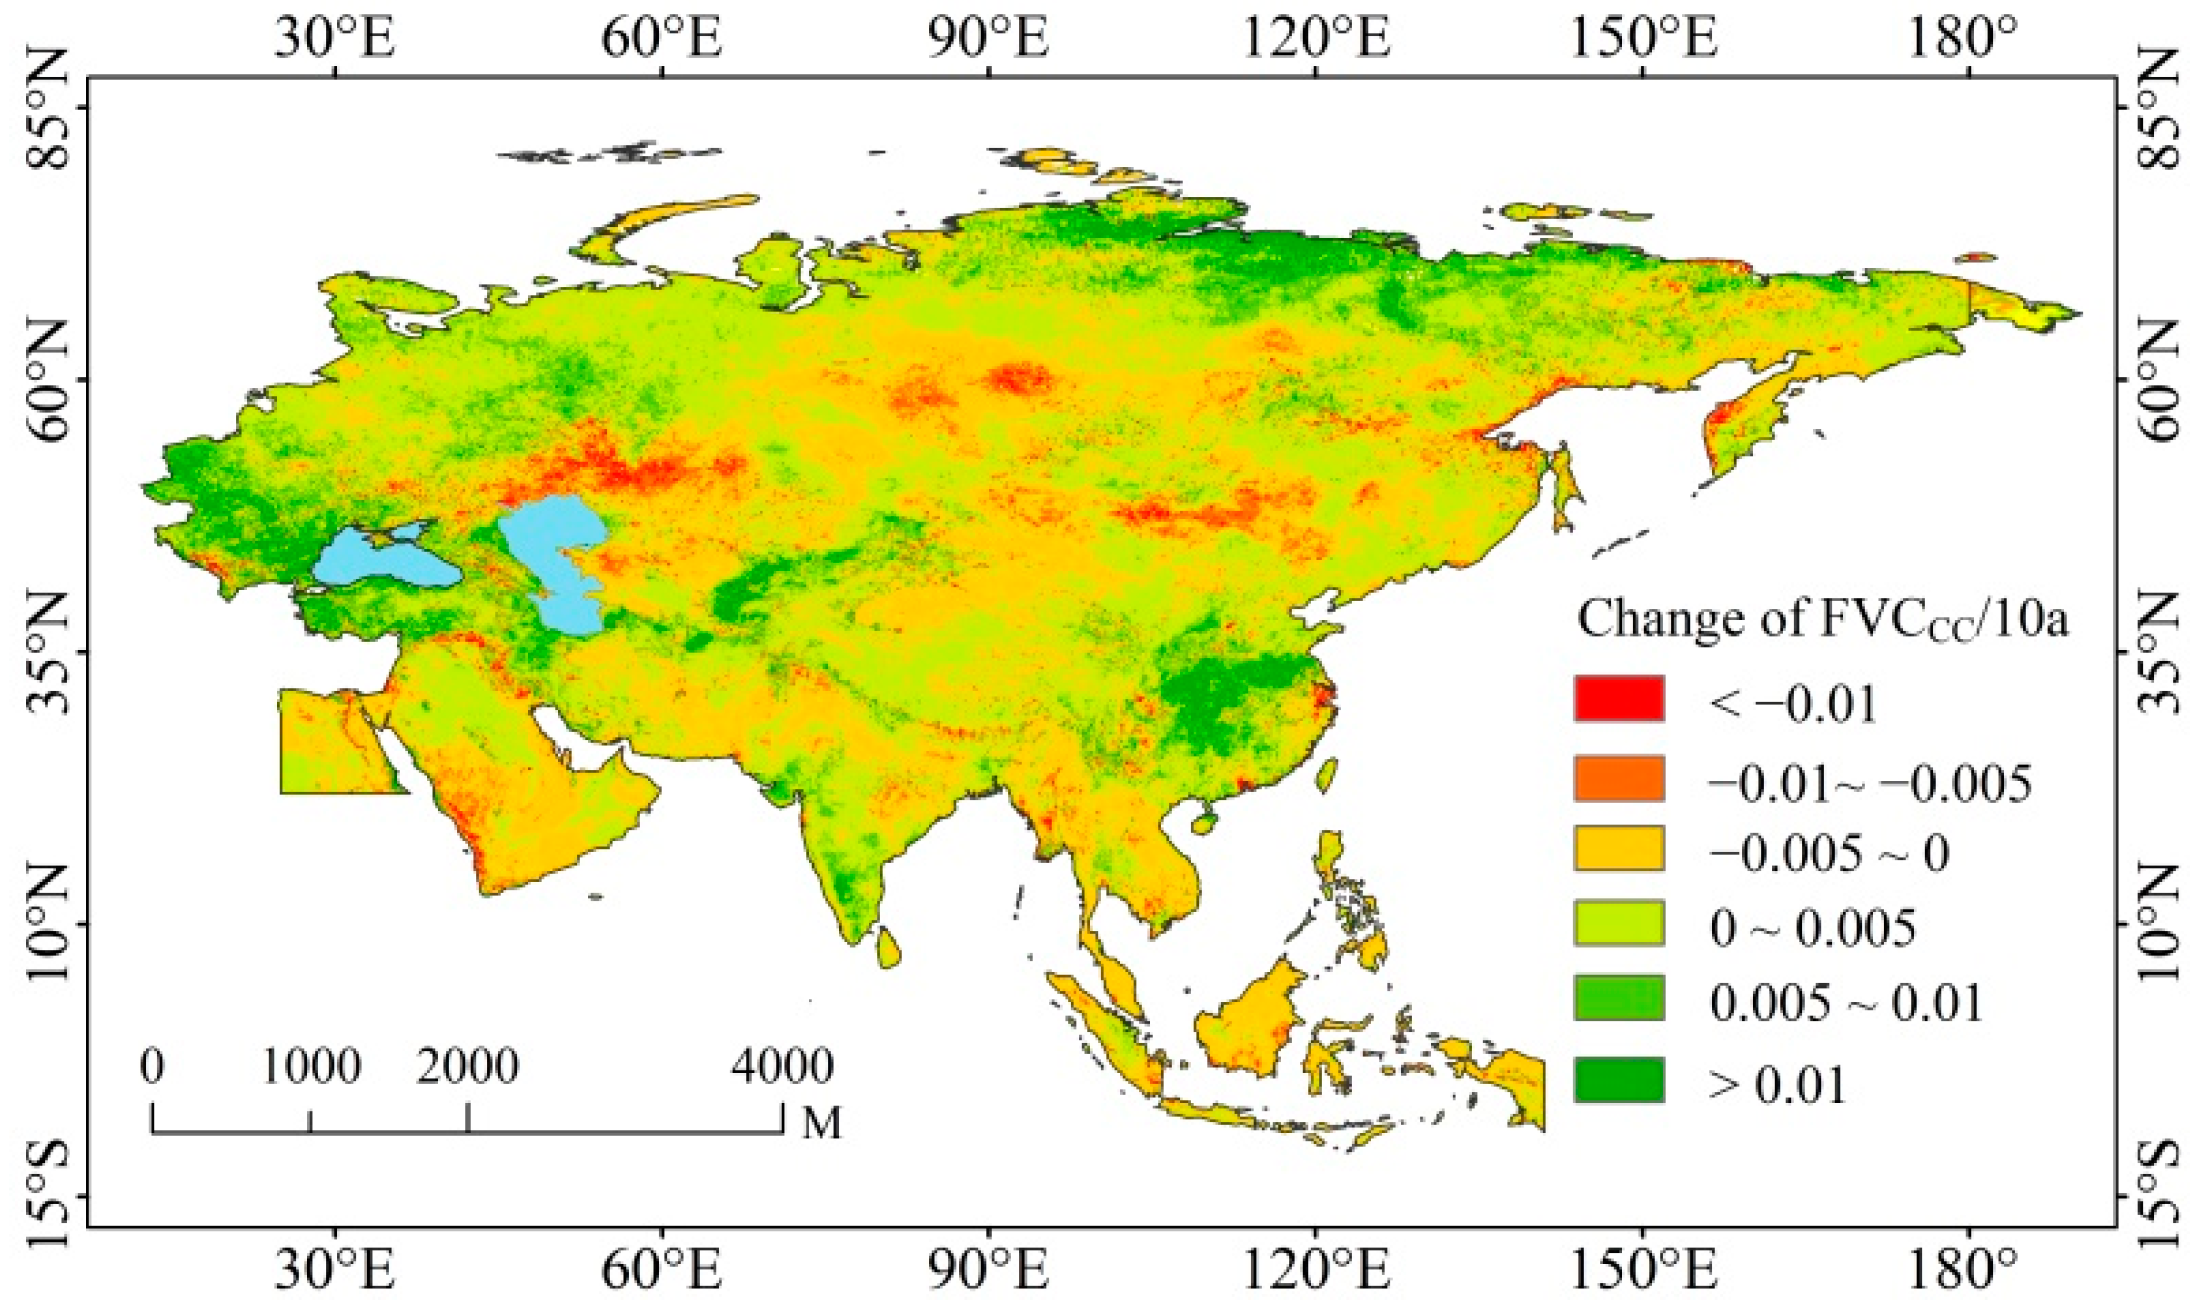
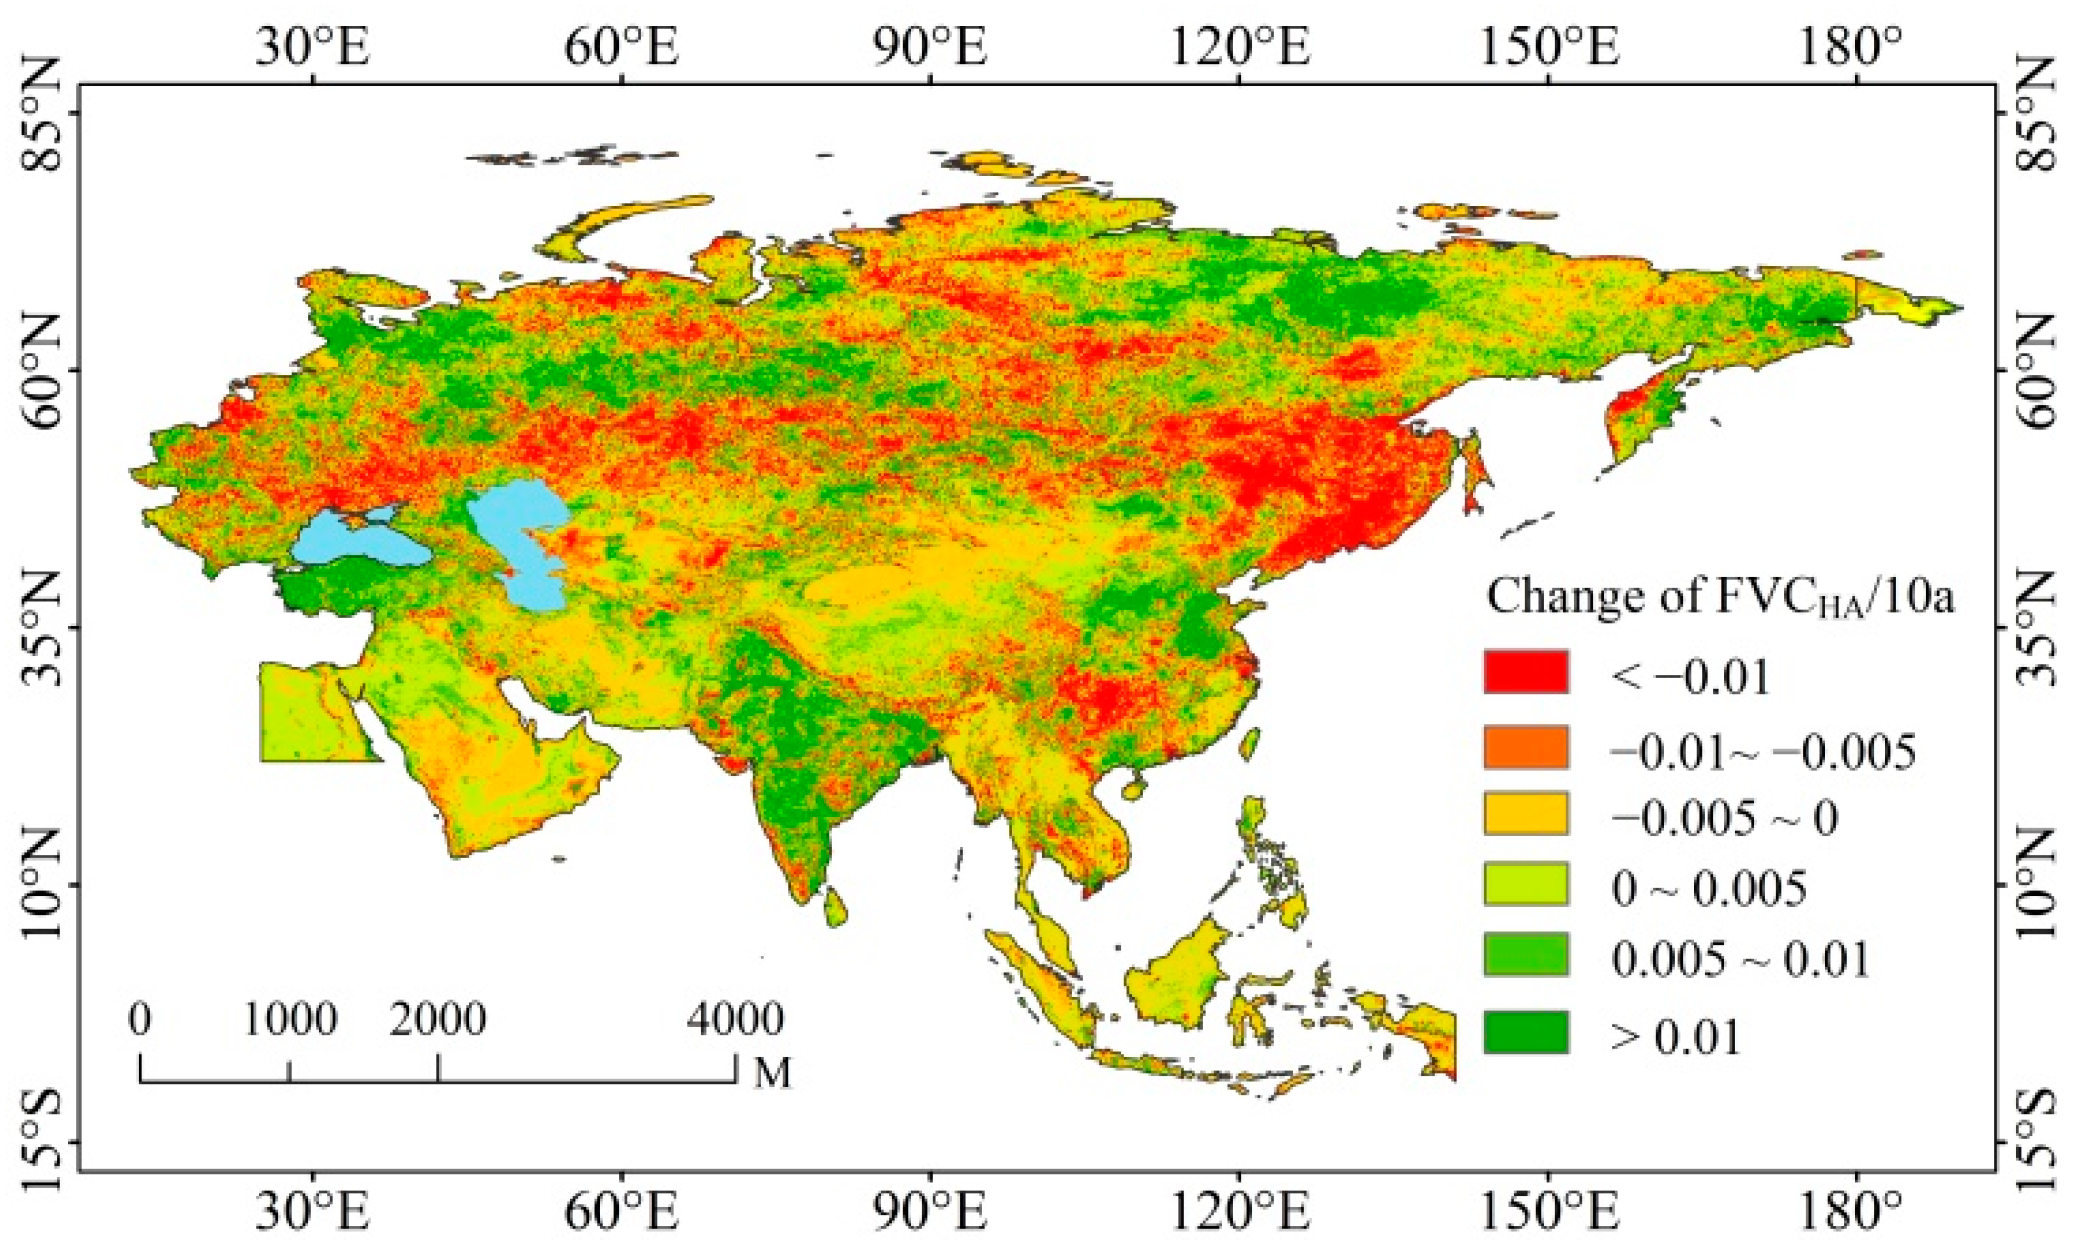
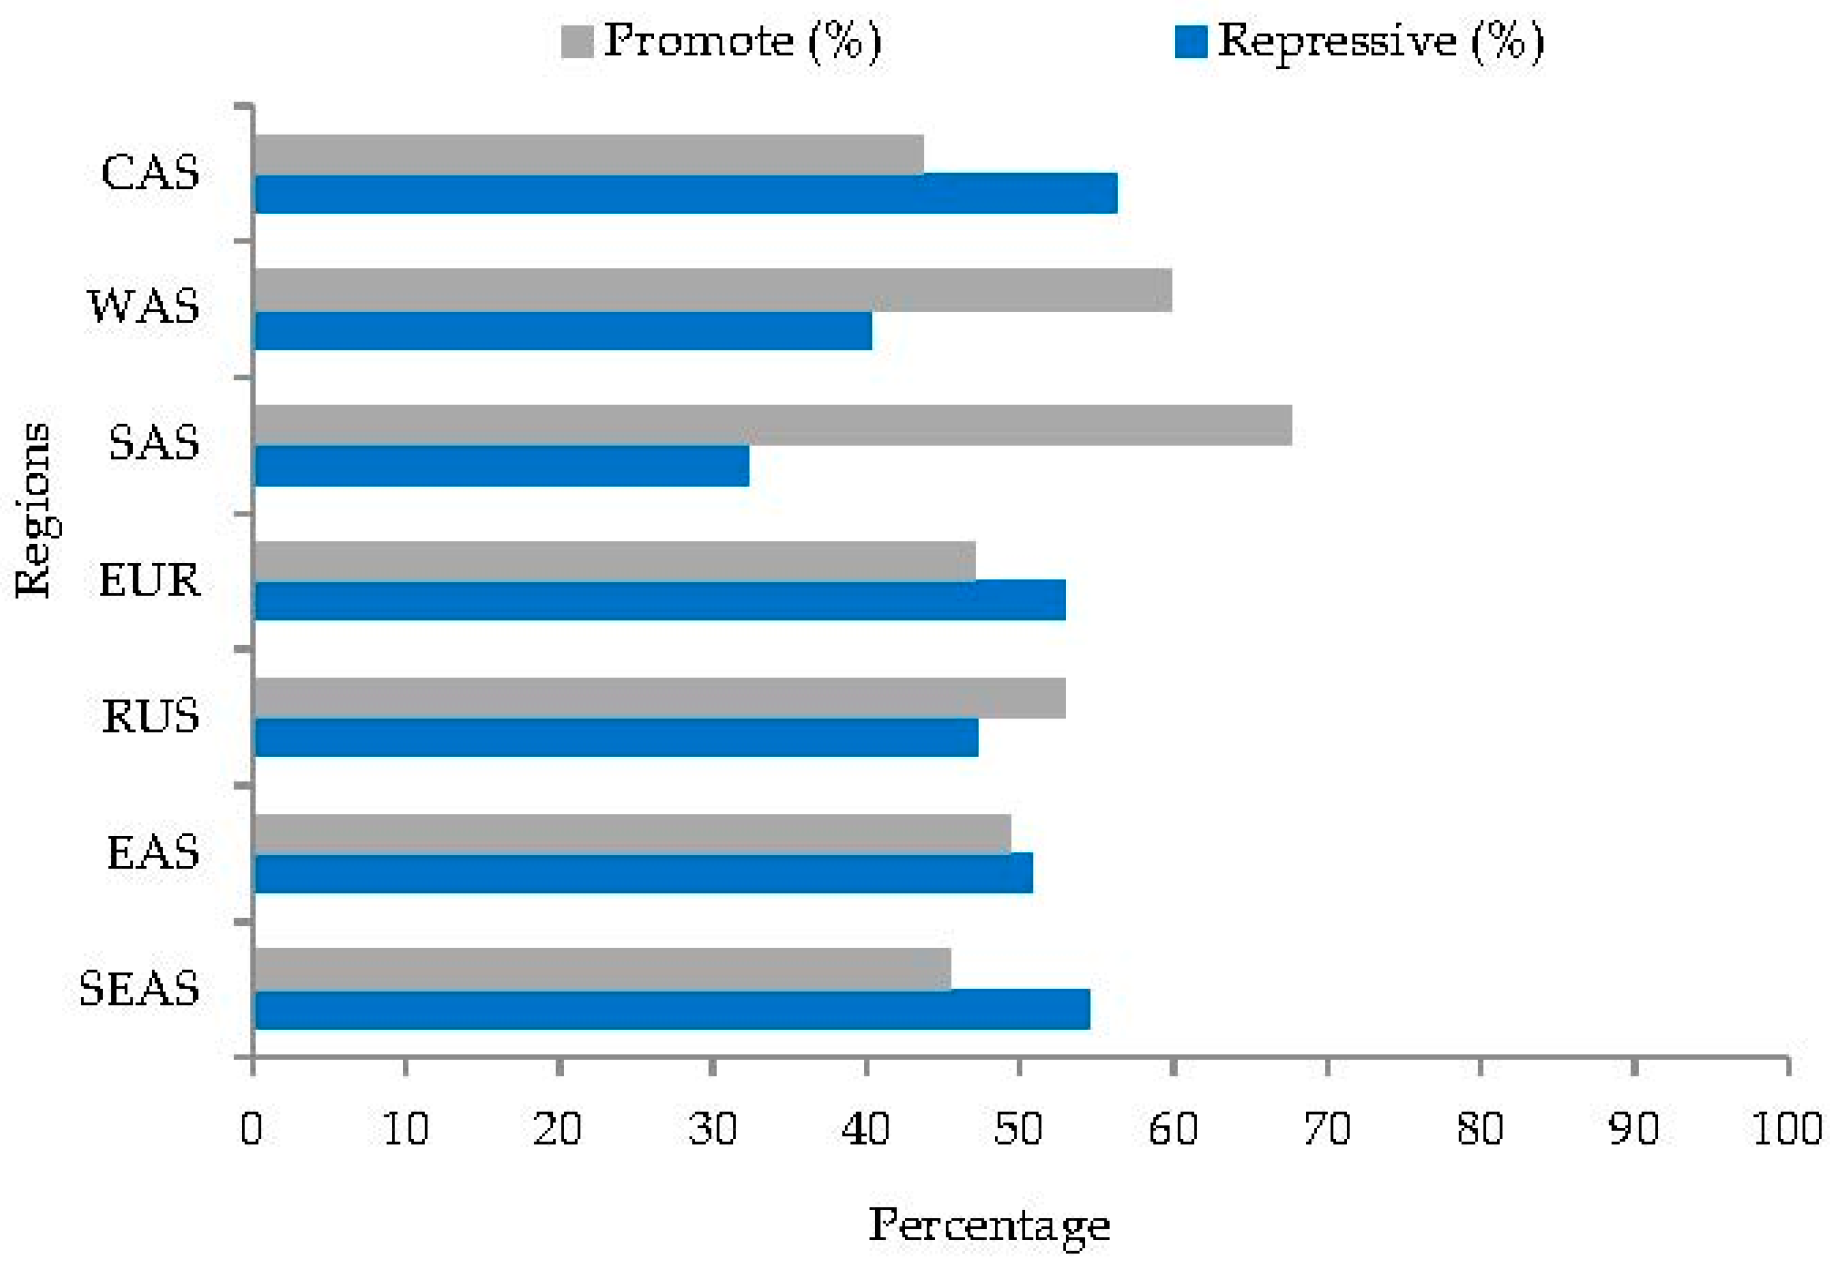
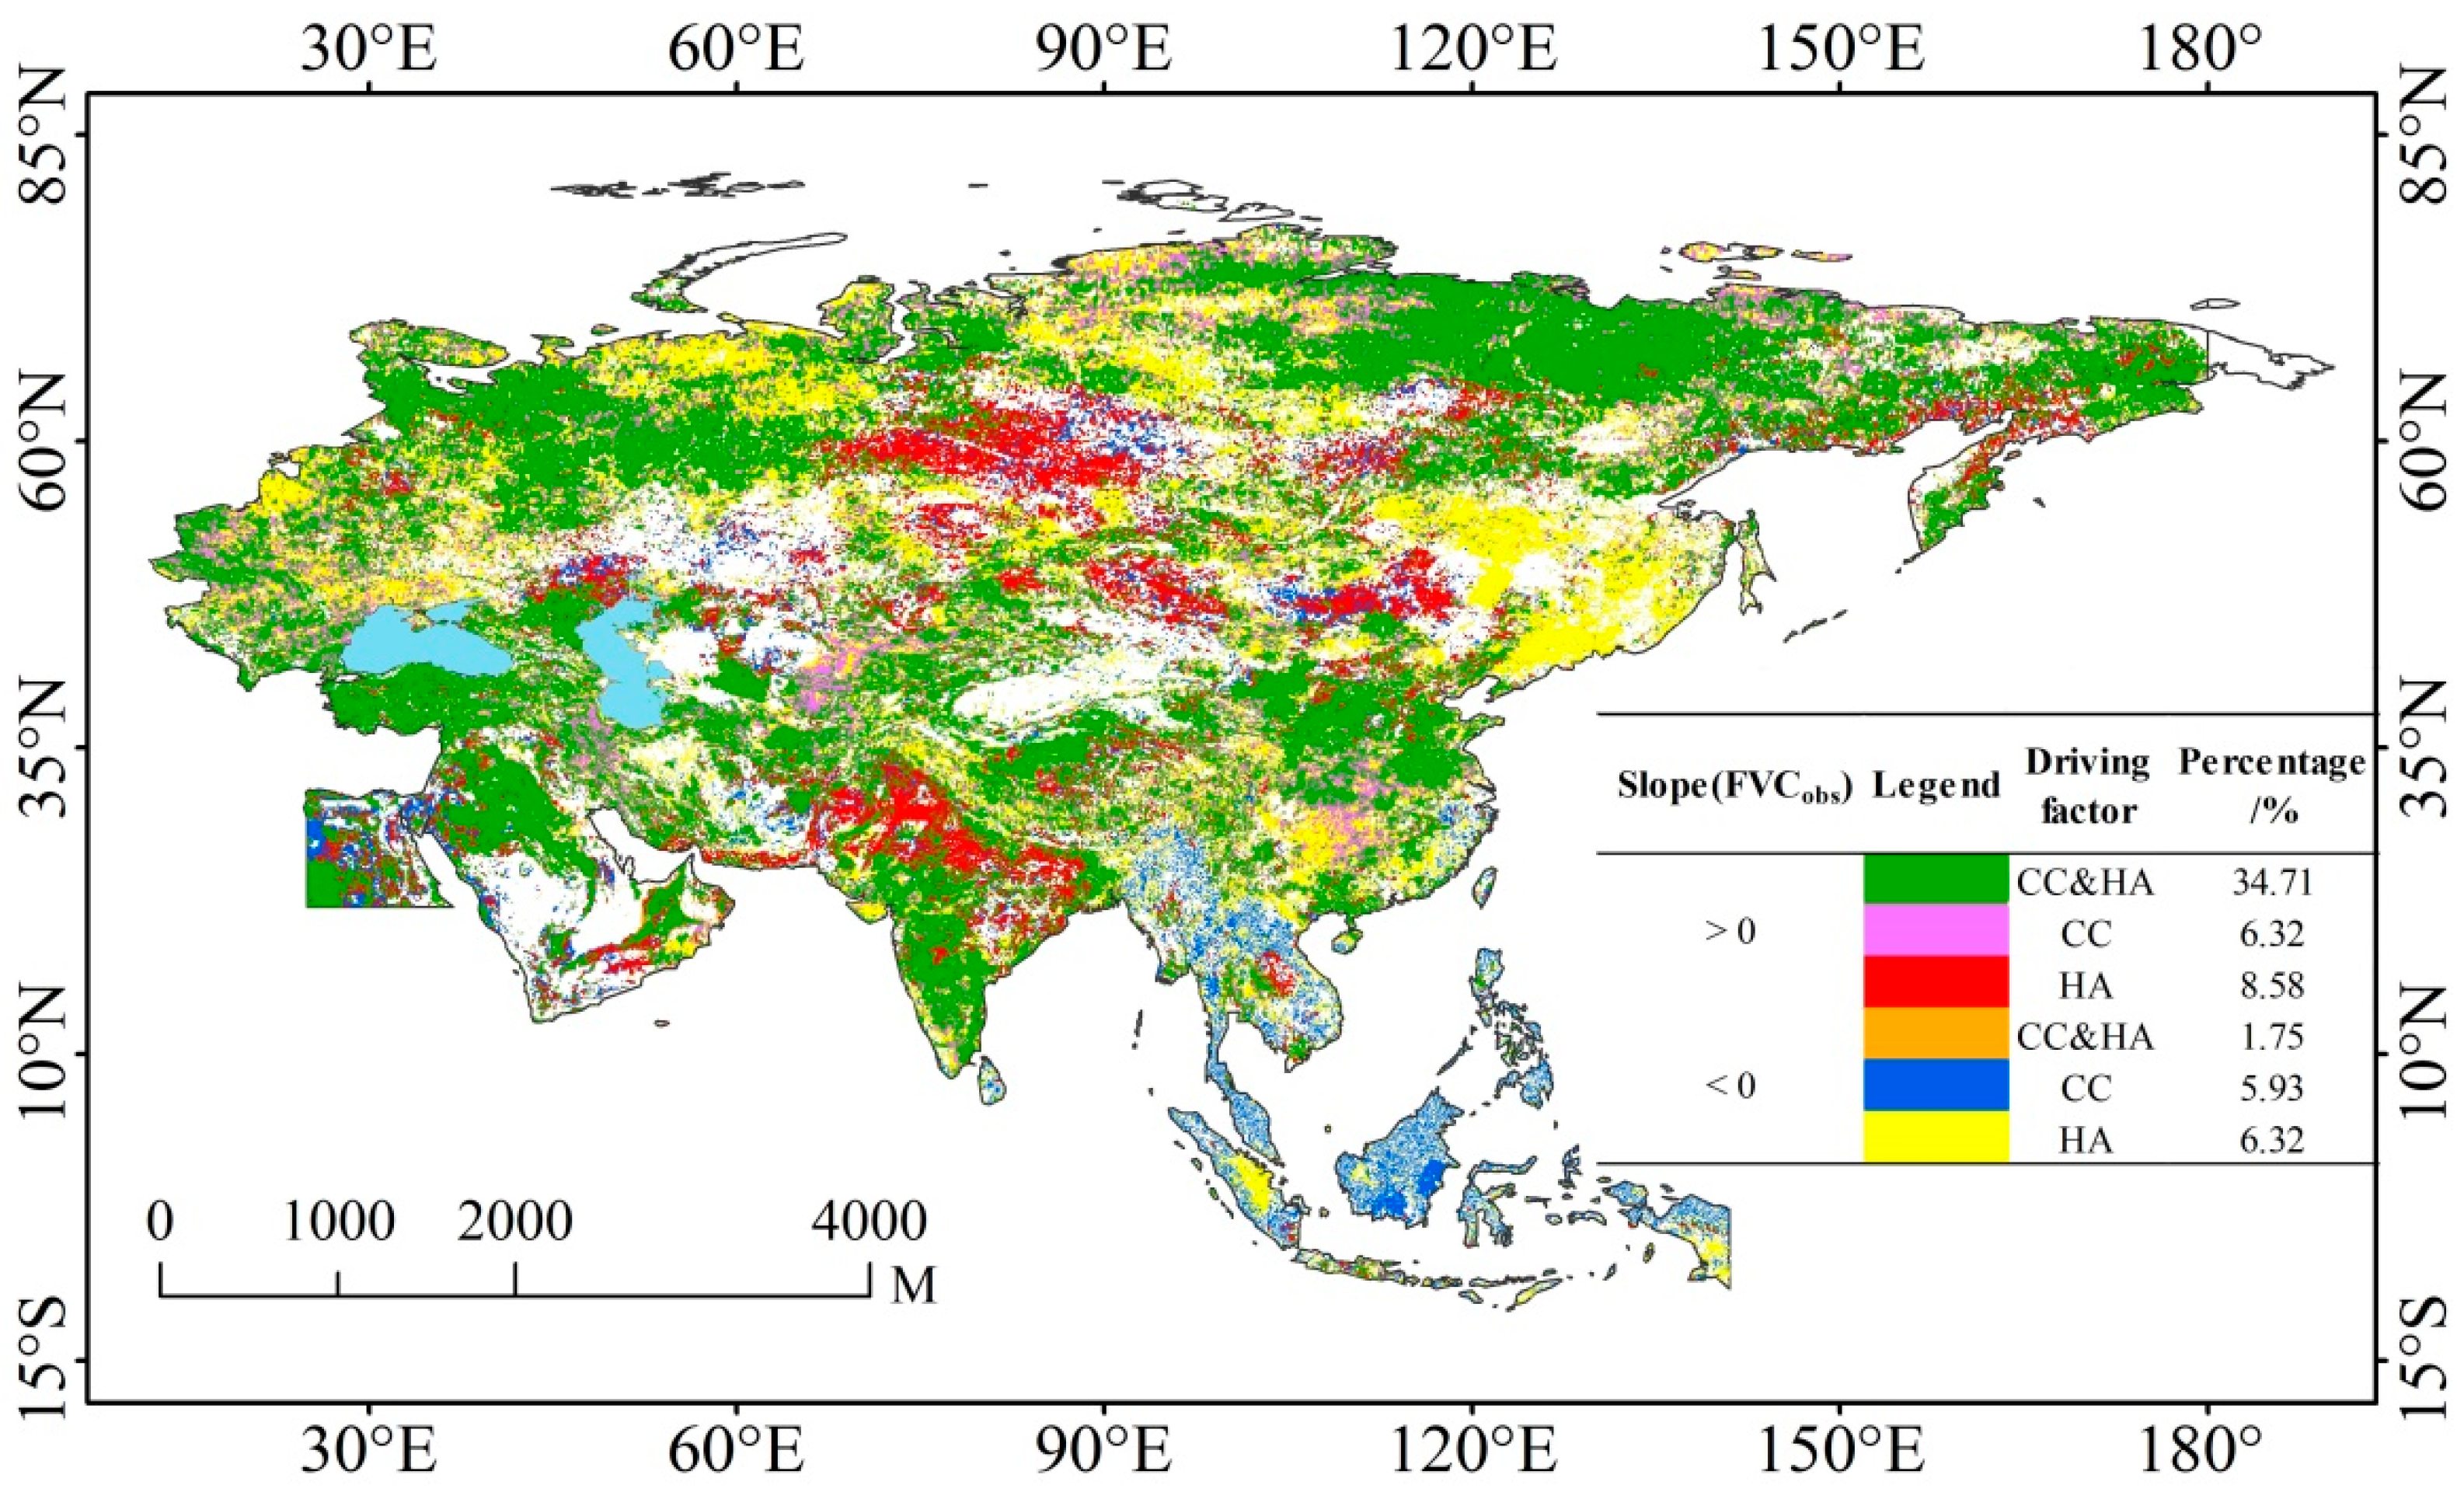
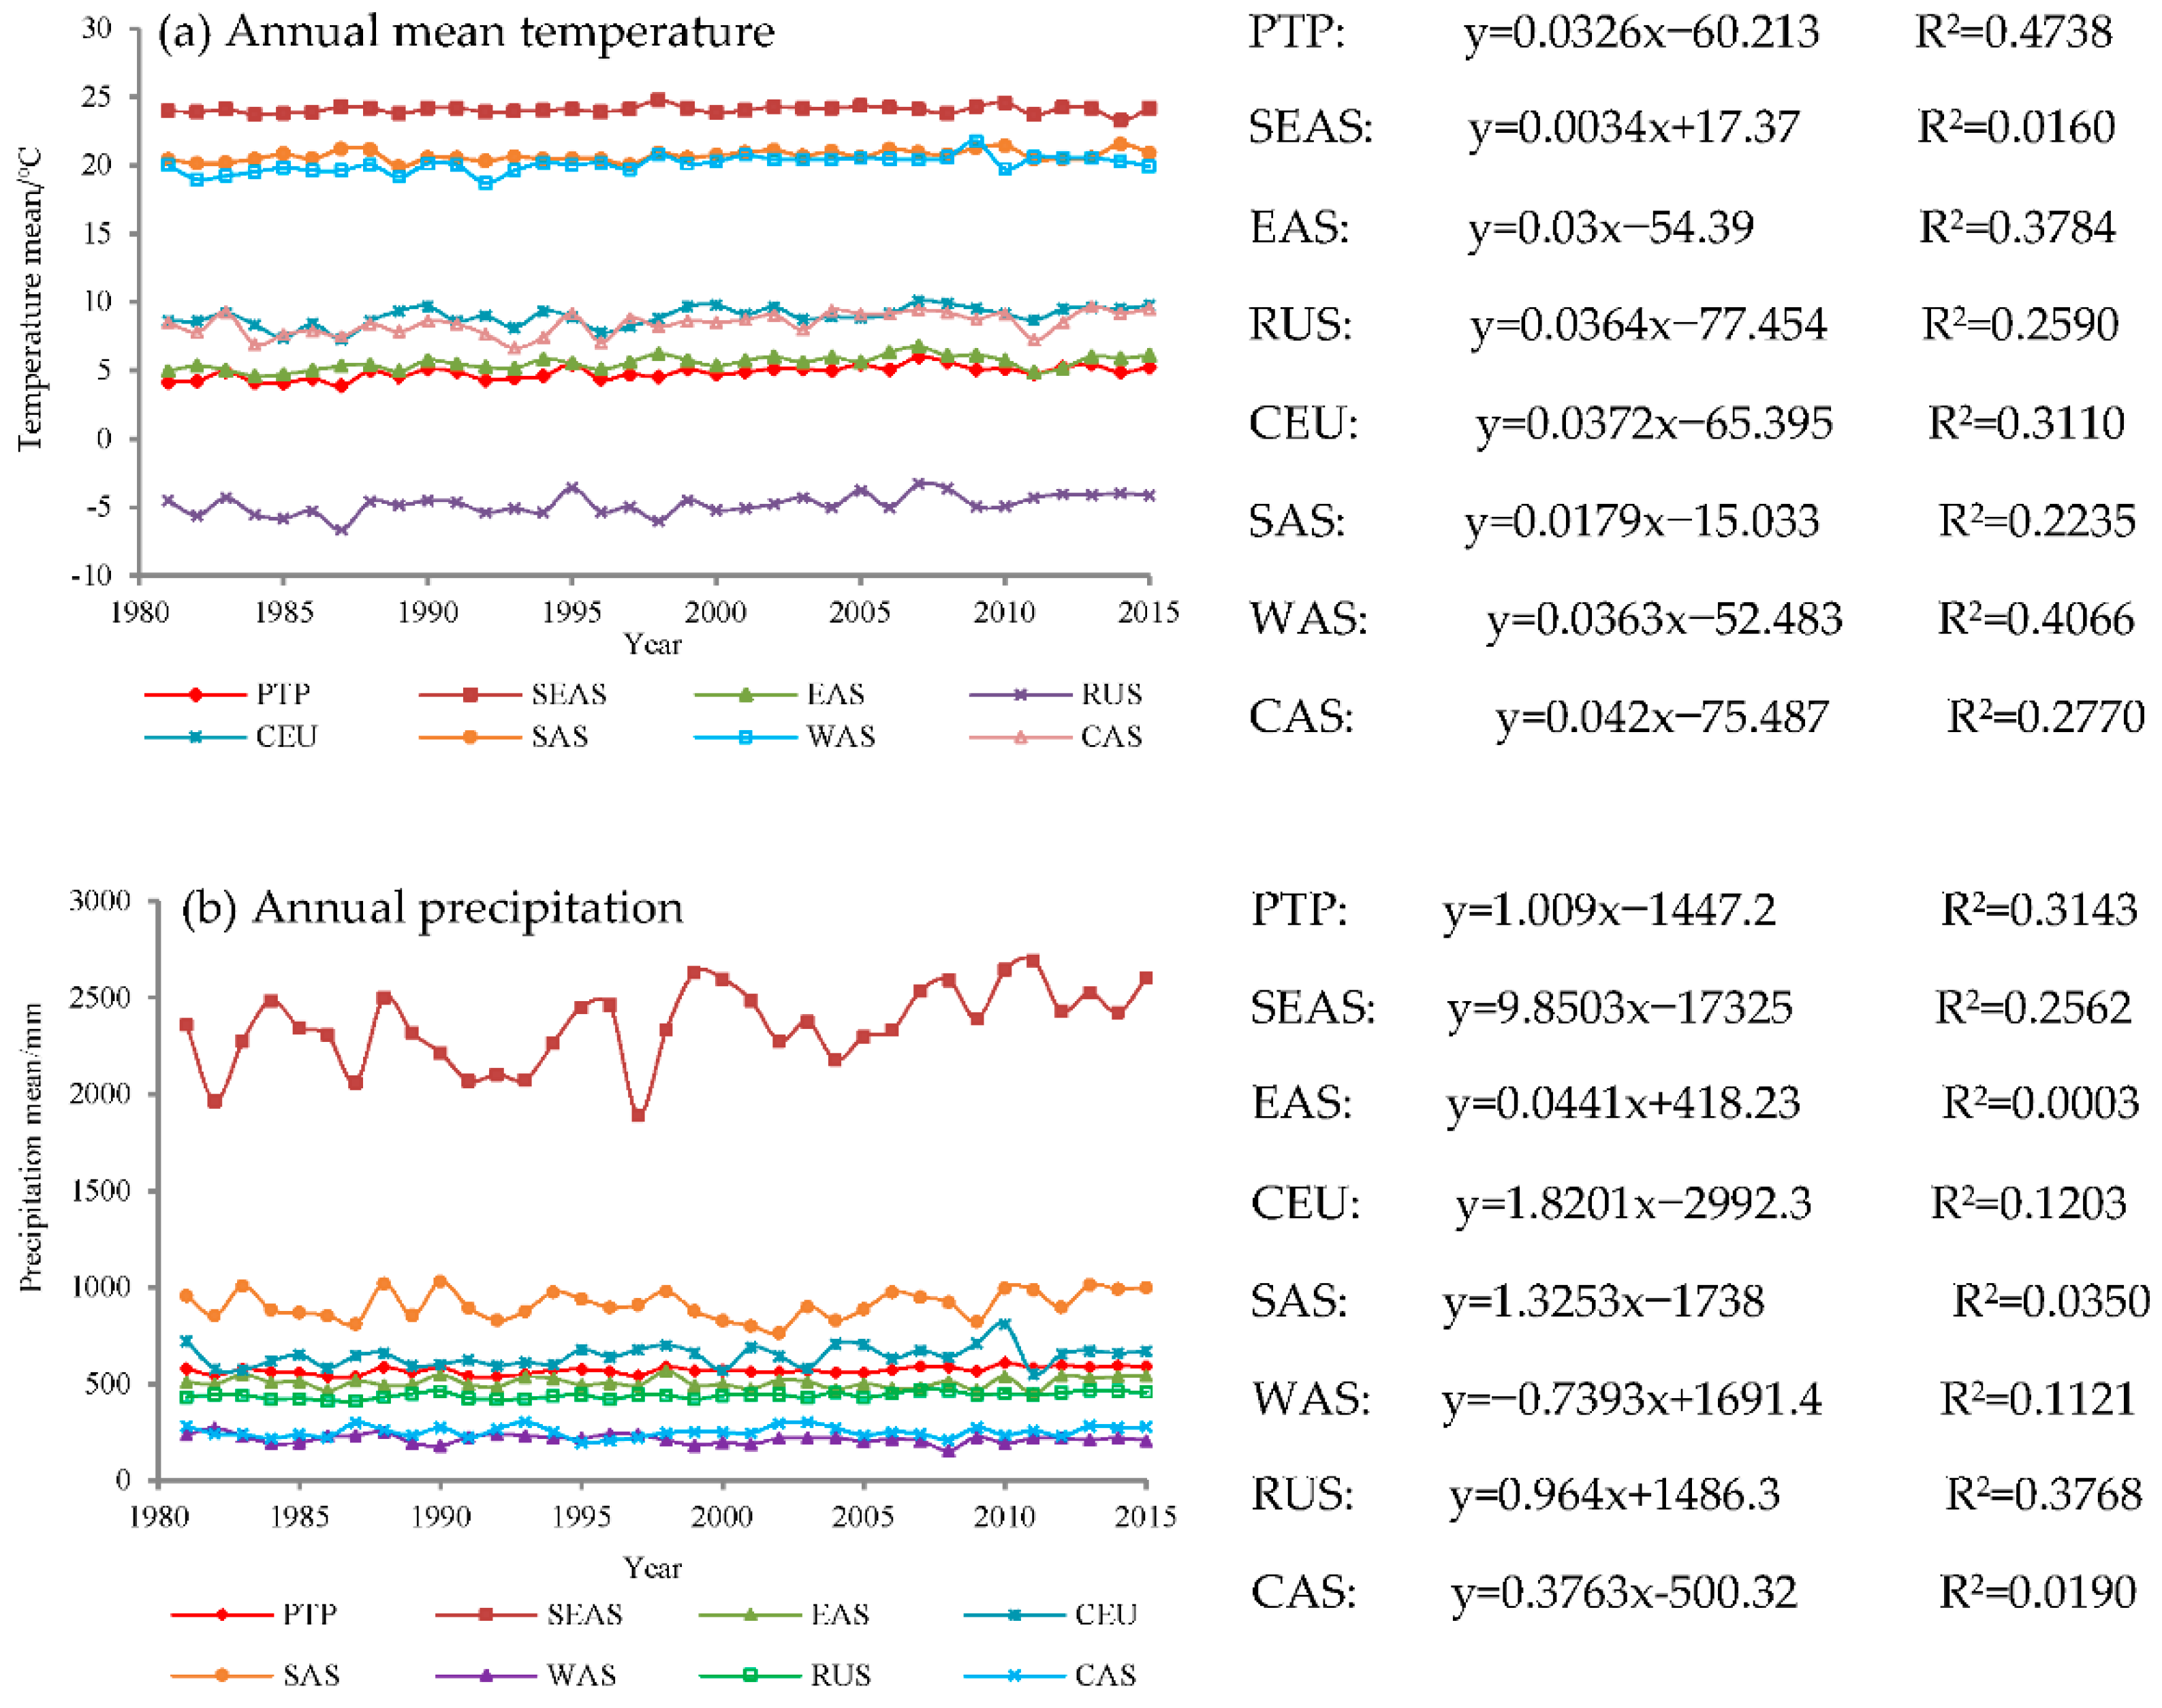
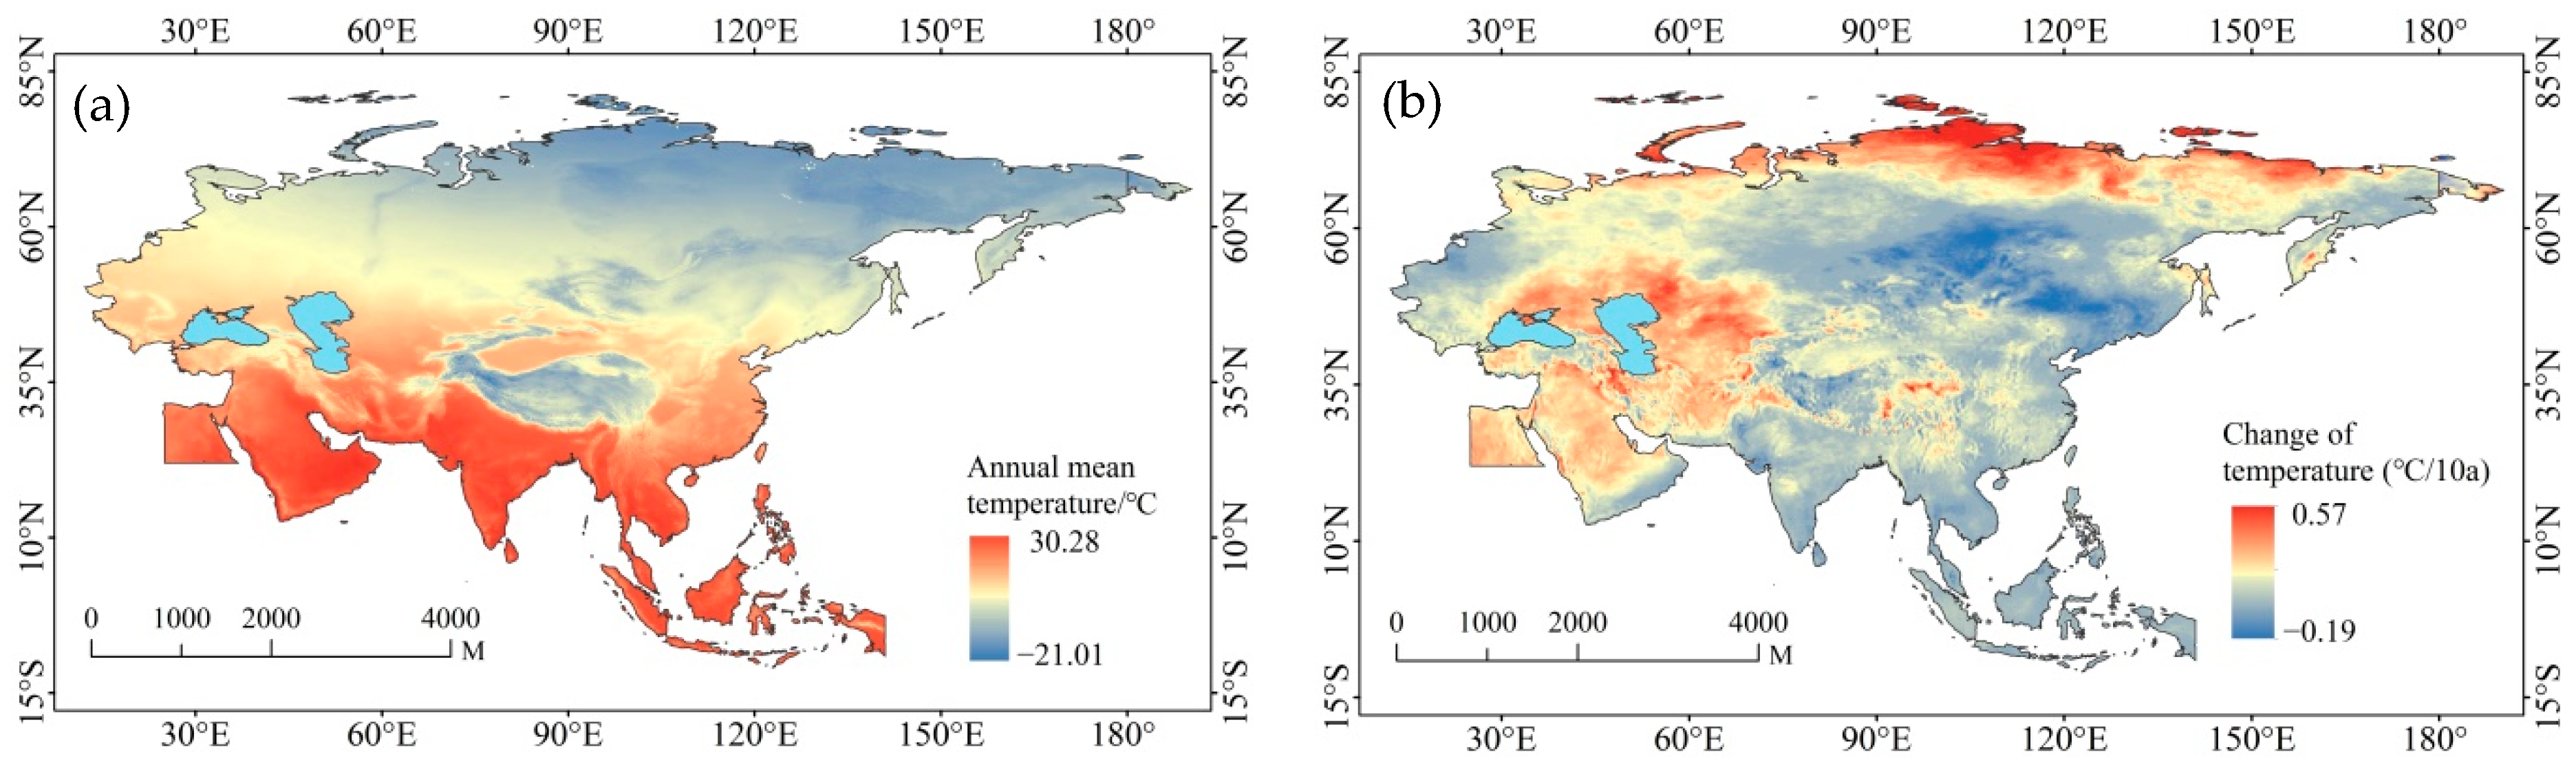
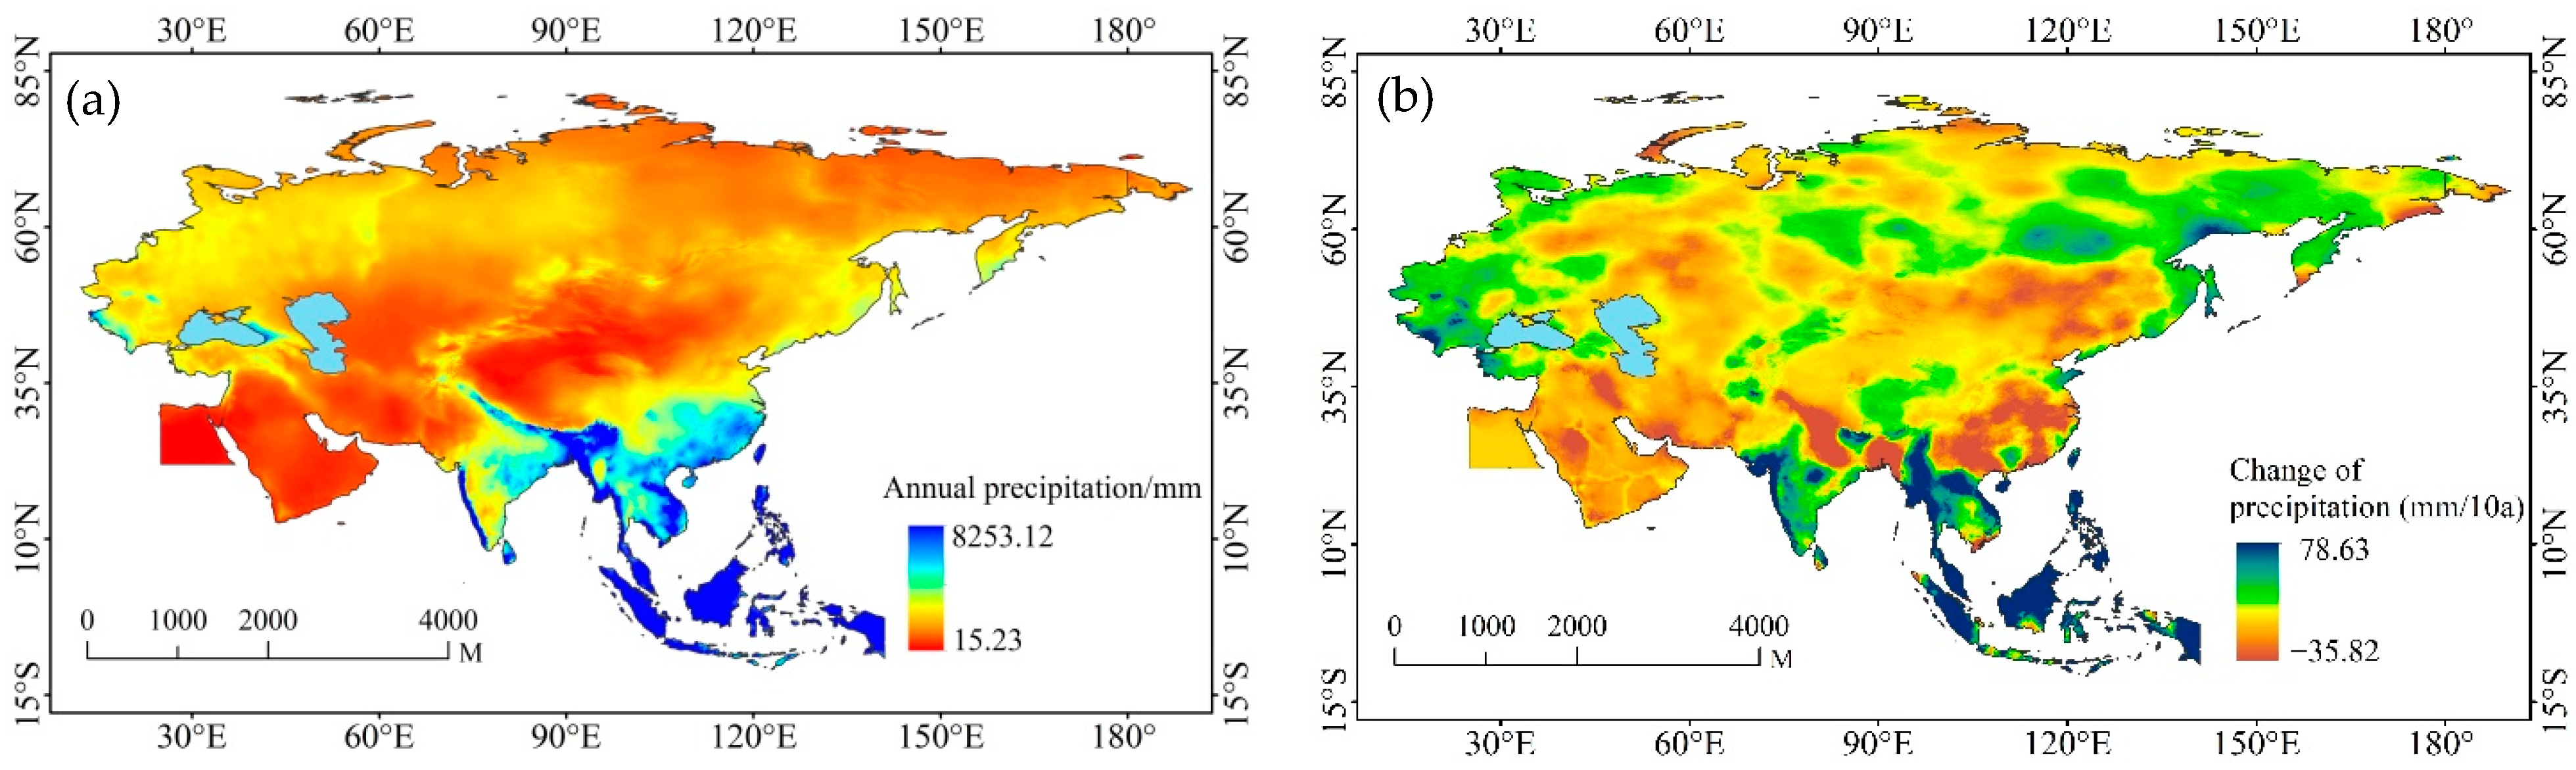
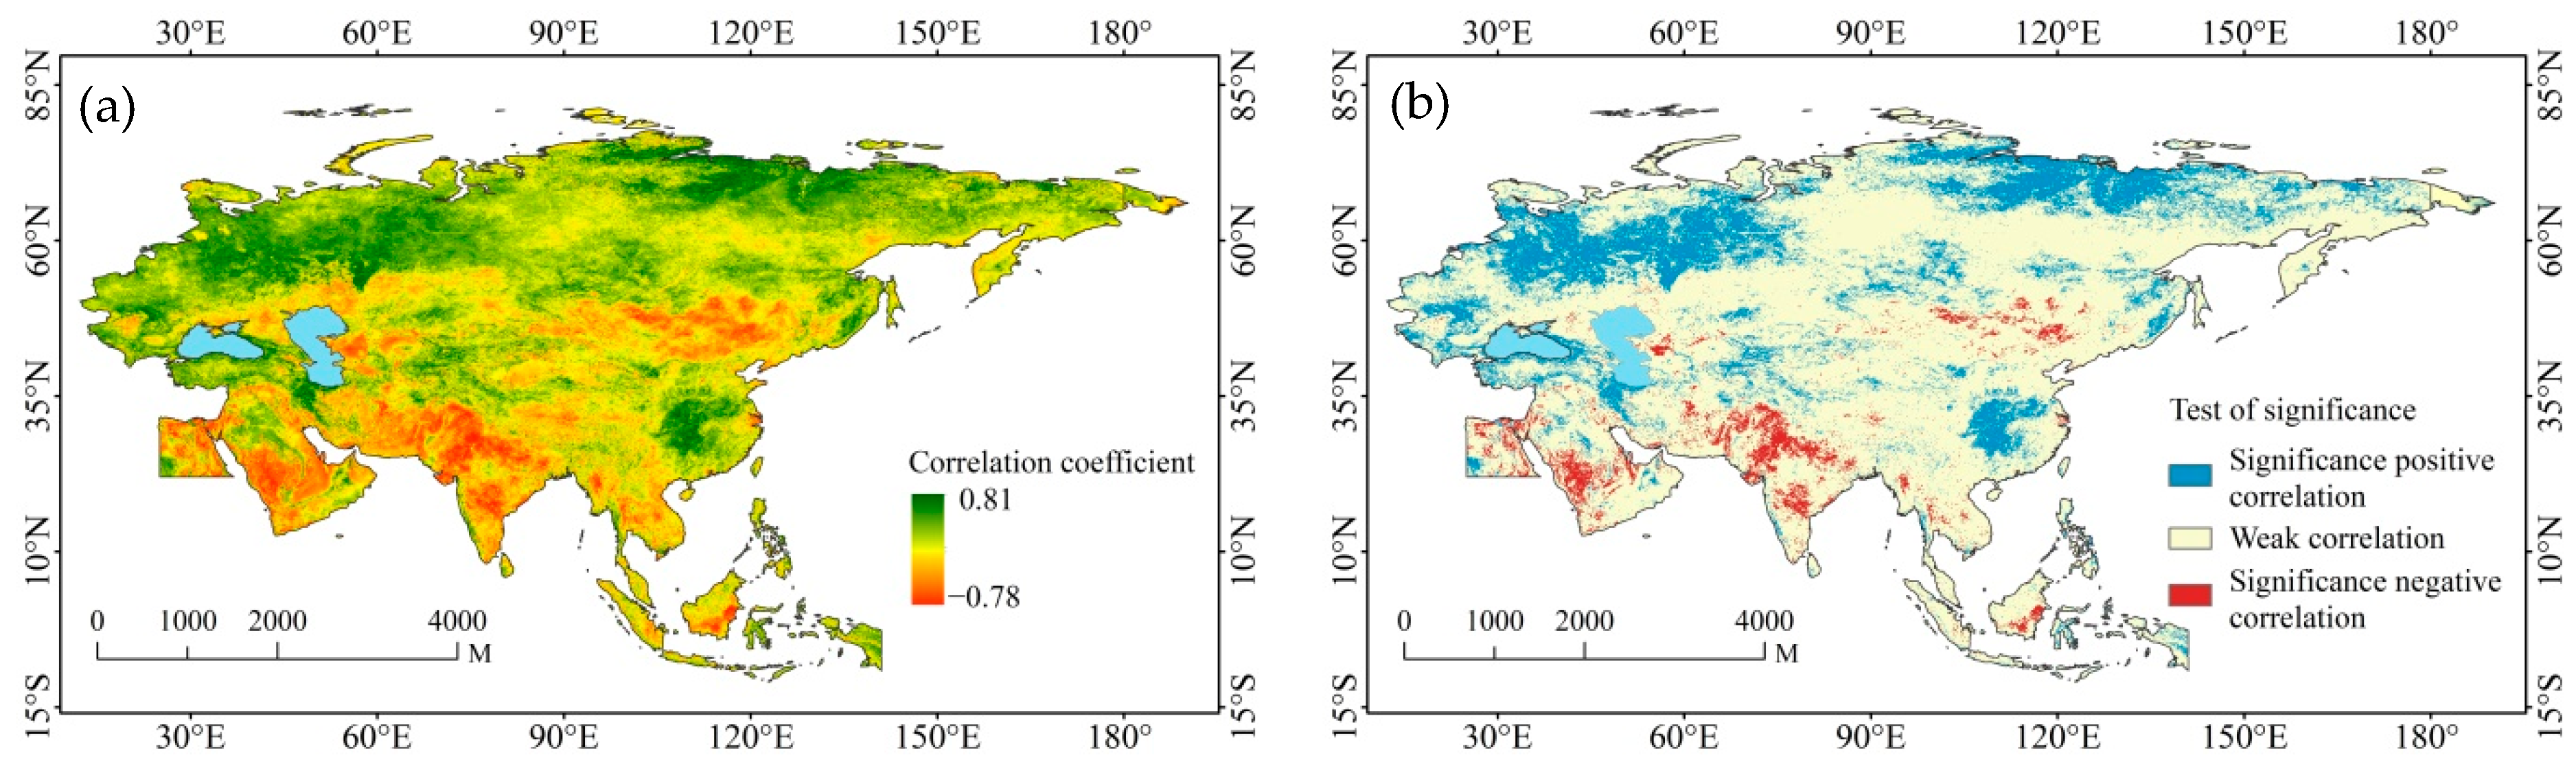
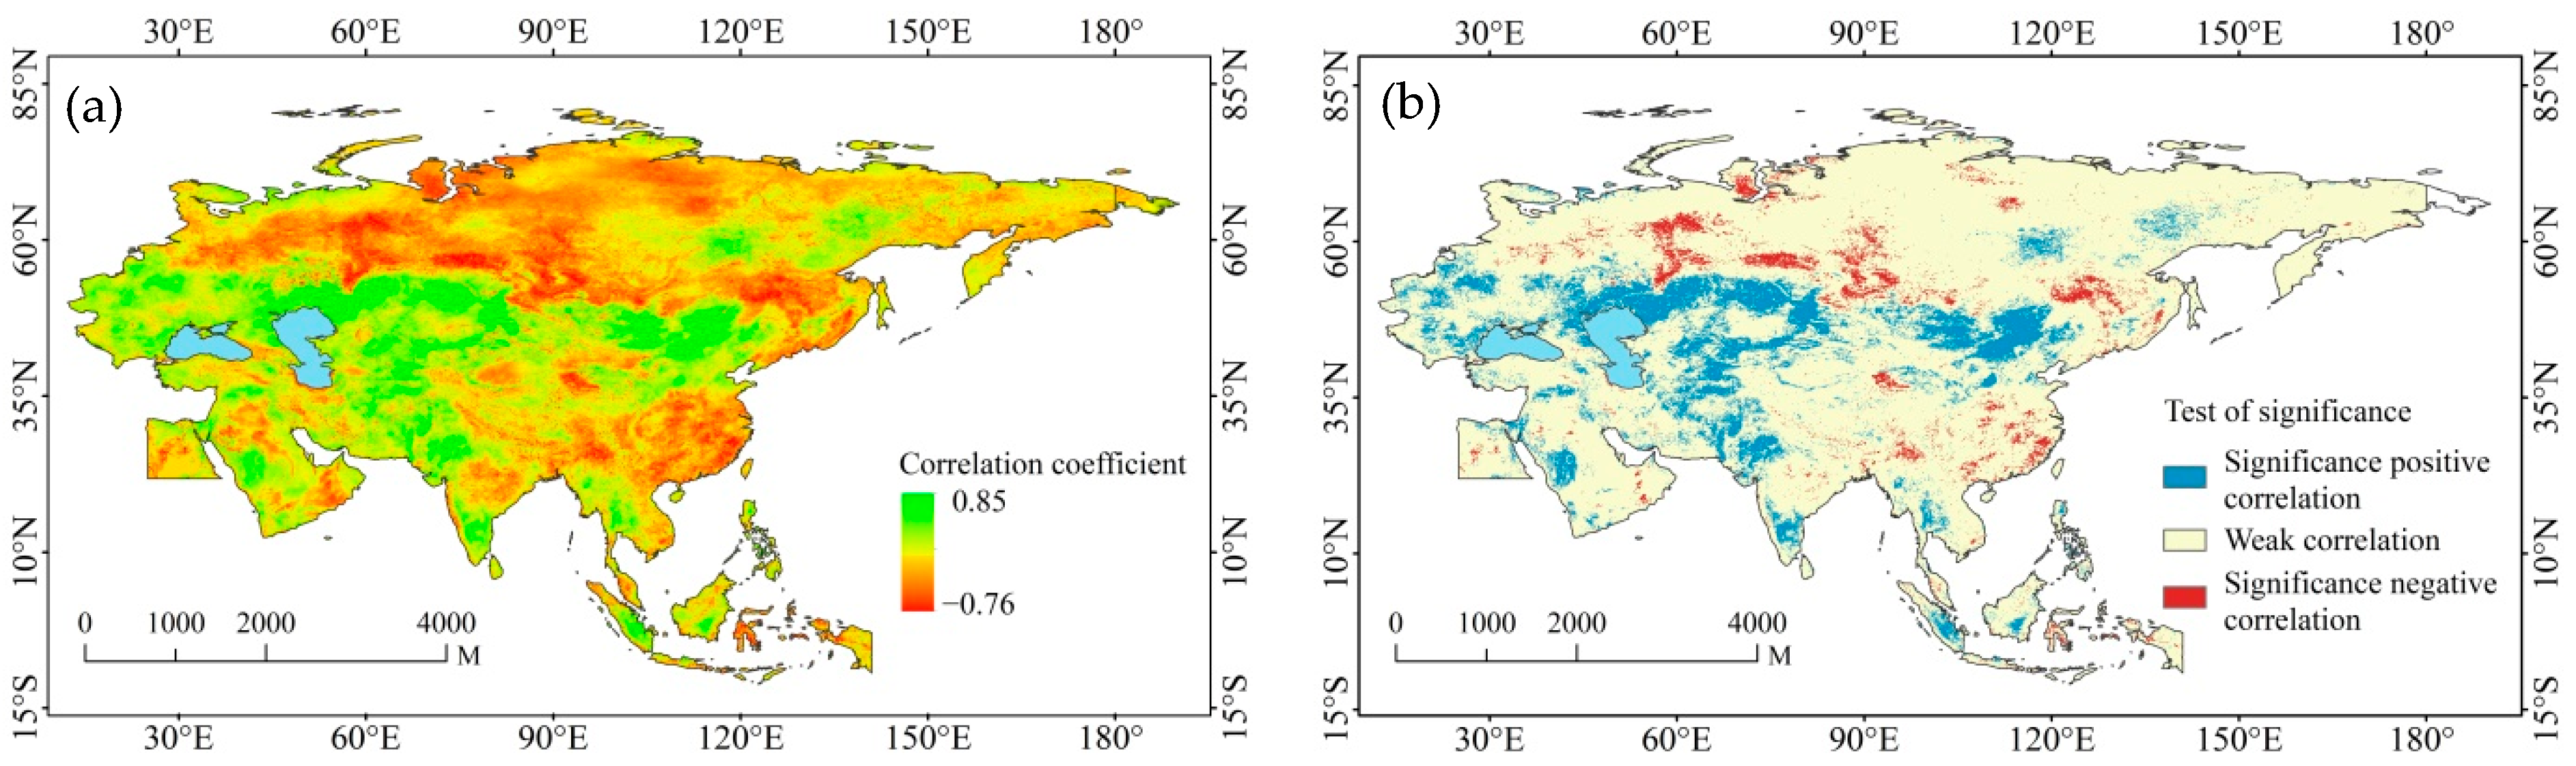
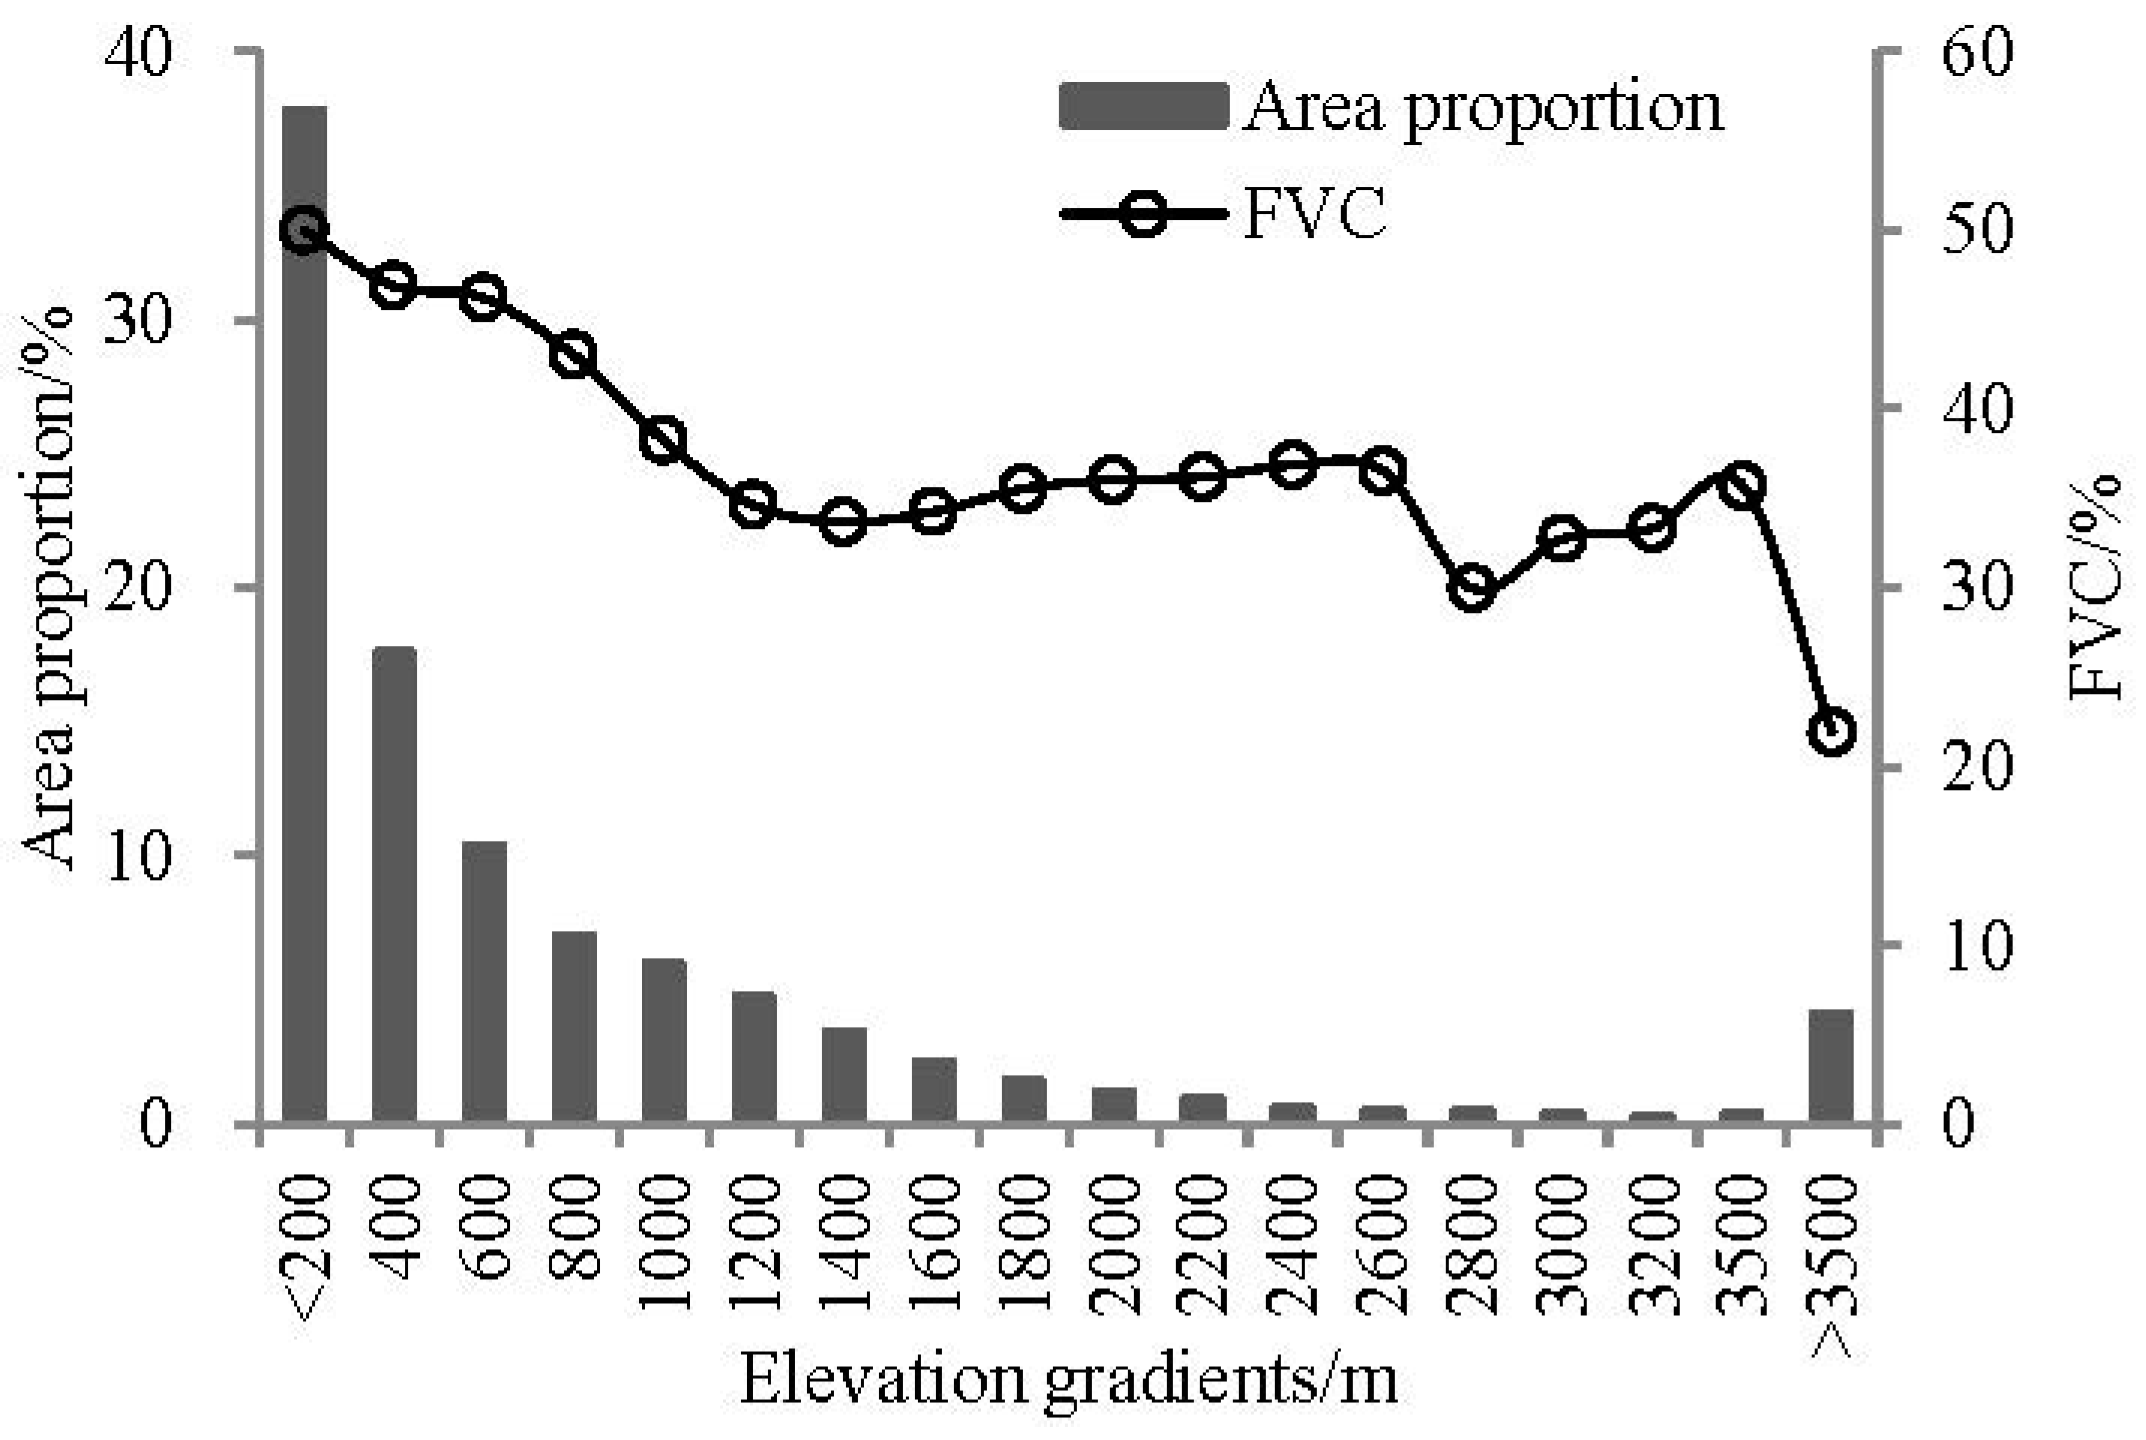
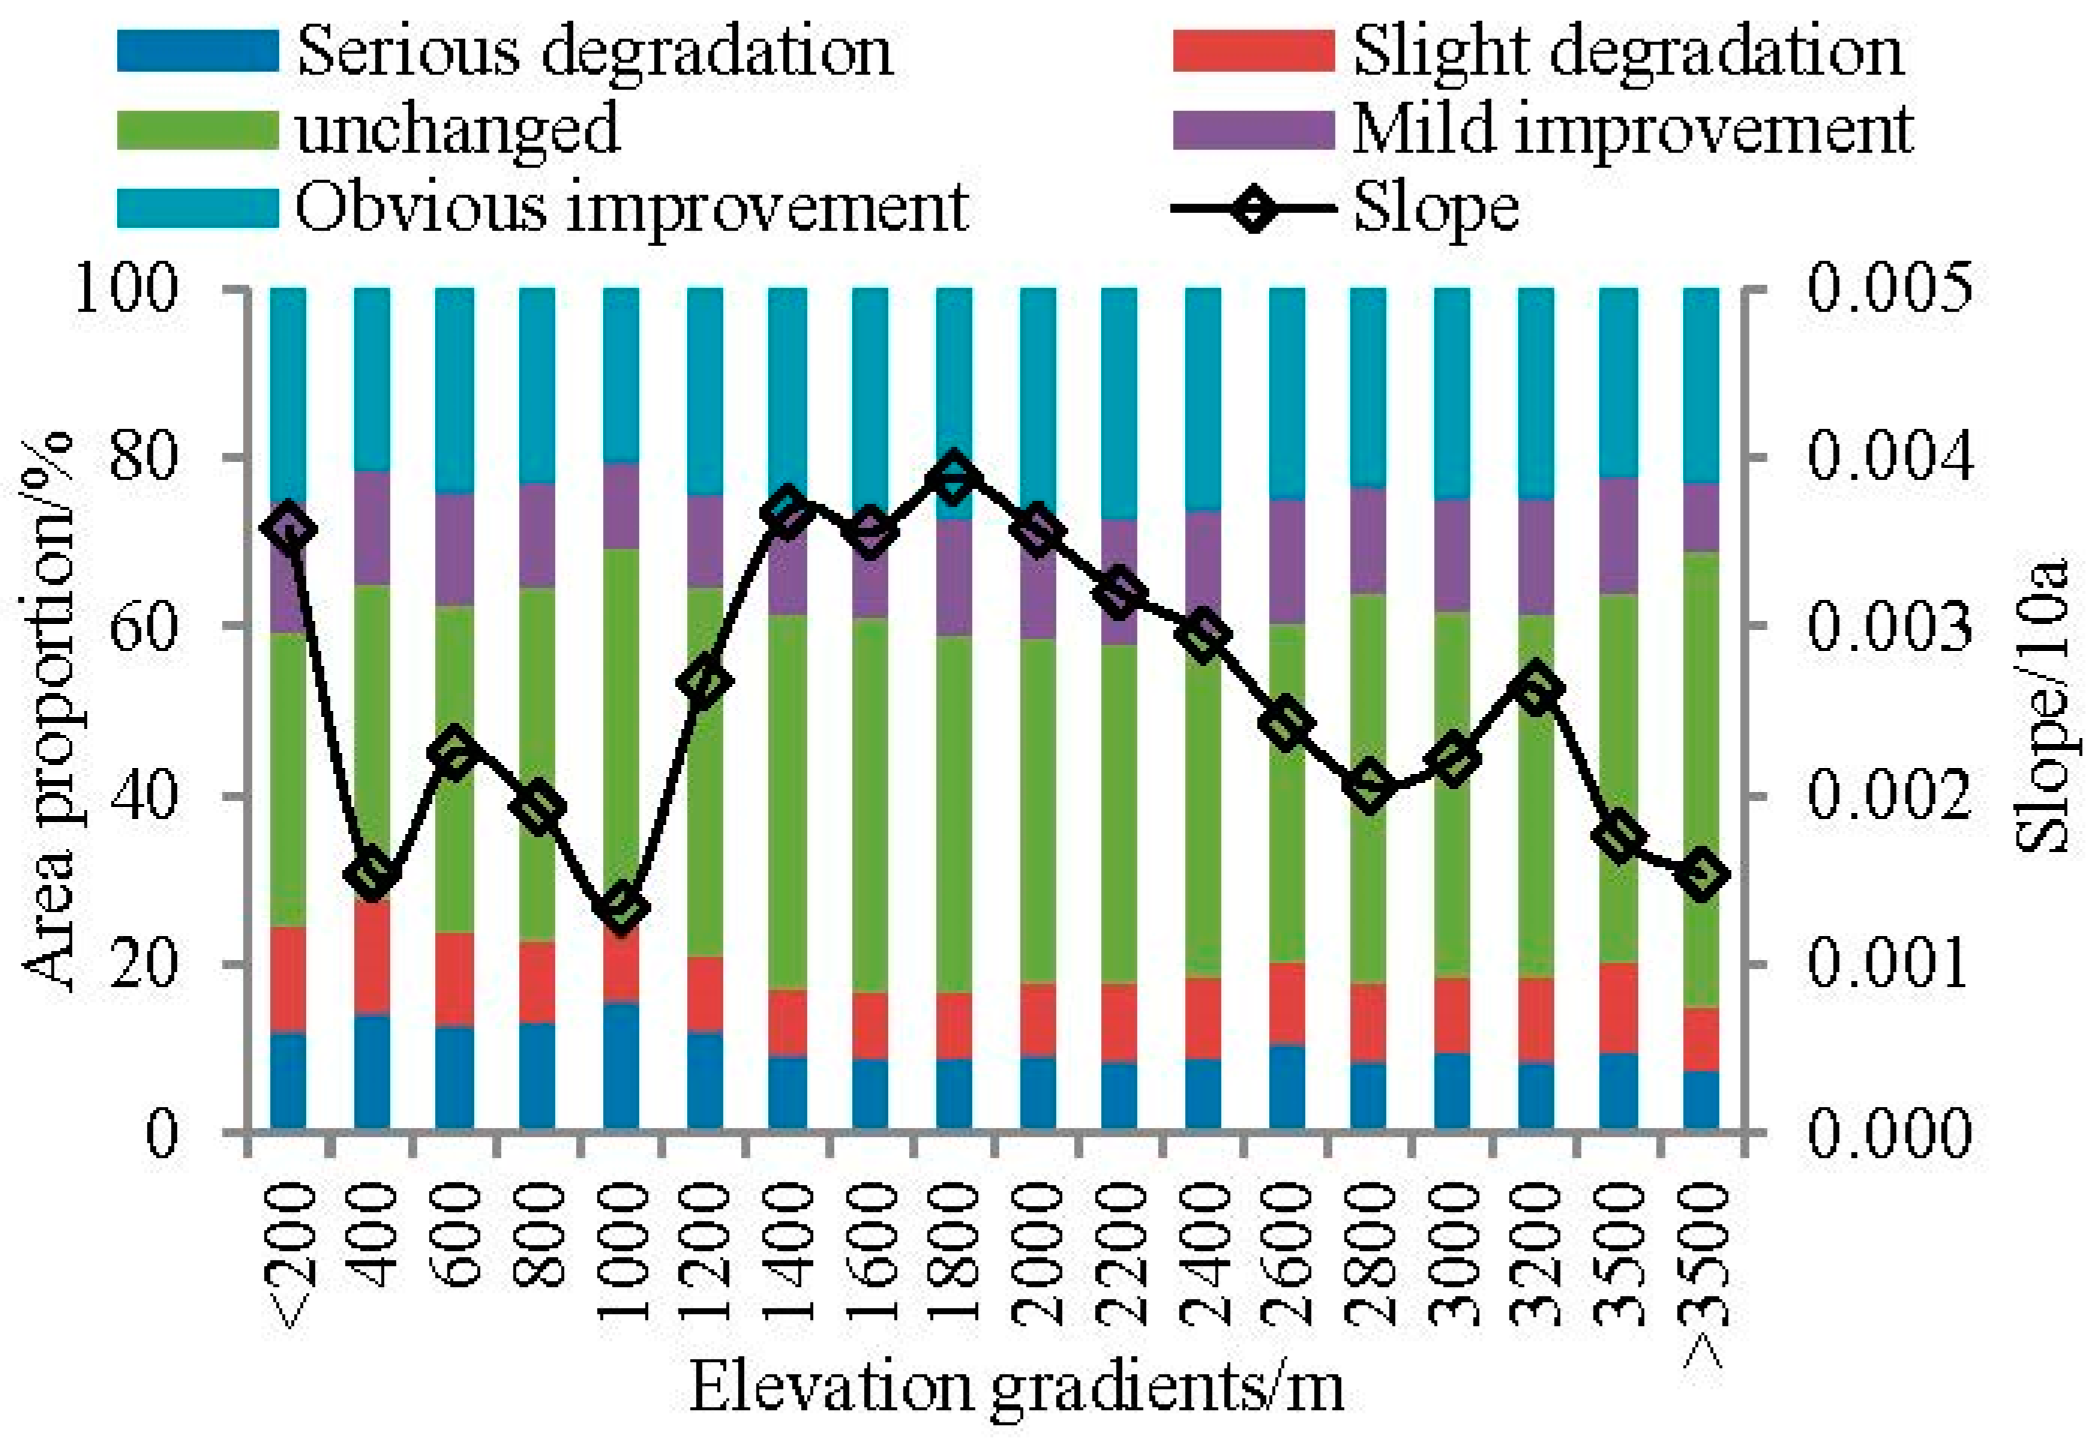
Table 1.
The classification standard for FVC change trends.
| Theil-Sen | MK Significance Test | Change Levels | Theil-Sen | MK Significance Test | Change Levels |
|---|---|---|---|---|---|
| Slope ≤ −0.0005 | Z ≤ −1.96 | Serious degradation | Slope ≥ 0.005 | −1.96 < Z < 19.6 | Mild improvement |
| Slope ≤ −0.0005 | −1.96 < Z < 19.6 | Slight degradation | Slope ≥ 0.005 | Z > 1.96 | Obvious improvement |
| −0.0005 < Slope < 0.0005 | −1.96 < Z < 19.6 | Unchange |
Table 2.
Determination criteria for driving forces of FVC change.
| Slope(FVCobs) | Driving Forces | Criteria for Classifying Driving Factors | |
|---|---|---|---|
| Slope(FVCCC) | Slope(FVCHA) | ||
| >0 | CC & HA | >0 | >0 |
| CC | >0 | <0 | |
| HA | <0 | >0 | |
| <0 | CC & HA | <0 | <0 |
| CC | <0 | >0 | |
| HA | >0 | <0 | |
Note: Slope(FVCobs), Slope(FVCCC), and Slope(FVCHA) represent the growth season FVC observations based on remote sensing data, growing season FVC predictions based on multivariate residual analysis, and growing season FVC residuals, respectively. CC and HA represent the impact of climate change and human activities, respectively.
Table 3.
Change trend statistics for FVC in subregions.
| Region | Serious Degradation (%) | Slight Degradation (%) | Unchanged (%) | Mild Improvement (%) | Obvious Improvement (%) |
|---|---|---|---|---|---|
| SEAS | 8.24 | 8.08 | 67.22 | 8.28 | 8.19 |
| EAS | 13.71 | 10.63 | 43.21 | 12.66 | 19.79 |
| RUS | 14.71 | 14.16 | 28.56 | 14.98 | 27.59 |
| CEU | 6.32 | 17.42 | 25.22 | 23.06 | 27.98 |
| SAS | 6.42 | 8.12 | 33.67 | 17.81 | 33.98 |
| WAS | 9.87 | 3.65 | 55.85 | 6.37 | 24.26 |
| CAS | 14.96 | 15.87 | 38.79 | 15.72 | 14.66 |
Table 4.
FVC trend rates and driving factors of subregions in the Pan-Third Pole region during 1982–2015 (10a−1).
Table 4.
FVC trend rates and driving factors of subregions in the Pan-Third Pole region during 1982–2015 (10a−1).
| Regions | Slope (FVCobs) | Effect on Vegetation Restoration | Driving Factors | |
|---|---|---|---|---|
| CC | HA | |||
| SAS | 0.0078 | Promote | Promote | CC&HA |
| CEU | 0.0061 | Promote | Repressive | CC |
| WAS | 0.0033 | Promote | Promote | CC&HA |
| SEAS | 0.0004 | Repressive | Promote | HA |
| EAS | 0.0012 | Promote | Repressive | CC |
| CAS | 0.0002 | Promote | Repressive | CC |
| RUS | 0.0022 | Promote | Promote | CC&HA |
Note: Slope (FVCobs) represent the growing season FVC observations based on remote sensing data. CC and HA represent the impacts of climate change and human activities, respectively.
Publisher’s Note: MDPI stays neutral with regard to jurisdictional claims in published maps and institutional affiliations. |
© 2022 by the authors. Licensee MDPI, Basel, Switzerland. This article is an open access article distributed under the terms and conditions of the Creative Commons Attribution (CC BY) license (https://creativecommons.org/licenses/by/4.0/).
Share and Cite
MDPI and ACS Style
Yang, X.; Yang, Q.; Yang, M. Spatio-Temporal Patterns and Driving Factors of Vegetation Change in the Pan-Third Pole Region. Remote Sens. 2022, 14, 4402. https://doi.org/10.3390/rs14174402
AMA Style
Yang X, Yang Q, Yang M. Spatio-Temporal Patterns and Driving Factors of Vegetation Change in the Pan-Third Pole Region. Remote Sensing. 2022; 14(17):4402. https://doi.org/10.3390/rs14174402
Chicago/Turabian StyleYang, Xuyan, Qinke Yang, and Miaomiao Yang. 2022. "Spatio-Temporal Patterns and Driving Factors of Vegetation Change in the Pan-Third Pole Region" Remote Sensing 14, no. 17: 4402. https://doi.org/10.3390/rs14174402
Note that from the first issue of 2016, this journal uses article numbers instead of page numbers. See further details here.