
Late Cenozoic to Present Kinematic of the North to Eastern Iran Orogen: Accommodating Opposite Sense of Fault Blocks Rotation


Abstract
:1. Introduction
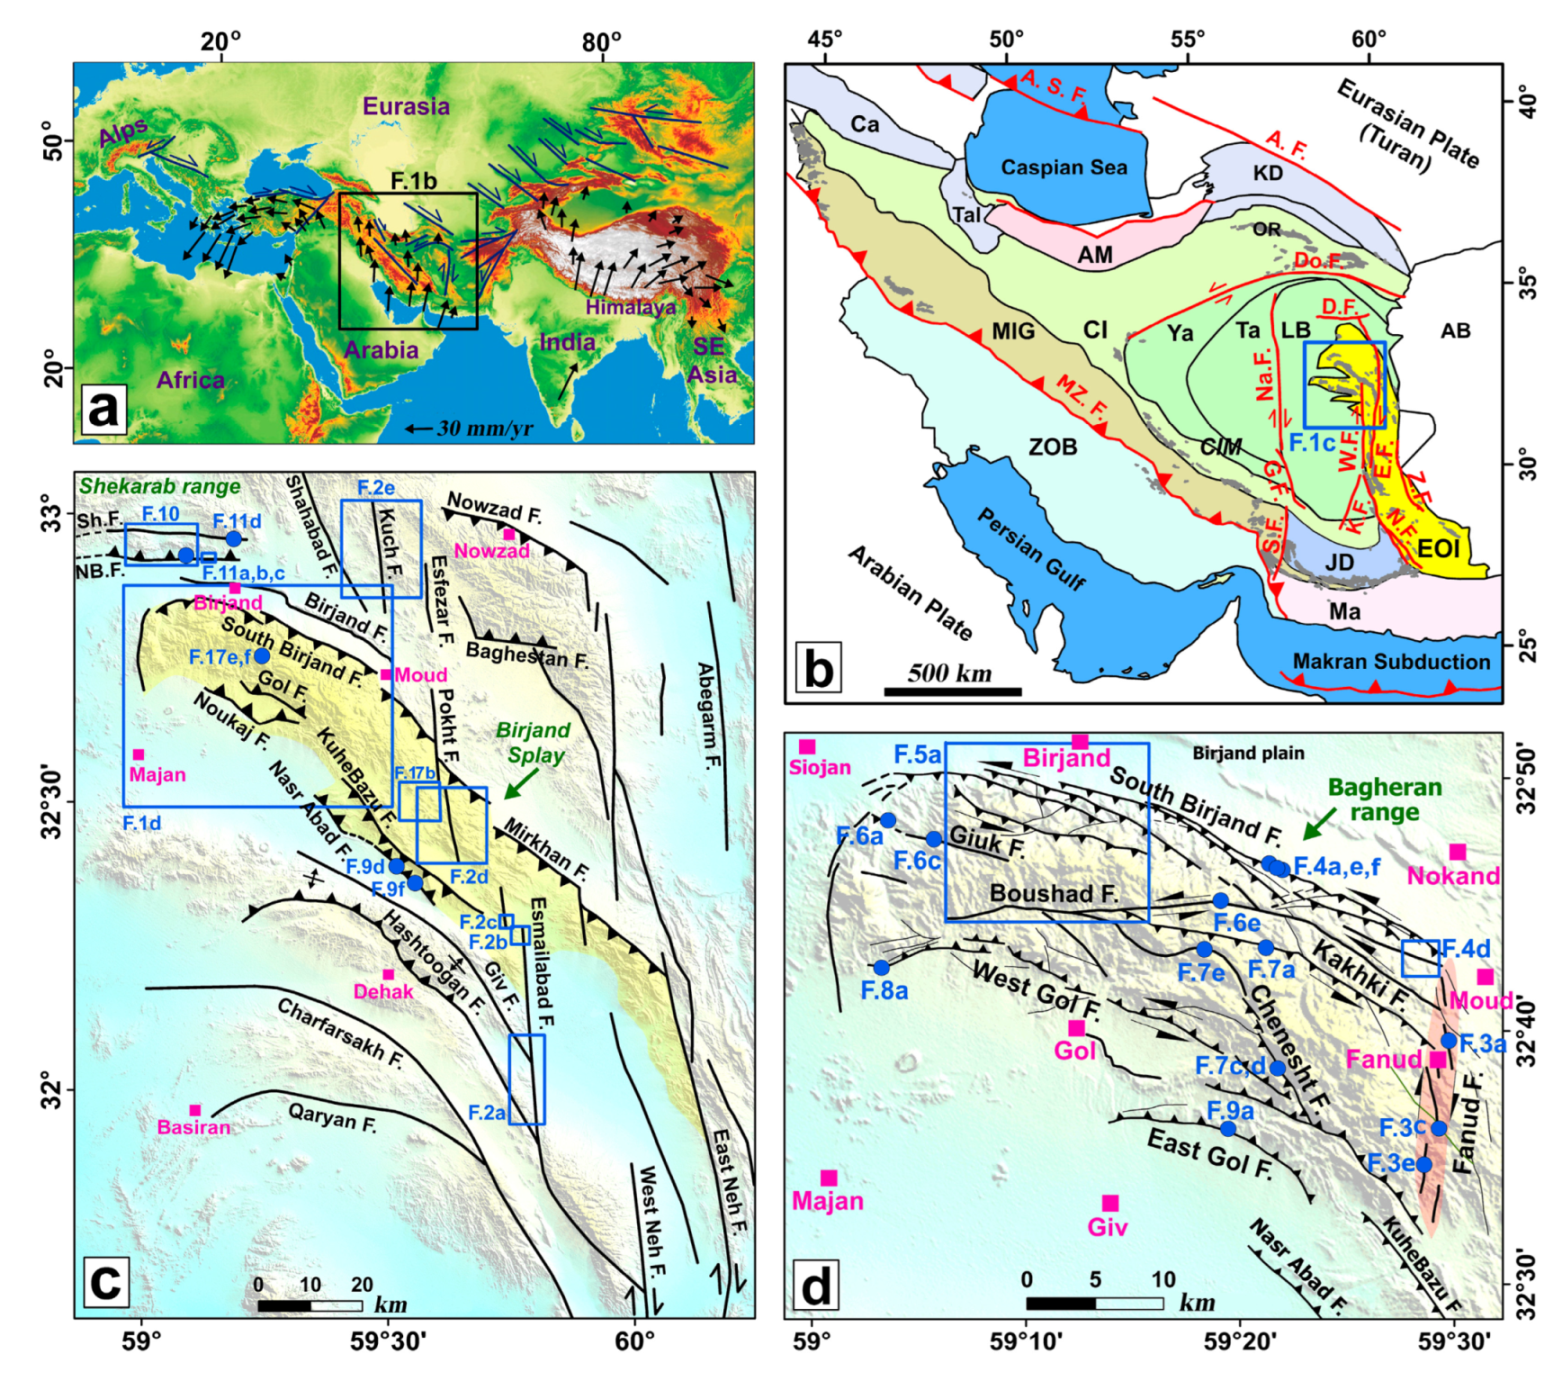
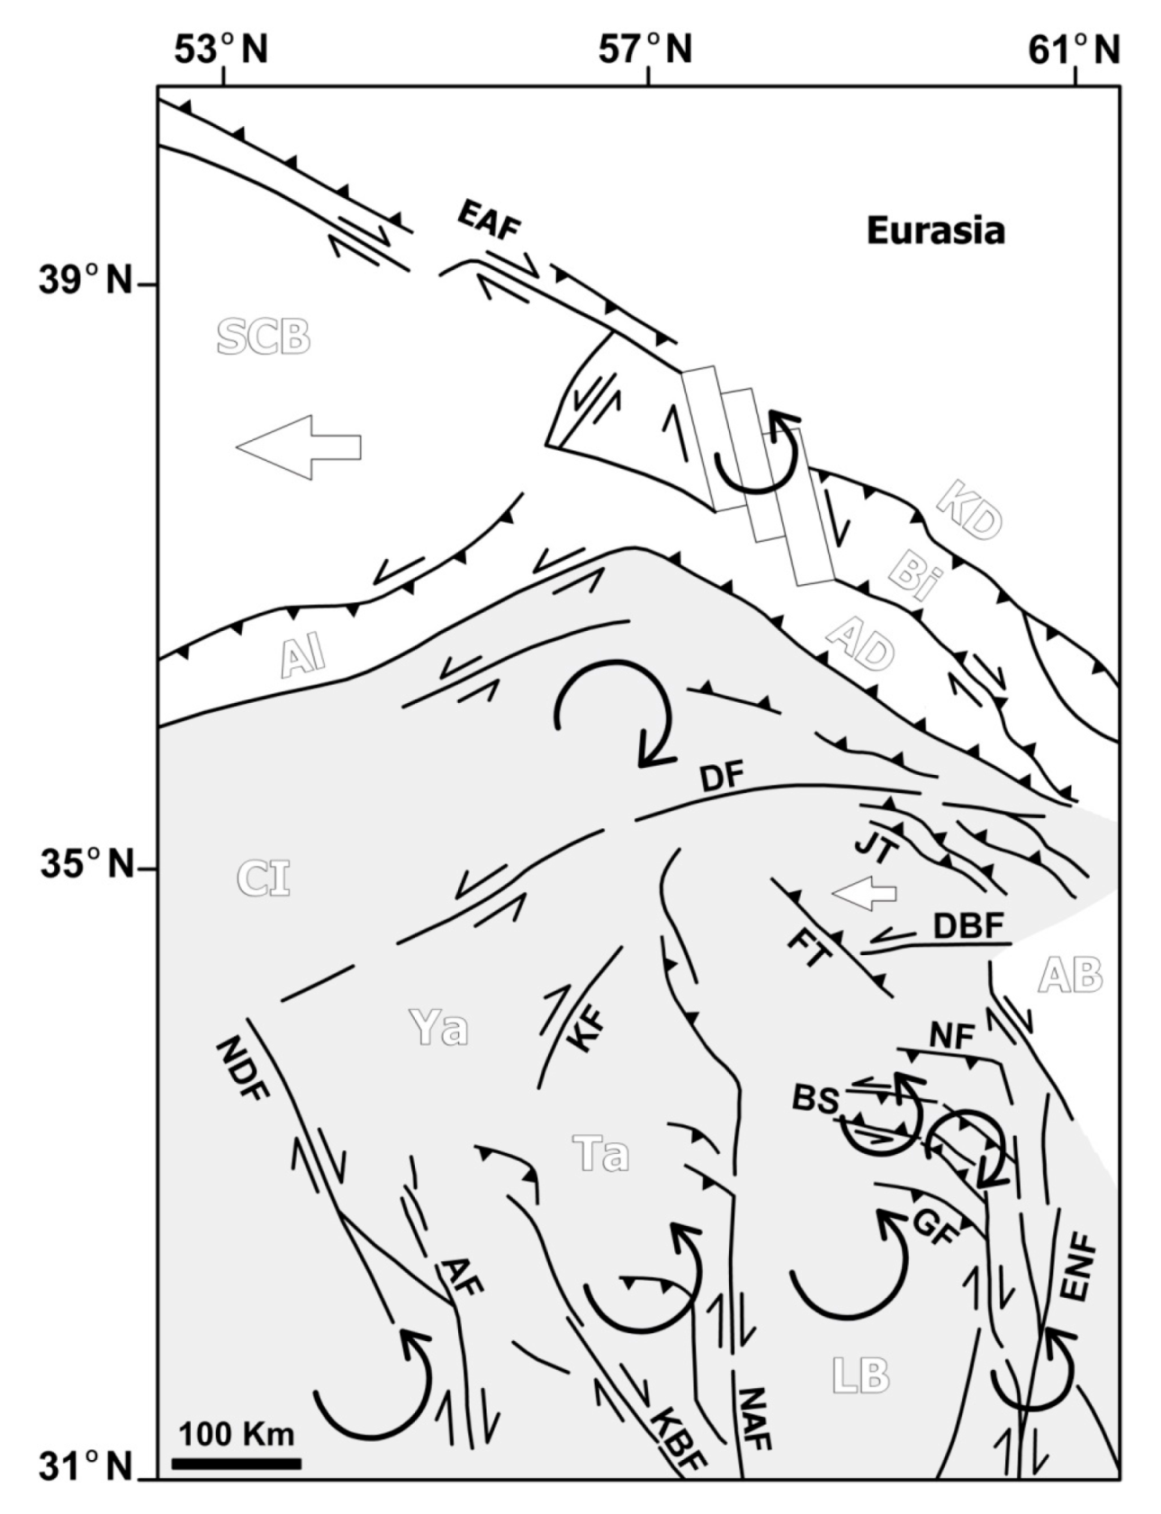
2. Tectonic Setting
3. Data and Methodology
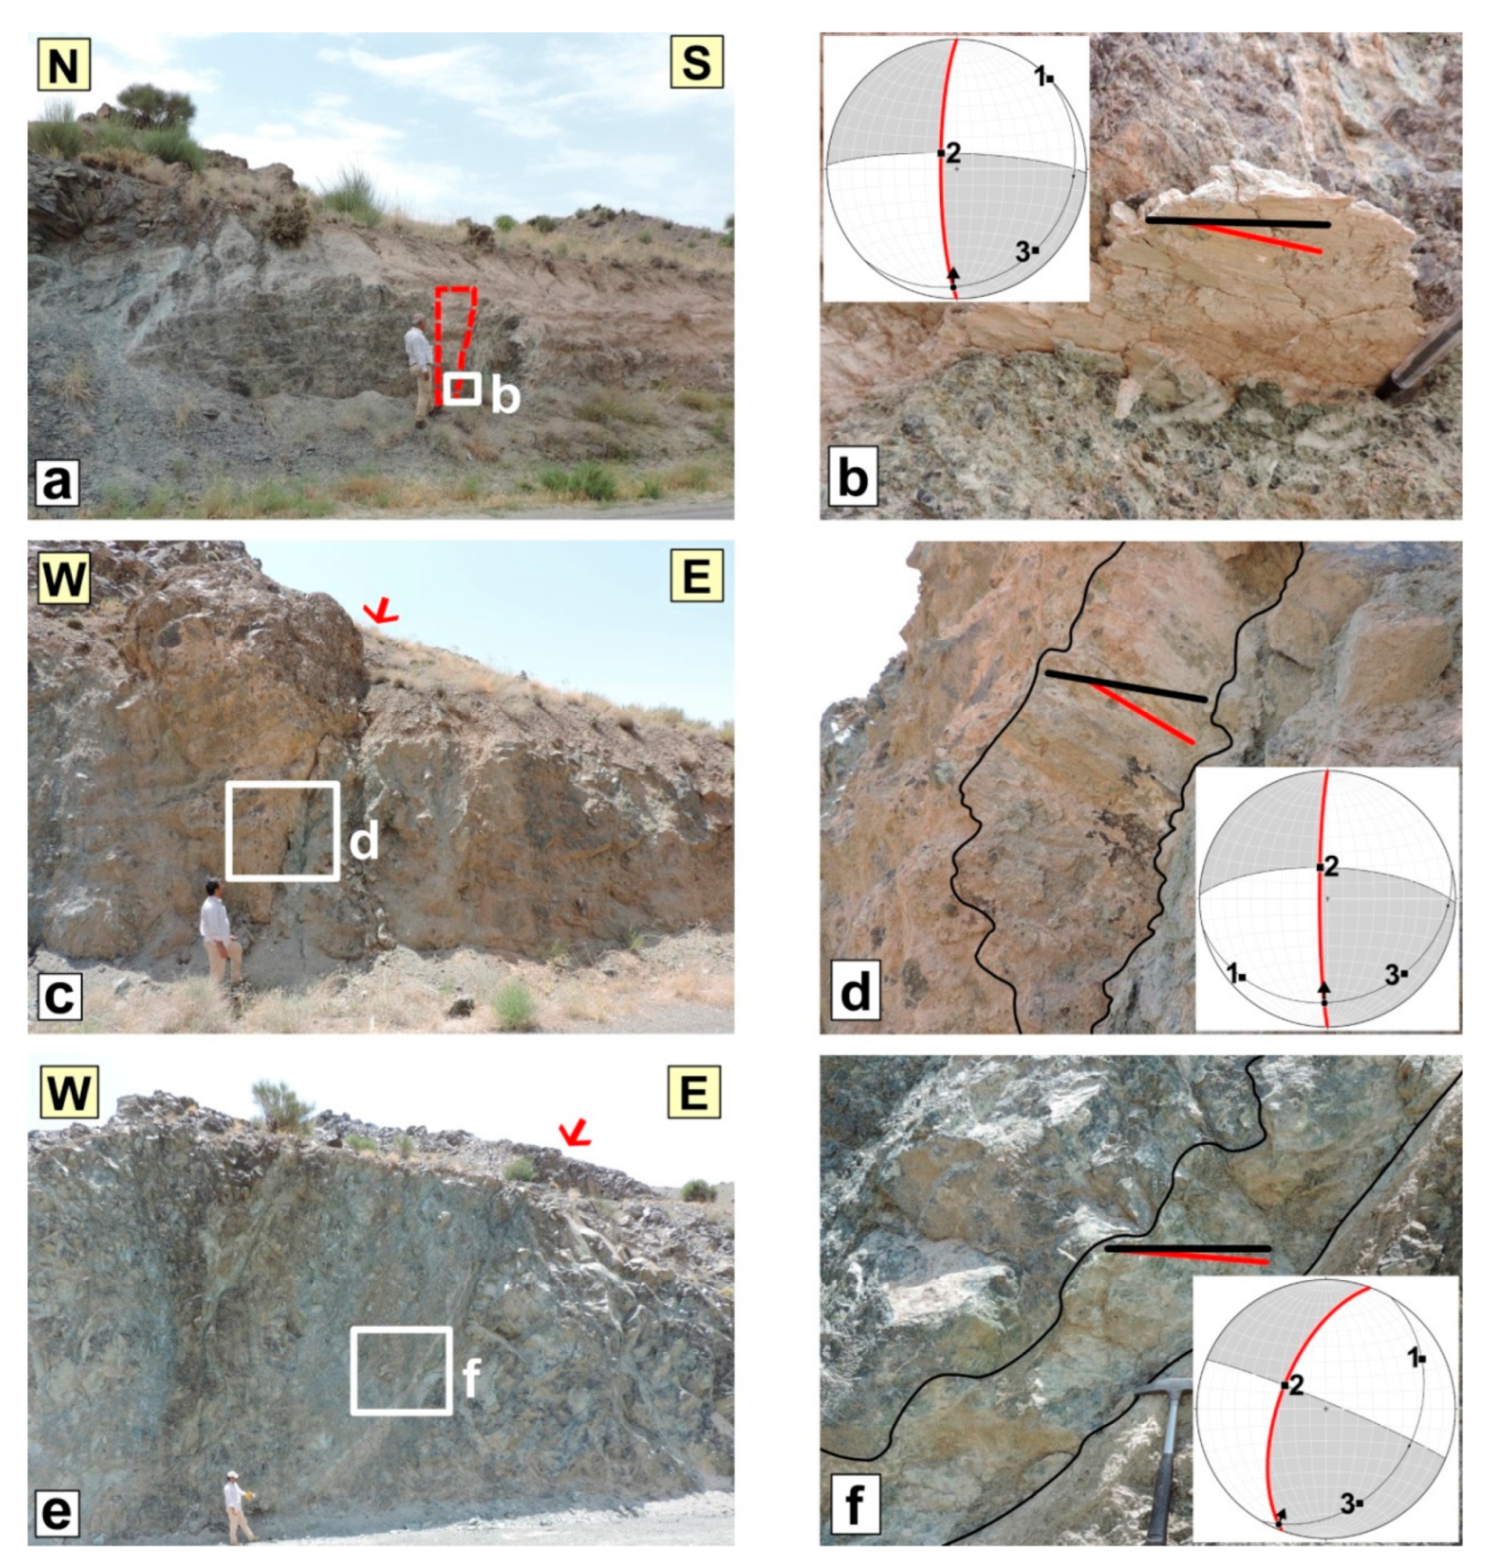
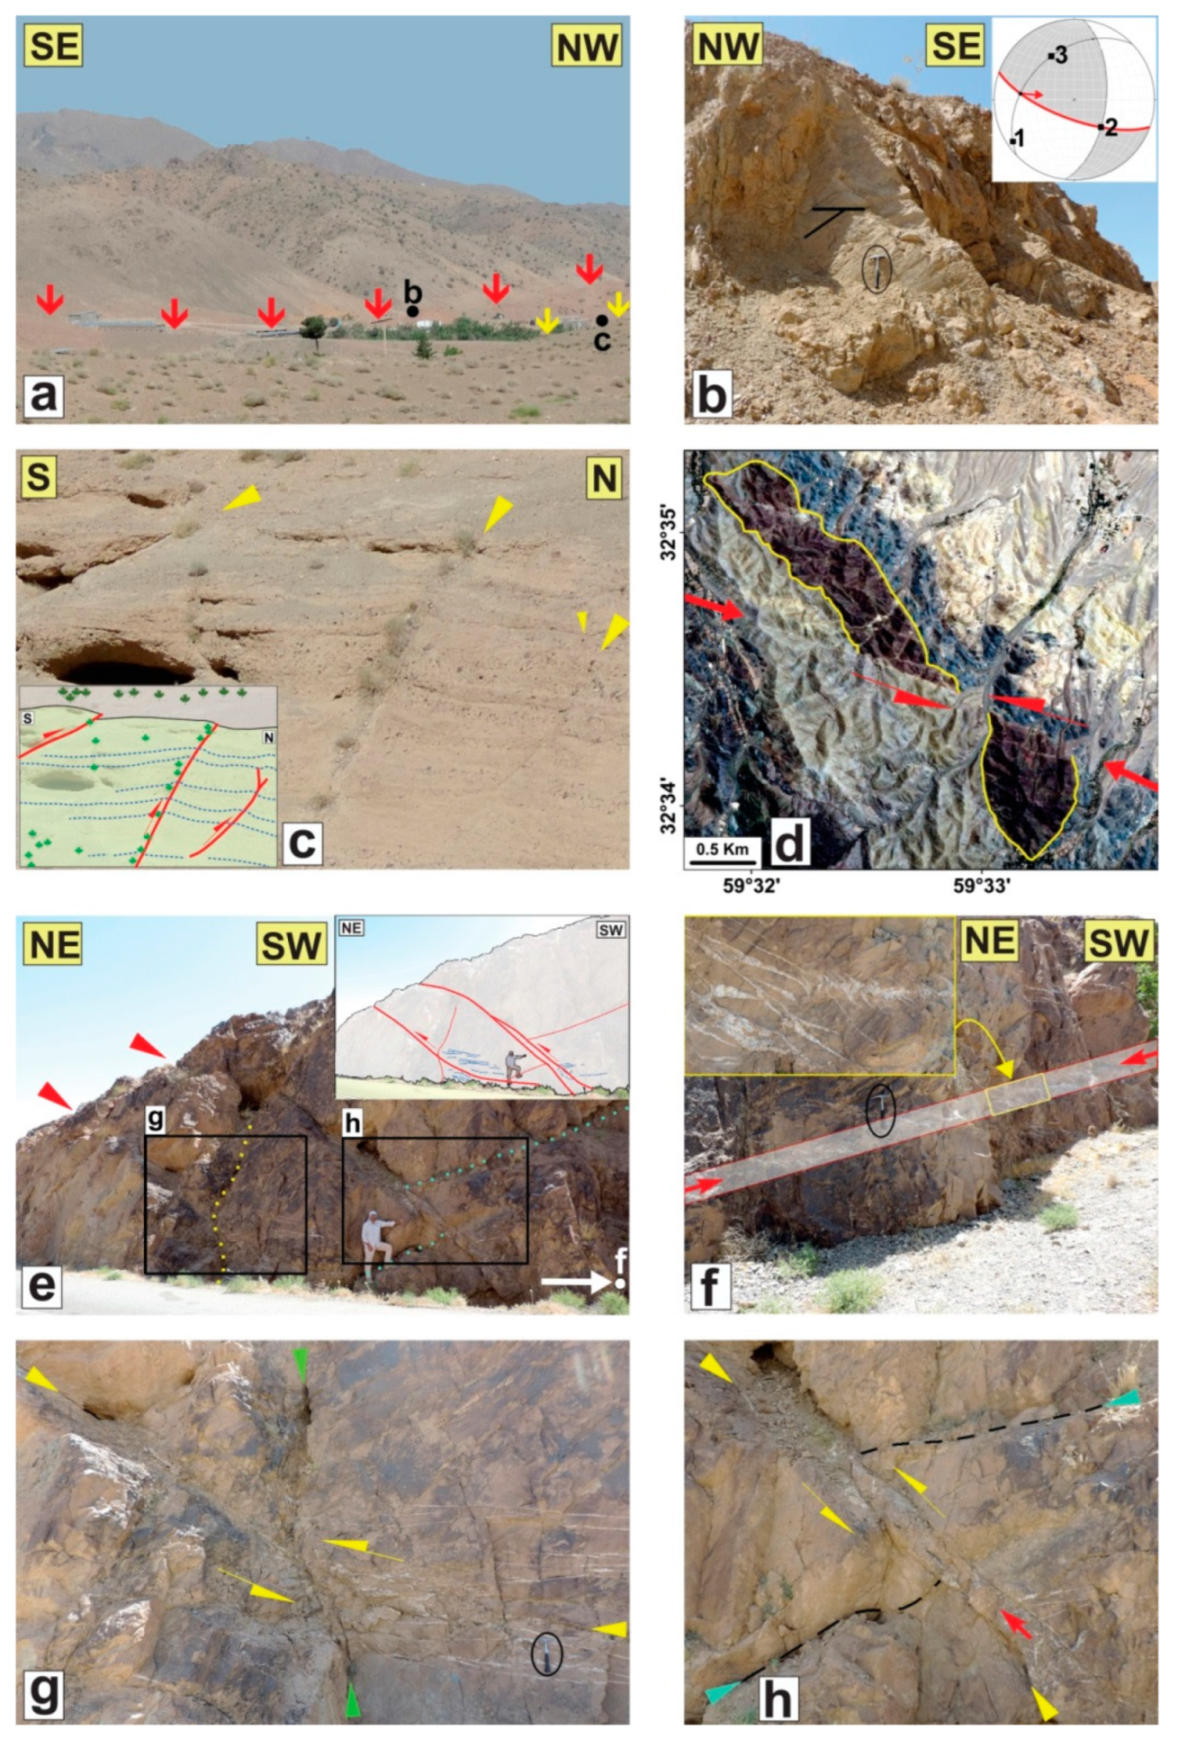
3.1. Field Studies of Faults
3.2. Geodetic Strain
Geodetic Strain Field and Rotation Rate
3.3. Satellite Images and Digital Terrain Model
4. Results on Distributed Faulting in the Area
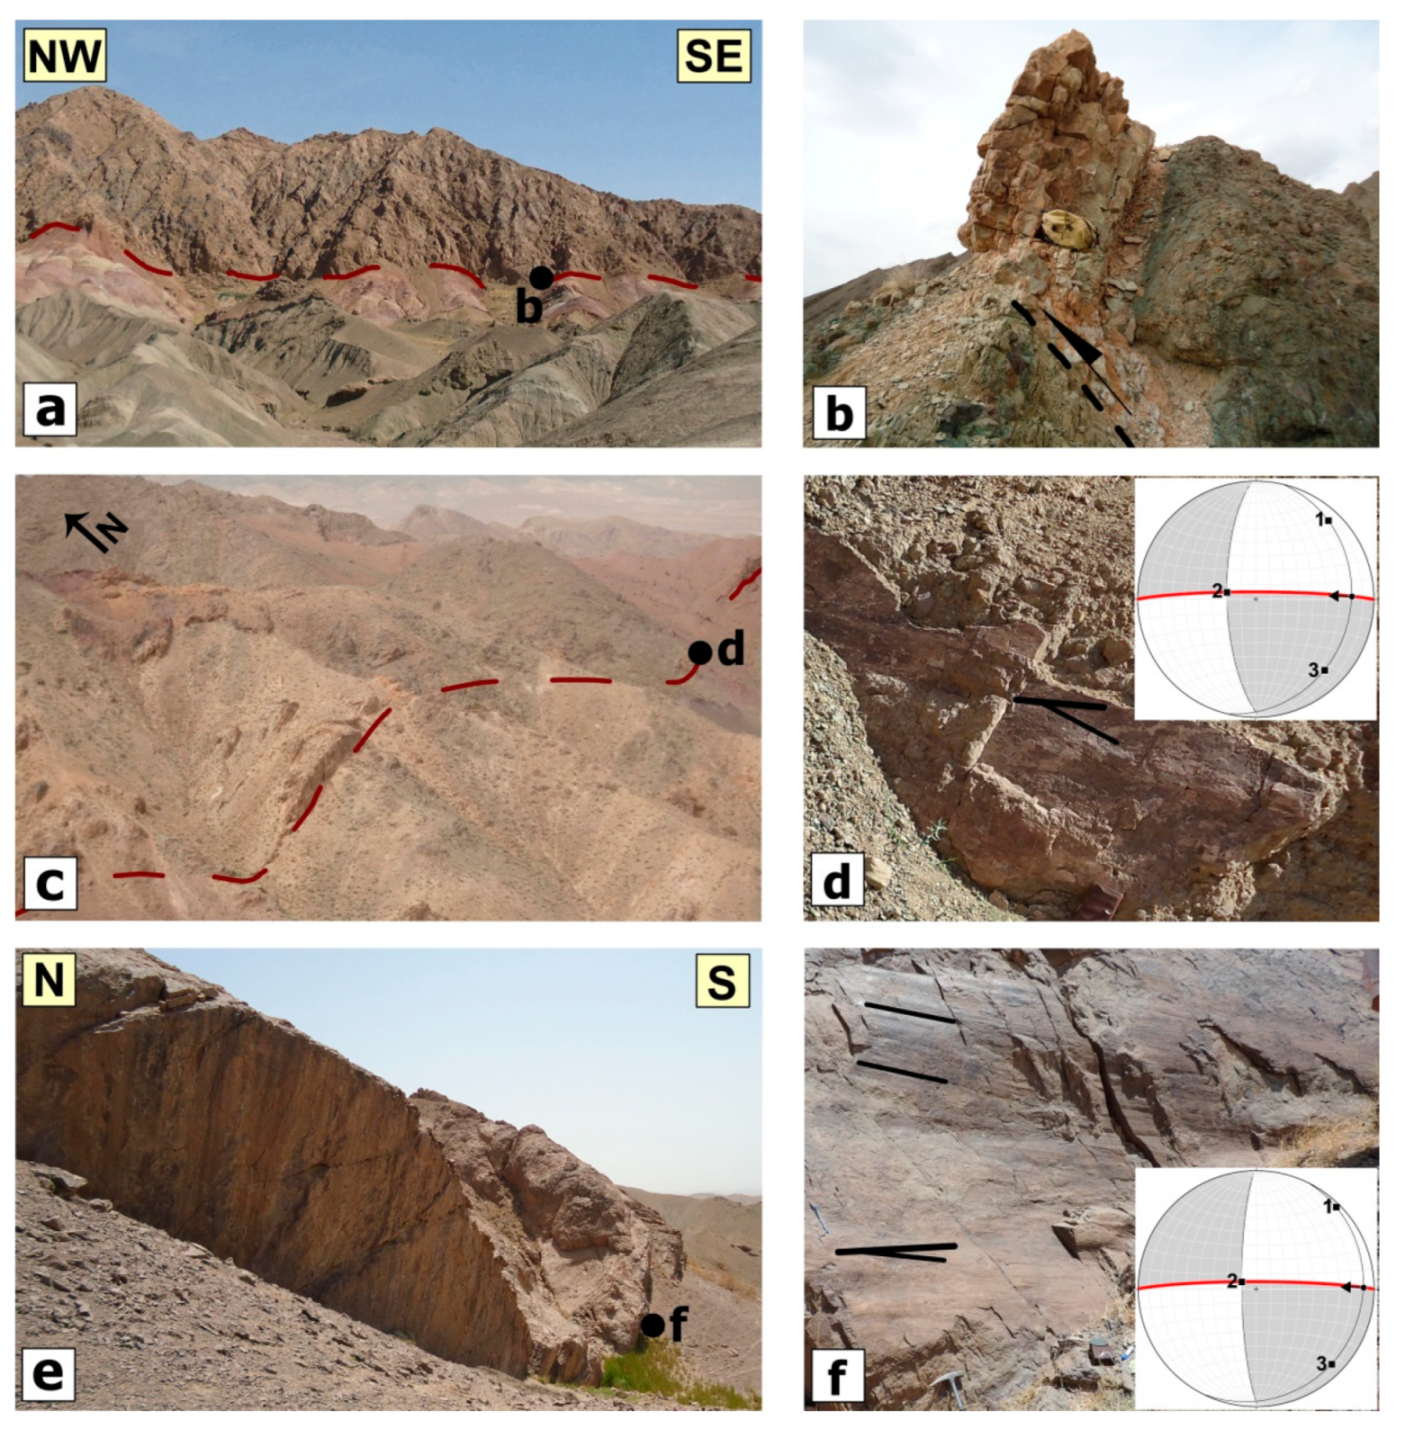
4.1. The N-S Right-Lateral Strike-Slip Faults
4.2. The NW-SE Oblique and the E-W Left-Lateral Strike-Slip Faults
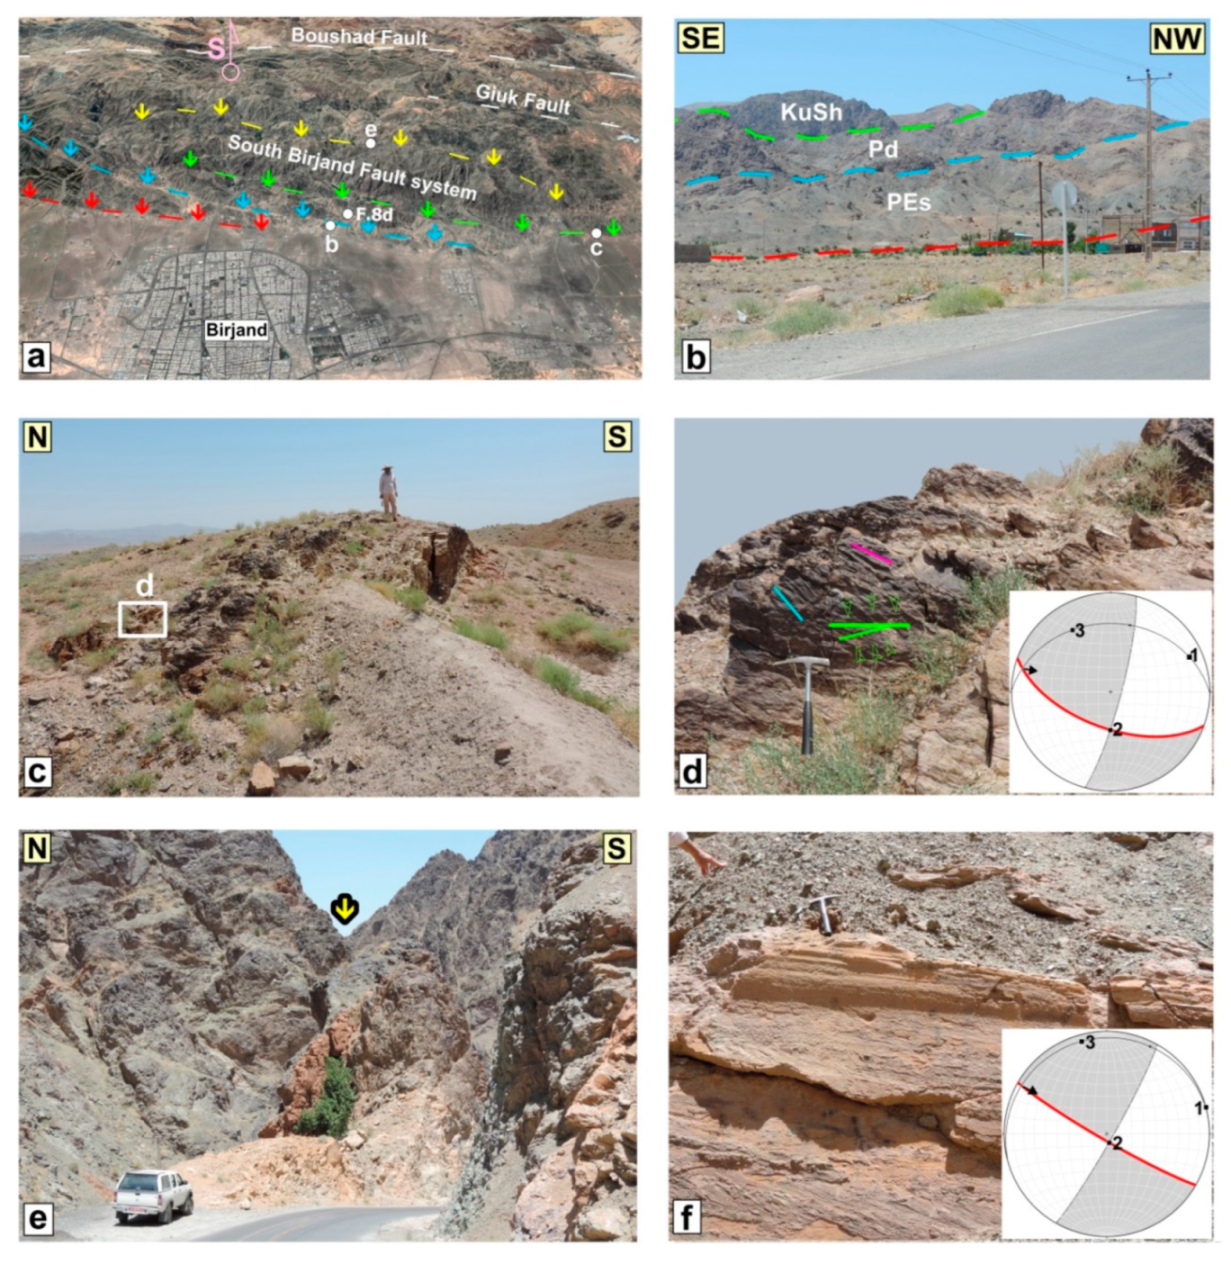
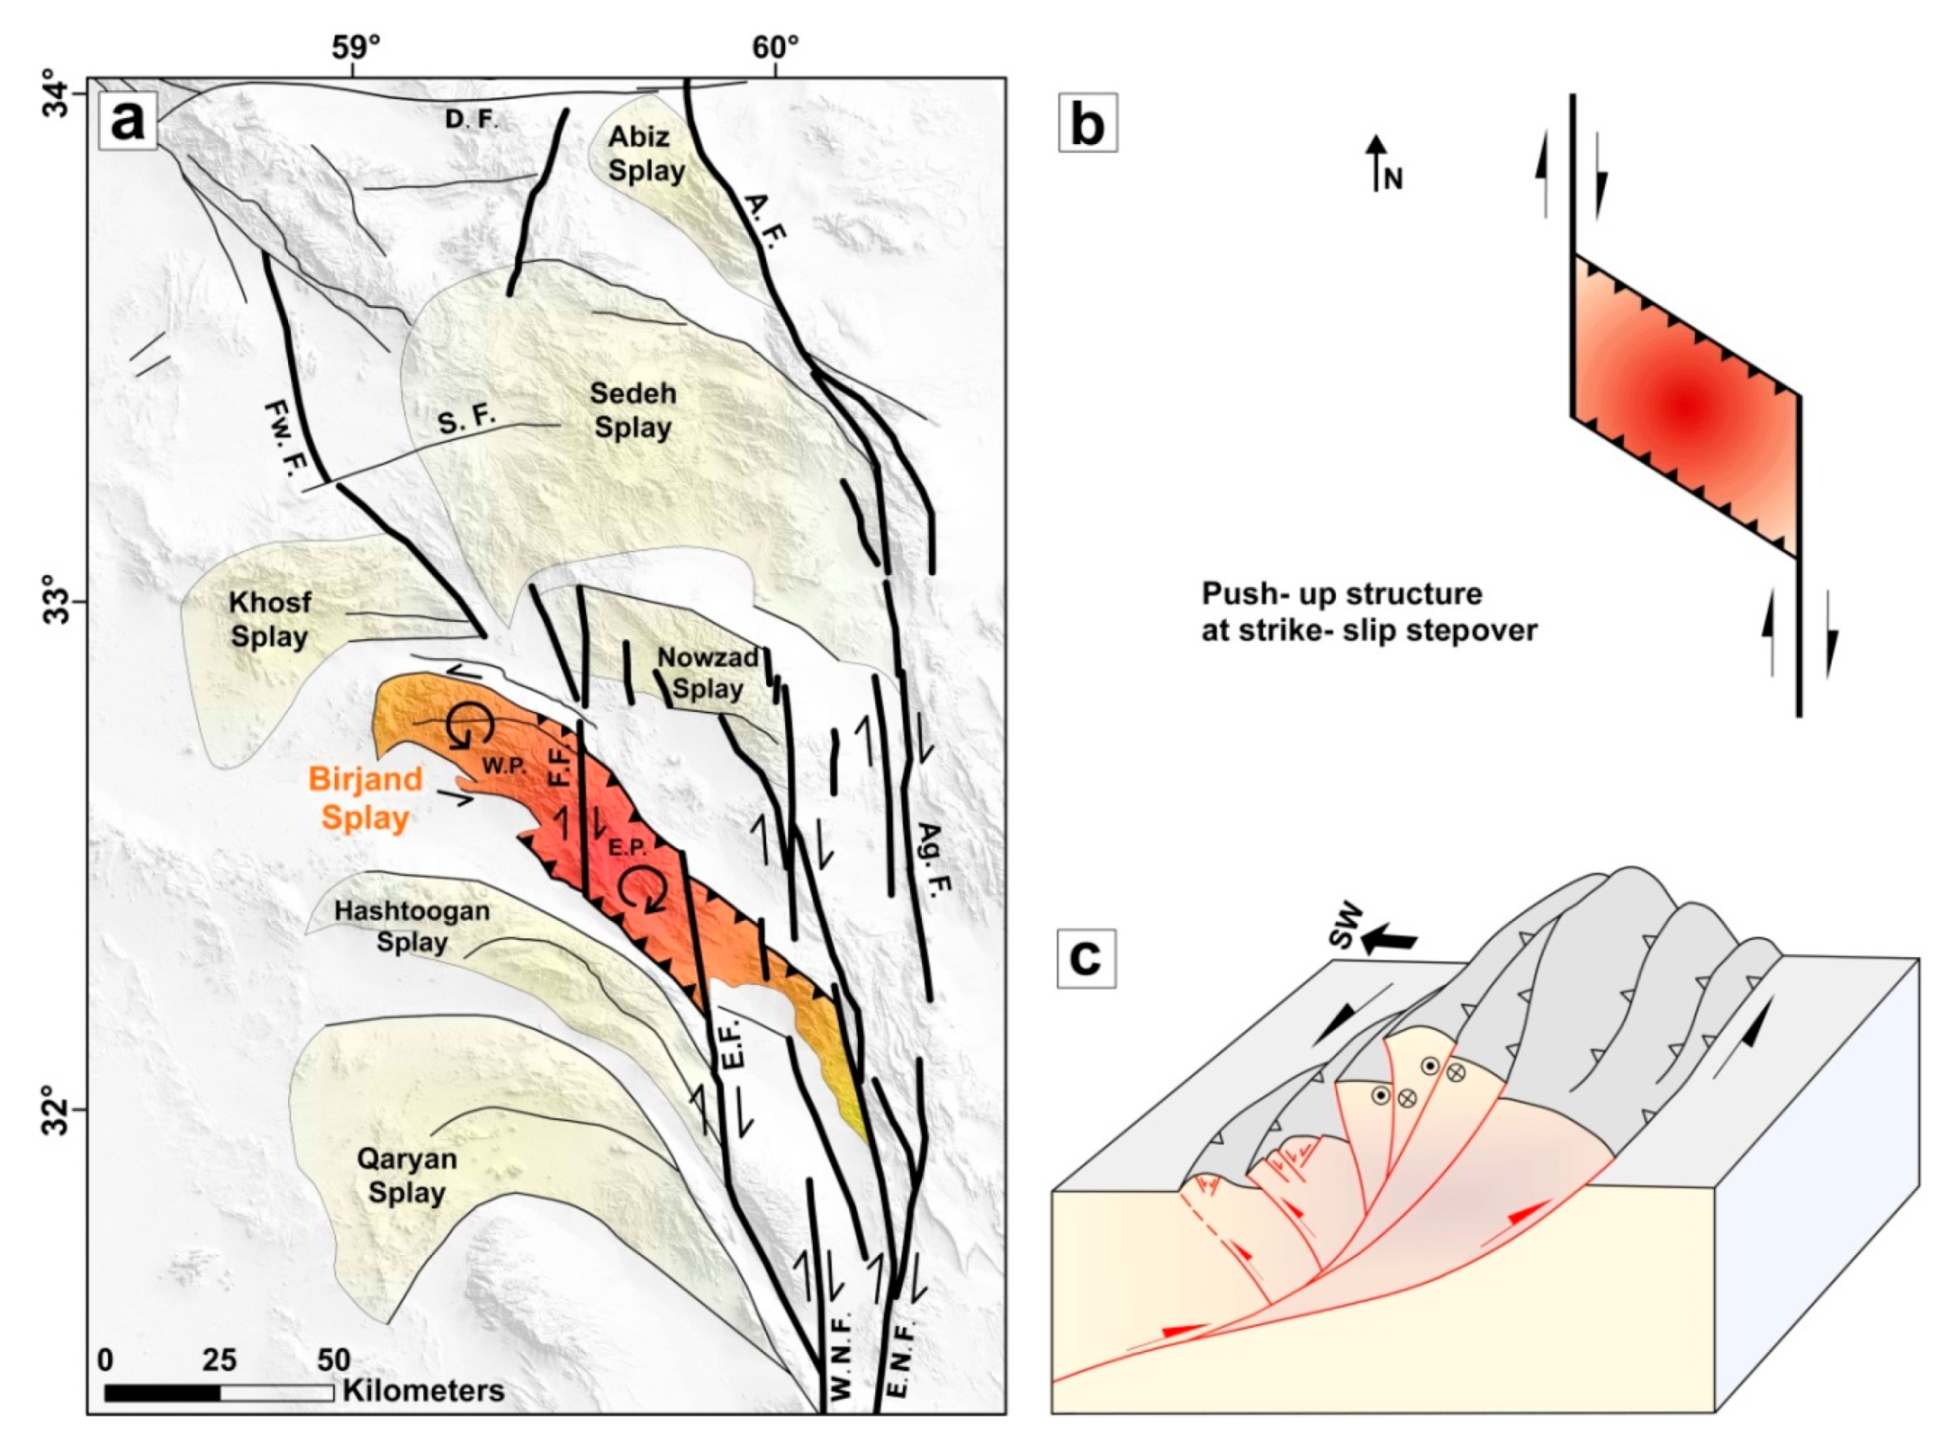
4.2.1. South Birjand Fault
4.2.2. Giuk Fault
4.2.3. Boushad Fault
4.2.4. Kakhki Fault
4.2.5. Chenesht Fault
4.2.6. Gol Fault
4.2.7. Nasrabad (or Mokhtaran) Fault
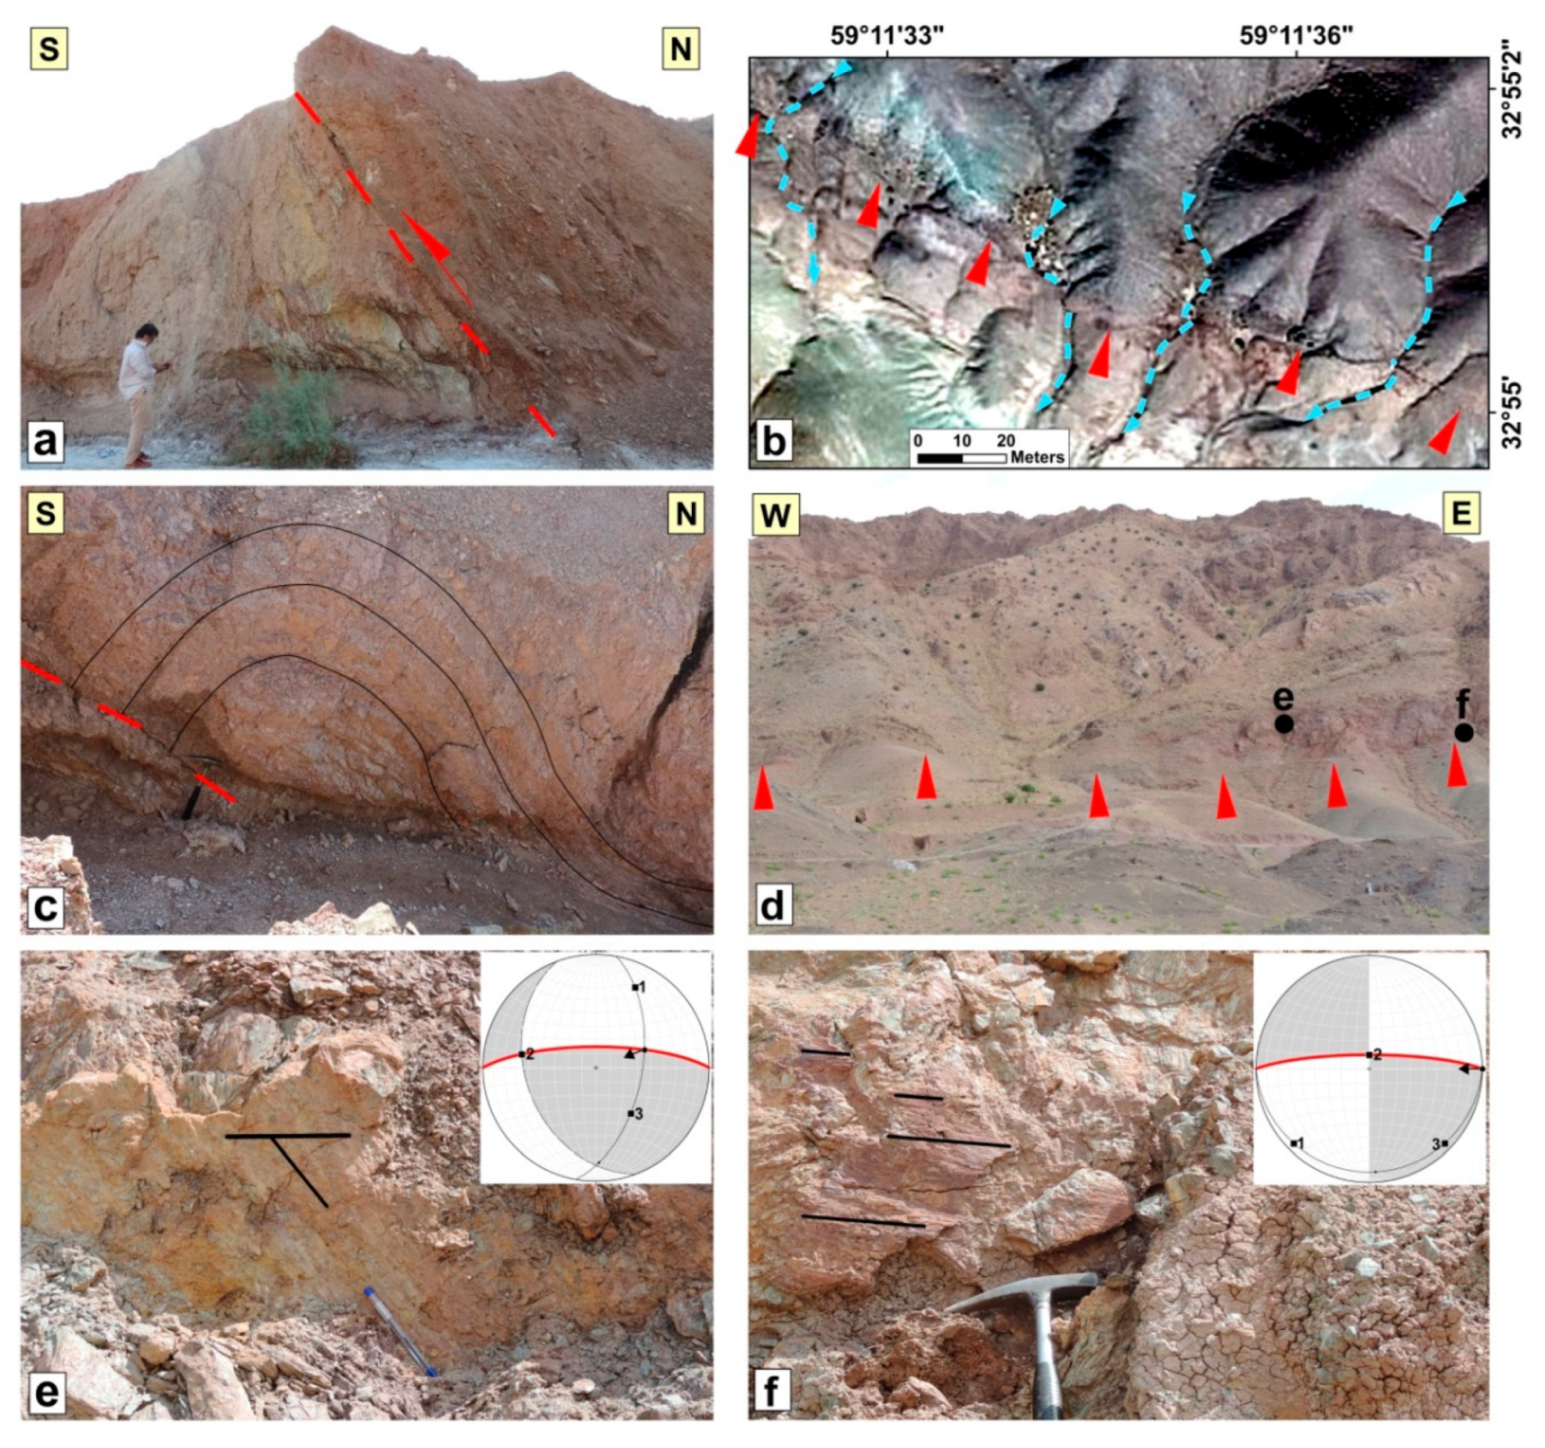
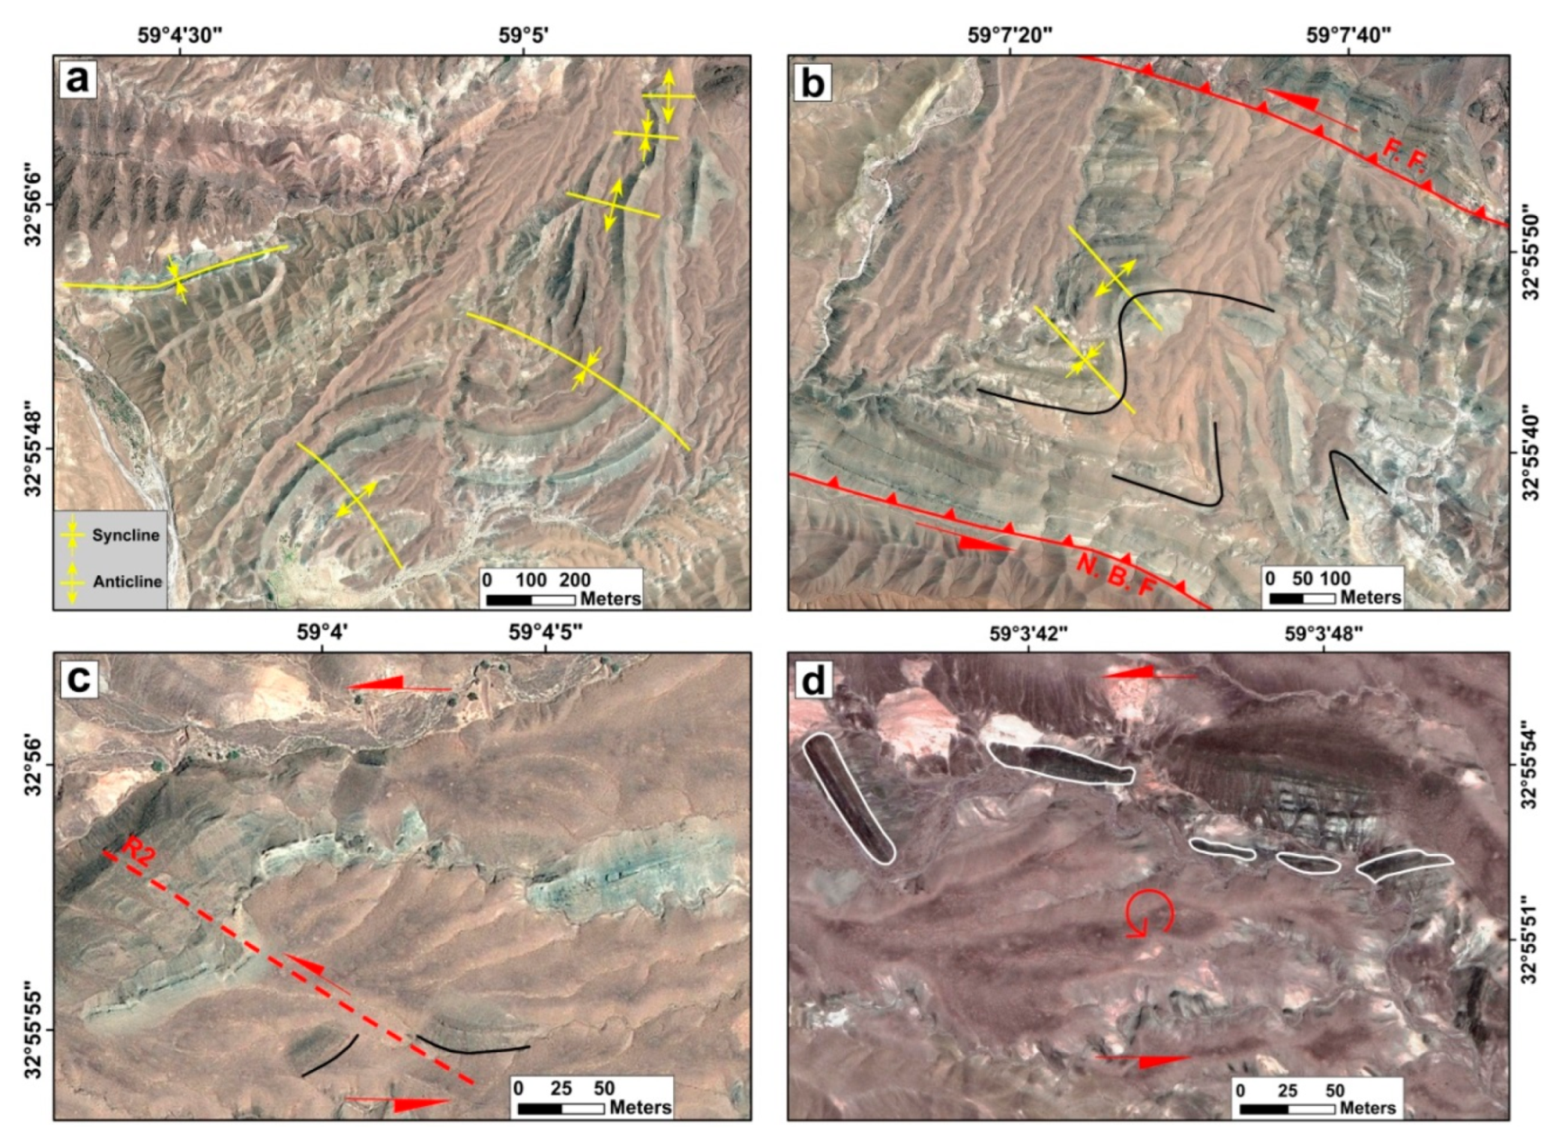
5. Results on Distributed Faulting on the Shekarab Range
5.1. North Birjand Fault
5.2. Shekarab Fault
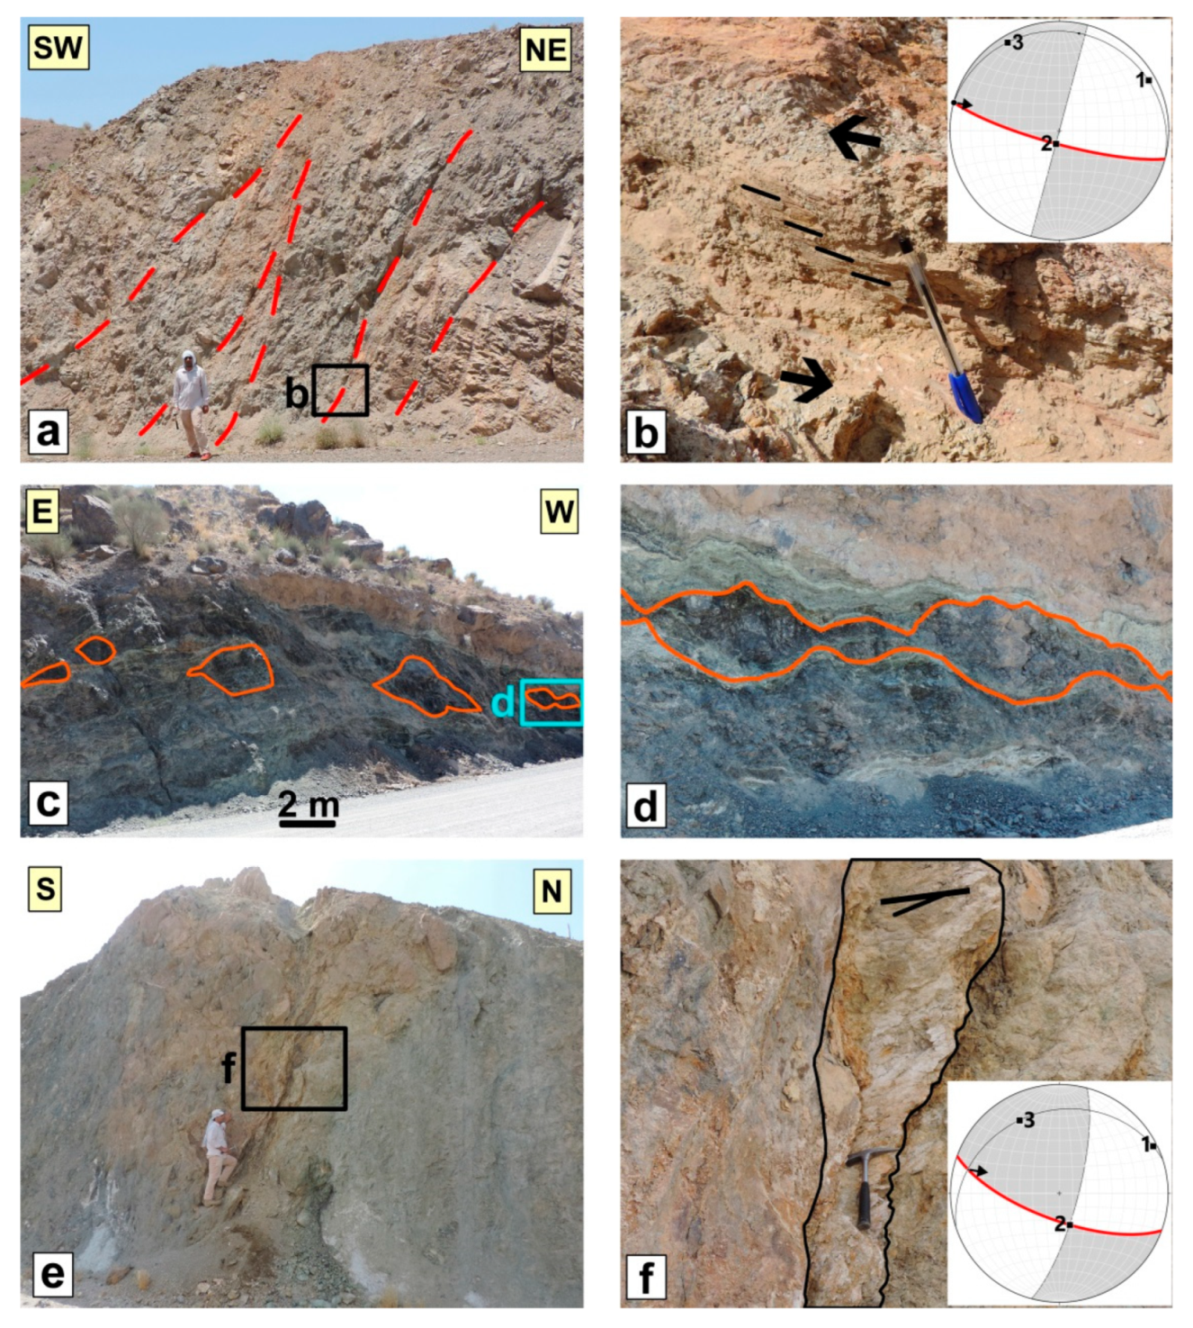
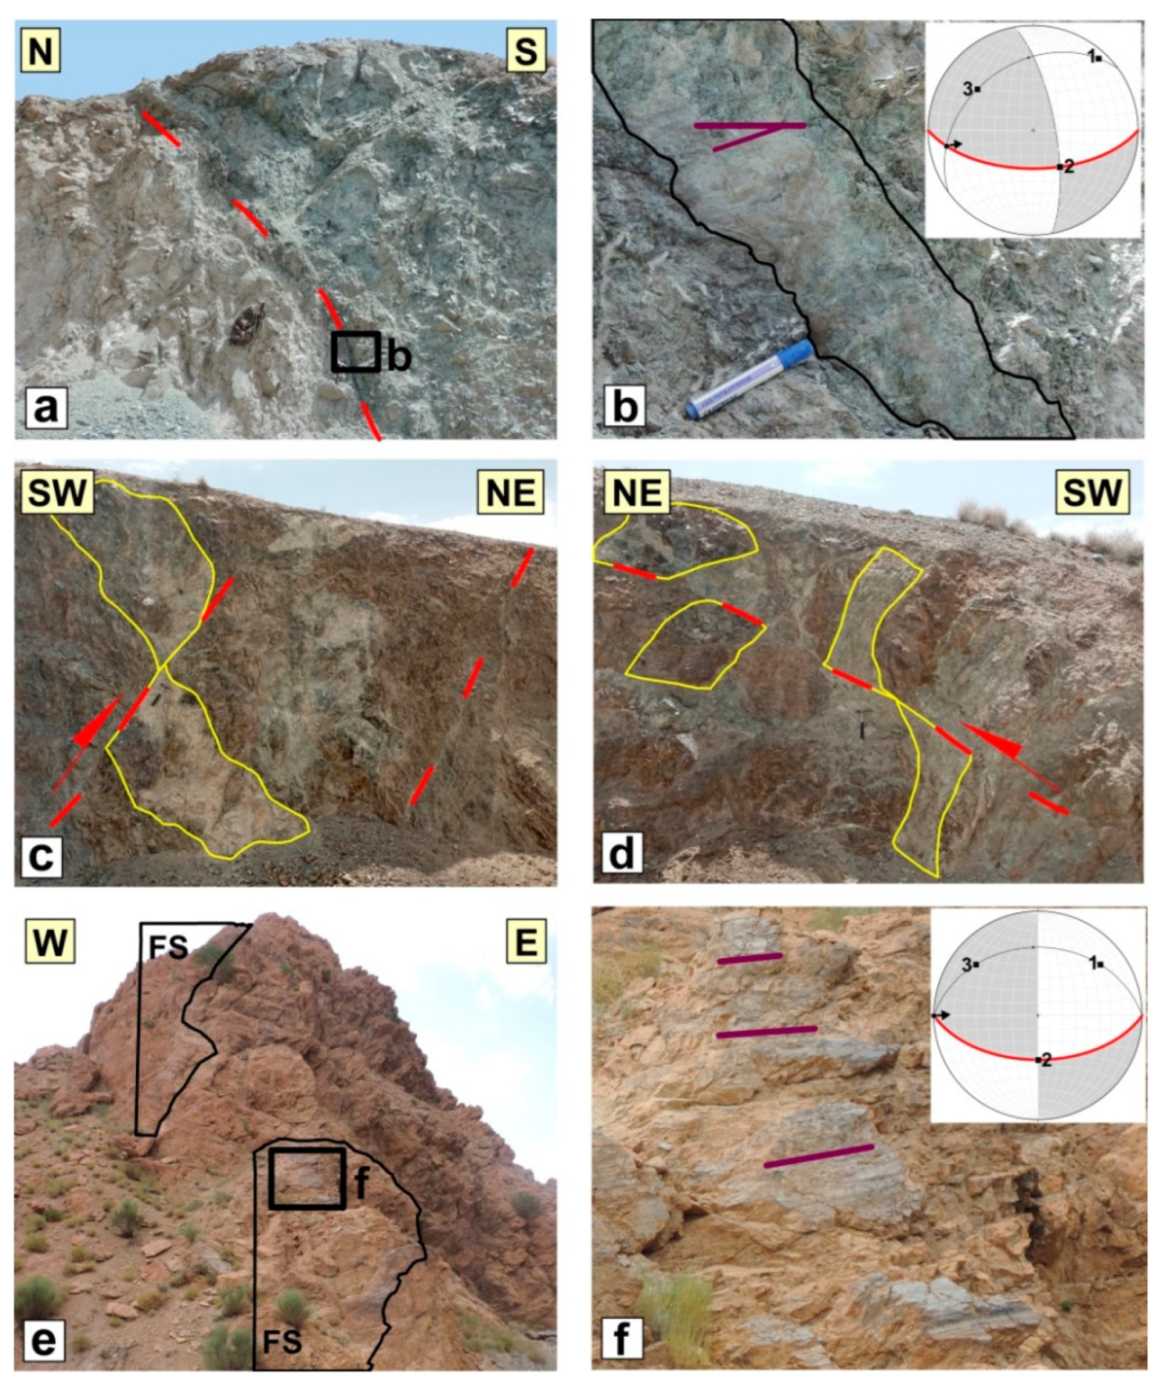
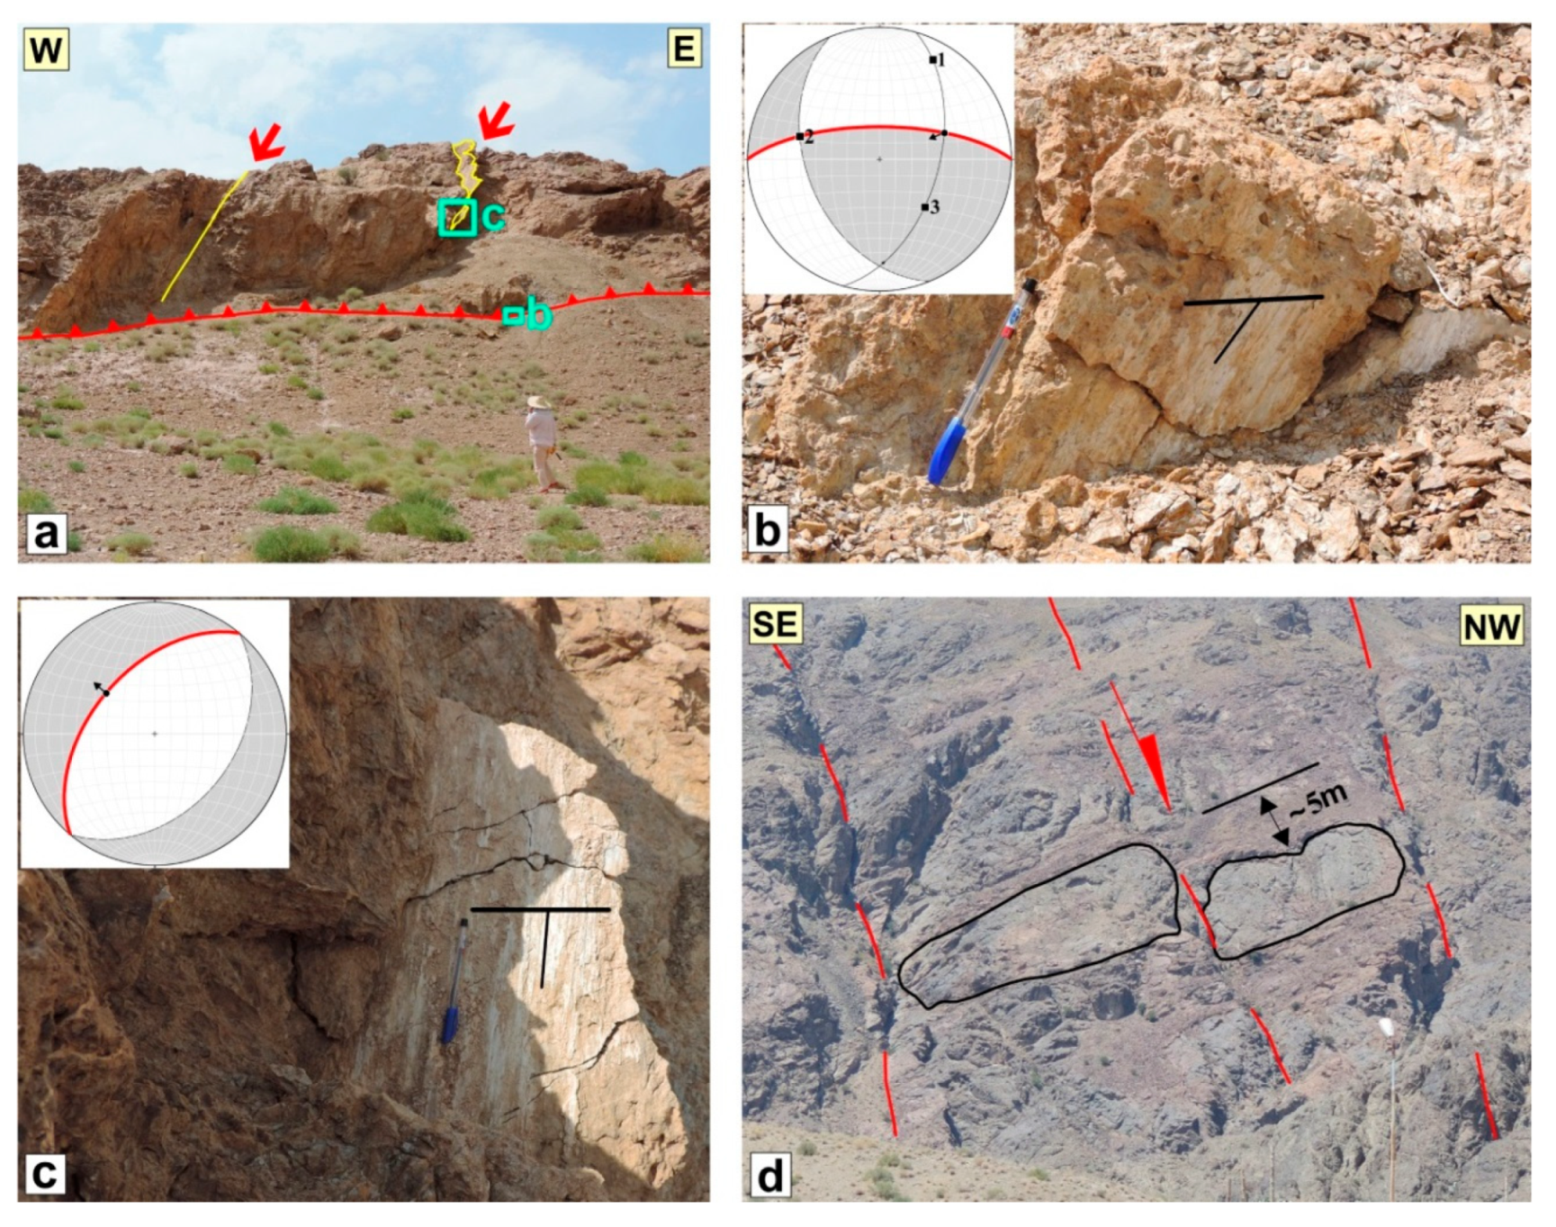
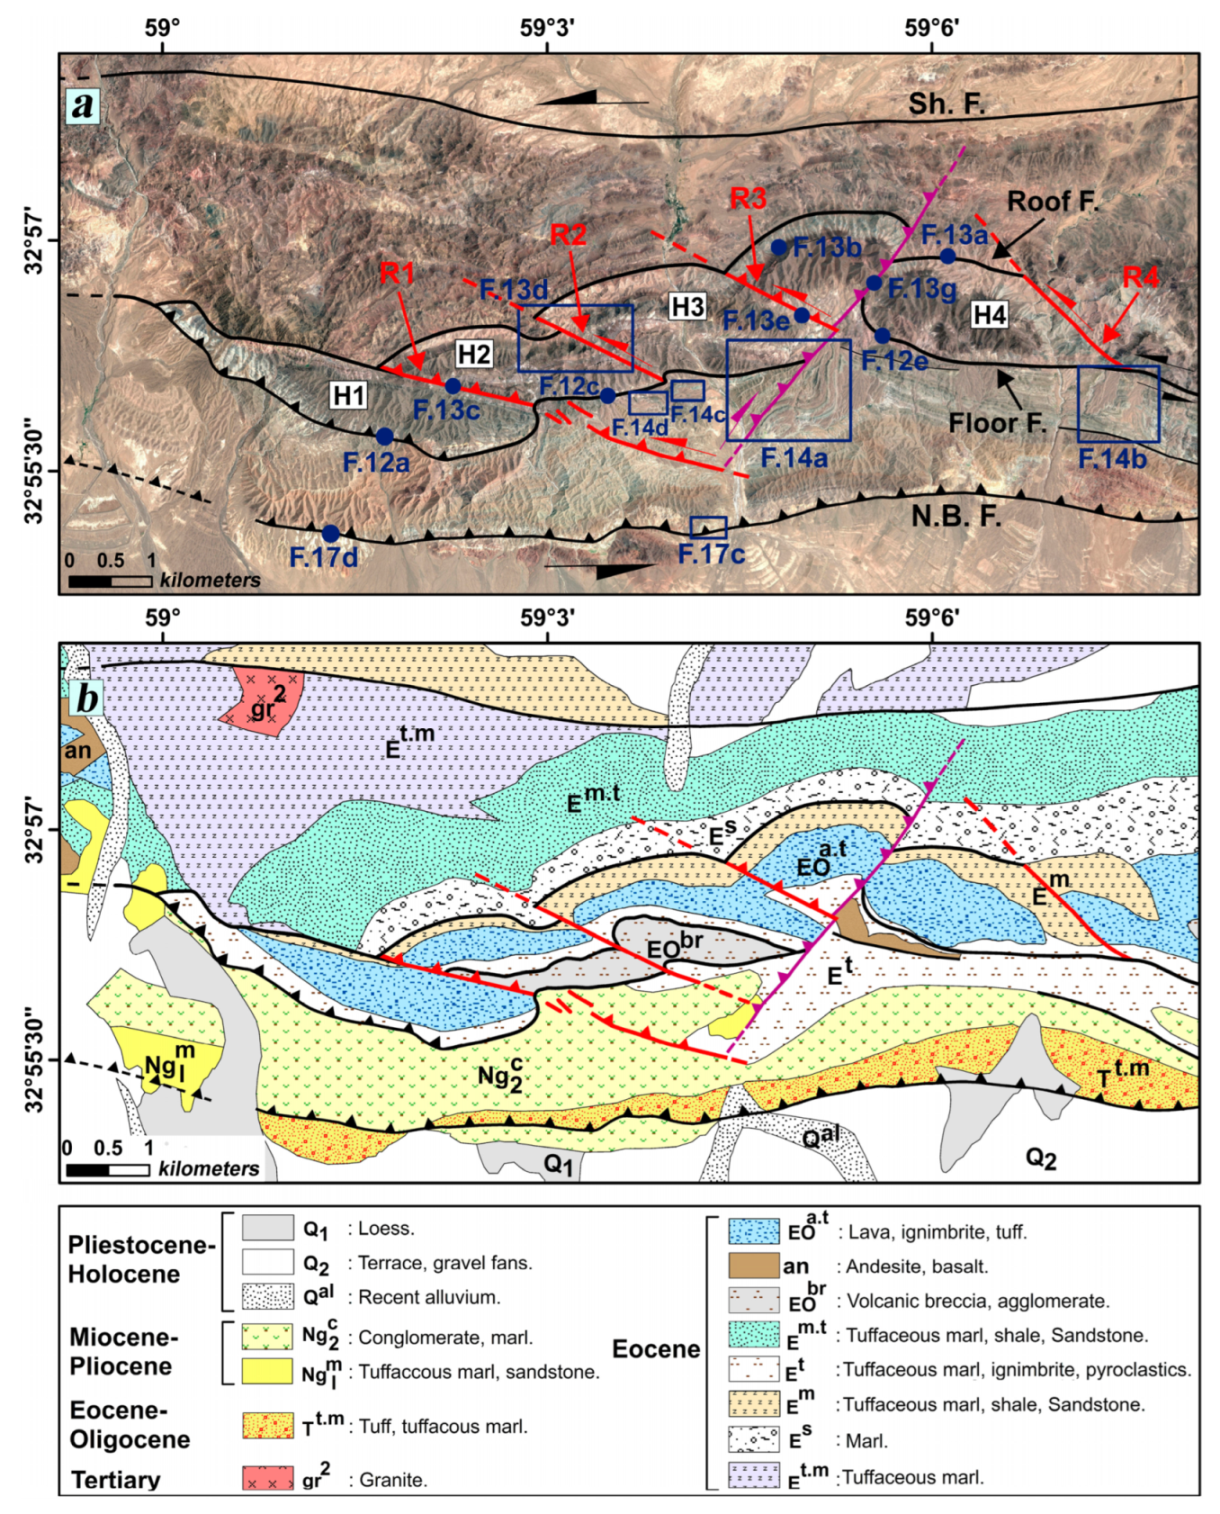
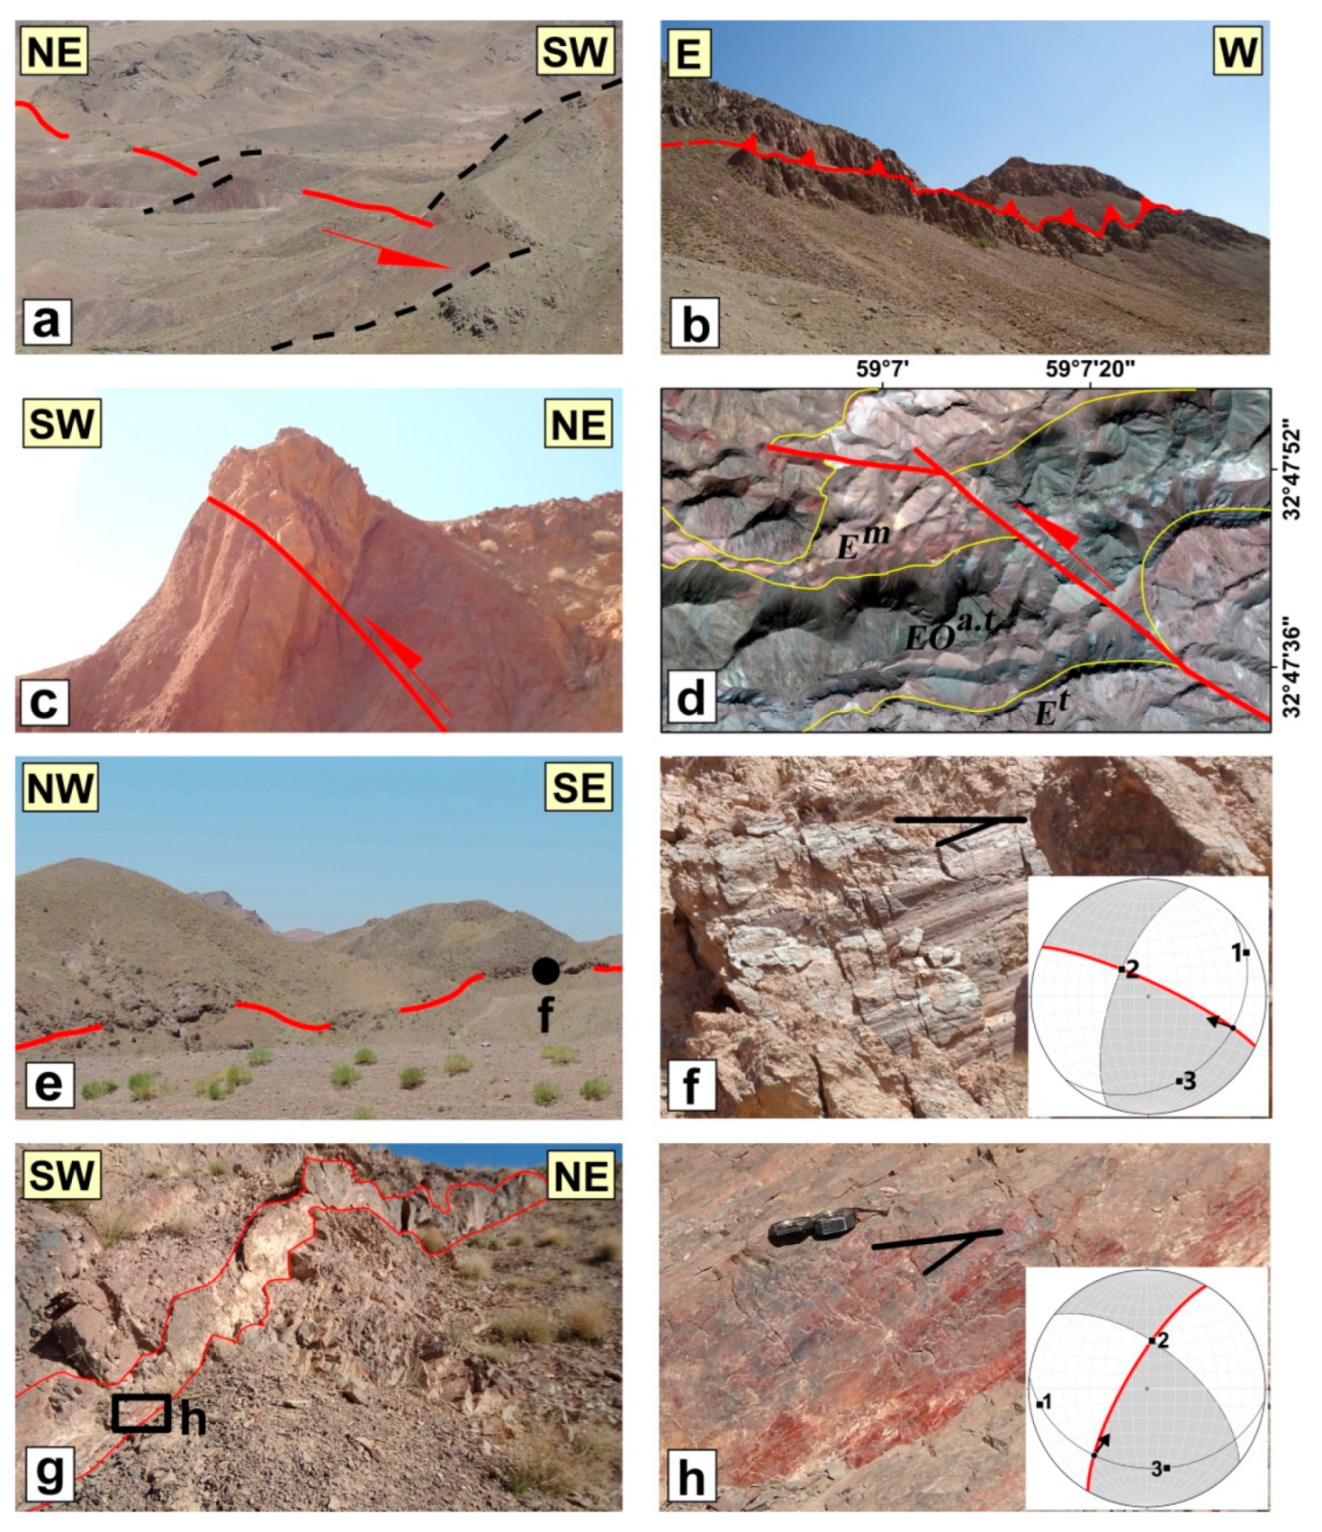
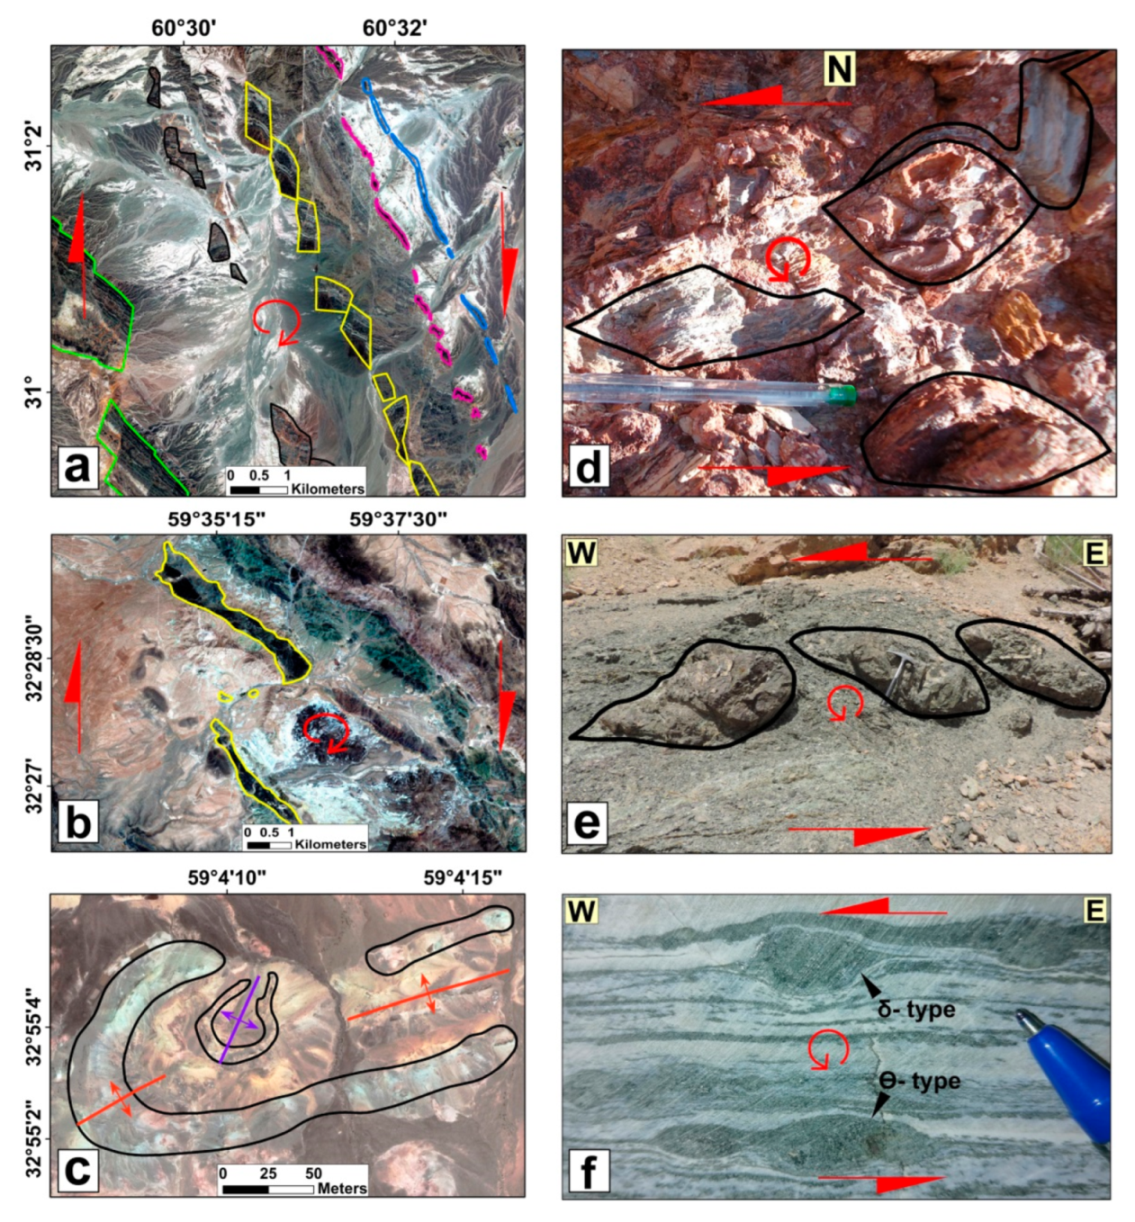
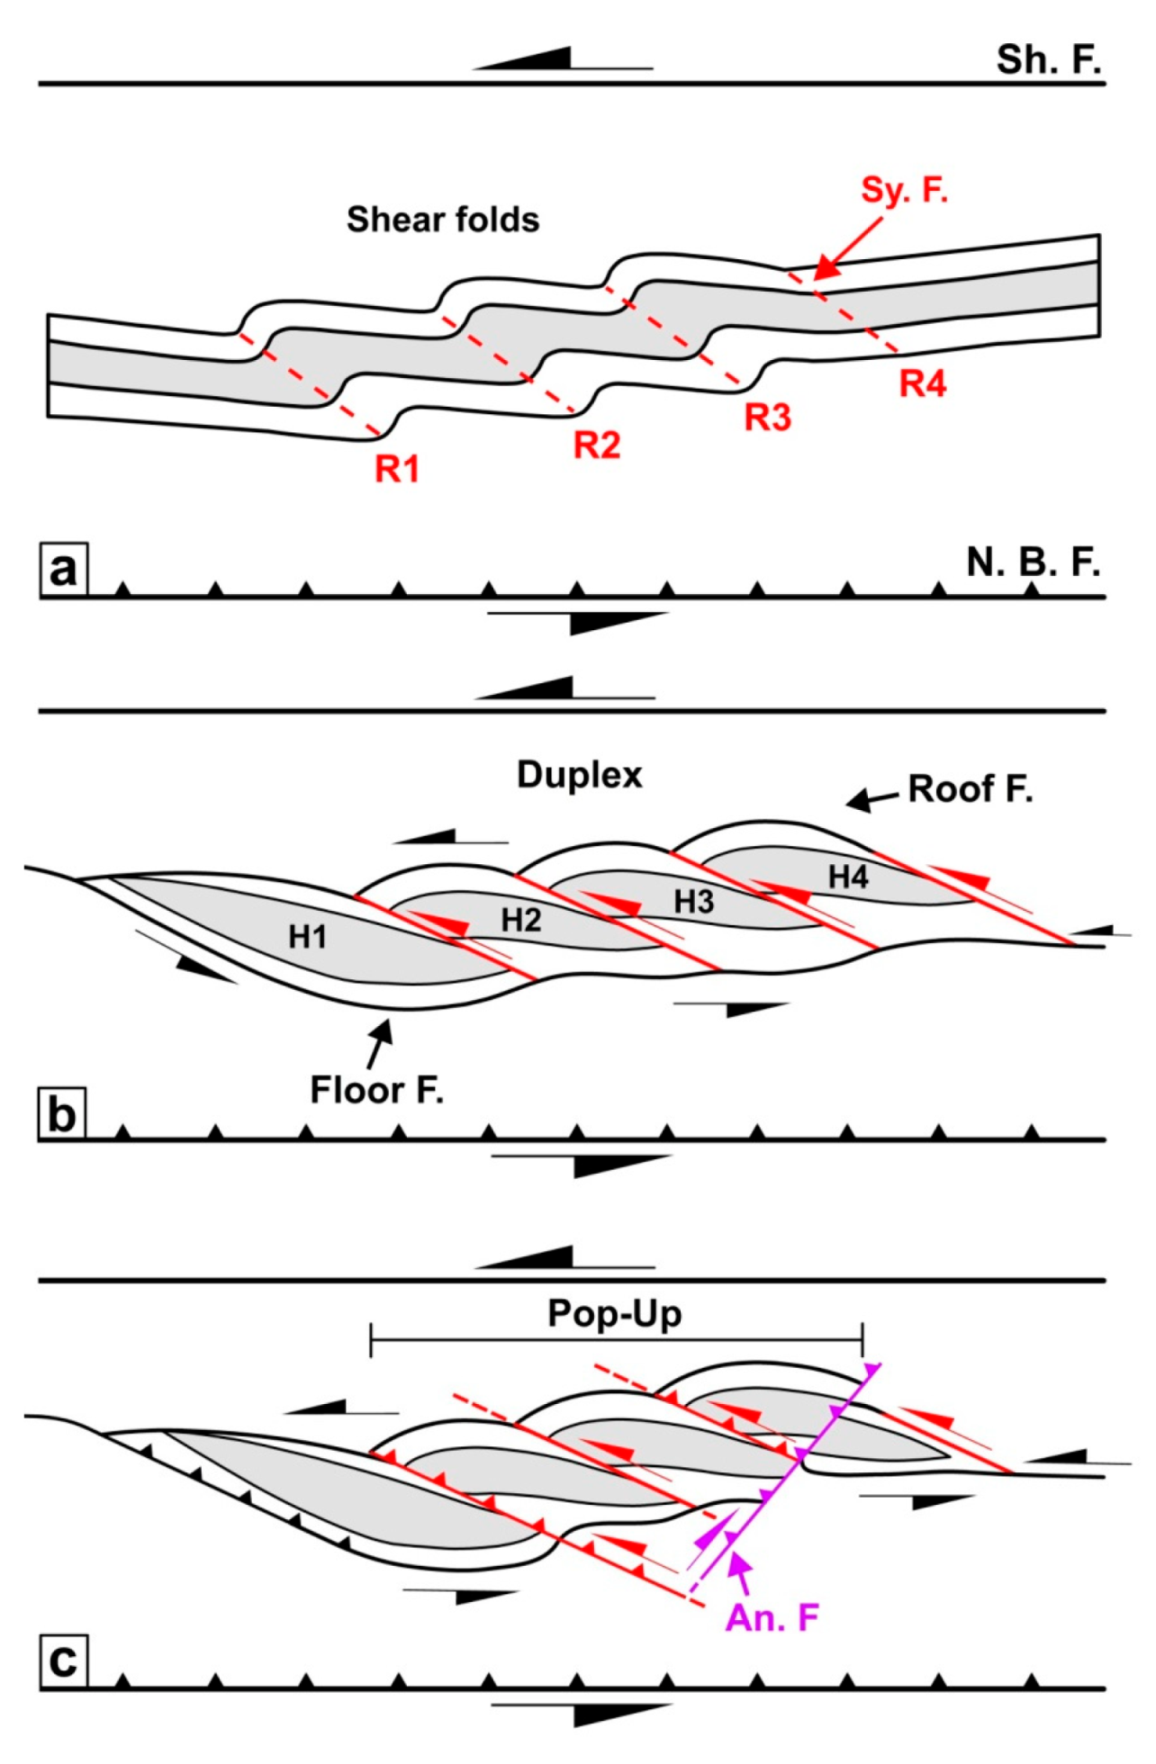
5.3. The Shekarab Transpressional Zone
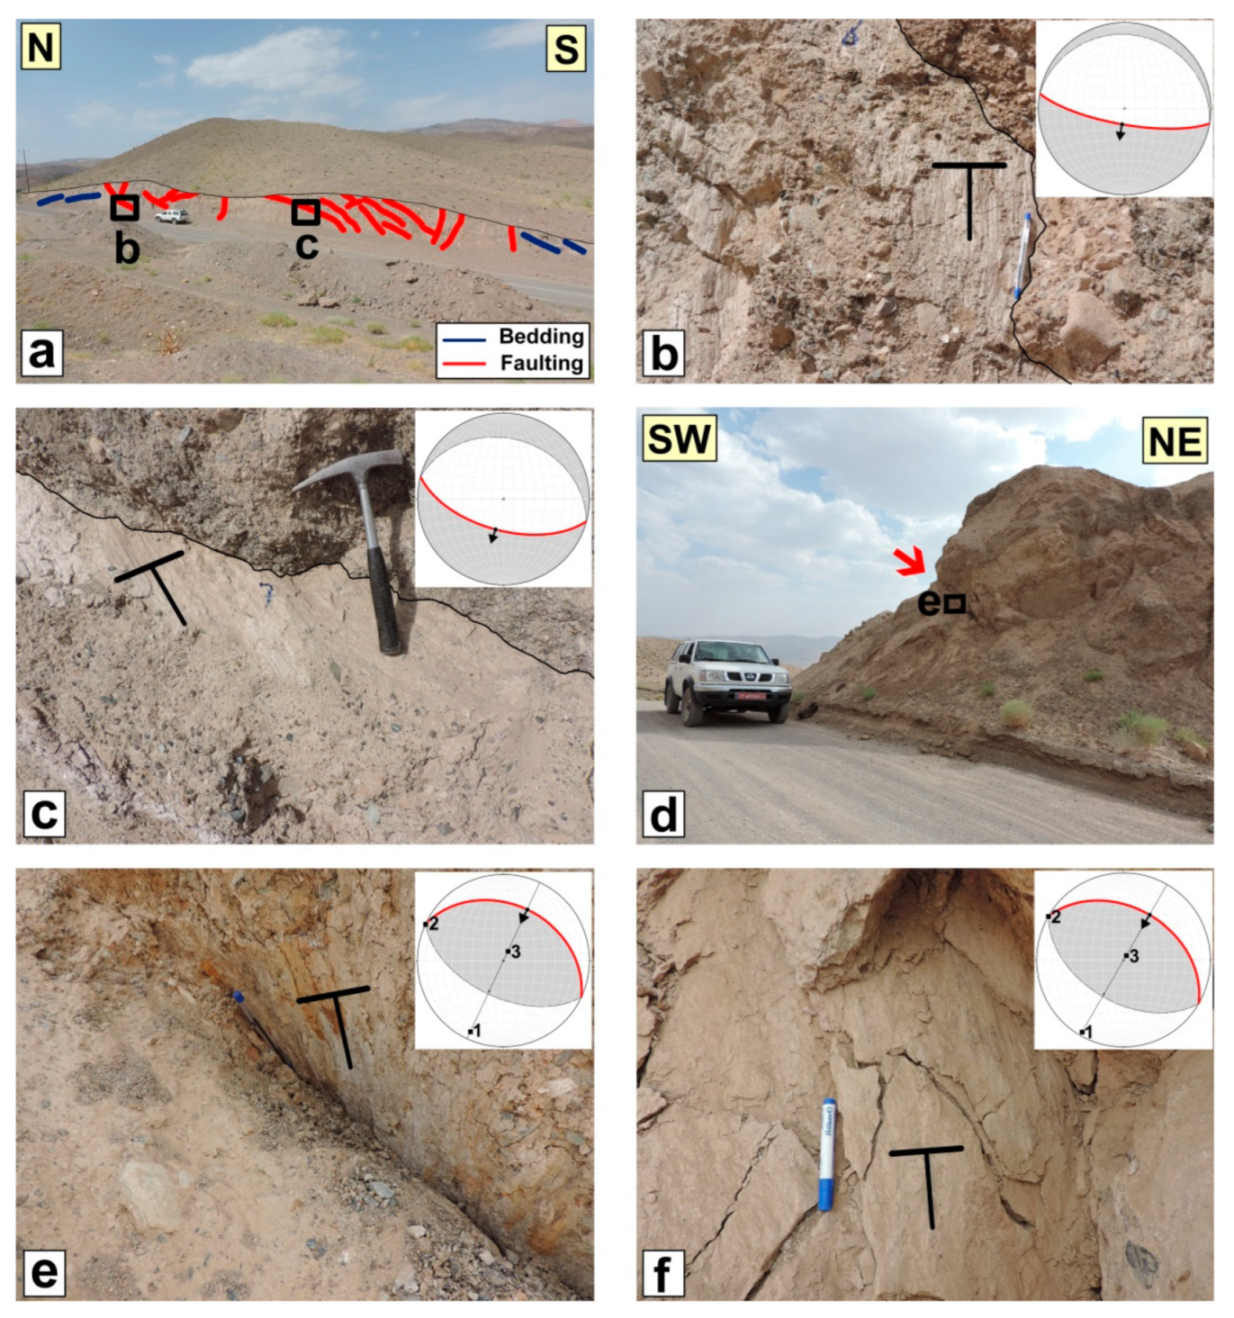
5.3.1. The Floor and Roof faults
5.3.2. The Ramps of Duplex
5.3.3. The Antithetic Faults
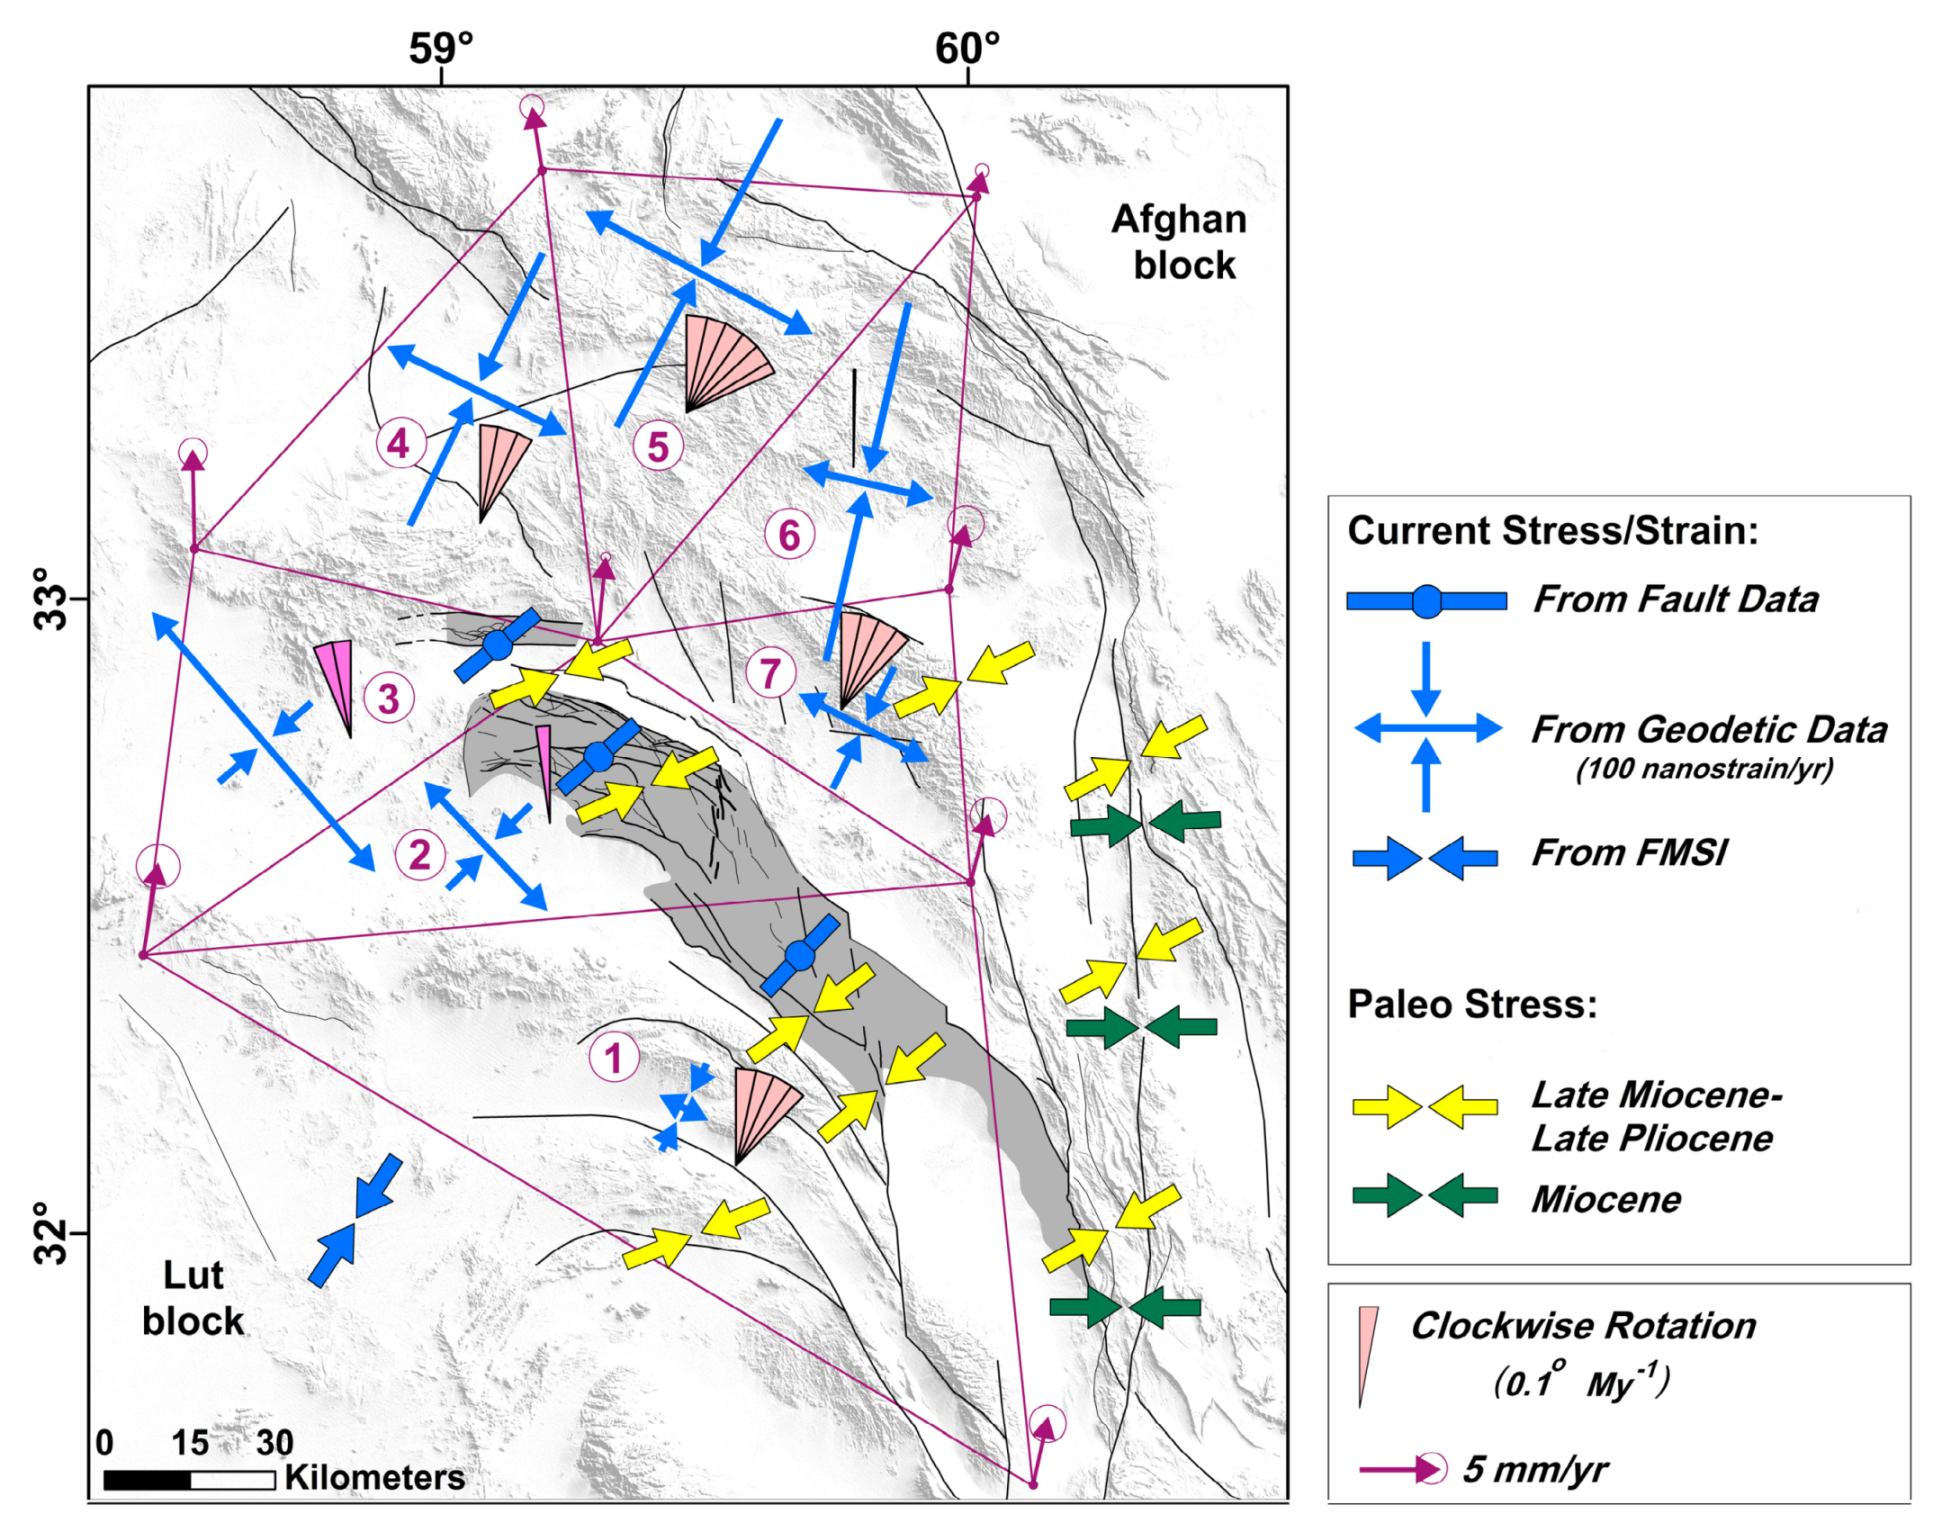
6. Results on Stress and Strain Fields
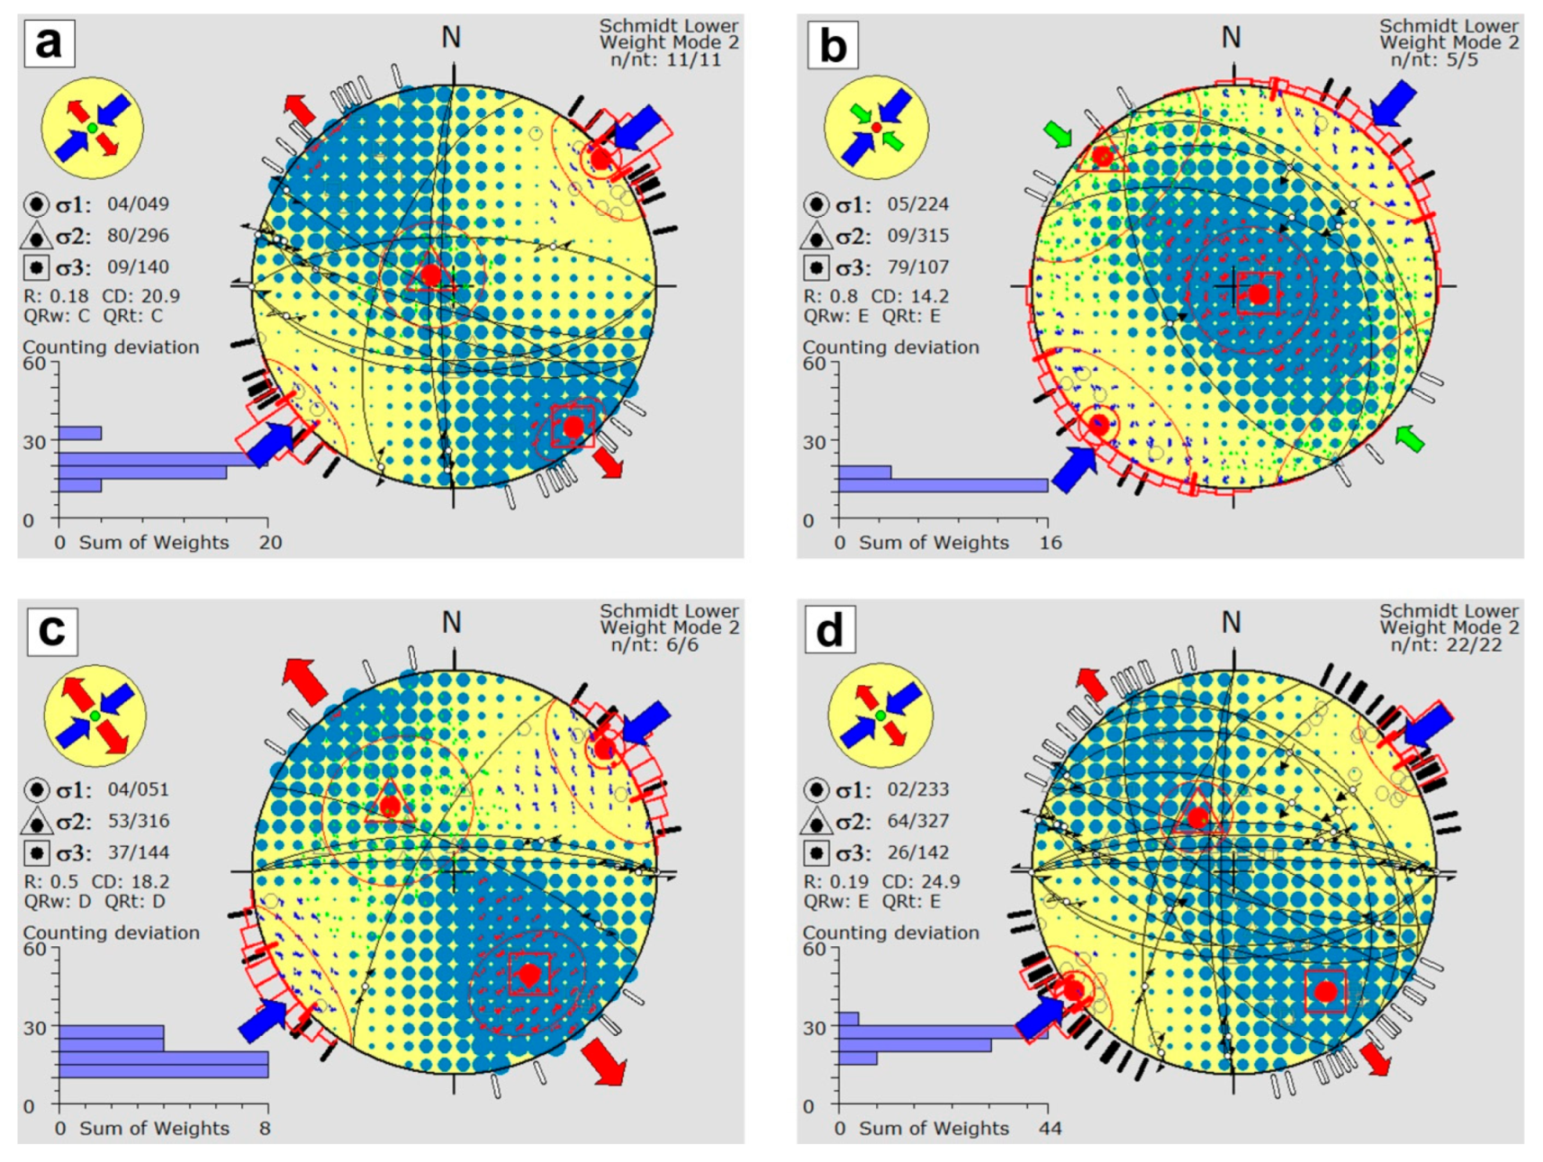
6.1. Analysis of the Fault Slip Data
6.2. Geodetic Strain Field and Rotation Rate
7. Discussion and Interpretation of Results
7.1. Structural Evolution of the Shekarab Duplex
7.2. Vertical-Axis Fault Block Rotation
7.3. Tectonic Model of the Birjand Splay within the East Iran Orogen
7.4. Regional Tectonics and Kinematic Implications
8. Conclusions
Author Contributions
Funding
Data Availability Statement
Acknowledgments
Conflicts of Interest
References
- Jackson, J.; Molnar, P. Active faulting and block rotations in the Western Transverse Ranges, California. J. Geophys. Res. Earth Surf. 1990, 95, 22073–22087. [Google Scholar] [CrossRef]
- Molnar, P.; Tapponnier, P. Cenozoic Tectonics of Asia: Effects of a Continental Collision: Features of recent continental tectonics in Asia can be interpreted as results of the India-Eurasia collision. Science 1975, 189, 419–426. [Google Scholar] [CrossRef] [PubMed]
- Nur, A.; Ron, H.; Scotti, O. Kinematics and Mechanics of Tectonic Block Rotations. In Geophysical Monograph Series; Cohen, S.C., VanííEk, P., Eds.; American Geophysical Union: Washington, DC, USA, 2013; pp. 31–46. [Google Scholar] [CrossRef]
- Freund, R. Rotation of Strike Slip Faults in Sistan, Southeast Iran. J. Geol. 1970, 78, 188–200. [Google Scholar] [CrossRef]
- Tirrul, R.; Bell, I.R.; Griffis, R.J.; Camp, V.E. The Sistan suture zone of eastern Iran. Geol. Soc. Am. Bull. 1983, 94, 134. [Google Scholar] [CrossRef]
- Jentzer, M.; Fournier, M.; Agard, P.; Omrani, J.; Khatib, M.M.; Whitechurch, H. Neogene to Present paleostress field in Eastern Iran (Sistan belt) and implications for regional geodynamics: Paleostress Field in Eastern Iran. Tectonics 2017, 36, 321–339. [Google Scholar] [CrossRef]
- Bagheri, S.; Gol, S.D. The eastern iranian orocline. Earth-Sci. Rev. 2020, 210, 103322. [Google Scholar] [CrossRef]
- Walker, R.T.; Khatib, M.M. Active faulting in the Birjand region of NE Iran. Tectonics 2006, 25. [Google Scholar] [CrossRef]
- Calzolari, G.; Della Seta, M.; Rossetti, F.; Nozaem, R.; Vignaroli, G.; Cosentino, D.; Faccenna, C. Geomorphic signal of active faulting at the northern edge of Lut Block: Insights on the kinematic scenario of Central Iran: Tectonic geomorphology in central Iran. Tectonics 2015, 35, 76–102. [Google Scholar] [CrossRef]
- Calzolari, G.; Rossetti, F.; Della Seta, M.; Nozaem, R.; Olivetti, V.; Balestrieri, M.L.; Cosentino, D.; Faccenna, C.; Stuart, F.M.; Vignaroli, G. Spatio-temporal evolution of intraplate strike-slip faulting: The Neogene–Quaternary Kuh-e-Faghan Fault, central Iran. Geol. Soc. Am. Bull. 2015, 128, 374–396. [Google Scholar] [CrossRef]
- Rashidi, A. Geometric and kinematic characteristics of the Khazar and North Alborz Faults: Links to the structural evolution of the North Alborz-South Caspian boundary, Northern Iran. J. Southeast Asian Earth Sci. 2021, 213, 104755. [Google Scholar] [CrossRef]
- Rashidi, A.; Abbassi, M.-R.; Nilfouroushan, F.; Shafiei, S.; Derakhshani, R.; Nemati, M. Morphotectonic and earthquake data analysis of interactional faults in Sabzevaran Area, SE Iran. J. Struct. Geol. 2020, 139, 104147. [Google Scholar] [CrossRef]
- Molnar, P.; Dayem, K.E. Major intracontinental strike-slip faults and contrasts in lithospheric strength. Geosphere 2010, 6, 444–467. [Google Scholar] [CrossRef]
- Vernant, P.; Nilforoushan, F.; Hatzfeld, D.; Abbassi, M.R.; Vigny, C.; Masson, F.; Nankali, H.; Martinod, J.; Ashtiani, A.; Bayer, R.; et al. Present-day crustal deformation and plate kinematics in the Middle East constrained by GPS measurements in Iran and northern Oman. Geophys. J. Int. 2004, 157, 381–398. [Google Scholar] [CrossRef]
- Camp, V.; Griffis, R. Character, genesis and tectonic setting of igneous rocks in the Sistan suture zone, eastern Iran. Lithos 1982, 15, 221–239. [Google Scholar] [CrossRef]
- Saccani, E.; Delavari, M.; Beccaluva, L.; Amini, S. Petrological and geochemical constraints on the origin of the Nehbandan ophiolitic complex (eastern Iran): Implication for the evolution of the Sistan Ocean. Lithos 2010, 117, 209–228. [Google Scholar] [CrossRef]
- Zarrinkoub, M.H.; Pang, K.-N.; Chung, S.-L.; Khatib, M.M.; Mohammadi, S.S.; Chiu, H.-Y.; Lee, H.-Y. Zircon U–Pb age and geochemical constraints on the origin of the Birjand ophiolite, Sistan suture zone, eastern Iran. Lithos 2012, 154, 392–405. [Google Scholar] [CrossRef]
- Conrad, G.; Montigny, R.; Thuizat, R.; Westphal, M. Tertiary and quaternary geodynamics of southern Lut (Iran) as deduced from palaeomagnetic, isotopic and structural data. Tectonophysics 1981, 75, T11–T17. [Google Scholar] [CrossRef]
- Shafiei, B.; Haschke, M.; Shahabpour, J. Recycling of orogenic arc crust triggers porphyry Cu mineralization in Kerman Cenozoic arc rocks, southeastern Iran. Miner. Deposita 2008, 44, 265–283. [Google Scholar] [CrossRef]
- Walker, R.; Jackson, J. Offset and evolution of the Gowk fault, S.E. Iran: A major intra-continental strike-slip system. J. Struct. Geol. 2002, 24, 1677–1698. [Google Scholar] [CrossRef]
- Wellman, H.W. Active wrench faults of Iran, Afghanistan and Pakistan. Geol. Rundsch. 1966, 55, 716–735. [Google Scholar] [CrossRef]
- Berberian, M.; A Jackson, J.; Fielding, E.; E Parsons, B.; Priestley, K.; Qorashi, M.; Talebian, M.; Walker, R.; Wright, T.J.; Baker, C. The 1998 March 14 Fandoqa earthquake (Mw6.6) in Kerman province, southeast Iran: Re-rupture of the 1981 Sirch earthquake fault, triggering of slip on adjacent thrusts and the active tectonics of the Gowk fault zone. Geophys. J. Int. 2001, 146, 371–398. [Google Scholar] [CrossRef]
- Berberian, M.; Jackson, J.A.; Qorashi, M.; Talebian, M.; Khatib, M.; Priestley, K. The 1994 Sefidabeh earthquakes in eastern Iran: Blind thrusting and bedding-plane slip on a growing anticline, and active tectonics of the Sistan suture zone. Geophys. J. Int. 2000, 142, 283–299. [Google Scholar] [CrossRef]
- Berberian, M.; Jackson, J.A.; Qorashi, M.; Khatib, M.M.; Priestley, K.; Talebian, M.; Ghafuri-Ashtiani, M. The 1997 May 10 Zirkuh (Qa’enat) earthquake (Mw 7.2): Faulting along the Sistan suture zone of eastern Iran. Geophys. J. Int. 1999, 136, 671–694. [Google Scholar] [CrossRef]
- Boshrabadi, A.R.; Khatib, M.M.; Raeesi, M.; Mousavi, S.M.; Djamour, Y. Geometric-kinematic characteristics of the main faults in the W-SW of the Lut Block (SE Iran). J. Afr. Earth Sci. 2018, 139, 440–462. [Google Scholar] [CrossRef]
- Ambraseys, N.N.; Tchalenko, J.S. The Dasht-e Bayāz (Iran) earthquake of August 31, 1968: A field report. Bull. Seism. Soc. Am. 1969, 59, 1751–1792. [Google Scholar] [CrossRef]
- Berberian, M.; Yeats, R.S. Patterns of historical rupture in the Iranian Plateau. Bull. Seism. Soc. Am. 1999, 89, 120–139. [Google Scholar] [CrossRef]
- Walker, R.; Jackson, J. Active tectonics and late Cenozoic strain distribution in central and eastern Iran: Tectonics of central and eastern Iran. Tectonics 2004, 23. [Google Scholar] [CrossRef]
- Meyer, B.; Le Dortz, K. Strike-slip kinematics in Central and Eastern Iran: Estimating fault slip-rates averaged over the Holocene: Holocene strike-slip kinematics in Iran. Tectonics 2007, 26. [Google Scholar] [CrossRef]
- Regard, V.; Bellier, O.; Thomas, J.-C.; Bourlès, D.; Bonnet, S.; Abbassi, M.R.; Braucher, R.; Mercier, J.; Shabanian, E.; Soleymani, S.; et al. Cumulative right-lateral fault slip rate across the Zagros-Makran transfer zone: Role of the Minab-Zendan fault system in accommodating Arabia-Eurasia convergence in southeast Iran. Geophys. J. Int. 2005, 162, 177–203. [Google Scholar] [CrossRef]
- Baker, C. The Active Seismicity and Tectonics of Iran. Ph.D. Thesis, University of Cambridge, Cambridge, UK, 1993. [Google Scholar]
- Jackson, J. Living with earthquakes: Know your faults. J. Earthq. Eng. 2001, 5, 5–123. [Google Scholar] [CrossRef]
- Ezati, M.; Gholami, E.; Mousavi, S.M.; Rashidi, A.; Derakhshani, R. Active Deformation Patterns in the Northern Birjand Mountains of the Sistan Suture Zone, Iran. Appl. Sci. 2022, 12, 6625. [Google Scholar] [CrossRef]
- Angelier, J.; Tarantola, A.; Valette, B.; Manoussis, S. Inversion of field data in fault tectonics to obtain the regional stress? I. Single phase fault populations: A new method of computing the stress tensor. Geophys. J. Int. 1982, 69, 607–621. [Google Scholar] [CrossRef]
- Delvaux, D.; Sperner, B. New aspects of tectonic stress inversion with reference to the TENSOR program. Geol. Soc. London Spéc. Publ. 2003, 212, 75–100. [Google Scholar] [CrossRef]
- Rashidi, A.; Derakhshani, R. Strain and Moment Rates from GPS and Seismological Data in Northern Iran: Implications for an Evaluation of Stress Trajectories and Probabilistic Fault Rupture Hazard. Remote Sens. 2022, 14, 2219. [Google Scholar] [CrossRef]
- Khorrami, F.; Vernant, P.; Masson, F.; Nilfouroushan, F.; Mousavi, Z.; Nankali, H.; Saadat, S.A.; Walpersdorf, A.; Hosseini, S.; Tavakoli, P.; et al. An up-to-date crustal deformation map of Iran using integrated campaign-mode and permanent GPS velocities. Geophys. J. Int. 2019, 217, 832–843. [Google Scholar] [CrossRef]
- Malvern, L.E. Introduction to the Mechanics of a Continuous Medium; Prentice-Hall: Englewood Cliffs, NJ, USA, 1969. [Google Scholar]
- Raeesi, M.; Zarifi, Z.; Nilfouroushan, F.; Boroujeni, S.A.; Tiampo, K. Quantitative Analysis of Seismicity in Iran. Pure Appl. Geophys. 2016, 174, 793–833. [Google Scholar] [CrossRef]
- Deng, Q.; Wu, D.; Zhang, P.; Chen, S. Structure and deformational character of strike-slip fault zones. Pure Appl. Geophys. 1986, 124, 203–223. [Google Scholar] [CrossRef]
- Bartel, E.M.; Neubauer, F.; Genser, J.; Heberer, B. States of paleostress north and south of the Periadriatic fault: Comparison of the Drau Range and the Friuli Southalpine wedge. Tectonophysics 2014, 637, 305–327. [Google Scholar] [CrossRef]
- Ashidi, A.; Kianimehr, H.; Shafieibafti, S.; Mehrabi, A.; Derakhshani, R. Active faults in the west of the Lut block (central Iran). Геoфизисслед 2021, 22, 70–84. [Google Scholar] [CrossRef]
- Woodcock, N.H. Kinematics of strike-slip faulting, builth Inlier, mid-Wales. J. Struct. Geol. 1987, 9, 353–363. [Google Scholar] [CrossRef]
- Eftekhar Nezhad, J.; Stocklin, J. Geological Map of Iran sheet K8 (Birjand), scale 1:250,000. Geological Survey of Iran: Tehran, Iran, 1992. [Google Scholar]
- Al-Kindi, M. Understanding the Relationship between Large-Scale Fold Structures and Small-Scale Fracture Patterns: A Case Study from the Oman Mountains. Geosciences 2020, 10, 490. [Google Scholar] [CrossRef]
- Chauvet, A. Structural Control of Ore Deposits: The Role of Pre-Existing Structures on the Formation of Mineralised Vein Systems. Minerals 2019, 9, 56. [Google Scholar] [CrossRef]
- Fischer, M.P.; Jackson, P.B. Stratigraphic controls on eformation patterns in fault-related folds: A detachment fold example from the Sierra Madre Oriental, northeast Mexico. J. Struct. Geol. 1999, 21, 613–633. [Google Scholar] [CrossRef]
- Johnston, J.D. Three- dimensional geometries of veins and their relationship to folds: Examples from the Carboniferous of eastern Ireland. Irish J. Earth Sci. 1993, 12, 47–63. [Google Scholar]
- Doblas, M. Slickenside kinematic indicators. Tectonophysics 1998, 295, 187–197. [Google Scholar] [CrossRef]
- Goscombe, B.D.; Passchier, C.W.; Hand, M. Boudinage classification: End-member boudin types and modified boudin structures. J. Struct. Geol. 2004, 26, 739–763. [Google Scholar] [CrossRef]
- Alsop, G.; Strachan, R.; Holdsworth, R.; Burns, I. Geometry of folded and boudinaged pegmatite veins emplaced within a strike-slip shear zone: A case study from the Caledonian orogen, northern Scotland. J. Struct. Geol. 2020, 142, 104233. [Google Scholar] [CrossRef]
- Savidge, E.; Nissen, E.; Nemati, M.; Karasözen, E.; Hollingsworth, J.; Talebian, M.; Bergman, E.; Ghods, A.; Ghorashi, M.; Kosari, E.; et al. The December 2017 Hojedk (Iran) earthquake triplet—sequential rupture of shallow reverse faults in a strike-slip restraining bend. Geophys. J. Int. 2019, 217, 909–925. [Google Scholar] [CrossRef]
- Dahlstrom, C.D.A. Structural Geology in Eastern Margin of Canadian Rocky Mountains: ABSTRACT. AAPG Bull. 1970, 54. [Google Scholar] [CrossRef]
- Butler, R.W. The terminology of structures in thrust belts. J. Struct. Geol. 1982, 4, 239–245. [Google Scholar] [CrossRef]
- Elliott, D. The Strength of Rocks in Thrust Sheets. Eos 1981, 62, 397. [Google Scholar]
- Boyer, D.E.S.E. Thrust Systems. AAPG Bull. 1982, 66, 1196–1230. [Google Scholar] [CrossRef]
- Boyer, S.E.; Mitra, G. Fold duplexes. J. Struct. Geol. 2018, 125, 202–212. [Google Scholar] [CrossRef]
- Mitra, G.; E Boyer, S. Energy balance and deformation mechanisms of duplexes. J. Struct. Geol. 1986, 8, 291–304. [Google Scholar] [CrossRef]
- Rashidi, A.; Kianimehr, H.; Yamini-Fard, F.; Tatar, M.; Zafarani, H. Present Stress Map and Deformation Distribution in the NE Lut Block, Eastern Iran: Insights from Seismic and Geodetic Strain and Moment Rates. Pure Appl. Geophys. 2022, 179, 1887–1917. [Google Scholar] [CrossRef]
- Sheikholeslami, M.R.; Mobayen, P.; Javadi, H.R.; Ghassemi, M.R. Stress field and tectonic regime of Central Iran from inversion of the earthquake focal mechanisms. Tectonophysics 2021, 813, 228931. [Google Scholar] [CrossRef]
- Carreras, J.; Druguet, E.; Griera, A. Shear zone-related folds. J. Struct. Geol. 2005, 27, 1229–1251. [Google Scholar] [CrossRef]
- Llorens, M.-G.; Bons, P.D.; Griera, A.; Gomez-Rivas, E.; Evans, L.A. Single layer folding in simple shear. J. Struct. Geol. 2013, 50, 209–220. [Google Scholar] [CrossRef]
- Woodcock, N.H.; Rickards, B. Transpressive duplex and flower structure: Dent Fault System, NW England. J. Struct. Geol. 2003, 25, 1981–1992. [Google Scholar] [CrossRef]
- Renda, P.; Tavarnelli, E.; Tramutoli, M.; Gueguen, E. Neogene deformation of Northern Sicily, and their implications for the geodynamics of the Southern Tyrrhenian sea margin. Mem. Della Soc. Geol. Italiana 2000, 55, 53–59. [Google Scholar]
- Jackson, J.; Priestley, K.; Allen, M.; Berberian, M. Active tectonics of the South Caspian Basin. Geophys. J. Int. 2002, 148, 214–245. [Google Scholar] [CrossRef]
- Mattei, M.; Cifelli, F.; Muttoni, G.; Zanchi, A.; Berra, F.; Mossavvari, F.; Eshraghi, S.A. Neogene block rotation in central Iran: Evidence from paleomagnetic data. GSA Bull. 2012, 124, 943–956. [Google Scholar] [CrossRef]
- Hatzfeld, D.; Molnar, P. Comparisons of the kinematics and deep structures of the Zagros and Himalaya and of the Iranian and Tibetan plateaus and geodynamic implications. Rev. Geophys. 2010, 48. [Google Scholar] [CrossRef]
- Dubey, A.K. Simultaneous development of noncylindrical folds, frontal ramps, and transfer faults in a compressional regime: Experimental investigations of Himalayan Examples. Tectonics 1997, 16, 336–346. [Google Scholar] [CrossRef]
- Wernicke, B.; Axen, G.J. On the role of isostasy in the evolution of normal fault systems. Geology 1988, 16, 848. [Google Scholar] [CrossRef]
- Dart, C.; Cohen, H.A.; Akyüz, H.S.; Barka, A. Basinward migration of rift-border faults: Implications for facies distributions and preservation potential. Geology 1995, 23, 69. [Google Scholar] [CrossRef]
- Jackson, J. Active tectonics of the Aegean region. Annu. Rev. Earth Planet. Sci. 1994, 22, 239–271. [Google Scholar] [CrossRef]
- Walker, R.T. A remote sensing study of active folding and faulting in southern Kerman province, S.E. Iran. J. Struct. Geol. 2006, 28, 654–668. [Google Scholar] [CrossRef]
- Mattei, M.; Cifelli, F.; Alimohammadian, H.; Rashid, H.; Winkler, A.; Sagnotti, L. Oroclinal bending in the Alborz Mountains (Northern Iran): New constraints on the age of South Caspian subduction and extrusion tectonics. Gondwana Res. 2017, 42, 13–28. [Google Scholar] [CrossRef]
- Nozaem, R.; Mohajjel, M.; Rossetti, F.; Della Seta, M.; Vignaroli, G.; Yassaghi, A.; Salvini, F.; Eliassi, M. Post-Neogene right-lateral strike–slip tectonics at the north-western edge of the Lut Block (Kuh-e–Sarhangi Fault), Central Iran. Tectonophysics 2013, 589, 220–233. [Google Scholar] [CrossRef]
- Allen, M.B.; Kheirkhah, M.; Emami, M.H.; Jones, S. Right-lateral shear across Iran and kinematic change in the Arabia-Eurasia collision zone: Right-lateral shear across Iran. Geophys. J. Int. 2010, 184, 555–574. [Google Scholar] [CrossRef]
- Taymaz, T.; Jackson, J.; McKenzie, D. Active tectonics of the north and central Aegean Sea. Geophys. J. Int. 1991, 106, 433–490. [Google Scholar] [CrossRef]
- Molnar, P.; England, P. Late Cenozoic uplift of mountain ranges and global climate change: Chicken or egg? Nature 1990, 346, 29–34. [Google Scholar] [CrossRef]
- Allmendinger, R.W.; Cardozo, N.; Fisher, D.M. Structural Geology Algorithms: Vectors and Tensors; Cambridge University Press: Cambridge, UK, 2011. [Google Scholar] [CrossRef]
- Marrett, R.; Allmendinger, R.W. Kinematic analysis of fault-slip data. J. Struct. Geol. 1990, 12, 973–986. [Google Scholar] [CrossRef]
- Wessel, P.; Smith, W.H.F. New, improved version of generic mapping tools released. Eos Trans. Am. Geophys. Union 1998, 79, 579. [Google Scholar] [CrossRef]


| Site | Long. | Lat. | Evel (mm/yr) | Nvel (mm/yr) | SigVe | SigVn | Correlation | References |
|---|---|---|---|---|---|---|---|---|
| ABGR | 58.3190 | 32.4840 | 1.46 | 7.99 | 1.58 | 1.58 | 0.002 | RA |
| BIJD | 59.2553 | 32.9002 | 0.90 | 6.99 | 0.13 | 0.13 | 0.012 | IPGN |
| HJBD | 60.0098 | 33.6039 | 0.62 | 2.24 | 0.23 | 0.27 | 0.007 | IPGN |
| NOGH | 59.9370 | 32.9880 | 1.54 | 5.54 | 1.01 | 1.01 | 0.004 | RA |
| QAE2 | 59.1880 | 33.6630 | −0.59 | 5.33 | 0.75 | 0.72 | 0.006 | IPGN |
| SARB | 59.9550 | 32.5780 | 1.75 | 5.83 | 1.18 | 1.19 | 0.004 | RA |
| TOTI | 58.5320 | 33.0190 | −0.15 | 8.65 | 0.80 | 0.78 | 0.006 | RA |
| NEBA | 60.047 | 31.573 | 1.34 | 6.23 | 1.3 | 1.3 | 0.004 | RA |
| Fault Plane | Slip Line | Slip | Longitude (°E) | Latitude (°N) | Stress Regime Index (R′) | Stress Regime | σ1 (az/pl) | σ2 (az/pl) | σ3 (az/pl) | Area | ||
|---|---|---|---|---|---|---|---|---|---|---|---|---|
| Dip | Dip Dir. | Plunge | Azim. | Sense | ||||||||
| 80 | 270 | 10 | 182 | ID | 59.499° | 32.663° | 1.62 ± 0.16 | Strike-slipcompressive | 049°/04° | 296°/80° | 140°/09° | Western Birjand splay (Bagheran mountains) |
| 85 | 270 | 20 | 182 | ID | 59.490° | 32.608° | ||||||
| 60 | 290 | 04 | 202 | ID | 59.479° | 32.582° | ||||||
| 70 | 200 | 32 | 277 | IS | 59.346° | 32.785° | ||||||
| 60 | 200 | 10 | 285 | IS | 59.110° | 32.845° | ||||||
| 85 | 210 | 05 | 300 | IS | 59.177° | 32.807° | ||||||
| 80 | 195 | 00 | 285 | IS | 59.062° | 32.814° | ||||||
| 70 | 200 | 14 | 285 | IS | 59.305° | 32.755° | ||||||
| 60 | 180 | 17 | 260 | IS | 59.362° | 32.725° | ||||||
| 55 | 180 | 00 | 270 | IS | 59.311° | 32.725° | ||||||
| 70 | 360 | 46 | 068 | IS | 59.063° | 32.718° | ||||||
| 35 | 025 | 35 | 025 | IX | 59.548° | 32.365° | 2.56 ± 0.3 | Compressional | 224°/05° | 315°/09° | 107°/79° | Eastern Birjand splay |
| 40 | 060 | 40 | 060 | IX | 59.565° | 32.355° | ||||||
| 30 | 45 | 29 | 55 | IS | 59.558° | 32.360° | ||||||
| 60 | 240 | 60 | 240 | IX | 59.497° | 32.481° | ||||||
| 55 | 20 | 53 | 40 | IS | 59.447° | 32.434° | ||||||
| 75 | 360 | 52 | 070 | IS | 59.212° | 32.950° | 1.64 ± 0.54 | Strike-slip compressive | 051°/04° | 316°/53° | 144°/37° | Shekarab Mountains |
| 80 | 360 | 00 | 090 | IS | 59.212° | 32.949° | ||||||
| 85 | 360 | 20 | 088 | IS | 59.061° | 32.932° | ||||||
| 85 | 360 | 10 | 090 | IS | 59.091° | 32.938° | ||||||
| 80 | 025 | 25 | 110 | IS | 59.082° | 32.940° | ||||||
| 75 | 300 | 29 | 218 | ID | 59.091° | 32.943° | ||||||
| Triangles | Max Horizontal Extension (e1H) (Nano-Strain/yr) | Azimuth of e1H (Degrees) | Min Horizontal Extension (e2H) (Nano-Strain/yr) | Azimuth of e2H (Degrees) |
|---|---|---|---|---|
| 1 | 4.2 | 118° | −7.6 | 28° |
| 2 | 20.9 | 136° | −11.8 | 46° |
| 3 | 40.1 | 139° | −12.1 | 49° |
| 4 | 23.6 | 116° | −33.3 | 26° |
| 5 | 30.5 | 118° | −39.3 | 28° |
| 6 | 15.9 | 103° | −50.4 | 13° |
| 7 | 17.2 | 117° | −14.2 | 27° |
| Triangle | Rotation (Degrees/yr) | Rotation Sense |
|---|---|---|
| 1 | 5.00 × 10⁻⁷ | clockwise |
| 2 | 1.02 × 10⁻⁷ | counter-clockwise |
| 3 | 2.57 × 10⁻⁷ | counter-clockwise |
| 4 | 3.43 × 10⁻⁷ | clockwise |
| 5 | 7.35 × 10⁻⁷ | clockwise |
| 6 | 3.33 × 10⁻⁹ | clockwise |
| 7 | 5.02 × 10⁻⁷ | clockwise |
Publisher’s Note: MDPI stays neutral with regard to jurisdictional claims in published maps and institutional affiliations. |
© 2022 by the authors. Licensee MDPI, Basel, Switzerland. This article is an open access article distributed under the terms and conditions of the Creative Commons Attribution (CC BY) license (https://creativecommons.org/licenses/by/4.0/).
Share and Cite
Rashidi, A.; Shahpasandzadeh, M.; Braitenberg, C. Late Cenozoic to Present Kinematic of the North to Eastern Iran Orogen: Accommodating Opposite Sense of Fault Blocks Rotation. Remote Sens. 2022, 14, 4048. https://doi.org/10.3390/rs14164048
Rashidi A, Shahpasandzadeh M, Braitenberg C. Late Cenozoic to Present Kinematic of the North to Eastern Iran Orogen: Accommodating Opposite Sense of Fault Blocks Rotation. Remote Sensing. 2022; 14(16):4048. https://doi.org/10.3390/rs14164048
Chicago/Turabian StyleRashidi, Ahmad, Majid Shahpasandzadeh, and Carla Braitenberg. 2022. "Late Cenozoic to Present Kinematic of the North to Eastern Iran Orogen: Accommodating Opposite Sense of Fault Blocks Rotation" Remote Sensing 14, no. 16: 4048. https://doi.org/10.3390/rs14164048