
The Surface Urban Heat Island and Key Mitigation Factors in Arid Climate Cities, Case of Marrakesh, Morocco
by
Abdelali Gourfi
1,2,3,*, 
Aude Nuscia Taïbi
1,
Salima Salhi
1,2, 
Mustapha El Hannani
1 and
Said Boujrouf
2 1
ESO, UMR CNRS 6590, 5 bis Bd. Lavoisier, Université d’Angers, 49045 Angers, France
2
Laboratoire des Etudes sur les Ressources, Mobilité et Attractivité (LERMA), Faculté des Lettres et des Sciences Humaines, Université Cadi Ayyad, Marrakech 40030, Morocco
3
Laboratoire de Géoressources, Géoenvironnement et Génie Civil (L3G), Faculté des Sciences et Techniques, Université Cadi Ayyad, Marrakech 40000, Morocco
*
Author to whom correspondence should be addressed.
Remote Sens. 2022, 14(16), 3935; https://doi.org/10.3390/rs14163935
Submission received: 26 June 2022
/
Revised: 7 August 2022
/
Accepted: 8 August 2022
/
Published: 13 August 2022
(This article belongs to the Special Issue Thermal and Optical Remote Sensing: Evaluating Urban Green Spaces and Urban Heat Islands in a Changing Climate)
Abstract
:The use of vegetation is one of the effective methods to combat the increasing Urban Heat Island (UHI). However, vegetation is steadily decreasing due to urban pressure and increased water stress. This study used air temperature measurements, humidity and an innovative advanced earth system analysis to investigate, at daytime, the relationship between green surfaces, built-up areas and the surface urban heat island (SUHI) in Marrakesh, Morocco, which is one of the busiest cities in Africa and serves as a major economic centre and tourist destination. While it is accepted that UHI variation is generally mitigated by the spatial distribution of green spaces and built-up areas, this study shows that bare areas also play a key role in this relationship. The results show a maximum mean land surface temperature difference of 3.98 °C across the different city neighbourhoods, and bare ground had the highest correlation with temperature (r = 0.86). The correlation between the vegetation index and SUHI is decreasing over time, mainly because of the significant changes in the region’s urban planning policy and urban growth. The study represents a relevant overview of the factors impacting SUHI, and it brings a new perspective to what is known so far in the literature, especially in arid climate areas, which have the specificity of large bare areas playing a major role in SUHI mitigation. This research highlights this complex relationship for future sustainable development, especially with the challenges of global warming becoming increasingly critical.
1. Introduction
Today, cities are facing many new challenges and issues. They are increasingly urbanised [1], dense and sprawling in order to accommodate demographic growth and the concentration of activities. This has led to a degradation of the urban microclimate due to an increase in urban temperatures [2,3]. This phenomenon, known as the urban heat island (UHI) effect, is intensified by the effects of global warming [4]. Moreover, several studies [5,6,7] argue that extreme heat will pose an increased threat to public health, such as the severe increase in heat-related mortality in urban areas, explained in part by the urban heat island effect.
Studies on UHI are of central interest to all scientific disciplines, as it affects human activities, health [8] and ecosystems [9]. UHI has several causes, but it is strongly linked to a reduction in latent heat at the expense of sensible variation in heat and the removal of vegetation cover, particularly in urban areas where there is low vegetation cover [10,11].
Vegetation lowers ground surface temperatures by providing shade [12,13]. Trees and vegetation decrease ambient air temperature through the process of evapotranspiration, where they release water vapour into the atmosphere [14,15]. In fact, areas with very high temperatures are characterised either by an absence of vegetation or by predominantly artificial impermeable surfaces, such as roads, buildings, pavement, etc. Thus, the properties of materials used in the construction of urban structures, such as solar reflectance, heat capacity and thermal emissivity, play a major role in the formation of UHIs. Additionally, the waste heat generated by factories, air conditioners and motor vehicles, which are ubiquitous in the city, is an important factor [16]. These negative effects of UHI can be significantly controlled through sustainable development combined with mitigation or adaptation measures. The ‘strategic’ planting of trees and vegetation in urban areas is one of the most effective methods to reduce the effects of UHI, as vegetation cover increases evaporative cooling while providing shade, reducing solar radiation from the heat-exposed soil [17].
In their study, [18] found that water bodies and vegetation had the lowest land surface temperatures, whereas bare ground had the highest ones. However, bare soils are commonly considered as all urbanised surfaces, whereas in reality it is necessary to distinguish bare areas from built up areas because they do not behave the same way when it comes to heat islands. There are very few studies combining UHI formation with vegetation and built-up areas, particularly in cities of the Global South and at the neighbourhood level. Therefore, in this study, we will present the relationship and impact of vegetation and built-up areas on the presence or absence of UHI, providing insight into this phenomenon.
Two kinds of UHI exist: the canopy layer heat island (CLHI) and the surface urban heat island (SUHI). While CLHI refers to the warming of the urban air, SUHI describes changes in surface temperature [19,20] and, influenced mainly by the albedo, land use and building typology and materials [21]. The most common method used in the literature for SUHI analysis is the retrieval of land surface temperature (LST) from satellite images [22,23,24,25,26,27,28,29].
Solar radiation warms the earth’s surface, while longwave infrared radiation mostly heats the atmosphere from the ground up. Given that the land surface’s energy balance is a complicated process that depends on several factors, the link between LST and air temperature (Tair) may change over time and space (e.g., surface roughness, cloud cover, soil moisture and wind speed). In a recent study, when [30] compared LST and Tair from 2007 to 2013, they found that LST and Tair at daytime are strongly correlated; this correlation is generally stronger than that of the night time. Satellite LST images can be used to derive air temperature [31]. On this basis, it can be concluded that the detailed study of LST can provide a lot of information on the state of UHI and its spatial variation.
In contrast to in situ measurements, which provide sparsely distributed data, satellite imagery products allow monitoring of the urban heat island with global spatial coverage, ensuring better analysis of intra-urban spatial variability of UHI, which is closely related to the distribution of buildings, surface materials and green spaces. Satellite remote sensing is an excellent tool to study the earth’s surface properties and the effects of UHI [32,33]. In this study, we use an exploratory analysis to investigate the SUHI during the daytime and its relationship with different factors in order to understand the mitigating factors for the city of Marrakesh, Morocco in light of the challenges related to climate, environment, demography and water needs.
2. Study Area
Marrakesh is a semi-arid continental city located in central Morocco (Figure 1). The area has undergone radical change since it was founded. It was desert land before the occupation, a garden city before colonisation, and now, it has become a tourist city. Marrakesh has also experienced a rapid urban demographic transition in the last decades as a result of its economic development. Currently, the city is part of the Marrakesh–Safi region, which covers 230 km², with 5 districts (Marrakesh–Medina, Guéliz, Menara, Ennakhil and Sidi Youssef Ben Ali/SYBA) and 25 neighbourhoods. It is home to 928,850 inhabitants with a density of 350 inhabitants per km² [34]. The Medina and Mechewer districts constitute the centuries-old centre of the city, next to the colonial neighbourhoods of Hivernage and Guéliz, as well as the military district in colonial times. These French neighbourhoods, examples of the French colonial urban model with public parks and gardens, squares and public places, and trees aligned along the streets [35], were created with a hygienist objective, synonymous with modernity, civilisation and social progress, and an attractive reassuring framework and pleasant environment for French people [36]. The other districts were built after independence. SYBA, an informal working-class neighbourhood from the 1960s, was built around old foundations and later regularised. In the south, Hay Jadid underwent a similar process after the 1990s. Daoudiate is a planned middle-class neighbourhood from the 1970s, as are Issil and Amerchich from the 1980s. Mhamid, Massira, Iziki, Azli, Hay Hassani and Riad Salam are high-rise working-class neighbourhoods planned in the 1990s and 2000s and which spill over into predominantly rural neighbourhoods such as Sidi Ghanem, El Inara, Maata Allah, Azkjjour, Bouaakaz and Al Izdihar. The districts of Ennakhil North and South, which developed in the palm grove mainly after 2000, are home to luxury villas and hotels and are relatively unurbanized; however, the palm grove has completely lost its traditional features, retaining only one layer of low-density palm trees, leaving large areas of bare soils.
Marrakesh is characterised by a semi-arid continental climate. Its average annual temperature is around 20 °C with peaks of around 40 °C. Rainfall periods are between November and April and reach a climatological mean annual total that fluctuates between 150 and 350 mm/year. Outside the rainy season, the atmosphere remains dry with a high evaporative demand.
Today, the urban growth in Marrakesh has led to an increase in demand for housing, basic infrastructure, parks, tourist attractions and real estate, often at the expense of vegetated areas.
The vegetation in the city corresponds largely to the heritage of the colonial period and is today in poor condition, with the exception of a few emblematic public and private parks and gardens, widely recognised in the countries of the North as former colonial metropolises.
3. Material and Methods
In order to understand the relationship between and spatial variation in vegetation, the heat island and built-up areas, we studied the area at the borough, neighbourhood and hexagonal scales. The borough scale was used because population distribution data are available at this unique level, and it was compared with the neighbourhood scale, which is more accurate. We also used a hexagonal grid with polygons of 10 ha, in order to extract more detailed spatial information about the extent of the vegetation, heat island and built-up areas in 2020.
The methodological approach can be divided into three steps:
The first step was to measure air temperature and humidity at the near-surface using a XIAOMI Mijia thermometer (LYWSD03MMC). The temperature measurement range was from 0 °C to 60 °C (resolution ± 0.1 °C), and the humidity range was from 0% to 99% RH (resolution ± 1% RH). The sampling points were taking during midday (between 12:00 am and 14:00 am Greenwich Mean Time) and were carefully selected on the basis of one sample per location (Table 1) to cover the different land uses of the city. The sample point P7 was taken at the level of bare ground in Riad Salam district. The other specimen point, P5, was taken at the level of dense vegetation at Hivernage district, and the sample points P1 and P2 were taken at the level of sparse vegetation at Mechewer district. Additionally, the specimen points P3 and P4 were taken at the level of an alley in the SYBA and Medina districts, respectively. The alleyways in the Medina and SYBA districts of Marrakesh are characterized by narrow streets between dense, neighbouring buildings (ground floor plus one or two floors) and with an open sky view, often sheltered from the sun. The sample point P7 is taken at the level of an alley in Issil. The alleys of the Issil district are characterized by fairly wide alleys; the construction is of the ground floor type plus two storeys, with an open sky view, often exposed to solar radiation.
The samples were taken during the same daytime period in order to obtain a clear result on the spatial variation in air temperatures with different land uses.
The thermometer used was covered by a box to protect the temperature sensor from being influenced by direct or reflected sunlight. The wood box was painted white to better reflect the sun’s rays. The sides with openings allowed outside air to flow around the thermometer. The box was raised to a height of 50 cm to measure the temperature of the air above the ground.
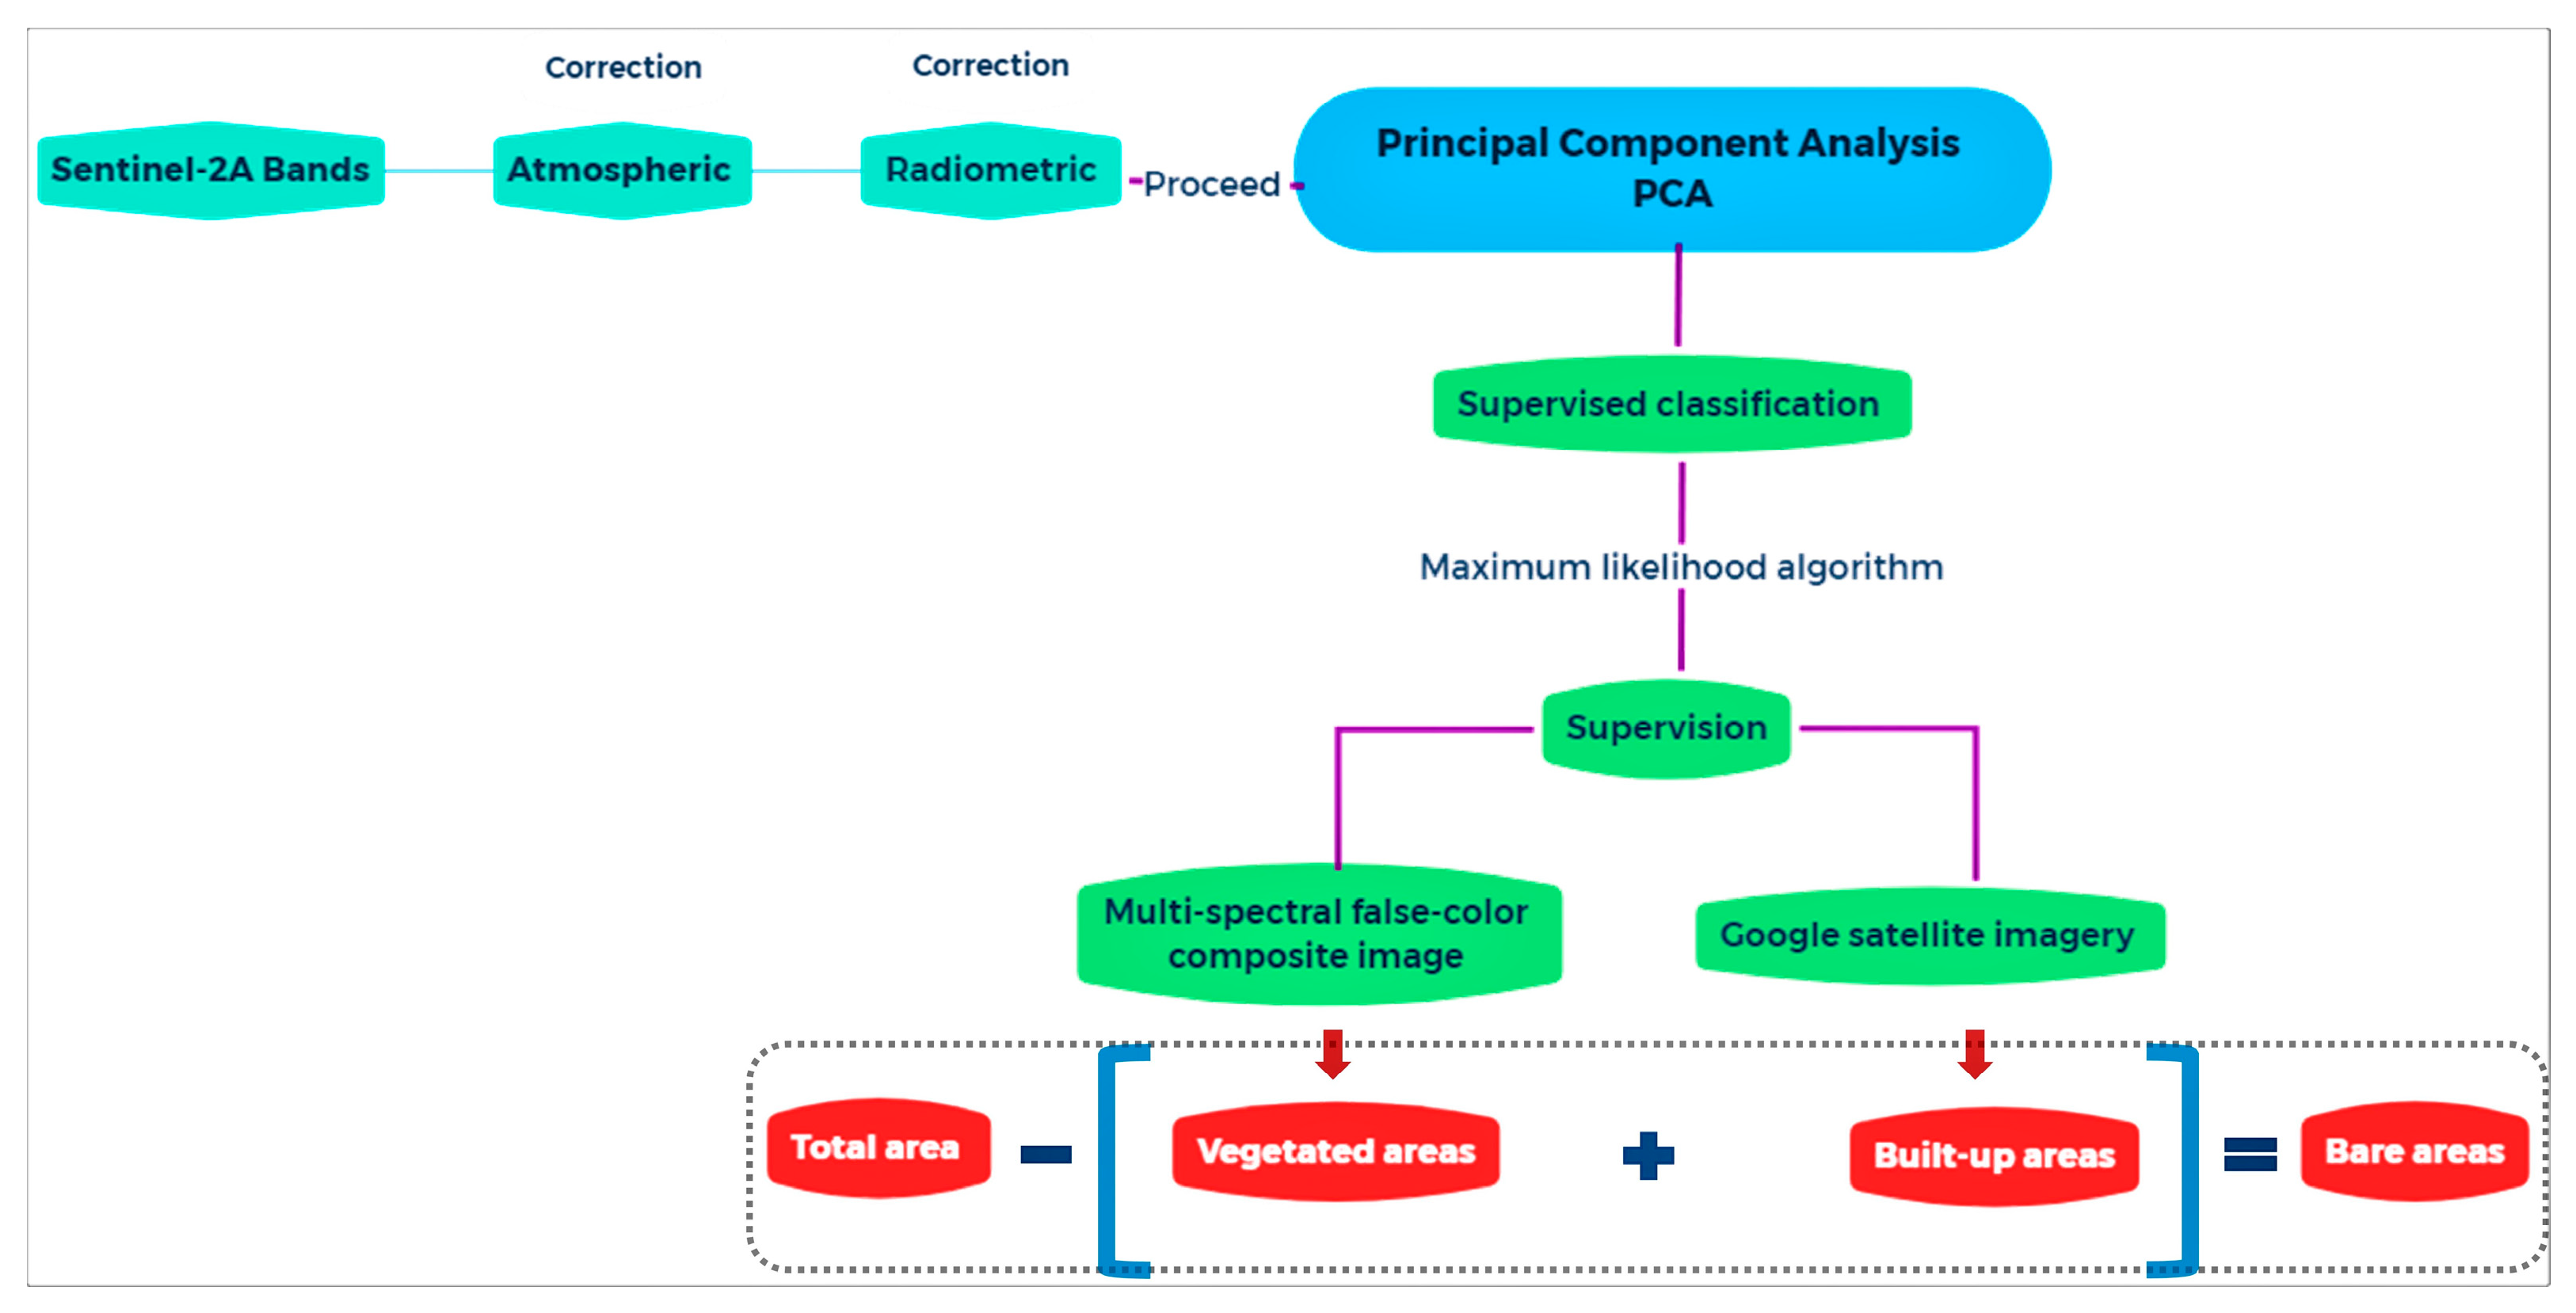
The second step consisted of identifying vegetation cover and built-up and bare soil areas (Figure 2). In this step, the Sentinel 2A was used for more accurate results in estimating land use land cover than those generated from the Landsat time series [37]. In this step, three different stages were carried out: (1) Atmospheric correction and radiometric calibration were performed for each Sentinel-2A spectral band; in this stage, radiance, reflectance and brightness temperatures were optimized and dark subtraction was used to remove the effects of atmospheric scattering from an image. ENVI software was used because of the very powerful scripts used for this purpose, through the “FLAASH Atmospheric correction” and “Radiometric calibration” functions. (2) On the corrected and preprocessed dataset, principal component analysis was performed in order to improve the image presentation by using a data compression technique to separate the noise components, lower the dimensionality of datasets and provide uncorrelated output bands [38]. The ArcGIS software was used to perform the Principal Component Analysis on a set of raster bands and generate a single multiband raster as output. (3) The supervised classification using the Maximum Likelihood Algorithm was used for vegetation sensing, with the samples selected on the basis of the false colour multispectral composite image where the vegetation appears in red colour. For built-up sensing, the samples were chosen using Google Earth satellite imagery [39]. Finally, bare ground refers to stony mineral areas that have not been built on and not vegetated; basically, the entire area with the exception of vegetation and buildings.
The third step concentrated on the calculation of the spatial distribution of LST (land surface temperature) and NDVI (Normalized Difference Vegetation Index).
In this study, we will calculate these two parameters and their linear regression for the years studied (1985–1990–1995–2000–2005–2010–2015–2020) using Landsat satellite images.
Images from the Landsat satellite (5, 7, 8) and Sentinel-2A satellite were used in this study (Table 2). They consist of optical images from 2020 for Sentinel-2A, mainly used to map vegetation areas and built-up areas, and Landsat, used mainly to map NDVI and LST indexes. All the images were acquired from the USGS Global Visualization Viewer website (GloVis) [40]. All the Landsat data were acquired in the morning (between 10:00 am and 12:00 am Greenwich Mean Time).
The images were taken during the dry months (June–July) in order to identify the permanent vegetation cover, which is irrigated during this dry season in Marrakesh. Only images with little or no cloud cover were selected to improve the accuracy of the classifications.
The NDVI values range from −1 to +1. A higher NDVI value indicates healthy and dense vegetation; a lower NDVI value indicates sparse vegetation [41]. It is expressed as follows:
where RED and NIR represent spectral reflectance measurements acquired in the red (visible) and near infrared regions, respectively.
NDVI = (NIR − RED)/(NIR + RED)
The LST index is the key factor for calculating the highest and lowest temperatures of a specific place [42]. It is calculated by using Land Surface Emissivity, top of atmosphere brightness temperature and wavelength of emitted radiance.
The LST (°C) is calculated using two methodologies depending on the sensor used: TM, ETM+ or OLI.
For the TM and ETM+ sensor, LST is calculated using the following equation:
where K1 is the calibration constant 1 in Watts/(m2 × sr × μm) and K2 is the calibration constant 1 in Kelvin. K1 and K2 are calculated based on the band 6 depending on the sensor used (Table 3):
LST = K2/(ln(K1/Lλ + 1)) − 273.15
Lλ (Watts/(m2 × sr × μm)) is the TOA spectral radiance, calculated as follows:
where QCAL = Band 6; LMAXλ: Radiance Maximum Band in Watts/(m2 × sr × μm); LMINλ = Radiance Minimum Band in Watts/(m2 × sr × μm); QCALMIN = Minimum quantized calibrated pixel value of band 6 and QCALMAX = Maximum quantized calibrated pixel value of band 6.
Recurring data for the determination of K1, K2, QCALMIN, QCALMAX, LMAXλ and LMINλ could be found in the MTL file in the Landsat image folder.
For the OLI sensor, LST (°C) is calculated using the following equation:
where W = Wavelength of Emitted Radiance of band 10 (11.5 um); BT = Top of Atmosphere Brightness Temperature in °C; W = Wavelength of Emitted Radiance and E = Land Surface Emissivity.
LST = BT/(1+ (W × BT/14380) × ln(E))
The top of atmosphere Brightness Temperature (BT) is calculated as follows:
where K1 = calibration constant 1 in Watts/(m2 × sr × μm); K2 = calibration constant 1 in Kelvin and Lλ = TOA Spectral Radiance (Watts/(m2 × sr × μm)).
BT = K2/(ln(K1/Lλ + 1) − 273.15
K1 and K2 are calculated based on the band 10 of the sensor Landsat 8 (Table 3).
TOA Spectral Radiance (Lλ) can be calculated as follows:
where ML = radiance multiplicative band (3.342 10–4); Qcal = quantized and calibrated standard product pixel values (Band 10); AL = radiance Add Band (AL = 0.1) and Oi=correction value for band 10 (Oi = 0.29).
Lλ = ML × Qcal + AL − Oi
E, the Land Surface Emissivity, can be calculated as follows:
where PV = proportion of vegetation, which can be calculated as follows:
where PV = proportion of vegetation; NDVI = DN values from NDVI image (Calculated from Equation (1)); NDVImin = minimum DN values from NDVI image and NDVImax = maximum DN values from NDVI image.
E = 0.986 + PV × 0.004
PV = [(NDVI − NDVImin)/(NDVImax + NDVImin)]²
Recurring data for determination of ML, AL, K1 and K2 could be found in the MTL file in the Landsat image folder.
4. Results
4.1. Initial Results
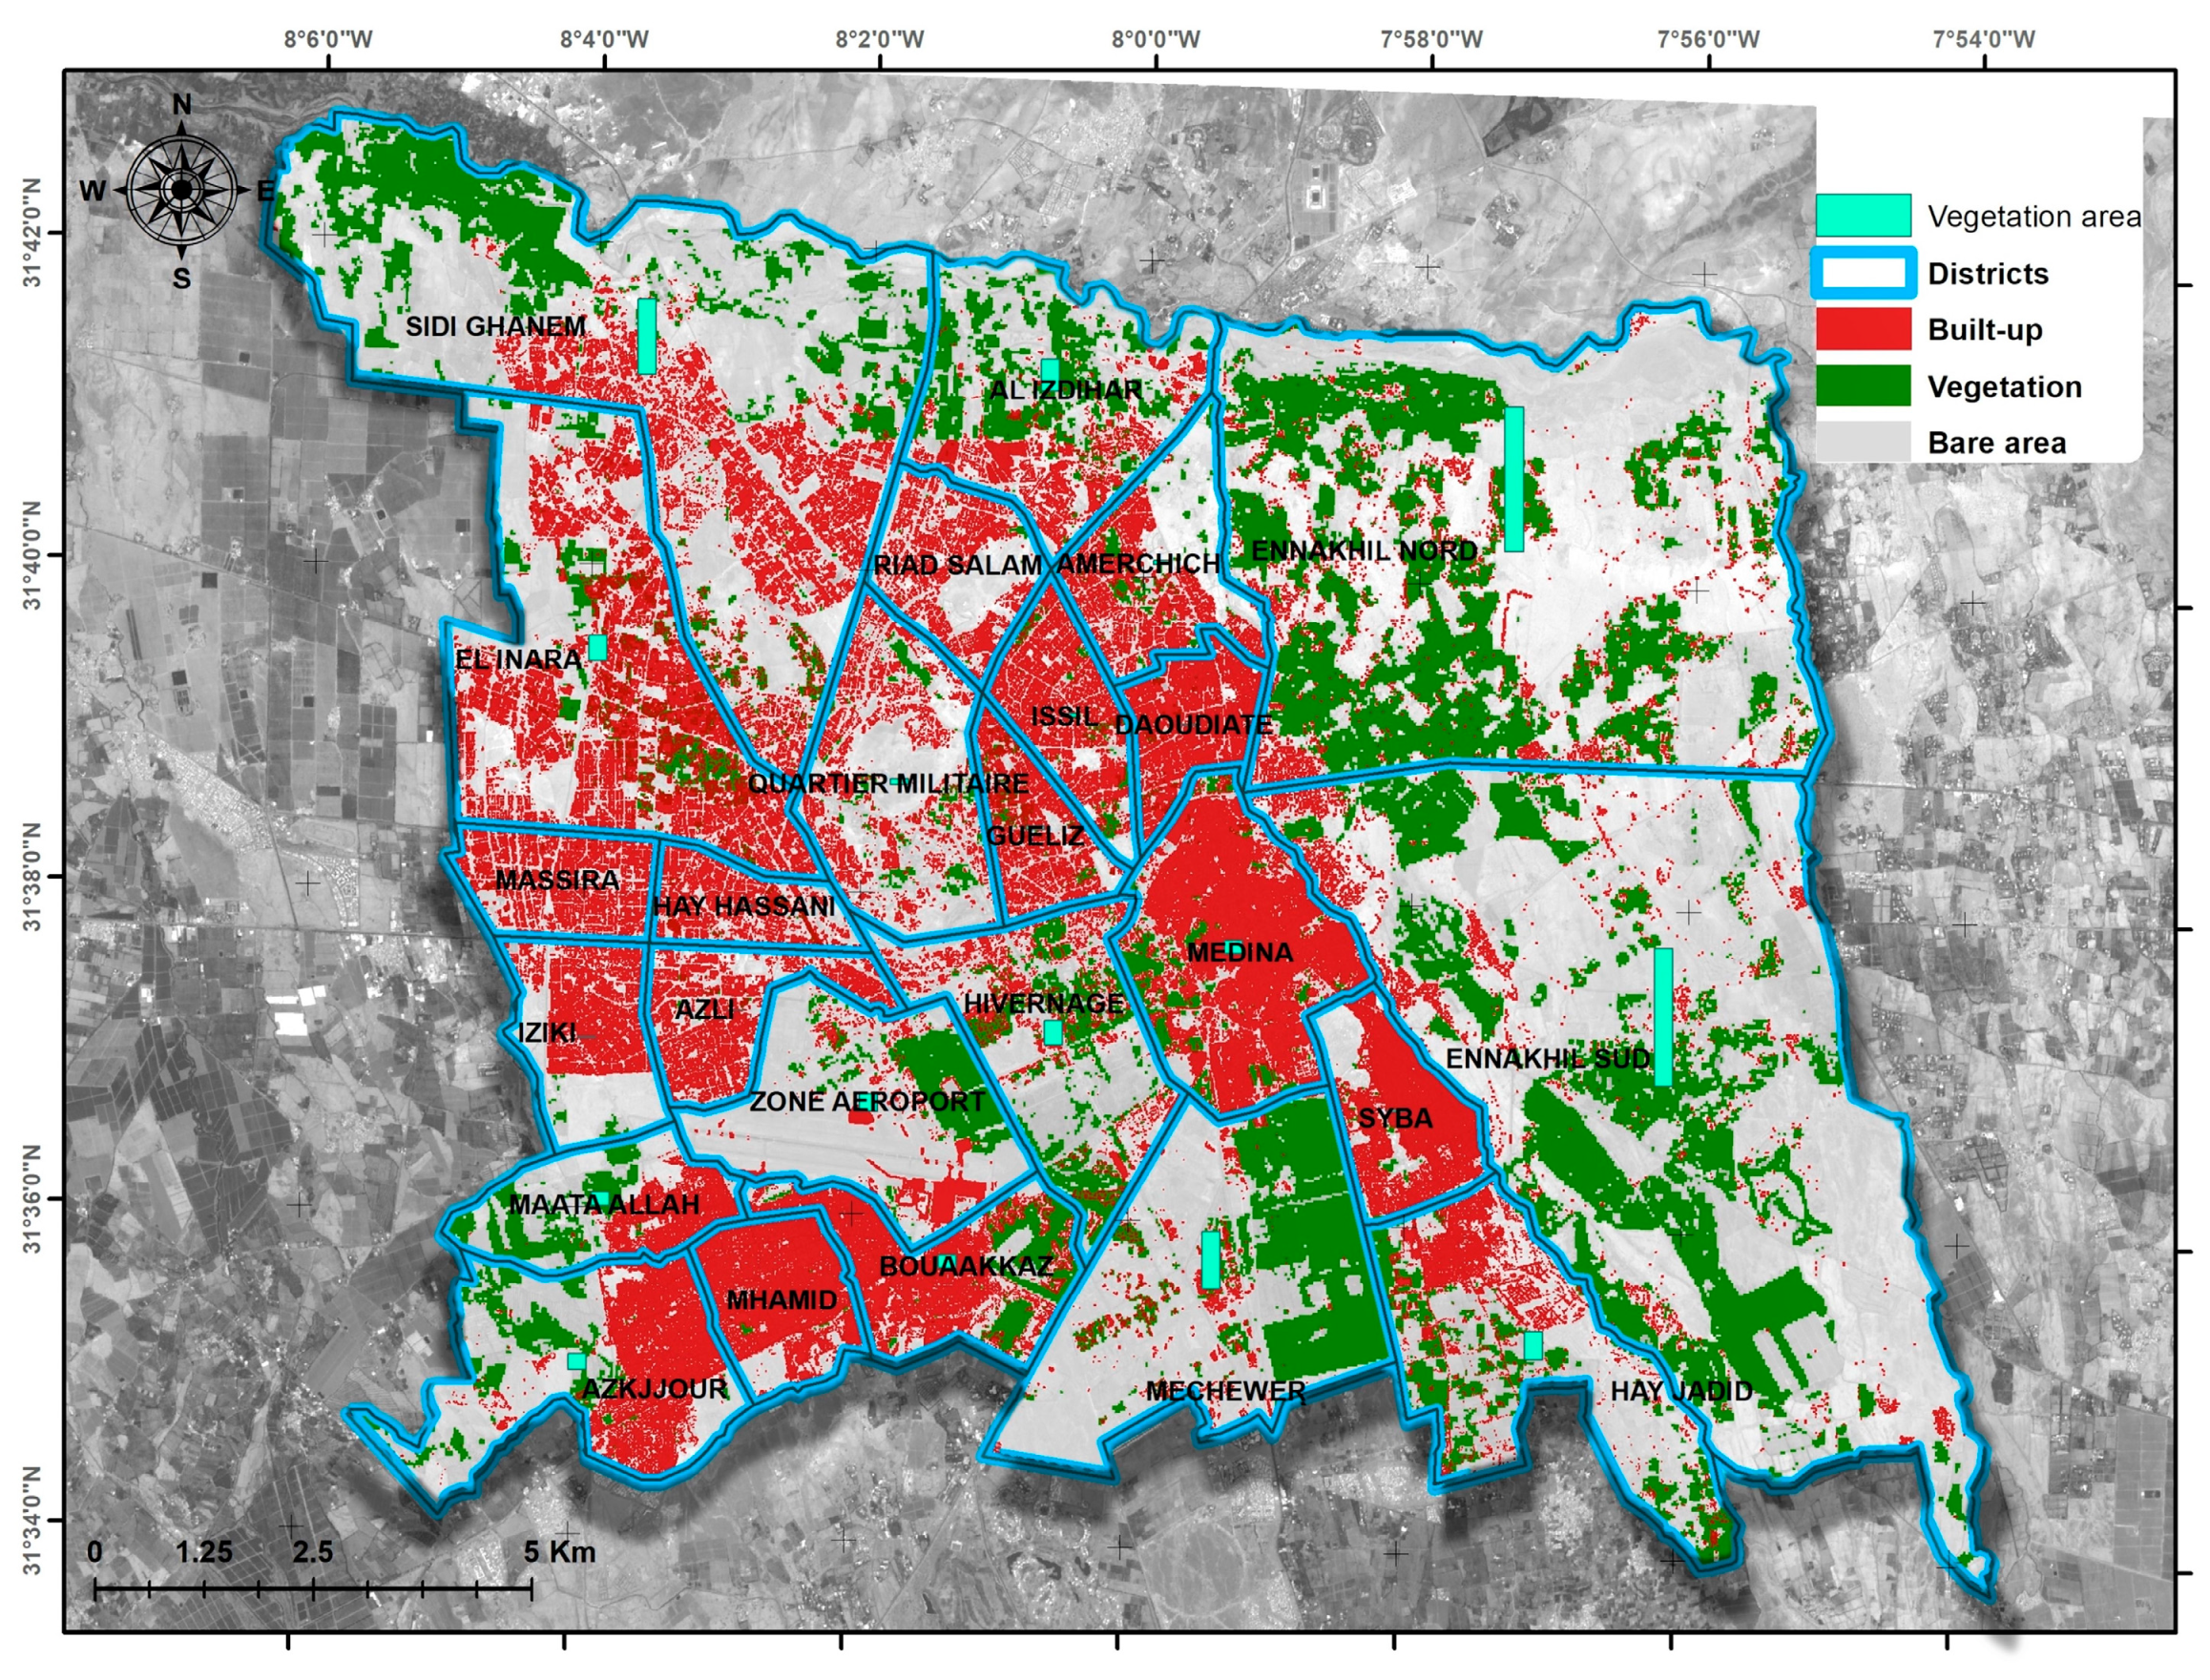
The Urban Community of Marrakesh has a surface area of 213.31 km2, where vegetation currently represents 43.32 km2 (20% of the total surface area), the built-up surface area 39.99 km2 (19% of the total surface area) and the remaining 130 km2 (61%) represents bare areas (Figure 3).
As regards the total vegetation area, the Ennakhil North district has the largest vegetated area, with 995.67 ha. This district also has the second largest surface area (3217.13 ha) and large surfaces of bare ground (2074.11ha, ~65%). The Mhamid district has the lowest vegetated area with 2.04 ha, and almost the entire area is occupied by built-up area (209.75 ha, 68% of total area) and bare ground (95.20 ha, 31% of total area).
As regards the total built-up area, the Medina district is in first place, with an area of 460.09 ha, while the least built-up district is the Mechewer district (47.92 ha).
As regards vegetation density, the analysis of the variation in vegetation on a hexagon scale showed that the most densely vegetated district is Mechewer (33.54%), with a mean of 3.17 ha per 10 ha (hexagon), and it is also the district with the highest standard deviation (3.44 ha). The district with the lowest vegetation density is the Mhamid district (0.66%), with 0.077 ha per 10 ha (hexagon).
Built-up surface density also varies greatly. The Daoudiate district is the densest one in terms of construction, with a percentage of approximately 72%, equivalent to 6.93 ha per 10 ha. The least dense district is Ennakhil Sud (4%), equivalent to 6.38 ha per 10 ha.
4.2. Spatial Variation of LST and NDVI
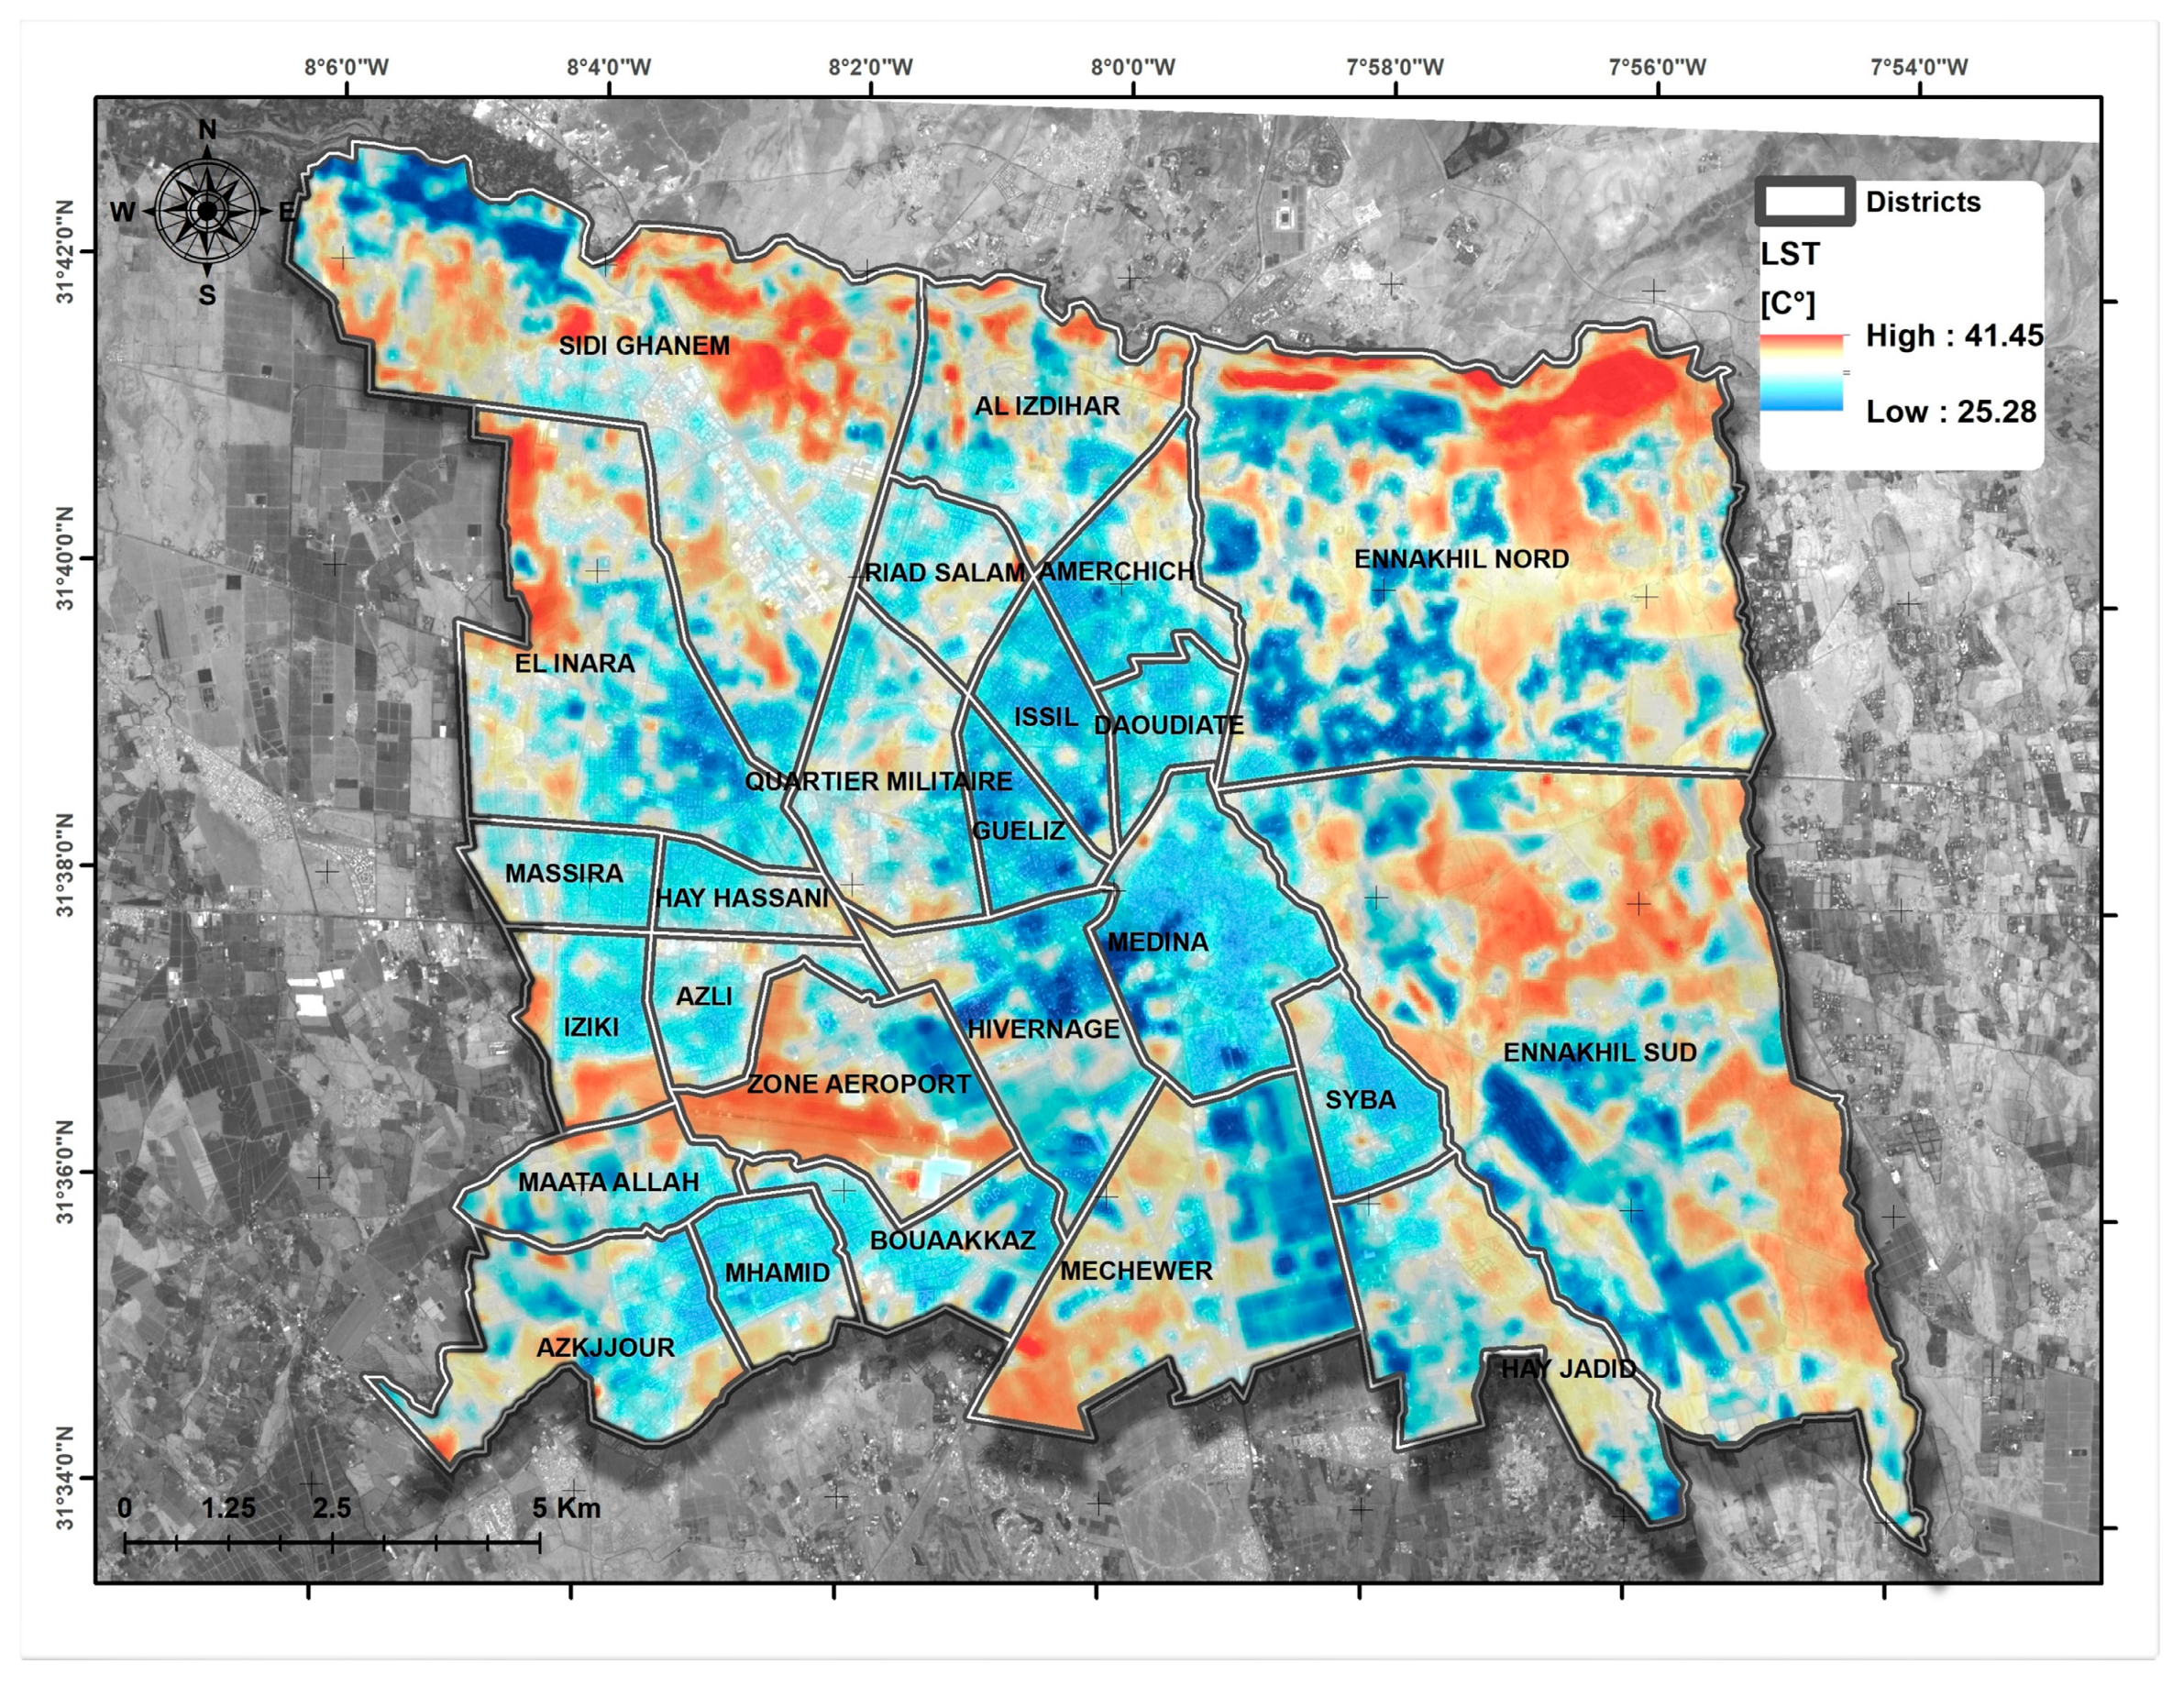
Figure 4 displays the spatial variation in land surface temperature in the study area. A minimum surface temperature of 25.28 °C was recorded at the water basins used for irrigation, which are located in the Menara and Agdal gardens, and the maximum was 41.45 °C recorded in the large area of bare ground located in the northeastern part of Marrakesh. The range was 16.17 °C, the mean was 33.90 °C and the standard deviation was 2.55 °C.
We can see that the highest temperatures were recorded on bare soils, and the temperatures were medium to low in built-up areas and low in vegetated areas.
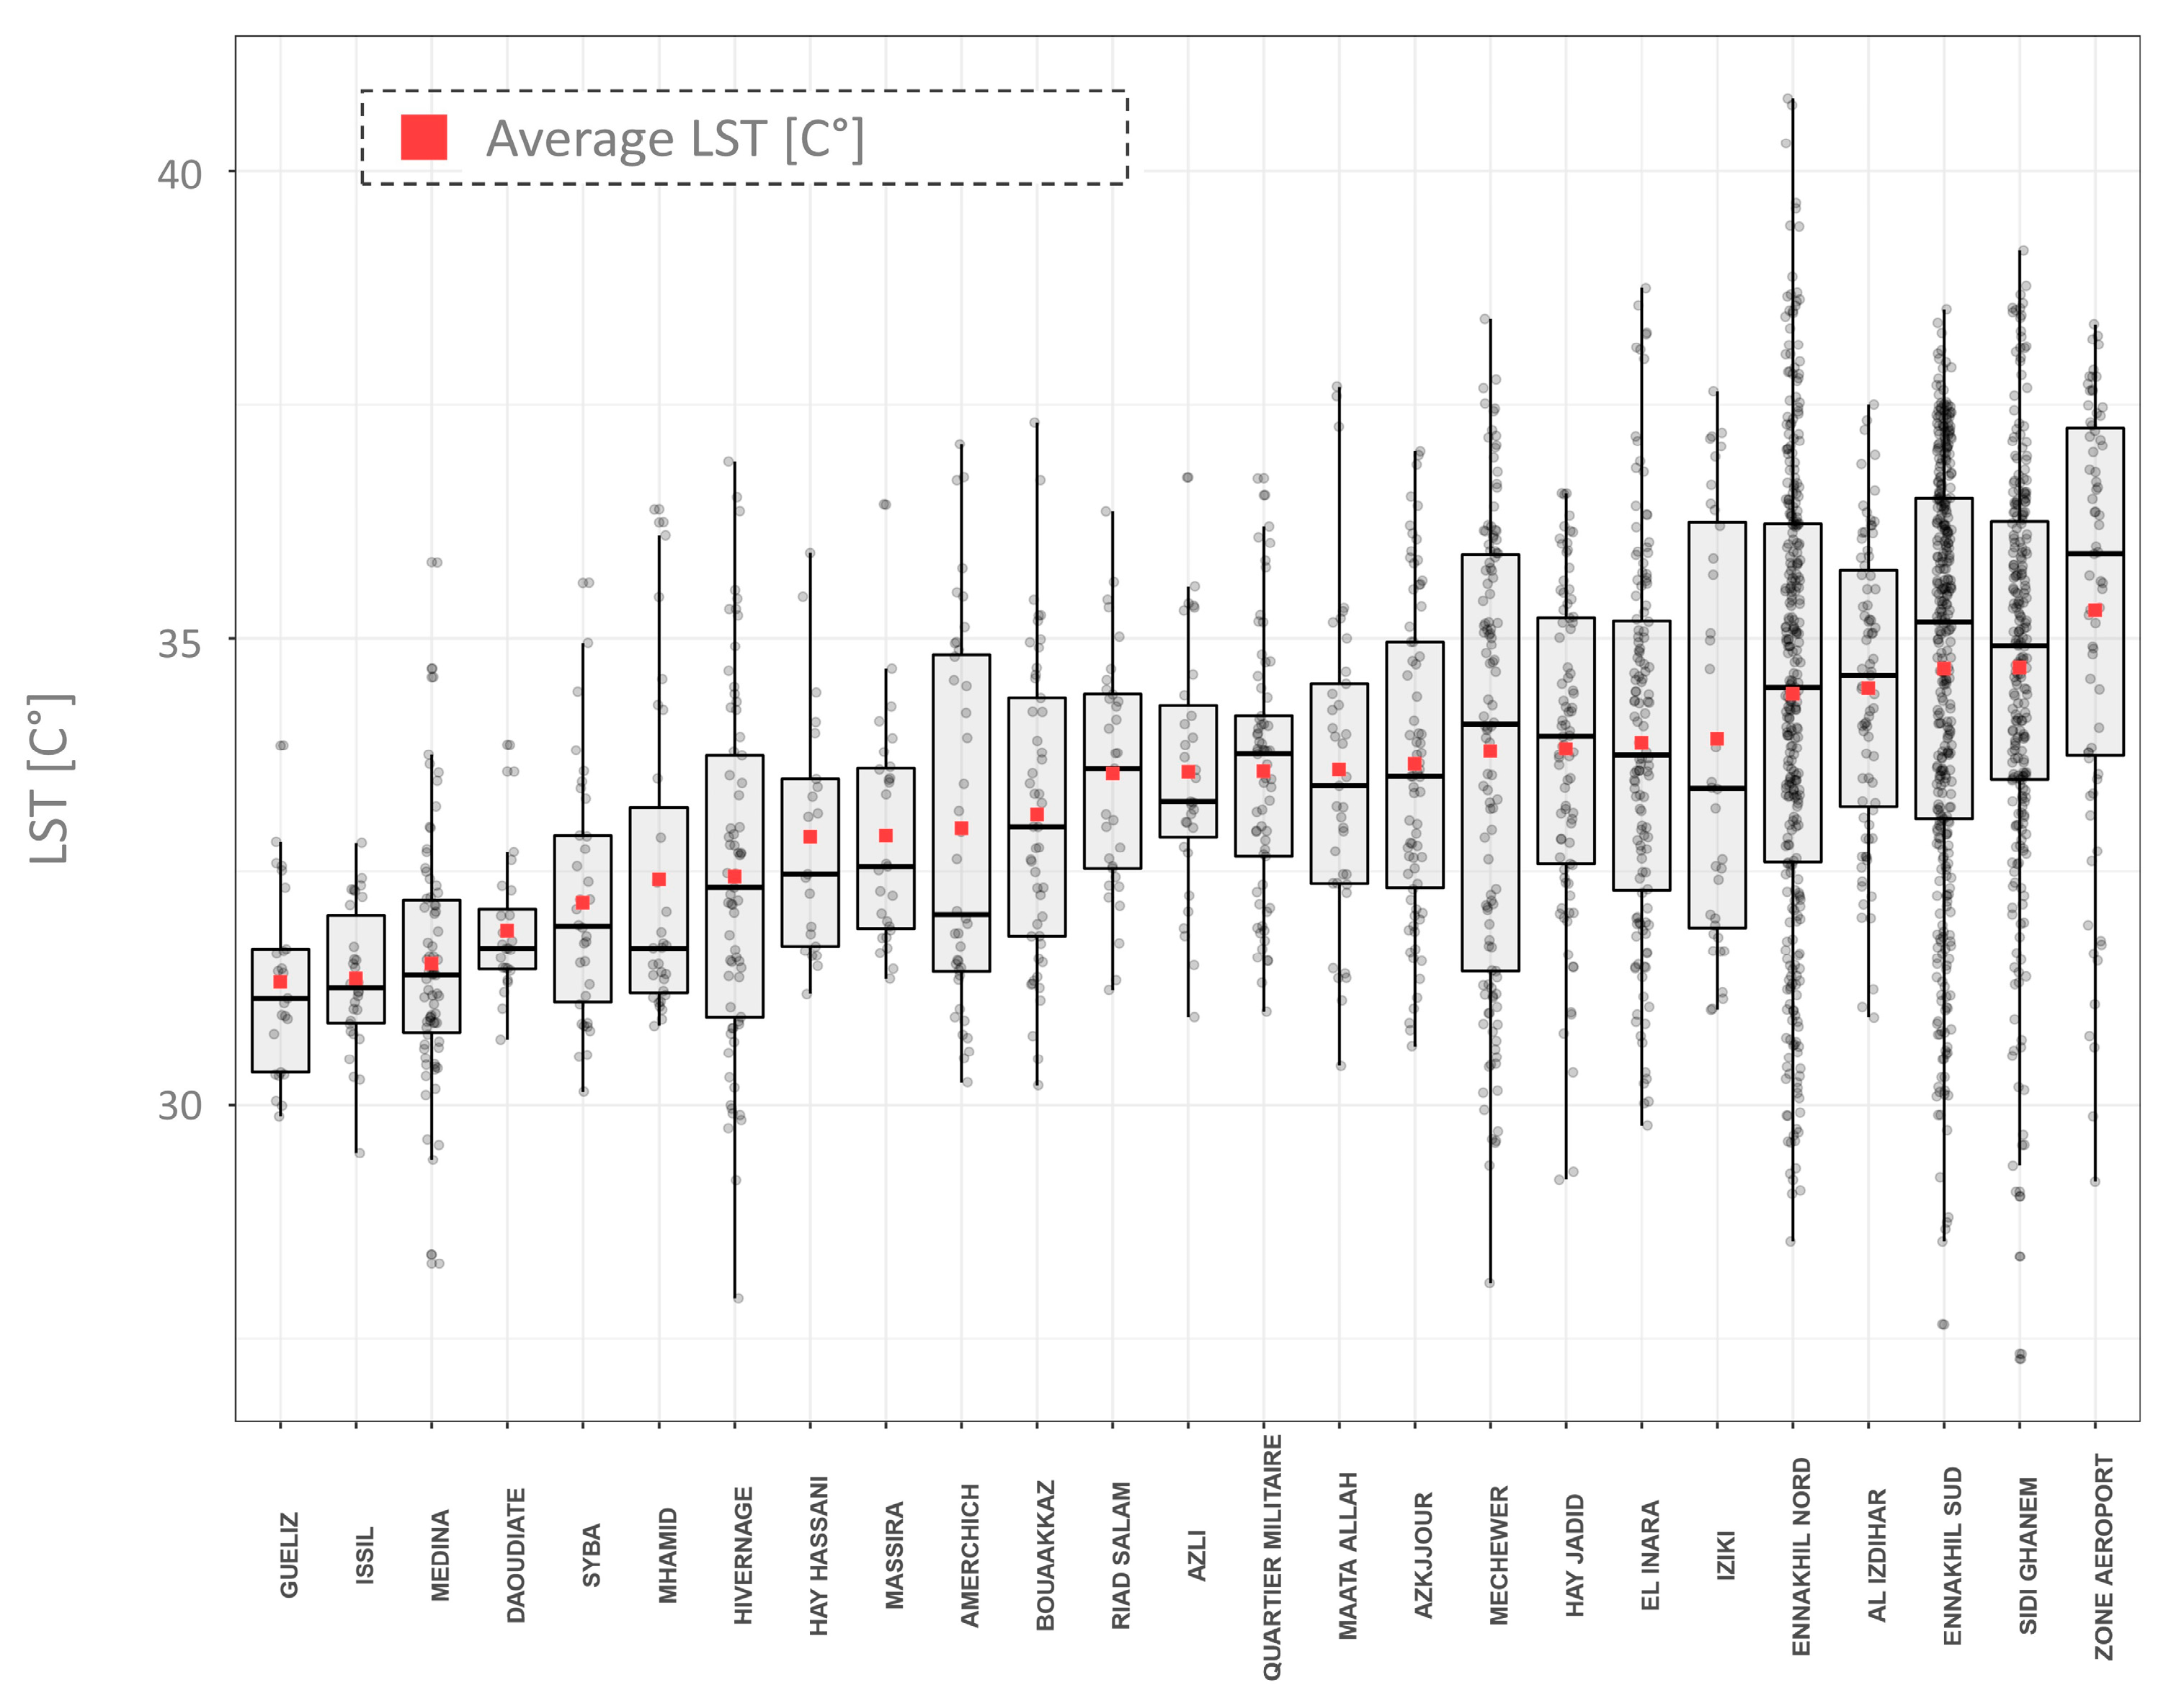
At the level of the districts (Figure 5), the highest mean LST was observed at Zone Airport with a mean of 35.30 °C (std = 2.33 °C), the lowest mean at Guéliz with a mean of 31.31 °C (std = 1.02 °C) and the highest LST standard deviation was observed at Ennakhil North with std = 2.52 °C.
Concerning the NDVI, essentially related to the density, type and health of the vegetation, the Ennakhil North district had the highest average (NDVI = 0.15), and the Mhamid district recorded the lowest average (NDVI = 0.07).
4.3. Relationship between LST, NDVI, Bare Areas, Vegetated Areas and Built-Up Areas
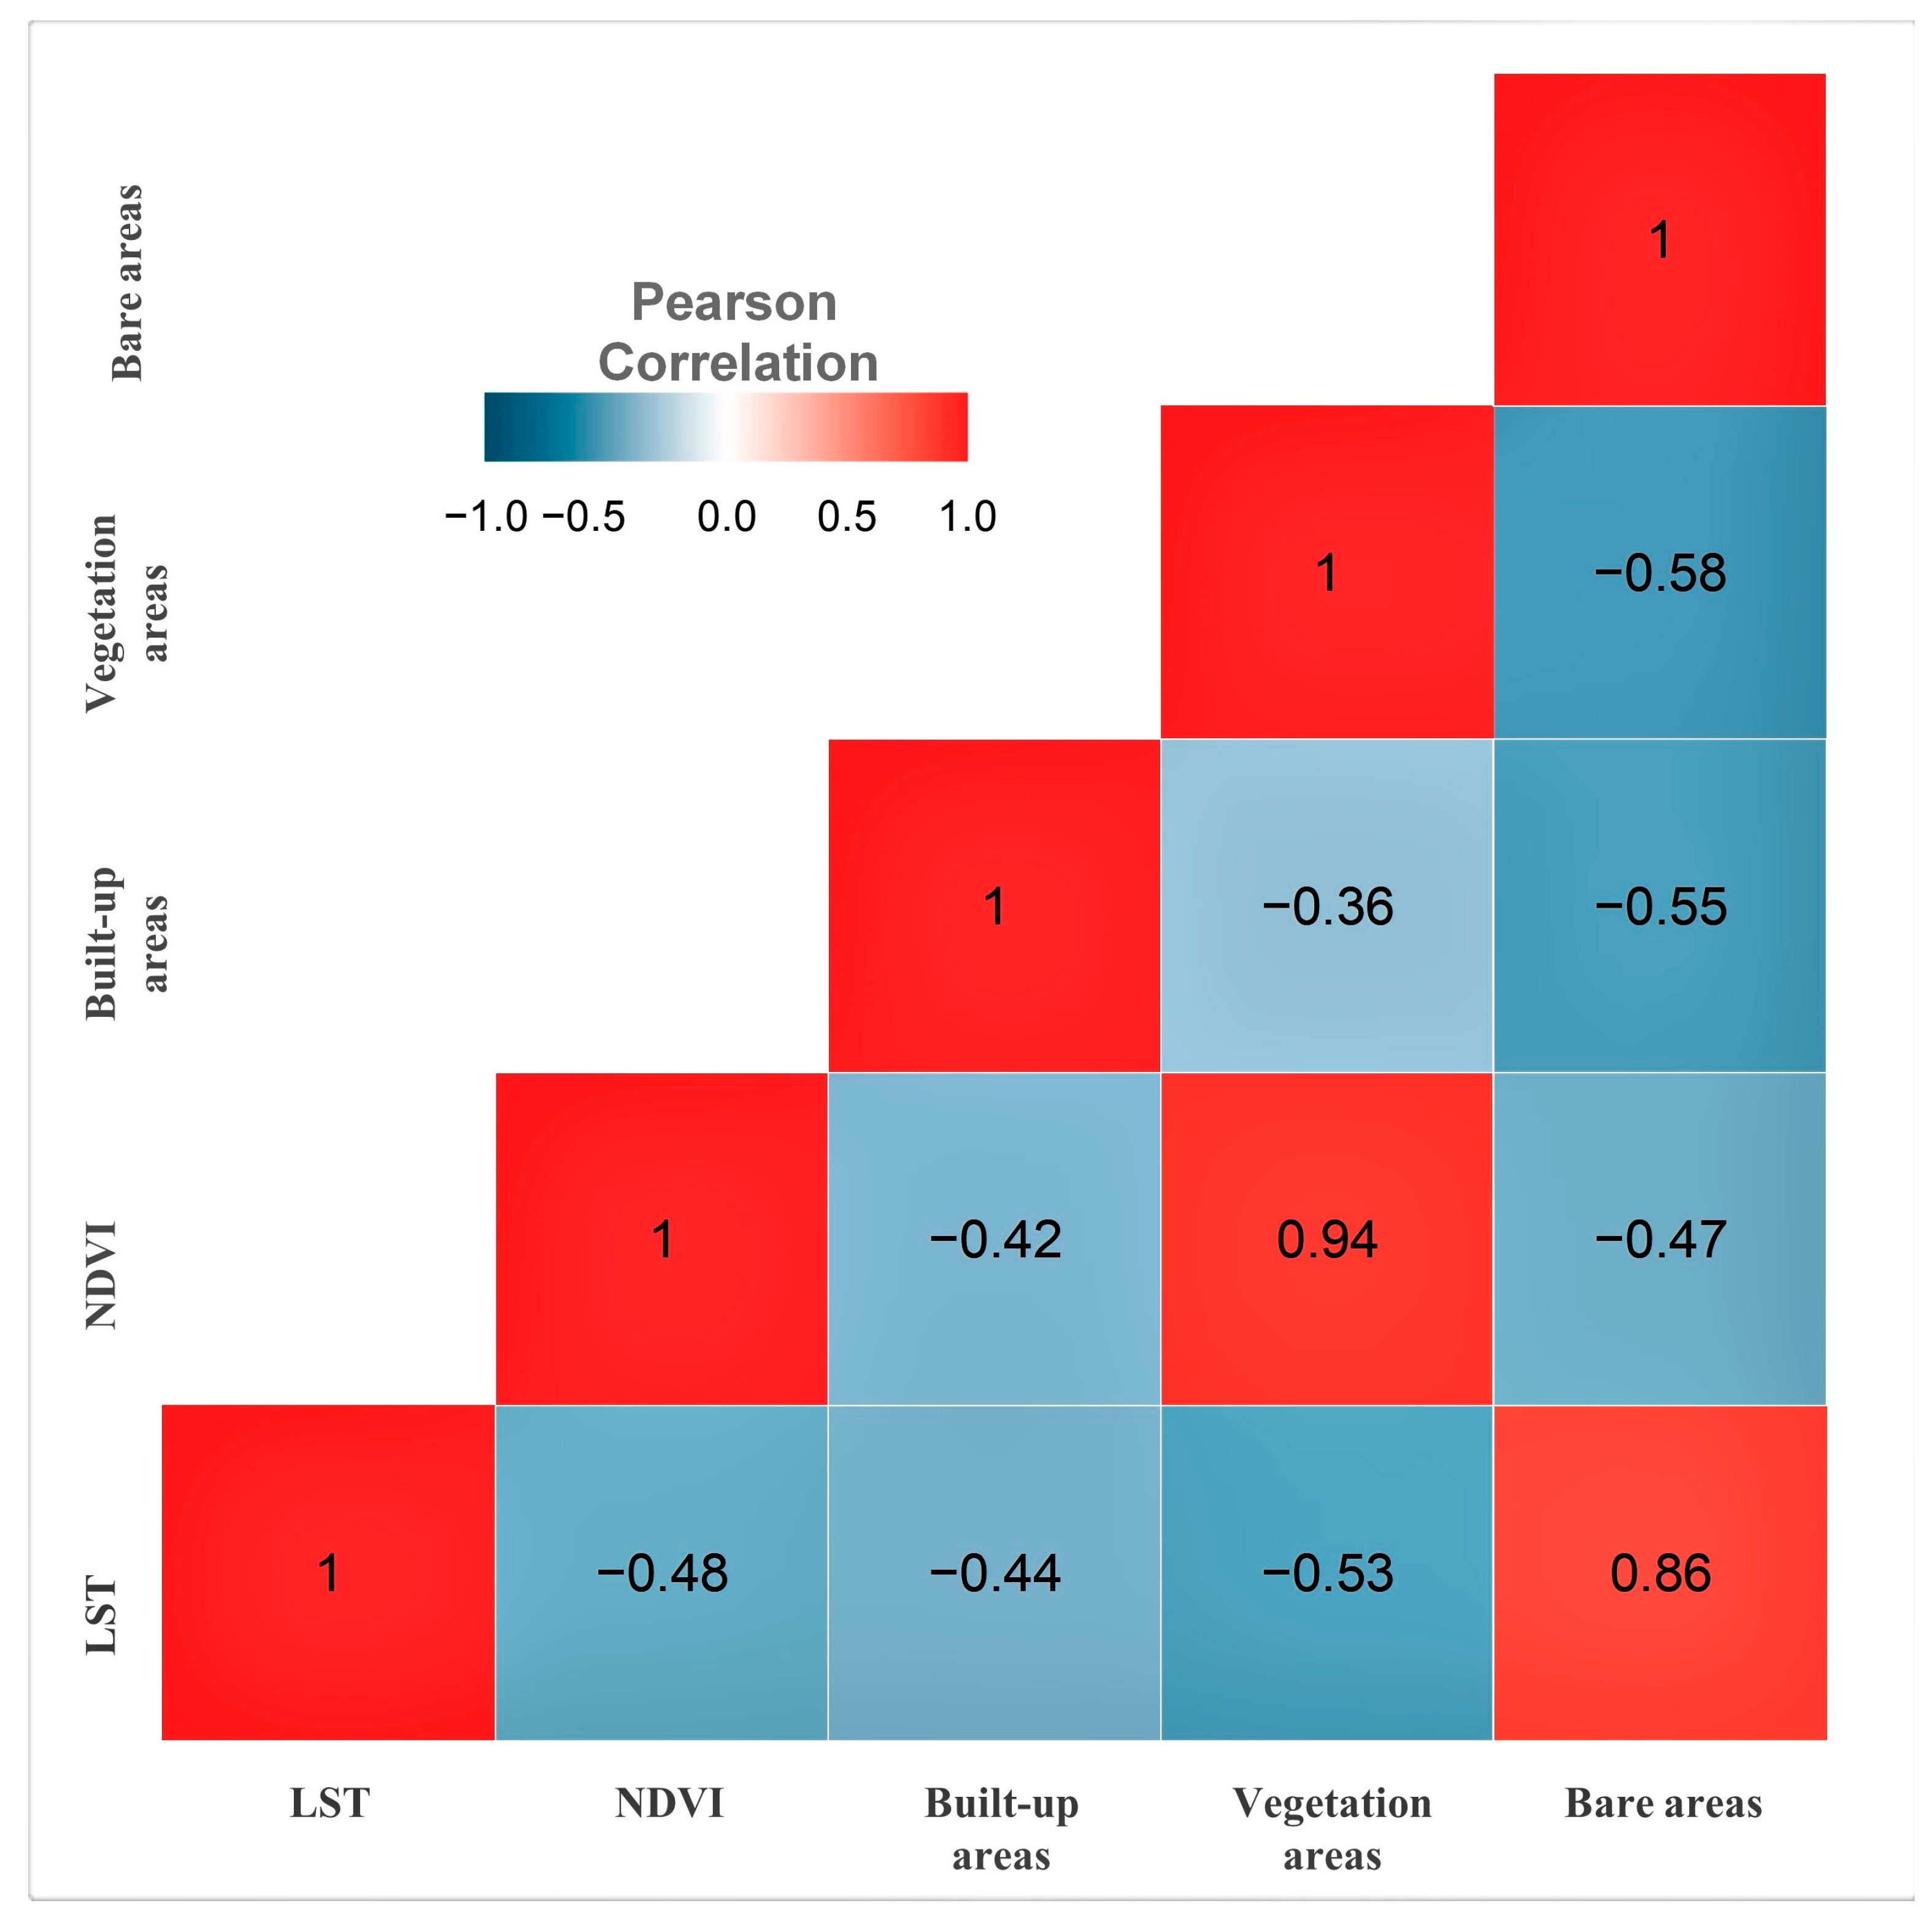
Figure 6 shows the heat map of the correlation matrix of the different factors studied, and the correlation is made by studying LST, NDVI, bare area, vegetated area and built-up area for each hexagon. According to the heat map, NDVI had a close relationship with vegetation, with a very high positive correlation index of r = 0.94, which proves that the NDVI calculation processes are correct. The second strongest correlation was between LST and bare area, with a positive correlation coefficient of r = 0.86, which implies that the more soil ground there is, the higher the ground temperature will be. The correlation between LST and NDVI and vegetation areas showed negative mean values of r = −0.48 and r = −0.53, respectively, and, notably, of r = −0.44 with built-up areas.
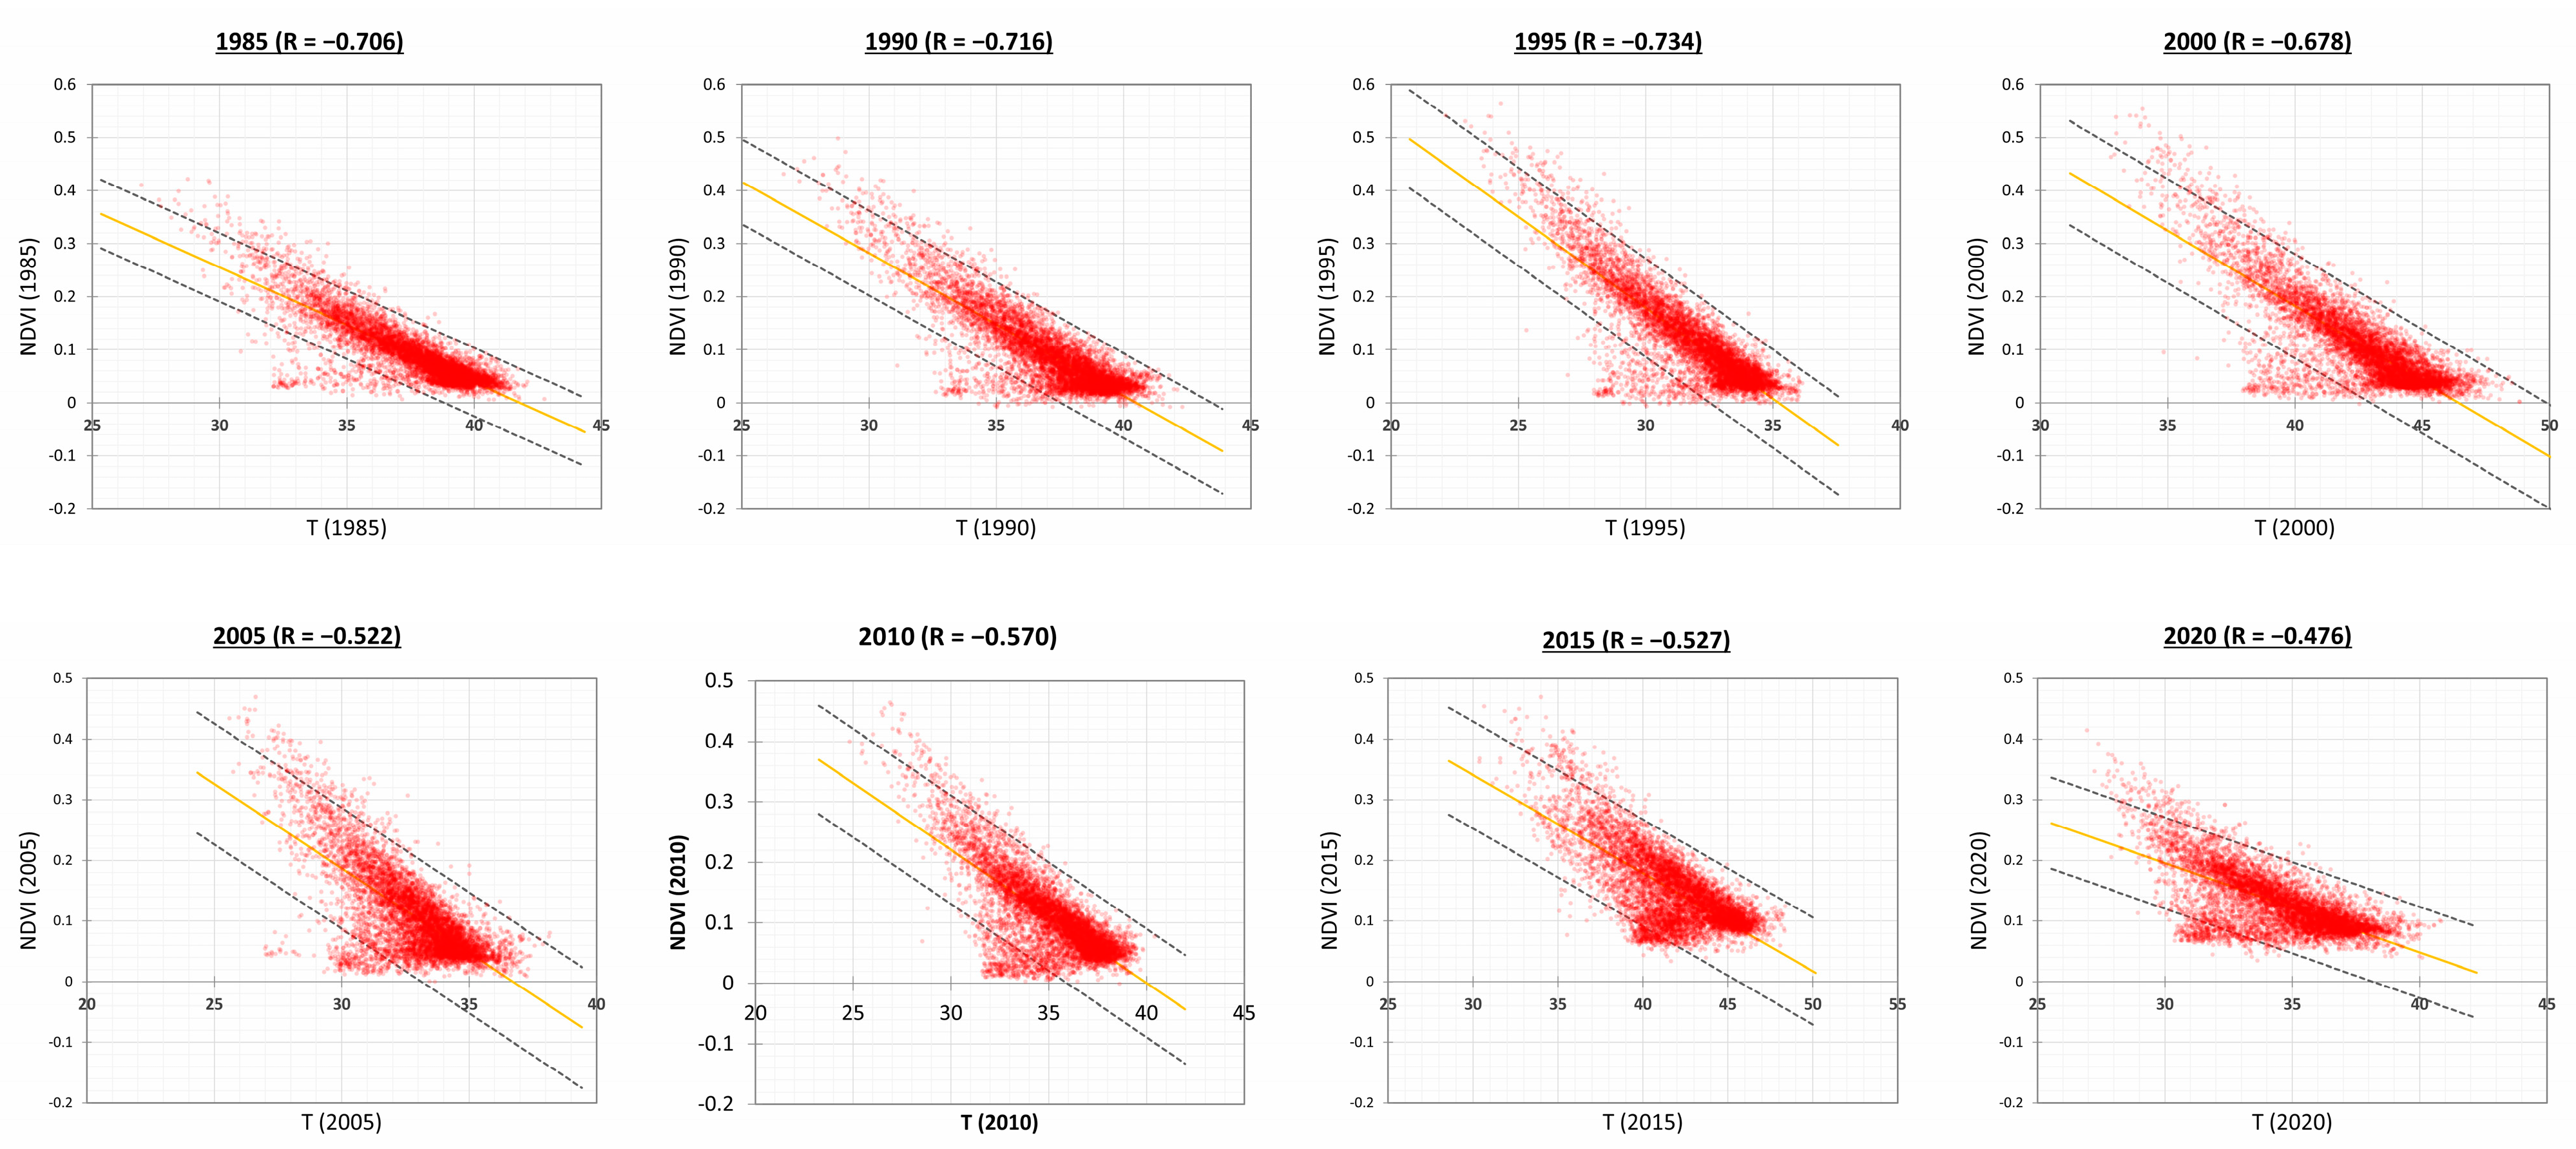
4.4. Relationship between LST and NDVI from 1985 to 2020
In order to have more detailed information on the relationship between NDVI and LST, we tracked these two indices over time (Figure 7). In 1985, a strong negative correlation of r = −0.71 was observed, and by 2020, this correlation had decreased significantly, to r = −0.48. The correlation between NDVI and LST is getting weaker over the years, which could be explained by the change in land use of some hexagons from bare or vegetated areas to built-up areas. This change in land use has resulted in hexagons with medium to low LST and low NDVI, which is mainly due to the fact that built-up areas have a different NDVI than bare and vegetated areas.
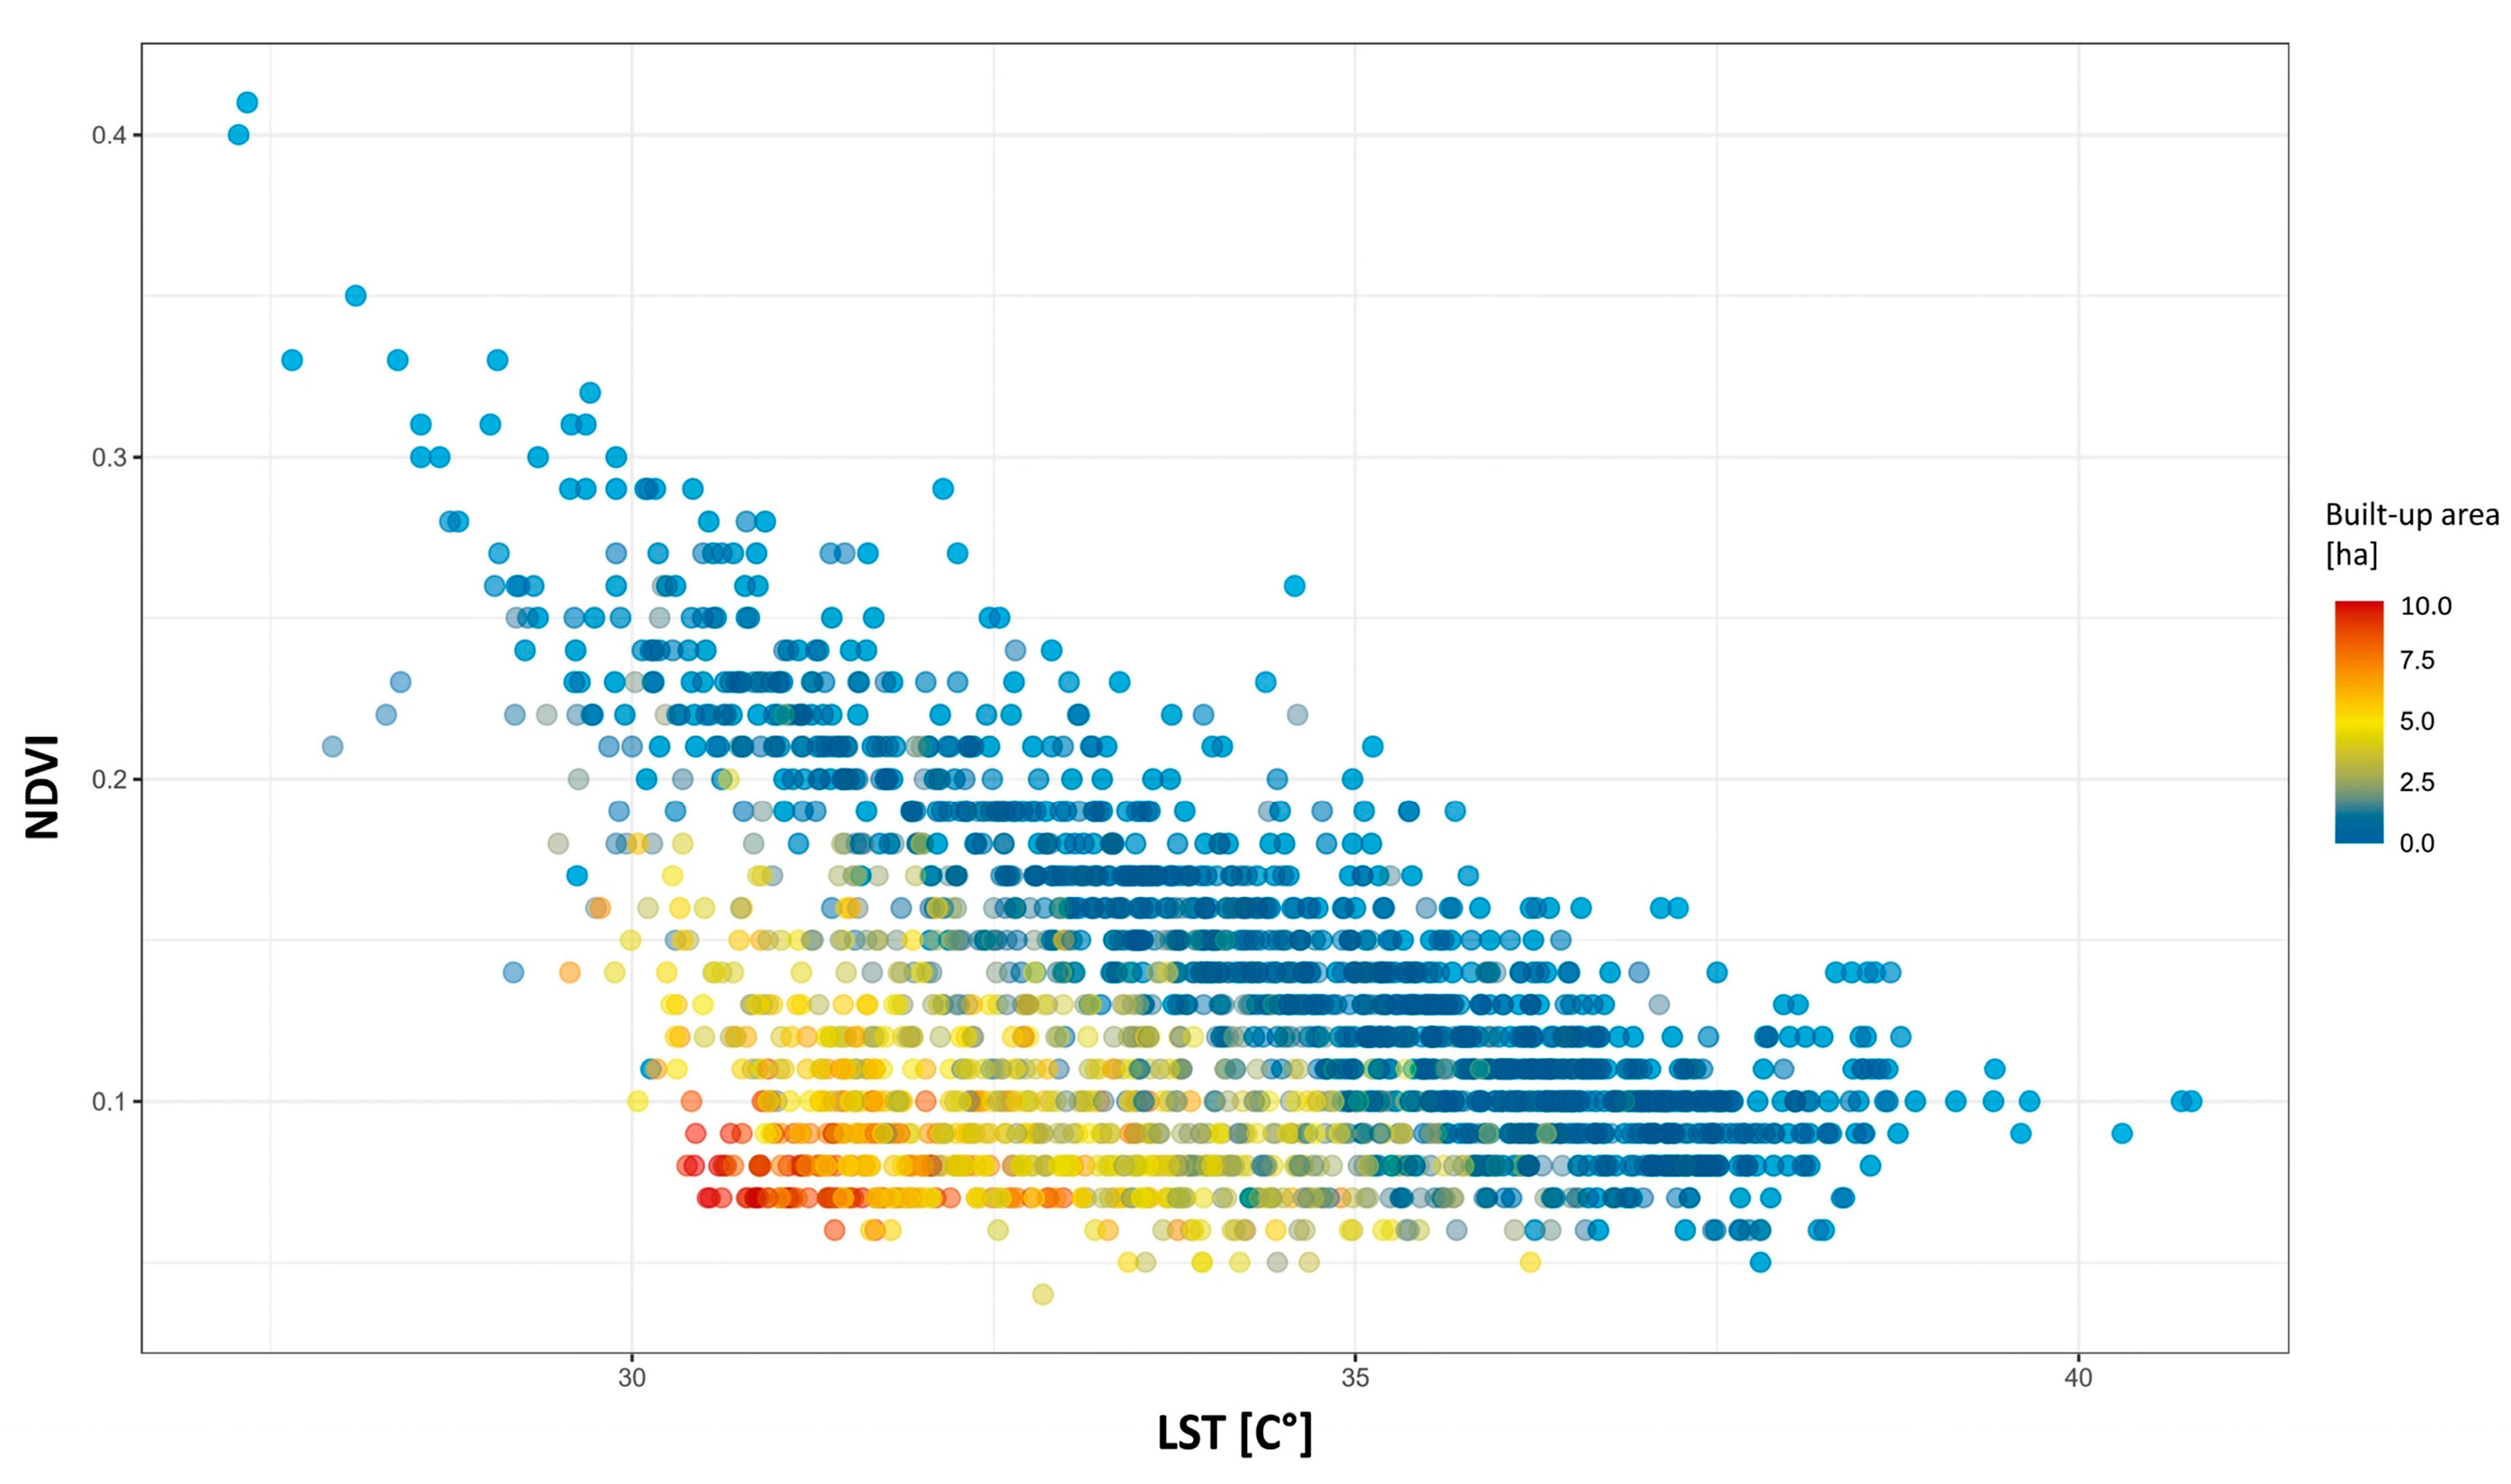
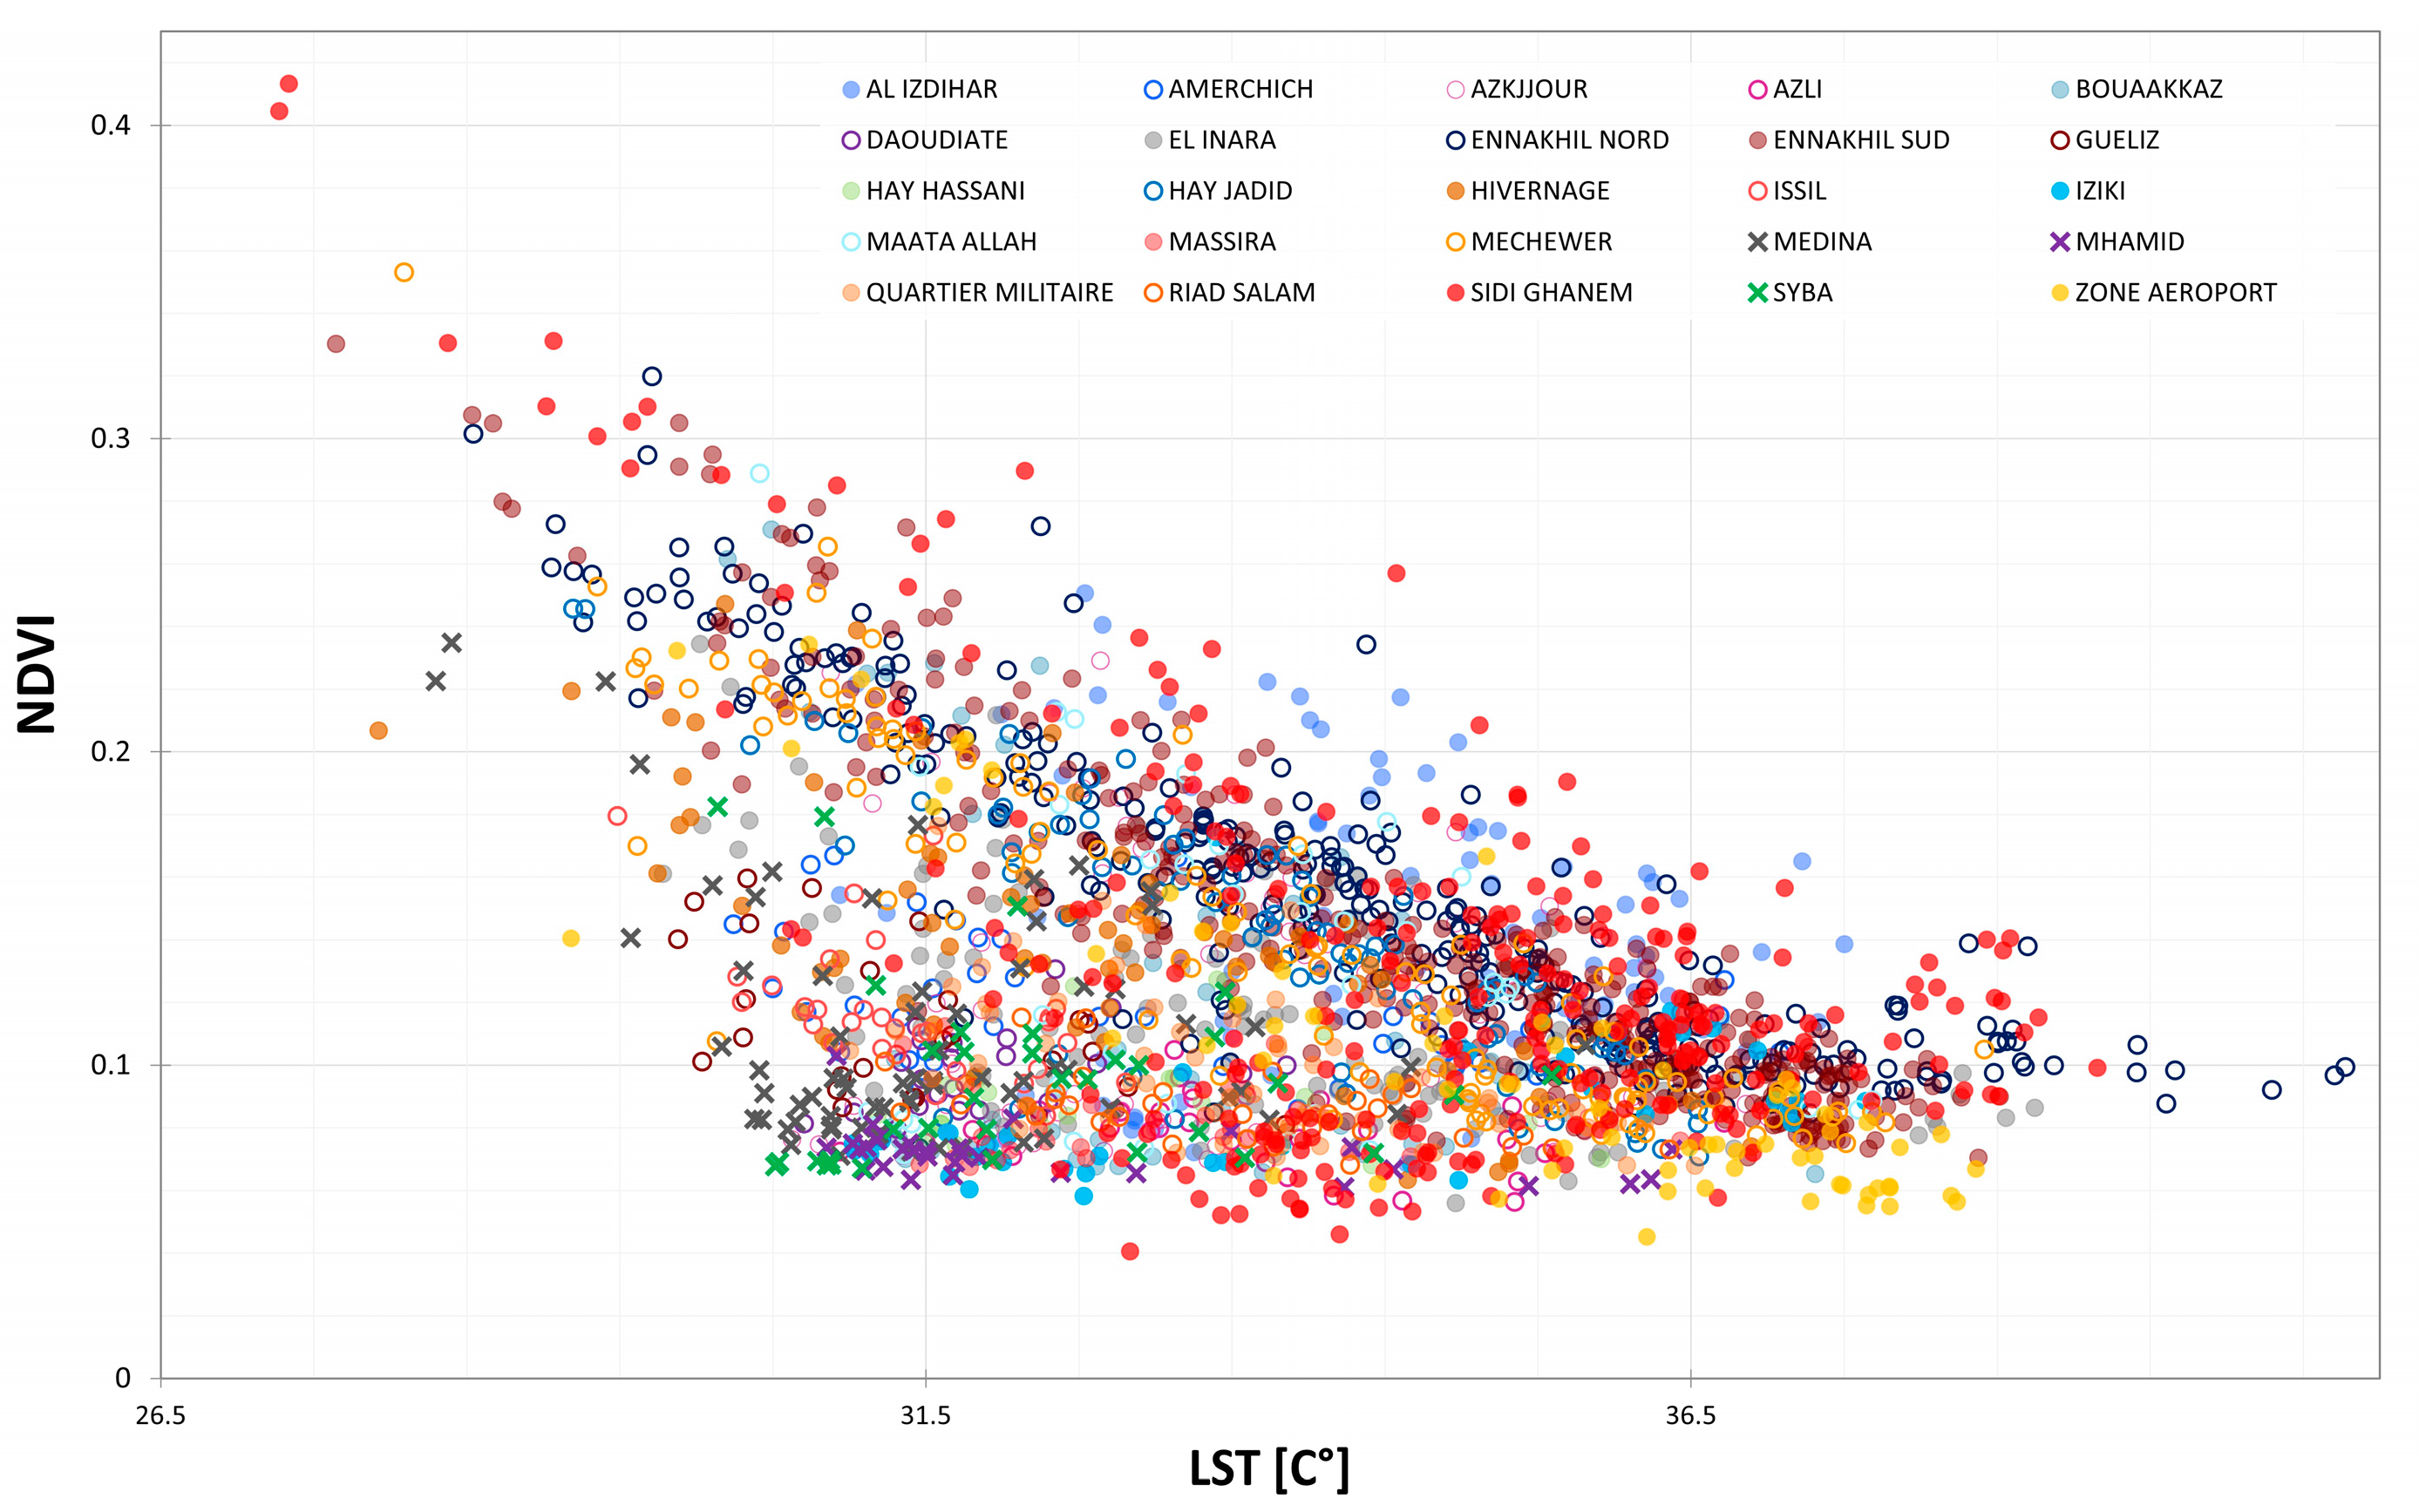
On the other hand, the detailed analysis of the relationship between LST and NDVI (Figure 8 and Figure 9) for the year 2020 shows that the hexagons experiencing significant change and with a low mean LST index and a low NDVI index are hexagons with very high urbanisation (>60%), such as SYBA, Mhamid and Medina.
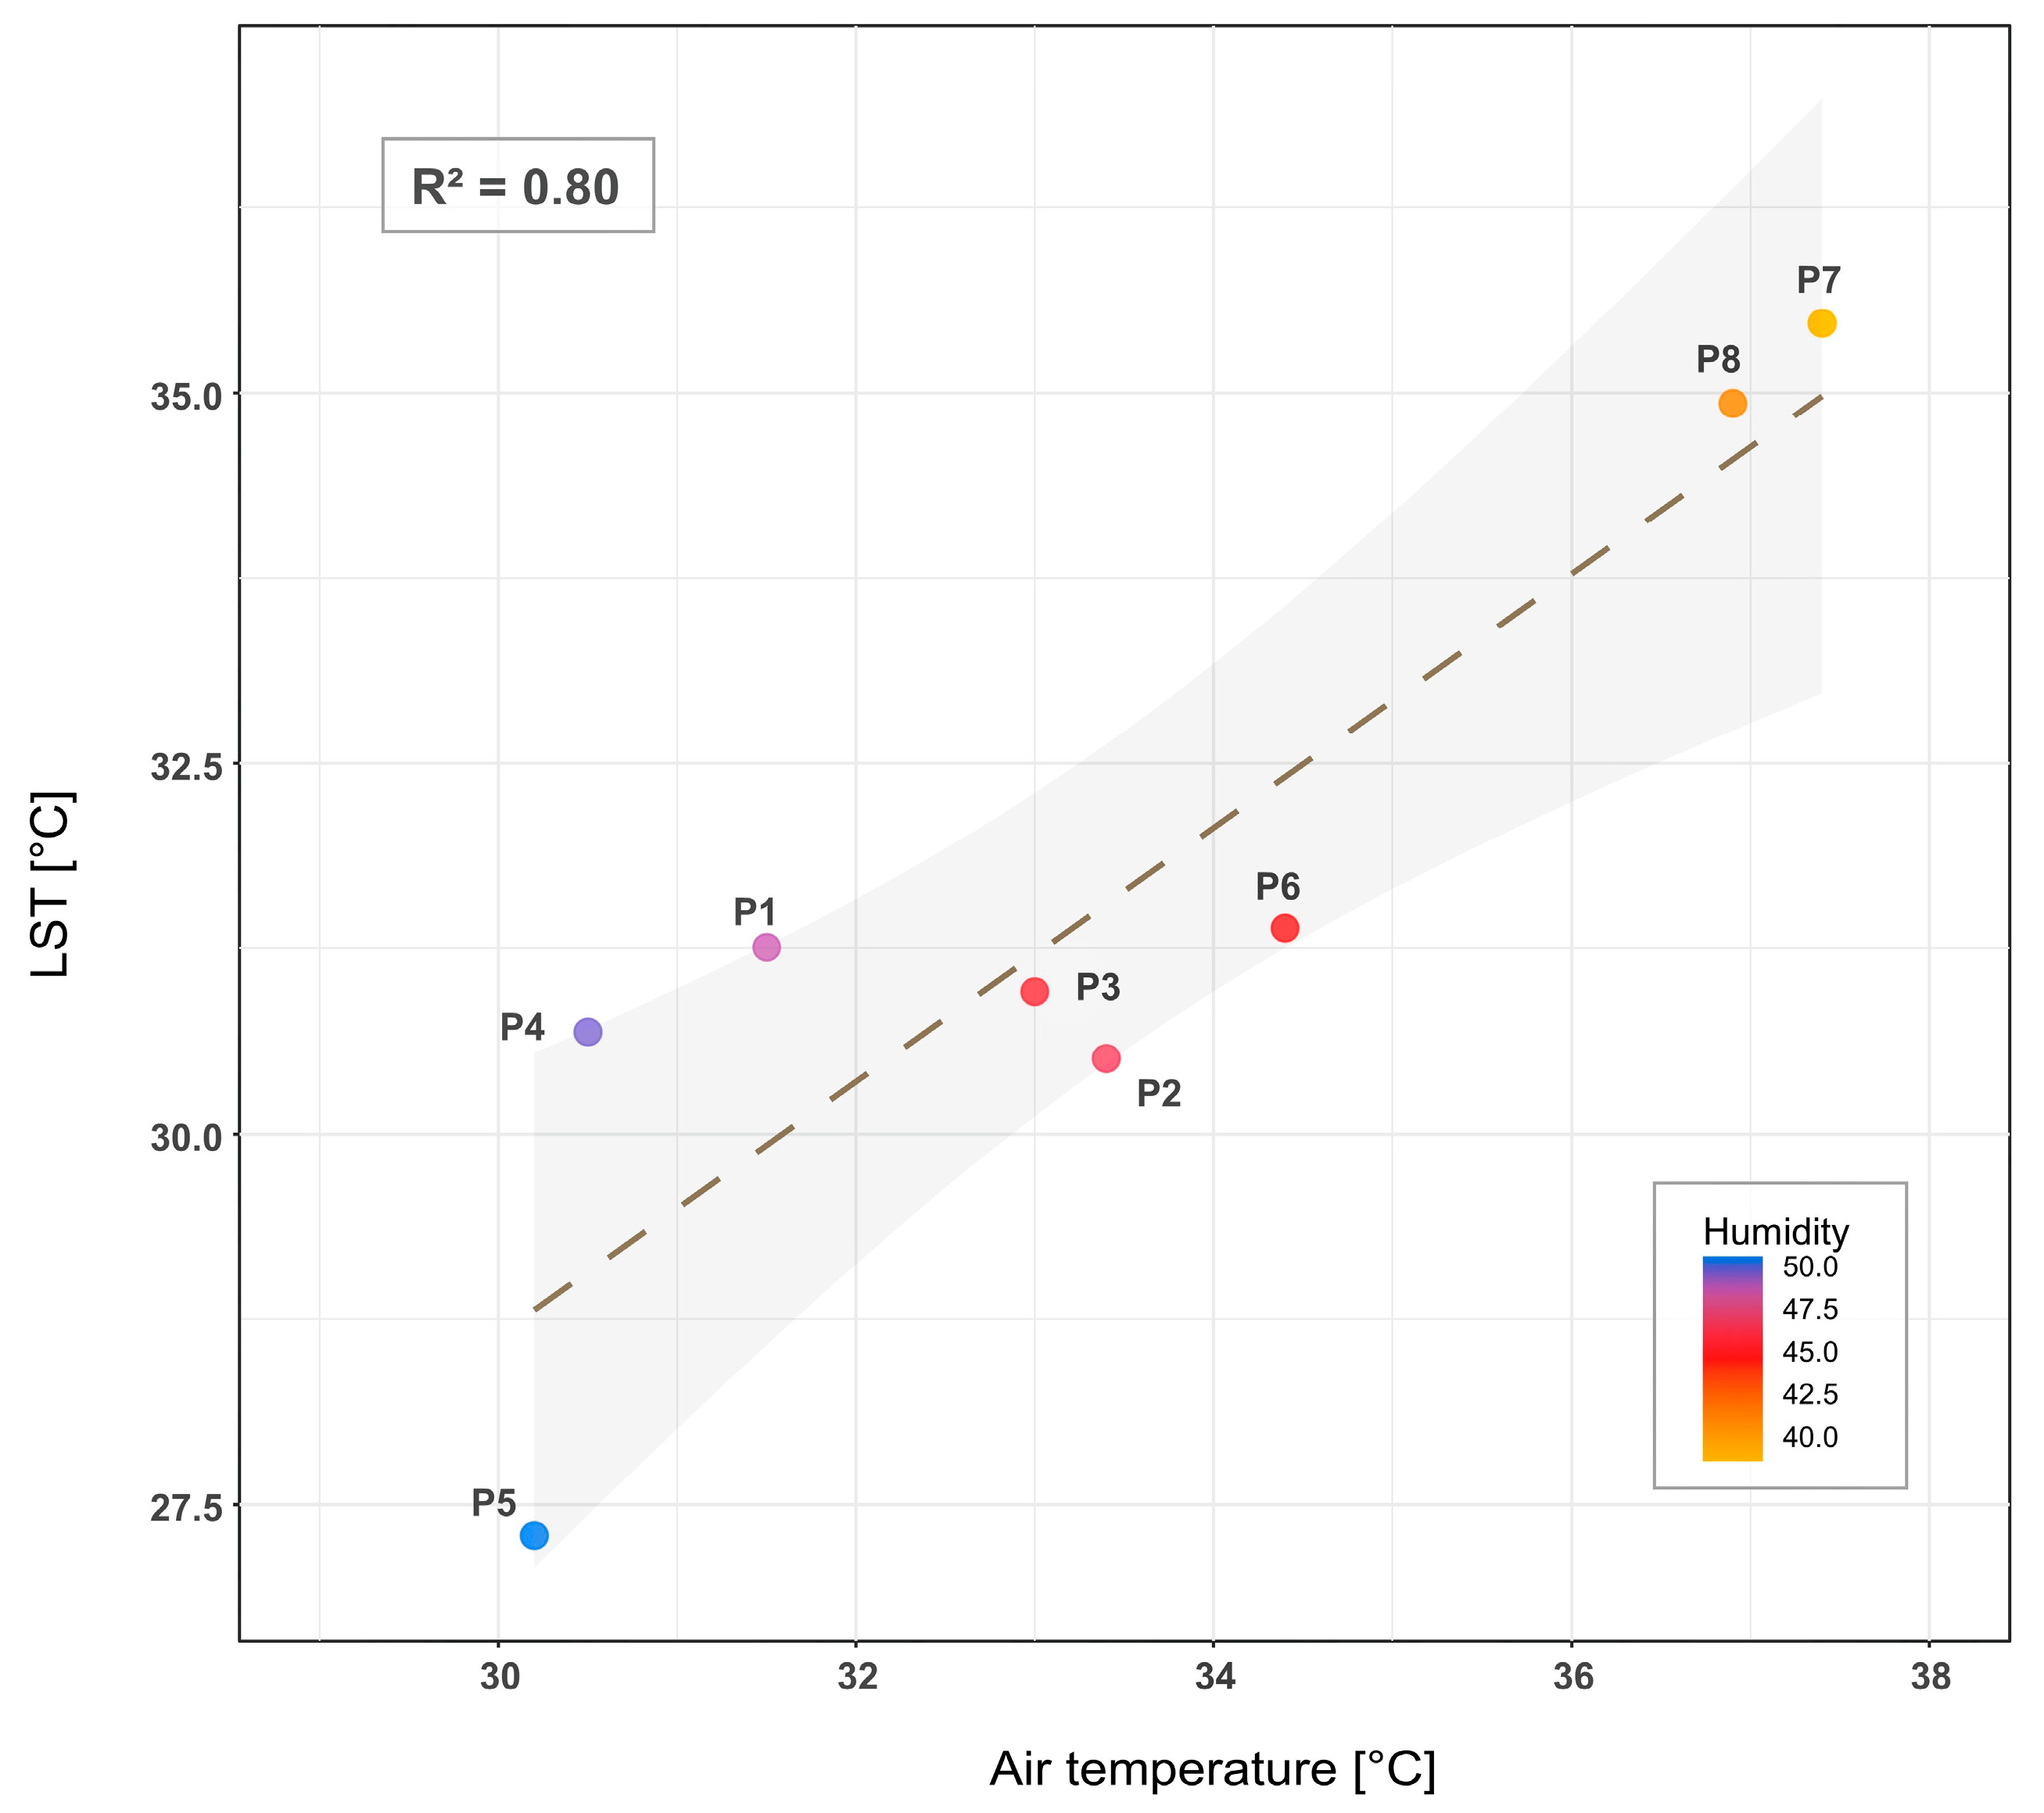
4.5. Relationship between Observed Air Temperature and LST
The results of measurement of air temperatures (Table 1) show that the point P5, characterizing a typical green space in the Guéliz district, recorded the lowest temperature (30.20 °C). The highest value is recorded at the point P7, characterizing a bare area from Riad Salam district (37.4 °C). It should be noted that the point characterizing Agdal (P2), with sparse vegetation—mainly olive trees—has recorded relatively medium air temperatures (33.4 °C), while it was expected to have a lower value. On the other hand, the sample taken in the Medina district (P4), with old buildings, recorded the second lowest temperature (30.5 °C), while the sample taken in the industrial buildings in the Sidi Ghanem district (P8) recorded the second highest temperature (36.9 °C).
The comparison between air temperature-observed data with the simulated data of the land surface temperature LST (Figure 10) shows a very high coefficient of determination (R2 = 0.8), which explains the close relationship and the connection between them. These two factors are also connected to the air humidity: the higher the temperature the lower the humidity, and vice versa.
5. Discussion
Understanding the factors that minimise the adverse effects of UHI is important in the global context of climate change and the increasing frequency of heat waves.
5.1. Relationship LST, Vegetation, Urban and Bares Areas
The vegetation is recognised as being able to attenuate the urban warming effect, since plants use part of the energy absorbed for vital processes and then cool the environment and the surrounding air by producing shade and releasing water vapour [32].
Therefore, the NDVI is widely used as a proxy for monitoring vegetation health and abundance [43,44,45]. In Marrakesh, the high negative relationship found between NDVI and LST suggests that green areas in the city can help mitigate the SUHI effect. Areas with high NDVI values and relatively healthy and dense vegetation such as grass or woodlands generally have the lowest temperatures. Medium NDVI values represent unhealthy and degraded green areas, and the lowest NDVI values represent bare ground without vegetated areas.
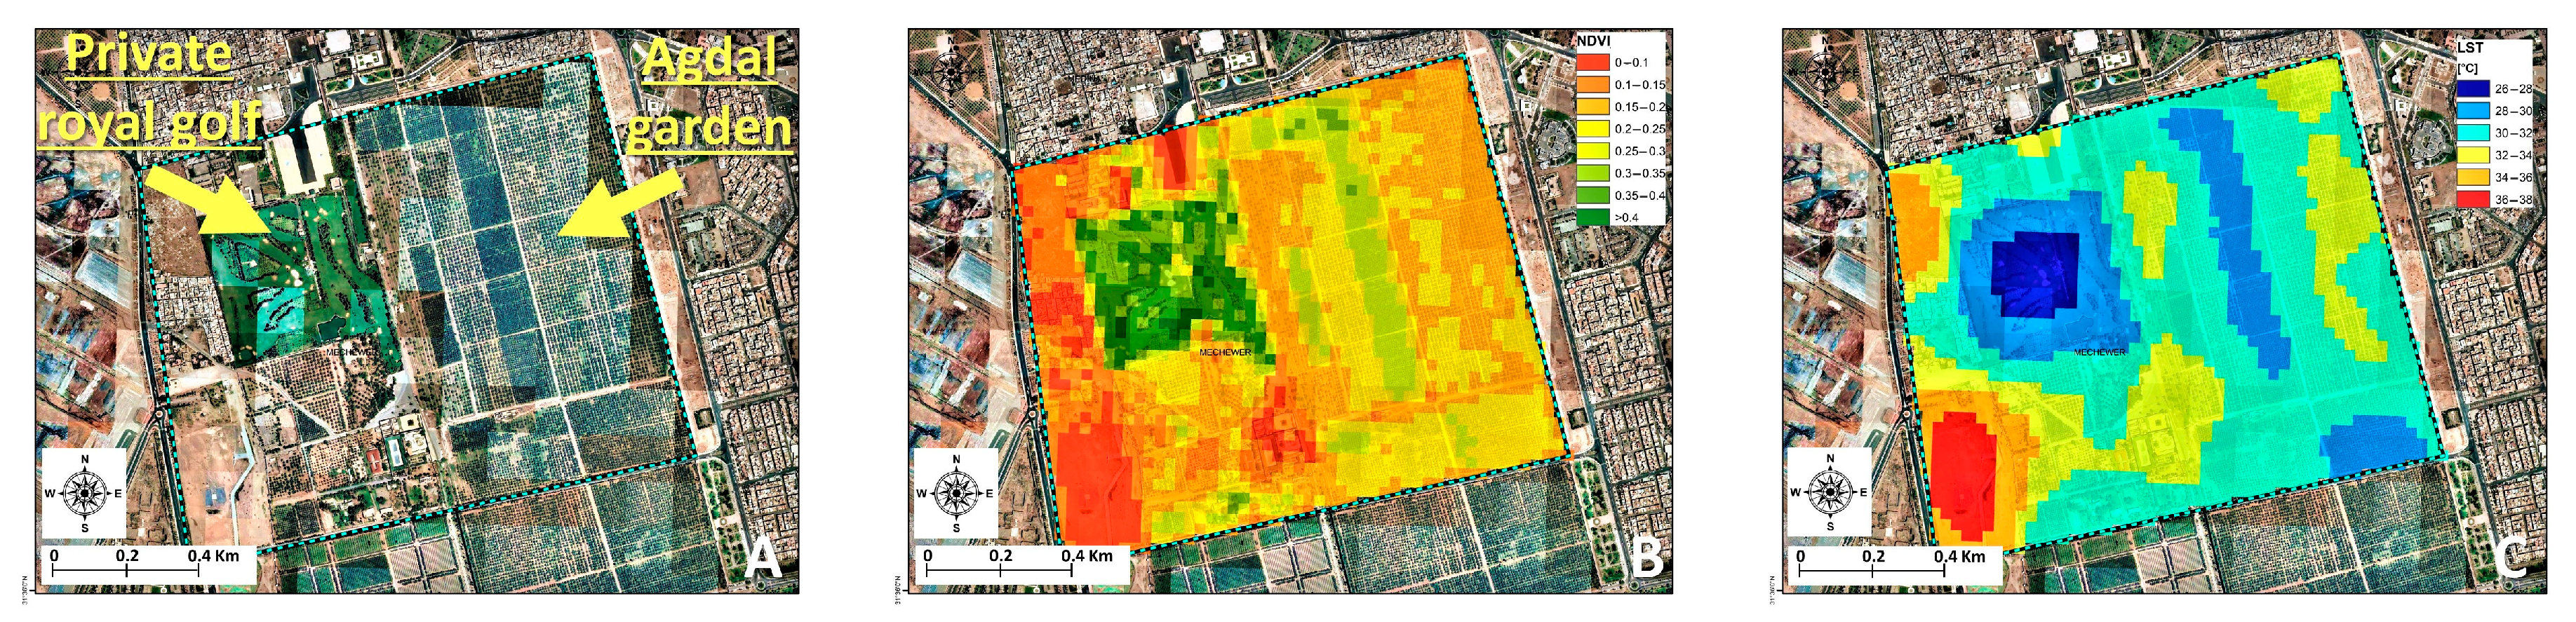
The most practical example is the royal territory in the north of the Mechewer district, composed mainly of the large centuries-old Agdal Garden and the private royal golf course (Figure 11). In the private golf course area, composed mainly of grassy areas and some cypress trees, the vegetation index is high (NDVI > 0.35) and the LST is low, with temperatures below 30 °C. The Agdal Garden, composed mainly of olive trees, relatively spaced in the eastern part, has NDVI values of 0.1–0.2 in the eastern part and between 0.2 and 0.35 in the western part of the garden, with temperatures between 32 and 30 °C.
On this basis, many studies have attempted to understand the relationship and spatial distribution of LST, built-up areas and vegetation in various metropolitan areas worldwide [46,47,48,49,50].
In many investigations, UHI variation has been compared to built-up areas and vegetation [28,46,51,52,53,54]. However, although bare soils sometimes occupy large areas of land, notably, in arid climate cities, bare areas have rarely been considered.
Many other studies have investigated these relationships using indexes such as NDVI (Normalized Difference Vegetation Index) and NDBI (The Normalized Difference Built-up Index) on LST [28,55,56,57]. On the other hand, [58] and [59] indicated that, due to the complexity of the spectral response patterns of vegetation and buildings, NDBI is unable to separate urban areas from certain barren lands, and also that NDVI can result in high values for some types of built-up areas. Therefore, this study presents an innovative method to overcome these drawbacks and study the effects of vegetation and built-up areas as well as bare areas on LST and their interactions. The results show that there is a large spatial and structural variation in neighbourhoods in terms of total area, bare soil areas, vegetation areas and built-up areas, which directly influences LST, thus explaining the wide variation in LST at the neighbourhood level, which is consistent with the findings of [60,61].
The neighbourhood of the Zone Airport (Figure 12) recorded the highest mean LST (35.30° C) and is considered the hottest neighbourhood in the city, despite the presence of a vast and stable green space, the Menara Garden, originating in the 12th century. This can be explained by the presence of large areas of bare ground, the second highest average (7.34/10 ha) in this airport district of Marrakesh, much of which is covered by asphalt pavements with an albedo of about 0.05, which means that only 5% of the light is reflected. The remaining 95% is absorbed, which is why asphalt pavements are considered to be a major factor contributing to the increase in SUHI [62].
In contrast, the neighbourhood of Guéliz (Figure 13), with the lowest mean LST (31.32 °C), is characterised by medium to low occupancy of bare ground and medium to high occupancy of vegetation (23.49 ha) and built-up areas (102.70 ha). This combination has made this district the coolest in the city. Guéliz, historically called “the European neighbourhood”, built during the French colonial period to the detriment of the palm grove, was part of the urban policy of Hubert Lyautey (the first French Resident–General of Morocco in the 1910s), which consisted of creating new modern cities for the large French community that settled in Morocco during the colonial period [63]. The area was planned based on the urban French colonial model, featuring real estate complexes and luxury villas with small grass gardens for each building accompanied by alignment trees in the streets. The goal was to provide the city with the necessary hygiene and quality of life [35]. This translates into a relatively small standard deviation in vegetation variation in that neighbourhood (Std = 1.06 per 10 ha), which is due to the uniform distribution of vegetation in the Guéliz district. As far as the type of construction is concerned, the district has undergone changes over time in terms of zoning, with certain single unit zones converted into R +5 building zones (buildings with no more than five floors above the ground floor).
In their study on the effect of park proximity on the urban heat island effect, [64] found that smaller scale green spaces can reduce SUHI with a magnitude close to that of larger parks. Therefore, small-scale green spaces such as those in Guéliz, which consume less water and take up little urban space, significantly mitigate SUHI in a cost-effective and sustainable way, explaining why Guéliz is the coolest neighbourhood in Marrakesh.
Concerning the impact of bare ground areas on surface temperature, very little is discussed in the literature [65,66,67], while the correlation analysis between the five parameters of LST, NDVI, bare area, vegetated area and built-up area showed that LST is mostly related to bare areas, with a high correlation of r = 0.86. Bare ground areas presented the highest mean surface temperatures, and the LST map also shows that the bare ground surface area plays a key role in the LST and built-up areas’ relationship; the larger the bare areas, the higher the temperatures will be, thus cancelling out the temperature-lowering effect of small vegetated areas in many cases. The Ennakhil neighbourhood, for example, which should induce low temperatures, on the contrary posts high average temperatures. These results have been recently reported in a few studies [18,68].
Furthermore, it is generally accepted that LSTs have an inverse correlation with NDVI, meaning that vegetation spaces help mitigate the LST, and the denser and larger the space, the more the SUHI effect decreases [28,69,70,71]. However, the correlation of LST with vegetation and NDVI is not strong enough (r < 0.6), with a negative correlation coefficient of r = −0.53 and r = −0.48, although visually (Figure 4), it can be seen that the green areas are those characterised by the lowest temperatures.
Moreover, the analysis of the spatial and temporal variation in the LST-NDVI correlation from 1985 to 2020 shows that, over time, this correlation is reduced, mainly due to the expansion of urbanisation that has a different trend from the LST-NDVI. In other words, the more buildings the district contains, the lower the correlation.
5.2. Impact of Construction Type on LST
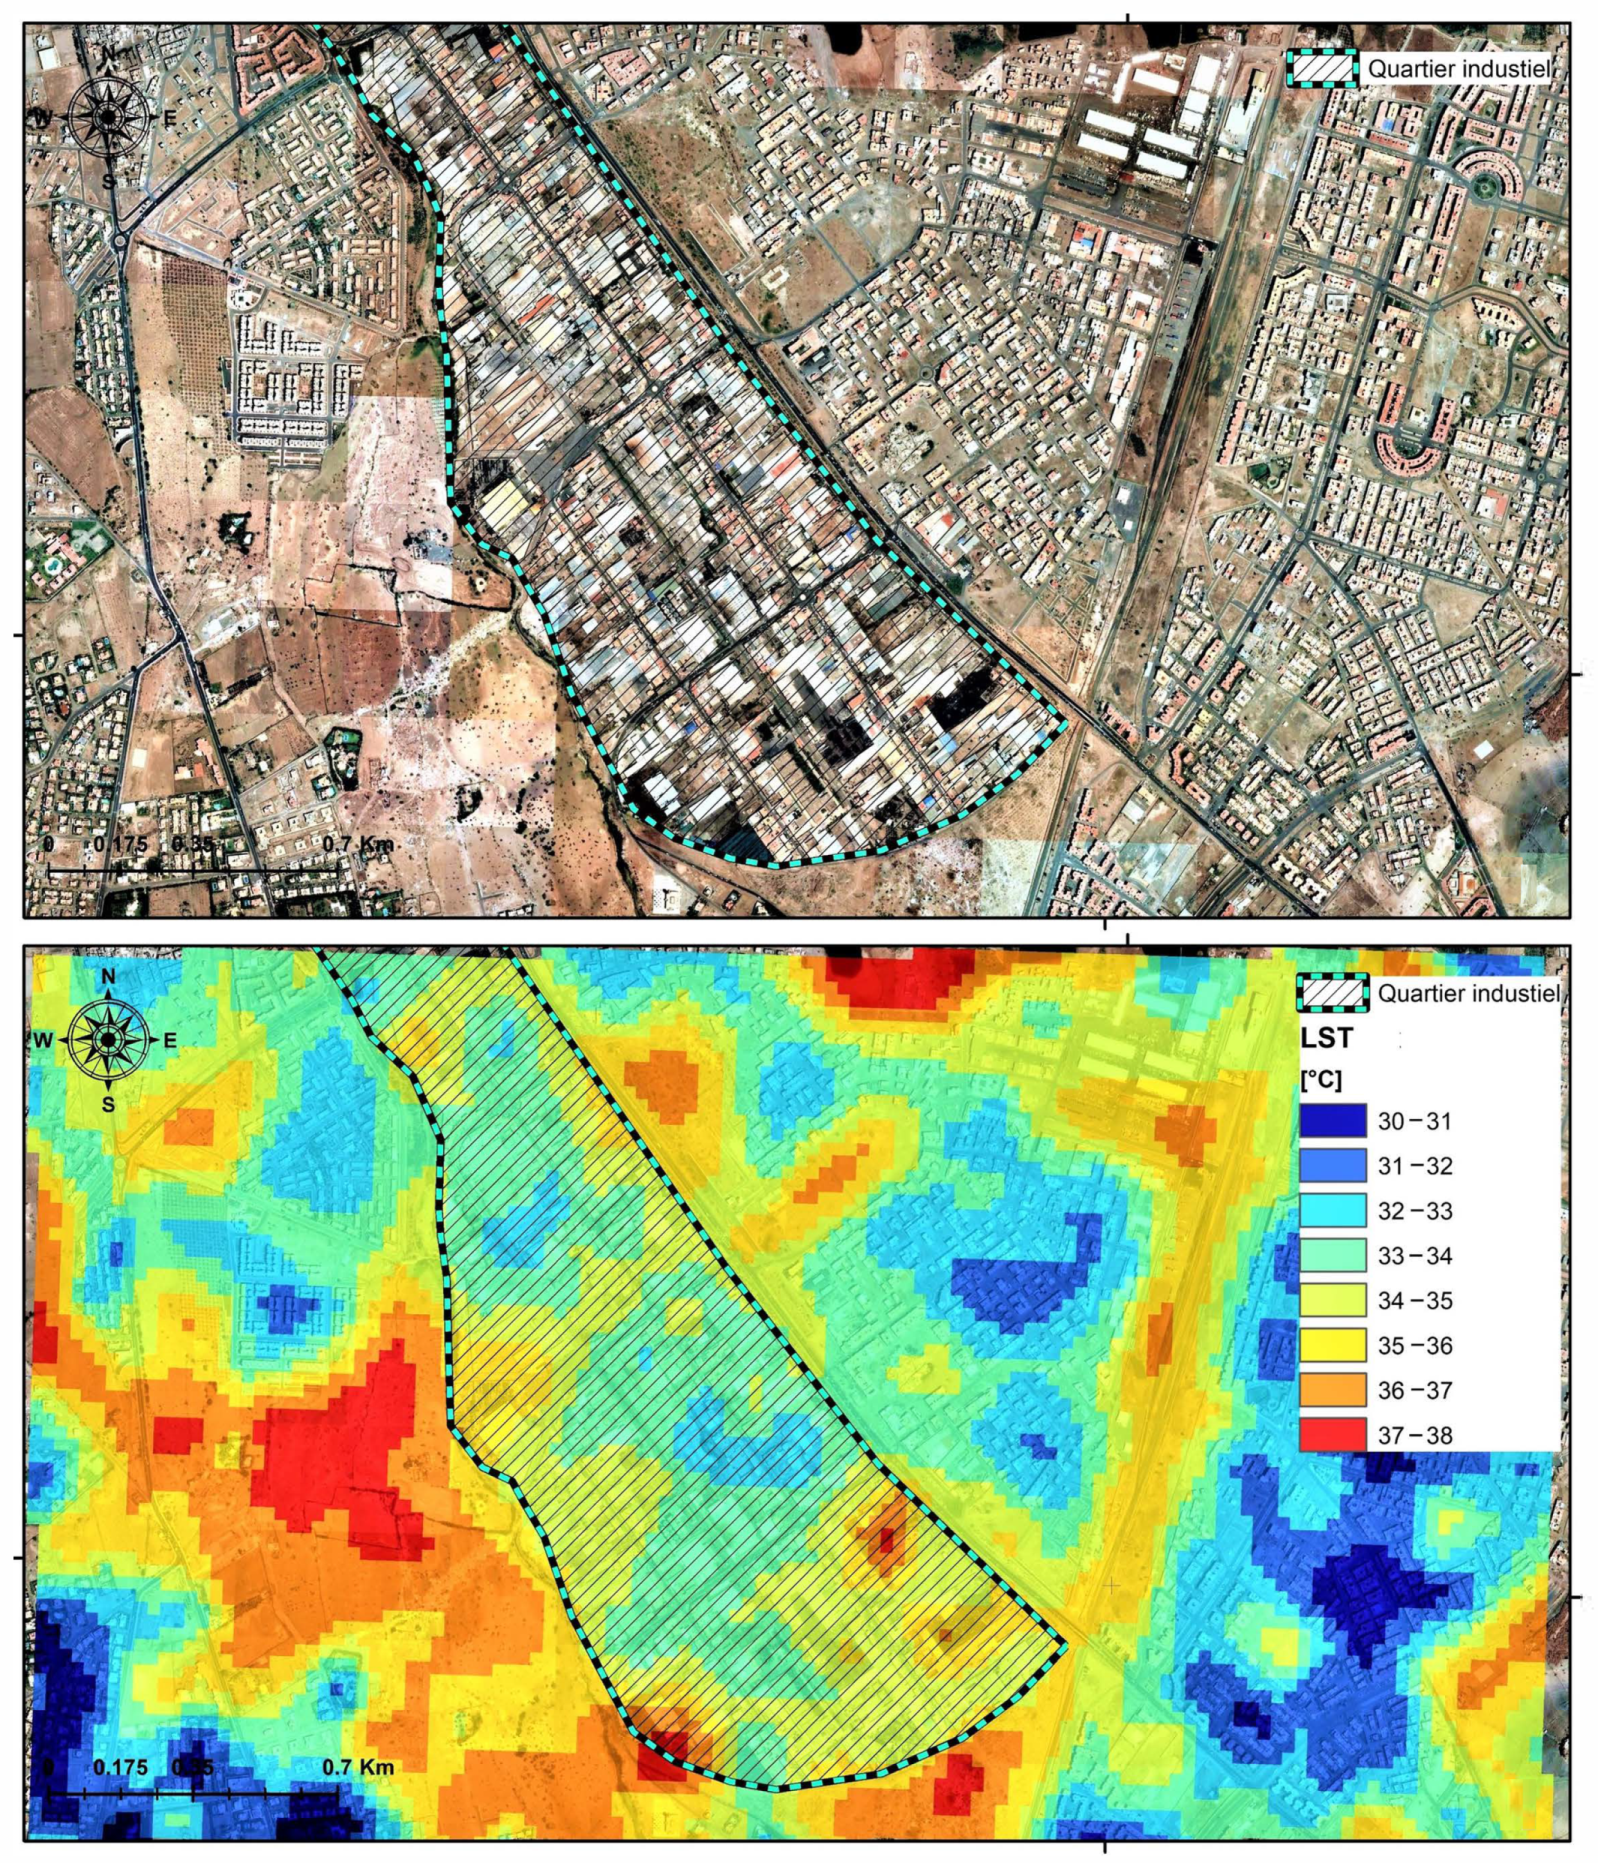
The nature of the construction is another factor influencing heat. Thus, the Quartier Industriel (Industrial district) in the Sidi Ghanem district (Figure 14), a commercial centre and artisanal enclave on the outskirts of the city, filled with local designers’ workshops and trendy boutiques, posts high temperatures (34.68 °C) despite the density of built-up areas. Indeed, the industrial buildings are composed mainly of load-bearing masonry (bricks, blocks, stones), main frame structures supporting the main floors and roof, and secondary structural elements including balconies, canopies and metal walkways. This type of construction has a low albedo, absorbs higher amounts of solar radiation and converts it to thermal energy, favouring the storage of solar energy [53] and, consequently, increasing the heat islands despite the density of the buildings. Therefore, several studies have recommended increasing the albedo of the area to reduce the accumulated heat by introducing reflective materials with high albedo, especially light-coloured coatings for building roofs [72,73,74].
One of the most interesting elements that has emerged from this study is the low LST of densely built and poorly vegetated neighbourhoods such as the Medina (31.51° C) and SYBA (32.16 °C). Most researchers theorise that the gradual replacement of natural surfaces by built surfaces, through urbanisation, constitutes the main cause of UHIs [46,75,76]. However, in Marrakesh, the downtown neighbourhoods post some of the lowest temperatures in the city.
The Medina of Marrakesh (Figure 15), classified as a UNESCO World Heritage Site, was designed centuries ago, mostly in the 12th century, with an urban morphology consisting of an assemblage of house courtyards (patios) linked by a hierarchical street network. Residential houses have massive facades with few openings, yet the courtyards connect the houses with the outside environment. This compact organic rather than geometric urban fabric thoroughly adapts to the immediate hot environment by providing shade in all the narrow and winding streets.
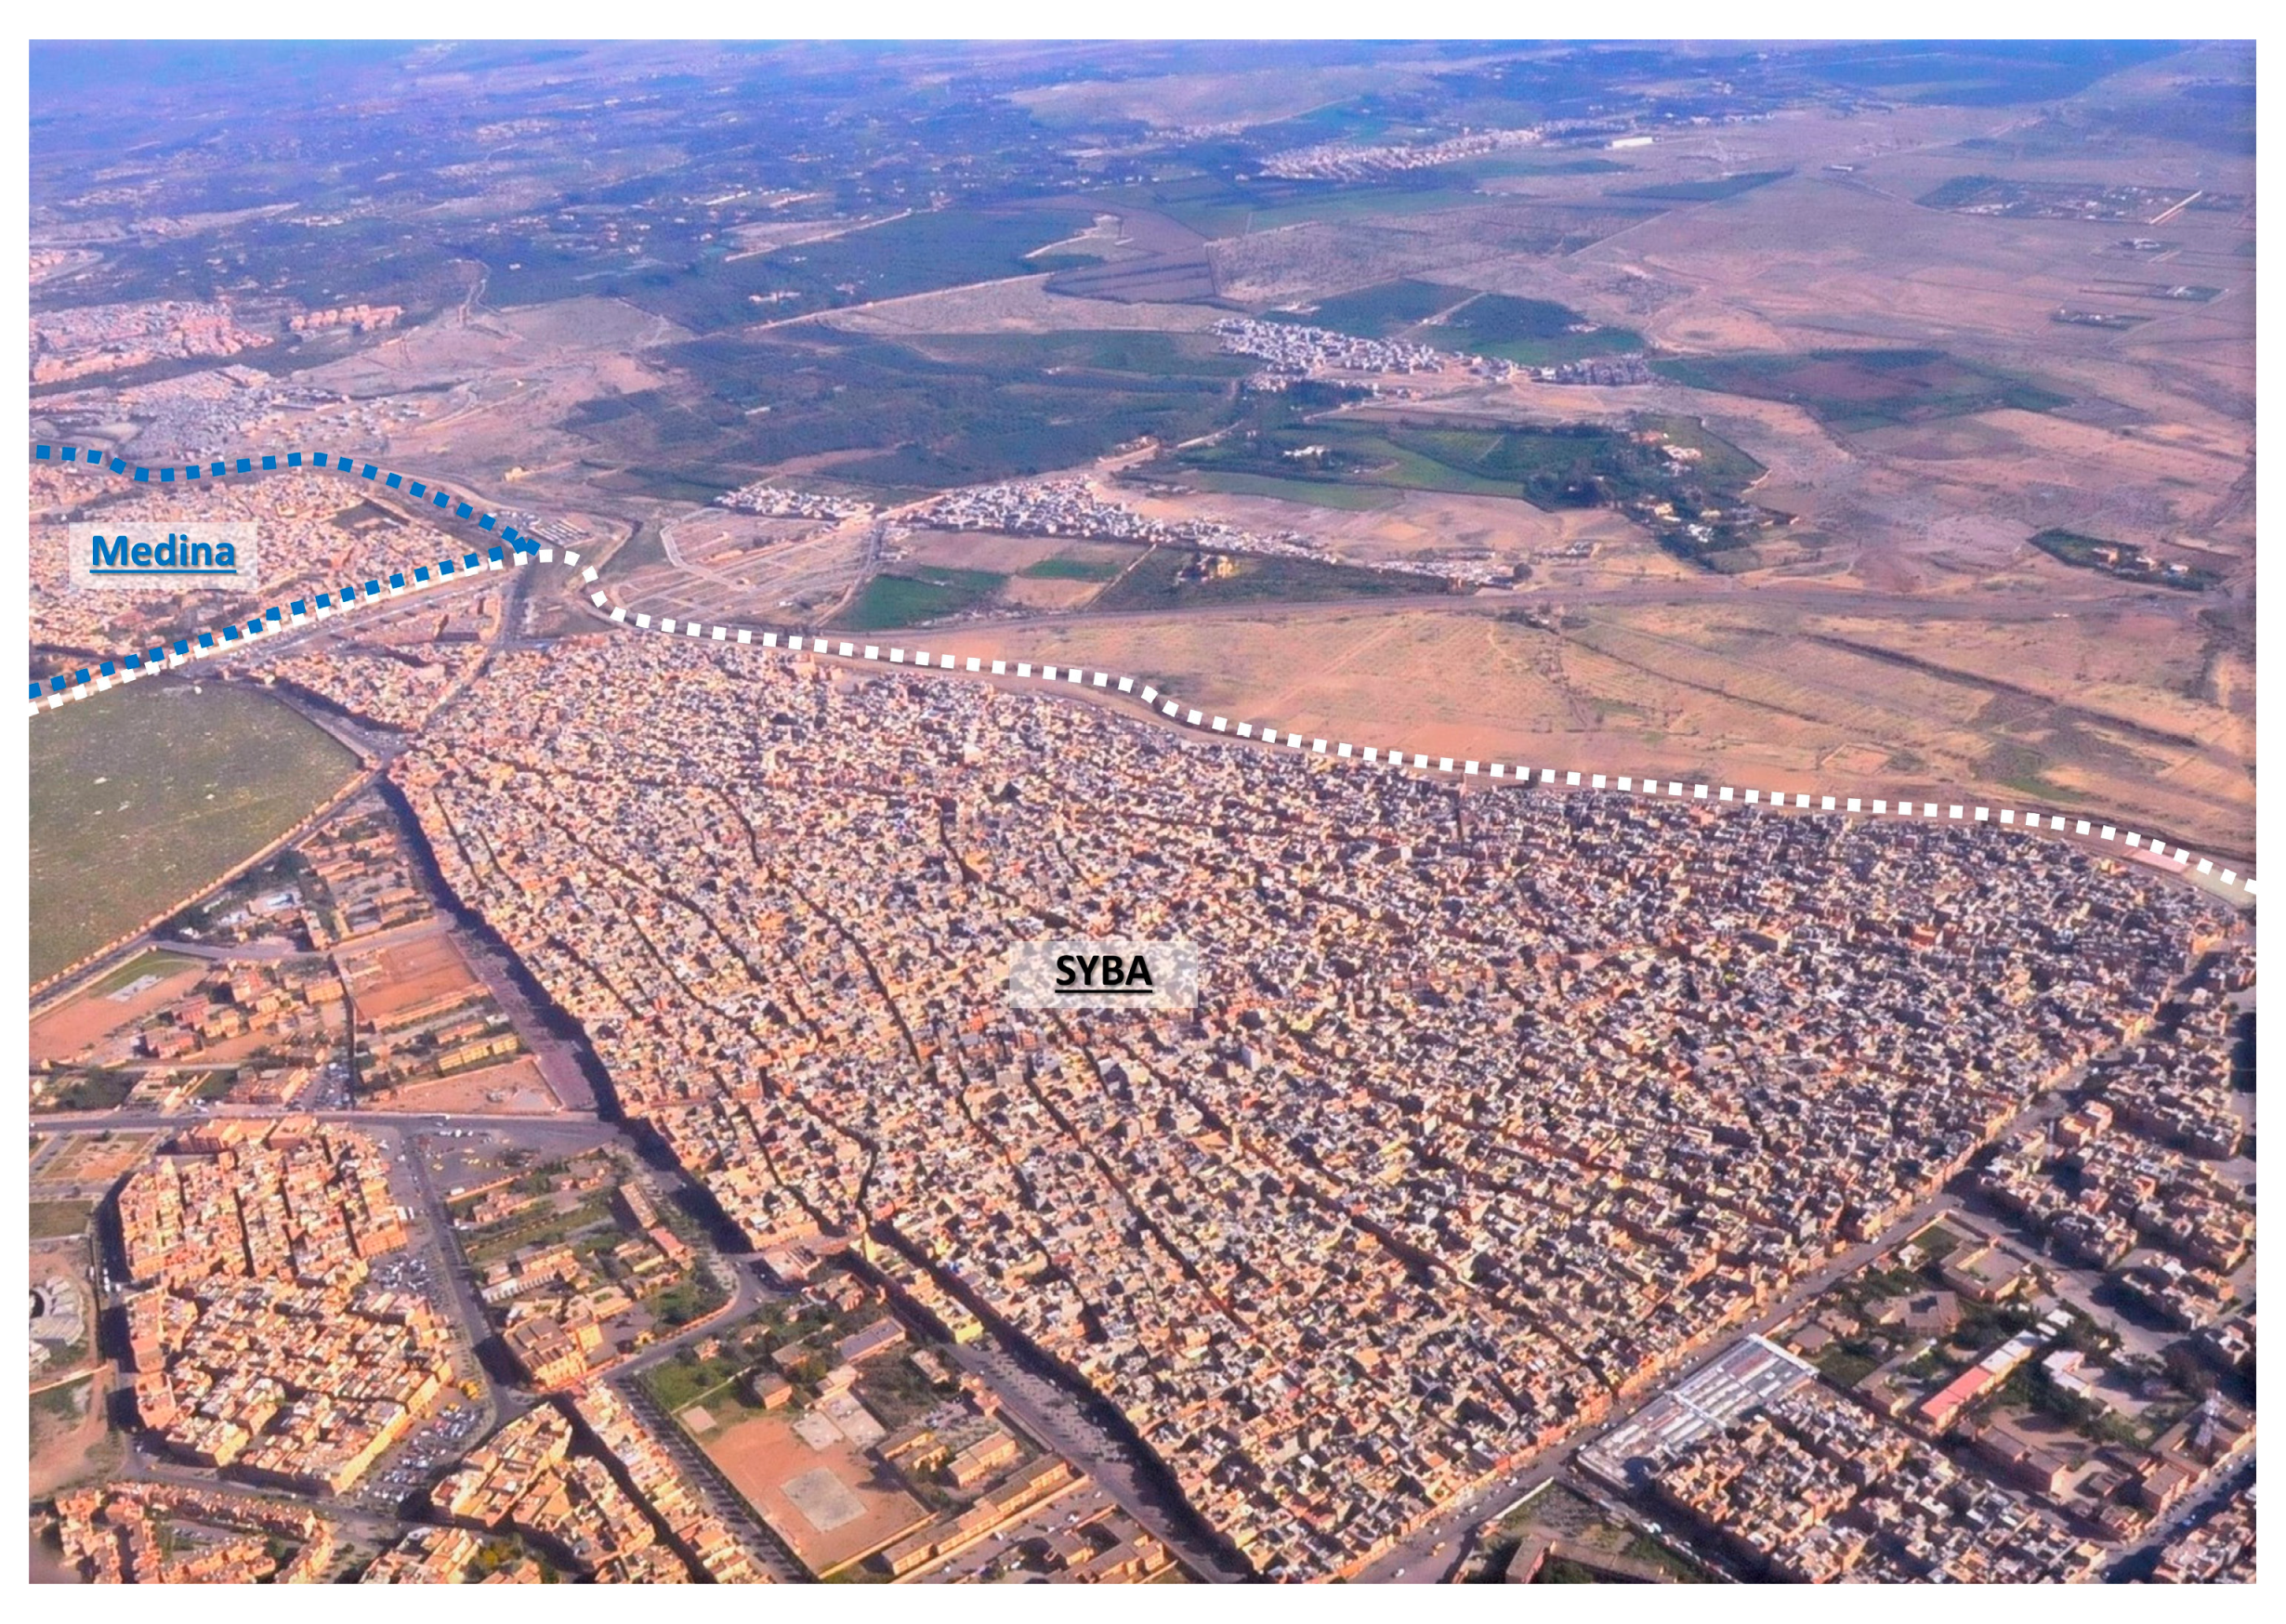
The Sidi Youssef Ben Ali (SYBA) (Figure 15) neighbourhood, located in the south of the Medina between the Issil River and the ramparts of the Agdal Garden, developed out of a self-construction phase starting in the 1950s by neo-urban people who could not find places to live in the saturated Medina in a context of strong rural exodus. The urbanisation of this sector was clandestine at the beginning, with multi-family dwellings built on small plots of land (60 to 100 m2), single-storey at the beginning and rebuilt with two or three storeys in recent decades. This spontaneous extension of the typo-morphology of the Medina in the northern part of the SYBA district features houses with patios squeezed together like traditional fabrics, with high densities and a lack of infrastructure. The area has a compact and dense organisation which has developed in the absence of appropriate urban planning. This mainly concerns the old district, which had experienced a high density as a result of large immigration flows, and since then, this district has shown a definite need for urban recovery, equipment and infrastructure. Due to its geographical location in the southeast of the city of Marrakesh, close to the Medina and in the heart of three major natural components, namely The Agdal gardens and their ramparts, Oued Issil and the vast Hassan II Oasis farmlands to the south, the SYBA district has undergone a programmed urban evolution to limit its spontaneous expansion and diversify its housing through projects carried out by ERAC. A number of public and socio-economic facilities have also been built. Sidi Youssef Ben Ali is a part of the city that some describe as a countryside within an urban perimeter, as it has, in the past, reflected all the images of marginalisation and social exclusion. The latter is closely linked to poverty, unemployment and destitution, which are reflected in individual (public services and facilities) and/or collective deprivation and in the lack of adequate and dignified housing and fairly paid jobs. Despite all these elements of social and urban degradation and downgrade, this neighbourhood demonstrates real qualities in terms of reduction in LST. This is due to the fact that the dense nature of the buildings in these two districts prevents the heat from reaching the street canyon, provides shade and also keeps the sky view open. Another reason could be the construction materials with which the buildings are built, which are often natural and traditional materials such as natural stones or raw earth.
5.3. Synthesis on the Variation in LST in Marrakesh
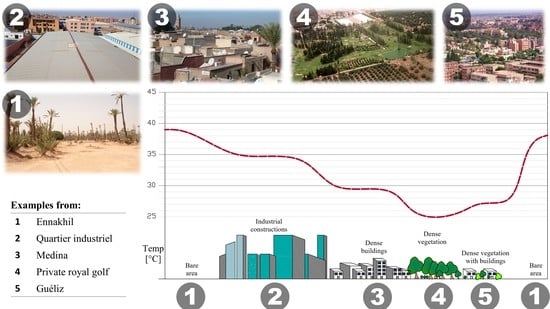
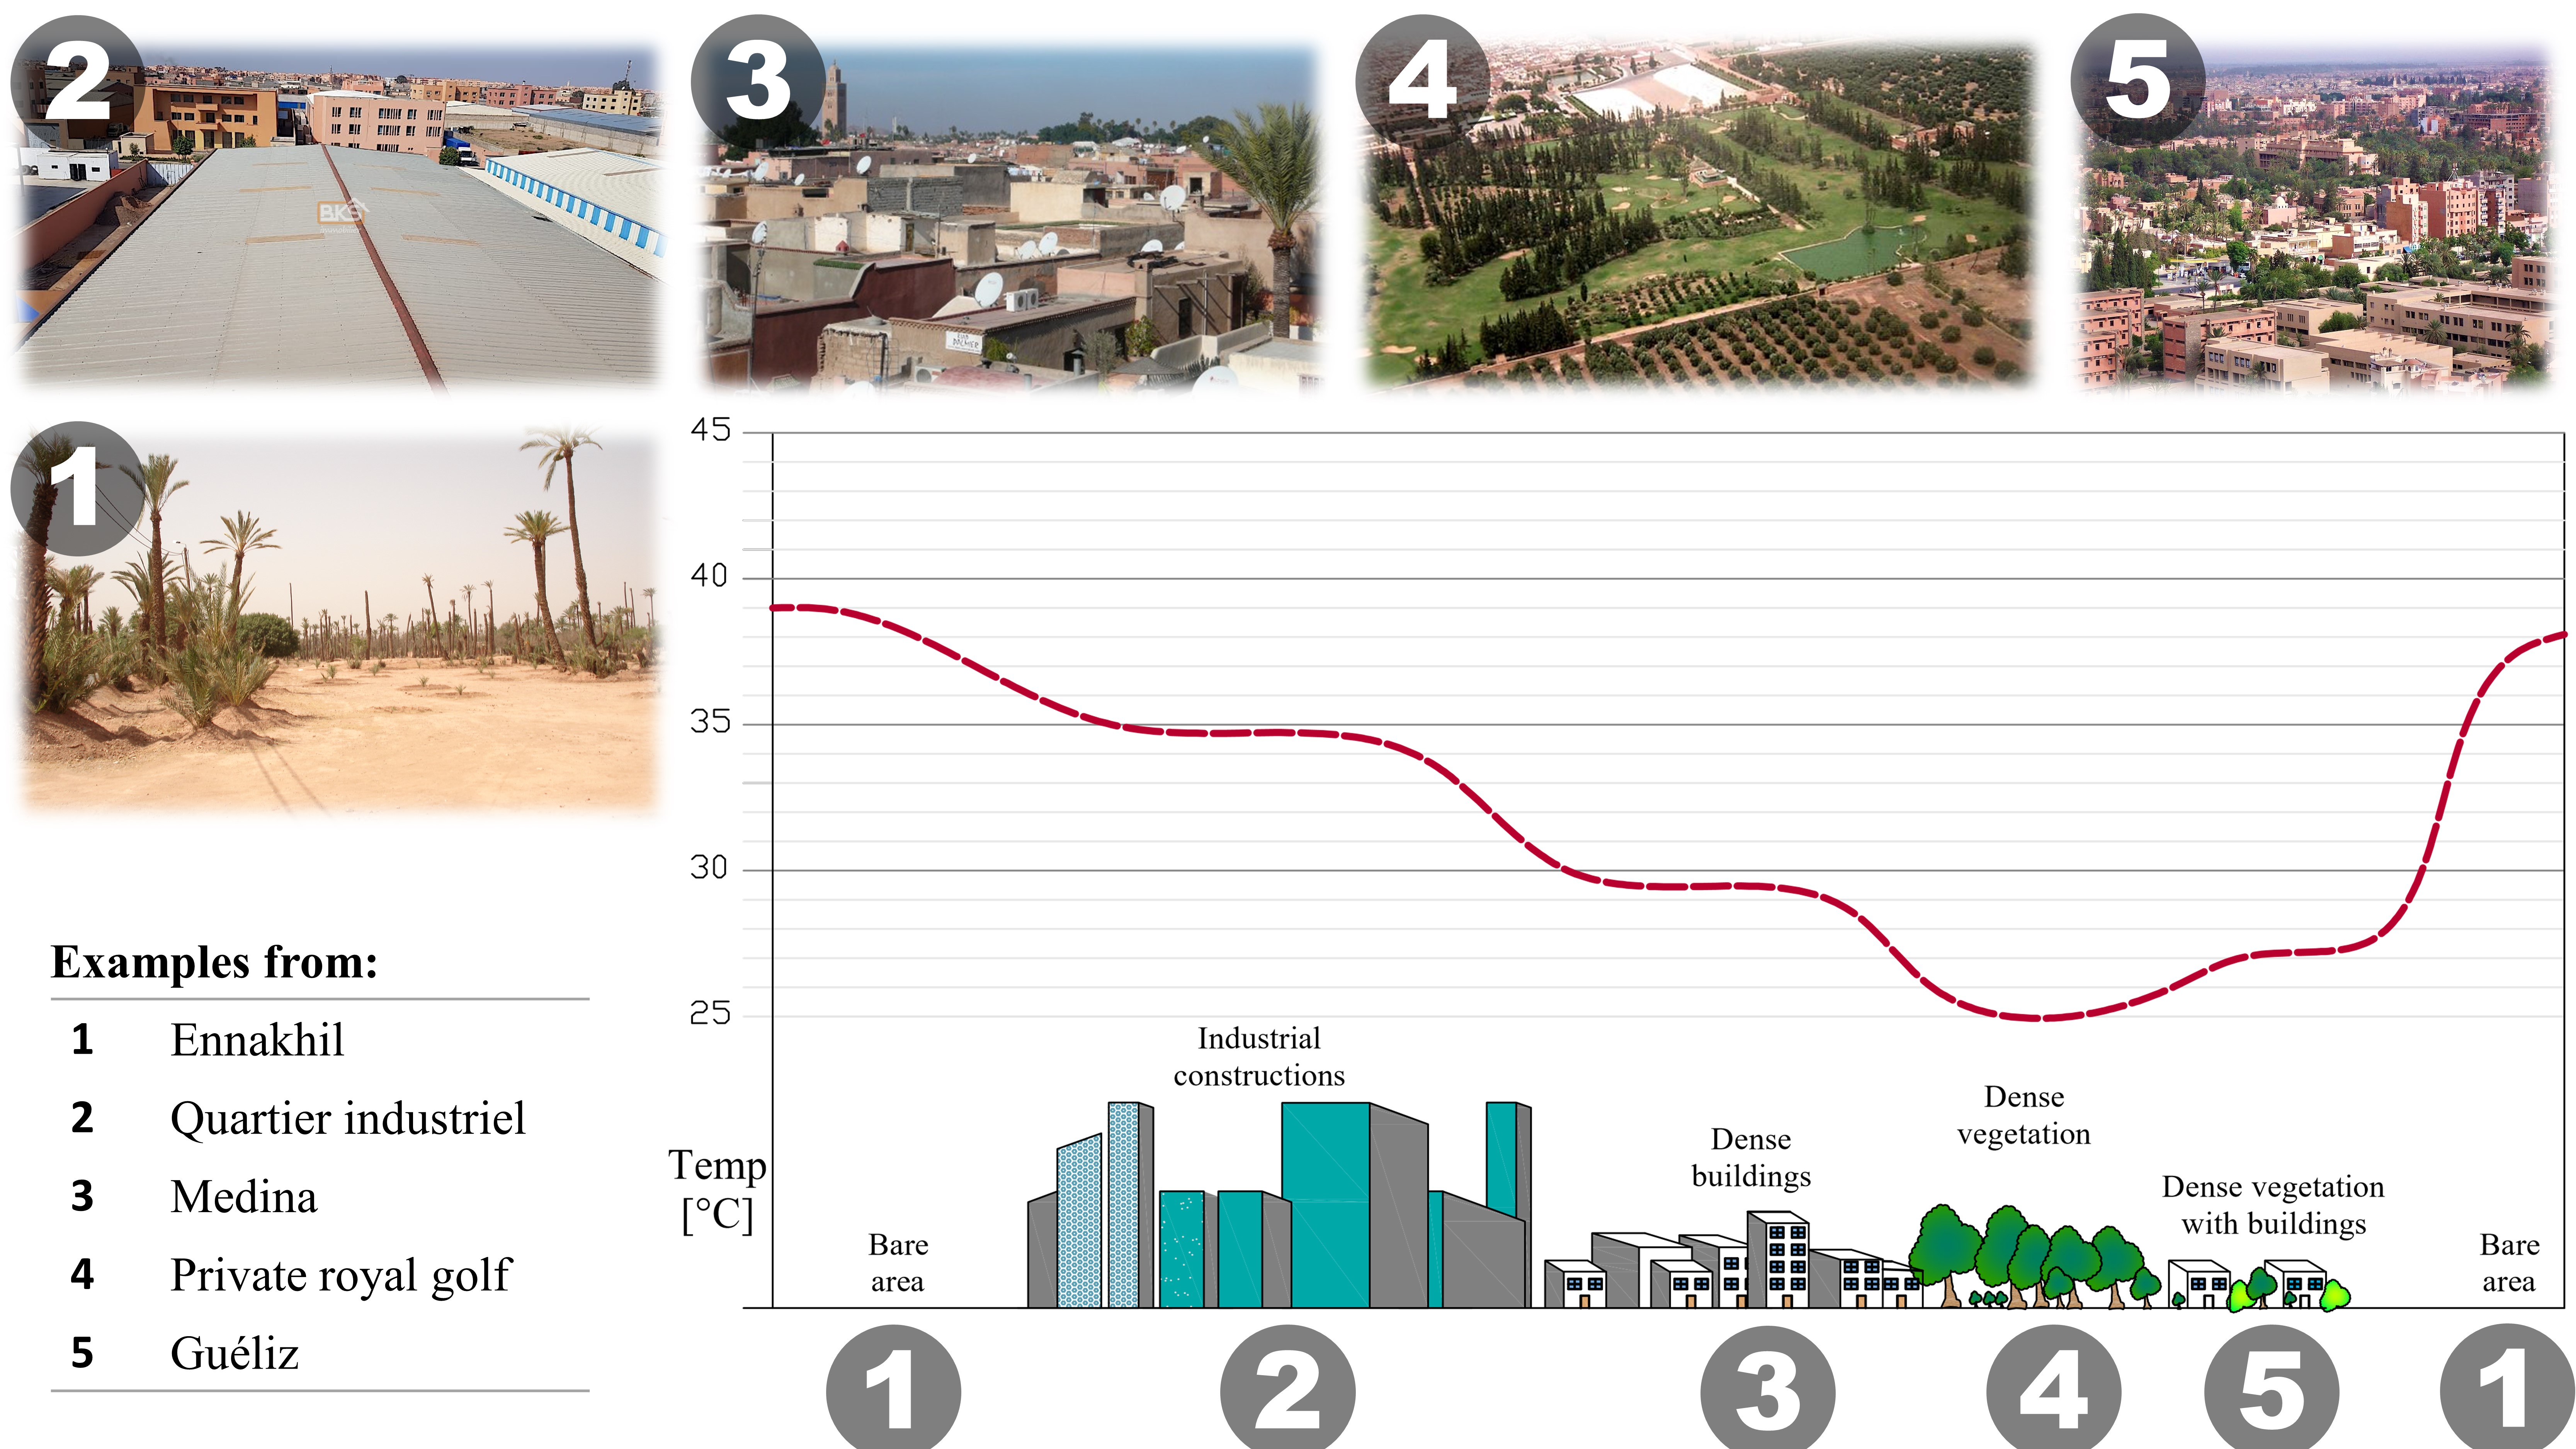
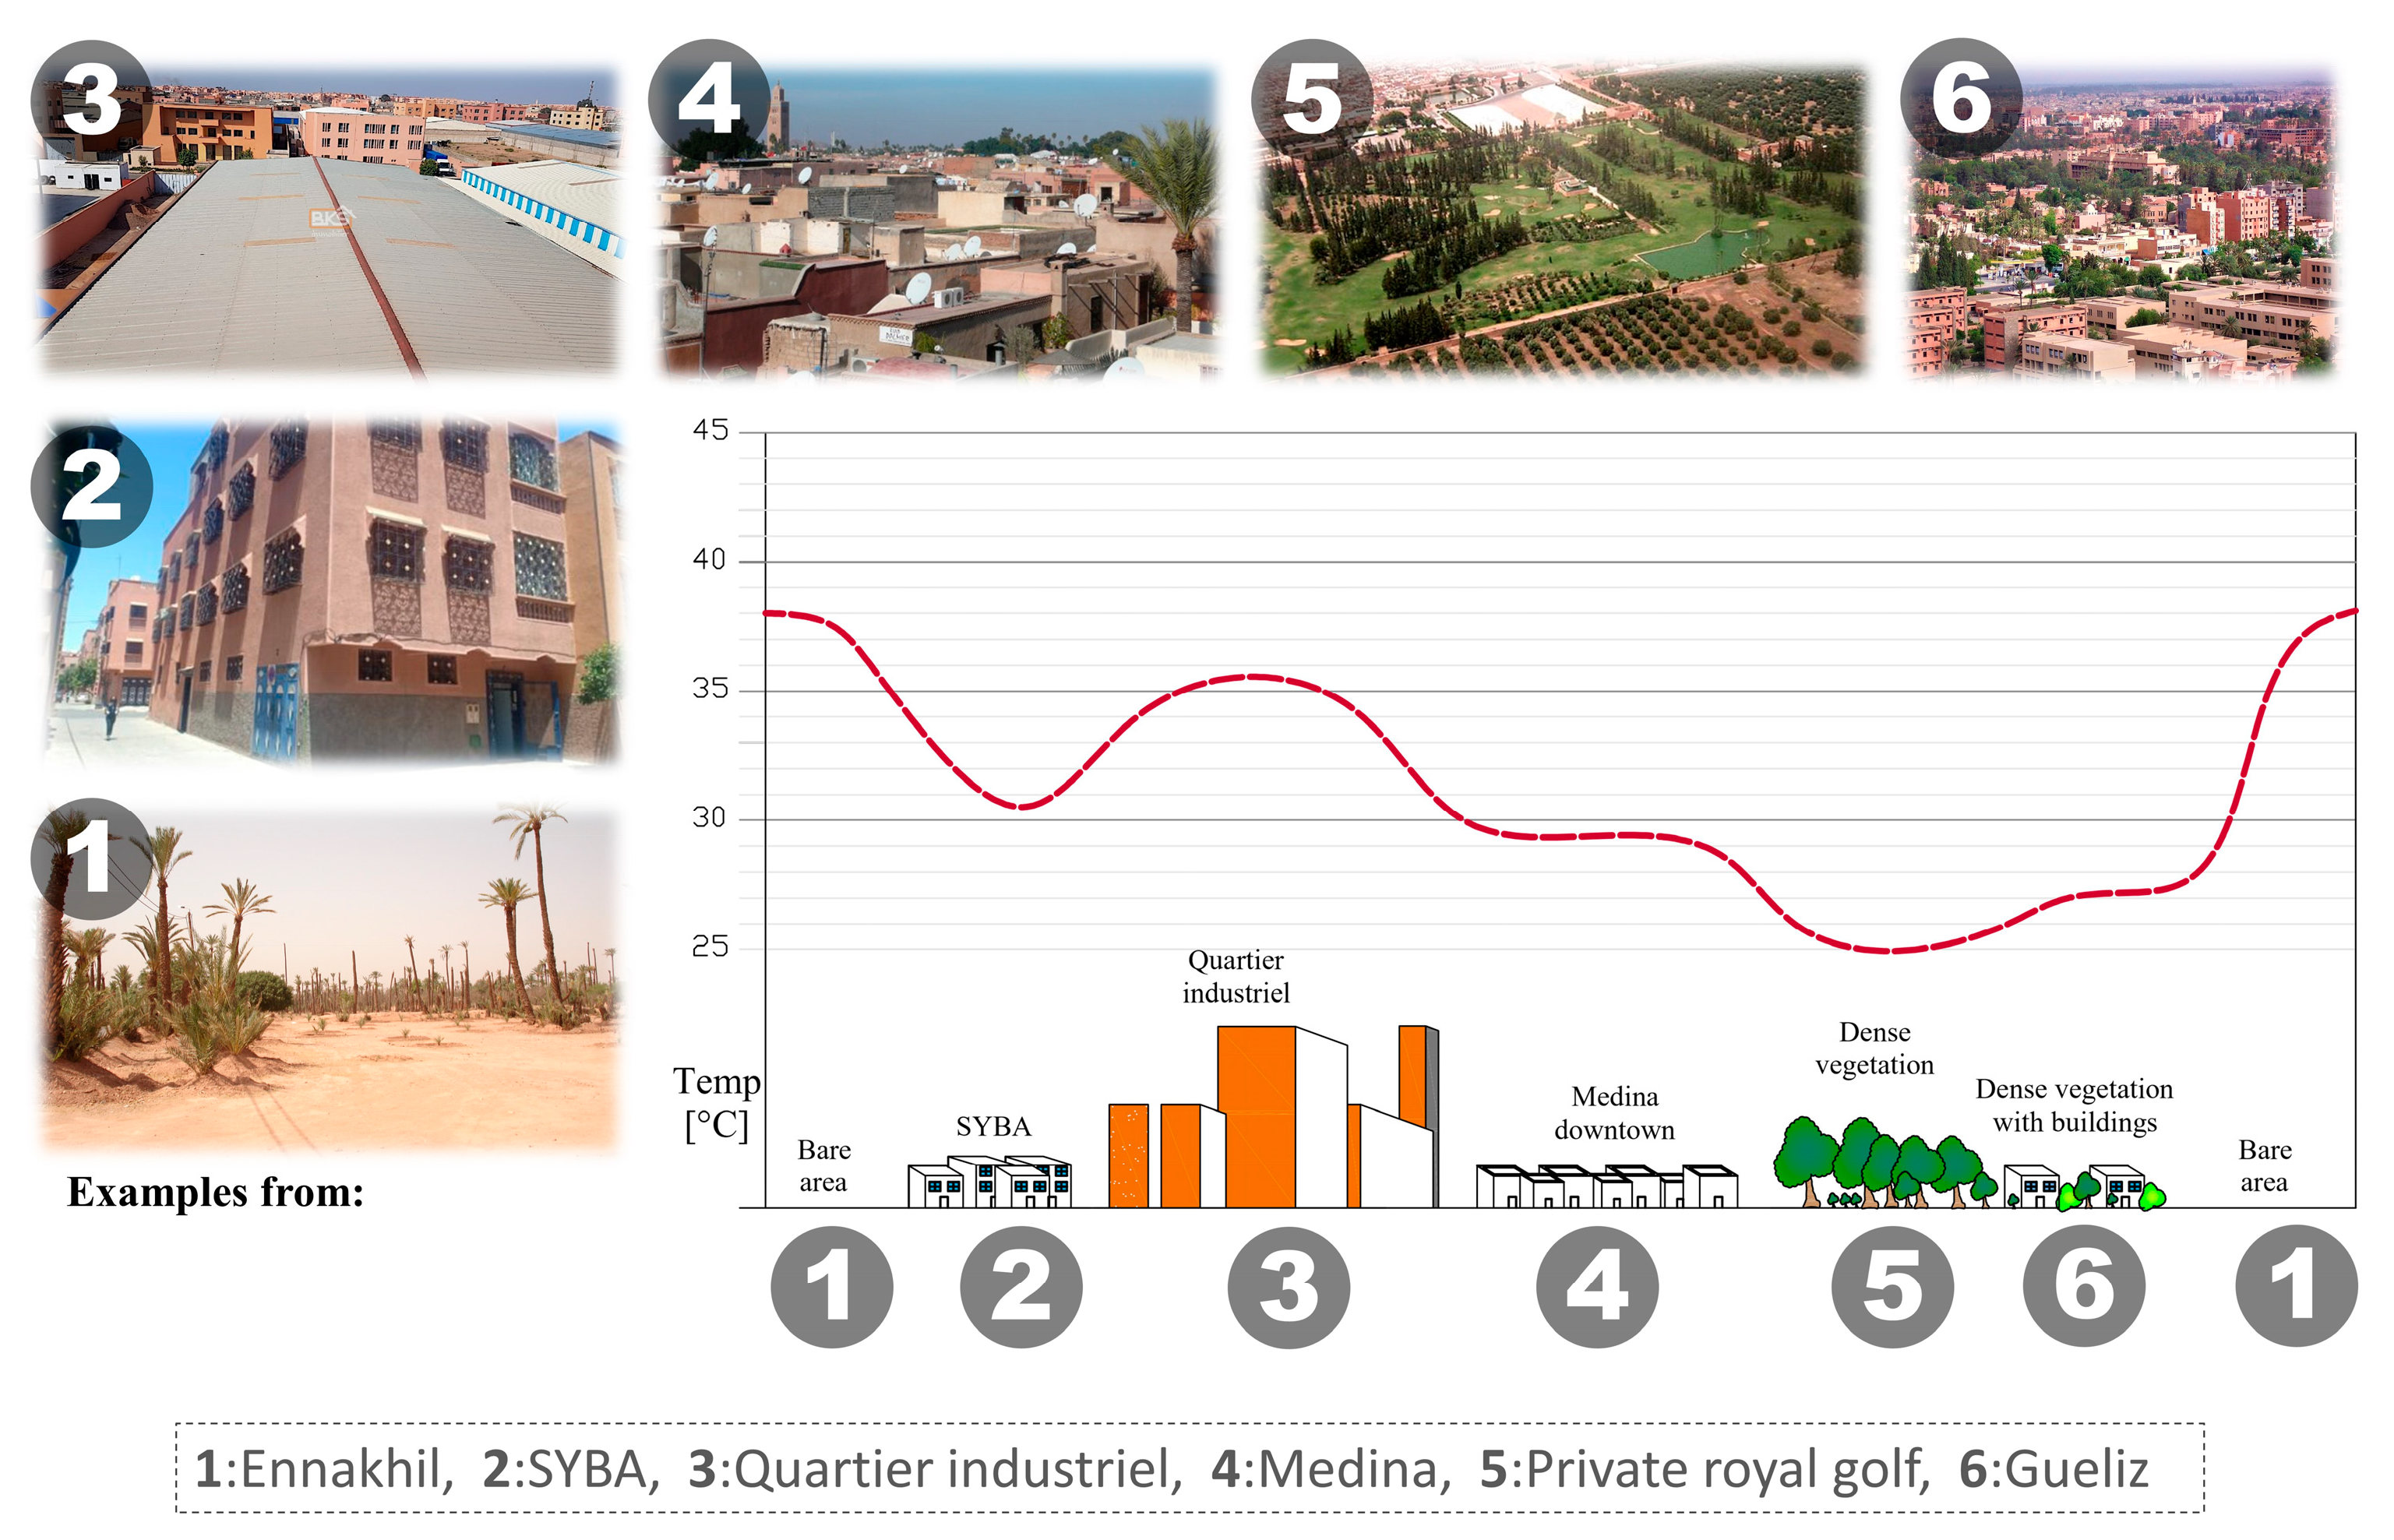
Marrakesh is a city characterised by an arid climate, where history and social inequality have contributed to differences in the city’s districts; these differences mainly concern urban management, vegetation and the urban development plan. These different parameters have had a direct influence on surface heat islands and their presence in districts (Figure 16).
In cities with an arid climate, during the daytime, the presence of LST is mainly related to the presence of bare land [65,66,67]. For example, in Marrakesh, the Airport Zone and Sidi Ghanem districts are considered as the hottest districts of Marrakesh, at 35.30 °C and 34.68 °C, respectively. In these two districts, in addition to large areas of bare lands, there are asphalt pavements (in the case of the Airport Zone) and metal construction (in the case of Sidi Ghanem) which retain even more heat due to their low albedo [72,73,74].
On the other hand, vegetation and built-up areas contribute to the attenuation of the LST [60,61], as in the case of the districts of Guéliz and Médine. In the case of Guéliz, which has a relatively different organisation due to its colonial history, it is characterised by R + 5 buildings, preventing heat from reaching the street gutter, providing shade and also keeping the view to the sky open. The Guéliz district is also characterised by well-distributed vegetation, reflected in luxury villas and high-class hotels with a large number of grassy gardens and small courtyards [63]. This combination has been shown to minimize temperatures and mitigate the LST [64]. It is important to mention that the presence of vegetation does not always mean low temperatures; the typology of the vegetation, its health and density play an essential role in the mitigation (for example, the Agdal Garden and the Royal Private Golf Course).
In the case of the Medina and SYBA districts, also characterised by low average temperatures of 31.51 °C and 32.16 °C, respectively, the very dense urban architecture as well as the very narrow alleys prevent the sun’s heat from reaching the roof of the street and providing more shade [77]. The nature of the buildings as well as their construction materials, mainly natural materials such as straw and clay bricks, act as thermal insulation and prevent light heat from reaching the surface, thus mitigating UHI [78].
6. Conclusions
Most of the studies dealing with the urban heat island effect take into consideration the parameters of vegetation and built-up areas, since it is accepted that vegetation helps reduce UHI while built-up areas have the opposite effect. In this study, we introduced another factor, bare ground, which is rarely taken into account in studies and which is even more important in the semi-arid and arid climate where Marrakesh is located. This study shows that bare areas play a key role in the variation in SUHI, increasing surface temperatures at daytime. Vegetation, depending on its typology and distribution, also comes into play in reducing air and ground temperatures. In fact, well distributed smaller scale green spaces can reduce SUHI with a magnitude close to that of larger parks (case of the Guéliz district).
On the other hand, the traditional dense urban structures characteristic of Arab Muslim cities such as Marrakesh, with dense buildings and narrow winding streets, help reduce temperatures. This is the case of the centuries-old Medina district, but also of the newer SYBA neighbourhood, whose structure imitates that of the old city. In contrast, the ‘industrial’ buildings generate a higher SUHI effect due to their albedo. The analysis by neighbourhood shows an imbalance at the city scale with strong inequalities. The neighbourhoods of dense vegetation and buildings are generally the coolest.
These results will be of great interest to city managers and planners in arid zones faced with the future challenge of global warming. Although revegetation is of great interest in reducing SUHI, it is also confronted with the scarcity of water in Marrakesh. In this case, the choice of urban structures that mitigate the SUHI effect is crucial.
Author Contributions
A.G. conceived the paper’s concept and performed data collection, data preprocessing and processing, and the field mission. A.N.T. and S.S.: writing—original draft preparation; M.E.H. and S.B.: writing—review and editing. All authors have read and agreed to the published version of the manuscript.
Funding
This work, carried out at ESO-Angers, UMR 6590 CNRS (France), is funded by French Partenariat Hubert Curien “Maghreb” (38MAG20 project 4363PH) and the ATLAS short-term postdoctoral mobility program in the Humanities and Social Sciences, proposed by the Arab Council for Social Sciences (ACSS) and the Fondation Maison des Sciences de l’Homme (FMSH).
Data Availability Statement
The data presented in this study are available on request from the corresponding author.
Acknowledgments
The authors wish to acknowledge the constructive comments of the anonymous reviewers.
Conflicts of Interest
The authors declare no conflict of interest.
References
- Balk, D.; Leyk, S.; Montgomery, M.R.; Engin, H. Global Harmonization of Urbanization Measures: Proceed with Care. Remote Sens. 2021, 13, 4973. [Google Scholar] [CrossRef]
- Congedo, L.; Macchi, S. The demographic dimension of climate change vulnerability: Exploring the relation between population growth and urban sprawl in Dar es Salaam. Curr. Opin. Environ. Sustain. 2015, 13, 1–10. [Google Scholar] [CrossRef]
- Mohsen, H.; Raslan, R.; El-bastawissi, I.Y. the Impact of Changes in Beirut Urban Patterns on the Microclimate: A Review of Urban Policy and Building. Arch. Planing J. 2020, 25. Available online: https://digitalcommons.bau.edu.lb/apj/vol25/iss1/2/ (accessed on 29 May 2022).
- Keppas, S.C.; Papadogiannaki, S.; Parliari, D.; Kontos, S.; Poupkou, A.; Tzoumaka, P.; Kelessis, A.; Zanis, P.; Casasanta, G.; De’Donato, F.; et al. Future Climate Change Impact on Urban Heat Island in Two Mediterranean Cities Based on High-Resolution Regional Climate Simulations. Atmosphere 2021, 12, 884. [Google Scholar] [CrossRef]
- Périard, J.D.; Travers, G.J.S.; Racinais, S.; Sawka, M.N. Cardiovascular adaptations supporting human exercise-heat accli-mation. Auton. Neurosci. Basic Clin. 2016, 196, 52–62. [Google Scholar] [CrossRef] [PubMed]
- Pascal, M.; Wagner, V.; Alari, A.; Corso, M.; Le Tertre, A. Extreme heat and acute air pollution episodes: A need for joint public health warnings? Atmos. Environ. 2021, 249, 118249. [Google Scholar] [CrossRef]
- Jung, J.; Uejio, C.K.; Adeyeye, T.E.; Kintziger, K.W.; Duclos, C.; Reid, K.; Jordan, M.; Spector, J.T.; Insaf, T.Z. Using social security number to identify sub-populations vulnerable to the health impacts from extreme heat in Florida, U.S. Environ. Res. 2021, 202, 111738. [Google Scholar] [CrossRef] [PubMed]
- Santamouris, M. Recent progress on urban overheating and heat island research. Integrated assessment of the energy, environmental, vulnerability and health impact. Synergies with the global climate change. Energy Build. 2020, 207, 109482. [Google Scholar] [CrossRef]
- Wang, J.; Xiang, Z.; Wang, W.; Chang, W.; Wang, Y. Impacts of strengthened warming by urban heat island on carbon sequestration of urban ecosystems in a subtropical city of China. Urban Ecosyst. 2021, 24, 1165–1177. [Google Scholar] [CrossRef]
- Kong, J.; Zhao, Y.; Carmeliet, J.; Lei, C. Urban Heat Island and Its Interaction with Heatwaves: A Review of Studies on Mesoscale. Sustainability 2021, 13, 10923. [Google Scholar] [CrossRef]
- Gourfi, A.; Daoudi, L.; Rhoujjati, A.; Benkaddour, A.; Fagel, N. Use of bathymetry and clay mineralogy of reservoir sediment to reconstruct the recent changes in sediment yields from a mountain catchment in the Western High Atlas region, Morocco. CATENA 2020, 191, 104560. [Google Scholar] [CrossRef]
- Edmondson, J.L.; Stott, I.; Davies, Z.G.; Gaston, K.J.; Leake, J.R. Soil surface temperatures reveal moderation of the urban heat island effect by trees and shrubs. Sci. Rep. 2016, 6, 33708. [Google Scholar] [CrossRef] [PubMed]
- Palmer, B.J.; Fulbright, T.E.; Grahmann, E.D.; Hernández, F.; Hehman, M.W.; Wester, D.B. Vegetation Structural Attributes Providing Thermal Refugia for Northern Bobwhites. J. Wildl. Manag. 2021, 85, 543–555. [Google Scholar] [CrossRef]
- Nedbal, V.; Láska, K.; Brom, J. Mitigation of Arctic Tundra Surface Warming by Plant Evapotranspiration: Complete Energy Balance Component Estimation Using LANDSAT Satellite Data. Remote Sens. 2020, 12, 3395. [Google Scholar] [CrossRef]
- Gourfi, A.; Daoudi, L.; de Vente, J. A new simple approach to assess sediment yield at a large scale with high landscape diversity: An example of Morocco. J. Afr. Earth Sci. 2020, 168, 103871. [Google Scholar] [CrossRef]
- Iddo, A.G.; Paramasivam, V.; Selvaraj, S.K. Design and Techno-economic analysis of power generating unit from waste heat (Preheater and grate cooler) of cement factory in Ethiopia. Mater. Today: Proc. 2021, 46, 7825–7838. [Google Scholar] [CrossRef]
- Tan, P.Y.; Wong, N.H.; Tan, C.L.; Jusuf, S.K.; Chang, M.F.; Chiam, Z.Q. A method to partition the relative effects of evaporative cooling and shading on air temperature within vegetation canopy. J. Urban Ecol. 2018, 4, juy012. [Google Scholar] [CrossRef]
- Sayão, V.M.; dos Santos, N.V.; Mendes, W.D.S.; Marques, K.P.; Safanelli, J.L.; Poppiel, R.R.; Demattê, J.A. Land use/land cover changes and bare soil surface temperature monitoring in southeast Brazil. Geoderma Reg. 2020, 22, e00313. [Google Scholar] [CrossRef]
- Nichol, J.E.; Fung, W.Y.; Lam, K.-S.; Wong, M.S. Urban heat island diagnosis using ASTER satellite images and ‘in situ’ air temperature. Atmos. Res. 2009, 94, 276–284. [Google Scholar] [CrossRef]
- Saaroni, H.; Ben-Dor, E.; Bitan, A.; Potchter, O. Spatial distribution and microscale characteristics of the urban heat island in Tel-Aviv, Israel. Landsc. Urban Plan. 2000, 48, 1–18. [Google Scholar] [CrossRef]
- Cheval, S.; Dumitrescu, A.; Irașoc, A.; Paraschiv, M.-G.; Perry, M.; Ghent, D. MODIS-based climatology of the Surface Urban Heat Island at country scale (Romania). Urban Clim. 2021, 41, 101056. [Google Scholar] [CrossRef]
- Hartz, D.; Prashad, L.; Hedquist, B.; Golden, J.; Brazel, A. Linking satellite images and hand-held infrared thermography to observed neighborhood climate conditions. Remote Sens. Environ. 2006, 104, 190–200. [Google Scholar] [CrossRef]
- Lu, D.; Weng, Q. Spectral mixture analysis of ASTER images for examining the relationship between urban thermal features and biophysical descriptors in Indianapolis, Indiana, USA. Remote Sens. Environ. 2006, 104, 157–167. [Google Scholar] [CrossRef]
- Meng, F.; Liu, M. Remote-sensing image-based analysis of the patterns of urban heat islands in rapidly urbanizing Jinan, China. Int. J. Remote Sens. 2013, 34, 8838–8853. [Google Scholar] [CrossRef]
- Pu, R.; Gong, P.; Michishita, R.; Sasagawa, T. Assessment of multi-resolution and multi-sensor data for urban surface temperature retrieval. Remote Sens. Environ. 2006, 104, 211–225. [Google Scholar] [CrossRef]
- Zakšek, K.; Oštir, K. Downscaling land surface temperature for urban heat island diurnal cycle analysis. Remote Sens. Environ. 2012, 117, 114–124. [Google Scholar] [CrossRef]
- Chen, X.-L.; Zhao, H.-M.; Li, P.-X.; Yin, Z.-Y. Remote sensing image-based analysis of the relationship between urban heat island and land use/cover changes. Remote Sens. Environ. 2006, 104, 133–146. [Google Scholar] [CrossRef]
- Jamei, Y.; Rajagopalan, P.; Sun, Q. Spatial structure of surface urban heat island and its relationship with vegetation and built-up areas in Melbourne, Australia. Sci. Total Environ. 2018, 659, 1335–1351. [Google Scholar] [CrossRef] [PubMed]
- Chen, L.; Wang, X.; Cai, X.; Yang, C.; Lu, X. Seasonal Variations of Daytime Land Surface Temperature and Their Underlying Drivers over Wuhan, China. Remote Sens. 2021, 13, 323. [Google Scholar] [CrossRef]
- Marzban, F.; Sodoudi, S.; Preusker, R. The influence of land-cover type on the relationship between NDVI–LST and LST-Tair. Int. J. Remote Sens. 2017, 39, 1377–1398. [Google Scholar] [CrossRef]
- Wloczyk, C.; Borg, E.; Richter, R.; Miegel, K. Estimation of instantaneous air temperature above vegetation and soil surfaces from Landsat 7 ETM+ data in northern Germany. Int. J. Remote Sens. 2011, 32, 9119–9136. [Google Scholar] [CrossRef]
- Anniballe, R.; Bonafoni, S.; Pichierri, M. Spatial and temporal trends of the surface and air heat island over Milan using MODIS data. Remote Sens. Environ. 2014, 150, 163–171. [Google Scholar] [CrossRef]
- Lazaar, A.; El Hammouti, K.; Naiji, Z.; Pradhan, B.; Gourfi, A.; Andich, K.; Monir, A. The manifestation of VIS-NIRS spectroscopy data to predict and map soil texture in the Triffa plain (Morocco). Kuwait J. Sci. 2020, 48, 8012. [Google Scholar] [CrossRef]
- HCP Recensement Général de la Population et de l’Habitat de 2014, le Haut Commissariat au Plan du Maroc. 2014. Available online: https://www.hcp.ma/Recensement-General-de-la-Population-et-de-l-Habitat-RGPH-2014_a2945.html (accessed on 29 May 2022).
- Taïbi, A.N.; Hannani, M. El Le Végétal dans l’Espace Public des Villes Coloniales de Marrakech, Alger, Antananarivo et To-liara. Enjeux Socio-Environnementaux d’un «Patrimoine» vert dans un Contexte Urbain en Mutation; CEAUP—Centro de Estudos Africanos da Universidade do Porto: Porto, Portugal, 2020; pp. 27–38. [Google Scholar]
- Gillot, G. La ville Nouvelle Coloniale au Maroc: Moderne, Salubre, Verte, Vaste.; La Maison.; les Villes Nouvelles Écrit par François Leimdorfer. 2014. Available online: https://halshs.archives-ouvertes.fr/halshs-01272511/document (accessed on 5 May 2022).
- Nasiri, V.; Deljouei, A.; Moradi, F.; Sadeghi, S.M.M.; Borz, S.A. Land Use and Land Cover Mapping Using Sentinel-2, Landsat-8 Satellite Images, and Google Earth Engine: A Comparison of Two Composition Methods. Remote Sens. 2022, 14, 1977. [Google Scholar] [CrossRef]
- Richards, J.A. Remote Sensing Digital Image Analysis: An introduction; Springer: Cham, Switzerland, 2013; ISBN 9783642300622. [Google Scholar]
- Vigneshwaran, S.; Kumar, S.V. Extraction of built-up area using high resolution sentinel-2A and google satellite imagery. ISPRS—Int. Arch. Photogramm. Remote Sens. Spat. Inf. Sci. 2018, 42, 165–169. [Google Scholar] [CrossRef]
- USGS. Landsat Data Users Handbook. Available online: https://www.usgs.gov/ (accessed on 5 January 2022).
- Weier, J.; Herring, D. Measuring Vegetation (NDVI & EVI)—Normalized Difference Vegetation Index (NDVI); Nasa Earth Observatory: Springdale, UT, USA, 2000.
- PMuhammad, Y.; Sheng, H.; Sami, U.; Rahman, I.; Atif, Z.; Asif, M. Estimation of Land Surface Temperature using LAND-SAT-8 Data-A Case Study of District Malakand, Khyber Pakhtunkhwa, Pakistan. J. Lib. Arts Humanit. 2020, 1, 140–148. [Google Scholar]
- Gallo, K.P.; Owen, T.W. Satellite-Based Adjustments for the Urban Heat Island Temperature Bias. J. Appl. Meteorol. 1999, 38, 806–813. [Google Scholar] [CrossRef]
- Gallo, K.P.; McNab, A.L.; Karl, T.R.; Brown, J.F.; Hood, J.J.; Tarpley, J.D. The Use of NOAA AVHRR Data for Assessment of the Urban Heat Island Effect. J. Appl. Meteorol. 1993, 32, 899–908. [Google Scholar] [CrossRef]
- Petralli, M.; Prokopp, A.; Morabito, M.; Bartolini, G.; Torrigiani, T.; Orlandini, S. Ruolo Delle Aree Verdi Nella Mitiga-zione Dell’Isola Di Calore Urbana: Uno Studio Nella Città Di Firenze. Riv. Ital. di Agrometeorol. 2006, 1. Available online: https://www.mendeley.com/catalogue/1901752a-f70d-3806-acec-3fe702778ac0/?utm_source=desktop&utm_medium=1.19.8&utm_campaign=open_catalog&userDocumentId=%7B932e2722-18fd-3001-9592-f1826dffbc22%7D (accessed on 29 May 2022).
- dos Santos, A.R.; de Oliveira, F.S.; da Silva, A.G.; Gleriani, J.M.; Gonçalves, W.; Moreira, G.L.; Silva, F.G.; Branco, E.R.F.; Moura, M.M.; da Silva, R.G.; et al. Spatial and temporal distribution of urban heat islands. Sci. Total Environ. 2017, 605–606, 946–956. [Google Scholar] [CrossRef] [PubMed]
- Fujibe, F. Urban warming in Japanese cities and its relation to climate change monitoring. Int. J. Clim. 2011, 31, 162–173. [Google Scholar] [CrossRef]
- Sodoudi, S.; Shahmohamadi, P.; Vollack, K.; Cubasch, U.; Che-Ani, A.I. Mitigating the urban heat island effect in megacity tehran. Adv. Meteorol. 2014, 2014, 547974. [Google Scholar] [CrossRef]
- Vargo, J.; Stone, B.; Habeeb, D.; Liu, P.; Russell, A. The social and spatial distribution of temperature-related health impacts from urban heat island reduction policies. Environ. Sci. Policy 2016, 66, 366–374. [Google Scholar] [CrossRef]
- Zhou, D.; Zhang, L.; Hao, L.; Sun, G.; Liu, Y.; Zhu, C. Spatiotemporal trends of urban heat island effect along the urban development intensity gradient in China. Sci. Total Environ. 2016, 544, 617–626. [Google Scholar] [CrossRef] [PubMed]
- Al-Saadi, L.M.; Jaber, S.H.; Al-Jiboori, M.H. Variation of urban vegetation cover and its impact on minimum and maximum heat islands. Urban Clim. 2020, 34, 100707. [Google Scholar] [CrossRef]
- Farhadi, H.; Faizi, M.; Sanaieian, H. Mitigating the urban heat island in a residential area in Tehran: Investigating the role of vegetation, materials, and orientation of buildings. Sustain. Cities Soc. 2019, 46, 101448. [Google Scholar] [CrossRef]
- Senanayake, I.; Welivitiya, W.; Nadeeka, P. Remote sensing based analysis of urban heat islands with vegetation cover in Colombo city, Sri Lanka using Landsat-7 ETM+ data. Urban Clim. 2013, 5, 19–35. [Google Scholar] [CrossRef]
- Stache, E.; Schilperoort, B.; Ottelé, M.; Jonkers, H. Comparative analysis in thermal behaviour of common urban building materials and vegetation and consequences for urban heat island effect. Build. Environ. 2021, 213, 108489. [Google Scholar] [CrossRef]
- Guha, S.; Govil, H.; Dey, A.; Gill, N. Analytical study of land surface temperature with NDVI and NDBI using Landsat 8 OLI and TIRS data in Florence and Naples city, Italy. Eur. J. Remote Sens. 2018, 51, 667–678. [Google Scholar] [CrossRef]
- Sharifi, E.; Sivam, A.; Karuppannan, S.; Boland, J. Landsat Surface Temperature Data Analysis for Urban Heat Resilience: Case Study of Adelaide. In Lecture Notes in Geoinformation and Cartography; Springer: New York, NY, USA, 2017; pp. 433–447. [Google Scholar] [CrossRef]
- Nakata-Osaki, C.M.; Souza, L.C.L.; Rodrigues, D.S. THIS—Tool for Heat Island Simulation: A GIS extension model to calculate urban heat island intensity based on urban geometry. Comput. Environ. Urban Syst. 2018, 67, 157–168. [Google Scholar] [CrossRef]
- Zha, Y.; Gao, J.; Ni, S. Use of normalized difference built-up index in automatically mapping urban areas from TM imagery. Int. J. Remote Sens. 2003, 24, 583–594. [Google Scholar] [CrossRef]
- He, C.; Shi, P.; Xie, D.; Zhao, Y. Improving the normalized difference built-up index to map urban built-up areas using a semiautomatic segmentation approach. Remote Sens. Lett. 2010, 1, 213–221. [Google Scholar] [CrossRef]
- Chakraborty, T.; Lee, X. A simplified urban-extent algorithm to characterize surface urban heat islands on a global scale and examine vegetation control on their spatiotemporal variability. Int. J. Appl. Earth Obs. Geoinf. ITC J. 2018, 74, 269–280. [Google Scholar] [CrossRef]
- Kim, G. Assessing Urban Forest Structure, Ecosystem Services, and Economic Benefits on Vacant Land. Sustainability 2016, 8, 679. [Google Scholar] [CrossRef]
- EPA Urban Heat Island Basics. Reducing Urban Heat Islands: Compendium of Strategies. In Heat Island Effect; US EPA: Washington, DC, USA, 2008. [Google Scholar]
- El Hannani, M.; Taïbi, A.N.; Brabra, N.; Giffon, S. Les enjeux du végétal dans une ville du « Sud » The Importance of Plant Life in a City of the “South”—The Case of Marra-kesh and the End of "Garden-City” Model. Proj. Paysage 2017, 16, 5862. [Google Scholar] [CrossRef]
- Algretawee, H.; Rayburg, S.; Neave, M. Estimating the effect of park proximity to the central of Melbourne city on Urban Heat Island (UHI) relative to Land Surface Temperature (LST). Ecol. Eng. 2019, 138, 374–390. [Google Scholar] [CrossRef]
- Bourscheidt, V. Análise da influência do uso do solo nas variações de temperatura utilizando imagens MODIS e LAND-SAT 8. In Proceedings of the XVII Simpósio Bras. Sensoriamento Remoto—SBSR, João Pessoa, Brazil, 25–29 April 2015. [Google Scholar]
- Abir, F.A.; Saha, R. Assessment of land surface temperature and land cover variability during winter: A spatio-temporal analysis of Pabna municipality in Bangladesh. Environ. Chall. 2021, 4, 100167. [Google Scholar] [CrossRef]
- Dissanayake, D.; Morimoto, T.; Ranagalage, M.; Murayama, Y. Land-Use/Land-Cover Changes and Their Impact on Surface Urban Heat Islands: Case Study of Kandy City, Sri Lanka. Climate 2019, 7, 99. [Google Scholar] [CrossRef]
- Knight, J.H.; Minasny, B.; McBratney, A.; Koen, T.B.; Murphy, B.W. Soil temperature increase in eastern Australia for the past 50 years. Geoderma 2018, 313, 241–249. [Google Scholar] [CrossRef]
- Deng, Y.; Wang, S.; Bai, X.; Tian, Y.; Wu, L.; Xiao, J.; Chen, F.; Qian, Q. Relationship among land surface temperature and LUCC, NDVI in typical karst area. Sci. Rep. 2018, 8, 64. [Google Scholar] [CrossRef]
- Ibrahim, F.; Rasul, G. Urban Land Use Land Cover Changes and Their Effect on Land Surface Temperature: Case Study Using Dohuk City in the Kurdistan Region of Iraq. Climate 2017, 5, 13. [Google Scholar] [CrossRef]
- Raynolds, M.K.; Comiso, J.C.; Walker, D.A.; Verbyla, D. Relationship between satellite-derived land surface temperatures, arctic vegetation types, and NDVI. Remote Sens. Environ. 2008, 112, 1884–1894. [Google Scholar] [CrossRef]
- Synnefa, A. Cool-colored coatings fight the urban heat-island effect. SPIE Newsroom 2007. [Google Scholar] [CrossRef]
- Akbari, H.; Pomerantz, M.; Taha, H. Cool surfaces and shade trees to reduce energy use and improve air quality in urban areas. Sol. Energy 2001, 70, 295–310. [Google Scholar] [CrossRef]
- Urban, B.; Roth, K. Guidelines for Selecting Cool Roofs; U.S. Department of Energy: Washington, DC, USA, 2010.
- Debbage, N.; Shepherd, J.M. The urban heat island effect and city contiguity. Comput. Environ. Urban Syst. 2015, 54, 181–194. [Google Scholar] [CrossRef]
- Taslim, S.; Parapari, D.M.; Shafaghat, A. Urban Design Guidelines to Mitigate Urban Heat Island (UHI) Effects In Hot-Dry Cities. J. Teknol. 2015, 74. [Google Scholar] [CrossRef]
- Sari, D.P. A Review of How Building Mitigates the Urban Heat Island in Indonesia and Tropical Cities. Earth 2021, 2, 653–666. [Google Scholar] [CrossRef]
- Österreicher, D.; Sattler, S. Maintaining Comfortable Summertime Indoor Temperatures by Means of Passive Design Measures to Mitigate the Urban Heat Island Effect—A Sensitivity Analysis for Residential Buildings in the City of Vienna. Urban Sci. 2018, 2, 66. [Google Scholar] [CrossRef]
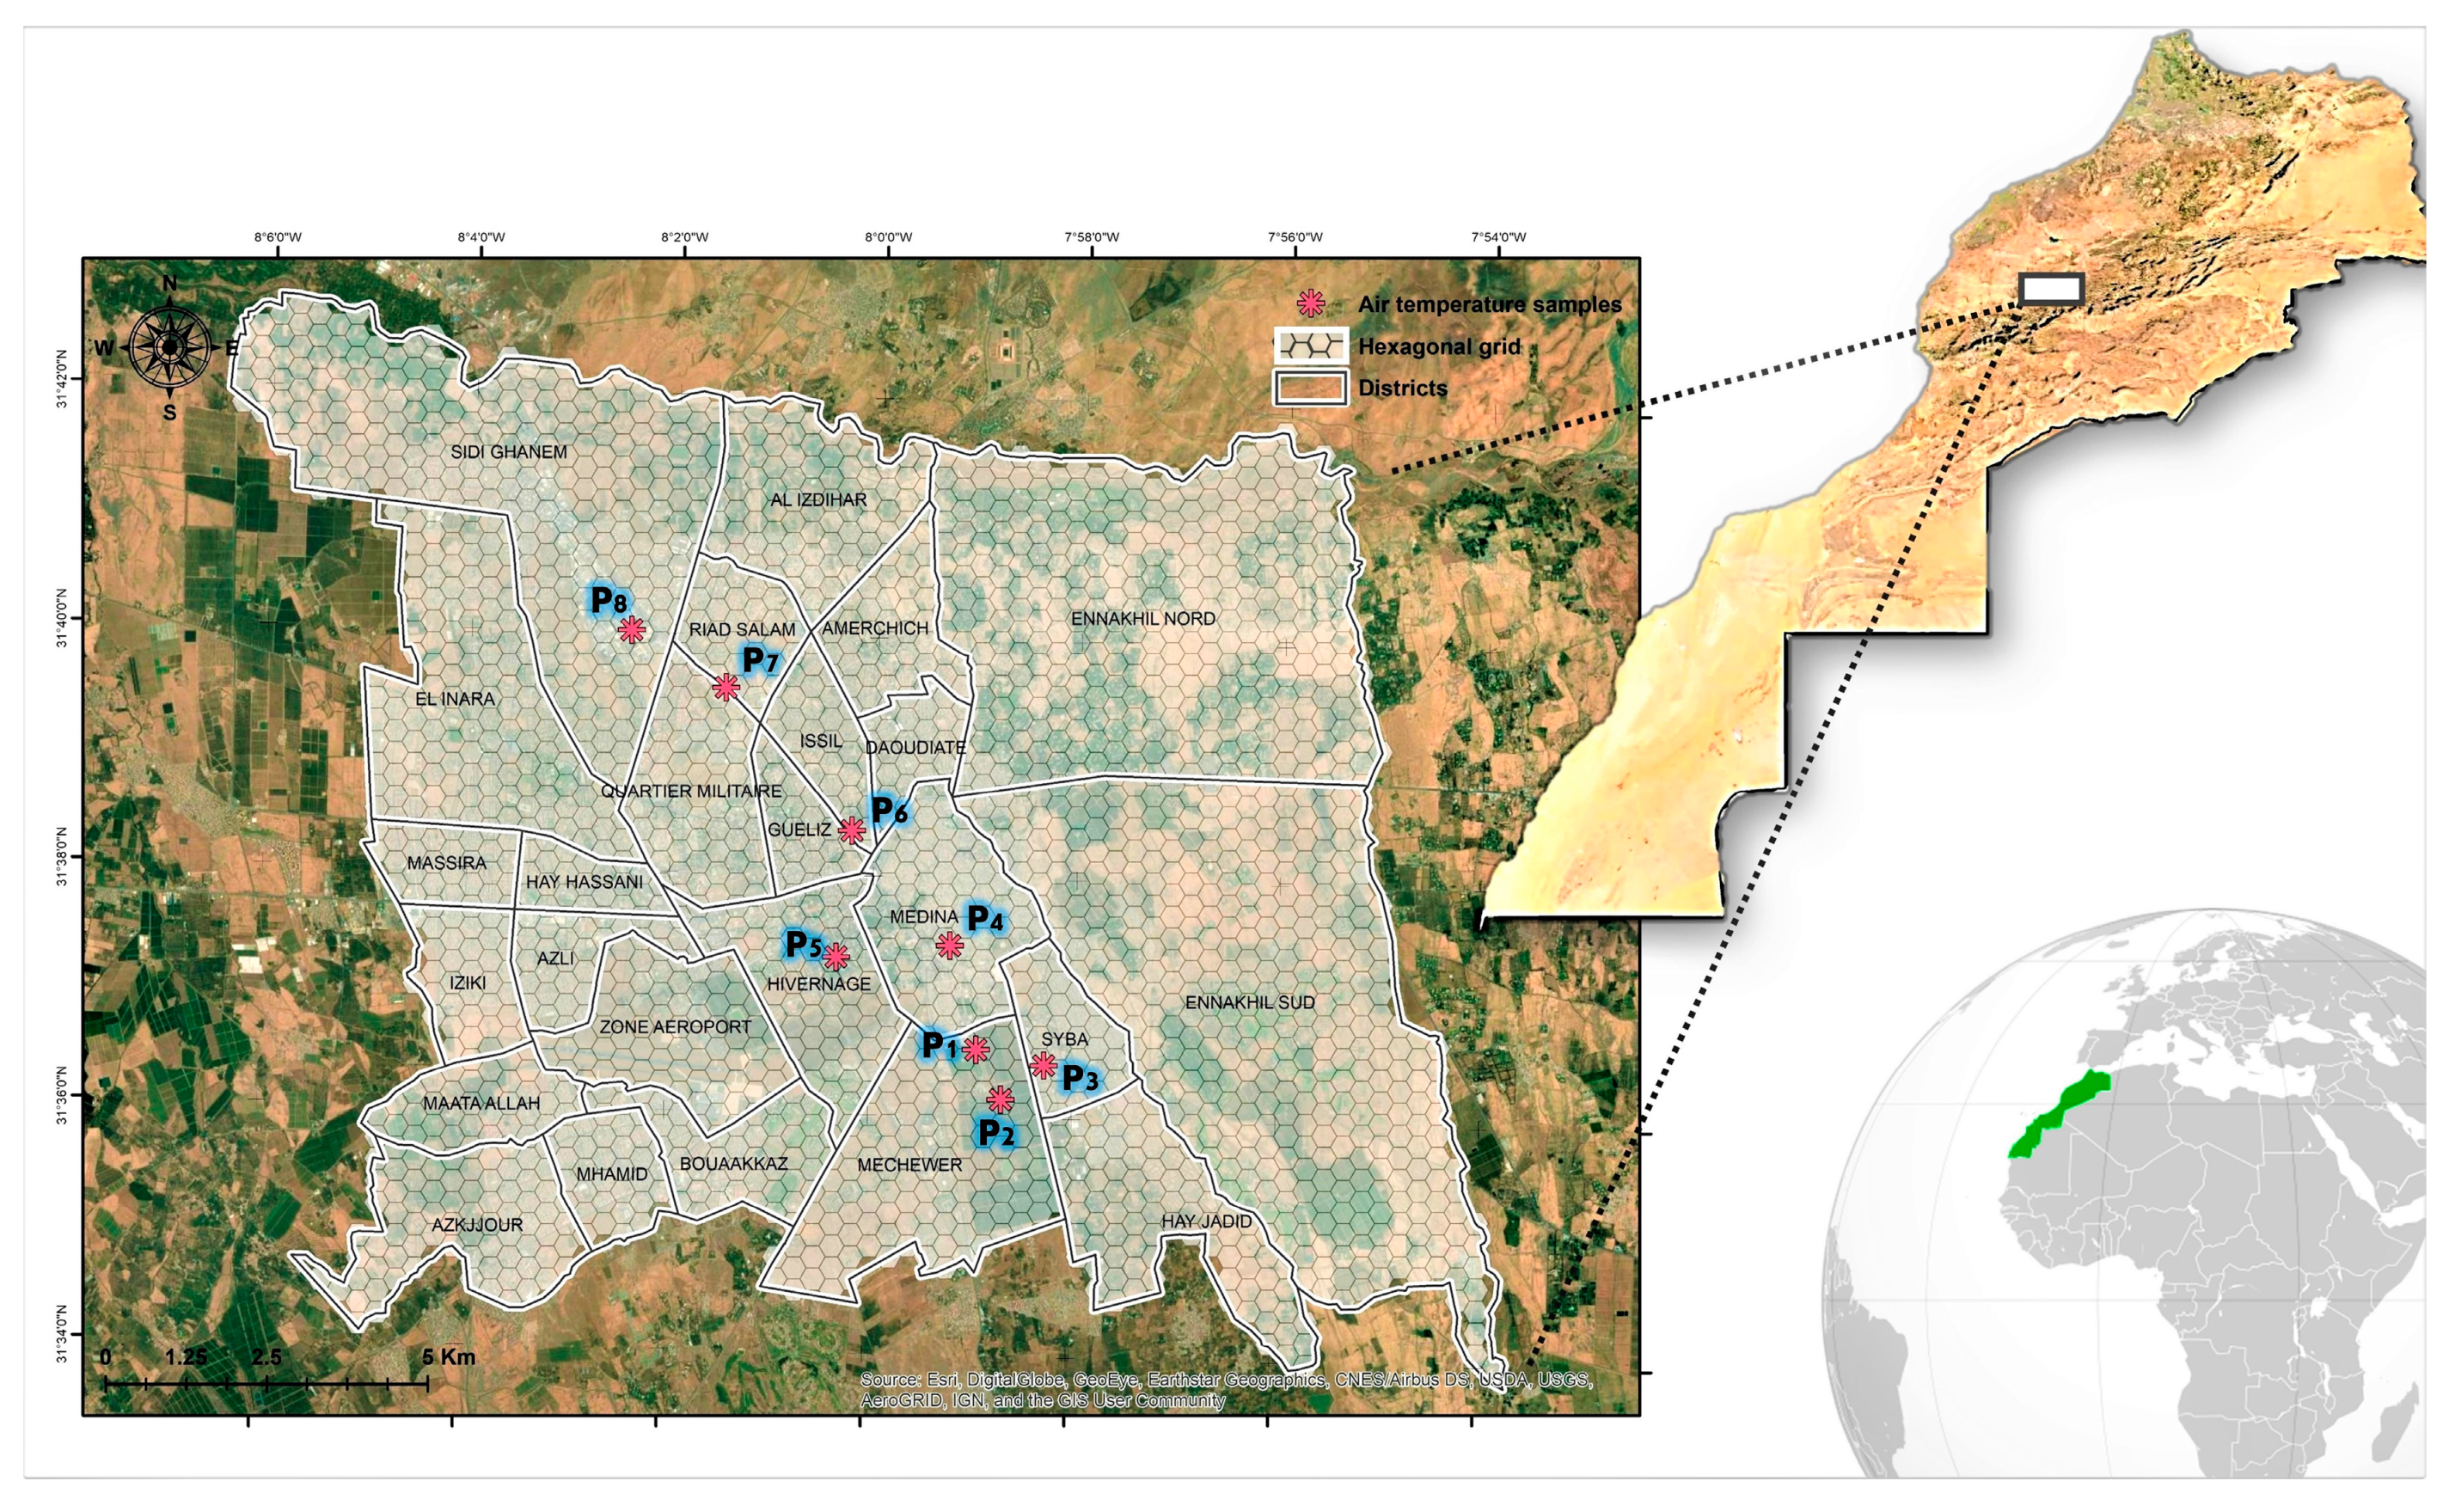
Figure 1.
Location of the study area, air temperature samples, districts and hexagonal grid used.

Figure 2.
Methodology for the determination of the vegetation cover, built-up areas and bare areas.

Figure 3.
Variation in vegetation in relation to built-up and bare surfaces.

Figure 4.
Spatial variation in land surface temperature.

Figure 5.
Average temperature by district.

Figure 6.
Relationship between LST, NDVI, bare areas, vegetated areas and built-up areas.

Figure 7.
Relationship between LST and NDVI from 1985 to 2020.

Figure 8.
Analysis of the relationship between LST and NDVI per built-up area (2020).

Figure 9.
Analysis of the relationship between LST and NDVI by neighbourhood (2020).

Figure 10.
Comparison between observed air temperature and LST.

Figure 11.
The satellite image (A), NDVI (B) and LST (C) of the Agdal Garden and the royal private golf course.
Figure 11.
The satellite image (A), NDVI (B) and LST (C) of the Agdal Garden and the royal private golf course.

Figure 12.
Neighbourhood of the Zone Airport (upper right, the Menara Garden with a water basin).

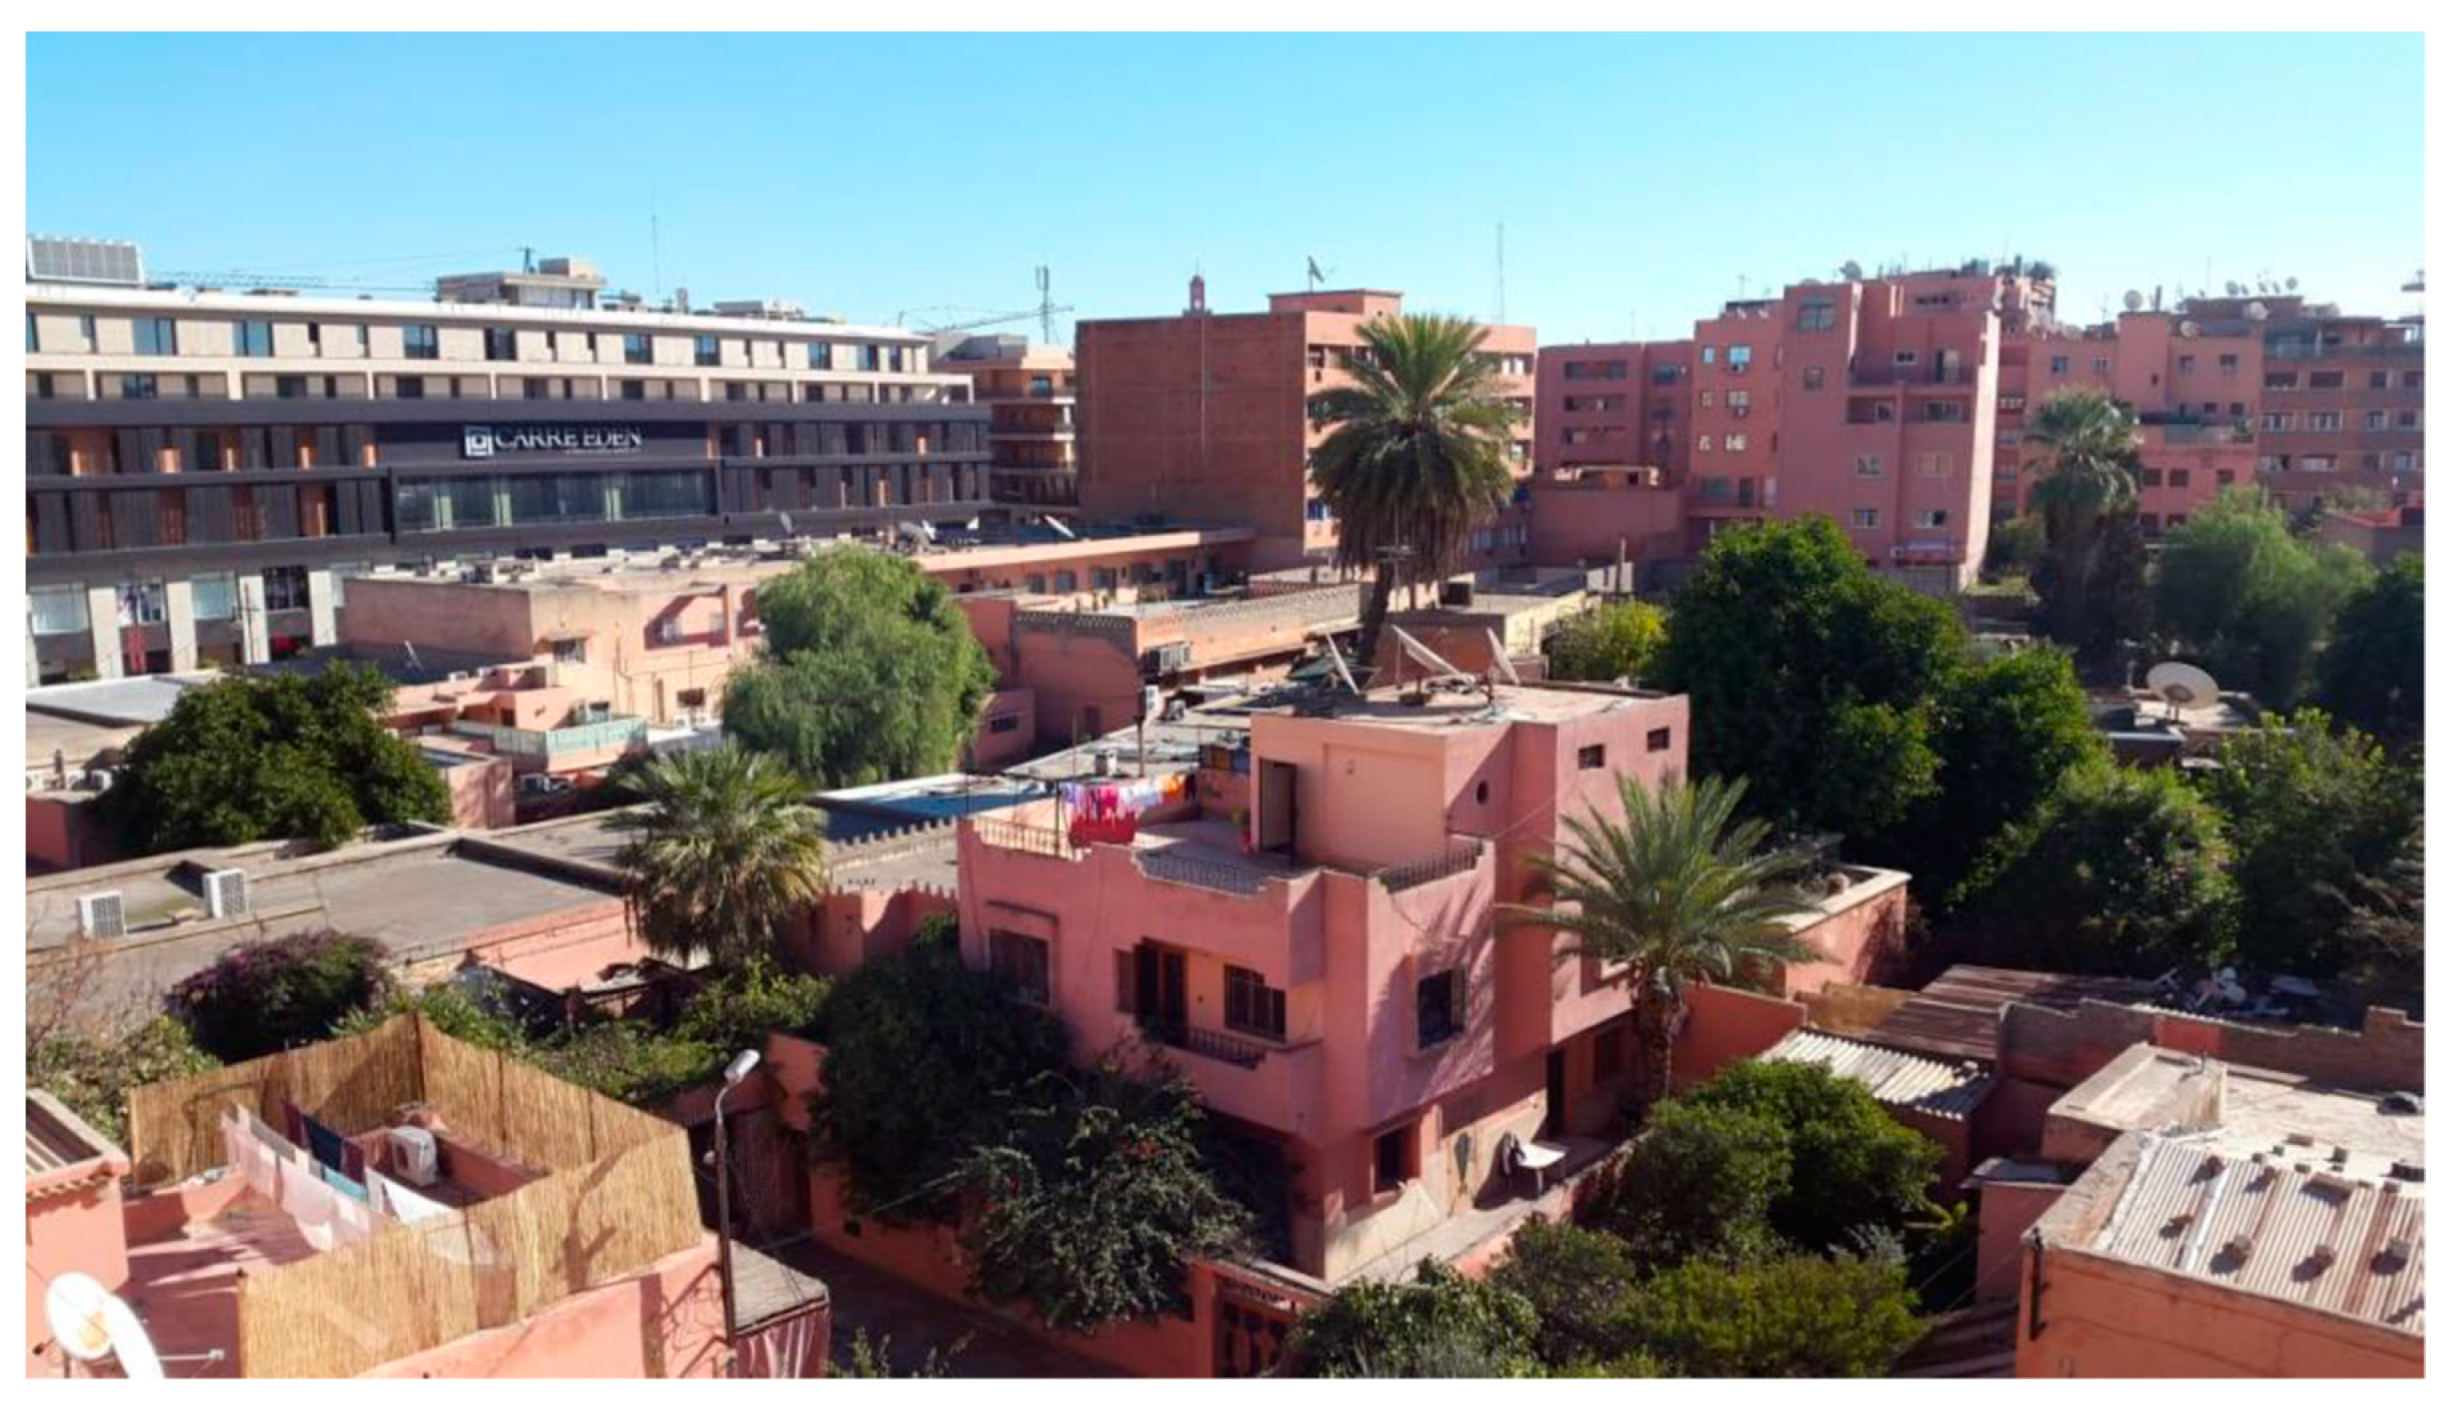
Figure 13.
Panoramic view of the centre of Guéliz.

Figure 14.
The Quartier Industrial in the Sidi Ghanem district.

Figure 15.
The SYBA and Medina district.

Figure 16.
Summary of the spatial variation in LST in the city during the daytime.


Table 1.
Air temperature and humidity sampling points.
| Sample | District | X | Y | Air Temperature (°C) | Humidity (%) | LST (°C) |
|---|---|---|---|---|---|---|
| P1 | Mechewer | 31.60954 | −7.9825 | 31.5 | 48 | 31.26 |
| P2 | Mechewer | 31.6026 | −7.97826 | 33.4 | 46 | 30.51 |
| P3 | SYBA | 31.60755 | −7.97137 | 33 | 45 | 30.96 |
| P4 | Medina | 31.62393 | −7.98717 | 30.5 | 49 | 30.69 |
| P5 | Hivernage | 31.62195 | −8.00576 | 30.2 | 50 | 27.29 |
| P6 | Issil | 31.64318 | −8.0075 | 34.4 | 44 | 31.39 |
| P7 | Riad Salam | 31.65922 | −8.02481 | 37.4 | 38 | 35.47 |
| P8 | Sidi Ghanem | 31.66696 | −8.04049 | 36.9 | 40 | 34.93 |
Table 2.
Satellite products used for the study.
| Satellite | Sensor | No. of MS Bands (Nominal Resolution) | Period |
|---|---|---|---|
| Landsat 5 | TM | 6 (30 m) | 27 July 1985 |
| 9 July 1990 | |||
| 8 August 1995 | |||
| 19 August 2005 | |||
| 16 July 2010 | |||
| Landsat 7 | ETM+ | 6 (30 m) | 13 August 2000 |
| Landsat 8 | OLI/TIRS | 8 (30 m) | 14 July 2015 |
| 12 August 2020 | |||
| Sentinel-2A | 13 (10–20 m) | 14 August 2020 |
Table 3.
Values of K1 and K2 for Landsat 5 (TM), Landsat 7 (ETM+) and Landsat 8 (OLI).
| Sensor | K1 | K2 |
|---|---|---|
| Landsat 5 TM | Band 6 | Band 6 |
| 607.76 | 1260.56 | |
| Landsat 7 ETM+ | Band 6 | Band 6 |
| 666.09 | 1282.71 | |
| Landsat 8 OLI | Band 10 | Band 10 |
| 774.89 | 1321.08 |
Publisher’s Note: MDPI stays neutral with regard to jurisdictional claims in published maps and institutional affiliations. |
© 2022 by the authors. Licensee MDPI, Basel, Switzerland. This article is an open access article distributed under the terms and conditions of the Creative Commons Attribution (CC BY) license (https://creativecommons.org/licenses/by/4.0/).
Share and Cite
MDPI and ACS Style
Gourfi, A.; Taïbi, A.N.; Salhi, S.; Hannani, M.E.; Boujrouf, S. The Surface Urban Heat Island and Key Mitigation Factors in Arid Climate Cities, Case of Marrakesh, Morocco. Remote Sens. 2022, 14, 3935. https://doi.org/10.3390/rs14163935
AMA Style
Gourfi A, Taïbi AN, Salhi S, Hannani ME, Boujrouf S. The Surface Urban Heat Island and Key Mitigation Factors in Arid Climate Cities, Case of Marrakesh, Morocco. Remote Sensing. 2022; 14(16):3935. https://doi.org/10.3390/rs14163935
Chicago/Turabian StyleGourfi, Abdelali, Aude Nuscia Taïbi, Salima Salhi, Mustapha El Hannani, and Said Boujrouf. 2022. "The Surface Urban Heat Island and Key Mitigation Factors in Arid Climate Cities, Case of Marrakesh, Morocco" Remote Sensing 14, no. 16: 3935. https://doi.org/10.3390/rs14163935
Note that from the first issue of 2016, this journal uses article numbers instead of page numbers. See further details here.