
Spatial–Temporal Relationship Study between NWP PWV and Precipitation: A Case Study of ‘July 20’ Heavy Rainstorm in Zhengzhou

 , and
, and
Abstract
:1. Introduction
2. Data and Methodology
2.1. Data Description
2.1.1. MERRA-2 Data
2.1.2. ERA5 Data
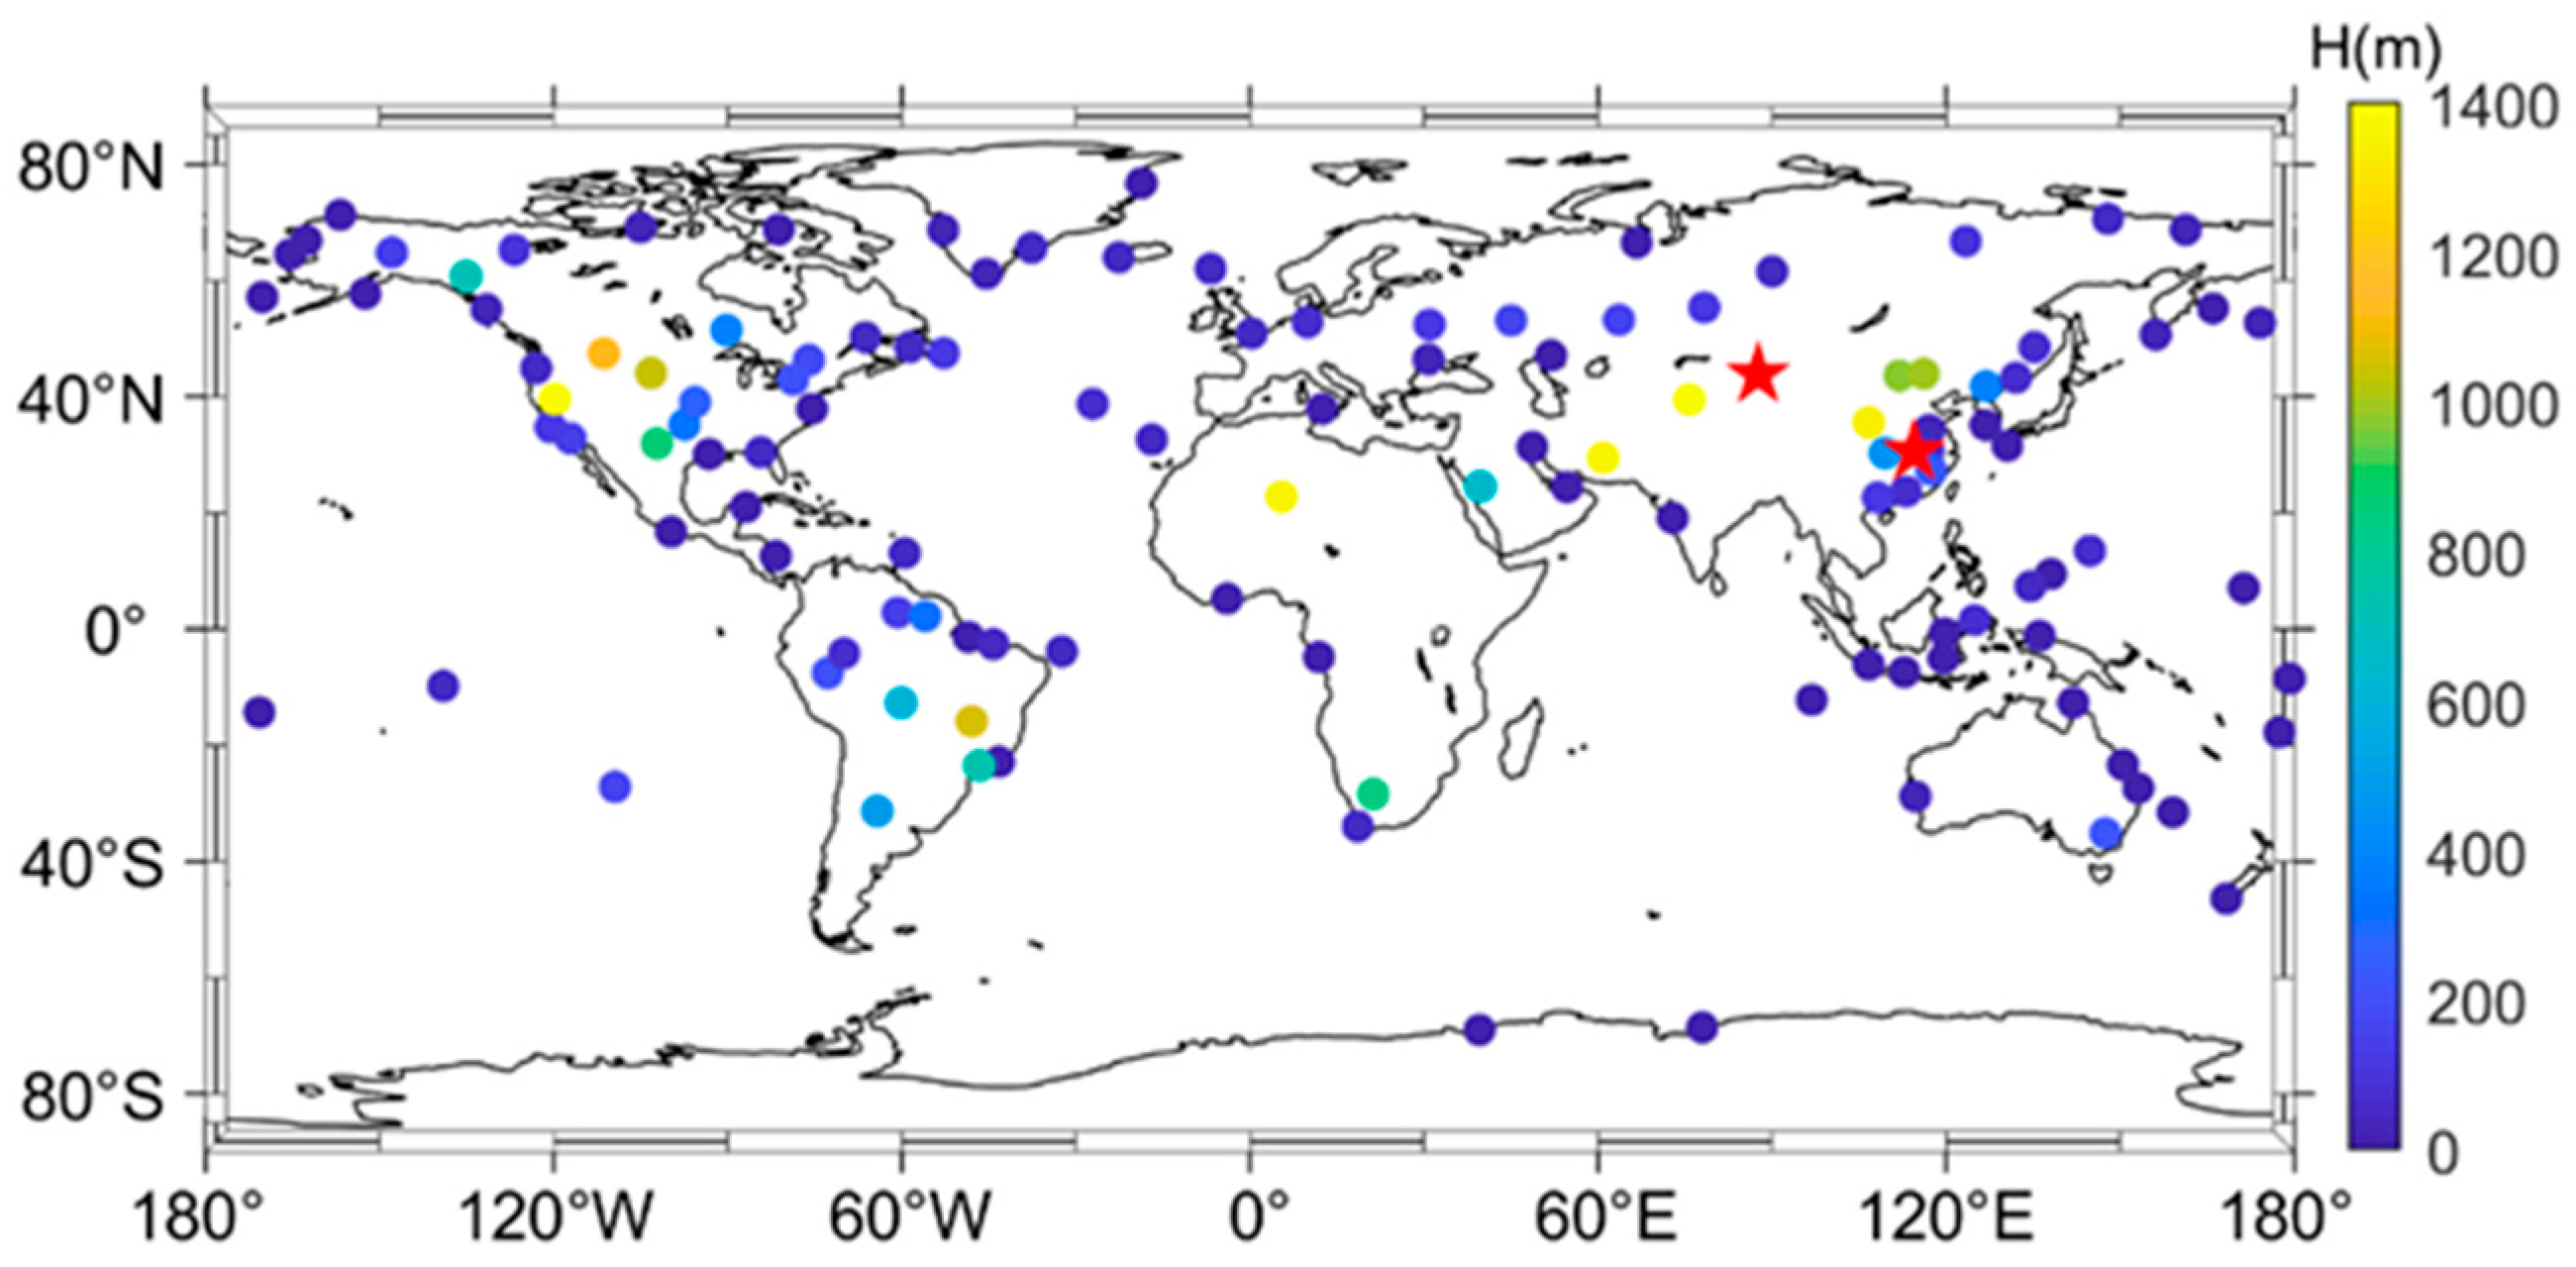
2.1.3. RS Data, GNSS ZTD Data and Precipitation Data
2.2. Methodology
2.2.1. NWP PWV Estimation Method
2.2.2. GNSS PWV Calculation Method
2.2.3. Gross Error Detection of RS PWV
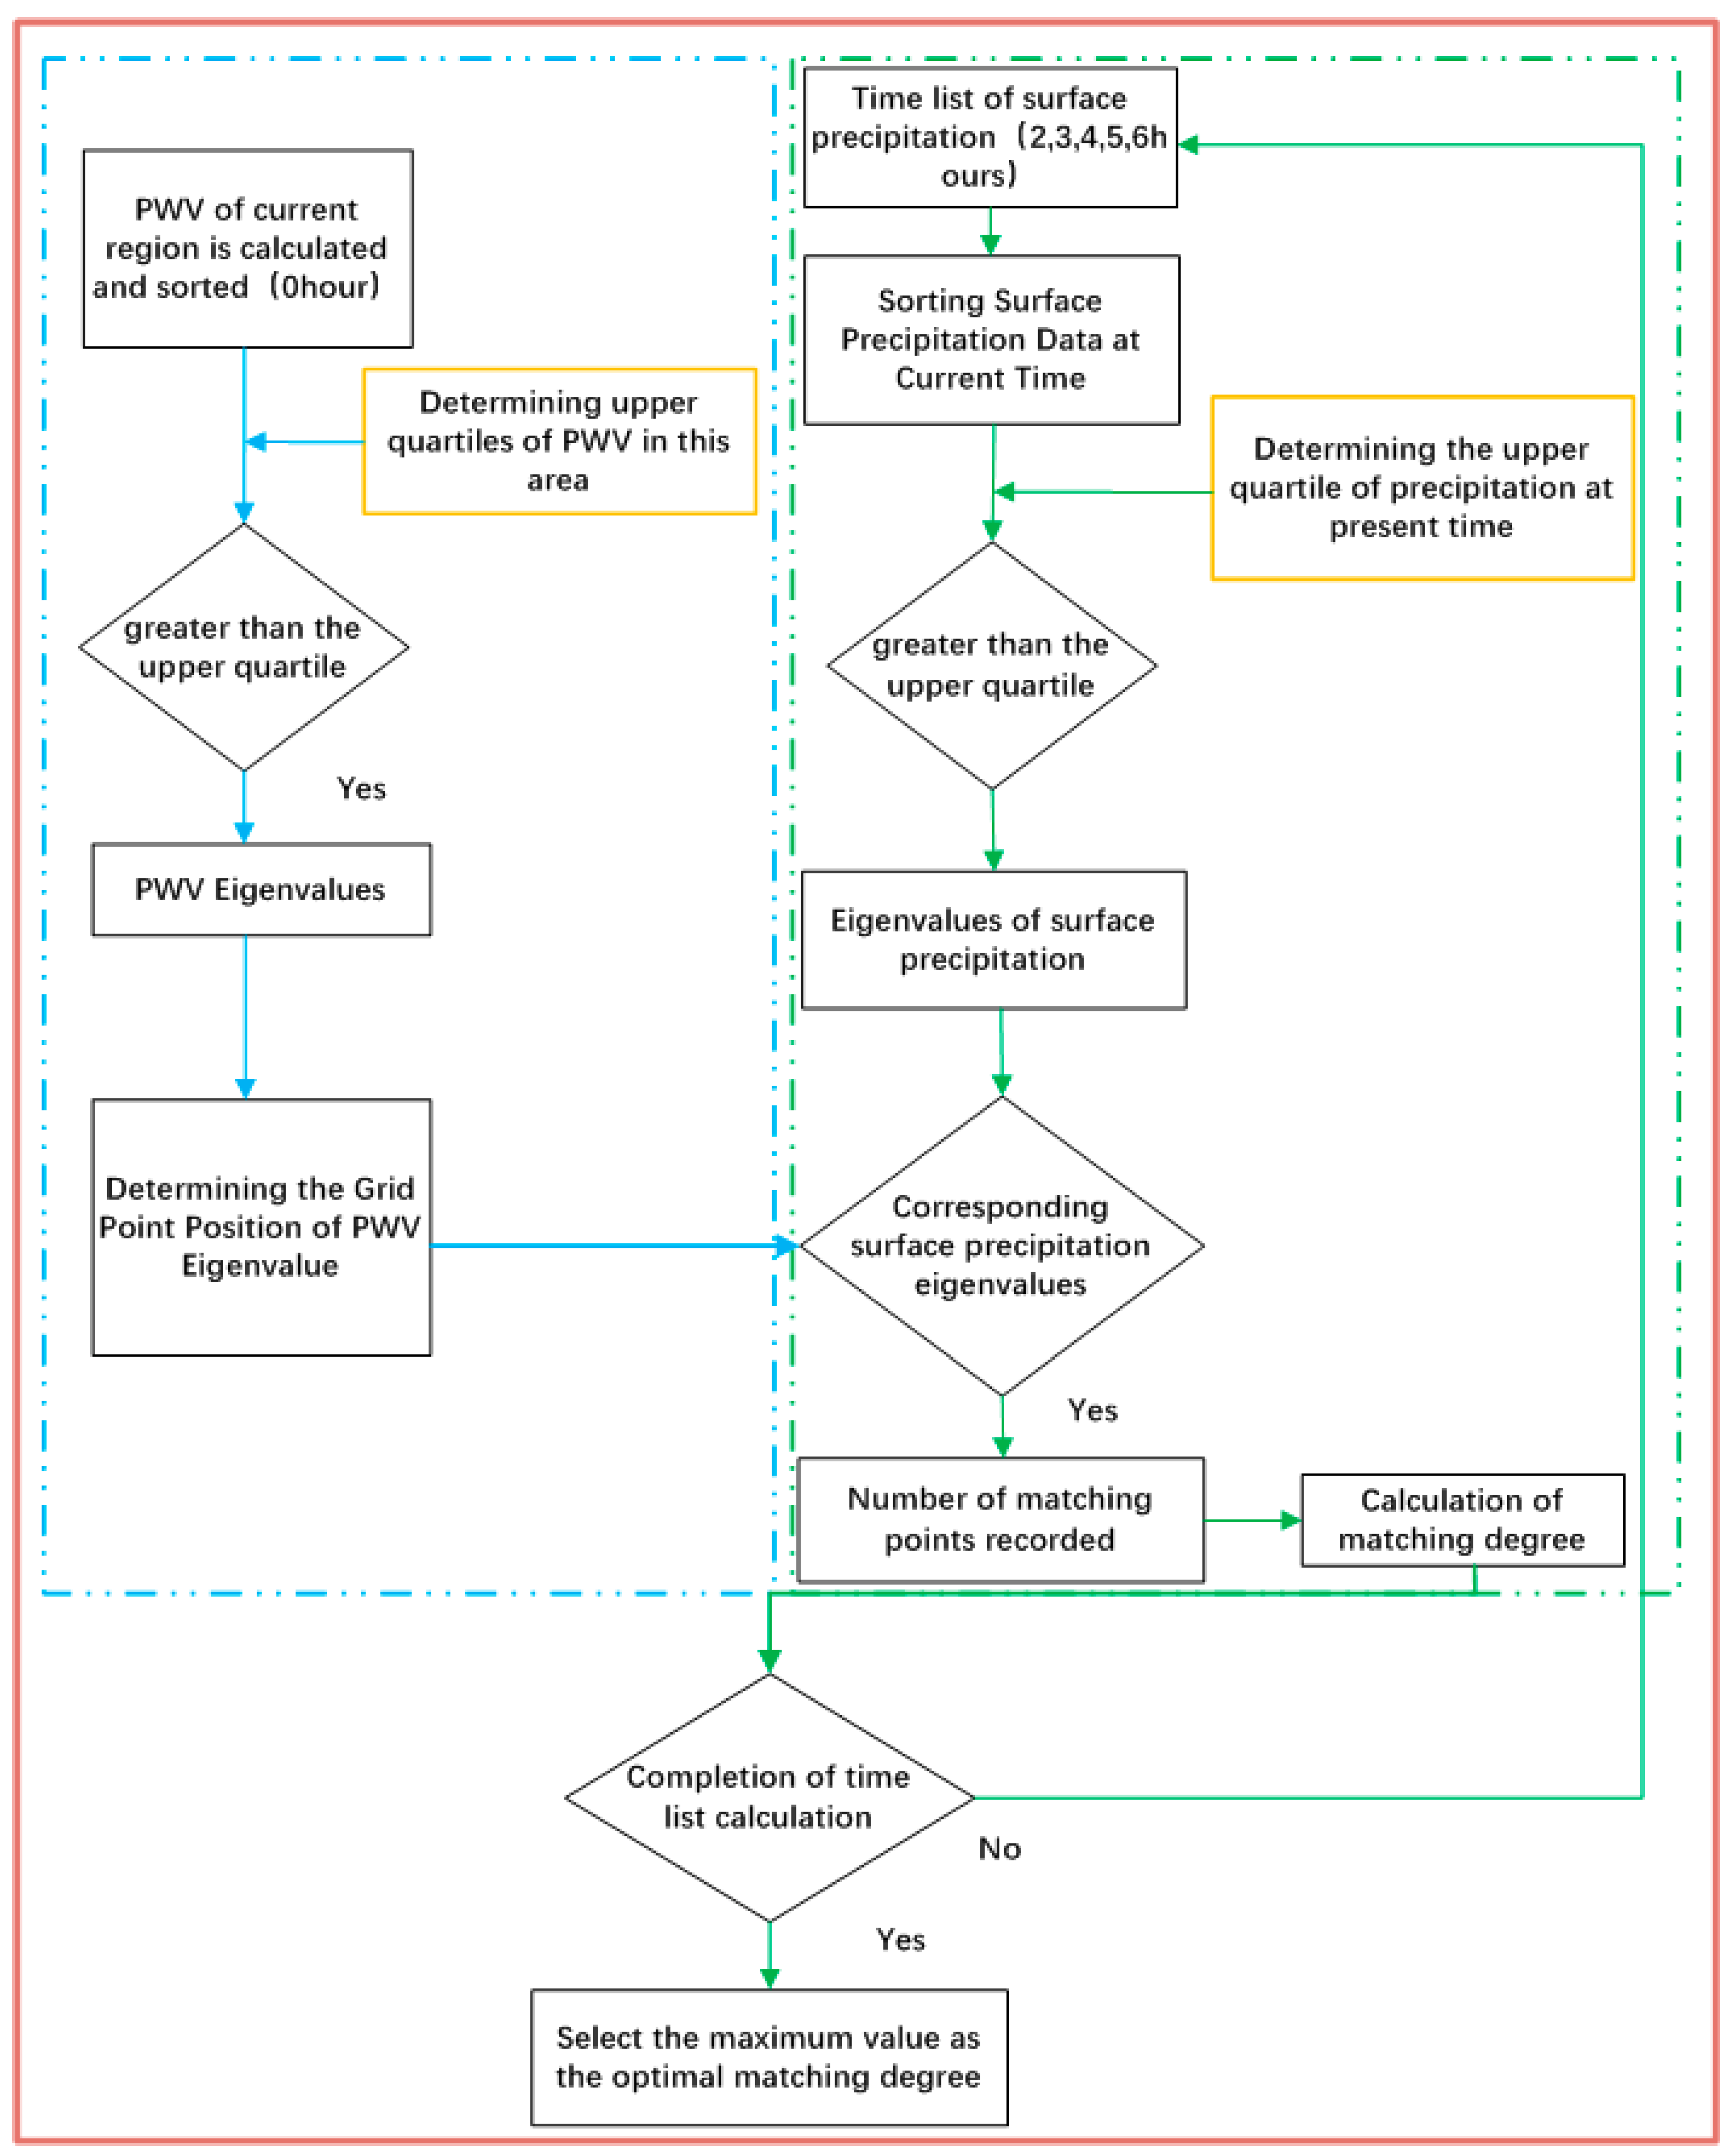
2.2.4. Eigenvalue Matching Method
2.3. Precision Evaluation Index
3. Results and Analysis
3.1. Accuracy Evaluation and Accuracy Affecting Factor Analysis of NWP PWV
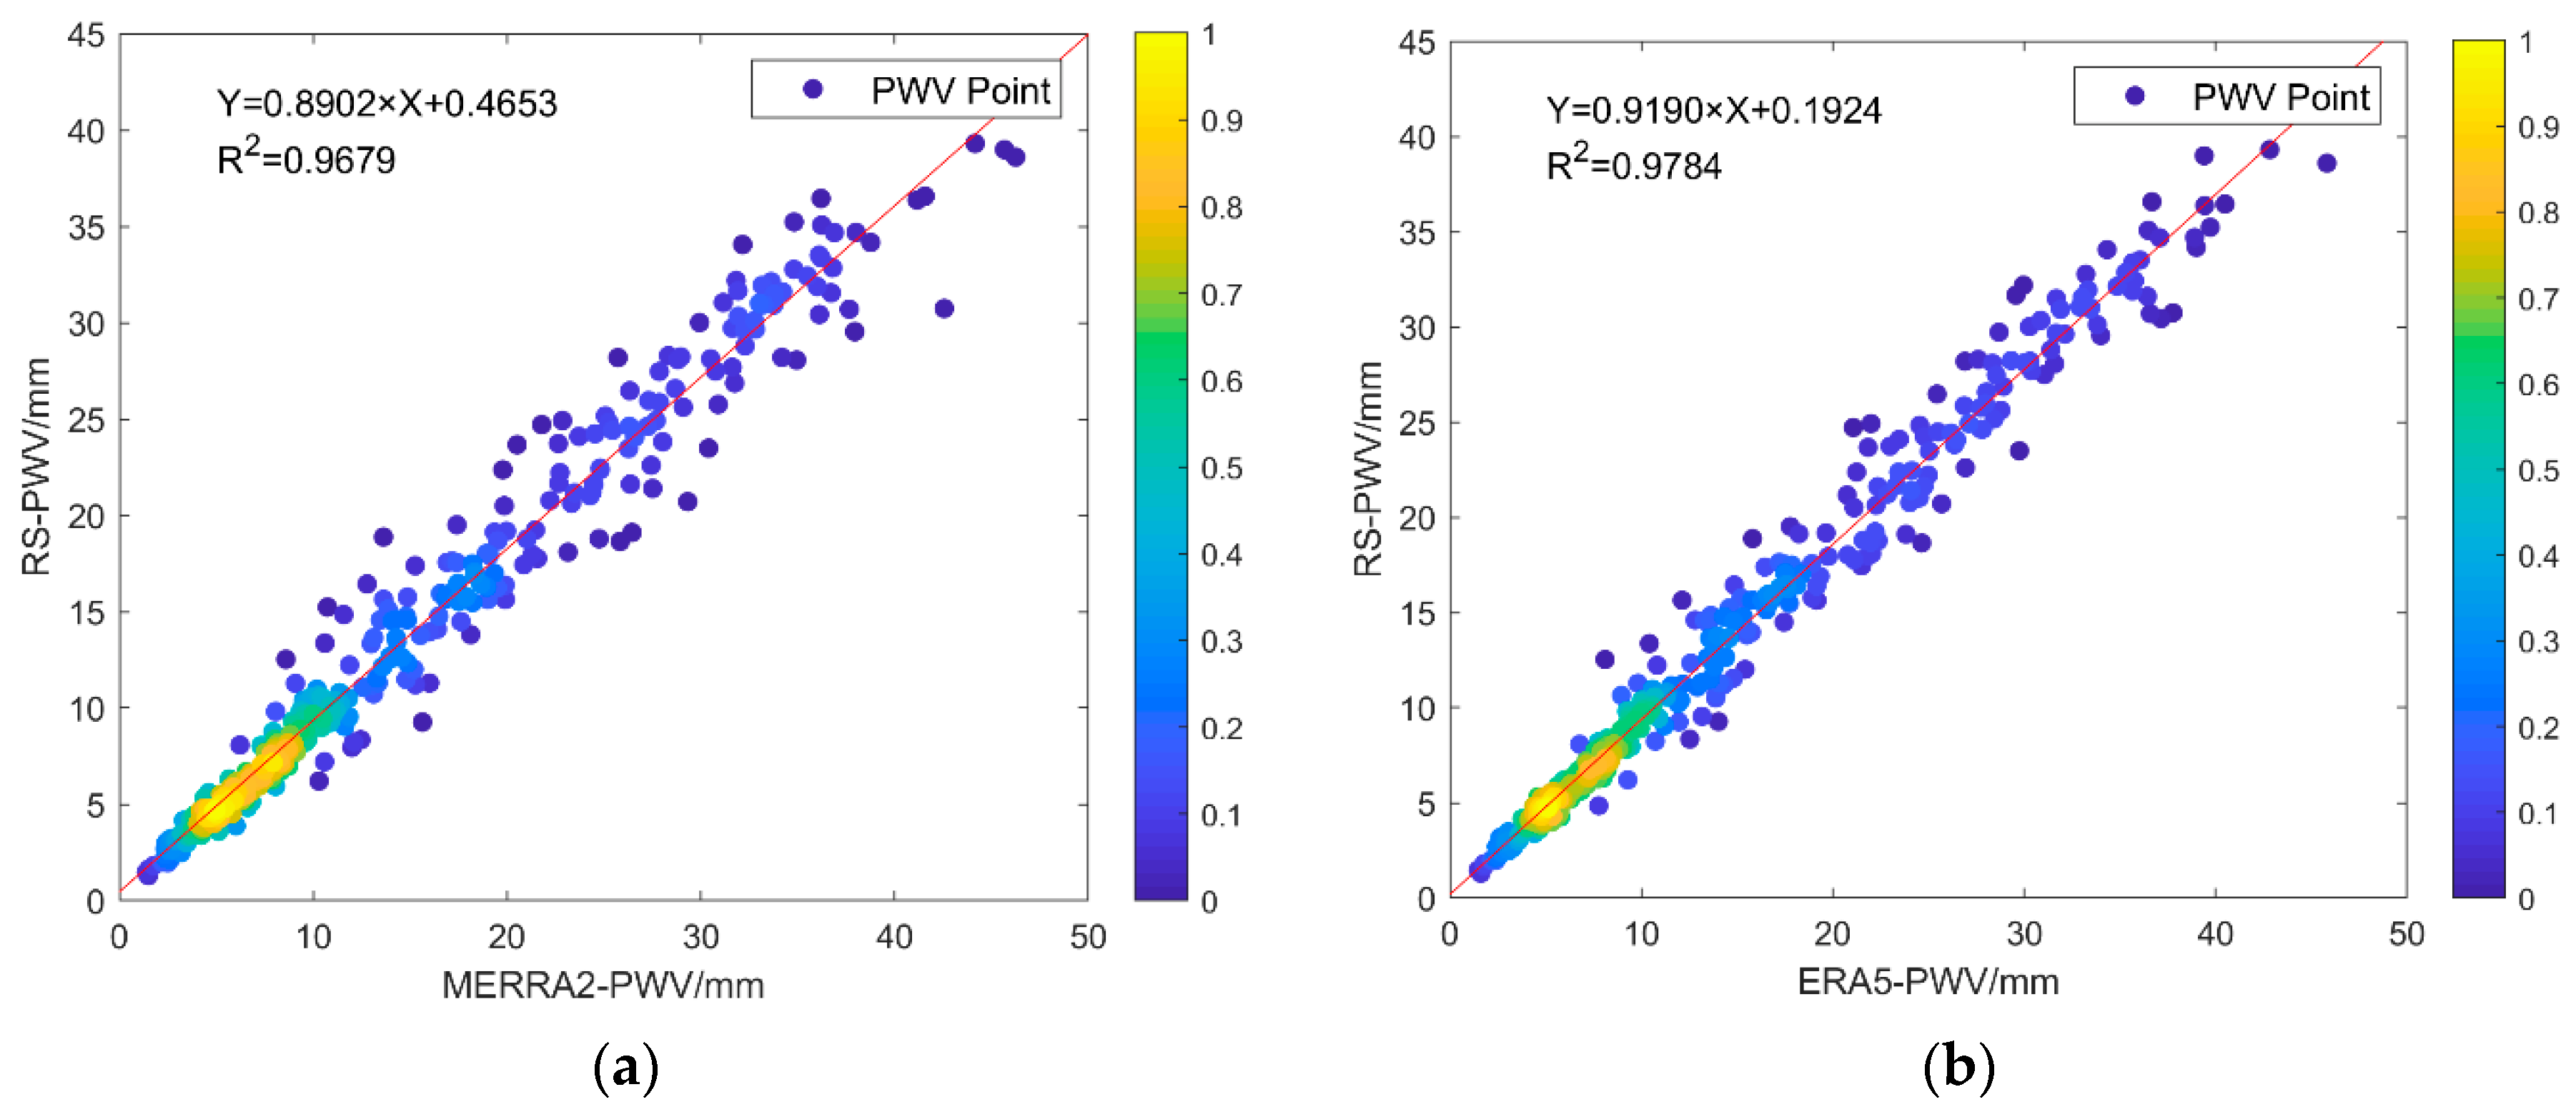
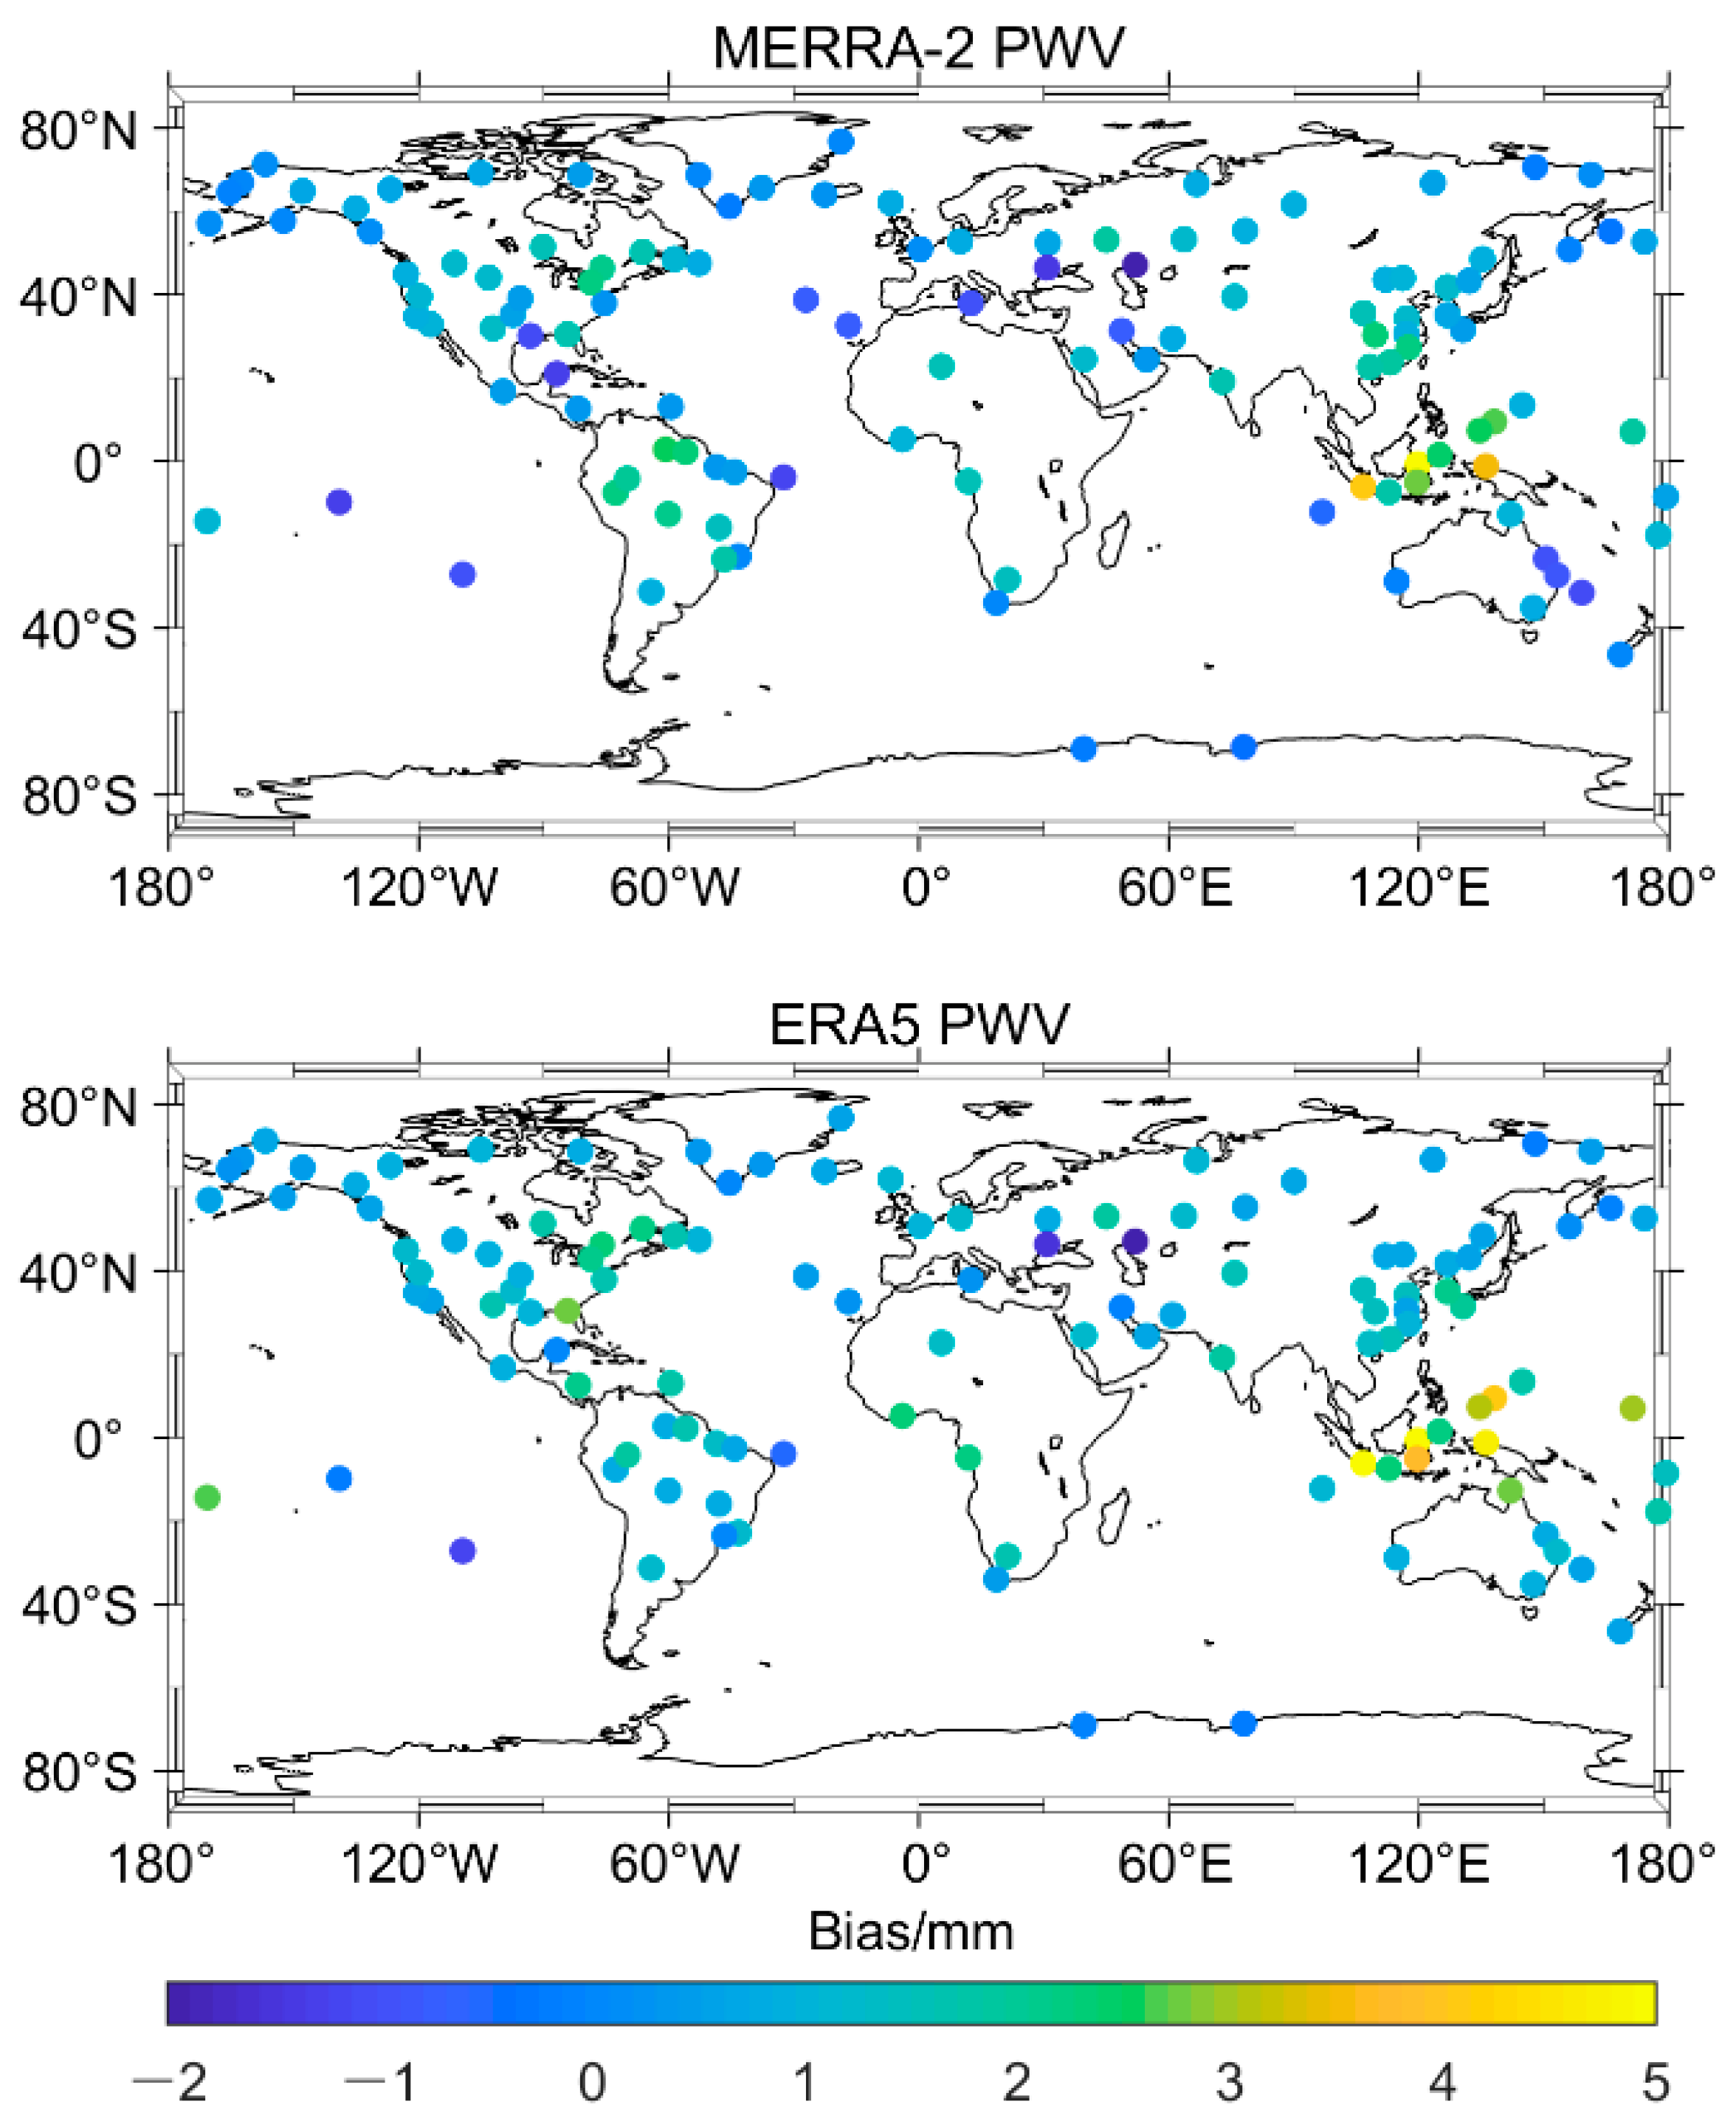
3.1.1. NWP PWV Accuracy Evaluation
3.1.2. NWP PWV Accuracy Affecting Factor Analysis
3.2. Spatial–Temporal Relationship between NWP PWV and Precipitation during the ‘July 20’ Heavy Rainstorm in Zhengzhou in 2021
3.2.1. Qualitative Analysis of the Spatial–Temporal Relationship between NWP PWV and Precipitation
3.2.2. Quantitative Analysis of the Relationship between NWP PWV and Precipitation by Eigenvalue Matching Method
4. Discussion
5. Conclusions
- (1)
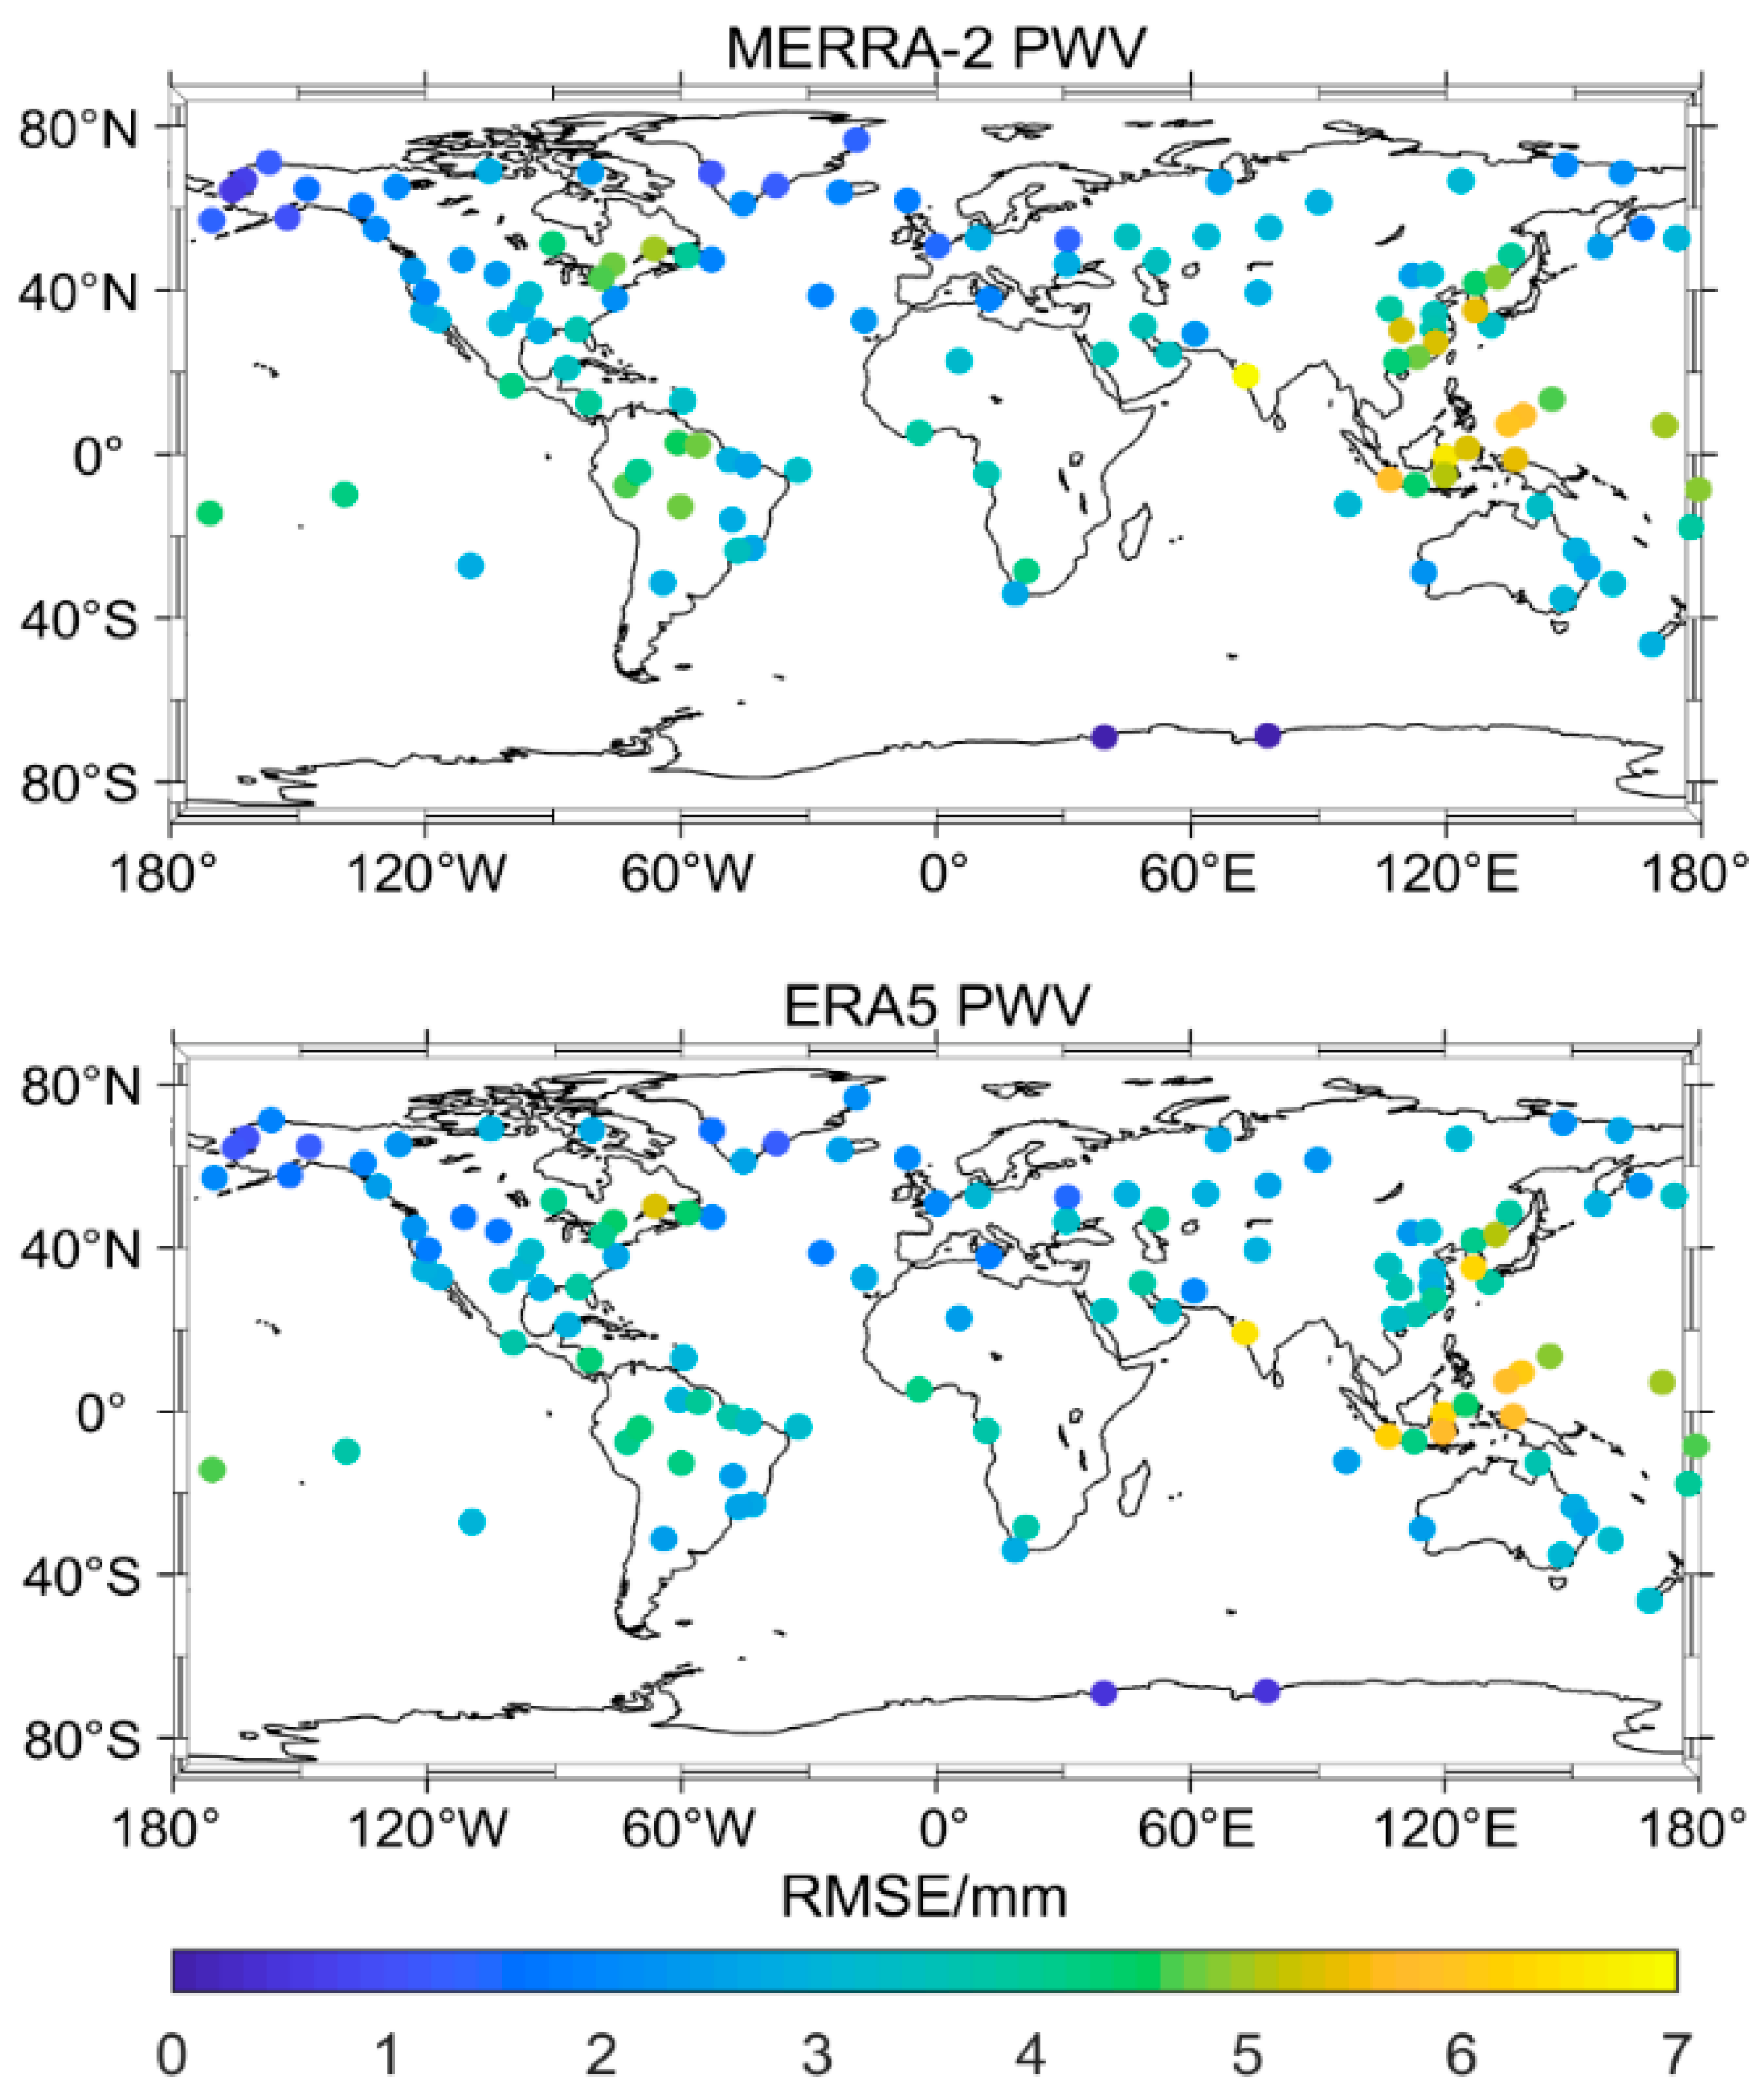
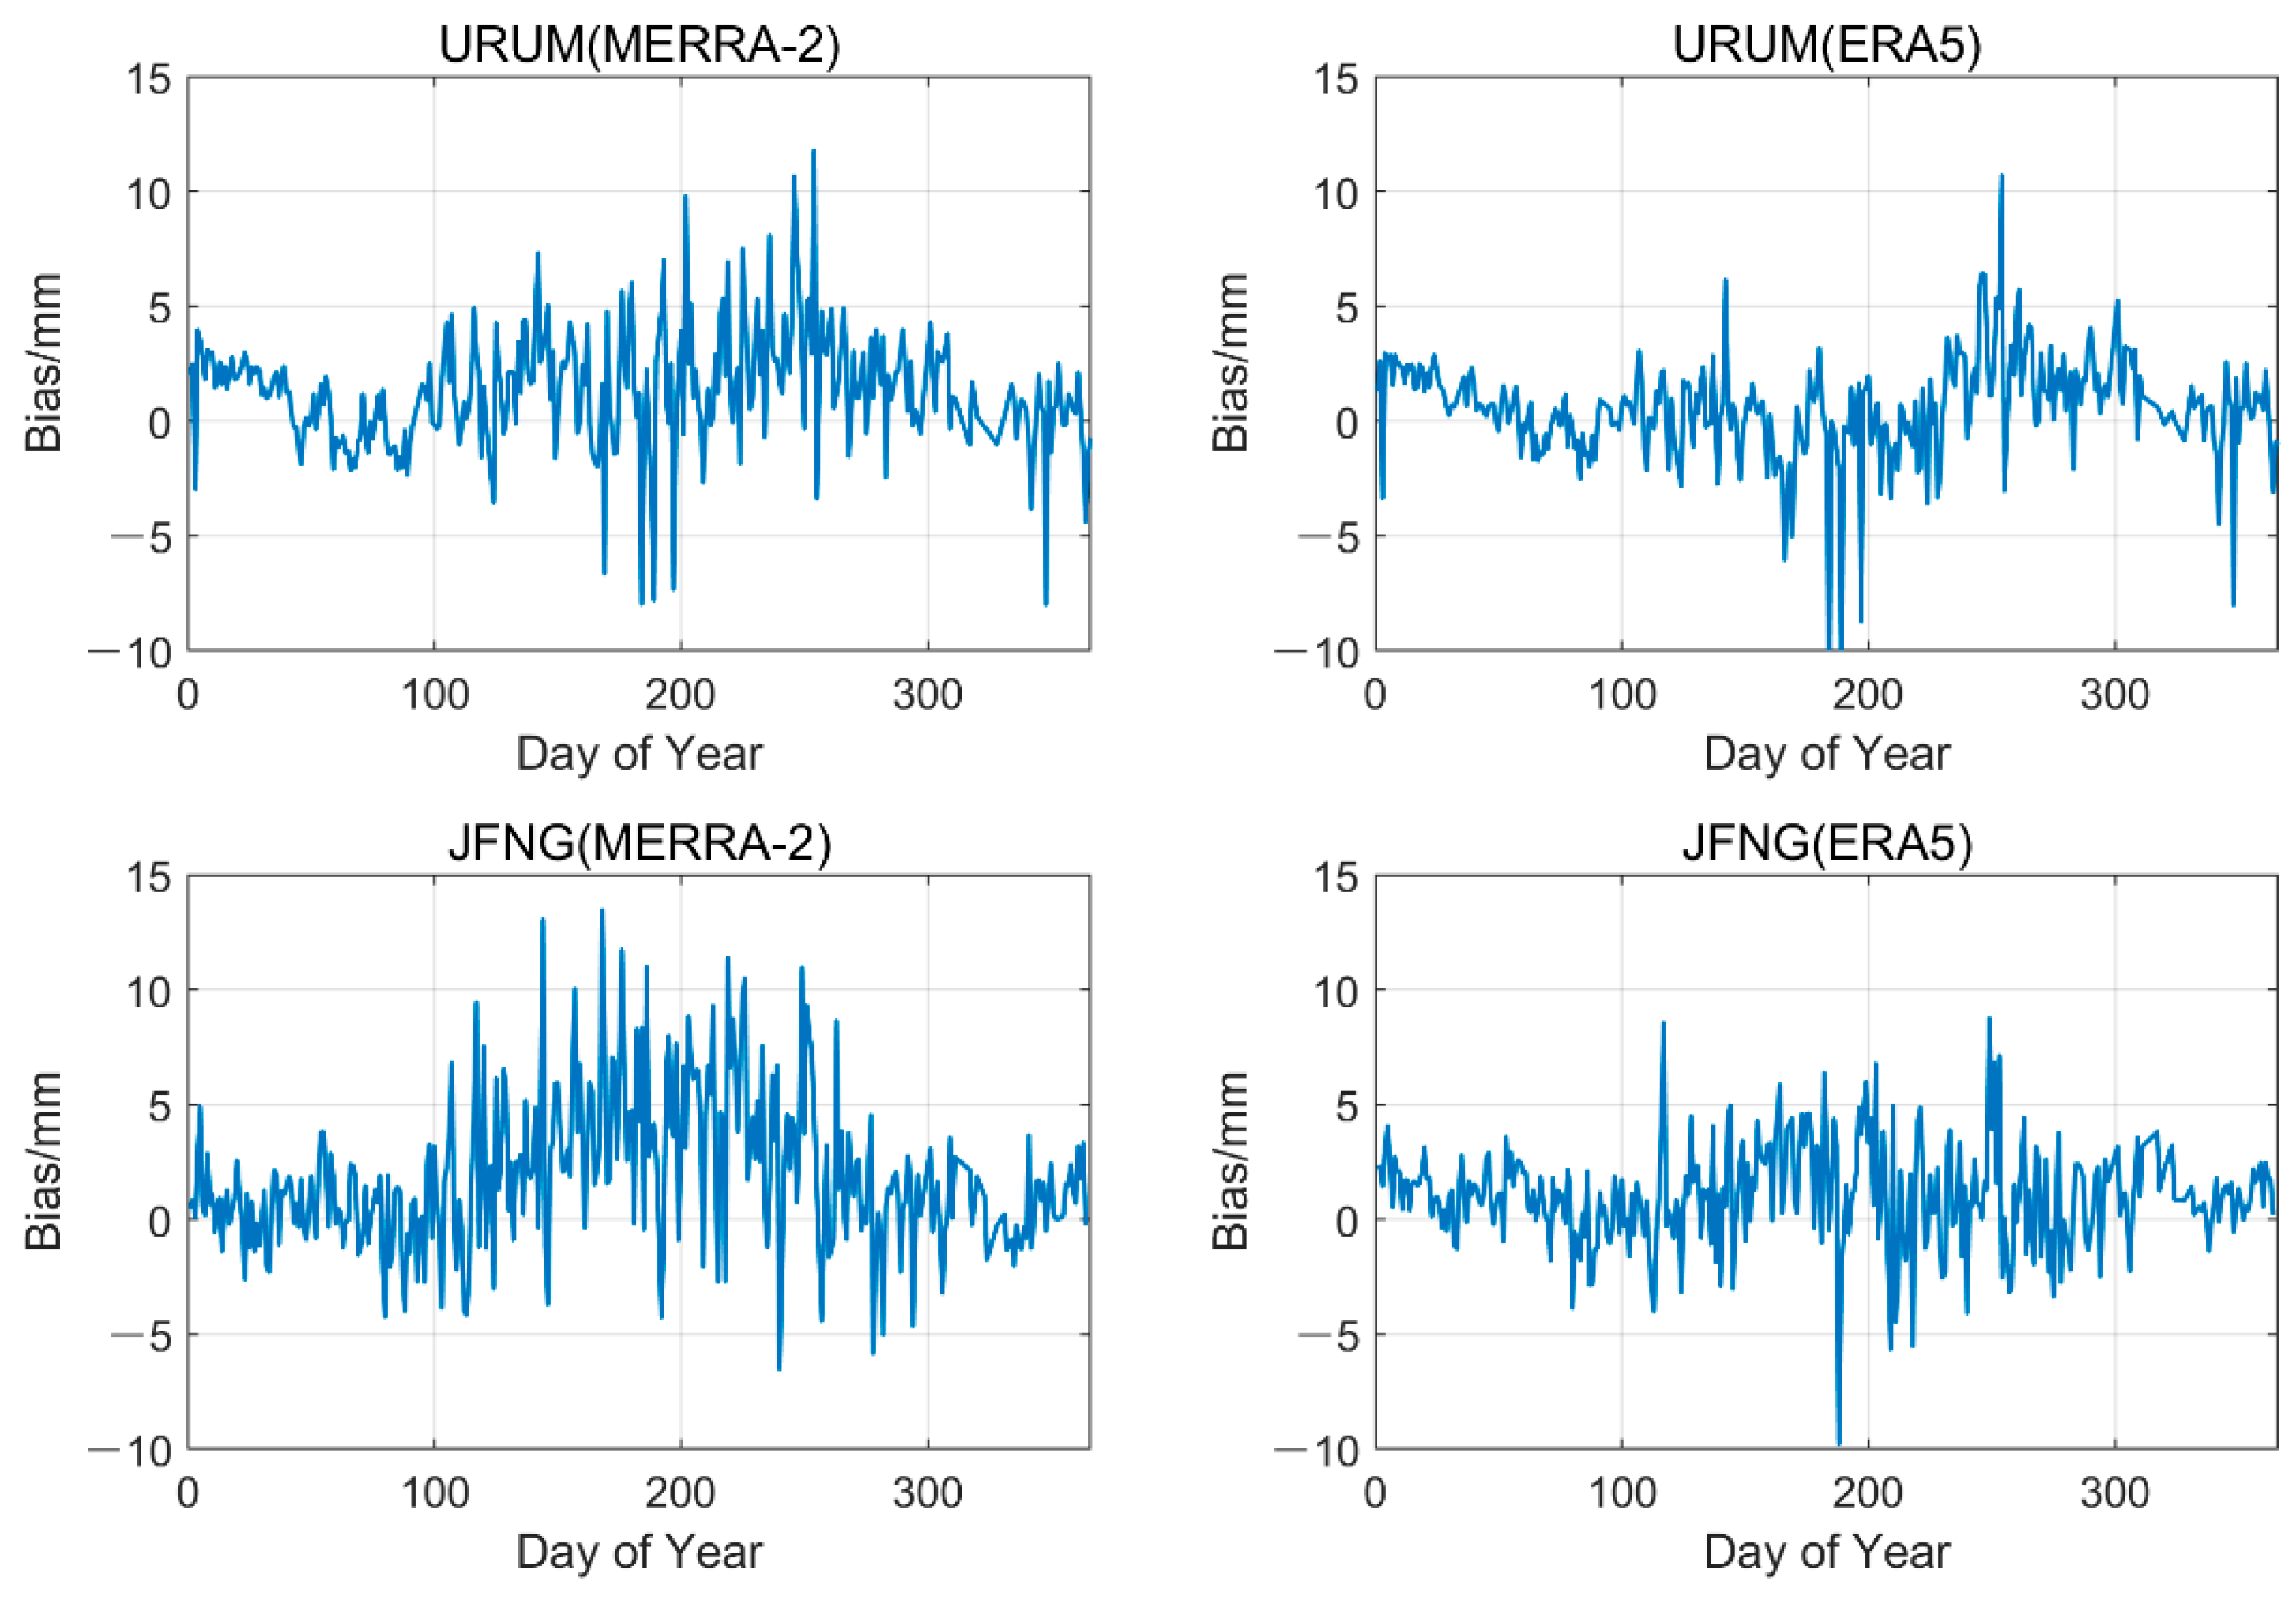
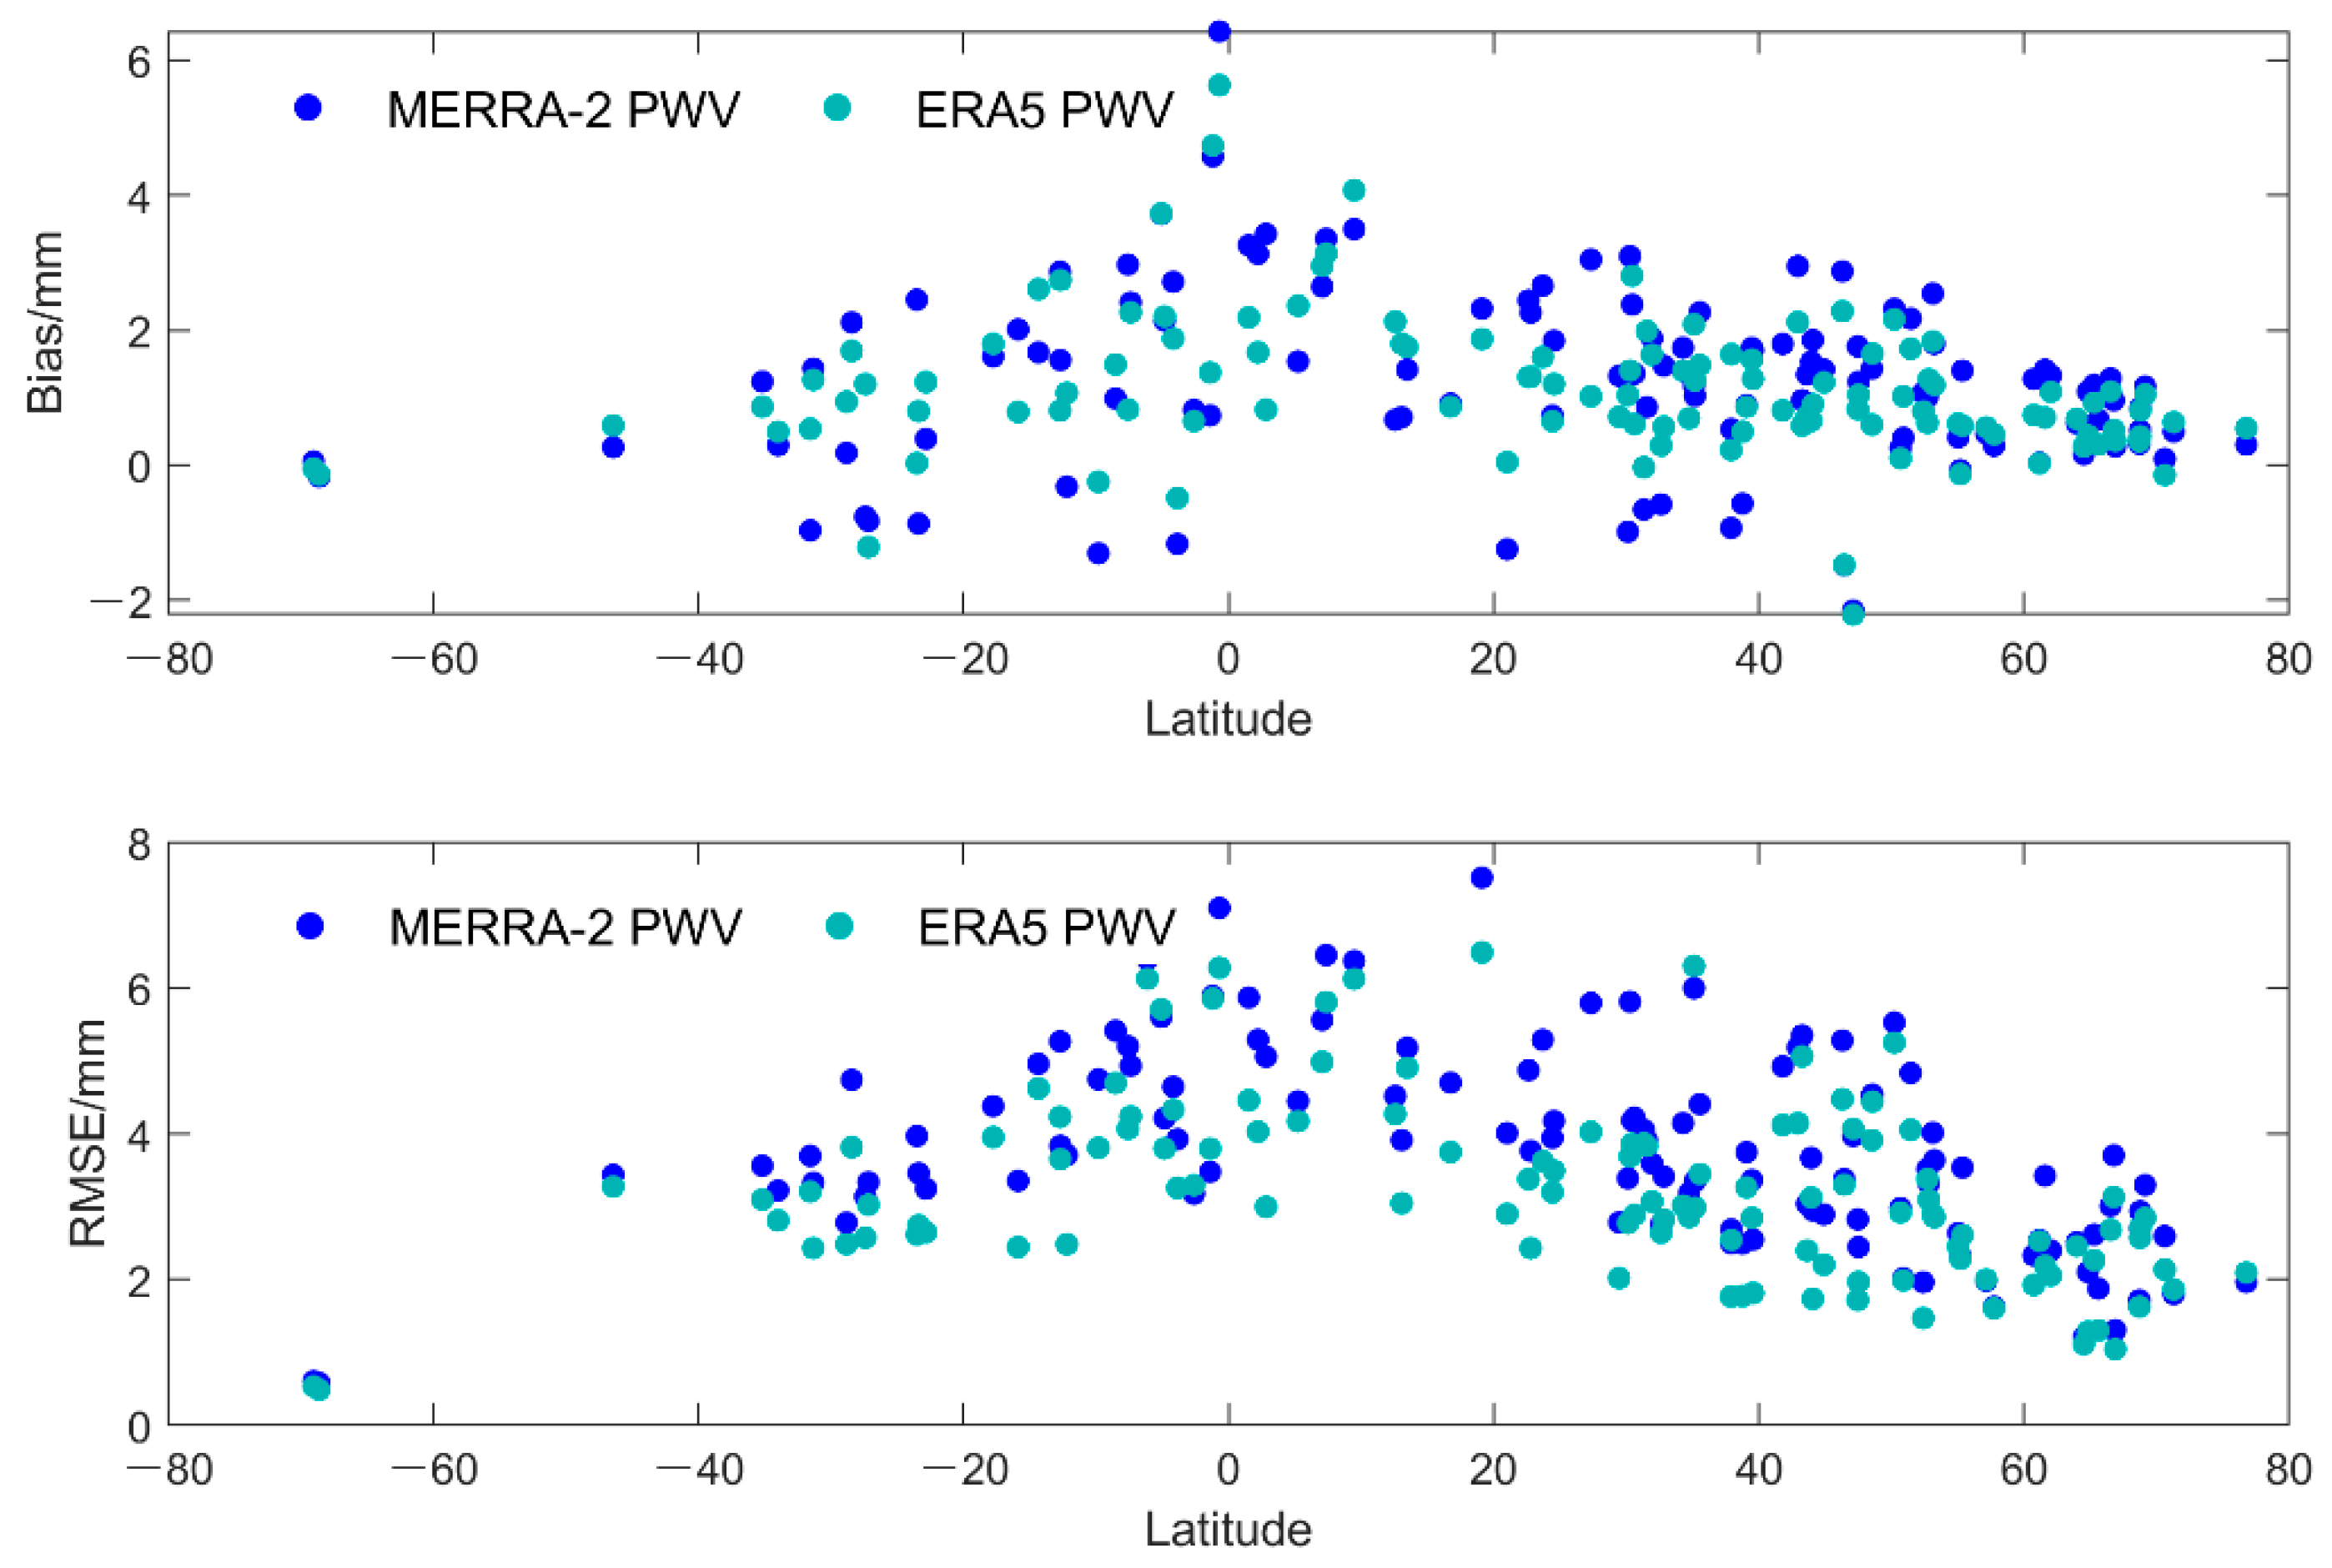
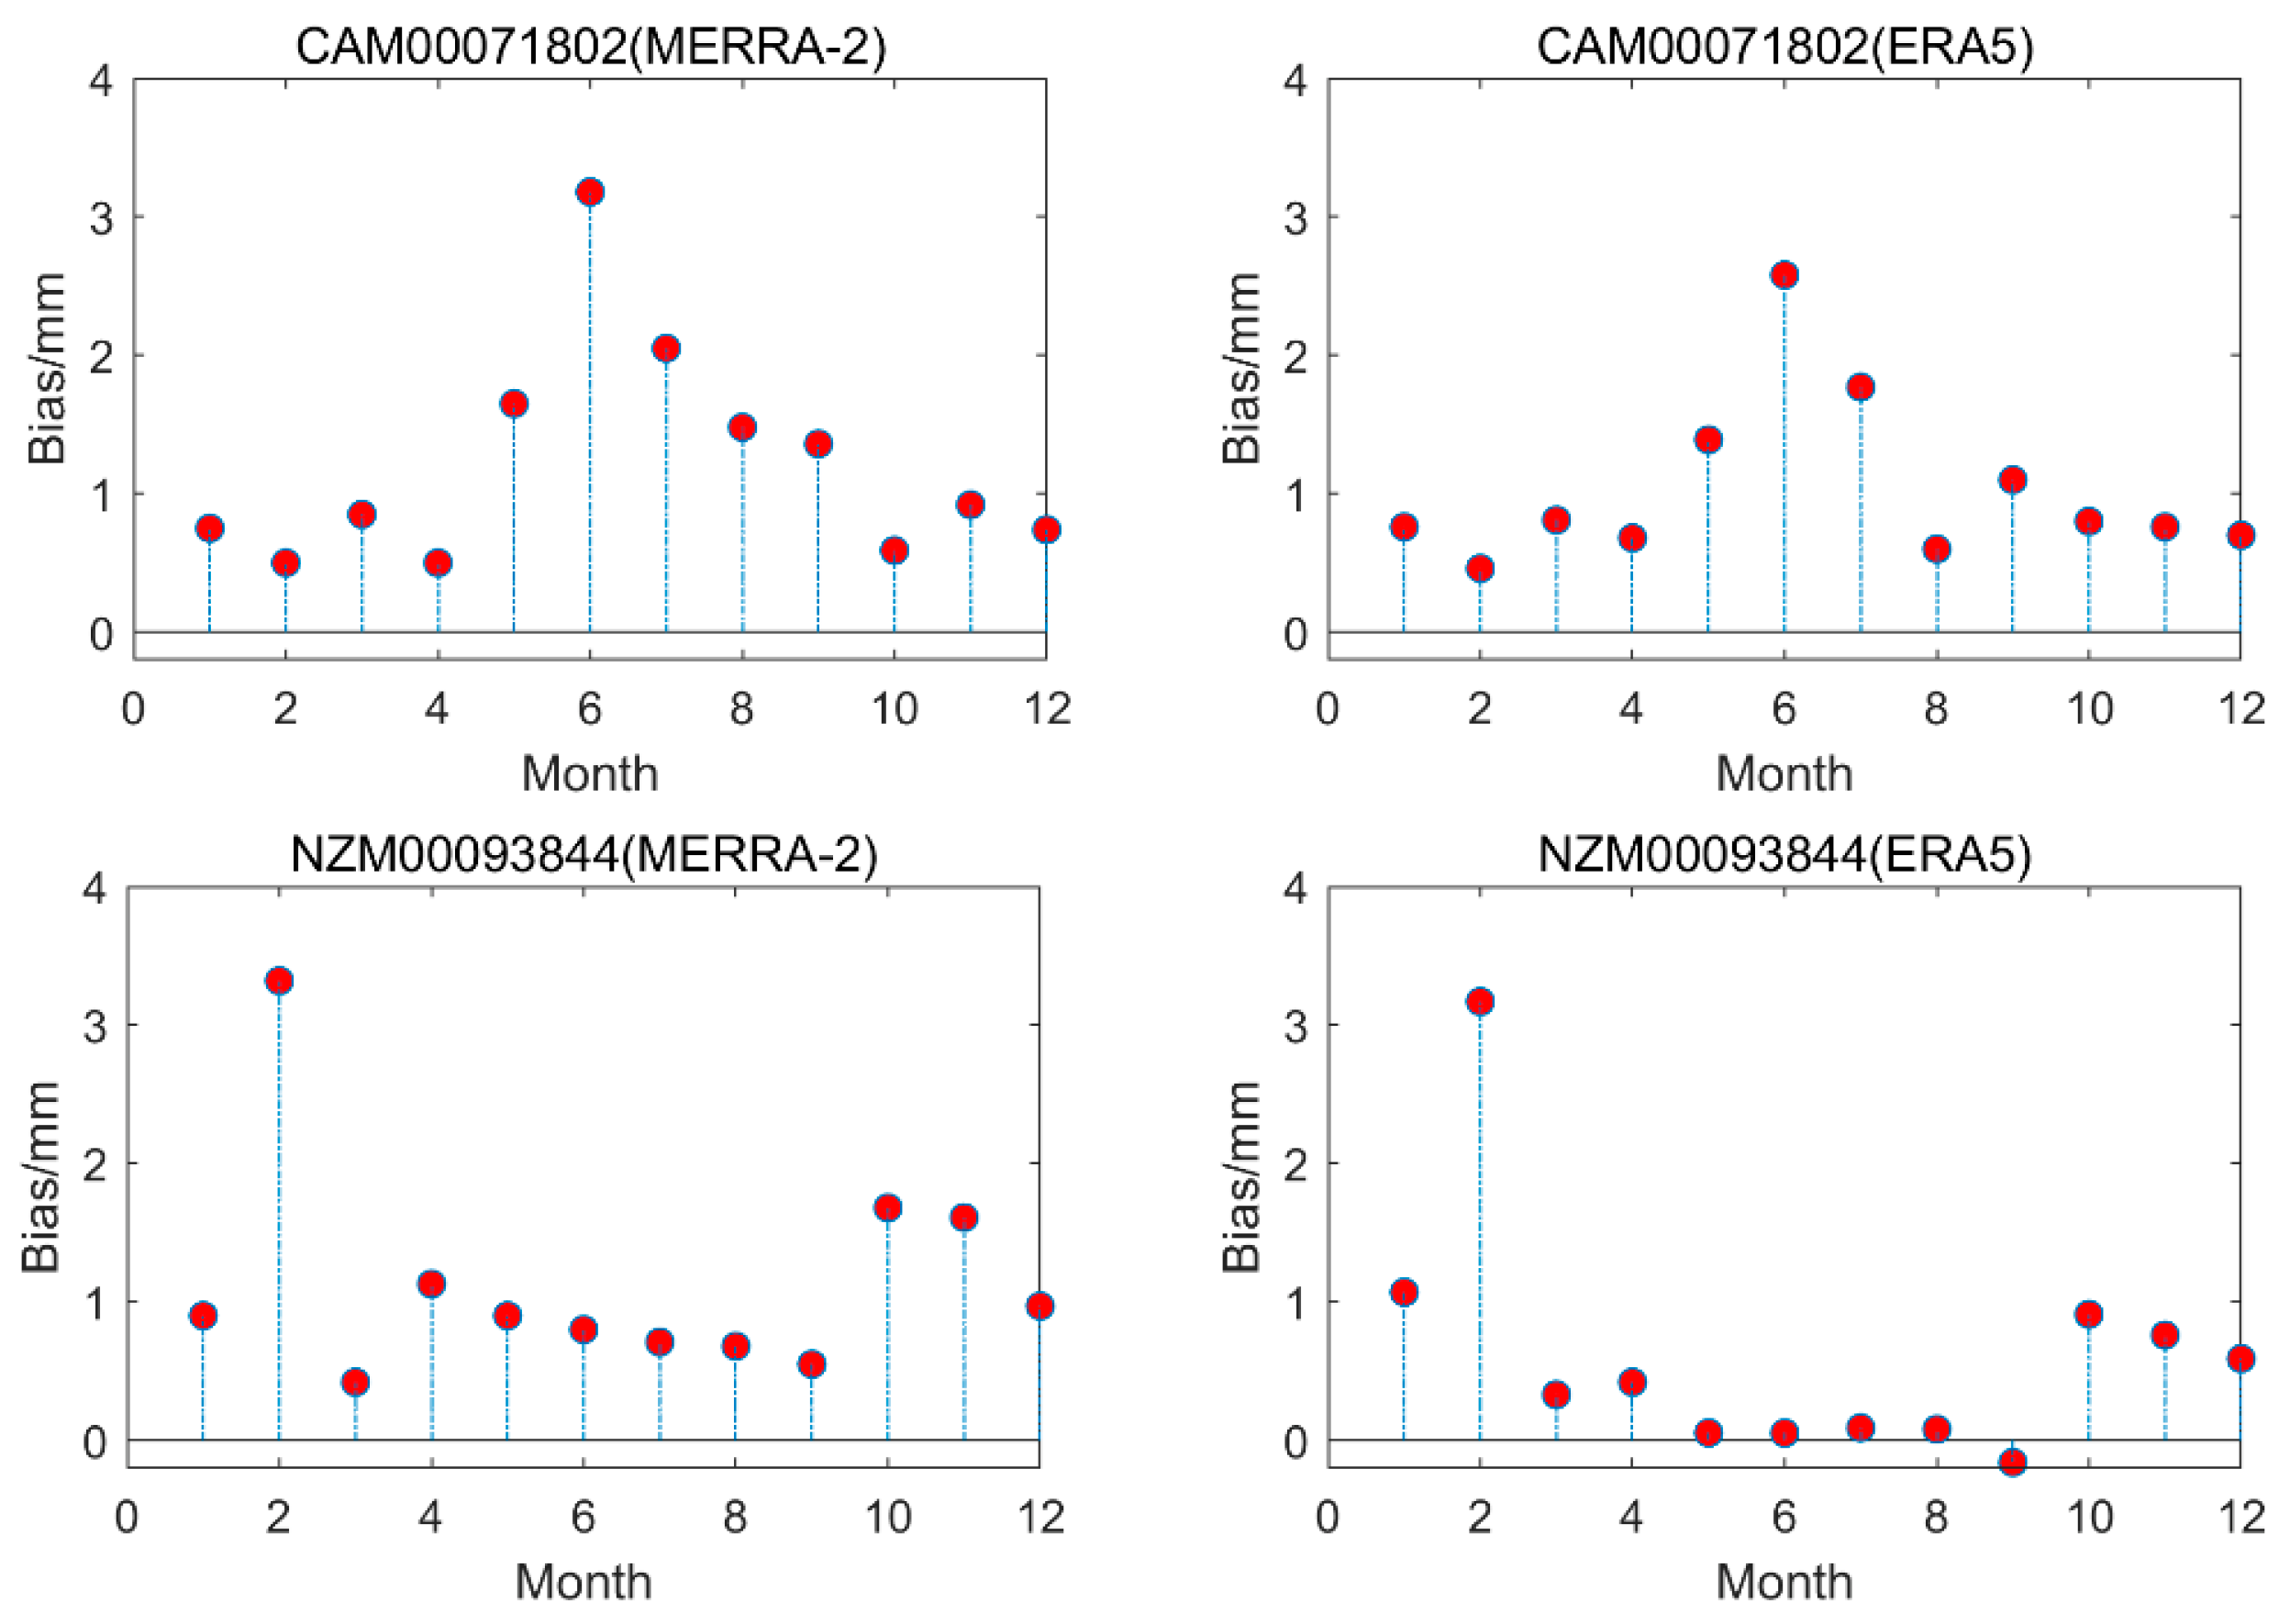
- The PWV of both the MERRA-2 data and the ERA5 data had good consistency with RS PWV and GNSS PWV. Compared with MERRA-2 PWV, the accuracy of ERA5 PWV was slightly higher. Latitude, altitude and season were the influencing factors on the NWP PWV estimation accuracy.
- (2)
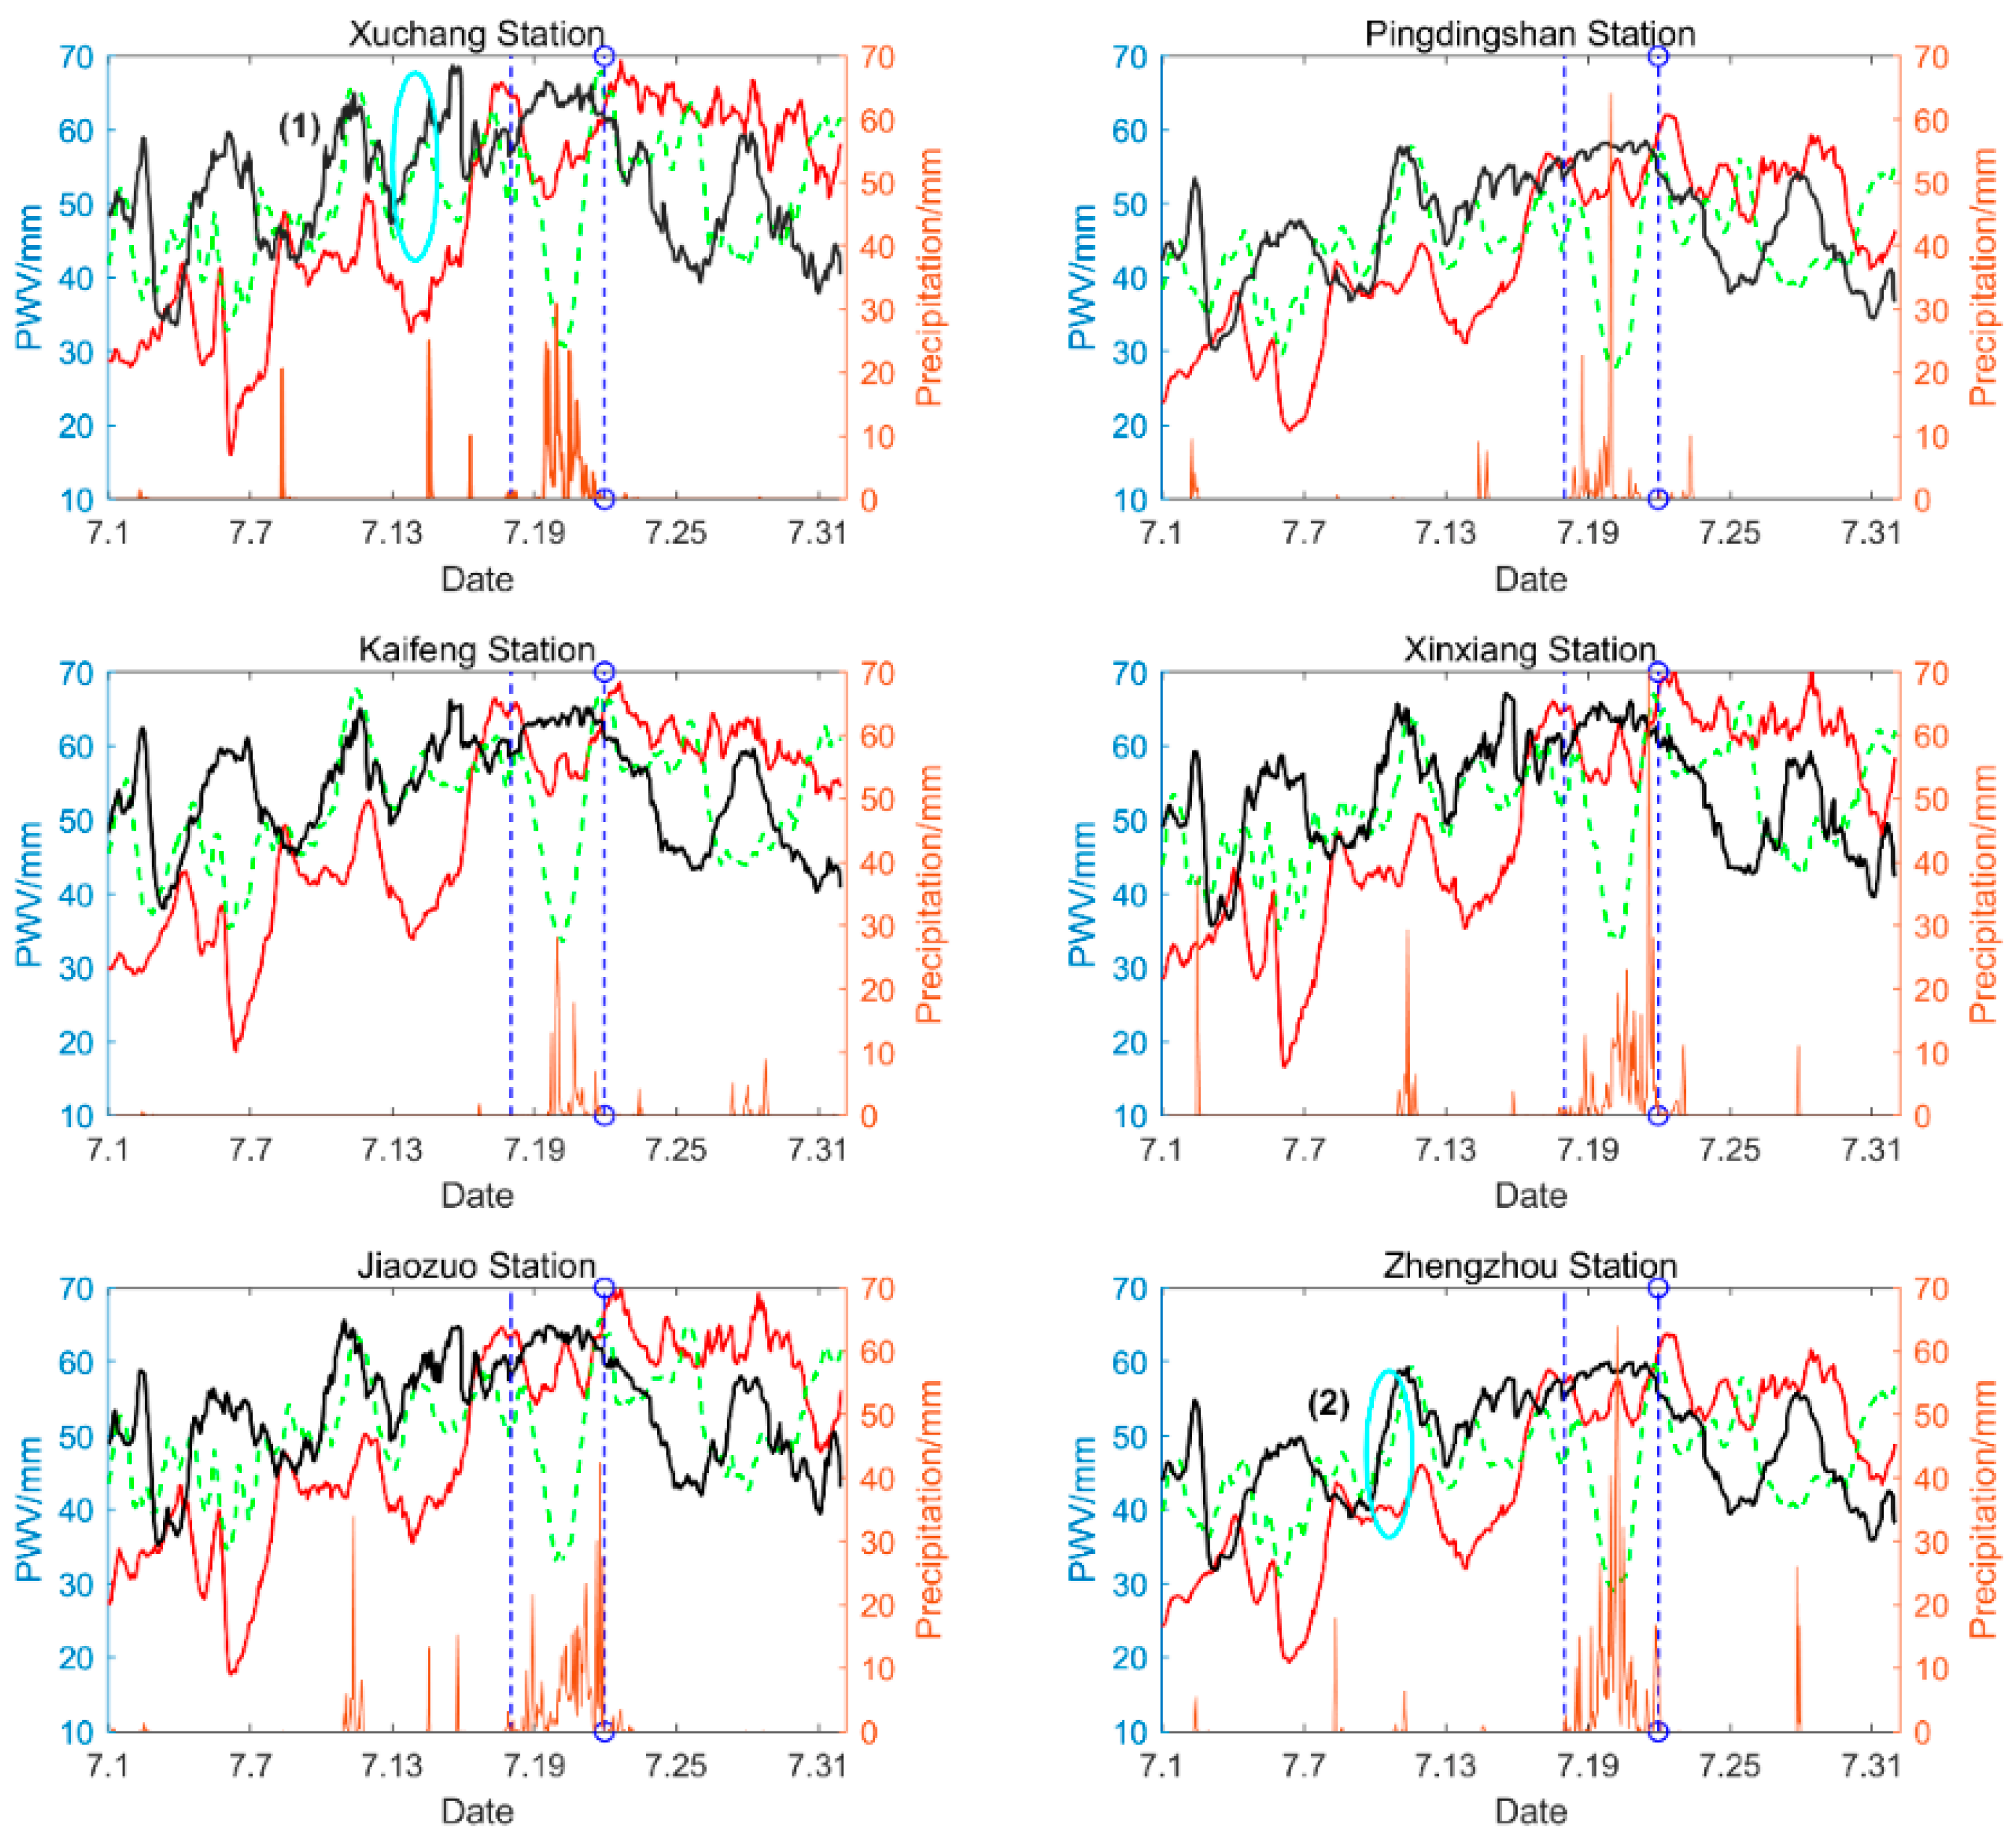
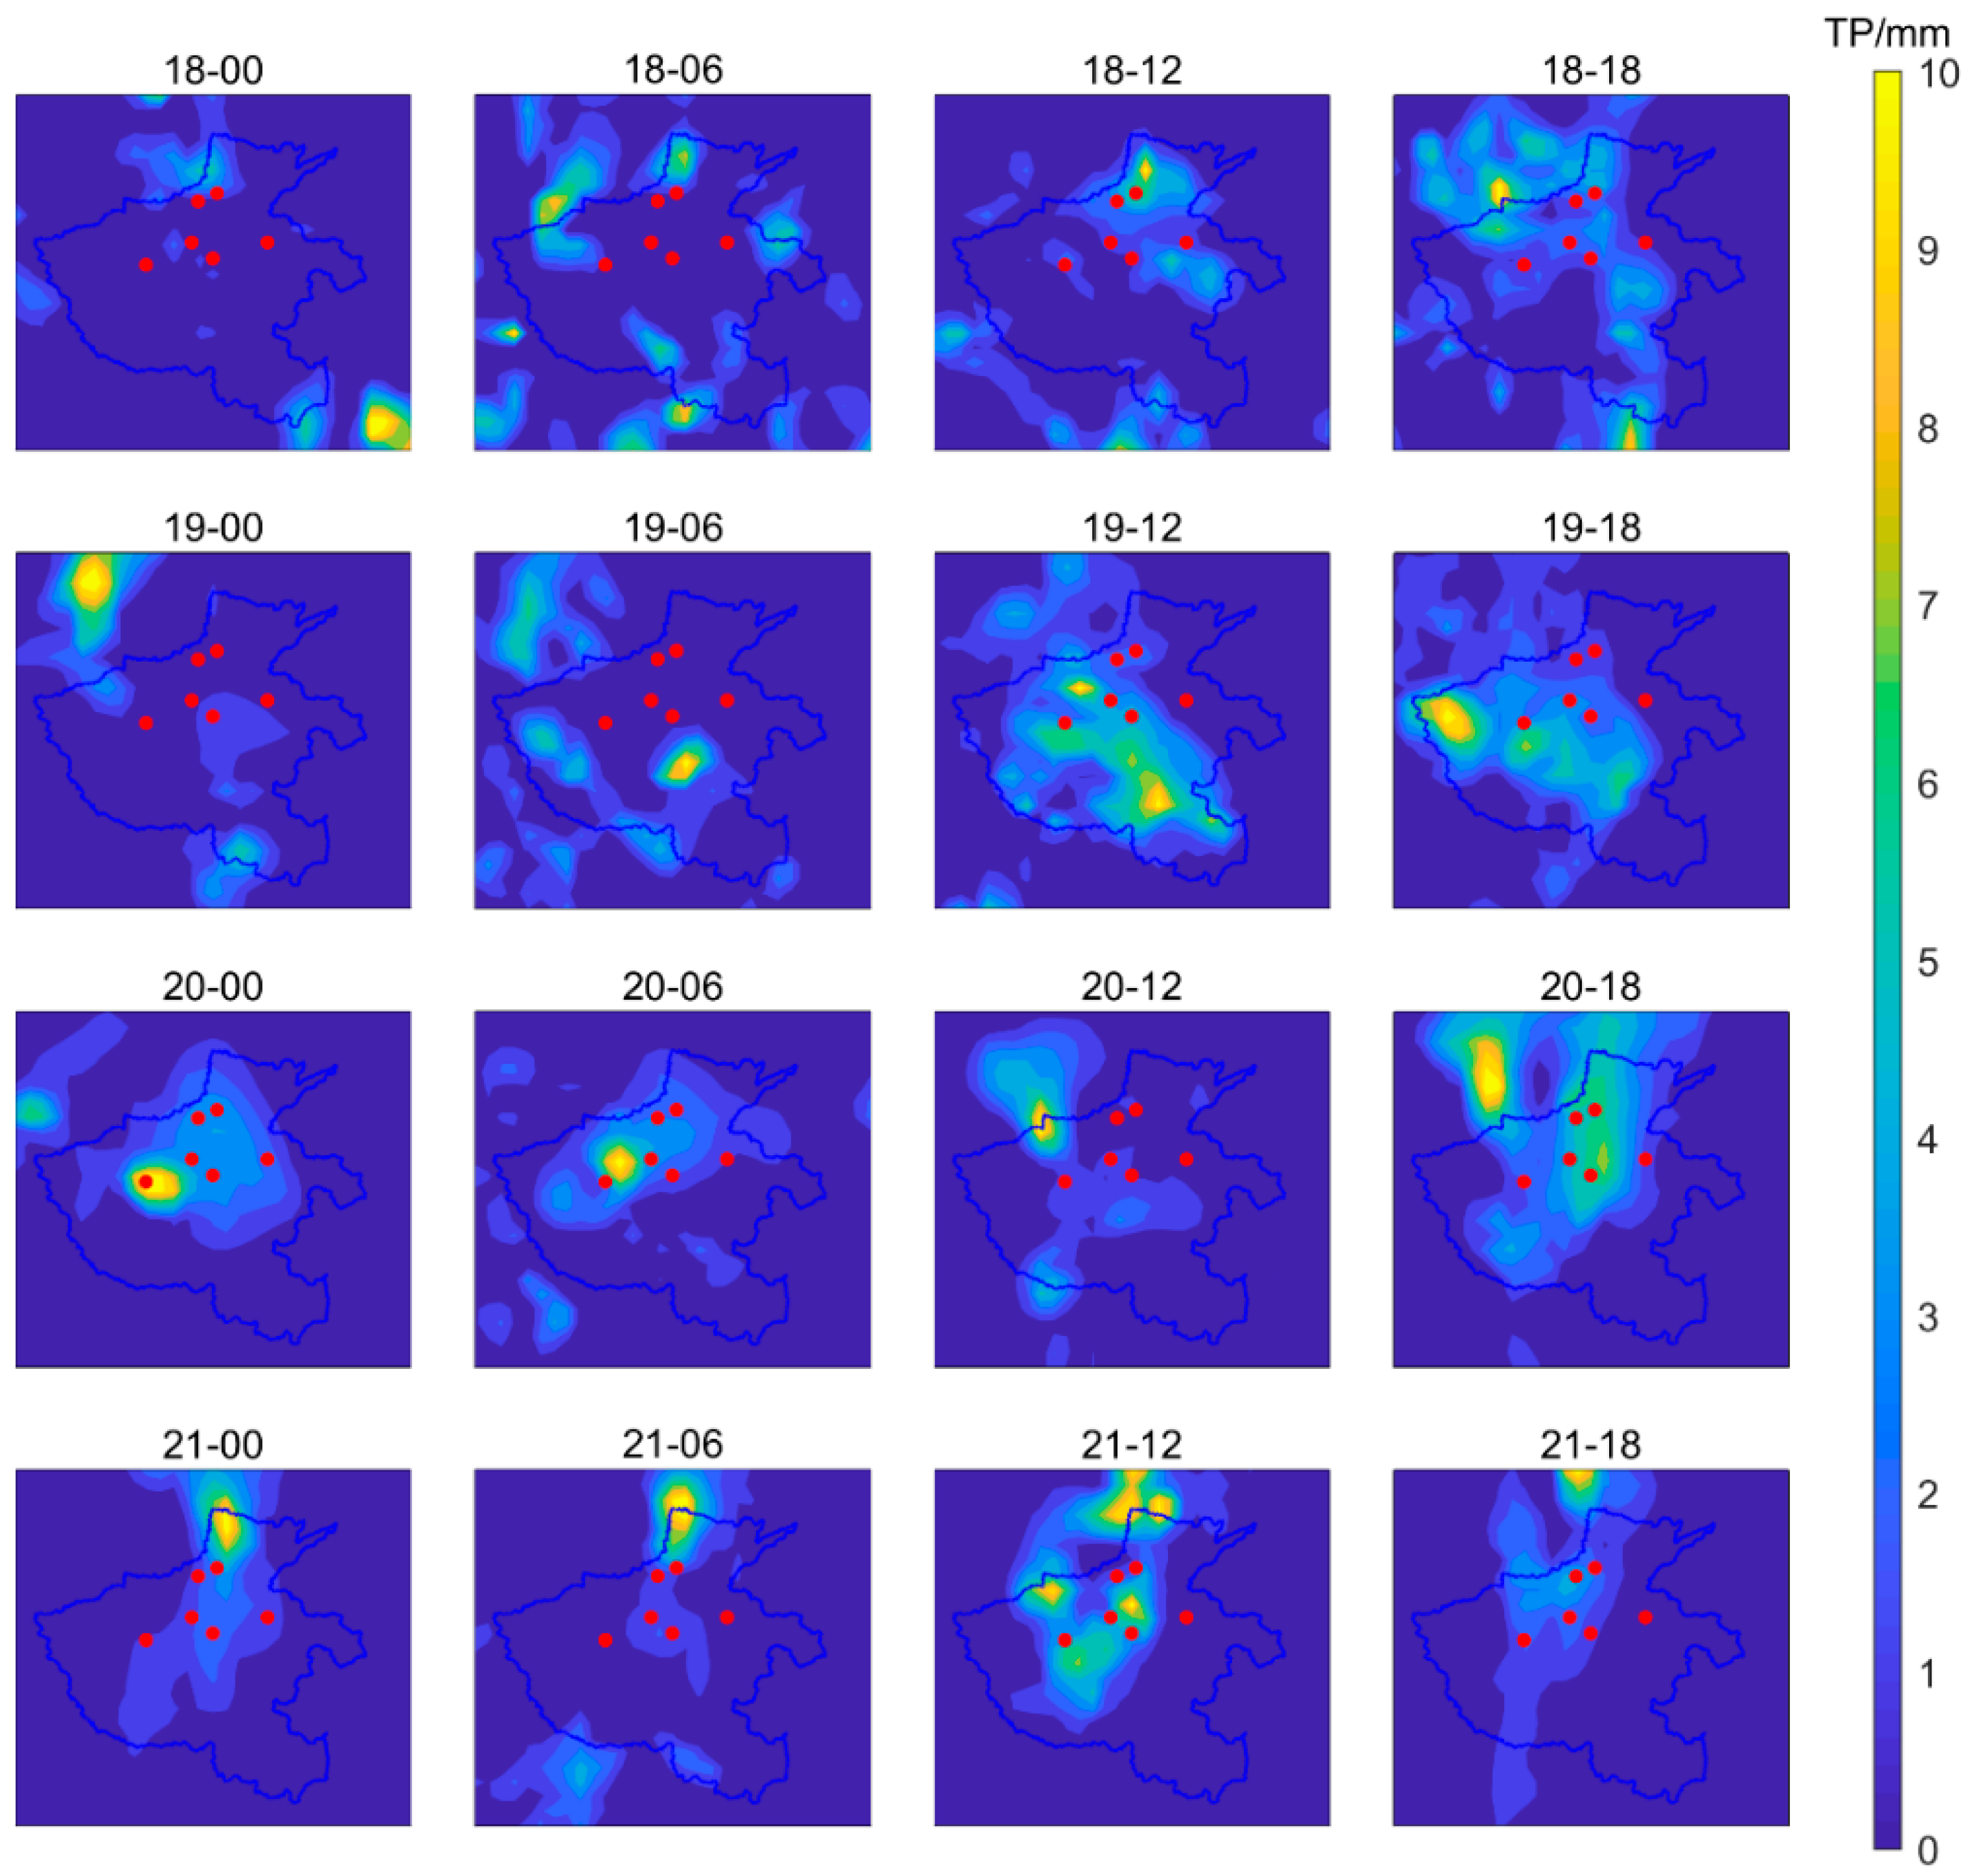
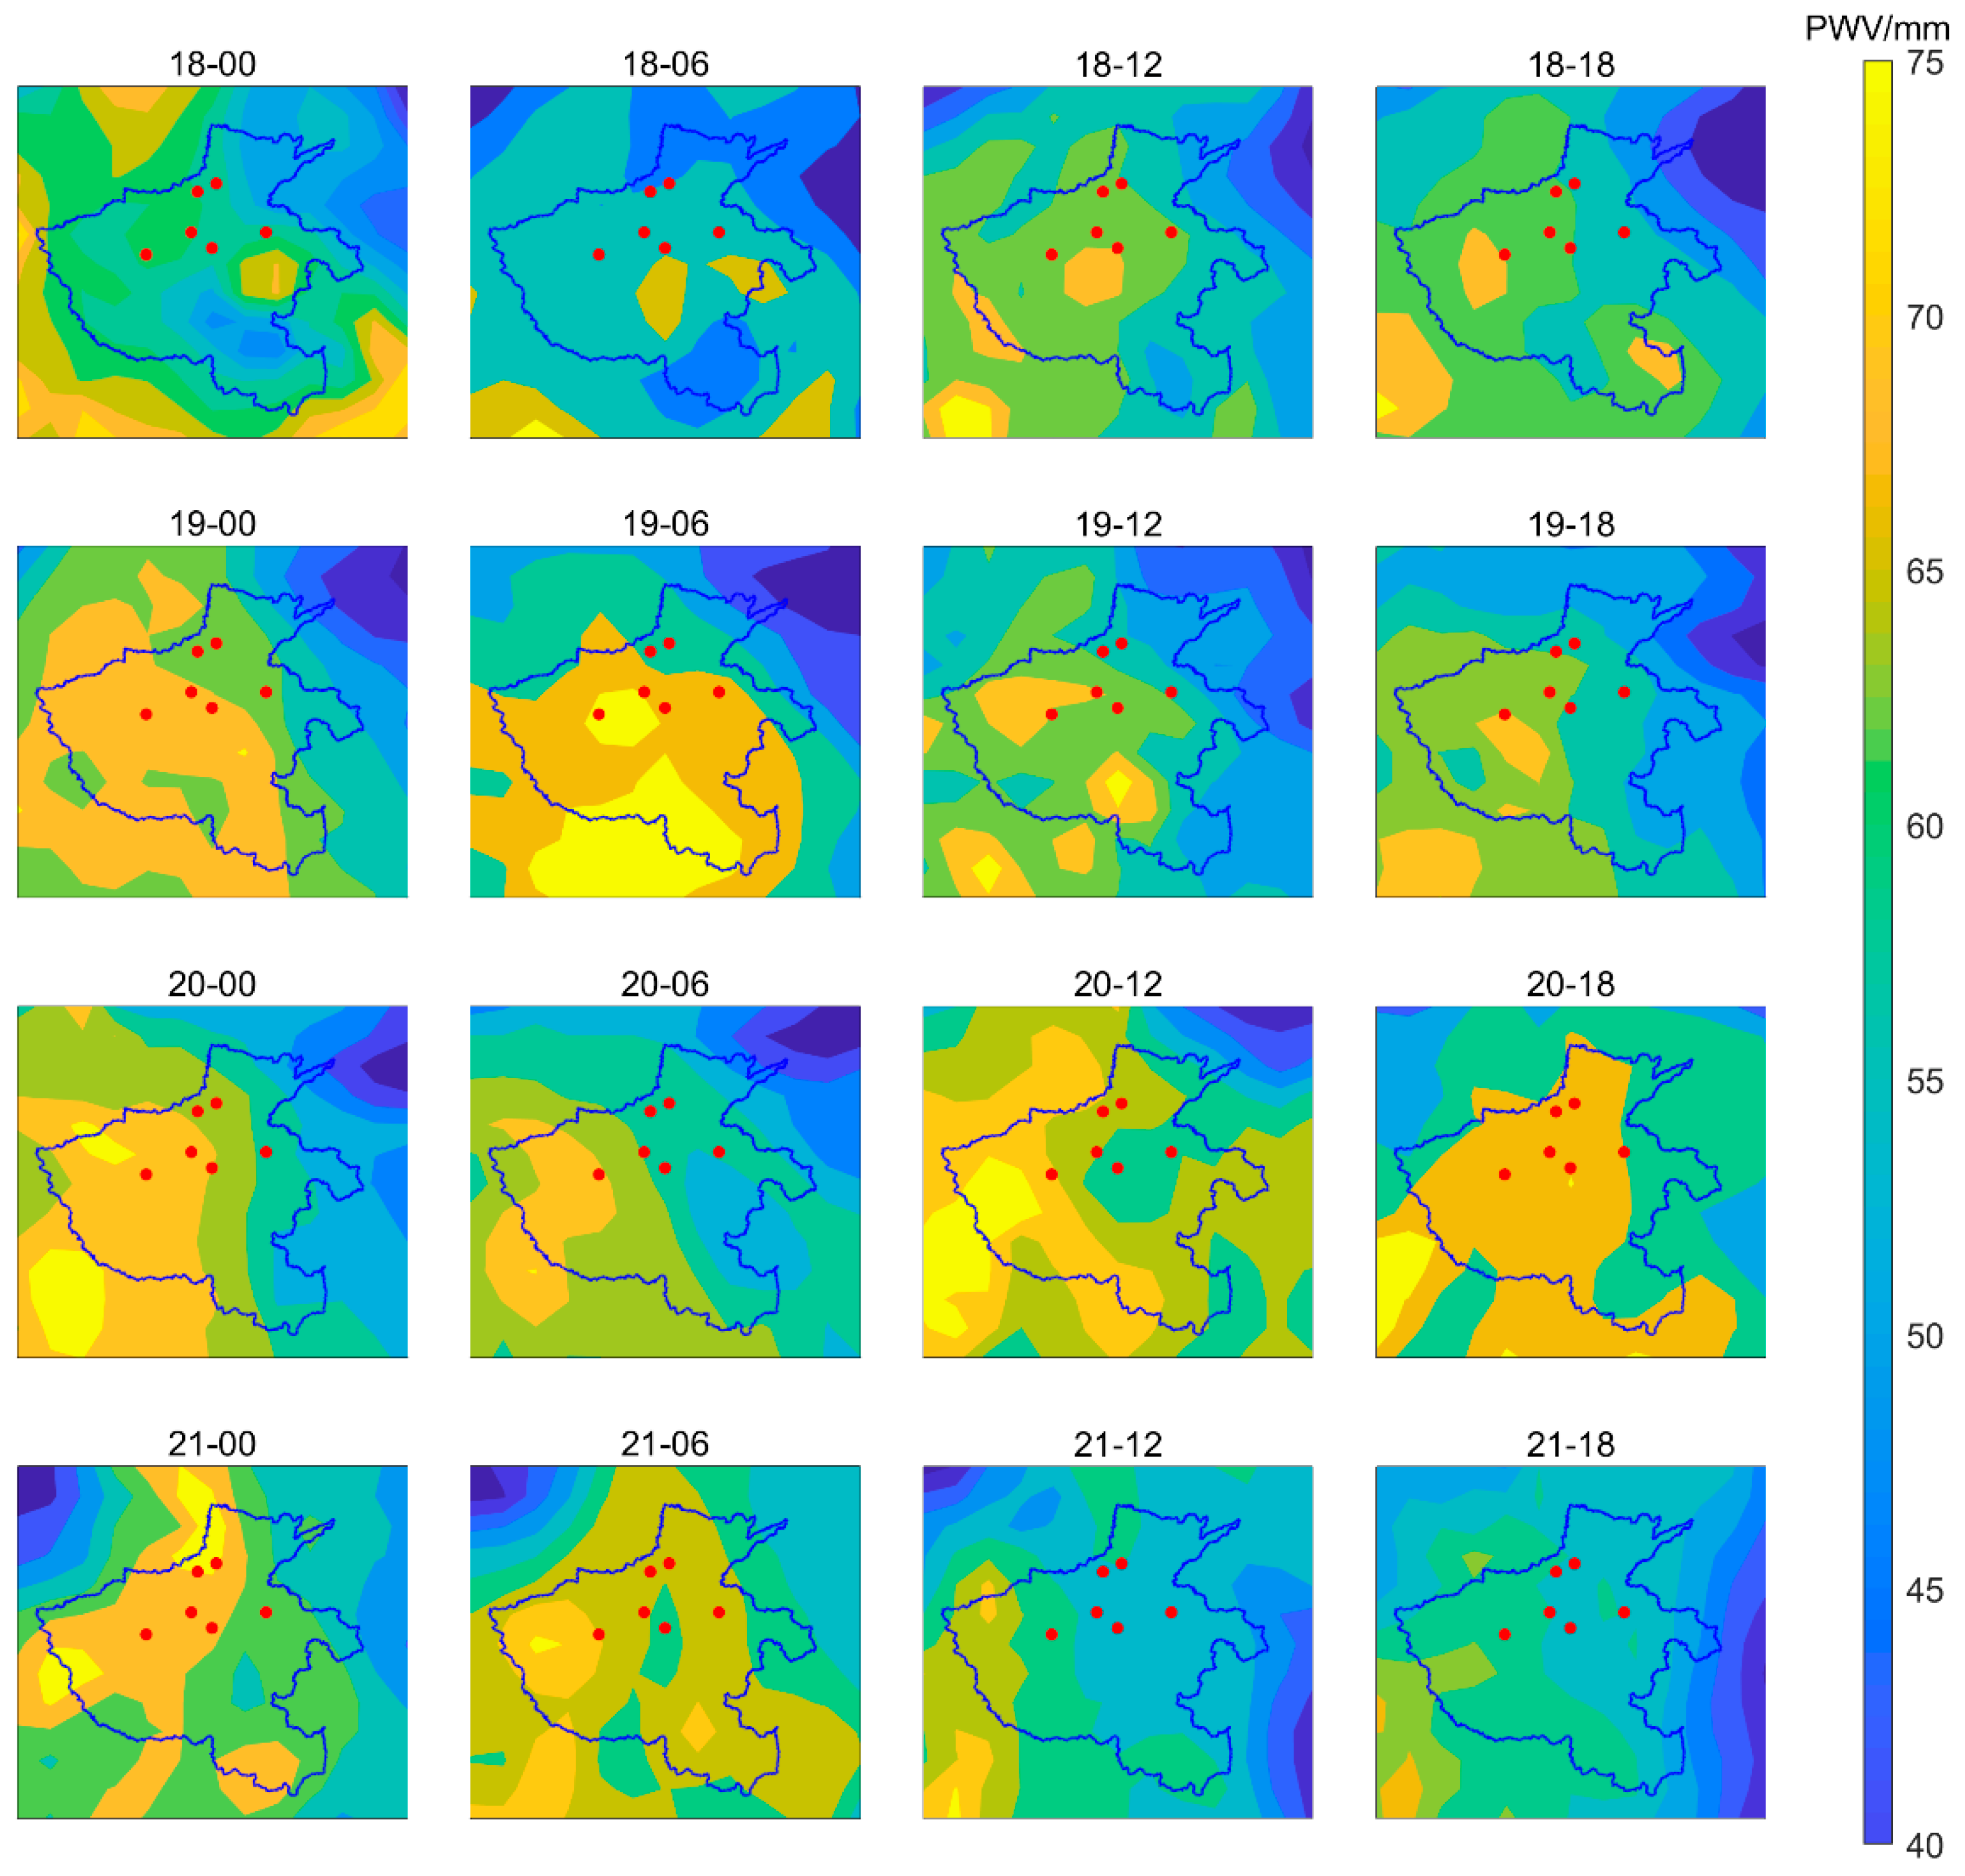
- The change trend of ERA5 PWV was consistent with both 24 h cumulative precipitation and surface precipitation during the ‘July 20’ heavy rainstorm in Zhengzhou. The average OMD and OMT between PWV and surface precipitation during the ‘July 20’ rainstorm in Zhengzhou were 56.63% and 3.68 h, respectively, and the maximum optimal matching degree was 80.3%. The spatial–temporal relationship between PWV and surface precipitation was strong.
Author Contributions
Funding
Data Availability Statement
Acknowledgments
Conflicts of Interest
References
- Allan, R.P.; Soden, B.J. Atmospheric warming and the amplification of precipitation extremes. Science 2008, 321, 1481–1484. [Google Scholar] [CrossRef] [Green Version]
- Colman, R. A comparison of climate feedbacks in general circulation models. Clim. Dyn. 2003, 20, 865–873. [Google Scholar] [CrossRef]
- Rocken, C.; Van, H.T.; Ware, R. Near real-time GPS sensing of atmospheric water vapor. Geophys. Res. Lett. 2013, 24, 3221–3224. [Google Scholar] [CrossRef] [Green Version]
- Wagner, T.; Beirle, S.; Grzegorski, M. Global trends (1996–2003) of total column precipitable water observed by Global Ozone Monitoring Experiment (GOME) on ERS-2 and their relation to near-surface temperature. J. Geophys. Res. 2006, 111, D12102. [Google Scholar] [CrossRef] [Green Version]
- He, Q.M.; Zhang, K.F.; Wu, S.Q.; Zhao, Q.Z.; Wang, X.M.; Shen, Z.; Li, L.J.; Wan, M.F.; Liu, X.Y. Real-Time GNSS-Derived PWV for Typhoon Characterizations: A Case Study for Super Typhoon Mangkhut in Hong Kong. Remote Sens. 2019, 12, 104. [Google Scholar] [CrossRef] [Green Version]
- King, M.D.; Kaufman, Y.J.; Menzel, W.P. Remote sensing of cloud, aerosol, and water vapor properties from the moderate resolution imaging spectrometer (MODIS). IEEE Trans. Geosci. Remote Sens. 1992, 30, 2–27. [Google Scholar] [CrossRef] [Green Version]
- Niell, A.E.; Coster, A.J.; Solheim, F.S. Comparison of Measurements of Atmospheric Wet Delay by Radiosonde, Water Vapor Radiometer, GPS, and VLBI. J. Atmos. Ocean. Technol. 2001, 18, 830–850. [Google Scholar] [CrossRef] [Green Version]
- Zeng, Z.; Mao, F.; Wang, Z. Preliminary Evaluation of the Atmospheric Infrared Sounder Water Vapor Over China Against High-Resolution Radiosonde Measurements. J. Geophys. Res.-Atmos. 2019, 124, 3871–3888. [Google Scholar] [CrossRef]
- Wang, J.H.; Zhang, L.Y. Systematic Errors in Global Radiosonde Precipitable Water Data from Comparisons with Ground-Based GPS Measurements. J. Clim. 2008, 21, 2218–2238. [Google Scholar] [CrossRef]
- Dalu, G. Satellite remote sensing of atmospheric water vapour. Int. J. Remote Sens. 1986, 7, 1089–1097. [Google Scholar] [CrossRef]
- Gui, K.; Che, H.; Chen, Q. Evaluation of radiosonde, MODIS-NIR-Clear, and AERONET precipitable water vapor using IGS ground-based GPS measurements over China. Atmos. Res. 2017, 197, 461–473. [Google Scholar] [CrossRef]
- Bevis, M.; Businger, S.; Herring, T.A. GPS meteorology: Remote sensing of atmospheric water vapor using the Global Positioning System. J. Geophys. Res.-Atmos. 1992, 97, 15787–15801. [Google Scholar] [CrossRef]
- Parracho, A.C.; Olivier, B.; Sophie, B. Global IWV trends and variability in atmospheric reanalyses and GPS observations. Atmos. Chem. Phys. 2018, 18, 16213–16237. [Google Scholar] [CrossRef] [Green Version]
- Bock, O.; Parracho, A.C. Consistency and representativeness of integrated water vapour from ground-based GPS observations and ERA-Interim reanalysis. Atmos. Chem. Phys. 2019, 19, 9453–9468. [Google Scholar] [CrossRef] [Green Version]
- Zhang, Y.; Cai, C.; Chen, B. Consistency Evaluation of Precipitable Water Vapor Derived From ERA5, ERA-Interim, GNSS, and Radiosondes Over China. Radio Sci. 2019, 54, 561–571. [Google Scholar] [CrossRef]
- Vey, S.; Dietrich, R.; Rülke, A. Validation of Precipitable Water Vapor within the NCEP/DOE Reanalysis Using Global GPS Observations from One Decade. J. Clim. 2010, 23, 1675–1695. [Google Scholar] [CrossRef]
- Chen, B.Y.; Liu, Z.Z. Global water vapor variability and trend from the latest 36 year (1979 to 2014) data of ECMWF and NCEP reanalyses, radiosonde, GPS, and microwave satellite. J. Geophys. Res.-Atmos. 2016, 121, 11442–11462. [Google Scholar] [CrossRef]
- Huang, L.; Mo, Z.; Liu, L. Evaluation of Hourly PWV Products Derived From ERA5 and MERRA-2 Over the Tibetan Plateau Using Ground-Based GNSS Observations by Two Enhanced Models. Earth Space Sci. 2021, 8, e2020EA001516. [Google Scholar] [CrossRef]
- Zhang, J.P.; Zhao, T.B.; Li, Z. Evaluation of Surface Relative Humidity in China from the CRA-40 and Current Reanalyses. Adv. Atmos. Sci. 2021, 38, 1958–1976. [Google Scholar] [CrossRef]
- Zhao, Q.; Liu, Y.; Ma, X.; Yao, W.; Yao, Y.; Li, X. An Improved Rainfall Forecasting Model Based on GNSS Observations. IEEE Trans. Geosci. Remote Sens. 2020, 58, 4891–4900. [Google Scholar] [CrossRef]
- Duc, L.; Saito, K.; Seko, H. Spatial-temporal fractions verification for high-resolution ensemble forecasts. Tellus A 2013, 65, 18171. [Google Scholar] [CrossRef] [Green Version]
- Champollion, C.; Masson, F.; Baelen, J.V. GPS monitoring of the tropospheric water vapor distribution and variation during the 9 September 2002 torrential precipitation episode in the Ce’vennes (southern France). J. Geophys. Res.-Atmos. 2004, 109, D24102. [Google Scholar] [CrossRef] [Green Version]
- Yao, Y.; Shan, L.; Zhao, Q. Establishing a method of short-term rainfall forecasting based on GNSS-derived PWV and its application. Sci. Rep. 2017, 7, 12465. [Google Scholar] [CrossRef] [PubMed]
- Benevides, P.; Catalao, J.; Miranda, P.M.A. On the inclusion of GPS precipitable water vapour in the nowcasting of rainfall. Nat. Hazard Earth Syst. Sci. 2015, 15, 2605–2616. [Google Scholar] [CrossRef] [Green Version]
- Zhu, M.; Liu, Z.; Hu, W. Observing Water Vapor Variability during Three Super Typhoon Events in Hong Kong Based on GPS Water Vapor Tomographic Modeling Technique. J. Geophys. Res.-Atmos. 2020, 125, e2019JD032318. [Google Scholar] [CrossRef]
- Valjarevi, A.; Morar, C.; Ivkovi, J. Long Term Monitoring and Connection between Topography and Cloud Cover Distribution in Serbia. Atmosphere 2021, 12, 964. [Google Scholar] [CrossRef]
- Gelaro, R.; Mccarty, W.; Suárez, M.; Todling, R.; Zhao, B. The modern-era retrospective analysis for research and applications, Version 2 (MERRA-2). J. Clim. 2017, 30, 5419–5454. [Google Scholar] [CrossRef]
- Ssenyunzi, R.C. Performance of ERA5 data in retrieving Precipitable Water Vapour over East African tropical region. Adv. Space Res. 2020, 65, 1877–1893. [Google Scholar] [CrossRef]
- Molod, A.; Takacs, L.; Suarez, M.; Bacmeister, J. Development of the GEOS-5 atmospheric general circulation model: Evolution from MERRA to MERRA2. Geosci. Model Dev. 2015, 7, 1339–1356. [Google Scholar] [CrossRef] [Green Version]
- Hersbach, H.; de Rosnay, P.; Bell, B.; Schepers, D.; Simmons, A.; Soci, C.; Abdalla, S.; Alonso-Balmaseda, M.; Balsamo, G.; Bechtold, P. Operational global reanalysis: Progress, future directions and Synergies with NWP. ERA Rep. 2018, 27, 63. [Google Scholar]
- Zhang, Q.; Ye, J.H.; Zhang, S.C.; Han, F.; Hong, S.H. Precipitable Water Vapor Retrieval and Analysis by Multiple Data Sources: Ground-Based GNSS, Radio Occultation, Radiosonde, Microwave Satellite, and NWP Reanalysis Data. J. Sens. 2018, 2018, 3428303. [Google Scholar] [CrossRef]
- Byun, S.H.; Bar-Sever, Y.E.; Gendt, G. The new tropospheric product of the International GNSS Service. C. In Proceedings of the 18th International Technical Meeting of the Satellite Division of The Institute of Navigation (ION GNSS 2005), Long Beach, CA, USA, 13–16 September 2005; pp. 241–249. [Google Scholar]
- Jiang, P.; Ye, S.; Chen, D. Retrieving Precipitable Water Vapor Data Using GPS Zenith Delays and Global Reanalysis Data in China. Remote Sens. 2016, 8, 389. [Google Scholar] [CrossRef] [Green Version]
- Guo, L.; Huang, L.; Li, J.; Liu, L.; Huang, L.; Fu, B.; Xie, S.; He, H.; Ren, C. A Comprehensive Evaluation of Key Tropospheric Parameters from ERA5 and MERRA-2 Reanalysis Products Using Radiosonde Data and GNSS Measurements. Remote Sens. 2021, 13, 3008. [Google Scholar] [CrossRef]
- Boehm, J.; Heinkelmann, R.; Schuh, H. Short Note: A global model of pressure and temperature for geodetic applications. J. Geod. 2007, 81, 679–683. [Google Scholar] [CrossRef]
- Bevis, M.; Businger, S.; Chiswell, S. GPS Meteorology: Mapping Zenith Wet Delays onto Precipitable Water. J. Appl. Meteorol. Clim. 1994, 33, 379–386. [Google Scholar] [CrossRef]
- Nikolaidis, R. Observation of Geodetic and Seismic Deformation with the Global Positioning System. Ph.D. Thesis, University of California, San Diego, CA, USA, 2002; pp. 38–46. [Google Scholar]
- Landskron, D.; Bohm, J. VMF3/GPT3: Refined discrete and empirical troposphere mapping functions. J. Geod. 2018, 92, 349–360. [Google Scholar] [CrossRef]
- Zhou, W.; Bovik, A.C.; Sheikh, H.R.; Simoncelli, E.P. Image quality assessment: From error visibility to structural similarity. IEEE Trans. Image Process. 2004, 13, 600–612. [Google Scholar]
- Eltahan, M.; Alahmadi, S. Numerical Dust Storm Simulation Using Modified Geographical Domain and Data Assimilation: 3DVAR and 4DVAR (WRF-Chem/WRFDA). IEEE Access 2019, 7, 128980–128989. [Google Scholar] [CrossRef]
- Koch, G.; Zemel, R.; Salakhutdinov, R. Siamese Neural Networks for One-shot Image Recognition. In Proceedings of the 32nd International Conference on Machine Learning, Lille, France, 6–11 July 2015. [Google Scholar]
- Zhou, Y.Z.; Lou, Y.D.; Zhang, W.X.; Kuang, C.L.; Liu, W.X.; Bai, J.N. Improved performance of ERA5 in global tropospheric delay retrieval. J. Geod. 2020, 94, 103. [Google Scholar] [CrossRef]
- Zhang, L.; Liu, Y.Z.; Liu, Y.; Gong, J.D.; Lu, H.J.; Jin, Z.Y.; Tian, W.H.; Liu, G.Q.; Zhou, B.; Zhao, B. The operational global four-dimensional variational data assimilation system at the China Meteorological Administration. Q. J. R. Meteorol. Soc. 2019, 145, 1882–1896. [Google Scholar] [CrossRef] [Green Version]
- Barindelli, S.; Realini, E.; Venuti, G.; Fermi, A.; Gatti, A. Detection of water vapor time variations associated with heavy rain in northern Italy by geodetic and low-cost GNSS receivers. Earth Planets Space 2018, 70, 28. [Google Scholar] [CrossRef] [Green Version]


| Dataset | Agency | Maximum Time Resolution | Maximum Horizontal Resolution | Vertical Resolution | Assimilation Method |
|---|---|---|---|---|---|
| CRA40 | CMA | 6 h | 0.3125° × 0.3125° | 47 | 4DVAR |
| MERRA-2 | NASA | 6 h | 0.625° × 0.5° | 42 | GEOS-5 |
| ERA5 | ECMWF | 1 h | 0.25° × 0.25° | 37 | 4DVAR |
| Station Name | Latitude | Longitude | Altitude (m) | Coefficient between MERRA-2 PWV and RS PWV | Coefficient between ERA5 PWV and RS PWV |
|---|---|---|---|---|---|
| GLM00004360 | 65.61°N | 37.63°W | 54.0 | 0.8451 | 0.9181 |
| CAM00071802 | 47.51°N | 52.78°W | 112.4 | 0.9679 | 0.9784 |
| CHM00058027 | 34.28°N | 117.15°E | 42.0 | 0.9751 | 0.9822 |
| SAM00040430 | 24.55°N | 39.70°E | 654.0 | 0.7224 | 0.7326 |
| IDM00097014 | 1.53°N | 124.91°E | 80.0 | 0.6434 | 0.7365 |
| IDM00097072 | 0.68°S | 119.73°E | 6.0 | 0.5516 | 0.6223 |
| IDM00097560 | 1.18°S | 136.11°E | 11.0 | 0.5820 | 0.6209 |
| IDM00097180 | 5.06°S | 119.55°E | 14.0 | 0.4539 | 0.5477 |
| ASM00094403 | 28.80°S | 114.69°E | 36.9 | 0.7354 | 0.7373 |
| NZM00093844 | 46.41°S | 168.31°E | 2.0 | 0.7123 | 0.7428 |
| Meteorological Station | 2019 (mm) | 2020 (mm) | 2021 (mm) |
|---|---|---|---|
| PingDingShan Station | 43.36 | 44.35 | 47.22 |
| JiaoZuo Station | 49.62 | 50.77 | 53.48 |
| ZhengZhou Station | 44.92 | 45.98 | 48.88 |
| XuChang Station | 48.72 | 50.17 | 52.67 |
| KaiFeng Station | 49.30 | 51.87 | 54.13 |
| XinXiang Station | 49.76 | 51.44 | 53.82 |
| Meteorological Station | 18 July 2021 (mm) | 19 July 2021 (mm) | 20 July 2021 (mm) | 21 July 2021 (mm) |
|---|---|---|---|---|
| PingDingShan Station | 55.0 | 209.5 | 20.2 | 5.3 |
| JiaoZuo Station | 59.5 | 66.4 | 209.2 | 235.8 |
| ZhengZhou Station | 37.0 | 228.0 | 376.3 | 77.4 |
| XuChang Station | 3.6 | 166.2 | 175.2 | 27.9 |
| KaiFeng Station | 0.3 | 63.7 | 83.1 | 22.1 |
| XinXiang Station | 34.1 | 42.5 | 242.7 | 258.6 |
| Time of PWV | Time of TP | OMT | OMD | Time of PWV | Time of TP | OMT | OMD | ||
|---|---|---|---|---|---|---|---|---|---|
| 18 July | 00:00 | 02:00 | 2 h | 31.0% | 20 July | 00:00 | 03:00 | 3 h | 68.8% |
| 06:00 | 08:00 | 2 h | 36.1% | 06:00 | 08:00 | 2 h | 54.1% | ||
| 12:00 | 18:00 | 6 h | 56.0% | 12:00 | 15:00 | 3 h | 55.7% | ||
| 18:00 | 23:00 | 5 h | 47.5% | 18:00 | 00:00 | 6 h | 75.4% | ||
| 19 July | 00:00 | 02:00 | 2 h | 59.0% | 21 July | 00:00 | 02:00 | 2 h | 54.0% |
| 06:00 | 10:00 | 4 h | 65.6% | 06:00 | 12:00 | 6 h | 42.6% | ||
| 12:00 | 17:00 | 5 h | 80.3% | 12:00 | 15:00 | 3 h | 50.5% | ||
| 18:00 | 22:00 | 4 h | 60.6% | 18:00 | 22:00 | 4 h | 68.9% |
Publisher’s Note: MDPI stays neutral with regard to jurisdictional claims in published maps and institutional affiliations. |
© 2022 by the authors. Licensee MDPI, Basel, Switzerland. This article is an open access article distributed under the terms and conditions of the Creative Commons Attribution (CC BY) license (https://creativecommons.org/licenses/by/4.0/).
Share and Cite
Xu, Y.; Chen, X.; Liu, M.; Wang, J.; Zhang, F.; Cui, J.; Zhou, H. Spatial–Temporal Relationship Study between NWP PWV and Precipitation: A Case Study of ‘July 20’ Heavy Rainstorm in Zhengzhou. Remote Sens. 2022, 14, 3636. https://doi.org/10.3390/rs14153636
Xu Y, Chen X, Liu M, Wang J, Zhang F, Cui J, Zhou H. Spatial–Temporal Relationship Study between NWP PWV and Precipitation: A Case Study of ‘July 20’ Heavy Rainstorm in Zhengzhou. Remote Sensing. 2022; 14(15):3636. https://doi.org/10.3390/rs14153636
Chicago/Turabian StyleXu, Ying, Xin Chen, Min Liu, Jin Wang, Fangzhao Zhang, Jianhui Cui, and Hongzhan Zhou. 2022. "Spatial–Temporal Relationship Study between NWP PWV and Precipitation: A Case Study of ‘July 20’ Heavy Rainstorm in Zhengzhou" Remote Sensing 14, no. 15: 3636. https://doi.org/10.3390/rs14153636