Article

Risk Assessment of Snow Disasters for Animal Husbandry on the Qinghai–Tibetan Plateau and Influences of Snow Disasters on the Well-Being of Farmers and Pastoralists

1
School of Atmospheric Sciences, Plateau Atmosphere and Environment Key Laboratory of Sichuan Province, Chengdu University of Information Technology, Chengdu 610225, China
2
Sichuan Provincial Agricultural Meteorological Center, Chengdu 610072, China
3
Faculty of Geographical Science, Beijing Normal University, Beijing 100875, China
4
Water-Saving Agriculture in Southern Hill Area Key Laboratory of Sichuan Province, Chengdu 610066, China
5
Key Laboratory of Meteorological Disaster, Ministry of Education/International Joint Research Laboratory on Climate and Environment Change, Nanjing University of Information Science and Technology, Nanjing 210044, China
*
Author to whom correspondence should be addressed.
Remote Sens. 2022, 14(14), 3358; https://doi.org/10.3390/rs14143358
Submission received: 26 May 2022 / Revised: 7 July 2022 / Accepted: 8 July 2022 / Published: 12 July 2022

Abstract

:
In the context of global warming, meteorological disasters occur more frequently in various regions which exert increasing influences on human life. Snow disasters are some of the natural disasters that most seriously affect the development of husbandry on the Qinghai–Tibetan Plateau (QTP), so it is necessary to explore their spatio-temporal variations and perform comprehensive risk assessment. Based on the daily snow depth data set in China, obtained by inversion of satellite remote sensing data, the spatio-temporal variation characteristics of snow disasters on the QTP from 1980 to 2019 were studied. The regional difference in the comprehensive risks of snow disasters for the husbandry on the QTP was evaluated from four perspectives, i.e., the risk of hazard factors, sensitivity of hazard-inducing environments, vulnerability of hazard-affected bodies, and disaster prevention and mitigation capacity. The farmer and pastoralist well-being (FPWB) index in five typical regions was constructed to discuss the possible influences of snow disasters on the FPWB since the 21st century. Results show that, in the last 40 years, the frequency, duration, average snow depth, and grade of snow disasters on the QTP all exhibited significant interannual and interdecadal variabilities, and they also displayed a declining long-term trend. The comprehensive risk of snow disasters for the husbandry on the QTP is low in the north while high in the south. The high-risk zone accounts for 1.54% of the total and is mainly located in Kashgar City in the north-western end of the QTP; the sub-high-risk and medium-risk zones are mainly found in the south of the plateau and are distributed in a tripole pattern, separately covering 15.96% and 16.32% of the total area of the plateau; the north of the plateau mainly belongs to low-risk and sub-low-risk zones, which separately account for 43.06% and 23.12% of the total area of the plateau. Since the beginning of the 21st century, the FPWB in five typical regions, namely, Kashgar (I), Shigatse (II), Nagqu (III), Qamdo (IV), and Yushu (V), has been increasing, while the risk of snow disasters has gradually decreased. Every 1% decrease in the risk of snow disasters corresponded to 0.186%, 0.768%, 0.378%, 0.109%, and 0.03% increases in the FPWB index in the five regions. Snow disasters affect FPWB mainly by directly or indirectly damaging material resources (livestock inventories and meat production) and social and financial resources.

Graphical Abstract

1. Introduction

The sixth assessment report (AR6) released by the Intergovernmental Panel on Climate Change (IPCC) pointed out that extreme climate events have occurred more frequently in the context of global warming compared with pre-industrial-revolution levels [1]. The meteorological disasters and derived disasters triggered by extreme climate events have caused increasingly large losses and higher disaster risks which seriously affect society, the economy, and human life, so the topic has attracted wide attention [2]. The Qinghai–Tibetan Plateau (QTP), located in a mid-to-low-latitude region in the northern hemisphere, is the highest plateau in the world. At an average altitude of above 4000 m, animal husbandry is one of the economic pillars for residents on the QTP [3]. However, husbandry on the QTP is highly susceptible to natural disasters due to the special weather conditions and types of vegetation [4]. Among the natural disasters, snow disasters have become one of the leading meteorological disasters in winter and spring in alpine pastoral regions due to their long duration and wide range of influence. Continuous snowfall is frequent in alpine pastoral regions in winter and spring, and, at the same time, the snow persists for a long time due to the low temperature and readily covers short forage grass [4]. As a result, livestock feeding on forage grass may die of frost and starvation, which greatly threatens the livelihoods and property of local farmers and pastoralists and influences the productivity of husbandry. Meanwhile, previous research showed that the frequency and hazard of snow disasters on the QTP have also risen in the context of global climate change [5,6]. Therefore, assessing the risk of snow disasters based on determining the spatio-temporal distribution characteristics of snow disasters on the QTP is of significance for disaster prevention and protection of the husbandry on the plateau.
In recent years, much research into the spatio-temporal variation characteristics of snow disasters on the QTP has been performed using various data and technological means. Based on occurrence records and observations at meteorological stations, previous studies found that snow disasters on the QTP during winter and spring are mainly caused by abnormal snow accumulation from November to the following March [7]. In addition, snow disasters showed obvious interdecadal variations and a significant variation in the early 1990s. The frequency of snow disasters has shown an increasing trend since the 1990s [8,9], and the Lhoka City in the Tibetan Autonomous Region (Lhoka) in the south-west and the border between southern Qinghai Province and Sichuan Province are two centers with high frequencies of snow disasters [10]. With the climate warming over the plateau, the snow depth and the number of snow cover days for the majority of the QTP show a decreasing trend [11], and the decrease in the snow depth is more significant in the high-altitude areas [12]. Although the above studies achieved certain goals, the research conclusions were quite different due to the sparsely distributed nature of the meteorological stations on the QTP and differences in the selected meteorological stations and research areas [11,13,14,15]; because remote sensing data can provide snow information with high spatio-temporal resolution, they are widely used for the inversion and monitoring of snow [16,17,18], assessment of snow disasters [19,20], and early warning of snow disasters [21] in areas with sparse meteorological stations. These works greatly improved popular perception of the variations in, and possible drivers of, snowfall, and some scholars also used remote sensing data to explore the occurrence of snow disasters on the QTP. For example, Yin et al. [4] used AVHRR archival reflectance products to find that the grade of snow disaster on the QTP reduced from 1982 to 2012. No matter which data were used, most studies focused on the spatio-temporal variation characteristics of snow disasters. However, snow disasters, as one of the natural disasters that most greatly affects animal husbandry on the QTP, exert remarkable influences on all aspects of society, the economy, and people’s livelihood. Therefore, snow disasters need to be comprehensively studied from the perspective of risk assessment, in addition to the existing studies which discussed the influences of snow disasters on livestock in typical regions of the QTP [22,23]. Meanwhile, researchers have used human well-being to characterize the material and spiritual satisfaction of residents in recent years. Because of the close relations between the people’s livelihood and governmental decisions, human well-being has recently been paid much heed by many researchers [24,25]. Numerous studies were conducted on human well-being from multiple perspectives, including studies of variation characteristics and influence factors [26,27,28,29,30]; however, most studies focused on social and ecological topics. Natural disasters may affect material supply, living environment, and even life and property security of residents, so their influences on residents’ physical and mental health cannot be underestimated. However, there are few studies on the influences of natural disasters on human well-being.
Therefore, this research mainly aims to determine regional differences in the comprehensive risk degree of snow disasters for husbandry on the QTP by comprehensively considering the risk of hazard factors, sensitivity of hazard-inducing environments, vulnerability of hazard-affected bodies, and disaster prevention and mitigation capacity from the perspective of the risk assessment of snow disasters. This is based on analysis of spatio-temporal variation characteristics of snow disasters on the QTP. Then, the farmer and pastoralist well-being (FPWB) index is constructed to evaluate possible influences of snow disasters on FPWB on the QTP since the beginning of the 21st century. The research results provide a theoretical basis for making policies to prevent snow disasters and selecting policies for FPWB on the QTP.

2. Materials and Methods

2.1. Definition of Snow Disasters

Snow disasters on the QTP mainly occur from October to the following May, so this time period was selected for calculating snow disasters. For time recording, the period from October 1979 to May 1980 was used as a statistical time period, recorded as of the year of 1980, which was divided into last winter (from October 1979 to February 1980) and this spring (from March to May 1980). Other years were recorded in the same way, thus, obtaining snow disasters over 40 years from 1980 to 2019. According to previous research and relevant meteorological standards [4,31,32], the snow disasters of last winter and this spring on the QTP were graded following criteria in Table 1 and Table 2. Based on the criteria, the grade, duration, and average snow depth of snow disasters were summarized. Therein, the highest grade of snow disaster was taken as the annual grade of snow disaster. For example, if three snow disasters occurred in a year, including a slight, a moderate, and an extremely heavy event, then the year was recorded as having had an extremely heavy snow disaster. The sum of durations of several snow disasters in a year was recorded as the duration of snow disasters. The average snow depth was the average value during the snow disasters.

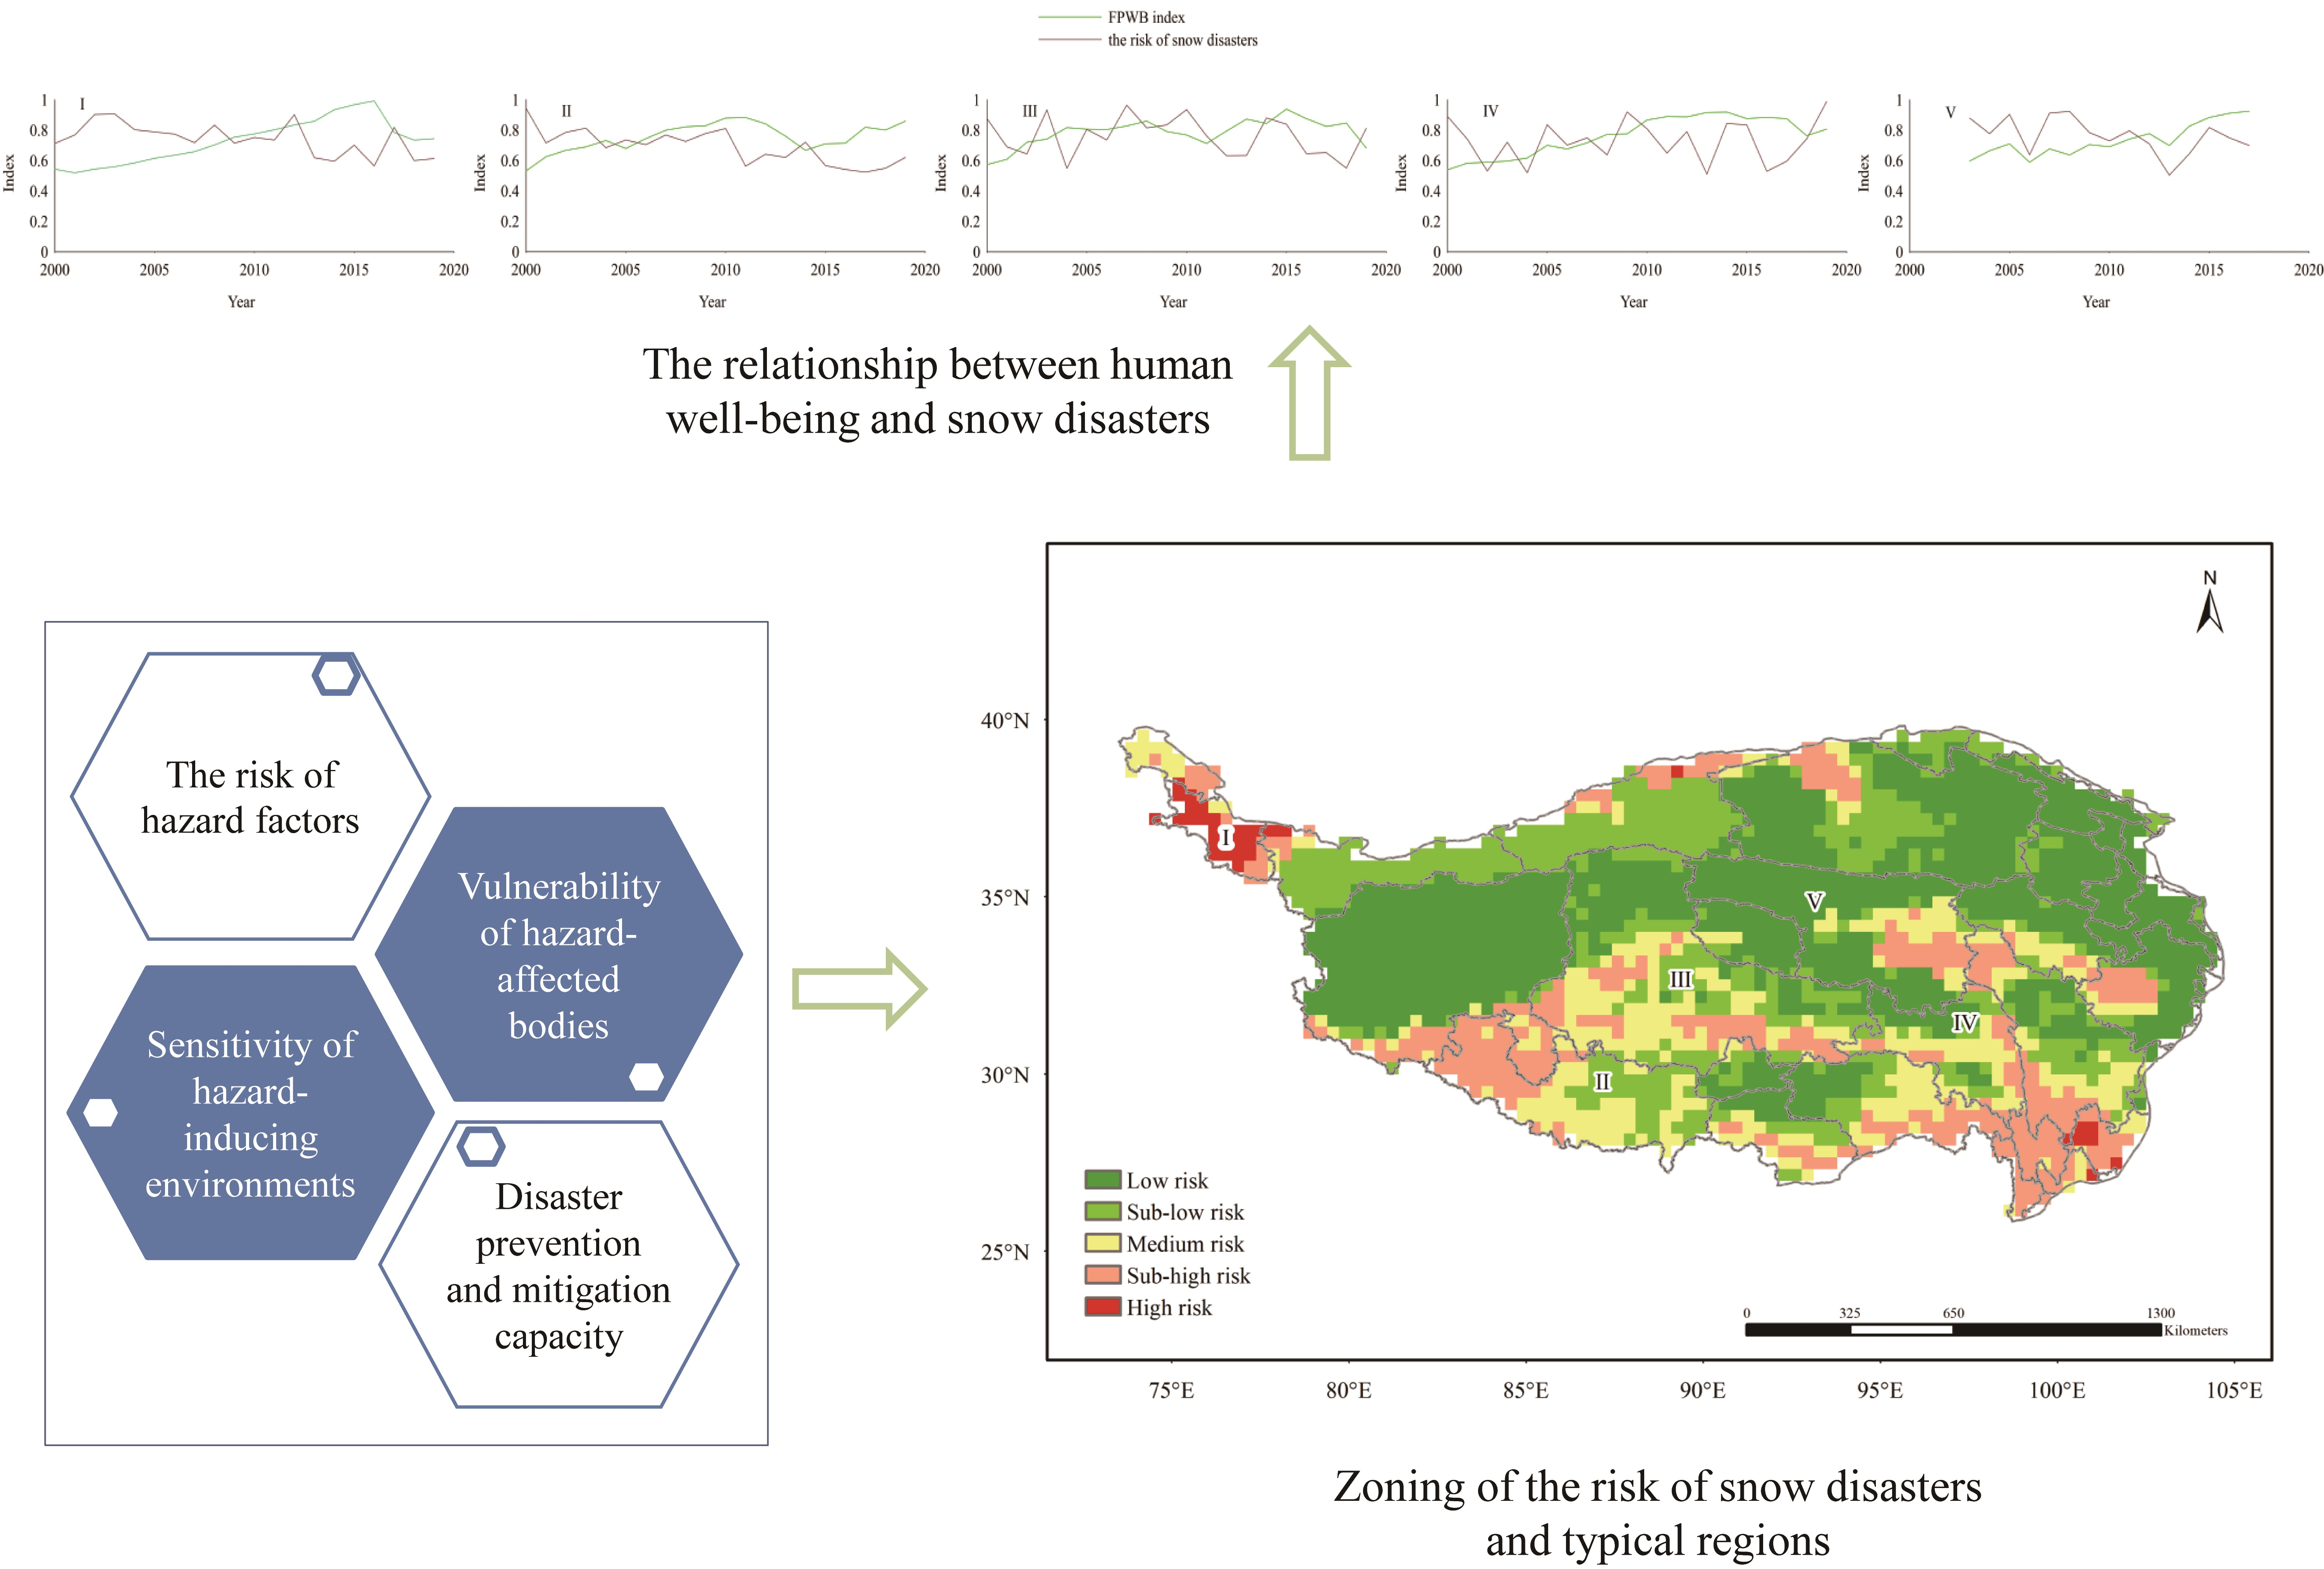
2.2. Risk Assessment Method of Snow Disasters

Snow disasters are a type of natural disaster. In risk assessment, the comprehensive risk of snow disasters is reflected by the risk of hazard factors, sensitivity of hazard-inducing environments, vulnerability of hazard-affected bodies, and disaster prevention and mitigation capacity according to the risk-forming theory of relevant natural disasters. The disaster risk is expressed as follows:
D = f ( H , S , V , R )
where D, H, S, V, and R separately represent the disaster risk, risk of hazard factors, sensitivity of hazard-inducing environments, vulnerability of hazard-affected bodies, and disaster prevention and mitigation capacity; f is the function relationship.
When assessing the risk of snow disasters on the QTP, the following equation was used:
FDVI = ( E WE ) V WV ( S WS ) ( 10 R ) WR
where FDVI represents the comprehensive risk index of snow disasters, and its value can be used to characterize the risk degree of snow disasters for husbandry on the QTP; the larger its value, the higher the risk of snow disasters. E, V, S, and R separately denote indices of various assessment factors, including the hazard factor, hazard-inducing environment, hazard-affected body, and disaster prevention and mitigation capacity; WE, WV, WS, and WR represent weights of various assessment factors, which are determined using the analytic hierarchy process (AHP). Weights of various factors are listed in Table 3.
In the calculation, various factors contain several different indexes, each of which has a different dimension and order of magnitude. Therefore, Equation (3) is used to normalize the various indices to ensure the comparability of various indices; thereafter, the indices lie within the range 0.5–1.
A i j = 0.5 + 0.5 × a i j m i n i m a x i m i n i
where Aij denotes the normalized value of the ith index at the jth station (or grid); aij is the value of the ith index at the jth station (or grid); maxi and mini separately represent the maximum and minimum of the ith index.
Finally, the natural breaks method was adopted to grade the comprehensive indices of snow disasters for husbandry as high-risk, sub-high-risk, medium-risk, low-risk, and sub-low-risk zones.

2.3. Establishment of the FPWB Index

Human well-being is used to characterize the living conditions of people, involving health, happiness, and affluence of materials. Early research on human well-being was mainly dedicated to economics and sociology. In recent years, research on human well-being has been gradually heeded by scholars in ecology and geology with the promotion of the idea of sustainable development. Meanwhile, characterization of human well-being has also gradually expanded from a single economic index to the ecological system. According to differences in research foci, human well-being is also divided into objective and subjective dimensions. This research focused on well-being of farmers and pastoralists (shorted as FPWB) according to sources of income, living styles, and the factors influencing the economy of residents on the QTP. To characterize FPWB, the FPWB index on the QTP was established by combining the conceptual framework of objective well-being and the concept of livelihood capital.
The FPWB index is composed of various factors. This research selected key factors that are closely related to the life of farmers and pastoralists from the agricultural part in provincial statistical yearbooks. These factors can be grouped into the following four aspects: natural resources, human resources, material resources, and social and financial resources, and indices contained in each level are listed in Table 4. The indices are quantified using the weighted comprehensive evaluation method, and their weights are determined by the AHP. In this way, the FPWB index can be expressed by Equation (4):
FPWB = V1W1 + V2W2 + V3W3 + V4W4
where FPWB represents the farmer and pastoralist well-being; W1, W2, W3, and W4 separately denote the four aspects that constitute the FPWB index, namely, natural resources, human resources, material resources, and social and financial resources; and V1, V2, V3, and V4 are weights of each level of assessment, which are determined using the AHP. The final weights are listed in Table 4. Likewise, each index is also normalized because each level of assessment involves different indices that are in different units and dimensions and must be normalized to reach the goal of eliminating differences and making the indices comparable.

2.4. Data Sources

Snow data: the snow depth long time-series data set in China (1979–2019) was provided by the National Tibetan Plateau Data Center (TPDC). The data set was obtained by inversion of SMMR (1979–1987), SSM/I (1987–2007), and SSMI/S (2008–2019) daily EASE-Grid brightness temperature data processed by the National Snow and Ice Data Center of the United States with a spatial resolution of 25 km. The data set has been widely proved to be reliable, and its development is described elsewhere [33,34,35].
Socio-economic data: socio-economic data, including the number of rural households, the number of employees in farming, forestry, animal husbandry, and fishery, GDP, and net income of rural residents, were extracted from statistical yearbooks of Qinghai Province, the Tibetan Autonomous Region, Sichuan Province, Gansu Province, and the Xinjiang Uygur Autonomous Region.

3. Results

3.1. Spatio-Temporal Variation of Snow Disasters

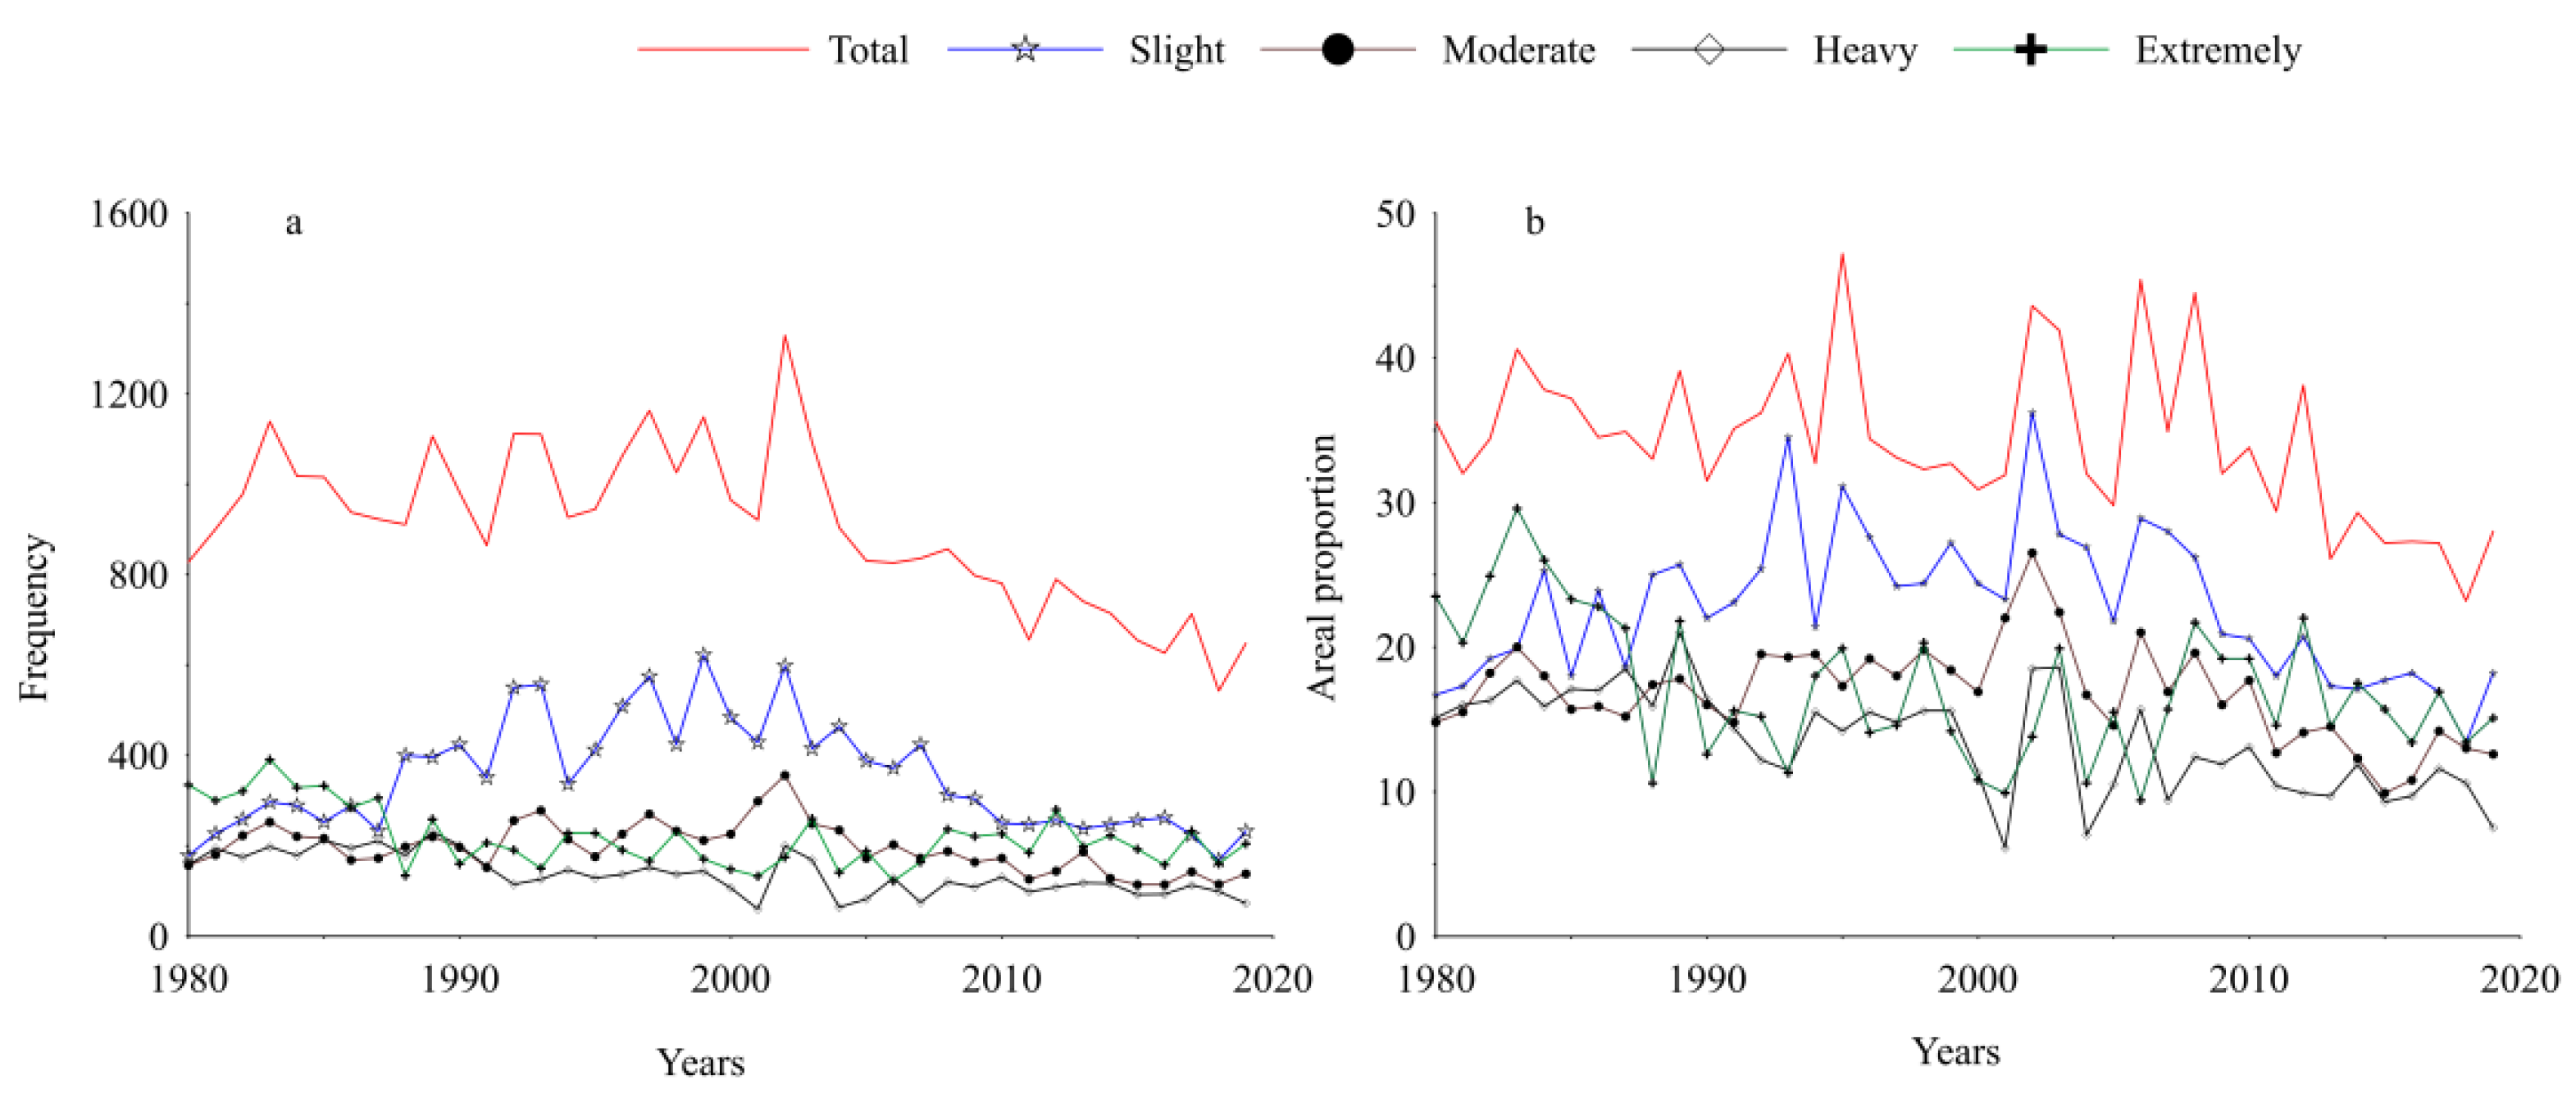
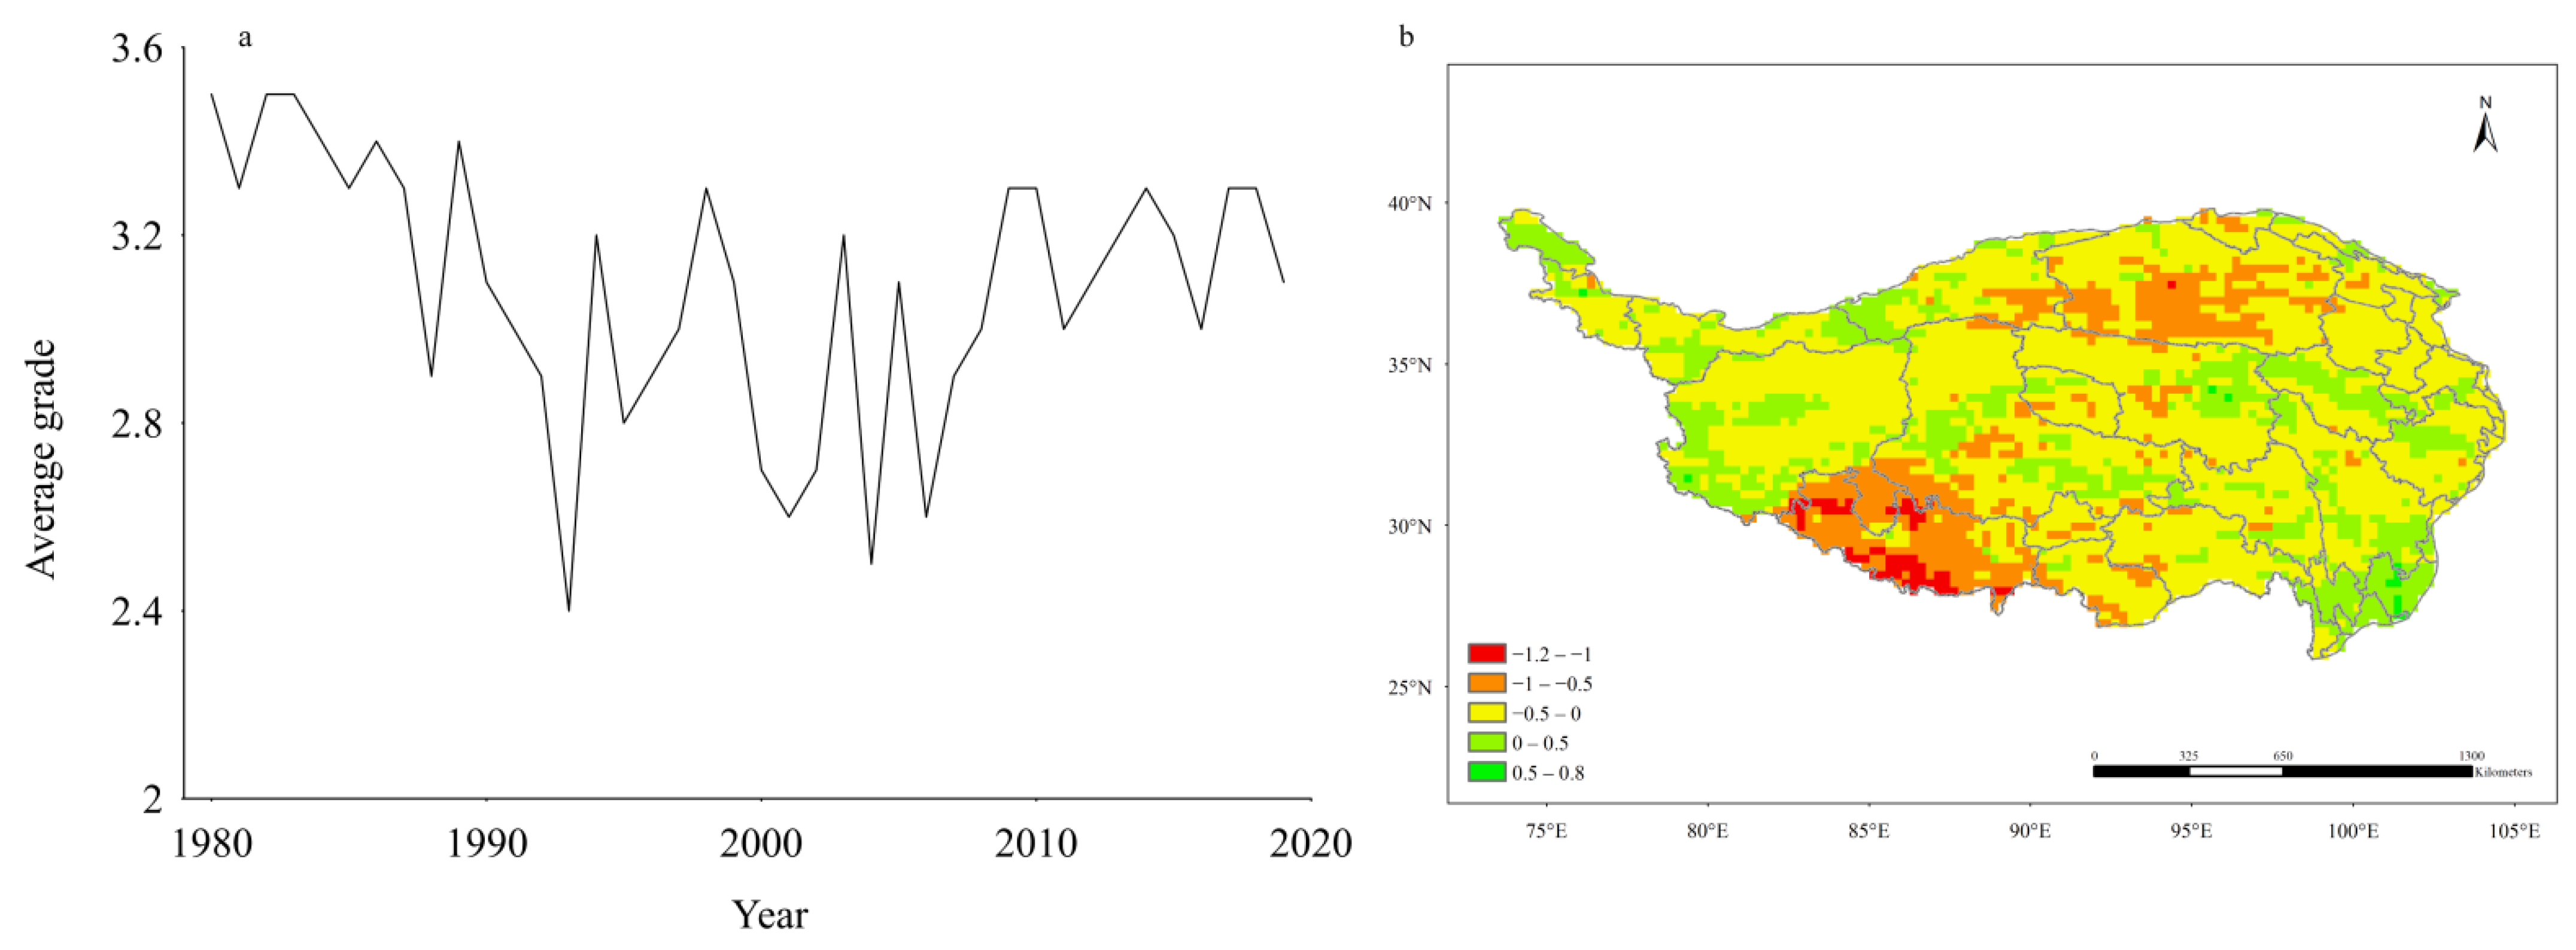
3.1.1. Temporal Variation Characteristics

According to the above division criteria for the grade of snow disaster, the frequency and areal proportion of snow disasters on the QTP from 1980 to 2019 were summarized (Figure 1). Over the past 40 years, 36,330 snow disasters happened at 724 grid points on the QTP, that is, 908 snow disasters every year on average. The annual average frequency was the lowest, at only 687, in the 2010s (2010–2019), while that in the 1990s (1990–1999) was relatively high at about 1034. Although the climate tendency rate shows that the overall frequency of snow disasters declined significantly (−94.9 times/decade, p < 0.01), the variations showed interdecadal characteristics. The frequency of snow disasters increased with volatility (74.2 times/decade, p < 0.05) in the 1980s and 1990s, while, after entering the 21st century, it exhibited a monotonic decreasing trend (−285.5 times/decade, p < 0.01). Variations of the frequency of different grades of snow disaster also showed remarkable differences: 354 slight snow disasters happened annually on average, with the lowest number in 2018 (168 times), while the largest number occurred in 1999 (622). The frequency of slight snow disasters showed a decreasing trend in the long run (−16.8 times/decade) (not passing the significance test). However, it also demonstrated a tendency to increase first, then decrease during the aforementioned interdecadal variation; the frequency increased significantly in the 1980s and 1990s by 186 times/decade (p < 0.01), while it significantly declined since the beginning of the 21st century by −168.4 times/decade (p < 0.01). Variations in the frequency of moderate snow disasters also showed similar characteristics: the frequency declined significantly (−19.4 times/decade, p < 0.05); it significantly increased before the beginning of the 21st century (39.5 times/decade, p < 0.05) and decreased significantly (−67.5 times/decade, p < 0.01) thereafter. In terms of the long-term variation trend, the frequencies of heavy and extremely heavy snow disasters were, separately, −28.7 times/decade (p < 0.01) and −29.1 times/decade (p < 0.01) without significant interdecadal variation.
Regarding the areal proportion of snow disasters, an average of 34.3% of the area of the QTP suffered from snow disasters every year, while the areal proportion of snow disasters shrank at −1.9%/decade (p < 0.05). This decline mainly occurred since the 2010s. Although the areal proportions of different grades of snow disaster changed with certain differences over the last 40 years, they all showed a decreasing trend. The areal proportions of slight and moderate snow disasters decreased slightly and did not pass the significance test, while those of heavy and extremely heavy snow disasters declined significantly by −2.1%/decade and −1.8%/decade, separately, passing the significance tests at the 0.01 and 0.05 levels.
As to the long-term variations in the annual frequencies of different grades of snow disasters at various grid points (Figure 2), the long-term variation trends of different grades of snow disasters and that of all snow disasters showed similar spatial distribution over the last 40 years. That is, the frequency of snow disasters showed a decreasing trend for the majority of the QTP in the context of global warming, with areas with the most significant decrease distributed mainly in the center and south of the Tibetan Autonomous Region and the north of Qinghai Province. The areas with an increasing frequency of snow disasters were dispersed and relatively concentrated in the north-western and south-eastern parts of the QTP with a slightly increasing trend.
The duration of snow disasters and snow depth are also important indices used for measuring snow disasters. Figure 3 illustrates the regional average variations of the duration of snow disasters and snow depth on the QTP over the past 40 years and the corresponding spatial distribution of long-term variation trends. The figure shows that the average duration of snow disasters in the past 40 years was 116 d, with the longest being 151 d (1982) and the shortest being 69 d (2006). The average snow depth was 73 mm, with the deepest being 89 mm (1992) and the shallowest being 60 mm (2006). Compared with variations of the snow depth (Figure 3c), the duration of snow disasters showed more obvious interdecadal variation characteristics. It can be seen from Figure 3a that the duration of snow disasters showed a significant decreasing trend before the beginning of the 21st century (−22.7 d/decade, p < 0.01); the snow disasters lasted for the shortest time in 2006, while their duration rapidly lengthened in the several years following until 2010 when the duration showed stable volatility. Correspondingly, the snow depth did not fluctuate greatly over the past 40 years and did not have significant interdecadal variation; however, the long-term variation trends of the duration of snow disasters and snow depth at different grid points (Figure 3b,d) exhibited significant spatial differences, and the two showed similar spatial distributions. The majority of the area of the QTP was found to have decreased duration of snow disasters and snow depth. The areas with the most significant decrease in the duration were mainly distributed in the center and south of the Tibetan Autonomous Region. The duration of snow disasters in these high-value centers was found to have a decreasing trend in the range of −40 to −67 d/decade. In addition, a sub-high-value center was found in the north of Qinghai Province, where the duration of snow disasters decreased in a trend from −20 to −40 d/decade. The areas with the most significant decreasing trend (−1 to −2 cm/decade) of snow depth were mainly concentrated in the south of the Tibetan Autonomous Region. Areas where the duration of snow disasters showed an increasing trend were dispersed, with relatively concentrated areas in the north-west and south-east of the QTP, varying within 20 d/decade. Areas with increasing snow depth where the snow depth increase did not exceed 10 mm/decade, were more dispersed.
The annual grade of snow disaster is the highest grade of snow disaster in a year. In this way, the variations in regional average grades of snow disaster and the spatial distribution of long-term variations over the past 40 years were calculated (Figure 4); the multi-year variations in the grade of snow disaster on the QTP showed significant interannual volatilities and a slight decreasing trend over the past 40 years (not passing the significance test). However, the grade tended to decrease then increase in different sections, somewhat akin to the variations in the duration of snow disasters. That is, the grade of snow disasters exhibited a significant decreasing trend before the early 21st century, growing significantly for several years thereafter, and showing slight volatility in the 2010s. The long-term variations at different grid points were found to have an uneven spatial distribution; the grade of snow disaster slightly rose in most areas of the QTP, with the most significant increase at the south-eastern margin of the plateau. Areas where the grade of snow disaster declined were mainly distributed at the southern margin of the plateau and in the region of the Qaidam Basin, particularly the former, where the grade declined most significantly.

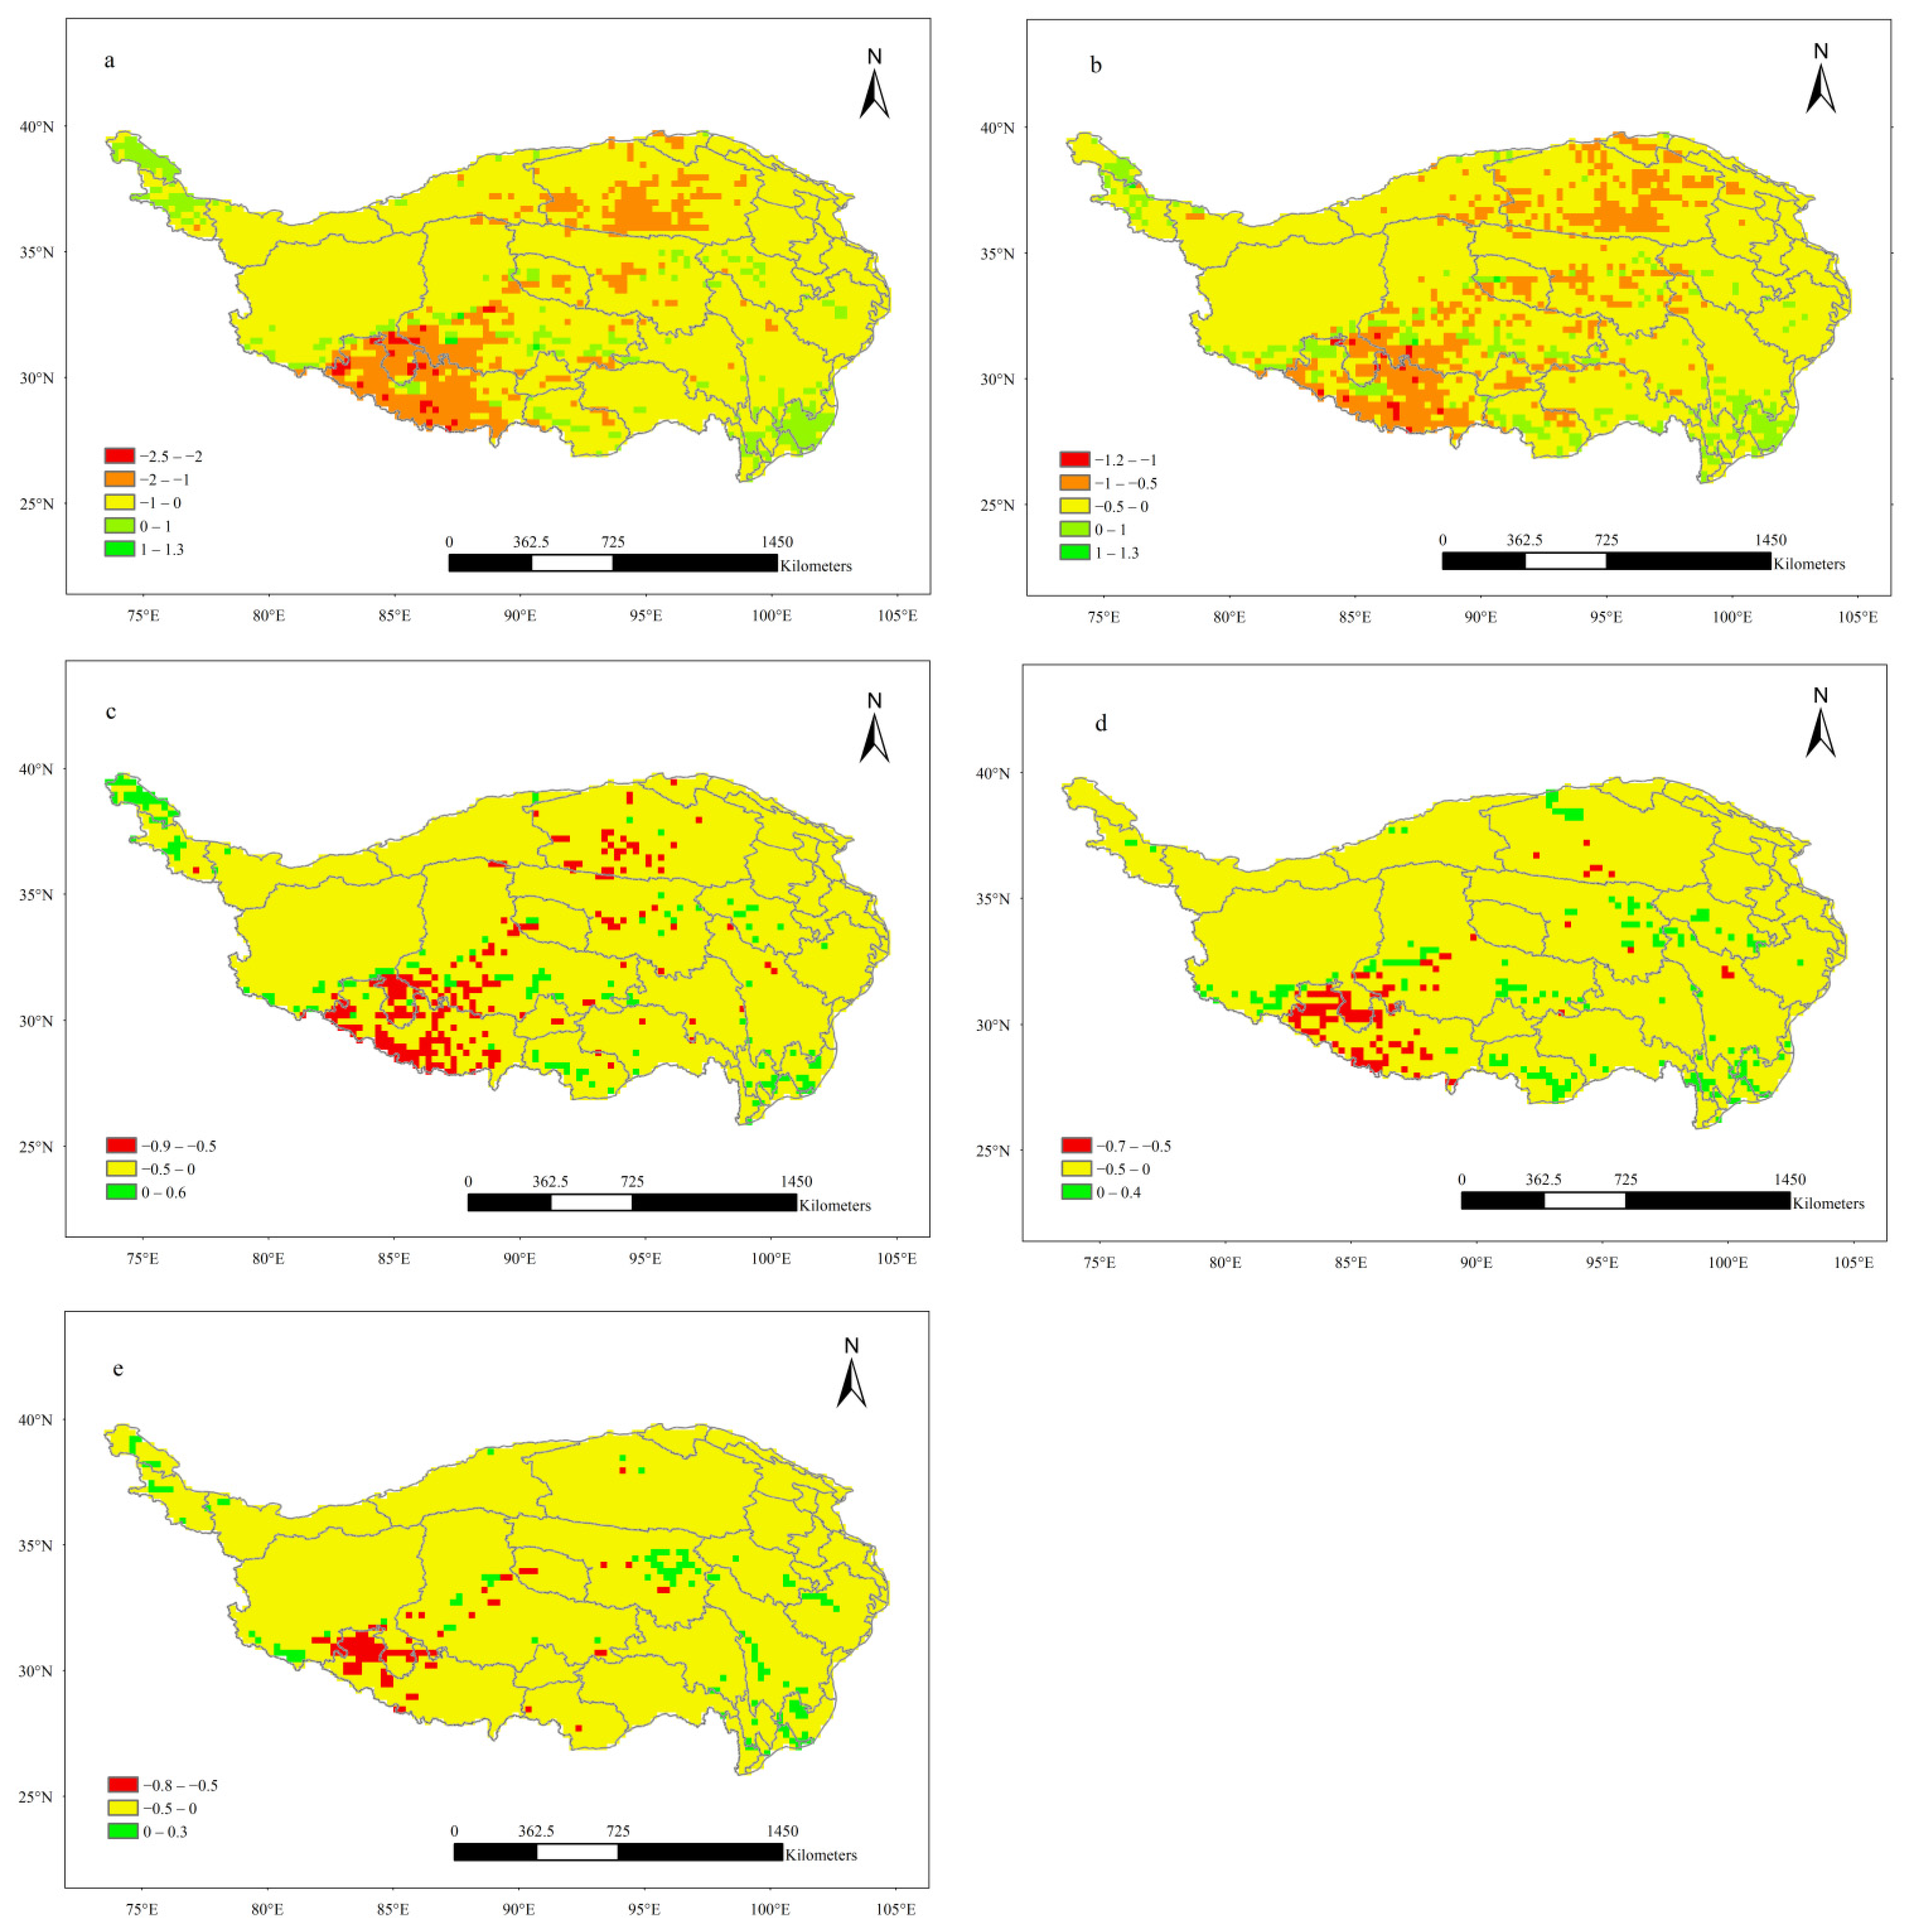
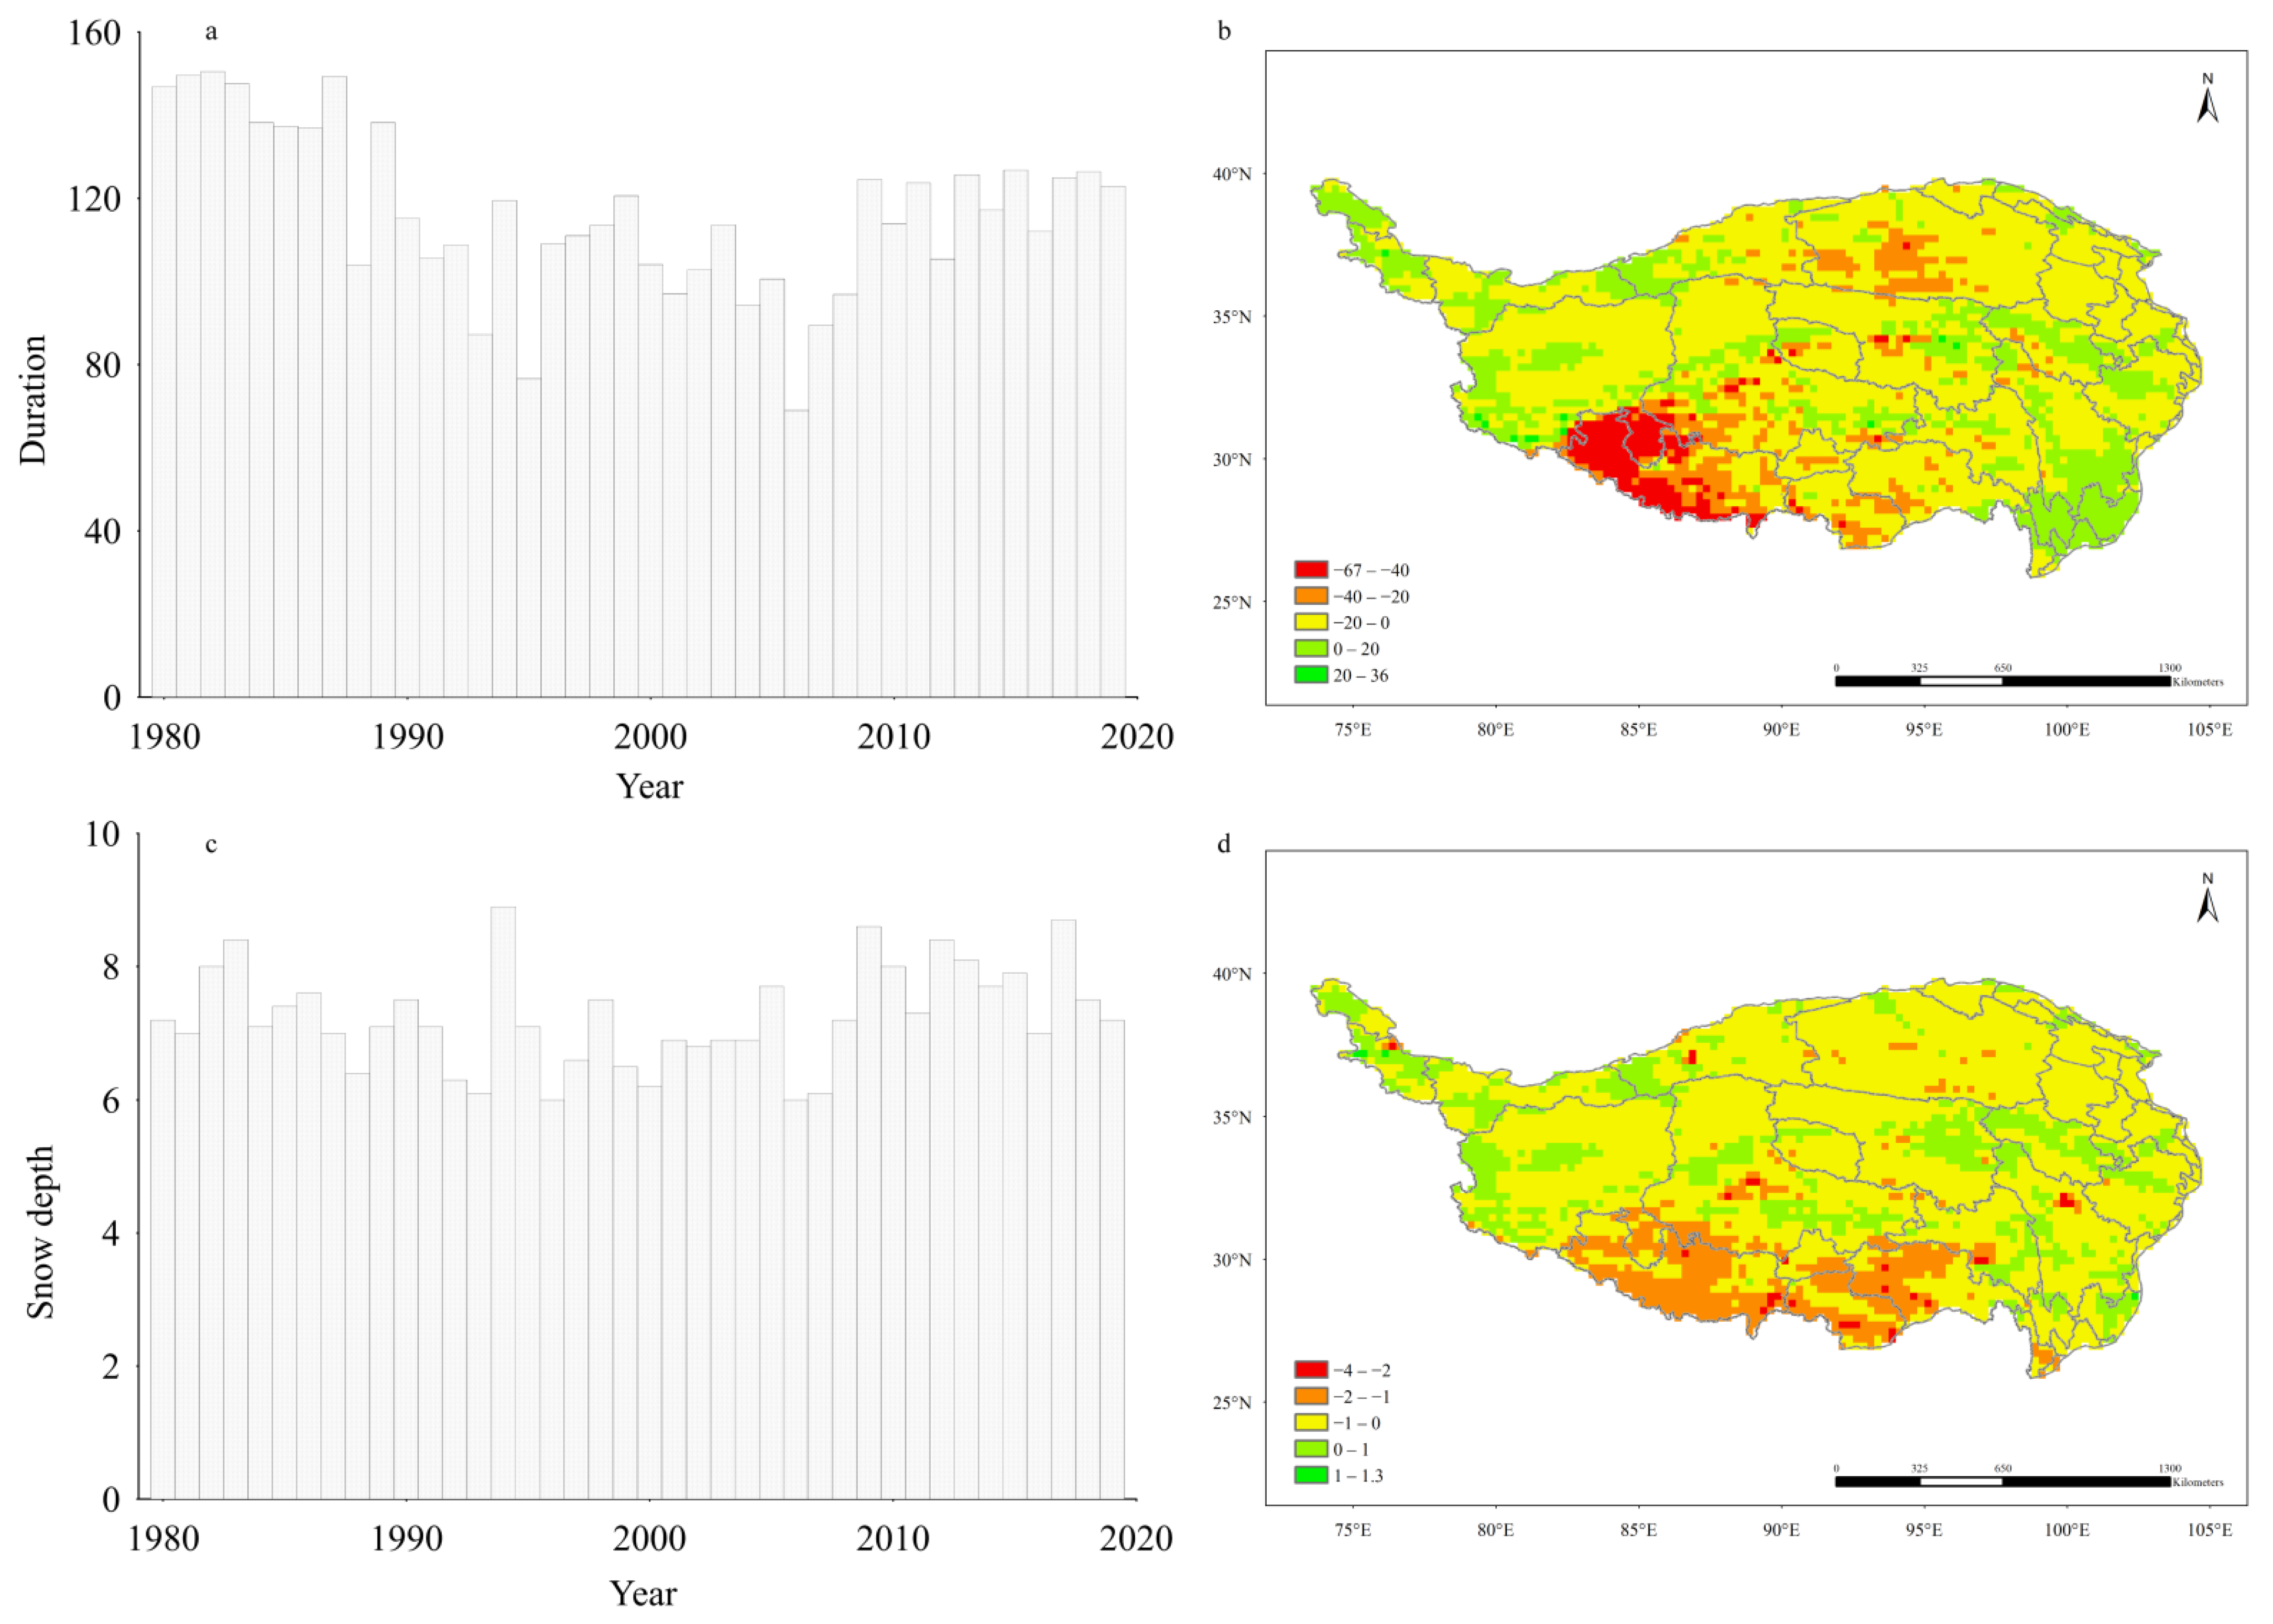
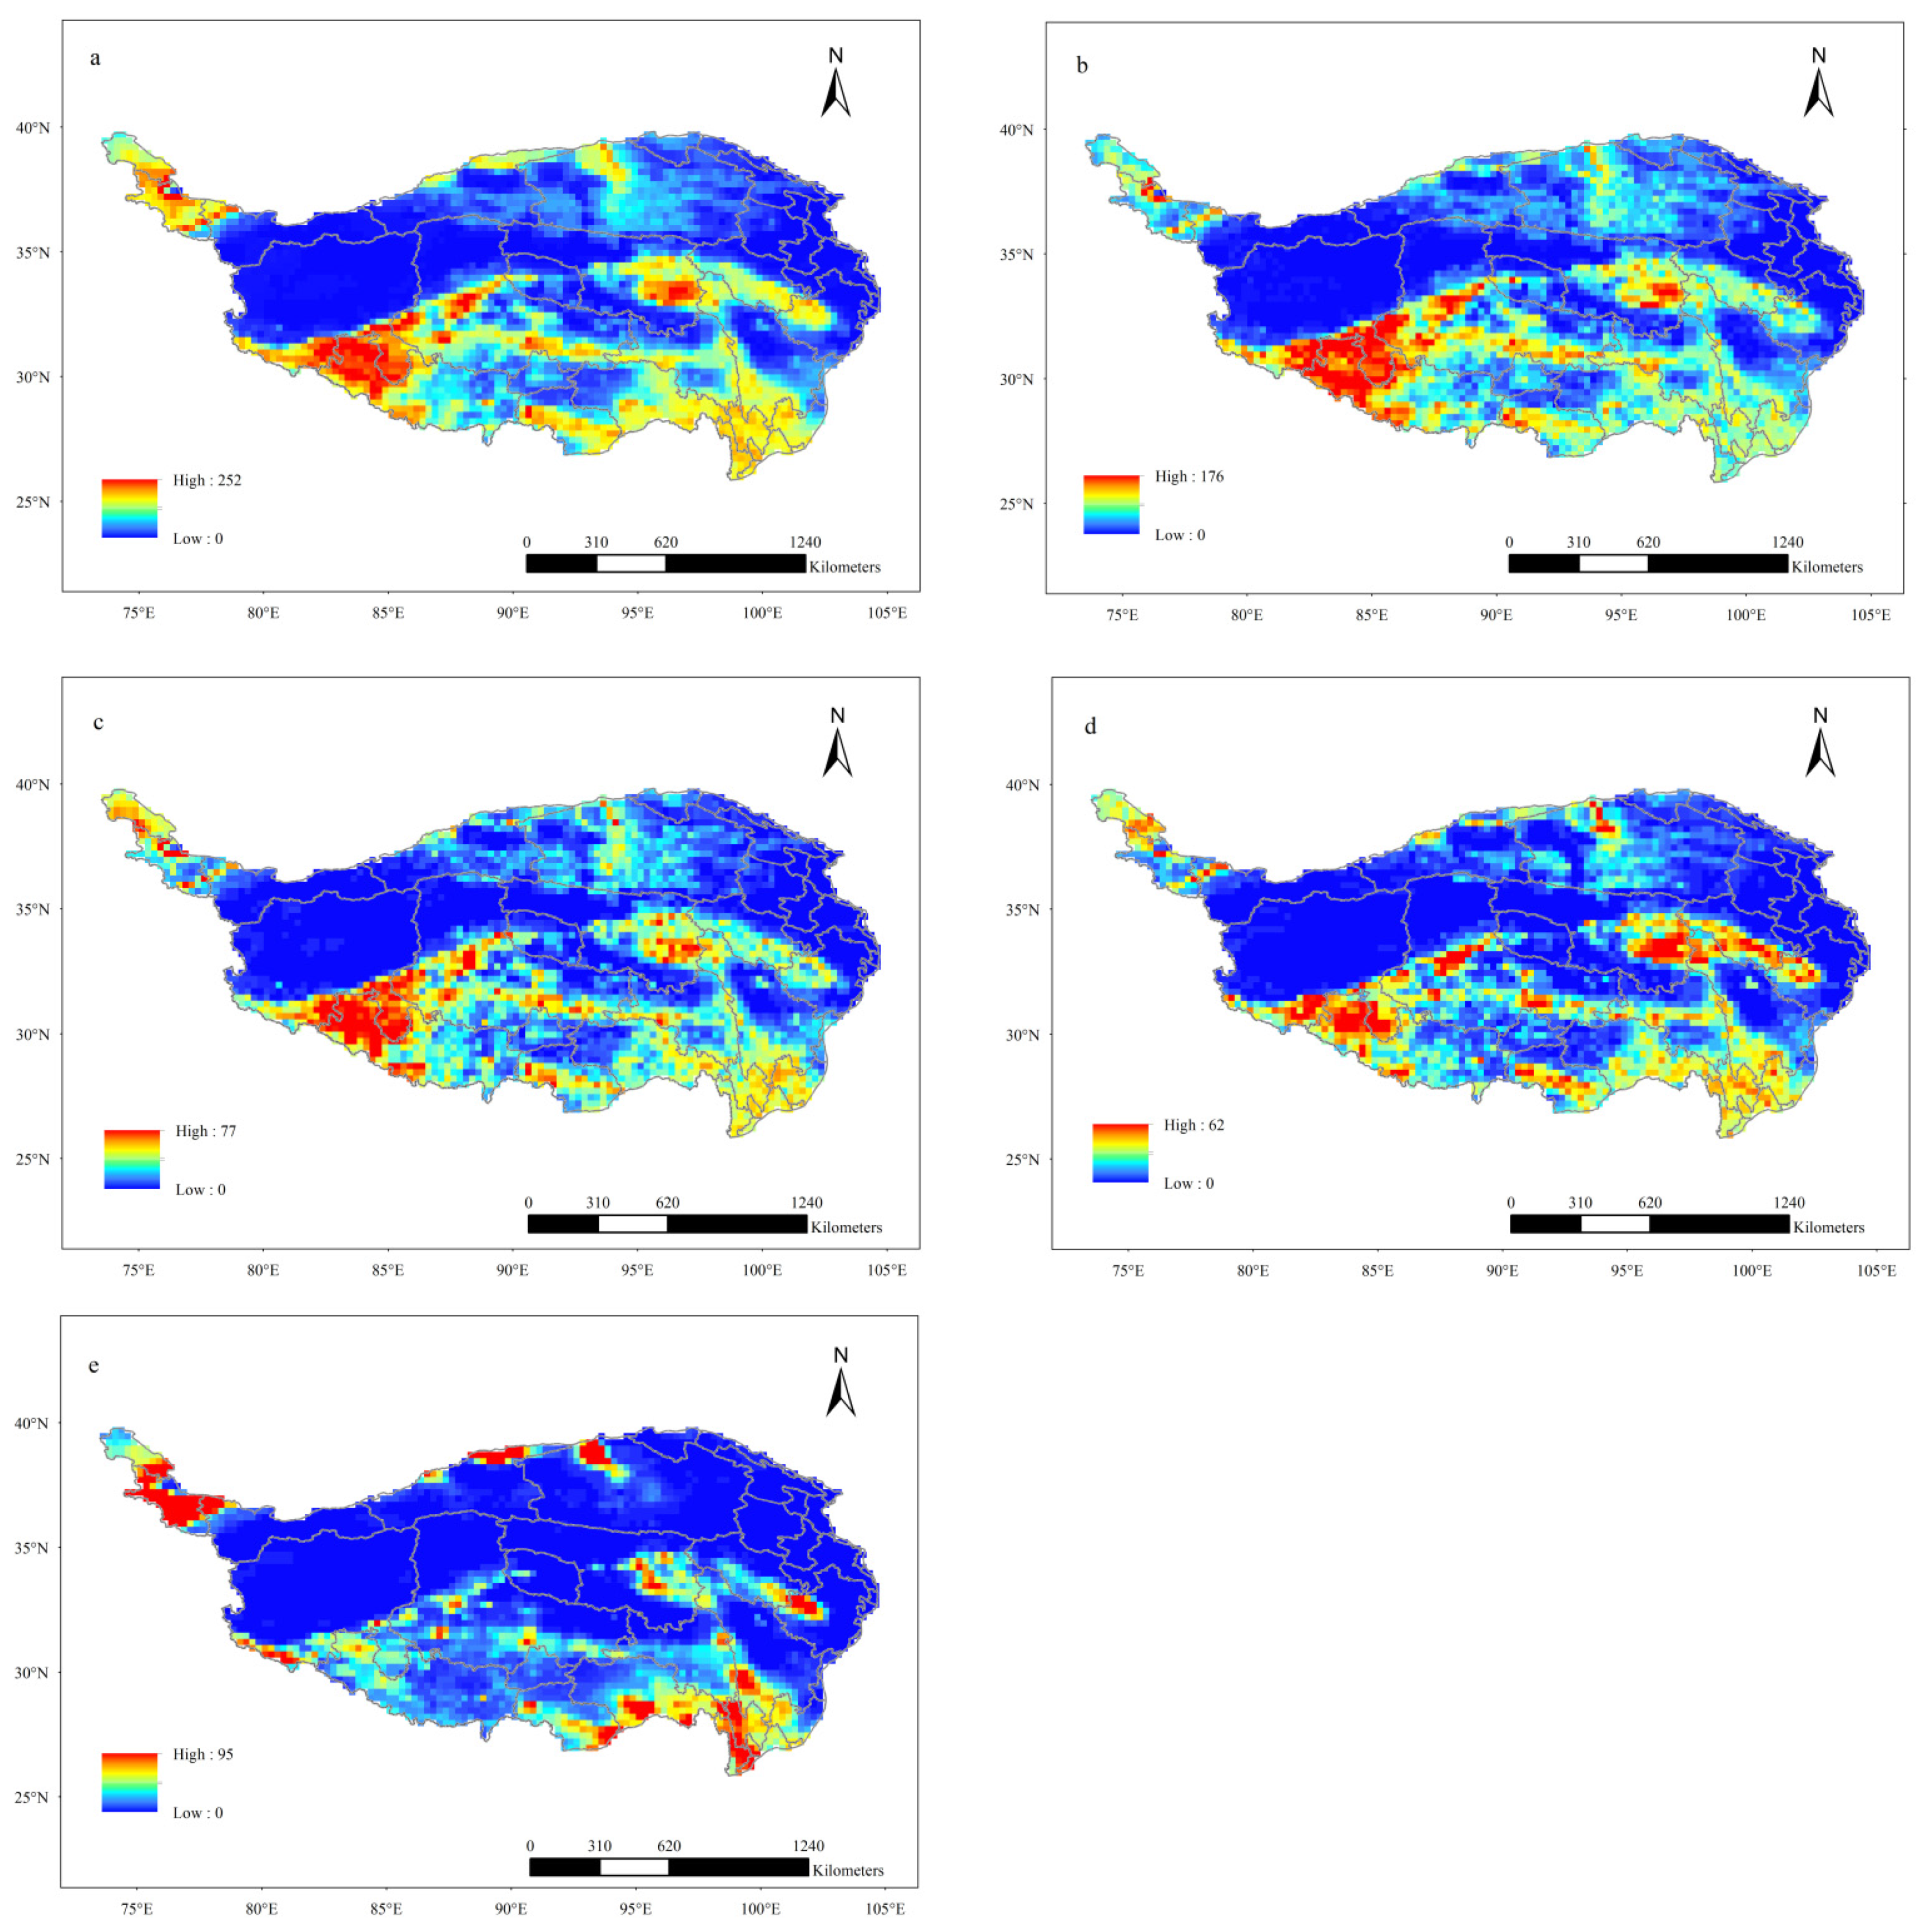
3.1.2. Spatial Distribution

From the spatial distribution of the overall frequency of snow disasters on the QTP over the past 40 years (Figure 5a), it can be seen that snow disasters were very unevenly spread across the plateau. In the west of the QTP, there is an obvious, low-value center from Ngari Prefecture in the Tibetan Autonomous Region (hereinafter shorted to Ngari) to Hotan Prefecture in the Xinjiang Uygur Autonomous Region (Hotan) to northern Nagqu County in the Tibetan Autonomous Region (Nagqu) to northern Yushu Tibetan Autonomous Prefecture in Qinghai Province (Yushu). Fewer than 10 snow disasters happened in most areas along the zone in the past 40 years, and most areas did not suffer from any snow disasters. In addition, there is also a low-value center with very few snow disasters in the north-east of the QTP from Xining City in Qinghai Province (Xining) to Haidong Prefecture in Qinghai Province (Haidong) to the Tibetan Autonomous Prefecture of Huangnan in Qinghai Province (Huangnan) to Gannan Tibetan Autonomous Prefecture in Gansu Province (Gannan) to northern Aba Tibetan and Qiang Autonomous Prefecture in Sichuan Province (Aba). There are three relatively concentrated high-value centers and one sub-high-value center with relatively high frequencies of snow disasters. The areas with the highest frequency of snow disasters are mainly found in the west of Shigatse City in the Tibetan Autonomous Region (Shigatse) and south-eastern Ngari in the south of the QTP, extending north-eastward to the center of Nagqu. This zone is where snow disasters happened most frequently on the QTP, with as many as 150 to 252 snow disasters over the past 40 years. Eastern Yushu in the middle of the QTP is also a high-value center and had around 150 to 200 snow disasters. Moreover, there is also a high-value center that had 150 to 200 snow disasters in the north-western end of the QTP from Kashgar Prefecture to Kizilsu Kirgiz Autonomous Prefecture (both in the Xinjiang Uygur Autonomous Region, Kashgar and Kizilsu Kirgiz). Snow disasters also happened frequently in the south-east of the QTP, which is a sub-high-value zone, with cumulative snow disasters amounting to 50 to 150 therein.
According to the spatial distribution of frequencies of slight, moderate, and heavy snow disasters (Figure 5b–d), despite different frequencies of different grades of snow disaster, the spatial distribution of the frequencies of these snow disasters was similar to that of the overall frequency of all snow disasters. That is, there are three relatively concentrated high-value centers, one sub-high-value center, and two low-value zones. In comparison, the frequency of extremely heavy snow disasters showed a very different spatial distribution (Figure 5e), mainly occurring in relatively decentralized high-value centers, and the relatively concentrated high-value centers are mainly located in two regions: the south-eastern end of the QTP and the north-western end of the plateau along Kashgar to Kizilsu Kirgiz. The cumulative numbers of extremely heavy snow disasters in the two high-value centers were mainly between 50 and 95.
Figure 6 shows the spatial distribution of the average duration of snow disasters and the corresponding average snow depth on the QTP over the past 40 years. The low-value zones are distributed in areas consistent with the frequency of snow disasters, while the high-value zones are distributed in different areas. The area with the longest average duration of snow disaster was in the north-western end of the QTP from Kashgar to Kizilsu Kirgiz, and the average duration of snow disaster in the high-value center was between 150 and 229 d. High-value centers with a long duration of snow disaster are also present in the south-east and the middle (eastern Yushu) of the QTP. Although snow disasters occur frequently in the south of the QTP, from the western Shigatse–south-eastern Ngari line, the duration does not tend to be any longer than in the aforementioned areas, so it is a sub-high-value zone. The spatial distribution of the average snow depth was similar to that of the duration of snow disasters; the high-value center is located in the north-western end of the QTP along the Kashgar–Kizilsu Kirgiz line, followed by the south-east of the plateau.
The spatial distribution of multi-year average grades of snow disaster on the QTP over the past 40 years (Figure 7) indicates that the average grades of snow disaster were distributed with multiple high-value centers. The highest-value center is in the north-western end of the QTP from Kashgar to Kizilsu Kirgiz, where the multi-year average grade of snow disasters always reached a level concomitant with extremely heavy snow disasters every year. There is also an area with a relatively high average grade of snow disaster in the south-east of the QTP, with the core area being from Lhoka City–Nyingchi City in the Tibetan Autonomous Region (Nyingchi) to Diqing Tibetan Autonomous Prefecture in Yunnan Province (Diqing). In that area, heavy snow disasters may take place. The zone from Yushu to the Tibetan Autonomous Prefecture of Golog in Qinghai Province (Golog) to Aba in the center of the QTP is also a continuous area with a high average grade of snow disaster, with snow disasters in the central zone reaching a heavy grade. The zone with a high average grade of snow disasters and covering a large area is found in the south of the QTP along the western Shigatse–south-eastern Ngari line, with a moderate grade of snow disaster on average.

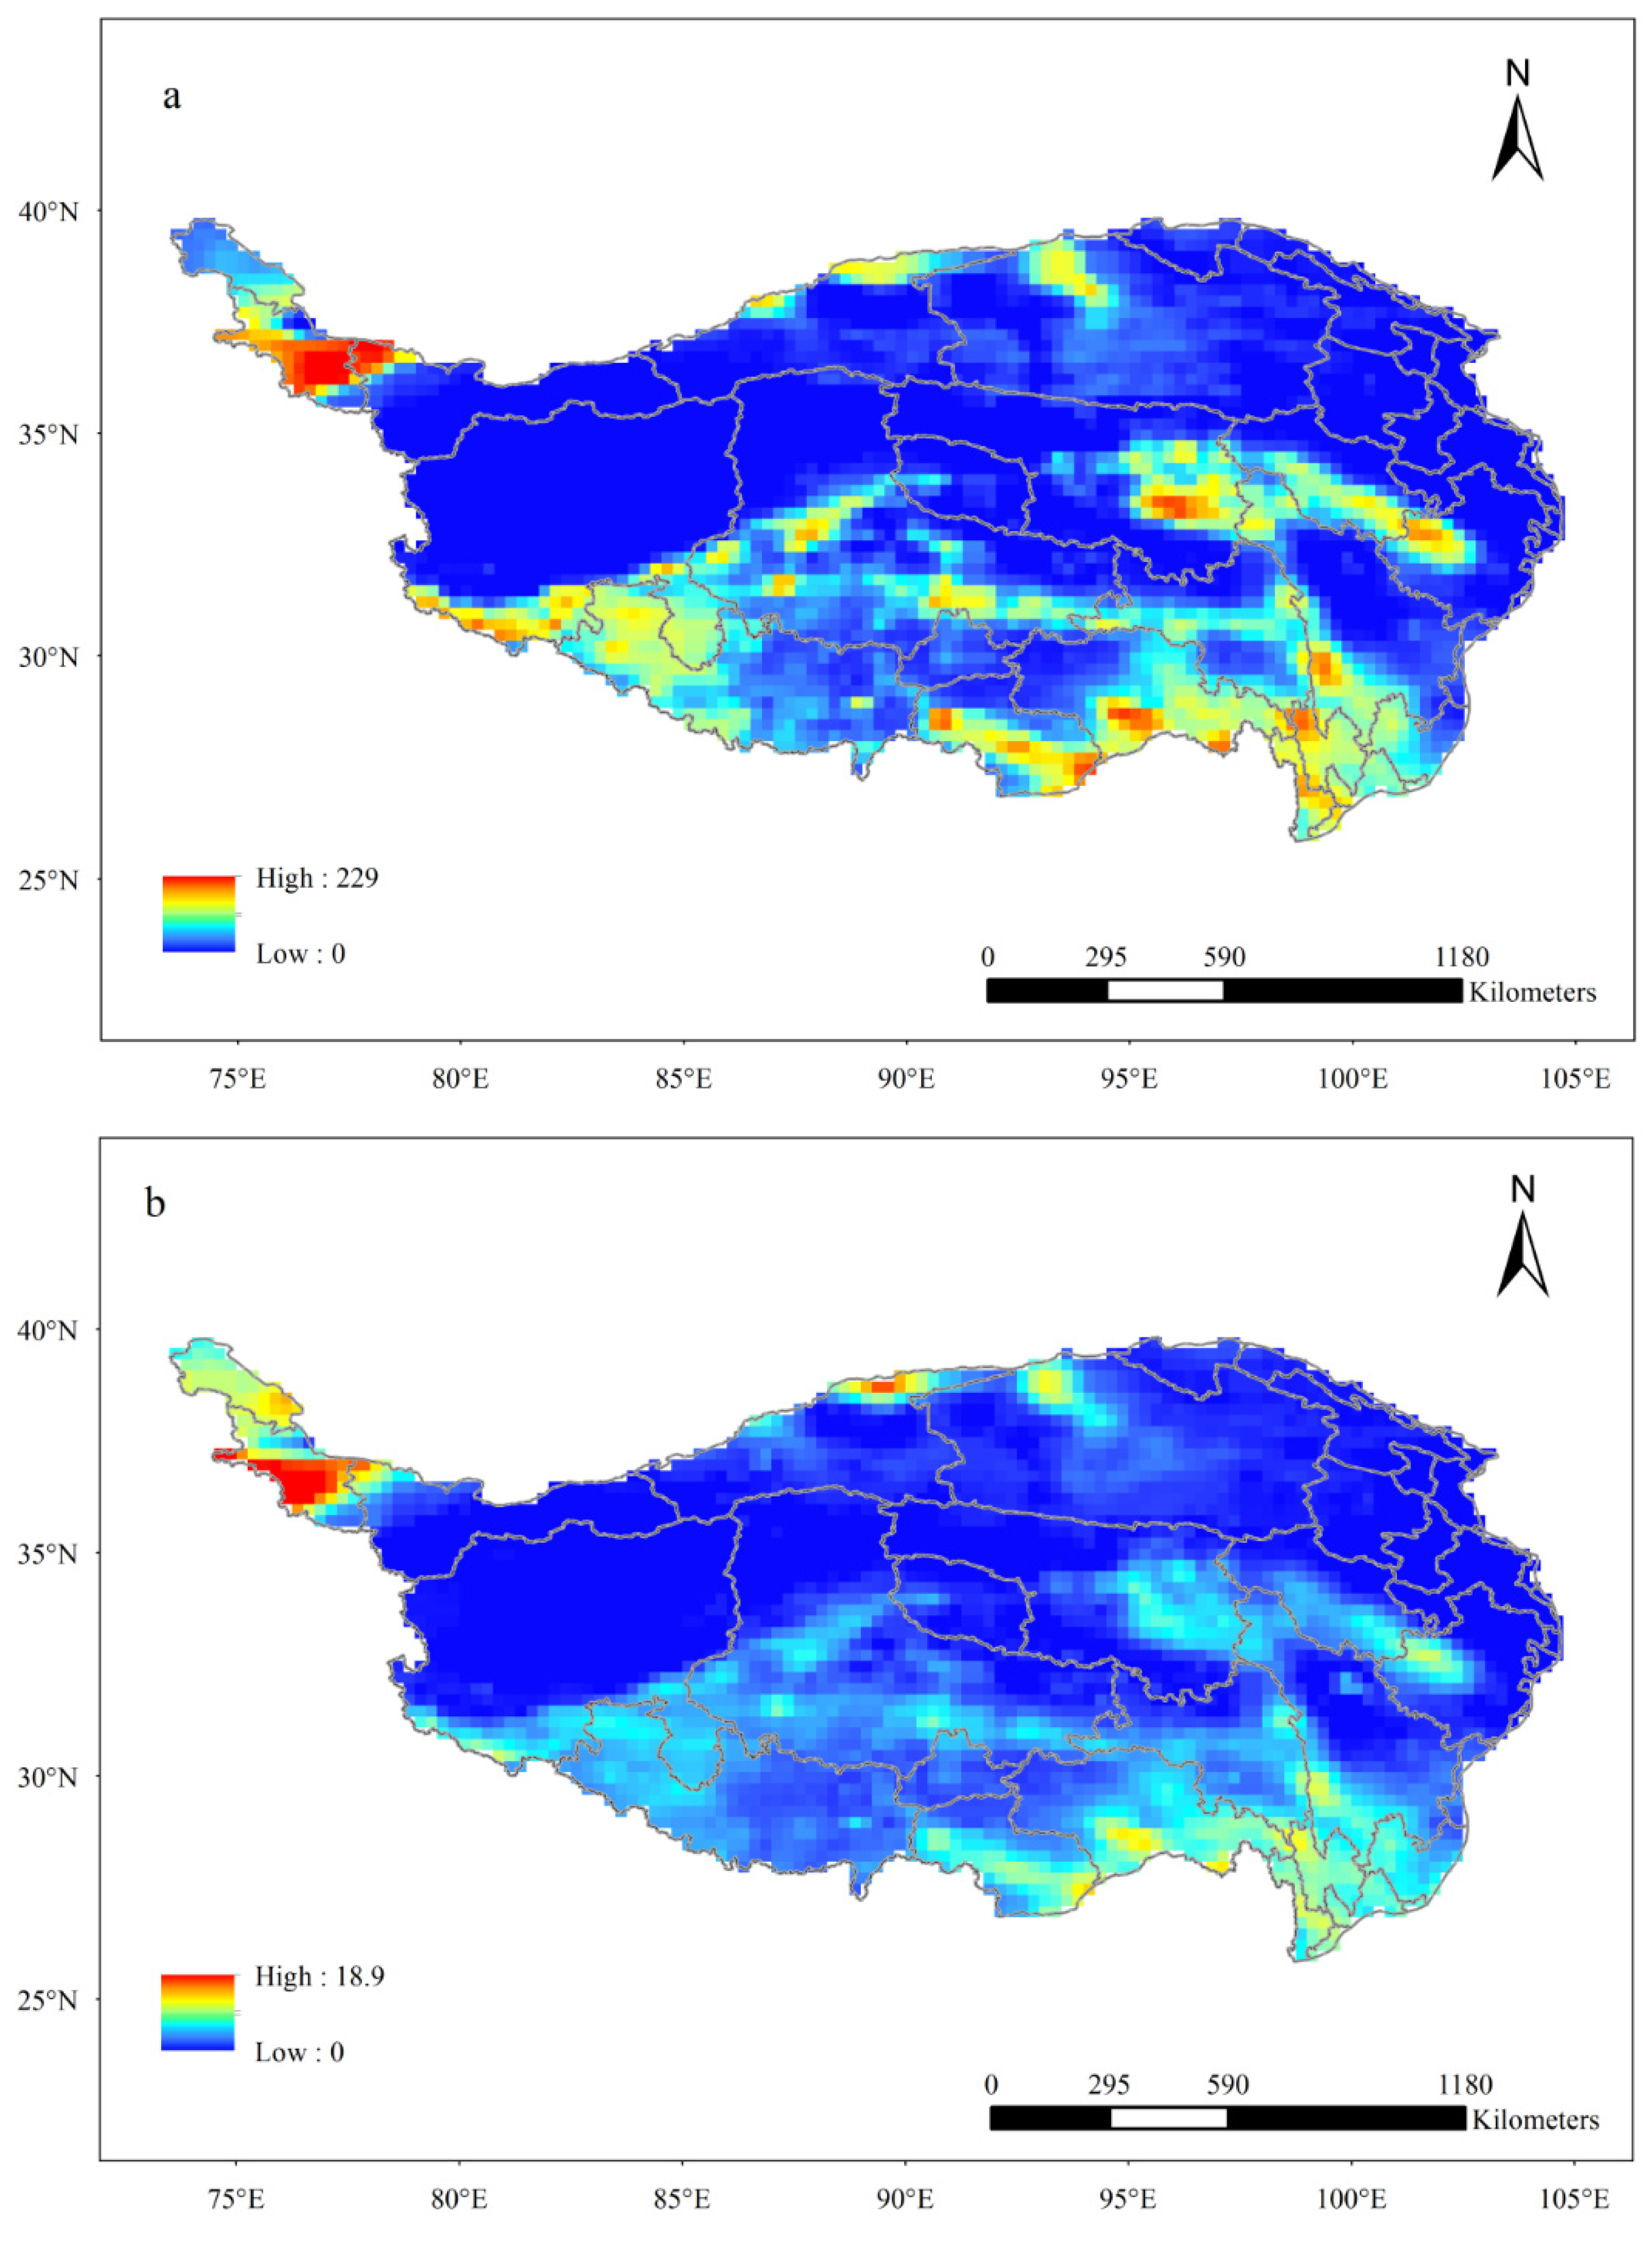
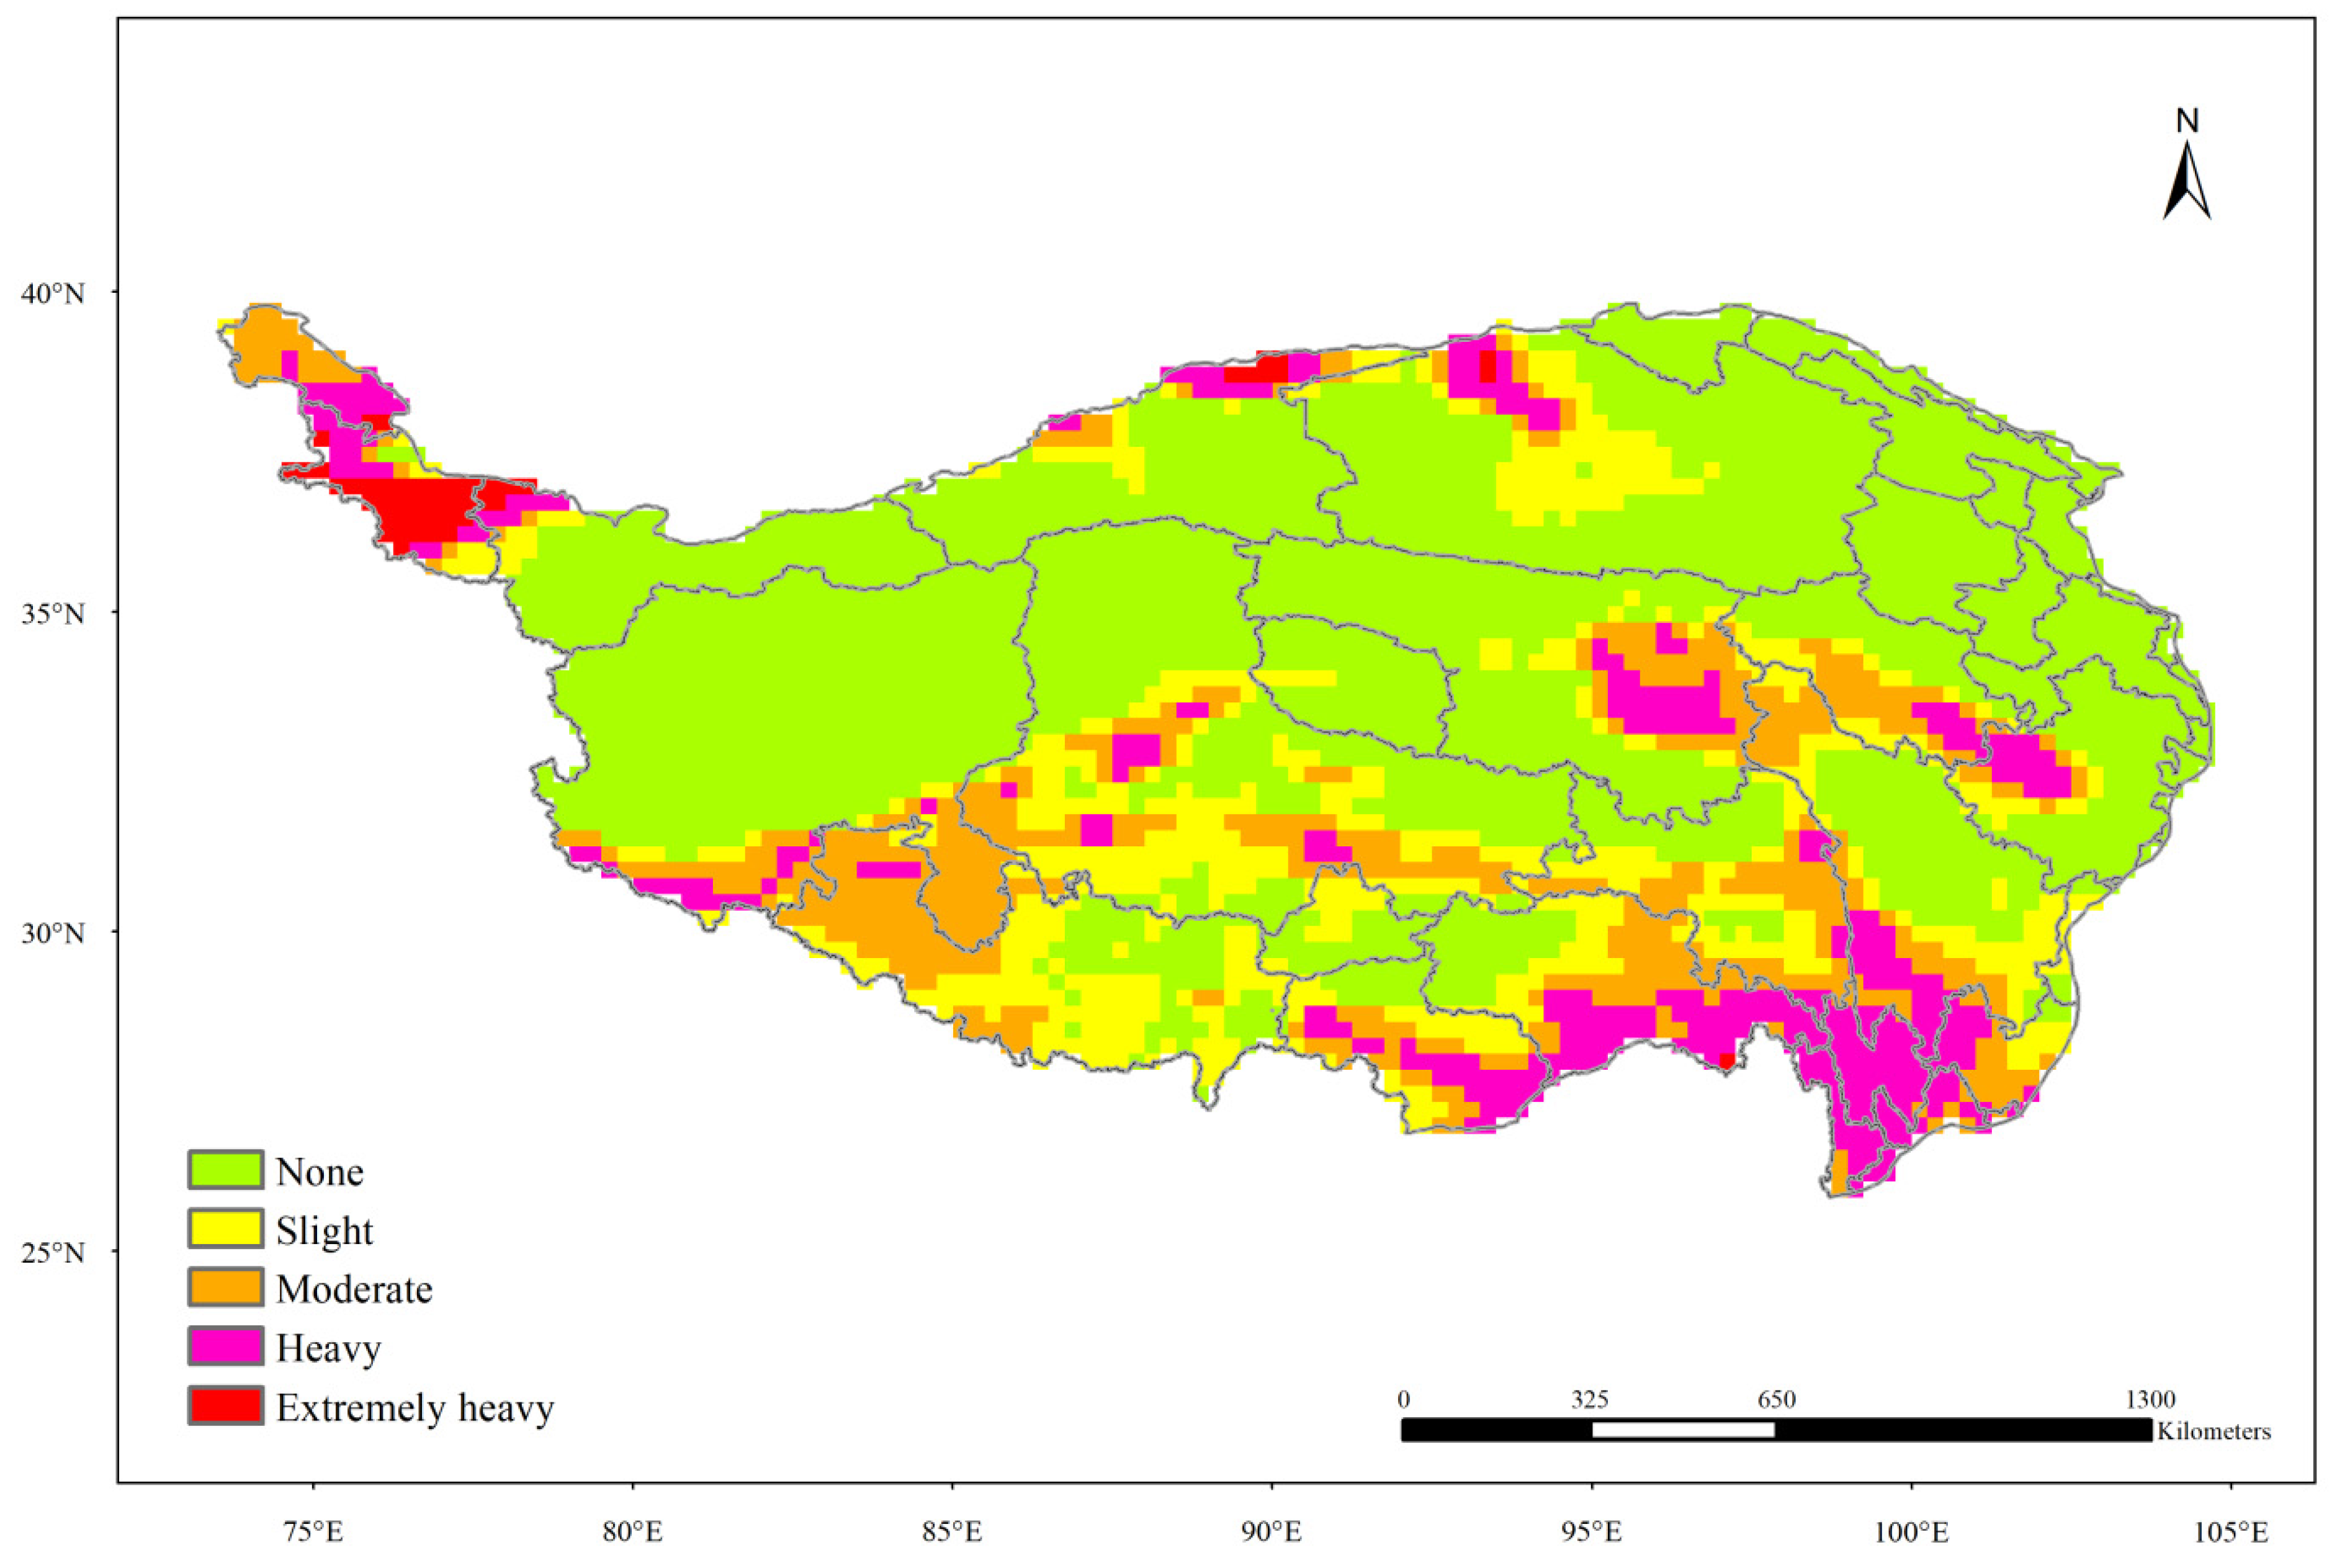
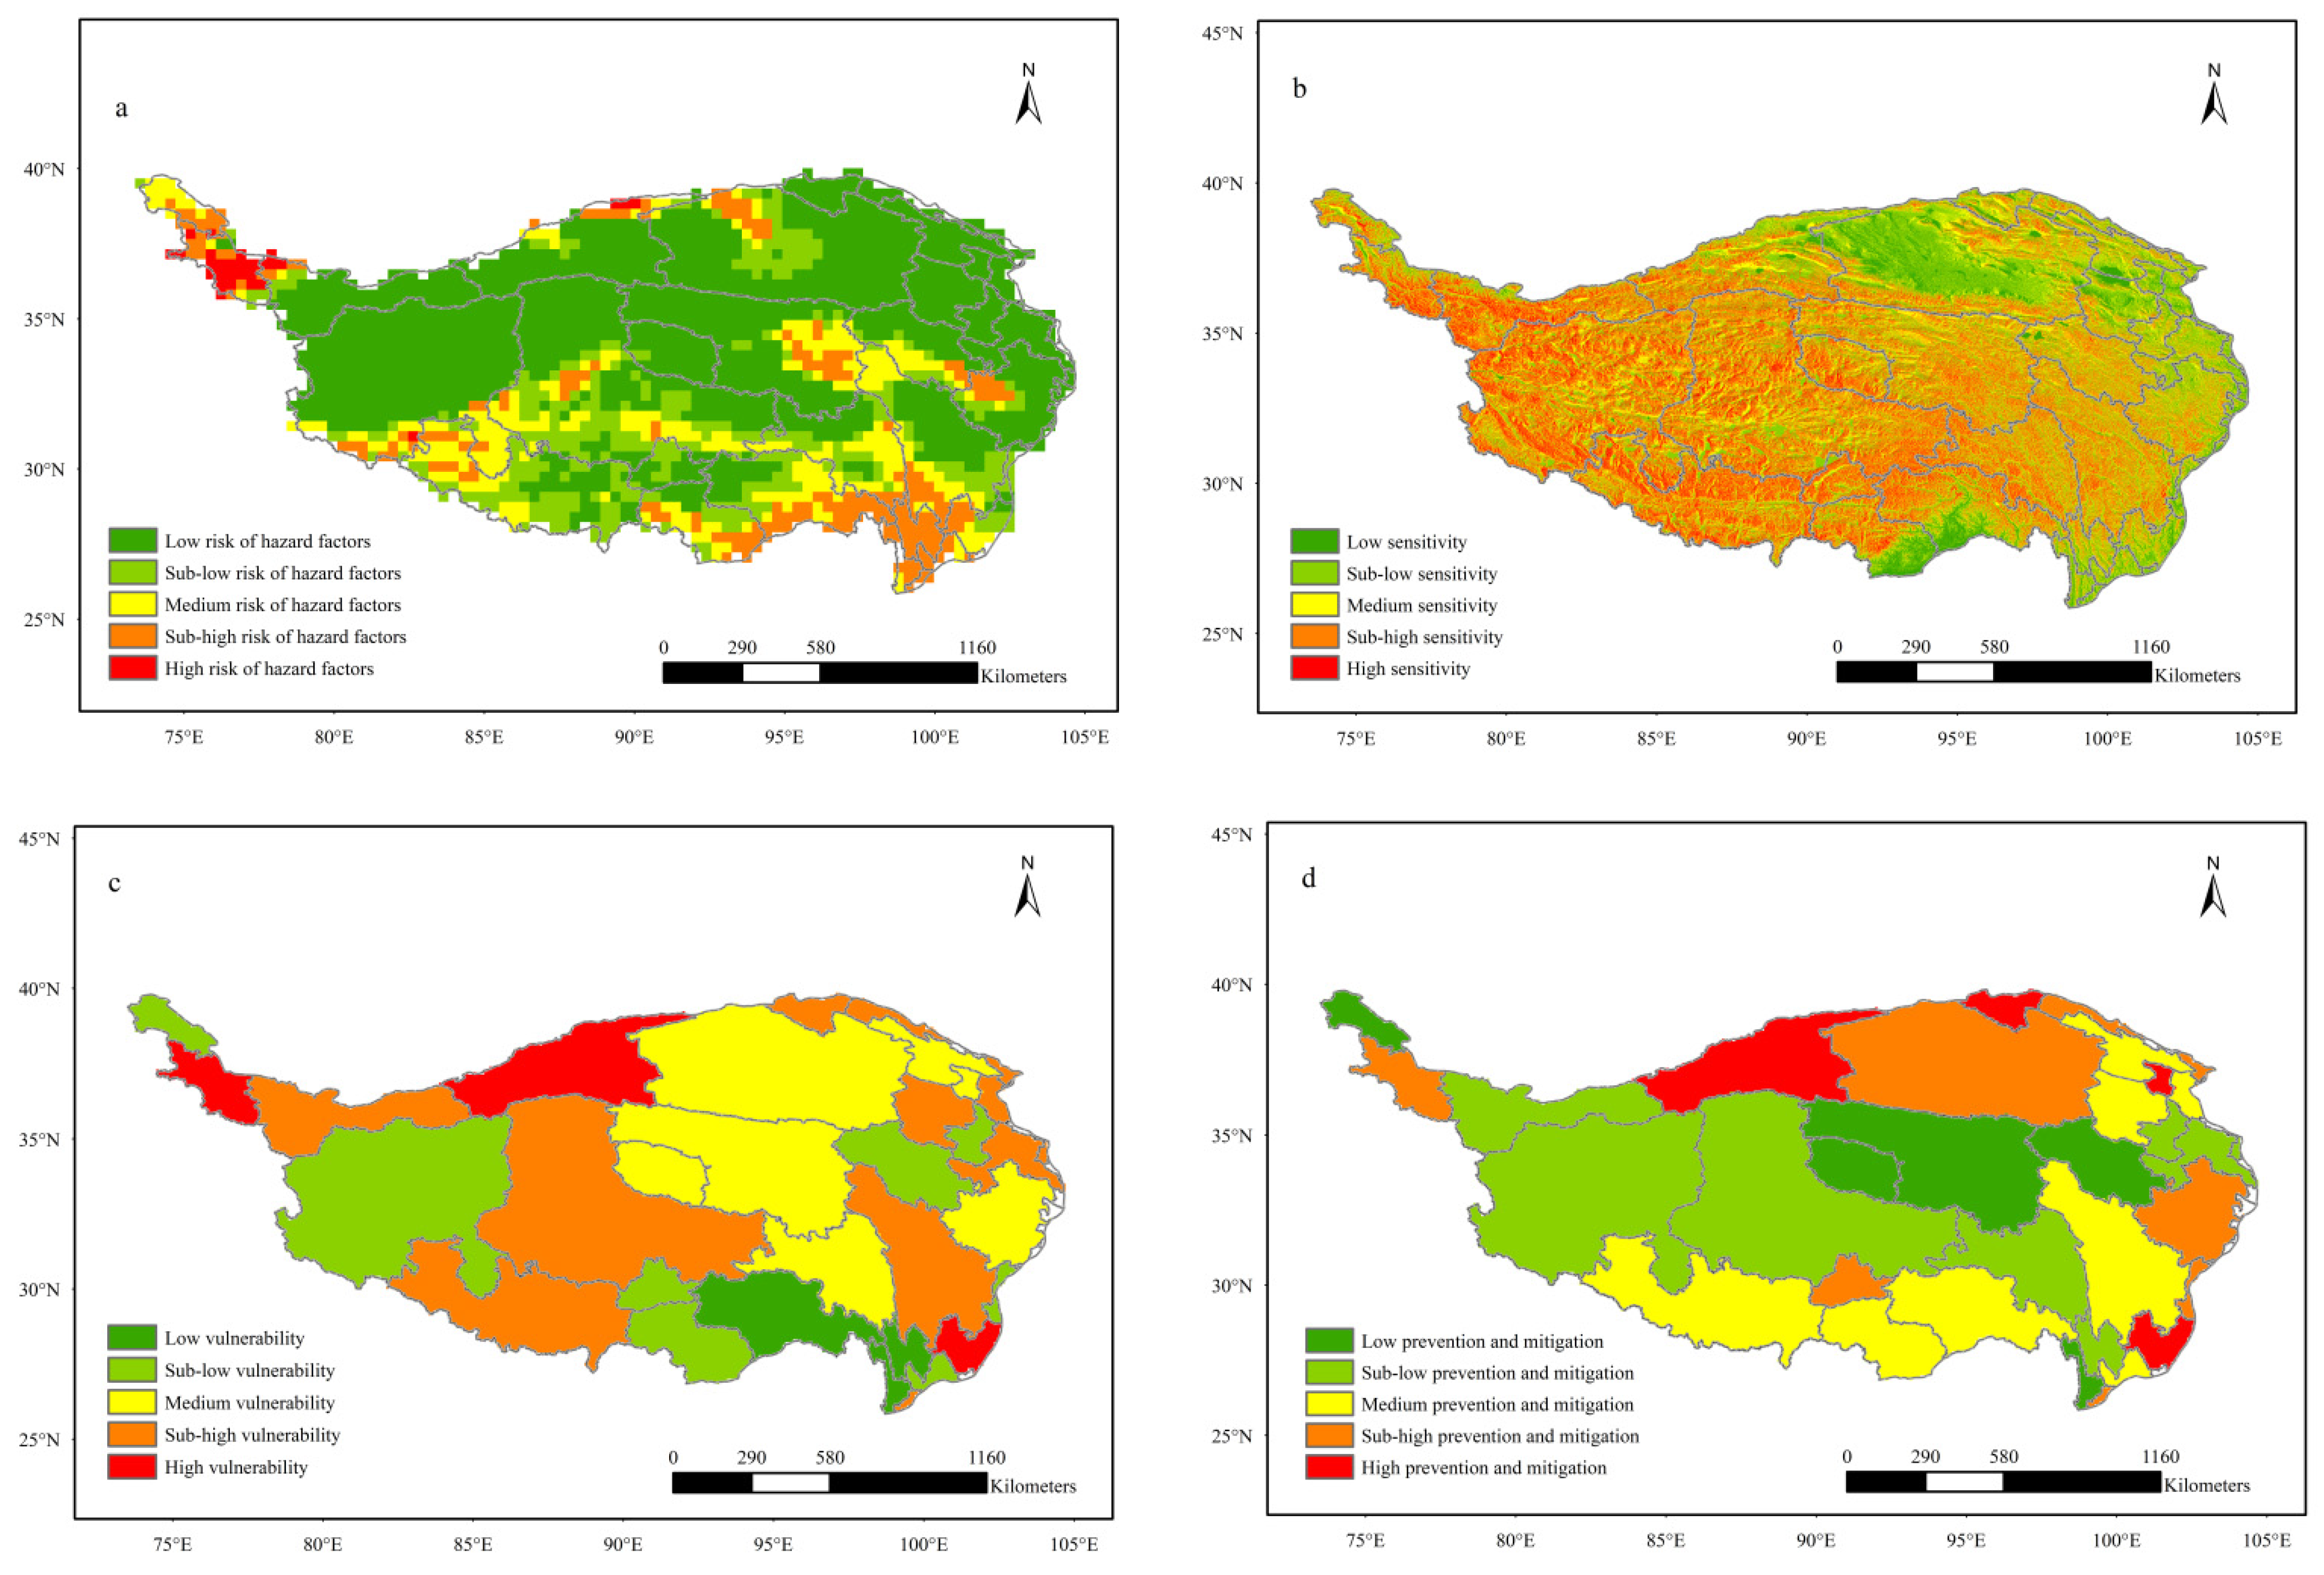
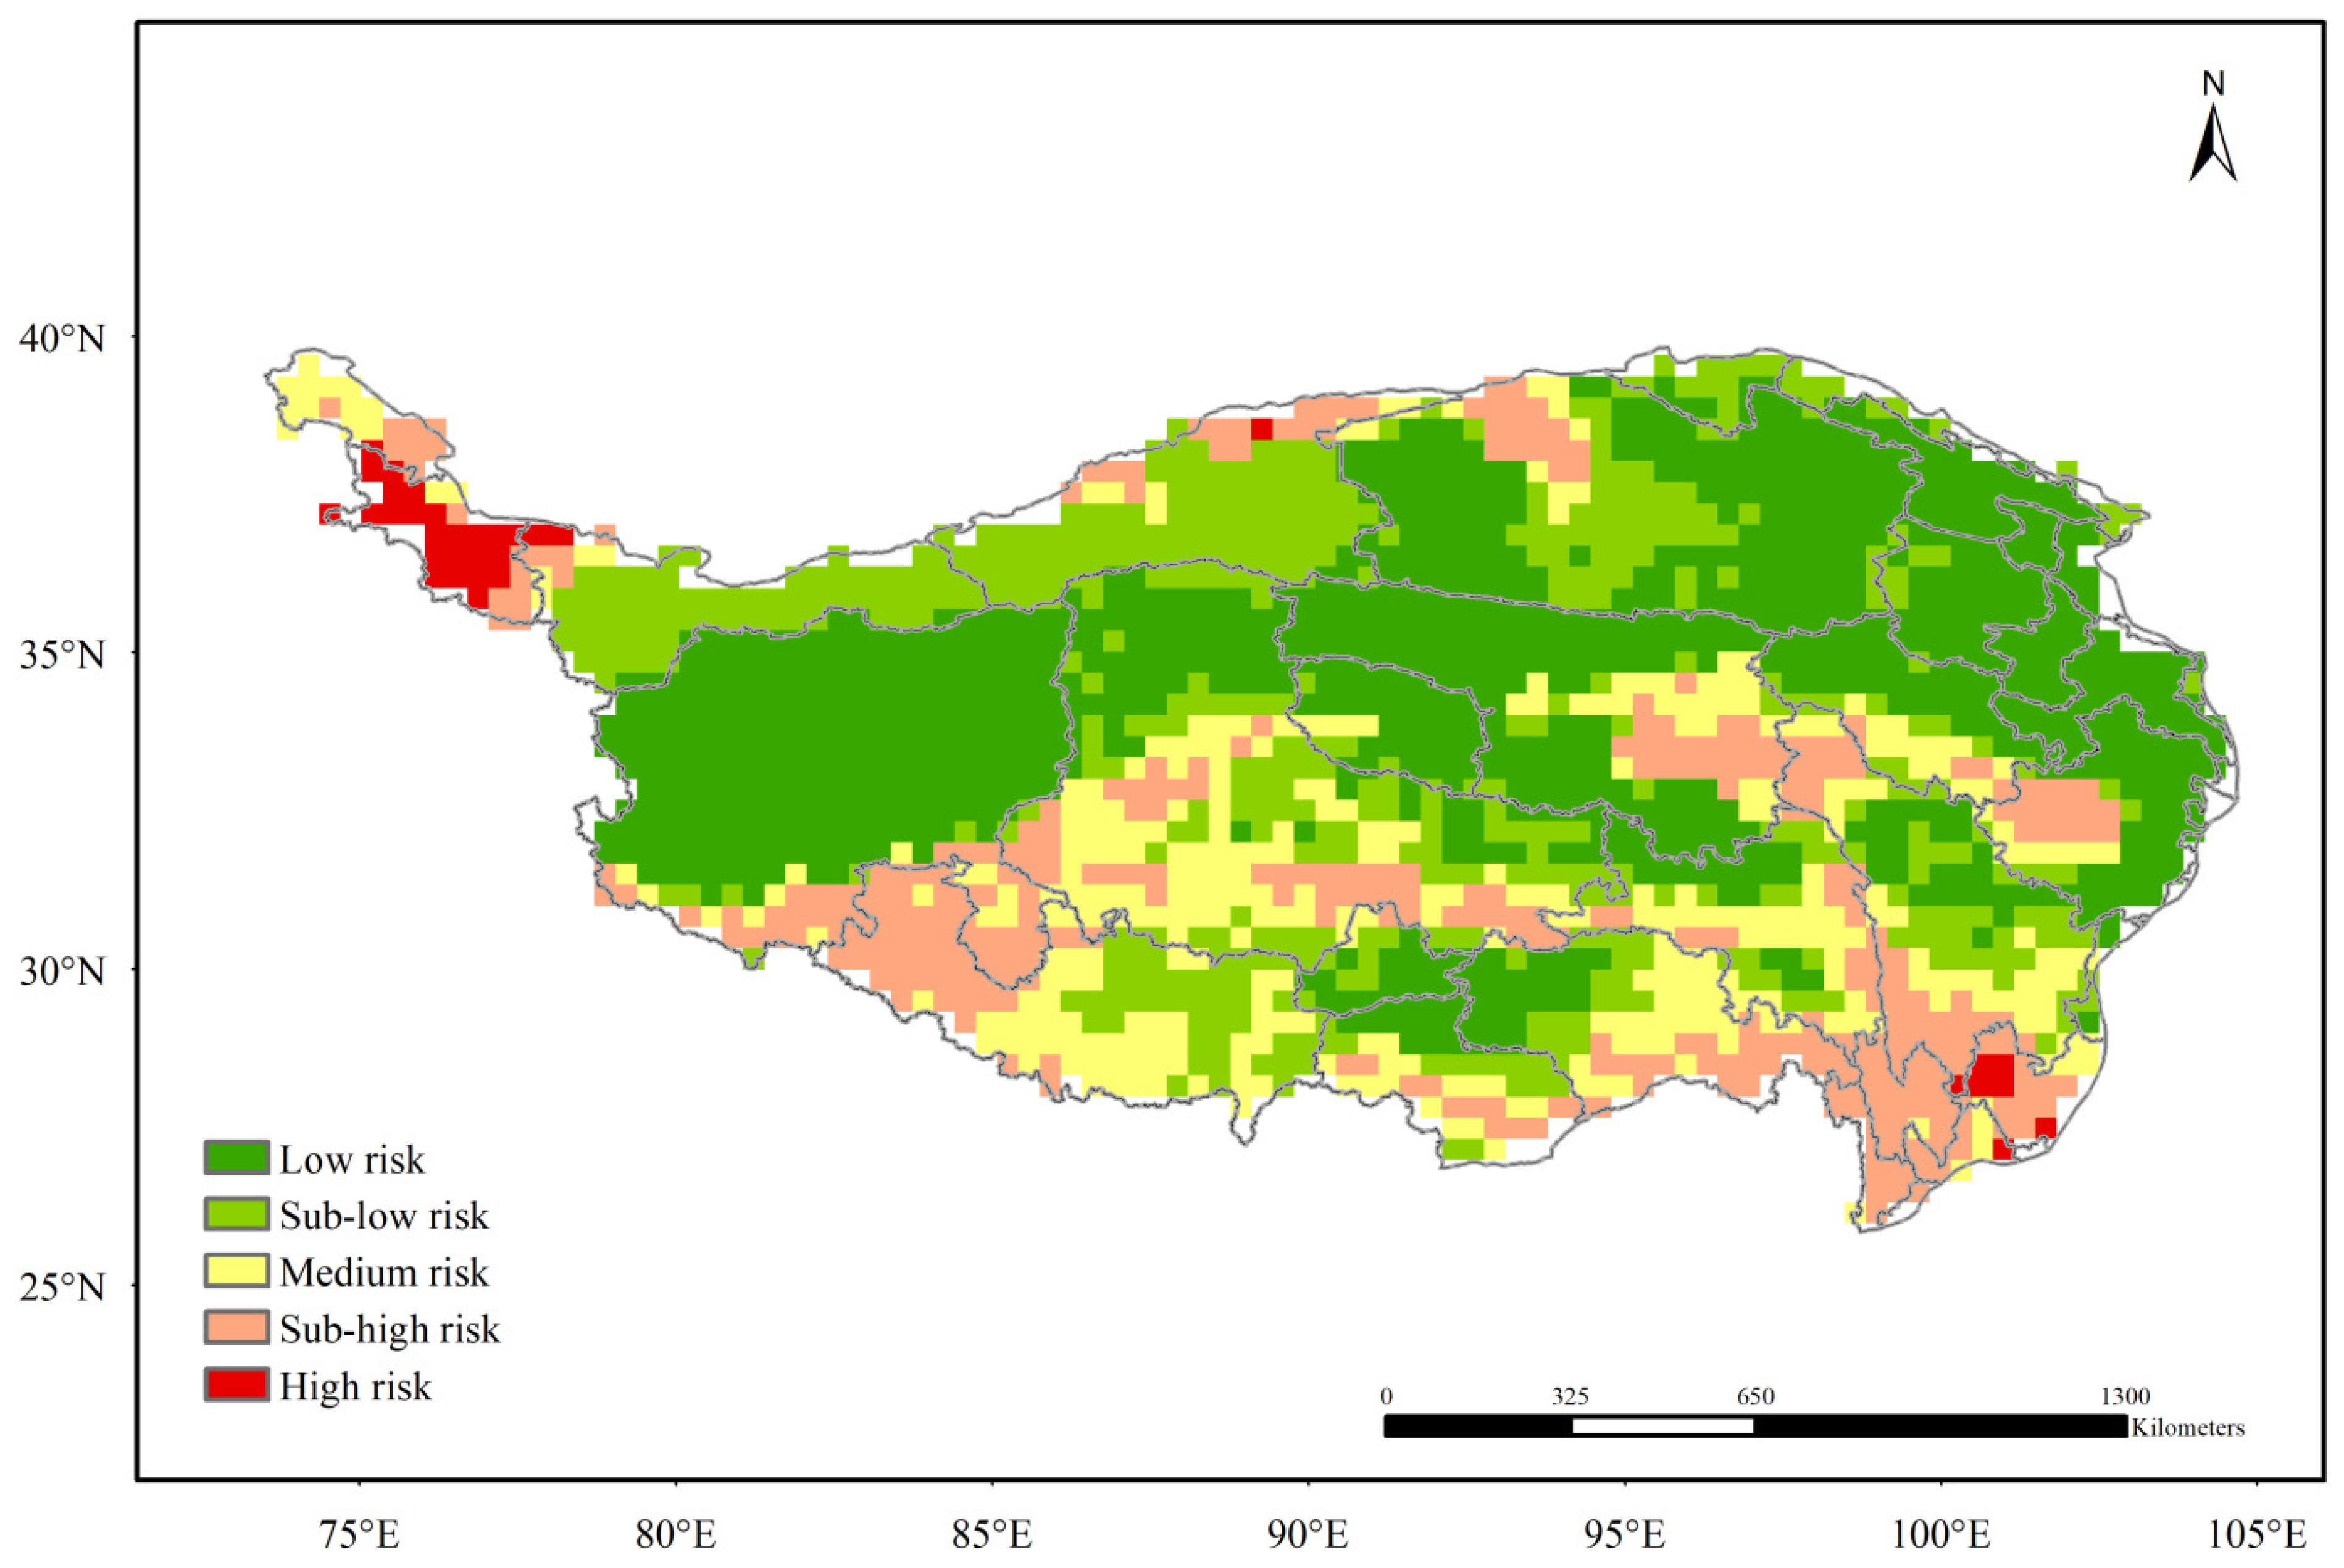
3.2. Risk Assessment of Snow Disasters for Husbandry

The risk of snow disasters for animal husbandry on the QTP was assessed from four perspectives: hazard factors, hazard-inducing environments, hazard-affected bodies, and disaster prevention and mitigation capacity. Four hazard factors were selected in the research, including the duration, snow depth, frequency, and grade of snow disaster (spatio-temporal variation characteristics of each factor are provided above). By using the weighted comprehensive evaluation method, the risk of hazard factors of snow disasters for animal husbandry on the QTP was zoned. This mainly reflects the intensity and probability of hazard factors that cause snow disasters to affect animal husbandry and is the leading precondition for snow disasters. The larger the risk of hazard factors, the greater the intensity thereof and the higher the probability of ensuing damage. Figure 8a shows the spatial distribution of the risk of hazard factors of snow disasters for animal husbandry on the QTP; the risk of hazard factors is low in the north while high in the south on the whole, having multiple high-value centers. The high-risk zone of snow disasters is mainly concentrated in Kashgar in the north-western end of the QTP, which is characterized by a long duration of snow, large snow depth, and high grade of snow disaster. The sub-high-value zone is mainly concentrated in the south-east of the QTP, including southern Lhoka and Nyingchi, Nujiang Lisu Autonomous Prefecture in Yunnan Province (Nujiang), Diqing, and southern Garzê Tibetan Autonomous Prefecture in Sichuan Province (Garzê). Snow disasters in the zone are mainly characterized by a high grade and a high frequency of extremely heavy snow disasters.
In terms of the hazard-inducing environment, three factors, including the altitude, slope, and slope aspect, were mainly considered. Research showed that, under same or similar conditions, the combination of snow and landform may further aggravate the influences of snow disasters and cause certain secondary disasters. Therein, small topographic factors, such as the altitude, slope, and slope aspect, exert more significant influences. Therefore, the three factors, i.e., altitude, slope, and slope aspect, were selected to analyze the sensitivity of the hazard-inducing environment of snow disasters for animal husbandry on the QTP (Figure 8b). The QTP lies at a high altitude, on the whole, and features steep mountains, so the hazard-inducing environment of snow disasters for animal husbandry is of high sensitivity, and areas of low sensitivity are mainly located in the north-east and the south-eastern margin.
The degree of damage caused by snow disasters is, in fact, closely related to the body affected by snow disasters. The loss caused by snow disasters is not only dependent on the intensity, duration, and frequency of the disasters, but also is greatly affected by the hazard-affected bodies. Generally, the higher the vulnerability of hazard-affected bodies, the more easily these bodies are affected and the greater the loss (and vice versa). The present research mainly focused on snow disasters and their effects on animal husbandry, so crop-sown area and livestock inventories were selected as indices representing the vulnerability of hazard-affected bodies. Zones with a large crop-sown area are mainly located in the northern and eastern QTP, in which Kashgar has the largest crop-sown area, followed by the Bayingolin Mongol Autonomous Prefecture in the Xinjiang Uygur Autonomous Region (Bayingolin). Two zones have large livestock inventories: one is Kashgar–Hotan–Bayingolin–Nagqu–Shigatse in the west of the QTP, and the other is Garzê–Aba in the east of the plateau. By combining these two indices, the zoning of the vulnerability of hazard-affected bodies in snow disasters for the husbandry on the QTP can be obtained (Figure 8c). Areas of high vulnerability of hazard-affected bodies are mainly distributed in Kashgar–Hotan–Bayingolin–Nagqu–Shigatse in the west of the plateau and Garzê, Hainan Tibetan Autonomous Prefecture in Qinghai Province (Hainan), and Gannan in the east.
The disaster prevention and mitigation capacities refer to both disaster resistance and post-disaster resilience, which are mainly represented by the local level of economic development and the economic capability of farmers and pastoralists. In this research, the (municipal/prefecture) GDP and the per capita net income of farmers and pastoralists were selected as indices to reflect the local disaster prevention and mitigation capacity, thus, finally obtaining a zoning map of the capacity (Figure 8d). As shown in the figure, areas with high disaster prevention and mitigation capacity include Xining, Bayingolin, Liangshan Yi Autonomous Prefecture in Sichuan Province (Liangshan), Aba, Kashgar, and Haixi.
The comprehensive risk index of snow disasters for husbandry on the QTP was calculated using Equation (2) for comprehensive risk assessment according to the weights of the four factors (the hazard factors, hazard-inducing environments, hazard-affected bodies, and disaster prevention and mitigation capacity) (Table 3). The comprehensive risk was graded using the natural breaks method, finally attaining the zoning map for the comprehensive risk of snow disasters for animal husbandry on the QTP (Figure 9). The risk of snow disasters can be divided into five grades: high-risk, sub-high-risk, medium-risk, low-risk, and sub-low-risk zones. The high-risk zone accounts for about 1.54% of the total area of the QTP, mainly located in Kashgar at the north-western end of the plateau; the sub-high-risk and medium-risk zones are mainly found in the south of the plateau and are distributed in a tripole pattern, separately accounting for 15.96% and 16.32% of the plateau. The three “poles” are located along the Lhoka–Nyingchi–Nujiang–Diqing–southern Garzê line in the south-east, western Shigatse in the south, and Yushu in the hinterland of the QTP. The northern QTP is mainly dominated by low-risk and sub-low-risk zones, which separately cover 43.06% and 23.12% of the plateau.

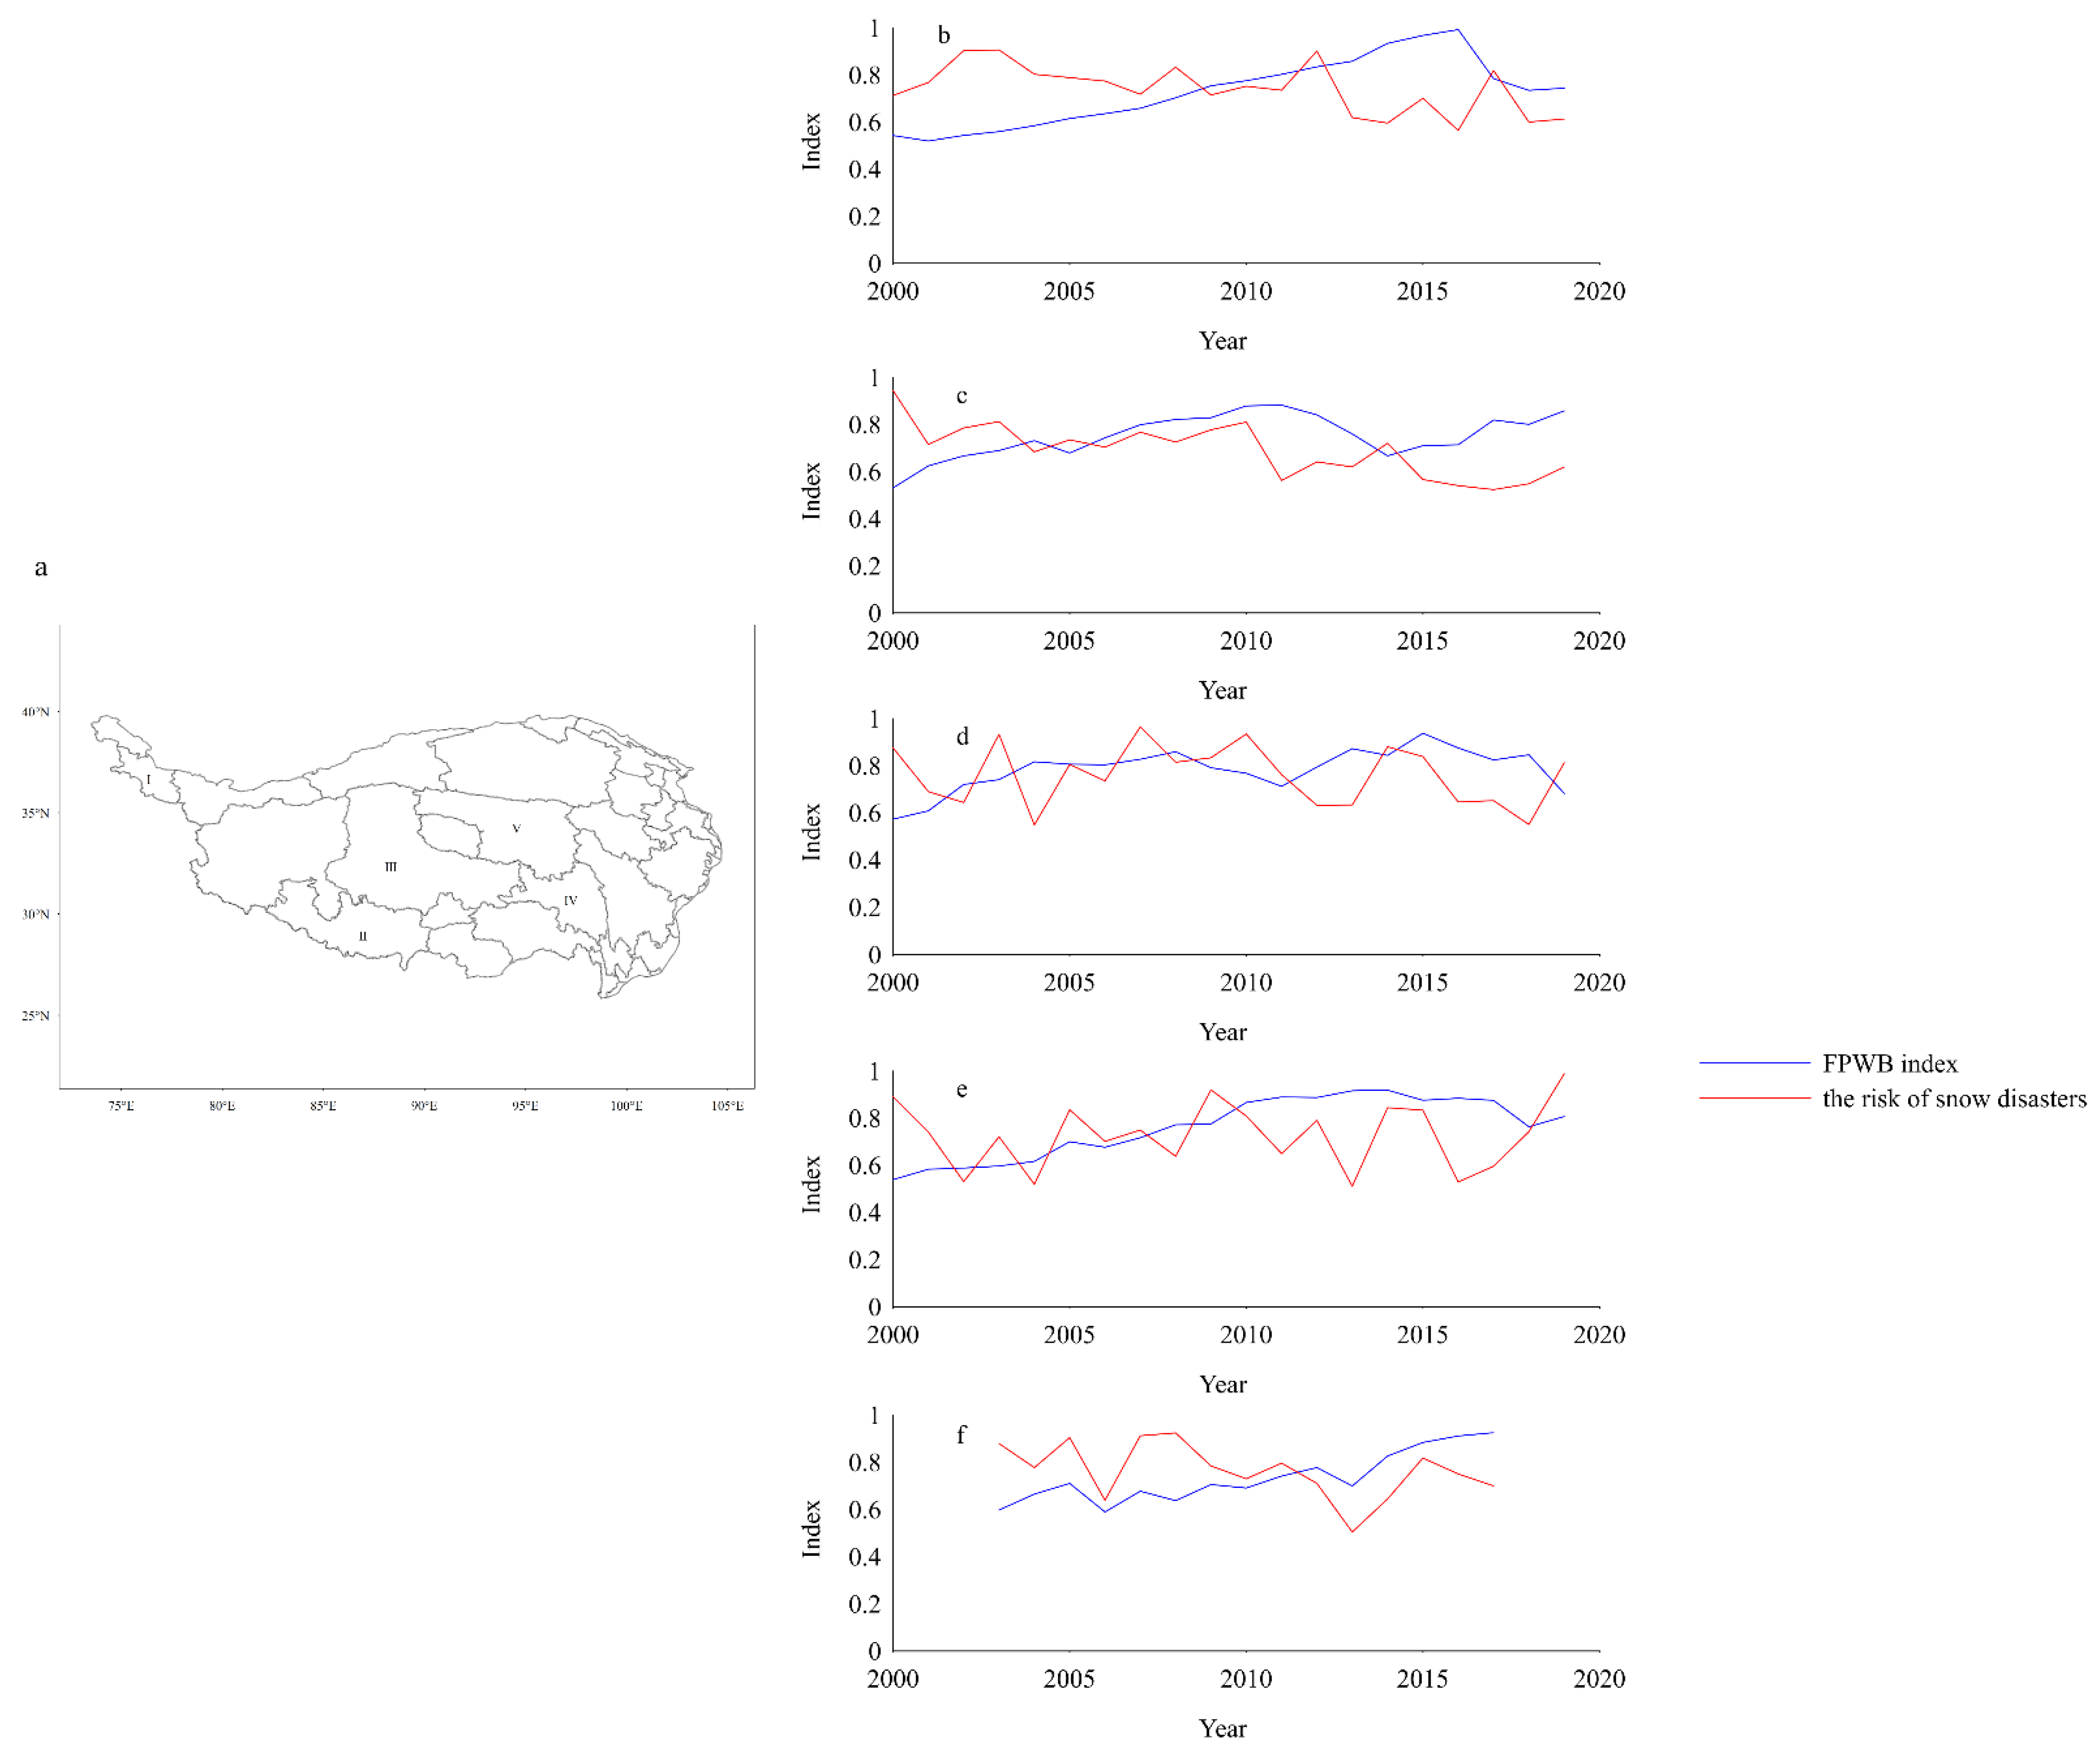
3.3. Possible Influences of Snow Disasters on FPWB

To further explore the possible influences of major natural disasters, represented by snow disasters on FPWB, several typical regions (Figure 10) were selected for discussion based on the aforementioned analysis of the spatial-temporal variations of snow disasters in the QTP and zoning of the comprehensive risk of snow disasters for animal husbandry. These regions were Kashgar (I), Shigatse (II), Nagqu (III), Qamdo (IV), and Yushu (V). Among these regions, Kashgar represents the high-risk zone and is characterized by the high risk of hazard factors and high vulnerability of hazard-affected bodies while also having favorable disaster prevention and mitigation capacity. Shigatse mainly contains sub-high-risk and medium-risk zones, characterized by the moderate risk of hazard factors and moderate disaster prevention and mitigation capacity, while showing high sensitivity in its hazard-inducing environments and high vulnerability of hazard-affected bodies. Nagqu and Qamdo, sharing the similar comprehensive risk of snow disasters for animal husbandry and the risk of hazard factors, both belong to the medium-risk zone with above moderate vulnerability of hazard-affected bodies and poor disaster prevention and mitigation capacity. Western Yushu is a vast, depopulated zone, while the more heavily populated eastern Yushu region shows a sub-high comprehensive risk of snow disasters and a sub-high risk of hazard factors, moderate vulnerability of hazard-affected bodies, and poor disaster prevention and mitigation capacity.
According to the method of calculation of the FPWB index, variations in the FPWB index in various typical regions from 2000 to 2019 were calculated (the period from 2003 to 2017 was used for Yushu due to problems encountered in data acquisition). Meanwhile, the risk of hazard factors was used as the comprehensive assessment model for the severity of snow disasters. Variations in the risk of snow disasters of these typical regions in the same period were calculated, and the FPWB indices and variations of the risk of snow disasters are illustrated in Figure 10. From the long-term variation, the FPWB in these typical regions showed a significant ascending trend, which passed the significance test at the 0.01 level. The result indicates that the FPWB on the QTP has improved significantly since the 21st century, and the average growth rate of FPWB in the five typical regions is 3.6%, 1.9%, 2.8%, 1.3%, and 2.3%, respectively. The risk of snow disasters in regions I, II, and V exhibited a significant decreasing trend, while that in regions III and IV did not show significant variation. By using least-squares regression, the contribution of variations in the risk of snow disasters to the FPWB from 2000 to 2019 was quantitatively estimated (Table 5). The results suggest that the risk of snow disasters had an adverse effect on variations of the FPWB. Every 1% increase in the risk of snow disasters in several typical regions corresponded to 0.186%, 0.768%, 0.378%, 0.109%, and 0.03% decreases in the FPWB index. Snow disasters affect the FPWB mainly by directly or indirectly impairing material resources (livestock inventories and meat production) and social and financial resources. Similar results were found in the research by Qiu et al. [22]. Because animal husbandry on the QTP is relatively unsophisticated and mainly depends on individual management of farmers and pastoralists, the area is far from realizing mechanization, intensification, and modernization of its agricultural practices; it is heavily dependent on prevailing meteorological conditions. Natural disasters, represented by snow disasters, directly affect the livelihood of local farmers and pastoralists and exert adverse impacts on the FPWB. Once a snow disaster occurs, it is generally accompanied by low-temperature weather, and the snow cannot be removed for a long time. This, on the one hand, directly affects livestock and poultry (often killing and injuring many animals and birds); on the other hand, a snow disaster also causes insufficient supply of forage grass, which affects later feeding and management and even causes death of livestock and poultry. At the same time, winter and spring are seasons with a high incidence of animal disease epidemics. Once a snow disaster occurs, the insufficient supply of forage grass may also lead to undernutrition and decreased immunity of livestock and poultry, rendering them more susceptible to infection, thus, influencing livestock inventories and meat production. In addition, in the process of snow disasters, the huge and rapid snowfall frequently causes collapse of livestock housing and breeding sheds, inducing deaths and injuries of livestock, bringing an economic loss to farmers and pastoralists and even causing causalities among farmers. Apart from the direct influences affecting development of animal husbandry, snow disasters also directly affect the life and production activities of residents, even causing major economic losses. For example, snow and ice heavily damage electric power facilities and transportation, hindering daily transportation of animal husbandry products, affecting the whole supply chain.

4. Discussion

Snow disasters are one of the most important meteorological hazards on the QTP, and their spatial and temporal characteristics and influencing factors have received more and more attention in recent years; however, some findings are constrained by the plateau’s poor distribution of meteorological stations. In this paper, we used remote sensing data to analyze the spatial and temporal occurrence patterns of snow disasters on the QTP. Results demonstrated that, during the past 40 years, the frequency, duration, average snow depth, and grade of snow disaster on the QTP have all exhibited significant interannual and interdecadal variabilities, as well as a declining long-term trend, which is consistent with some previous studies [4,11,12,19]. In addition to the direct influence of local climatic conditions [12], many circulation factors also modulate the occurrence of snow disasters on the QTP through westerly winds and atmospheric bridges. These factors all contribute to the variability of snow disasters on interannual to interdecadal time scales. Huang et al. [36] suggested that snow disasters were more likely to occur when the west wind belt and the polar vortex in the eastern hemisphere are stronger and the East Asian trough and subtropical high are more westerly, and vice versa. SST, as an important external forcing factor, also profoundly affects the occurrence of snow disasters, and the equatorial central-east Pacific, the tropical Indian Ocean, and the North Atlantic are some of the more critically affected areas [14,37,38,39]. In addition, the positive North Atlantic Oscillation (NAO) can excite Rossby waves, which can strengthen the Indo–Myanmar trough on the southern side of the plateau and promote snowfall on the QTP, leading to more snow disasters [40,41]. Furthermore, Arctic sea ice, as an important external forcing factor affecting extreme weather and climate events at medium latitudes [42], also has an important modulating effect on the occurrence of snow disasters on the Tibetan plateau. A positive anomaly of Arctic sea ice can enhance the meridional temperature gradient, which excites upward-propagating and equatorward-propagating anomalous Rossby waves, leading to an anomalous dipole pattern of atmospheric circulation over the polar regions and Eurasia, enhancing the zonal advection and meridional convergence of atmospheric moisture fluxes over the plateau and favoring snow disasters [43,44]. Other circulation factors, such as El Niño (ENSO) and the Arctic Oscillation (AO), can also influence the occurrence of snow disasters through cyclonic circulation propagating along the westerly wind belt [14,37,45,46]. We also discussed the possible influences of snow disasters on the farmer and pastoralist well-being (FPWB) since the 21st century. Since World War II, with the ensuing economic development, academics, decision-makers, and practitioners around the world have paid close attention to human well-being, and gross domestic product (GDP) was once the dominant measure of human well-being [47,48]. However, since GDP is mainly a reflection of economic indicators, it is hoped that other factors, such as social, humanistic, and ecological factors, can be absorbed into the human well-being evaluation system. The Millennium Ecosystem Assessment [49] provides a useful framework for the study of ecosystem services as an influencing factor on human well-being, making explicit the close relationship between ecosystem services and human well-being and ushering in a new era of human well-being research. Within this framework, a large number of studies revealed the characteristics of changes in human well-being in different regions and at different time scales, as well as their main drivers [50,51,52,53]. However, current research on human well-being tends to be a holistic concept, and there is no uniform definition of the meaning of well-being for different groups of people. Farmers and pastoralists are the majority of the inhabitants of the QTP, and it is of great practical importance to discuss their well-being to improve the well-being of the plateau people. Generally, farmers’ happiness increases with job satisfaction and income, while land as an important means of production for farmers is closely related to farmers’ income [54], and the stronger the farmers’ willingness to retire from farming, the worse their happiness is [55]; moreover, farmers’ self-rated health status has a positive impact on their well-being [56]. Here, the FPWB index on the QTP was established by combining the sources of income, living styles, and economic factors, and exploring the impact of snow disasters on the well-being of farmers and pastoralists. The results (Figure 10 and Table 5) show that snow disasters have a certain negative impact on the FPWB, but we only discussed the impact of a single meteorological disaster, and it is necessary to systematically explore the systematic impact of other meteorological disasters on the FPWB in the future. Meanwhile, it should be noted that the improvement of FPWB on the QTP has been stagnant or even declining in recent years. This may be related to the increase of extreme weather and climate events caused by climate change which affect the living environment, life, and property of farmers and pastoralists. On the other hand, the advancement of urbanization on the QTP may attract a large number of young people to work and live in cities, which indirectly leads to the decline of human resources, production level, and production capacity in agriculture and livestock, thus, affecting the overall situation of farmer and pastoralist well-being.

5. Conclusions

The spatio-temporal variation characteristics of snow disasters on the QTP over the past 40 years were investigated based on the daily snow depth data set in China obtained by the inversion of the satellite remote sensing data provided by the national TPDC. The results show that the frequency, duration, average snow depth, and grade of snow disaster had similar spatial distributions, being low in the north while high in the south. The high-value center in the north is mainly located in Kashgar–Kizilsu Kirgiz at the north-western end of the QTP, which is the zone with the most numerous heavy snow disasters and the highest frequency of snow disaster on the plateau. The high-value center in the south has a tripole distribution pattern, and the three “poles” are located in Lhoka–Nyingchi–Nujiang–Diqing–southern Garzê in the south-east, western Shigatse in the south, and Yushu in the hinterland of the plateau. It can be seen from the interannual and interdecadal variations in the frequency, duration, average snow depth, and grade of snow disaster on the QTP over the past 40 years that various indices all have obvious interannual and interdecadal variabilities. Meanwhile, the long-term variations of various indices also showed a decreasing trend despite certain spatio-temporal differences. On this basis, geographic information system (GIS) technology was used to zone the comprehensive risk of snow disasters on the QTP. The results indicated that the high-risk zone accounts for 1.54% of the plateau, mainly in Kashgar at the north-western end of the plateau. The sub-high-risk and medium-risk zones are located in the south of the plateau and are distributed in a tripole pattern, separately covering 15.96% and 16.32% of the QTP. The north of the QTP is dominated by low-risk and sub-low-risk zones, which separately account for 43.06% and 23.12% of the plateau. Finally, five typical regions, Kashgar (I), Shigatse (II), Nagqu (III), Qamdo (IV), and Yushu (V), were selected to discuss the possible influences of snow disasters on FPWB since the 21st century. The results implied that every 1% increase in the risk of snow disasters corresponded to 0.186%, 0.768%, 0.378%, 0.109%, and 0.03% decreases in the FPWB. Snow disasters affect the FPWB mainly by directly and indirectly damaging material resources (livestock inventories and meat production) and social and financial resources.

Author Contributions

Conceptualization, J.L., Y.Z. (Yufang Zhang) and X.D.; Structure and methodology, J.L., Y.Z. (Yujia Zou) and Y.Z. (Yufang Zhang); Data and software, J.L. and S.S.; Formal analysis and original writing, J.L. and S.S.; Funding acquisition, Y.Z. (Yufang Zhang). All authors have read and agreed to the published version of the manuscript.

Funding

This research was funded by the Second Tibetan Plateau Scientific Expedition and Research (STEP) program (no. 2019QZKK0608 and 2019QZKK0103).

Data Availability Statement

The snow depth long time-series data set in China (1979–2019) was provided by National Tibetan Plateau Data Center (http://data.tpdc.ac.cn, accessed on 21 June 2020). The other data generated for this study are available on request to the corresponding authors.

Acknowledgments

We also want to appreciate the support from China Scholarship Council.

Conflicts of Interest

The authors declare that the research was conducted in the absence of any commercial or financial relationships that could be construed as a potential conflict of interest.

References

  1. IPCC. Climate Change 2021: The Physical Science Basis. Contribution of Working Group I to the Fifth Assessment Report of the Intergovernmental Panel on Climate Change; Cambridge University Press: Cambridge, UK, 2021. [Google Scholar]
  2. Qin, P. More than six billion people encountering more exposure to extremes with 1.5 °C and 2.0 °C warming. Atmospheric Res. 2022, 273, 106165. [Google Scholar] [CrossRef]
  3. Dong, S.; Sherman, R. Enhancing the resilience of coupled human and natural systems of alpine rangelands on the Qinghai-Tibetan Plateau. Rangel. J. 2015, 37, i–iii. [Google Scholar] [CrossRef] [Green Version]
  4. Yin, H.; Cao, C.; Xu, M.; Chen, W.; Ni, X.; Chen, X. Long-term snow disasters during 1982–2012 in the Tibetan Plateau using satellite data. Geomat. Nat. Hazards Risk 2017, 8, 466–477. [Google Scholar] [CrossRef] [Green Version]
  5. Wang, Y.; Wang, J.; Li, S.; Qin, D. Vulnerability of the Tibetan Pastoral Systems to Climate and Global Change. Ecol. Soc. 2014, 19, 8–18. [Google Scholar] [CrossRef] [Green Version]
  6. Qin, D.H. China National Assessment Report on Risk Management and Adaptation of Climate Extremes and Disasters; Science Press: Beijing, China, 2015. [Google Scholar]
  7. Wei, Z. Persistence of the Snow Anomalies on the Qinghai-Tibetan Plateau. J. Glaciol. Geocryol. 2001, 23, 225–230. (In Chinese) [Google Scholar]
  8. Zhou, L.; Li, H.; Wang, Q. The basic characteristics of heavy snowstorm process and snow disaster distribution in eastern pastoral sreas of Qinghai-Xizang Plateau. Plateau Meteorol. 2000, 19, 450. (In Chinese) [Google Scholar]
  9. Dong, A.; Ju, Z.; Xin, X.; Zhou, L. The singular spectrum analysis of snow damage in Eastern Qinghai-Xizang Plateau. Plateau Meteorol. 2001, 20, 214. (In Chinese) [Google Scholar]
  10. Gao, Y.; Qiu, J. Study on the characteristics and distribution pattern of major natural disasters on the Qinghai-Tibet Plateau. J. Arid. Land Resour. Environ. 2011, 25, 101–106. (In Chinese) [Google Scholar]
  11. Xu, W.; Ma, L.; Ma, M.; Zhang, H.; Yuan, W. Spatial–temporal variability of snow cover and depth in the Qinghai–Tibetan Plateau. J. Clim. 2017, 30, 1521–1533. [Google Scholar] [CrossRef]
  12. Guo, D.; Pepin, N.; Yang, K.; Sun, J.; Li, D. Local changes in snow depth dominate the evolving pattern of elevation-dependent warming on the Tibetan Plateau. Sci. Bull. 2021, 66, 1146–1150. [Google Scholar] [CrossRef]
  13. Chen, L.; Wu, R. Interannual and decadal variations of snow cover over Qinghai-Xizang Plateau and their relationships to summer monsoon rainfall in China. Adv. Atmos. Sci. 2000, 17, 18–30. [Google Scholar]
  14. You, Q.; Kang, S.; Ren, G.; Fraedrich, K.; Pepin, N.; Yan, Y.; Ma, L. Observed changes in snow depth and number of snow days in the eastern and central Tibetan Plateau. Clim. Res. 2011, 46, 171–183. [Google Scholar] [CrossRef]
  15. Tan, X.; Wu, Z.; Mu, X.; Gao, P.; Zhao, G.; Sun, W.; Gu, C. Spatiotemporal changes in snow cover over China during 1960–2013. Atmos. Res. 2019, 218, 183–194. [Google Scholar]
  16. Xu, W.; Ma, H.; Wu, D.; Yuan, W. Assessment of the Daily Cloud-Free MODIS Snow-Cover Product for Monitoring the Snow-Cover Phenology over the Qinghai-Tibetan Plateau. Remote Sens. 2017, 9, 585. [Google Scholar] [CrossRef] [Green Version]
  17. Malmros, J.K.; Mernild, S.H.; Wilson, R.; Tagesson, T.; Fensholt, R. Snow cover and snow albedo changes in the central Andes of Chile and Argentina from daily MODIS observations (2000–2016). Remote Sens. Environ. 2018, 209, 240–252. [Google Scholar] [CrossRef] [Green Version]
  18. Zhang, C.; Mou, N.; Niu, J.; Zhang, L.; Liu, F. Spatio-Temporal Variation Characteristics of Snow Depth and Snow Cover Days over the Tibetan Plateau. Water 2021, 13, 307. [Google Scholar] [CrossRef]
  19. Shijin, W.; Lanyue, Z.; Yanqiang, W. Integrated risk assessment of snow disaster over the Qinghai-Tibet Plateau. Geomat. Nat. Hazards Risk 2019, 10, 740–757. [Google Scholar] [CrossRef] [Green Version]
  20. Che, T.; Hao, X.; Dai, L.; Li, H.; Huang, X.; Xiao, L. Snow cover variation and its impacts over the Qinghai-Tibet Plateau. Bull. Chin. Acad. Sci. 2019, 34, 1247–1253. [Google Scholar]
  21. Gao, J.; Huang, X.; Ma, X.; Feng, Q.; Liang, T.; Xie, H. Snow Disaster Early Warning in Pastoral Areas of Qinghai Province, China. Remote Sens. 2017, 9, 475. [Google Scholar] [CrossRef] [Green Version]
  22. Qiu, X.; Yang, X.; Fang, Y.-P.; Xu, Y.; Zhu, F. Impacts of snow disaster on rural livelihoods in southern Tibet-Qinghai Plateau. Int. J. Disaster Risk Reduct. 2018, 31, 143–152. [Google Scholar] [CrossRef]
  23. Ye, T.; Liu, W.; Chen, S.; Chen, D.; Shi, P.; Wang, A.; Li, Y. Reducing livestock snow disaster risk in the Qinghai–Tibetan Plateau due to warming and socioeconomic development. Sci. Total Environ. 2022, 813, 151869. [Google Scholar] [CrossRef]
  24. Summers, J.K.; Smith, L.M.; Case, J.L.; Linthurst, R.A. A Review of the Elements of Human Well-Being with an Emphasis on the Contribution of Ecosystem Services. Ambio 2012, 41, 327–340. [Google Scholar] [CrossRef] [PubMed] [Green Version]
  25. King, M.F.; Reno, V.F.; Novo, E.M.L.M. The Concept, Dimensions and Methods of Assessment of Human Well-Being within a Socioecological Context: A Literature Review. Soc. Indic. Res. 2014, 116, 681–698. [Google Scholar] [CrossRef]
  26. Bieling, C.; Plieninger, T.; Pirker, H.; Vogl, C.R. Linkages between landscapes and human well-being: An empirical exploration with short interviews. Ecol. Econ. 2014, 105, 19–30. [Google Scholar] [CrossRef] [Green Version]
  27. Naeem, S.; Chazdon, R.L.; Duffy, J.E.; Prager, C.; Worm, B. Biodiversity and human well-being: An essential link for sustainable development. Proc. R. Soc. B Boil. Sci. 2016, 283, 20162091. [Google Scholar] [CrossRef] [Green Version]
  28. Balmford, A.; Bond, W. Trends in the state of nature and their implications for human well-being. Ecol. Lett. 2005, 8, 1218–1234. [Google Scholar] [CrossRef]
  29. Shackleton, R.T.; Shackleton, C.M.; Kull, C.A. The role of invasive alien species in shaping local livelihoods and human well-being: A review. J. Environ. Manag. 2019, 229, 145–157. [Google Scholar] [CrossRef]
  30. Reyes-Riveros, R.; Altamirano, A.; De La Barrera, F.; Rozas-Vásquez, D.; Vieli, L.; Meli, P. Linking public urban green spaces and human well-being: A systematic review. Urban For. Urban Green. 2021, 61, 127105. [Google Scholar] [CrossRef]
  31. Guo, X.; Li, L.; Liu, C.; Li, B. Spatio-temporal Distribution of Snow Disaster in Qinghai Plateau During 1961-2008. Clim. Change Res. 2010, 6, 332–337. (In Chinese) [Google Scholar]
  32. Qinghai Province Local Standards DB63/T372—2001; Meteorological Disaster Standards. Qinghai Quality and Technical Supervision Bureau: Xining, China, 2001; pp. 6–8. (In Chinese)
  33. Che, T.; Li, X.; Jin, R.; Armstrong, R.; Zhang, T. Snow depth derived from passive microwave remote-sensing data in China. Ann. Glaciol. 2008, 49, 145–154. [Google Scholar] [CrossRef] [Green Version]
  34. Dai, L.Y.; Che, T.; Ding, Y.J. Inter-calibrating SMMR, SSM/I and SSMI/S data to improve the consistency of snow-depth products in China. Remote Sens. 2015, 7, 7212–7230. [Google Scholar] [CrossRef] [Green Version]
  35. Che, T. Research on Passive Microwave Remote Sensing Inversion of Snow Accumulation and Snow Data Assimilation Methods; Institute of Cold and Arid Regions Environment and Engineering, Chinese Academy of Sciences: Lanzhou, China, 2006. (In Chinese) [Google Scholar]
  36. Huang, X.; Tang, S.; Ciwang, D. Variation of the snow disasters under global warming and its relationship with general circulation over Tibetan Plateau. Plateau Meteorol. 2018, 37, 325–332. (In Chinese) [Google Scholar]
  37. Shaman, J.; Tziperman, E. The Effect of ENSO on Tibetan Plateau Snow Depth: A Stationary Wave Teleconnection Mechanism and Implications for the South Asian Monsoons. J. Clim. 2005, 18, 2067–2079. [Google Scholar] [CrossRef]
  38. Yu, W.; Liu, Y.; Yang, X.-Q.; Wu, G.; He, B.; Li, J.; Bao, Q. Impact of North Atlantic SST and Tibetan Plateau forcing on seasonal transition of springtime South Asian monsoon circulation. Clim. Dyn. 2021, 56, 559–579. [Google Scholar] [CrossRef]
  39. Yuan, C.; Tozuka, T.; Yamagata, T. IOD influence on the early winter tibetan plateau snow cover: Diagnostic analyses and an AGCM simulation. Clim. Dyn. 2012, 39, 1643–1660. [Google Scholar] [CrossRef]
  40. Liu, Y.; Chen, H.; Wang, H.; Qiu, Y. The Impact of the NAO on the Delayed Break-Up Date of Lake Ice over the Southern Tibetan Plateau. J. Clim. 2018, 31, 9073–9086. [Google Scholar] [CrossRef]
  41. Xiaoge, X.; Zhou, T.; Yu, R. Increased Tibetan Plateau snow depth: An indicator of the connection between enhanced winter NAO and late-spring tropospheric cooling over East Asia. Adv. Atmos. Sci. 2010, 27, 788–794. [Google Scholar] [CrossRef]
  42. Platov, G.; Krupchatnikov, V.; Gradov, V.; Borovko, I.; Volodin, E. Analysis of the Northern Hemisphere Atmospheric Circulation Response to Arctic Ice Reduction Based on Simulation Results. Geosciences 2021, 11, 373. [Google Scholar] [CrossRef]
  43. Chen, Y.; Duan, A.; Li, D. Connection between winter Arctic sea ice and west Tibetan Plateau snow depth through the NAO. Int. J. Clim. 2021, 41, 846–861. [Google Scholar] [CrossRef]
  44. Chen, Y.; Duan, A.; Li, D. Atmospheric Bridge Connecting the Barents Sea Ice and Snow Depth in the Mid-West Tibetan Plateau. Front. Earth Sci. 2020, 8, 265. [Google Scholar] [CrossRef]
  45. Cannon, F.; Carvalho, L.M.V.; Jones, C.; Bookhagen, B. Multi-annual variations in winter westerly disturbance activity affecting the Himalaya. Clim. Dyn. 2015, 44, 441–455. [Google Scholar] [CrossRef] [Green Version]
  46. Dou, J.; Wu, Z. Southern Hemisphere Origins for Interannual Variations of Snow Cover over the Western Tibetan Plateau in Boreal Summer. J. Clim. 2018, 31, 7701–7718. [Google Scholar] [CrossRef]
  47. Kummu, M.; Taka, M.; Guillaume, J.H.A. Gridded global datasets for Gross Domestic Product and Human Development Index over 1990–2015. Sci. Data 2018, 5, 180004. [Google Scholar] [CrossRef] [PubMed] [Green Version]
  48. Costanza, R.; Kubiszewski, I.; Giovannini, E.; Lovins, H.; McGlade, J.; Pickett, K.E.; Ragnarsdóttir, K.V.; Roberts, D.; De Vogli, R.; Wilkinson, R. Development: Time to leave GDP behind. Nature 2014, 505, 283–285. [Google Scholar] [CrossRef] [PubMed] [Green Version]
  49. Millennium Ecosystem Assessment. Ecosystems and Human Well-Being; Island Press: Washington, DC, USA, 2005; Volume 5, p. 563. [Google Scholar]
  50. Hickel, J. The sustainable development index: Measuring the ecological efficiency of human development in the anthropocene. Ecol. Econ. 2020, 167, 106331. [Google Scholar] [CrossRef]
  51. Clark, W.A.V.; Yi, D.; Huang, Y. Subjective well-being in China’s changing society. Proc. Natl. Acad. Sci. USA 2019, 116, 16799–16804. [Google Scholar] [CrossRef] [Green Version]
  52. Liu, L.; Wu, J. Ecosystem services-human wellbeing relationships vary with spatial scales and indicators: The case of China. Resour. Conserv. Recycl. 2021, 172, 105662. [Google Scholar] [CrossRef]
  53. Oswald, A.J.; Wu, S. Objective Confirmation of Subjective Measures of Human Well-Being: Evidence from the U.S.A. Science 2010, 327, 576–579. [Google Scholar] [CrossRef] [Green Version]
  54. Duc, N.M. Farmers’ satisfaction with aquaculture—A logistic model in Vietnam. Ecol. Econ. 2008, 68, 525–531. [Google Scholar] [CrossRef]
  55. Peel, D.; Berry, H.L.; Schirmer, J. Farm exit intention and wellbeing: A study of Australian farmers. J. Rural Stud. 2016, 47, 41–51. [Google Scholar] [CrossRef]
  56. Mzoughi, N. Do organic farmers feel happier than conventional ones? An exploratory analysis. Ecol. Econ. 2014, 103, 38–43. [Google Scholar] [CrossRef]
Figure 1. Variation of the frequency (a) and areal proportion of snow disasters (b) on the QTP over past 40 years.
Remotesensing 14 03358 g001
Figure 2. Spatial distribution of long-term variation trends for annual frequencies of different grades of snow disasters ((ae) represent total snow disasters, slight, moderate, heavy, and extremely heavy snow disasters, respectively).
Remotesensing 14 03358 g002
Figure 3. The regional average variation sequences and the spatial distribution of long-term variations of the duration of snow disasters and snow depth ((a,b) represent the duration of snow disasters; (c,d) represent the snow depth, respectively).
Remotesensing 14 03358 g003
Figure 4. Regional average grades of snow disasters (a) and spatial distribution of the long-term variations (b).
Remotesensing 14 03358 g004
Figure 5. Spatial distribution of frequencies of different grades of snow disasters on the QTP over the past 40 years ((ae) represent total snow disasters, slight, moderate, heavy, and extremely heavy snow disasters, respectively).
Remotesensing 14 03358 g005
Figure 6. Spatial distribution of the average duration of snow disasters (a) and the average snow depth (b) on the QTP over the past 40 years.
Remotesensing 14 03358 g006
Figure 7. Spatial distribution of the average grade of snow disaster on the QTP.
Remotesensing 14 03358 g007
Figure 8. Zoning of the risk of hazard factors (a), sensitivity of hazard-inducing environments (b), vulnerability of hazard-affected bodies (c), and disaster prevention and mitigation capacity (d) of snow disasters for husbandry on the QTP.
Remotesensing 14 03358 g008
Figure 9. Zoning of the comprehensive risk of snow disasters for husbandry on the QTP.
Remotesensing 14 03358 g009
Figure 10. Typical regions (a) and variations of the FPWB index and the risk of snow disasters for every typical region ((bf) represent I, II, III, IV, and V, respectively).
Remotesensing 14 03358 g010
Table 1. Division criteria for snow disasters of last winter.
Grade of Snow DisasterSnow Depth/mmSnow Duration/d
Slight[2, 5][11, 20]
(5, 10][5, 10]
Moderate[2, 5][21, 40]
(5, 10][11, 20]
(10, 20][5, 10]
Heavy[2, 5](40, )
(5, 10][21, 40]
(10, 20][11, 20]
Extremely heavy(5, 10](40, )
(10, 20](20, )
(20, )(15, )
Table 2. Division criteria for snow disasters of this spring.
Grade of Snow DisasterSnow Depth/cmSnow Duration/d
Slight[2, 5][6, 10]
(5, 10][3, 5]
Moderate[2, 5][11, 20]
(5, 10][6, 10]
(10, 20][3, 5]
Heavy[2, 5](20, )
(5, 10][11, 20]
(10, 20][6, 10]
Extremely heavy(5, 10](20, )
(10, 20](10, )
(20, )(8, )
Table 3. Risk assessment indices for snow disasters on the QTP and their weights.
IndexRule Hierarchy (Weight)Scheme Layer (Weight)
Risk assessment of snow disasters on the QTPHazard factors (0.534)Duration (0.141)
Snow depth (0.141)
Grade of snow disasters (0.455)
Frequency (0.263)
Hazard-inducing environments (0.108)Slope (0.159)
Slope aspect (0.252)
Altitude (0.589)
Hazard-affected bodies (0.282)Crop-sown area (0.081)
Livestock inventories at the end of a year (0.378)
Disaster prevention and mitigation capacity (0.076)GDP (0.5)
Net income of rural residents (0.5)
Table 4. Components of the FPWB index on the QTP.
IndexRule Hierarchy (Weight)Scheme Layer (Weight)
FPWB indexHuman resources (0.126)The number of rural households (0.5)
The number of employees in farming, forestry, animal husbandry, and fishery (0.5)
Natural resources (0.222)Crop-sown area
Material resources (0.574)Total power of agricultural machinery (0.081)
Total grain output (0.163)
Livestock inventories at the end of a year (0.378)
Meat production (0.378)
Social and financial resources (0.077)Gross output of farming, forestry, animal husbandry, and fishery
Table 5. Contribution of variations of the risk of snow disasters to the FPWB.
FPWBMaterial ResourcesLivestock InventoriesMeat ProductionSocial and Financial Resources
I−0.186−0.552−0.451−0.239−0.759
II−0.768−0.601−0.524−0.511−1.121
III−0.378−0.947−0.871−0.466−1.054
IV−0.109−0.032−0.172−0.223−0.284
V−0.03−0.047−0.12−0.043−0.044
Publisher’s Note: MDPI stays neutral with regard to jurisdictional claims in published maps and institutional affiliations.

