
Influence of Charcoal Production on Forest Degradation in Zambia: A Remote Sensing Perspective

1
Directorate for Natural Resources, Joint Research Center European Commission, 21027 Ispra, Italy
2
Forestry Department, Ministry of Lands and Natural Resources, Lusaka 50694, Zambia
3
Department of Geographical Sciences, University of Maryland, College Park, MD 20742, USA
*
Author to whom correspondence should be addressed.
Remote Sens. 2022, 14(14), 3352; https://doi.org/10.3390/rs14143352
Submission received: 26 May 2022
/
Revised: 24 June 2022
/
Accepted: 7 July 2022
/
Published: 12 July 2022
(This article belongs to the Special Issue Forest Disturbance Monitoring Using Satellite Remote Sensing)
Abstract
:A multitemporal dataset of medium-resolution imagery was used to document a tree cover loss process in three forest reserves of Zambia. This degradation process was attributed to charcoal production with a high degree of certainty, as evidence of kiln scars was found in more than 85% of sites sampled with high-resolution imagery across the study areas. The spatial and temporal pattern of mapped kiln scars exposed an intense and fast-paced degradation process, with kiln densities reaching 2.3 kiln/ha, removal of about 79.3% of the aboveground biomass and reductions of 74.2% of tree cover. The analysis revealed that this forest degradation process progressively moves further away from urban centers. In the year 2010, charcoal production took place around 190 km away from Lusaka, whereas extraction areas in 2020 were located around 350 km from this city. These results underline the negative impact of charcoal production on forest resources and question its characterization as localized and periurban. The post-disturbance LCLUC trajectories of degraded woodlands in forest reserves revealed a partial conversion to agricultural land over time, with less than 25% of these woodlands cultivated seven years after charcoal production. The disaggregation of the supply sources of charcoal for the city of Lusaka based on consumption figures and remote sensing deforestation records showed that the charcoal generated as a byproduct of agricultural expansion is not enough to meet the annual charcoal demand of Lusaka. On the contrary, the majority (65%) of this charcoal is the result of a forest degradation process that alters 197.4 km2 of miombo woodlands annually. These findings highlight the role of charcoal production as a direct driver of forest degradation and suggest that forest degradation resulting from charcoal production has surpassed deforestation due to agricultural expansion as the main tree cover loss process in Zambia. These results provide data-driven evidence to improve the characterization of forest degradation resulting from charcoal production across the woodlands of southern Africa and aid the REDD + monitoring, reporting and verification systems in compliance with international reporting commitments.
1. Introduction
Fifty-five percent of the wood extracted from forests globally is used to produce energy. This figure rises to ninety percent in Africa [1]. In sub-Saharan Africa (SSA), fuelwood consumption has doubled since 1990, and some estimates indicate that it could account for 30% of regional anthropogenic emissions [1,2]. Despite its relevance, the impact of wood fuel use on forest resources and carbon emissions is still not clearly understood and quantified [3,4,5]. Wood fuels include several sources, each with distinct production systems, stakeholders and impact on forest resources. Charcoal represents the main cooking energy source for urban households in twenty-one countries of SSA, where close to 80% of the population use it as part of their cooking energy mix [6]. Charcoal is the result of a process by which trees are felled, cut, stacked and covered with soil in earth kilns in a low-oxygen combustion environment. It is easy to transport and has a high energy content, making it the preferred alternative for urban households. The demand for charcoal in SSA has grown at an annual rate of around 4% since the year 2000, and projections indicate that as its urban population rapidly increases, charcoal will remain an important source of energy through 2040 [1,2,7,8,9].
During the global fuelwood crisis of the 1970s, the sustainability of wood fuel drew international attention, and the role of charcoal production in forest loss was widely emphasized [10,11]. By the mid-1980s, fuel scarcity crisis projections had been reappraised. Due to more lenient interpretations, charcoal was no longer portrayed as a major threat to forest sustainability, with the potential negative impact of charcoal production on forest resources downplayed [12,13,14]. However, these narratives are often rooted in scarce and partial evidence, and, unchallenged by data-driven evidence, they have shaped the perception of the drivers and impact of the charcoal sector on natural resources [15]. For instance, charcoal production is commonly represented as a periurban process with a localized negative impact on forest cover [1,16,17,18]. Charcoal has been also often described as a byproduct of agricultural expansion, a complementary livelihood strategy for farmers or a safety net in years of low agricultural production [17,19,20,21].
Although large knowledge gaps remain, there is a growing consensus regarding the role of charcoal production as a main cause of forest degradation in SSA [15,22,23,24]. Forest degradation can be defined as the reduction in the capacity of a forest to provide goods and services such as biomass, carbon sequestration, water regulation, soil protection and biodiversity conservation [25,26]. Recent research is contributing to the development of a more accurate depiction of the link between forest degradation and charcoal production in SSA, incorporating geospatial information to better understand the location and magnitude of its impacts [27,28]. Studies in dry woodlands of the region using Earth observation remote sensing data provide a detailed description of charcoal production patterns, confront traditional narratives and suggest that charcoal production is an unsustainable process often not linked to agricultural expansion [29,30]. However, it is not clear that these findings, from ecosystems with limited potential for agricultural expansion, can be extrapolated to humid ecosystems in the region with higher potential for agricultural development.
The focus of the present work is the spatial and temporal characterization of charcoal production and its impact on the wet miombo woodlands of Zambia. This represents an expansion of the geographic domain of recent studies to humid ecosystems in southern Africa. With this study, we targeted two main research questions: (1) Are the spatial–temporal dynamics and the level of AGB extractions of forest degradation from charcoal production in wet Miombo woodland ecosystems similar to those reported for other woodland ecosystems in the region? (2) What is the contribution of charcoal production as a result of forest degradation to the overall urban charcoal demand in Zambia? Building on recent developments with respect to monitoring of forest degradation resulting from charcoal production with medium-, high- and very high-resolution Earth observation imagery [28,29,30,31,32,33], the findings of this research contribute to filling a current gap in the understanding of forest degradation dynamics in the region.
2. Materials and Methods
2.1. Study Area
The study area includes three forest reserves in Zambia: Katarino in the Copperbelt province, as well as Kapiri Mposhi and Mkushi in the Central province (Figure 1). Kapiri Mposhi, Katanino and Mkushi forest reserves cover an area of 265, 57 and 308 km2, respectively and are located 187, 240 and 347 km from Lusaka, respectively. The three reserves present gently undulating landscapes at altitudes between 1000 and 1500 m above sea level, receiving more than 1000 mm rainfall per year, mostly concentrated during a 5–7-month wet season [34]. Tree formations in these reserves are classified as miombo woodlands, the main woodland type in southern Africa. These woodlands are dominated by deciduous trees of the genera Brachystegia, Isoberlinia and Julbernardia, and their structure commonly presents an upper canopy of trees usually greater than 15 m, a scatter layer of subcanopy trees, a discontinuous shrub understory and a layer of grasses. Tree cover in Kapiri Mposhi comprised 95.6% of the area in 2001, whereas tree cover in Katarino and Mkushi was above 96% [35].
Zambia represents an ideal case to gain a broader understanding of the role and impact of charcoal production on forest resources in humid ecosystems of southern Africa. More than 75% of urban households in the country use charcoal as the main cooking energy source [36]. Subject to cyclical floods and droughts, annual rainfall in Zambia is relatively high, ranging from 500 mm in the south to 1400 mm in the north. Forest cover is estimated to be 61% of the total land area, and with just 20% of the total arable land cultivated, the country has considerable room to expand its area under cultivation [37]. In the last decade, the Zambian government has actively promoted maize production, and the country has become a major surplus producer [38].
2.2. Datasets
A dataset of multitemporal Landsat images was compiled from the Landsat 5 (TM sensor) and Landsat 8 (OLI sensor) databases, including surface reflectance Collection 1 Tier 1 provided by the USGS. This dataset included cloud-free images for the three forest reserves acquired between June and September for each year between 1998 and 2020. This interannual acquisition window corresponds to the dry season, maximizes the chance of obtaining cloud-free images and provides larger spectral separation between the main land cover types (Figure 2). Kapiri Mposhi and Katarino were covered in the Path 172 Row 70 scene, and Mkushi was covered in the Path 171 Row 69 scene. A dataset of high-resolution WorldView 1, 2 and 3; GeoEye-1; and QuickBird-2 images acquired from 2008 to 2019 was assembled from the Maxar archive. This dataset includes 16, 17 and 7 multispectral images (2 m) for Mkushi, Katarino and Kapiri Mposhi, respectively, as well as 9 panchromatic (0.5 m) images for Kapiri Mposhi (Table 1). These images were used to identify evidence of kiln scars in areas of tree cover loss and to quantify tree cover changes between pre- and post-charcoal production disturbance (hereafter, disturbance). Field information was obtained during a field work campaign in the three forest reserves between 22 June and 6 July of 2019. The information was collected from 113 kiln sites across the three reserves. At each site, kiln scar dimensions, kiln development year, tree species in the kiln, current land cover and land use, and post-disturbance basal area were measured. Additionally, the reference basal area in 59 undisturbed woodland sites was also measured.
2.3. Methods
Historical Landsat imagery was used to map annual changes in forest cover in three forest reserves of Zambia, and multitemporal high-resolution imagery was used to precisely attribute forest cover changes to charcoal production. Historical Landsat imagery was also used to analyze land cover and land use trajectories after charcoal production. Finally, multisource data from demographic statistics, household surveys and remote sensing data were combined to quantify the contribution of both deforestation and forest degradation to cover the urban demand of the major urban centers in the country.
2.3.1. Detecting Annual Tree Cover Change
A change analysis approach based on multitemporal Landsat images was applied to map tree cover changes in three forest reserves on an annual basis. A similar approach has been used to monitor the advance of forest degradation extent in dry tropical woodlands of the region [30,33]. Charcoal production commonly involves a rapid and partial extraction of aboveground biomass. This removal results in temporary sharp declines of the NDVI signal in woodland ecosystems. With this approach, we searched for variations in the NDVI signal that followed this pattern and could be linked to forest degradation resulting from charcoal production (Figure 3). These dynamics are captured by the following equation:
where D is the NDVI variation between successive years, NDVIt is the NDVI value in year t and NDVIt−1 is the NDVI value in year t − 1. NDVI images from consecutive years were intercalibrated following the strategy described in [30]. The extent of forest degradation was defined using a spectral threshold that identified pixels with changes in the NDVI signal between consecutive images larger than one standard deviation of the average variation in woodland pixels. This spectral threshold was established based on previous studies in the region [30,33]. The analysis produced annual images of forest degradation extent for the three forest reserves between 2000 and 2020. The analysis was carried out in the Google Earth Engine platform.
2.3.2. Inspecting Intensity of Charcoal-Production-Driven Forest Degradation
Tree cover change in the study areas can potentially be attributed to several drivers (e.g., agricultural expansion, forest degradation, etc.). Changes in tree cover were attributed to charcoal production by searching for evidence of charcoal production in areas previously identified as degraded woodlands in the analysis of multitemporal Landsat images. Kiln scars mapped in high-resolution imagery served as proxy of forest degradation from charcoal production [29,31,32]. Kiln scars were mapped using a region-growing segmentation approach that exploits the contrast in the near-infrared band between kiln scars and neighboring pixels. This methodology has been successfully validated in woodlands of the Miombo region [28]. At each forest reserve kiln, scars were mapped in all the 1 × 1 km cells of a grid previously labeled as degraded woodland.
Subsequently, kiln densities at the three forest reserves were computed from kiln scars mapped in the high-resolution images, and AGB removals were estimated as the product of the average kiln density, kiln dimensions and kiln wood volume percentage measured in the field and the rate of biomass [39] and wood density obtained from previous studies in the region [40].
In Katarino and Mkushi forest reserves, tree cover change associated with charcoal production was mapped using cloud-free high-resolution images (2 m) from the Maxar archive before and after charcoal production. Kapiri Mposhi was excluded from this analysis due to the lack of pre- and post-disturbance high-resolution imagery. For Katarino, three QuickBird-2 images for 2009 and 2018 epochs were used. For Mkushi, four WorldView-2 images for 2012 and 2016 epochs were used. The image acquisition window was restricted to the beginning of the dry season (June to July), when spectral separation between the main vegetation types of the study area is larger. A classification and regression tree (CART) supervised classifier [41] was applied to create a tree cover mask (tree–no tree) for pre- and post-disturbance images. Training data for the classification algorithm were obtained via visual interpretation of each high-resolution image. Tree cover change was computed as the average from 210 sample locations (120 for Katarino and 90 for Mkushi), with each sample location covering 1 ha (100 × 100 m).
2.3.3. Analyzing the Post-Disturbance LCLU Trajectories
The post-disturbance LCLU trajectories of woodlands experiencing forest degradation from charcoal production were analyzed. At each forest reserve, annual LCLU maps were created using a single Landsat image acquired between September and November for each year since the disturbance year to 2020. The year of disturbance was estimated from the previously generated historical tree cover change maps. A Mahalanobis classifier [42] was applied to label degraded pixels as forest, shrub or agriculture in the successive annual LCLU maps. Training data were obtained from visual interpretation of the Landsat images at known locations within the forest reserves and surrounding areas.
2.3.4. Quantifying the Contribution of Forest Loss to Urban Charcoal Demand in Lusaka
The extent of forest degraded by charcoal production at a national level was indirectly estimated as the woodland area required to produce the amount of the charcoal consumed in Lusaka not met by agricultural expansion. As Zambia’s major urban center, Lusaka is the largest contributor to total national charcoal demand. Therefore, although partial, the conclusions from this assessment of Lusaka represent a lower bound of the forest degradation extent at a national level and offer valuable information with respect to national trends. For this assessment, we combined parameters extracted from remote sensing products and regional studies. The annual urban charcoal demand of Lusaka was estimated from population statistics [43], urban household charcoal usage and household consumption rates from in-country surveys [44]. The annual amount of charcoal produced from agricultural expansion was calculated as the product of annual agricultural expansion extent, average AGB of Zambian miombo woodlands [45] and charcoal conversion rates [44]. Annual deforestation figures were applied as a reasonable proxy for agricultural expansion, as agricultural expansion is responsible for more than 99% of the annual forest loss in the country [46]. Annual deforestation figures were extracted from [35]. For a robust estimate that avoided interannual fluctuations, the average annual tree cover loss between 2016 and 2020 was taken as reference. As the Hansen et al. (2013) product defines tree cover loss as a stand-replacement disturbance or a change from a forest to non-forest state, partial AGB removals, such as those associated with charcoal production, are not expected to be mapped as loss. Additionally, trees removed for agricultural expansion may not always be used to produce charcoal. Recent studies [21] documented that outside protected areas, charcoal was produced in 74% of the sites converted to agriculture. This value was used to accordingly adjust the final amount of charcoal produced from agriculture. Charcoal produced from forest degradation was estimated as the difference between the annual charcoal consumption of Lusaka and the annual charcoal produced as a result of agricultural expansion. Subsequently, the extent of degraded forest required to produce this amount of charcoal was calculated using remote-sensing-based kiln densities, field measurements of kiln wood [28] and regional charcoal conversion rates [44].
3. Results
3.1. Forest Degradation Patterns from 2006 to 2020
Through analysis of the multitemporal dataset of Landsat images, we mapped forest degradation extent on an annual basis, revealing a progressive forest degradation process in all three forest reserves. Although there was some overlapping, the process took place sequentially, following a centrifugal pattern in the forest reserves located 187, 240 and 347 km from Lusaka. Accordingly, forest degradation in Kapiri Mposhi was initiated in 2004, and nearly the entire tree cover of the reserve had been degraded by 2017. The first evidence of forest degradation in Katarino and Mkushi forest reserves was registered in 2006 and 2007, respectively, and the process was still active in 2020. Within each reserve, degradation was commonly initiated in tree stands near the main access roads and gradually spread, following trails specifically opened for charcoal production and transportation (Figure 4, Figure 5 and Figure 6).
3.2. Intensity and Spatial Patterns of Charcoal-Production-Induced Forest Degradation
Evidence of kiln scars was found in a large proportion of the sites experiencing forest degradation (Figure 7). Using imagery epochs for 2011 and 2014, evidence of kilns and kiln scars was found in 87.9% of the 1 × 1 km grid cells covering the degraded forests of Kapiri Mposhi. Analysis of four imagery epochs (2014, 2015, 2017 and 2018) in Katarino forest reserve also revealed evidence of charcoal production in 87.5% of the grid cells of degraded forests, and the analysis of six epochs (2012, 2013, 2015, 2016, 2017 and 2018) covering the Mkushi forest reserve revealed evidence of charcoal production in 89.4% of the degraded forests. The lack of wall-to-wall coverage of high-resolution images on an annual basis may result in the under-detection of kiln scars in the years without imagery. Therefore, attribution to charcoal production is likely to be higher than the reported figures.
The combination of information from high-resolution images and field data served to quantify the intensity and spatial patterns of forest degradation associated with charcoal production in the three forest reserves under study. A total of 1073 kiln scars were mapped in four locations in Katarino and two in Mkushi (Figure 8). The average kiln density in these sites was estimated to be 2.3 kilns/ha, and the average distance between kilns in was estimated to be 74.9 m (SD = 32.9). On average, the reduction in tree cover at charcoal production sites before and after disturbance reached 74.2% (78.7% in Katarino and 68.2% in Mkushi) (Figure 9). The lower values in Mkushi can be explained by the fact that charcoal production is still at an earlier stage in this forest reserve. Aboveground biomass removals in charcoal production sites were estimated at 65.59 tons/ha, which represents 79.3% of the average standing biomass for wet miombo [42].
3.3. Post-Disturbance LCLU Trajectories
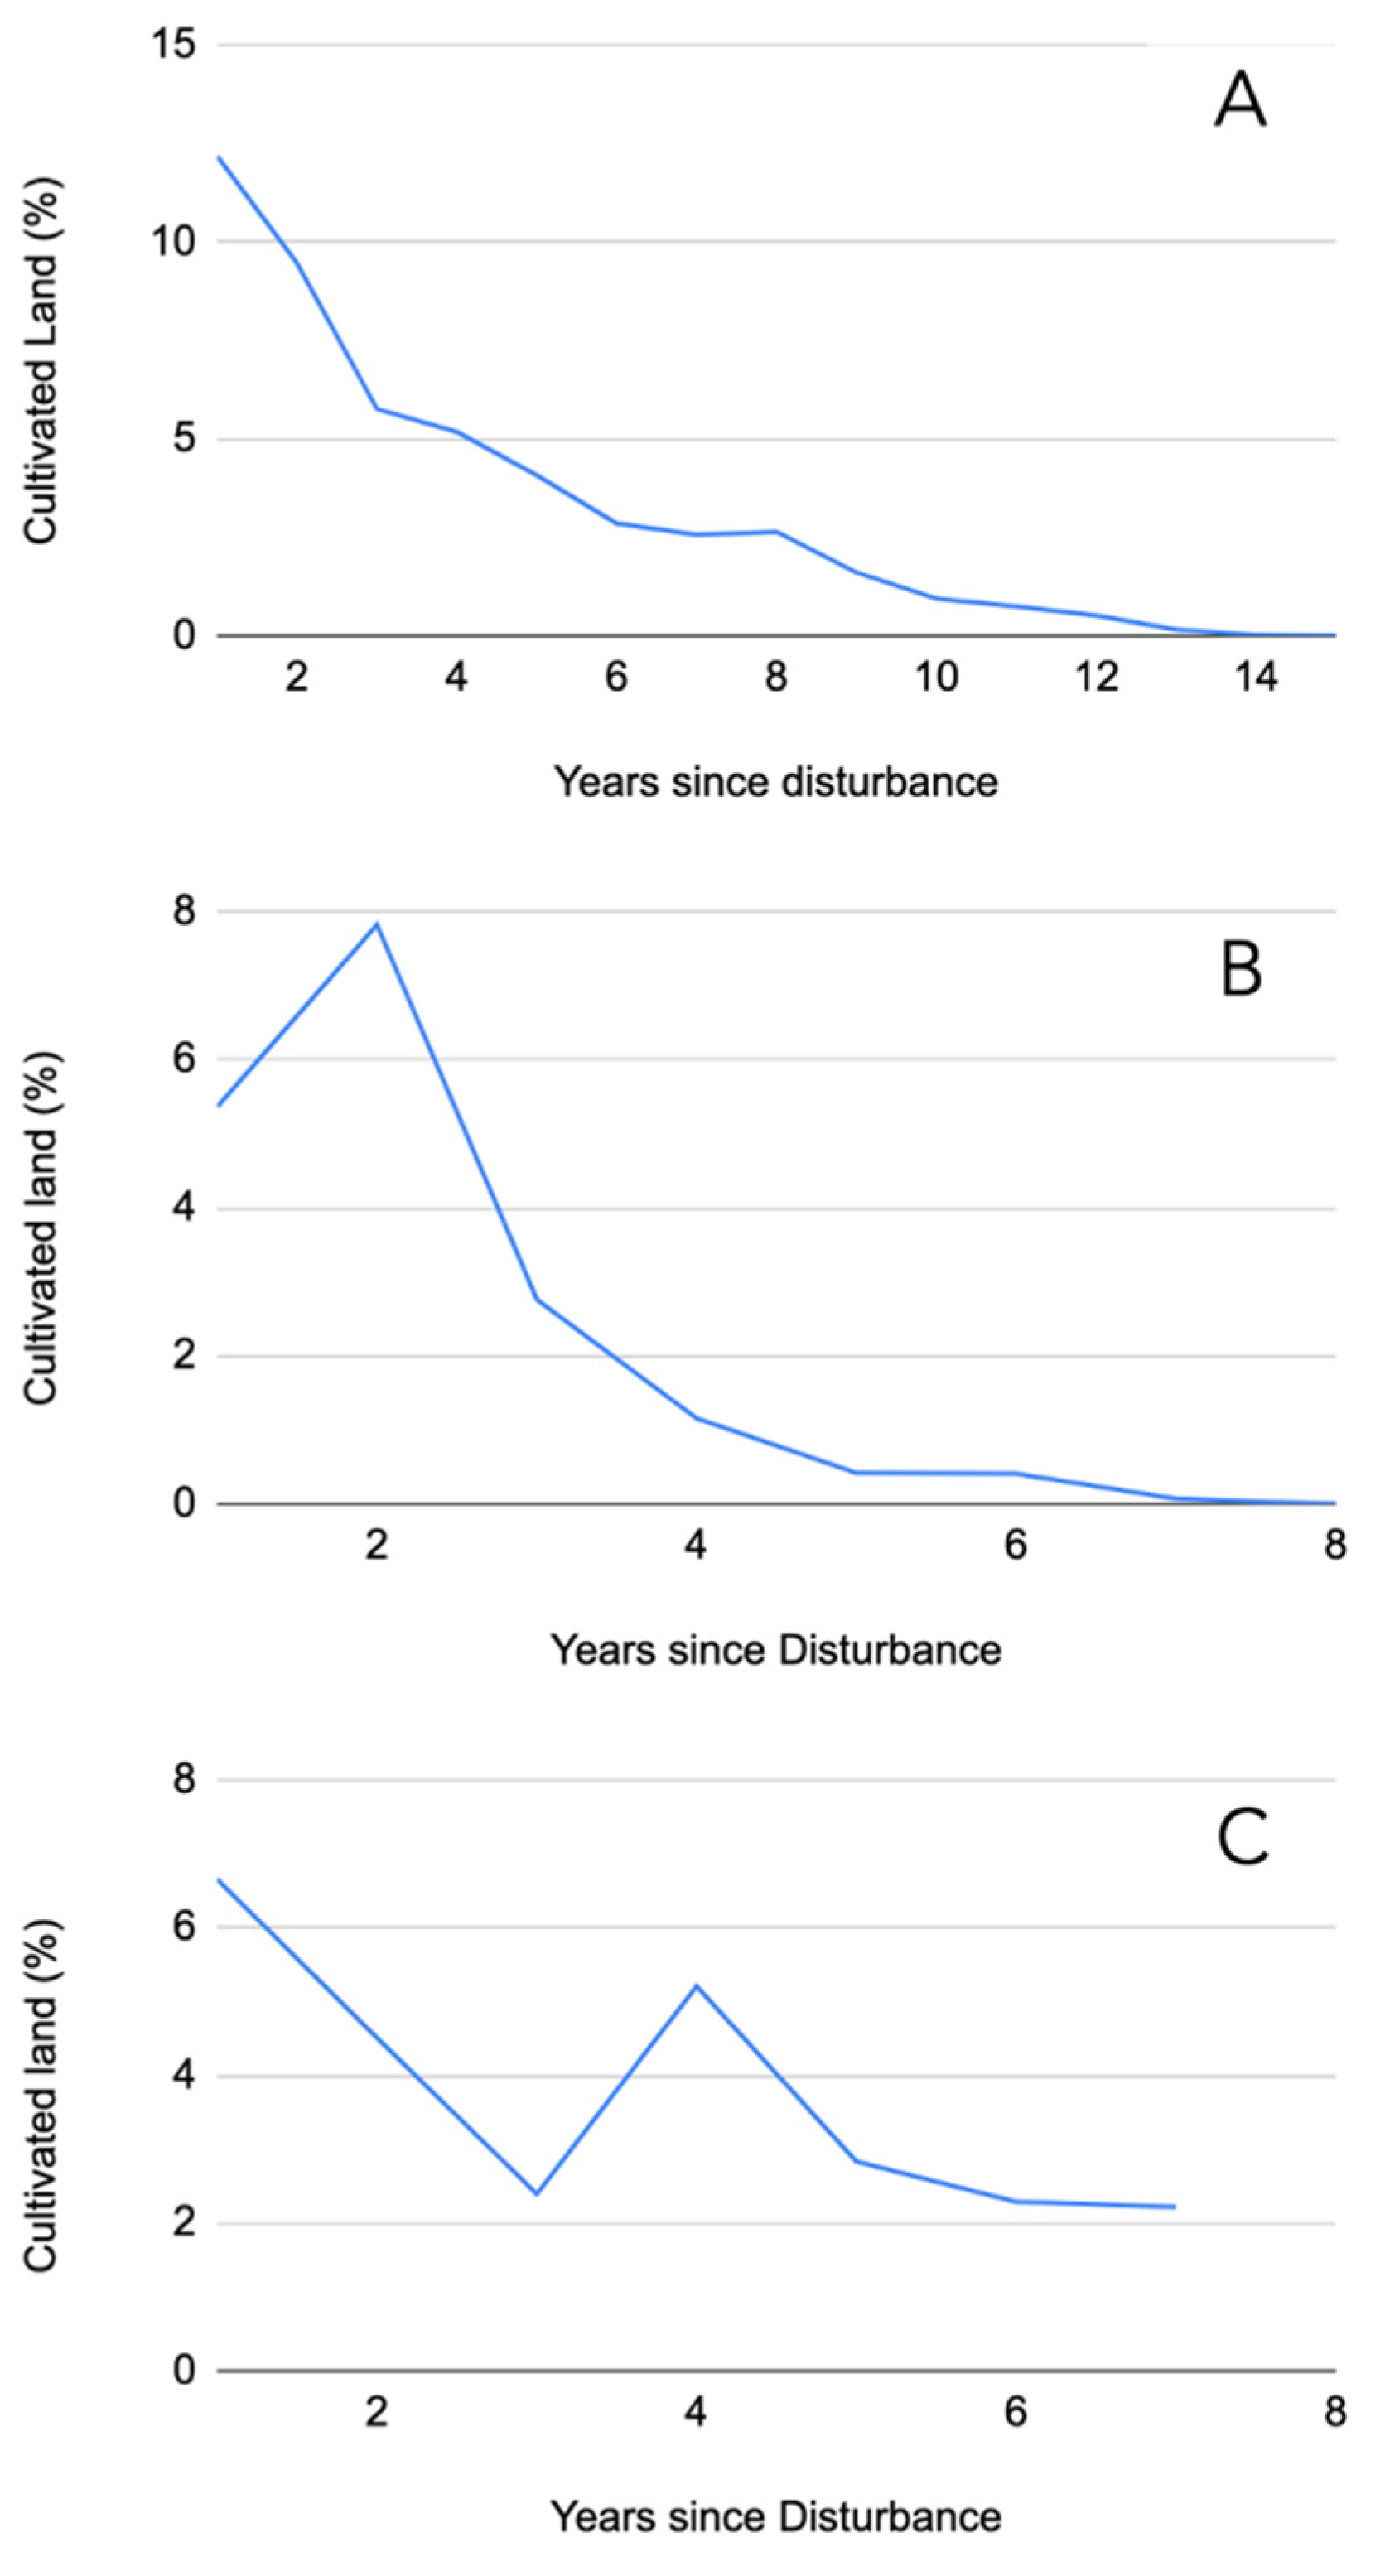
Post-disturbance LCLU trajectories did not show evidence of a complete or immediate conversion to agriculture after charcoal production. The annual post-disturbance Landsat-based LCLU maps revealed that most of the degraded woodlands maintained their natural vegetation in successive years, and only a portion of these woodlands were cultivated in the years following charcoal production. In Kapiri Mposhi, less than 25% of the degraded forests were cultivated two years after charcoal production (Figure 10). Over the years, this percentage gradually increased, and more than 75% of the degraded forests were cultivated seven years after charcoal production. This transition was slower in Katarino and Mkushi forest reserves, where less than 25% of the charcoal production sites had been cultivated eight years after charcoal production (Figure 11).
3.4. Contribution of Forest Degradation to Urban Charcoal Demand
The annual charcoal demand of Lusaka, estimated on the basis of population statistics and urban household consumption rates, was 496,590 tons. Charcoal obtained as a byproduct of agricultural expansion accounted for 172,977 tons (35% of this demand), resulting from the conversion of 148.7 km2 of woodlands annually. Forest degradation accounted for 65% of the annual charcoal demand of Lusaka (323,613 tons). The extent of forest degradation required to produce this amount of charcoal was estimated to be 197.4 km2. Hence, forest degradation extent represents 57% of the tree cover change, and deforestation accounts for the remaining 43%.
4. Discussion
A forest degradation process in three forest reserves of Zambia was documented using multitemporal medium-resolution remote sensing data. Starting in 2001, this process took place sequentially in forest reserves further from the city of Lusaka. Validation with high-resolution imagery showed that this forest degradation could be attributed to charcoal production with a high degree of certainty.
This charcoal production results in evident negative impacts on the woodland ecosystems. These findings suggest an intense production process, with kiln densities higher than those registered in dry woodland ecosystems in the region [34], extensive tree cover reductions and large aboveground biomass removals. The rapid progression of the centrifugal forest degradation pattern and the magnitude of its AGB removals measured with remote sensing data reinforce previous field studies that underline the unsustainability of current charcoal production systems in the miombo woodlands of Zambia [45,47]. They are also in line with trends of forest degradation resulting from charcoal production observed in other woodland ecosystems of southern Africa [28].
The negative impact of charcoal production has often been portrayed as a periurban problem [1,16,44]. However, considering the increasing urban energy demand, this characterization may no longer reflect the current production patterns. The main charcoal production areas at the beginning of the century were located 150 km from Lusaka [16]. Our analysis reveals that in 2020, production was taking place as far as 347 km from Lusaka, providing additional evidence of spatial and temporal patterns of forest degradation documented in other urban centers in the region [48]. The evidence of the expanding footprint of urban energy demand challenges the established perception of charcoal production as a mere periurban issue. As forest resources in the vicinity of urban areas have been depleted, the remaining woodlands can hardly meet the urban demand for charcoal, and production areas are gradually moving further away from cities [49]. Moreover, this work provides additional information that confronts the characterization of the negative impact of charcoal production as localized [50]. Earth observation records identified several discontinuous charcoal production areas, each covering a growing area over time. Although the focus of this work is forest reserves located in two provinces, there are records of charcoal production simultaneously taking place in other areas of the country [44,51]. Whereas charcoal production may have been highly localized in the past, current charcoal production patterns seem to confirm a web of production areas resulting in a diffuse and irregular forest degradation pattern.
Charcoal has often been described as a byproduct of agricultural expansion [21,49]. However, our remote-sensing-based analysis identified a process by which, rather than agricultural expansion, charcoal production is the main driver of tree cover loss. The disaggregation of charcoal supply sources at a national level using urban energy demand figures and remote sensing deforestation records indicates that charcoal produced as a byproduct of agricultural expansion is not enough to meet the urban energy demand of Lusaka and, by extension, the national demand. Today, the majority of charcoal consumed in Lusaka is obtained from trees felled with the primary goal of making charcoal in woodlands that experience an intense degradation process. The relative importance of forest degradation resulting from charcoal production, in terms of both spatial extent and produced charcoal, surpasses that of deforestation for agricultural expansion.
Our remote-sensing-based analysis of the post-disturbance LCLUC trajectories in the degraded woodlands of forest reserves reveals a gradual and partial conversion to cultivated land over time. This suggests a coupled system in which charcoal production could trigger farming in subsequent years, as lower AGB and potentially higher soil fertility could facilitate cultivation and higher yields. This system coexists with the previously mentioned process in which charcoal is a byproduct of agricultural expansion. Moreover, charcoal production can also be highly independent of farming in drier woodland ecosystems in the region, where there is limited potential for agricultural expansion [30]. These distinct tree cover change processes associated with charcoal production portray a complex reality often determined by the different ecological conditions and the socioeconomic contexts of each location.
An accurate quantification of the impact of charcoal production on forest resources has remained elusive, hampering international reporting obligations and the design and implementation of effective policy interventions. A main reason for this difficulty lies in the lack of specific information about charcoal production and the charcoal sector in general [15]. The authors of [52] noted that most carbon offset projects rely on broad assumptions and general ad hoc methodologies to set their targets, ignoring important aspects of forest degradation. The same authors proposed the development of spatially explicit supply–demand-based scenarios to provide a more realistic and detailed assessment. However, all these efforts are constrained by the above-mentioned lack of reliable information about the charcoal production process. This work contributes to the growing body of knowledge, providing detailed information on charcoal production spatial and temporal patterns and intensity in tropical woodlands of southern Africa. This information should serve to develop a data-driven and evidence-based characterization and quantification of forest degradation and charcoal production, contributing to the adjustment of existing approaches for carbon offset quantification and refining of modeling scenarios.
5. Conclusions
Although considered a main driver of forest degradation in sub-Saharan Africa, the lack of data-driven evidence about charcoal production has hampered its characterization and the quantification of its impacts on forest resources. In this research work, we relied on information from multitemporal medium-resolution and high-resolution Earth observation data to provide a detailed description of the spatial and temporal patterns of forest degradation resulting from charcoal production in the miombo woodlands of southern Africa. The analysis underlines the unsustainability of the current charcoal production regime, which is responsible for major changes in tree cover and large aboveground biomass removals. Our analysis of time series satellite data reveals that charcoal production and associated forest degradation is steadily advancing further away from the main urban centers in several locations simultaneously in a spatial pattern that can no longer be characterized as periurban and localized. The findings suggest that charcoal produced as a byproduct of agricultural expansion does not satisfy the annual charcoal demand of Zambia. On the contrary, the majority of the charcoal currently consumed in Zambian urban centers may come from woodlands experiencing a progressive degradation process. This implies that the footprint of forest degradation resulting from charcoal production is larger than that of deforestation as the main tree cover loss process in Zambia. In addition, our analysis of land cover and land use dynamics over time reveals that degraded forests are not necessarily converted to agricultural use in successive years, but charcoal production could in some cases, act as a precursor to agricultural expansion. This research work adds to a growing body of knowledge on charcoal production and forest degradation in sub-Saharan Africa. Our analyses were focused on wet miombo ecosystems of southern Africa, expanding the geographical scope of previous studies and contributing to a more accurate and detailed characterization of forest degradation resulting from charcoal production.
Author Contributions
Conceptualization, F.S. and A.M.-S.; methodology, F.S. and A.M.-S.; software, F.S.; validation, F.S. and A.M.-S.; investigation, F.S., A.M.-S., L.D. and M.L.; resources, F.S., A.M.-S., L.D. and M.L.; data curation, F.S.; writing—original draft preparation, F.S.; writing—review and editing, F.S., A.M.-S., L.D. and M.L.; supervision, F.S. and L.D.; project administration, F.S.; funding acquisition, F.S. All authors have read and agreed to the published version of the manuscript.
Funding
This study is part of the ‘Forest degradation caused by charcoal production: characterization, quantification and forecasting to improve carbon monitoring systems in southern Africa’ project supported by NASA Carbon Monitoring System (16-CMS16-0041).
Data Availability Statement
DigitalGlobe imagery was used under the National Geospatial Intelligence Agency’s (NGA) NextView license agreement (© 2016 DigitalGlobe, Inc., Licensed under NextView).
Acknowledgments
We would like to thank the anonymous reviewers for their suggestions and comments.
Conflicts of Interest
The authors declare no conflict of interest. The funders had no role in the design of the study; in the collection, analyses, or interpretation of data; in the writing of the manuscript, or in the decision to publish the results.
References
- FAO. The Charcoal Transition: Greening the Charcoal Value Chain to Mitigate Climate Change and Improve Local Livelihoods; van Dam, J., Ed.; Food and Agriculture Organization of the United Nations: Rome, Italy, 2017. [Google Scholar]
- International Energy Agency. Africa Energy Outlook 2019—Analysis Scenarios Africa Energy Outlook; International Energy Agency: Paris, France, July 2019. [Google Scholar]
- Houghton, R.A.; Hall, F.; Goetz, S.J. Importance of biomass in the global carbon cycle. J. Geophys. Res. Biogeosci. 2009, 114, G00E03. [Google Scholar] [CrossRef]
- Pearson, T.R.H.; Brown, S.; Murray, L.; Sidman, G. Greenhouse gas emissions from tropical forest degradation: An underestimated source. Carbon Balance Manag. 2017, 12, 3. [Google Scholar] [CrossRef] [PubMed] [Green Version]
- Bullock, E.L.; Woodcock, C.E.; Olofsson, P. Monitoring tropical forest degradation using spectral unmixing and Landsat time series analysis. Remote Sens. Environ. 2020, 238, 110968. [Google Scholar] [CrossRef]
- Zulu, L.C.; Richardson, R.B. Charcoal, livelihoods, and poverty reduction: Evidence from sub-Saharan Africa. Energy Sustain. Dev. 2013, 17, 127–137. [Google Scholar] [CrossRef]
- UN-Habitat. The State of African Cities: Re-Imagining Sustainable Urban Transitions; UN-Habitat: Nairobi, Kenya, 2014. [Google Scholar]
- Grimm, N.B.; Faeth, S.H.; Golubiewski, N.E.; Redman, C.L.; Wu, J.; Bai, X.; Briggs, J.M. Global change and the ecology of cities. Science 2008, 319, 756–760. [Google Scholar] [CrossRef] [Green Version]
- Grant, R. Africa: Geographies of Change; Grant, R., Ed.; Oxford University Press: Oxford, UK, 2015; p. 356. [Google Scholar]
- Eckholm, E.P. The Other Energy Crisis, Firewood; World Watch Institute: Washington, DC, USA, 1975. [Google Scholar]
- Anderson, D.; Fishwick, R. Fuelwood Consumption and Deforestation in African Countries; Staff Working Paper 704; World Bank: Washington, DC, USA, 1984. [Google Scholar]
- Mearns, R. Beyond the Woodfuel Crisis: People, Land and Trees in Africa. In Development Perspectives for the 1990s; Prendergast, R., Singer, H.W., Eds.; Palgrave Macmillan: London, UK, 1991. [Google Scholar]
- Cline-Cole, R. Knowledge claims and landscape: Alternative views of the fuelwood—Degradation nexus in northern Nigeria? Environ. Plan. D Soc. Space 1998, 16, 311–346. [Google Scholar] [CrossRef]
- Ribot, J. A history of fear: Imagining deforestation in the West African dryland forests. Glob. Ecol. Biogeogr. 1999, 8, 291–300. [Google Scholar] [CrossRef]
- Mwampamba, T.H.; Ghilardi, A.; Sander, K.; Chaix, K.J. Dispelling common misconceptions to improve attitudes and policy outlook on charcoal in developing countries. Energy Sustain. Dev. 2013, 17, 75–85. [Google Scholar] [CrossRef]
- Barnes, D.F.; Krutilla, K.; Hyde, W. The Urban Household Energy Transition: Energy, Poverty, and the Environment in the Developing World; World Bank: Washington, DC, USA, 2002. [Google Scholar]
- Arnold, M.; Köhlin, G.; Persson, R. Woodfuels, livelihoods, and policy interventions: Changing Perspectives. World Dev. 2006, 34, 596–611. [Google Scholar] [CrossRef]
- FAO. Urban and Peri-Urban Forestry in Africa: The Outlook for Woodfuel Urban and Peri-Urban Forestry Working Paper n°4; FAO: Rome, Italy, 2012; 95p. [Google Scholar]
- Schure, J.; Levang, P.; Wiersum, K.F. Producing Woodfuel for Urban Centers in the Democratic Republic of Congo: A Path Out of Poverty for Rural Households? World Dev. 2014, 64, S80–S90. [Google Scholar] [CrossRef]
- Smith, H.E.; Jones, D.; Vollmer, F.; Baumert, S.; Ryan, C.M.; Woollen, E.; Lisboa, S.N.; Carvalho, M.; Fisher, J.A.; Luz, A.C.; et al. Urban energy transitions and rural income generation: Sustainable opportunities for rural development through charcoal production. World Dev. 2019, 113, 237–245. [Google Scholar] [CrossRef]
- Pelletier, J.; Hamalambo, B.; Trainor, A.; Barrett, C.B. How land tenure and labor relations mediate charcoal’s environmental footprint in Zambia: Implications for sustainable energy transitions. World Dev. 2021, 146, 105600. [Google Scholar] [CrossRef]
- Kissinger, G.; Herold, M. Drivers of Deforestation and Forest Degradation: A Synthesis Report for REDD+Policymakers; Lexeme Consulting: Vancouver, BC, Canada, 2012. [Google Scholar]
- Chidumayo, E.N.; Gumbo, D.J. The environmental impacts of charcoal production in tropical ecosystems of the world: A synthesis. Energy Sustain. Dev. 2013, 17, 86–94. [Google Scholar] [CrossRef]
- Hosonuma, N.; Herold, M.; De Sy, V.; De Fries, R.S.; Brockhaus, M.; Verchot, L.; Angelsen, A.; Romijn, E. An assessment of deforestation and forest degradation drivers in developing countries. Environ. Res. Lett. 2012, 7, 044009. [Google Scholar] [CrossRef]
- FAO. Assessing forest degradation: Towards the development of globally applicable guidelines. In Forest Resources Assessment; FAO: Rome, Italy, 2011. [Google Scholar]
- Thompson, I.D.; Guariguata, M.R.; Okabe, K.; Bahamondez, C.; Nasi, R.; Heymell, V.; Sabogal, C. An operational framework for defining and monitoring forest degradation. Ecol. Soc. 2013, 18, 20. [Google Scholar] [CrossRef]
- Bailis, B.; Drigo, R.; Ghilardi, A.; Masera, O. The carbon footprint of traditional woodfuels. Nat. Clim. Change 2015, 5, 266–272. [Google Scholar] [CrossRef]
- Sedano, F.; Lisboa, S.N.; Duncanson, L.; Ribeiro, N.; Sitoe, A.; Sahajpal, R.; Hurtt, G.; Tucker, C.J. The connection between forest degradation and urban energy demand in sub-Saharan Africa: A characterization based on high-resolution remote sensing data. Environ. Res. Lett. 2021, 16, 064020. [Google Scholar] [CrossRef]
- Sedano, F.; Silva, J.A.; Machoco, R.; Meque, C.H.; Sitoe, A.; Ribeiro, N.; Anderson, K.; Ombe, Z.A.; Baule, S.H.; Tucker, C.J. The impact of charcoal production on forest degradation: A case study in Tete, Mozambique. Environ. Res. Lett. 2016, 11, 094020. [Google Scholar] [CrossRef]
- Sedano, F.; Lisboa, S.N.; Duncanson, L.; Ribeiro, N.; Sitoe, A.; Sahajpal, R.; Hurtt, G.; Tucker, C.J. Monitoring Forest degradation from charcoal production with historical Landsat imagery. A case study in southern Mozambique. Environ. Res. Lett. 2020, 15, 015001. [Google Scholar]
- Bolognesi, M.; Vrieling, A.; Rembold, F.; Gadain, H. Rapid mapping and impact estimation of illegal charcoal production in southern Somalia based on WorldView-1 imagery. Energy Sustain. Dev. 2015, 25, 40–49. [Google Scholar] [CrossRef]
- Dons, K.; Smith-Hall, C.; Meilby, H.; Fensholt, R. Operationalizing measurement of forest degradation: Identification and quantification of charcoal production in tropical dry forests using very high resolution satellite imagery. Int. J. Appl. Earth Obs. Geoinf. 2015, 39, 18–27. [Google Scholar] [CrossRef]
- Sedano, F.; Lisboa, S.N.; Duncanson, L.; Ribeiro, N.; Sitoe, A.; Sahajpal, R.; Hurtt, G.; Tucker, C.J. Monitoring intra and inter annual dynamics of forest degradation from charcoal production in Southern Africa with Sentinel—2 imagery. Int. J. Appl. Earth Obs. Geoinf. 2020, 92, 102184. [Google Scholar] [CrossRef]
- Frost, P. The Ecology of Miombo Woodlands in Book the Miombo in Transition: Woodlands and Welfare in Africa, 1st ed.; Campbell, B., Ed.; Center for International Forestry Research: Bogor, Indonesia, 1996; pp. 11–58. [Google Scholar]
- Hansen, M.C.; Potapov, P.V.; Moore, R.; Hancher, M.; Turubanova, S.A.; Tyukavina, A.; Thau, D.; Stehman, S.V.; Goetz, S.J.; Loveland, T.R.; et al. High-resolution global maps of 21st-century forest cover change. Science 2013, 342, 850–853. [Google Scholar] [CrossRef] [Green Version]
- Zambia Statistics Agency; Ministry of Health (MOH) Zambia; ICF. Zambia Demographic and Health Survey; Zambia Statistics Agency: Lusaka, Zambia; Ministry of Health: Maputo, Mozambique; ICF: Amsterdam, The Netherlands, 2019.
- FAO. Global Forest Resources Assessment Main Report; FAO: Rome, Italy, 2020. [Google Scholar]
- IFAD. Country Strategic Opportunities Programme; Republic of Zambia; International Fund for Agricultural Development: Rome, Italy, 2011. [Google Scholar]
- Martins, M.; Atanassov, B.; Mirira, R. Produção Sustentável de Carvão Vegetal. In Teoria e Prática na Definição, Implementação e Avaliação de Formas de Terra Melhorados IBEK, no Distrito de MABALANE—Província de Gaza; Província de Gaza: Maputo, Mozambique, 2016. [Google Scholar]
- Carsan, S.; Orwa, C.; Harwood, C.; Kindt, R.; Stroebe, L.A.; Neufeldt, H.; Jamnadass, R. African Wood Density Database; World Agroforestry Centre: Nairobi, Kenya, 2012. [Google Scholar]
- Breiman, L.; Friedman, J.H.; Olshen, R.A.; Stone, C.J. Classification and Regression Trees; Wadsworth & Brooks/Cole Advanced Books & Software: Monterey, CA, USA, 1984. [Google Scholar]
- Richards, J.A.; Jia, X. An Introduction. Remote Sensing Digital Image Analysis; Springer: Berlin/Heidelberg, Germany, 2006. [Google Scholar]
- United Nations, Department of Economic and Social Affairs, Population Division. World Population Prospects 2019: Highlights (ST/ESA/SER.A/423); United Nations, Department of Economic and Social Affairs, Population Division: New York, NY, USA, 2019. [Google Scholar]
- Environmental Institute, Energy and Development Group. Charcoal Potential in Southern Africa (CHAPOSA) Stockholm; Environmental Institute, Energy and Development Group: Stockholm, Sweden, 2012; pp. 1–88. [Google Scholar]
- Chidumayo, E.N. Is charcoal production in Brachystegia-Julbernardia woodlands of Zambia sustainable? Biomass Bioenergy 2019, 125, 1–7. [Google Scholar] [CrossRef]
- Curtis, P.G.; Slay, C.M.; Harris, N.L.; Tyukavina, A.; Hansen, M.C. Classifying drivers of global forest loss. Science 2018, 361, 1108–1111. [Google Scholar] [CrossRef] [PubMed]
- Chidumayo, E.N. Zambian Charcoal Production. Energy Policy 1993, 21, 586–597. [Google Scholar] [CrossRef]
- Ahrends, A.; Burgess, N.D.; Milledge, S.A.H.; Bulling, M.T.; Fisher, B.; Smart, J.C.R.; Clarke, G.P.; Mhoro, B.E.; Lewis, S.L. Predictable waves of sequential forest degradation and biodiversity loss spreading from an African city. Proc. Natl Acad. Sci. USA 2010, 107, 14556–14561. [Google Scholar] [CrossRef] [Green Version]
- Arnold, J.E.M.; Kohlin, G.; Persson, R.; Shepherd, G. Fuelwood Revisited: What Has Changed in the Last Decade? CIFOR Occasional Paper No.39; CIFOR: Bogor, Indonesia, 2003; 35p. [Google Scholar]
- Mulenga, B.P.; Hadunka, P.; Ricardson, R.B. Rural households’ participation in charcoal production in Zambia: Does agricultural productivity play a role? J. For. Econ. 2017, 26, 56–62. [Google Scholar] [CrossRef]
- Vinya, R.; Syampungasi, S.; Kasumu, E.C.; Monde, C.; Kasubika, R. Preliminary Study on the Drivers of Deforestation and Potential for REDD+ in Zambia; A consultancy report prepared for the Forestry Department and FAO under the national UN-REDD+ Programme Ministry of Lands & Natural Resources; FAO/Zambian Ministry of Lands and Natural Resources: Lusaka, Zambia, 2011.
- Bailis, R.; Wang, Y.; Drigo, R.; Ghilardi, A.; Masera, O. Getting the numbers right: Revisiting woodfuel sustainability in the developing world. Environ. Res. Lett. 2017, 12, 115002. [Google Scholar] [CrossRef]
Figure 1.
Location map of forest reserves of Zambia.

Figure 2.
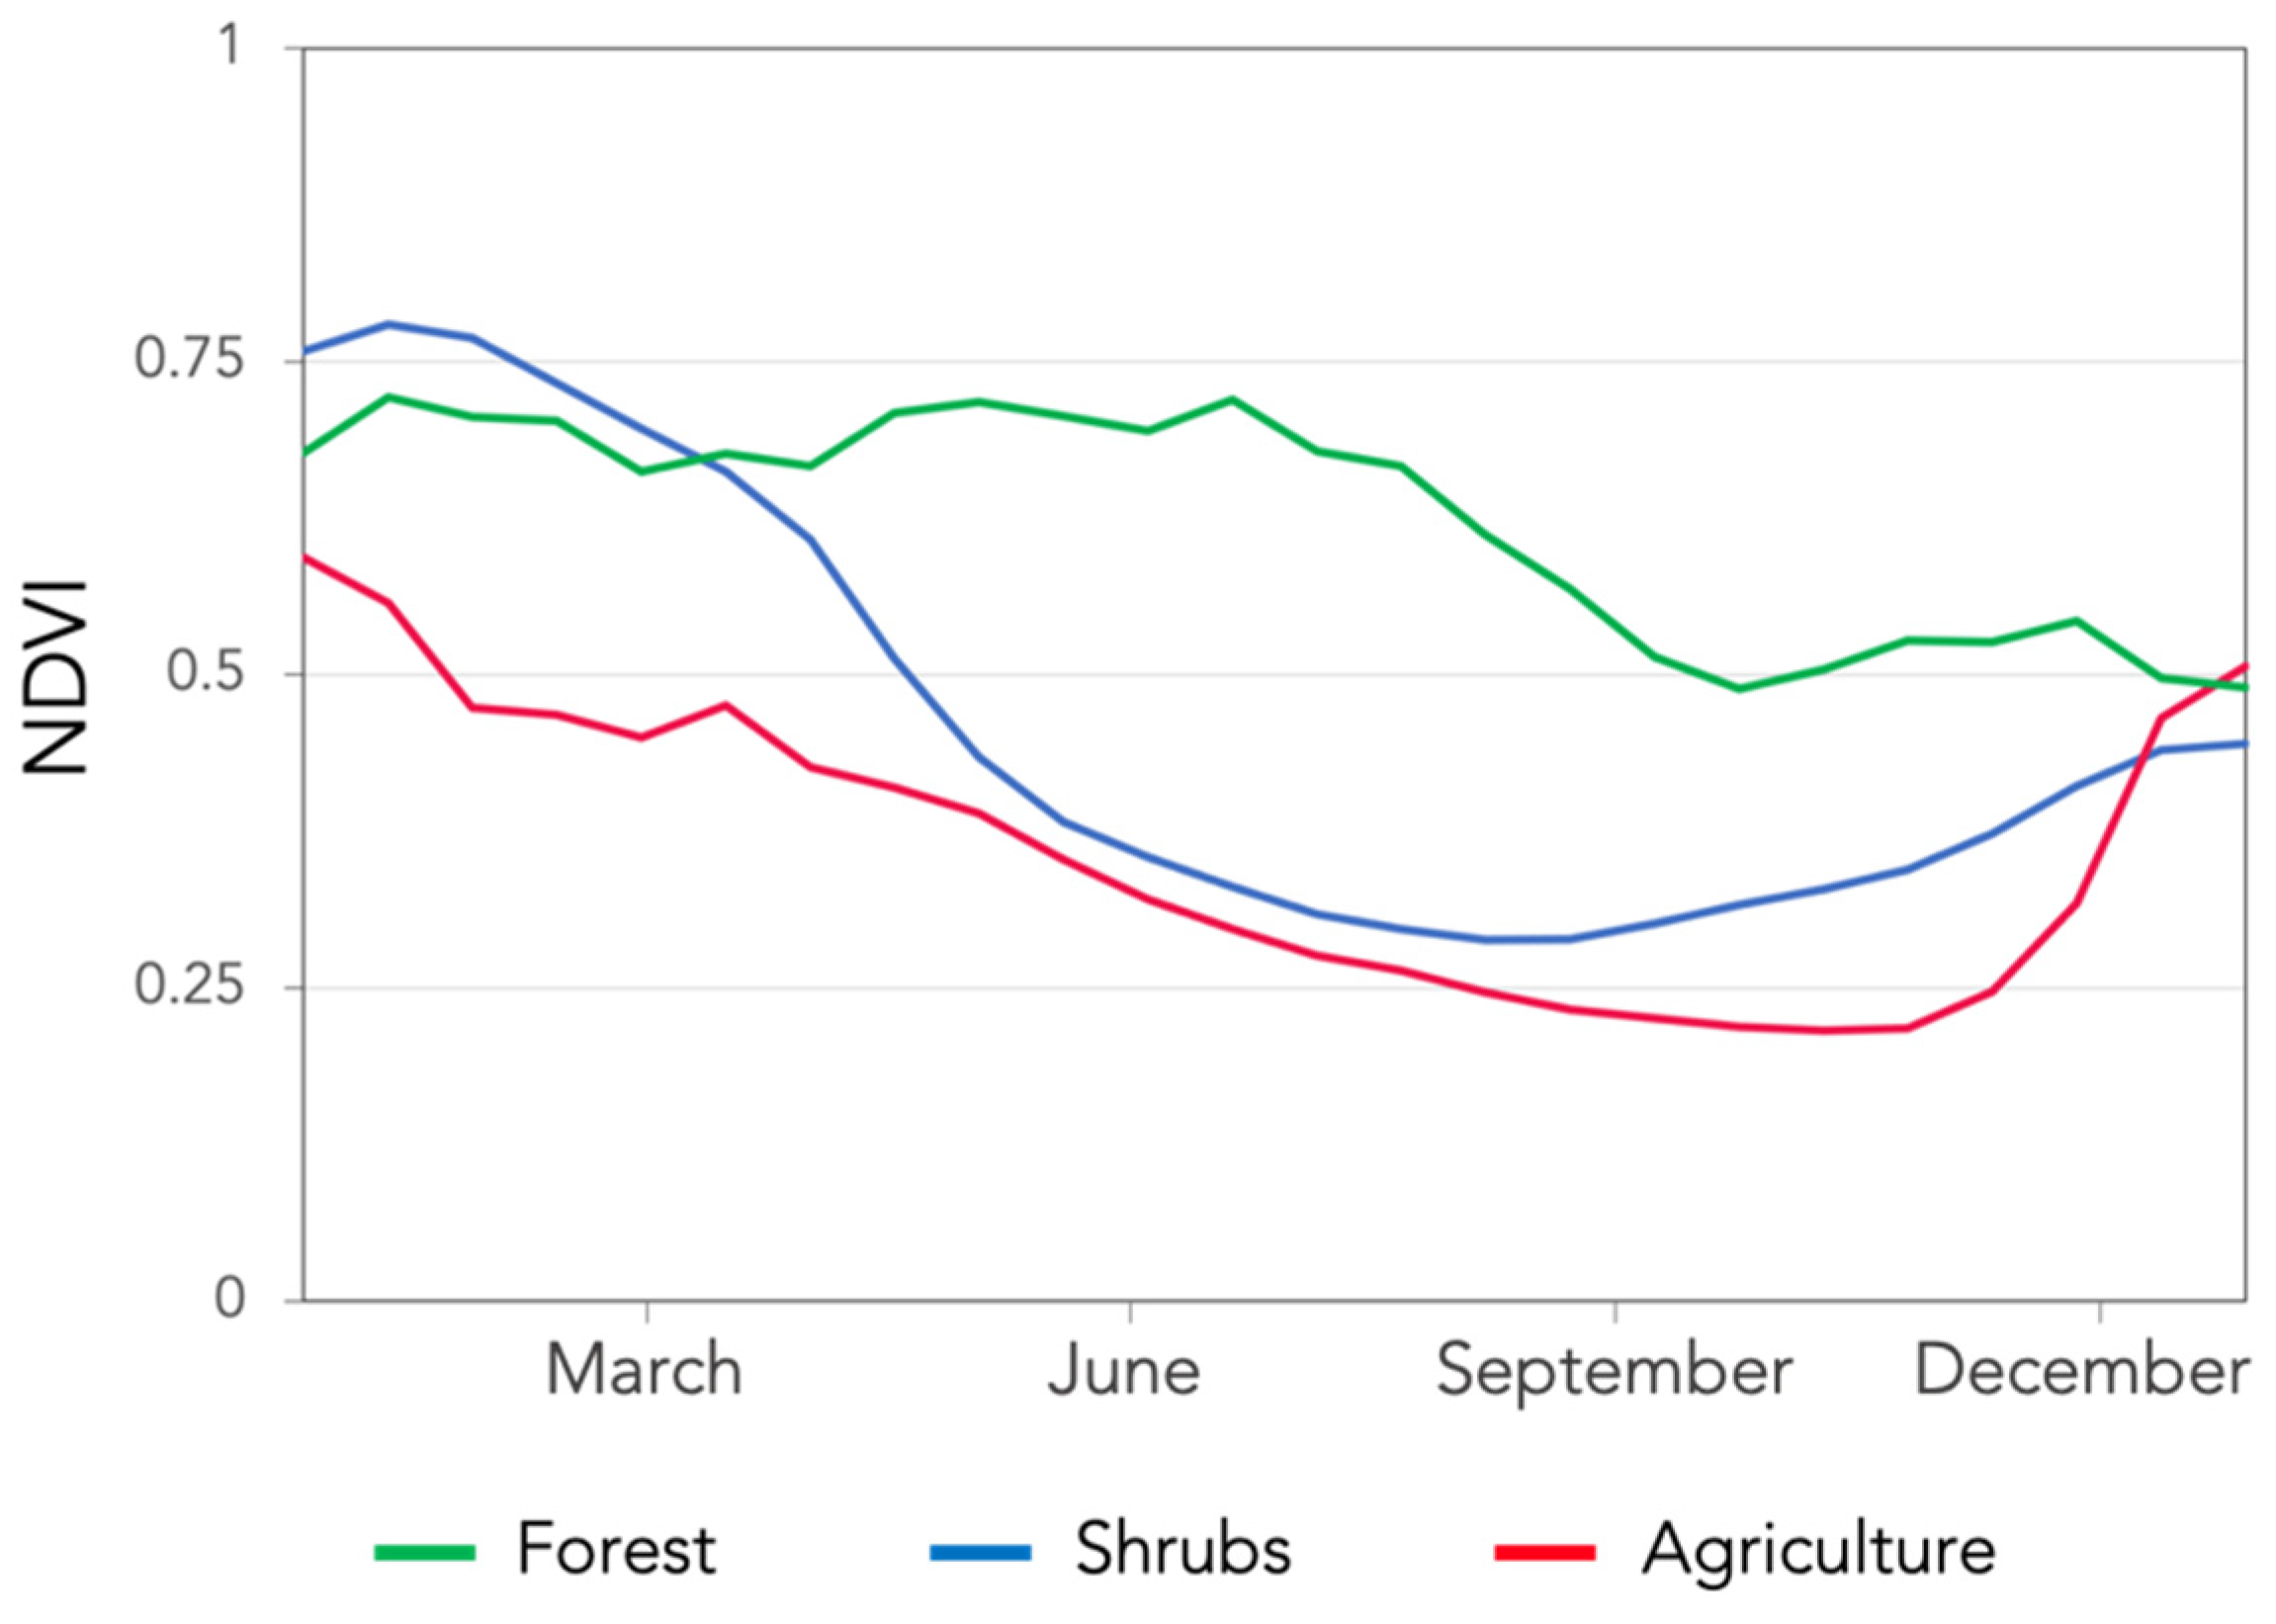
Seasonal NDVI profiles for main land cover land use classes in forest reserves. Forest NDVI profile shows a gradual decline as the dry season progresses. The values of the shrub NDVI profiles present a greater drop during the dry season. The agricultural NDVI profile shows a prolonged decline starting from harvest and the dry season, followed by a rapid recovery with the onset of the rains. The September–November acquisition window maximizes the spectral separability between the three classes.
Figure 2.
Seasonal NDVI profiles for main land cover land use classes in forest reserves. Forest NDVI profile shows a gradual decline as the dry season progresses. The values of the shrub NDVI profiles present a greater drop during the dry season. The agricultural NDVI profile shows a prolonged decline starting from harvest and the dry season, followed by a rapid recovery with the onset of the rains. The September–November acquisition window maximizes the spectral separability between the three classes.

Figure 3.
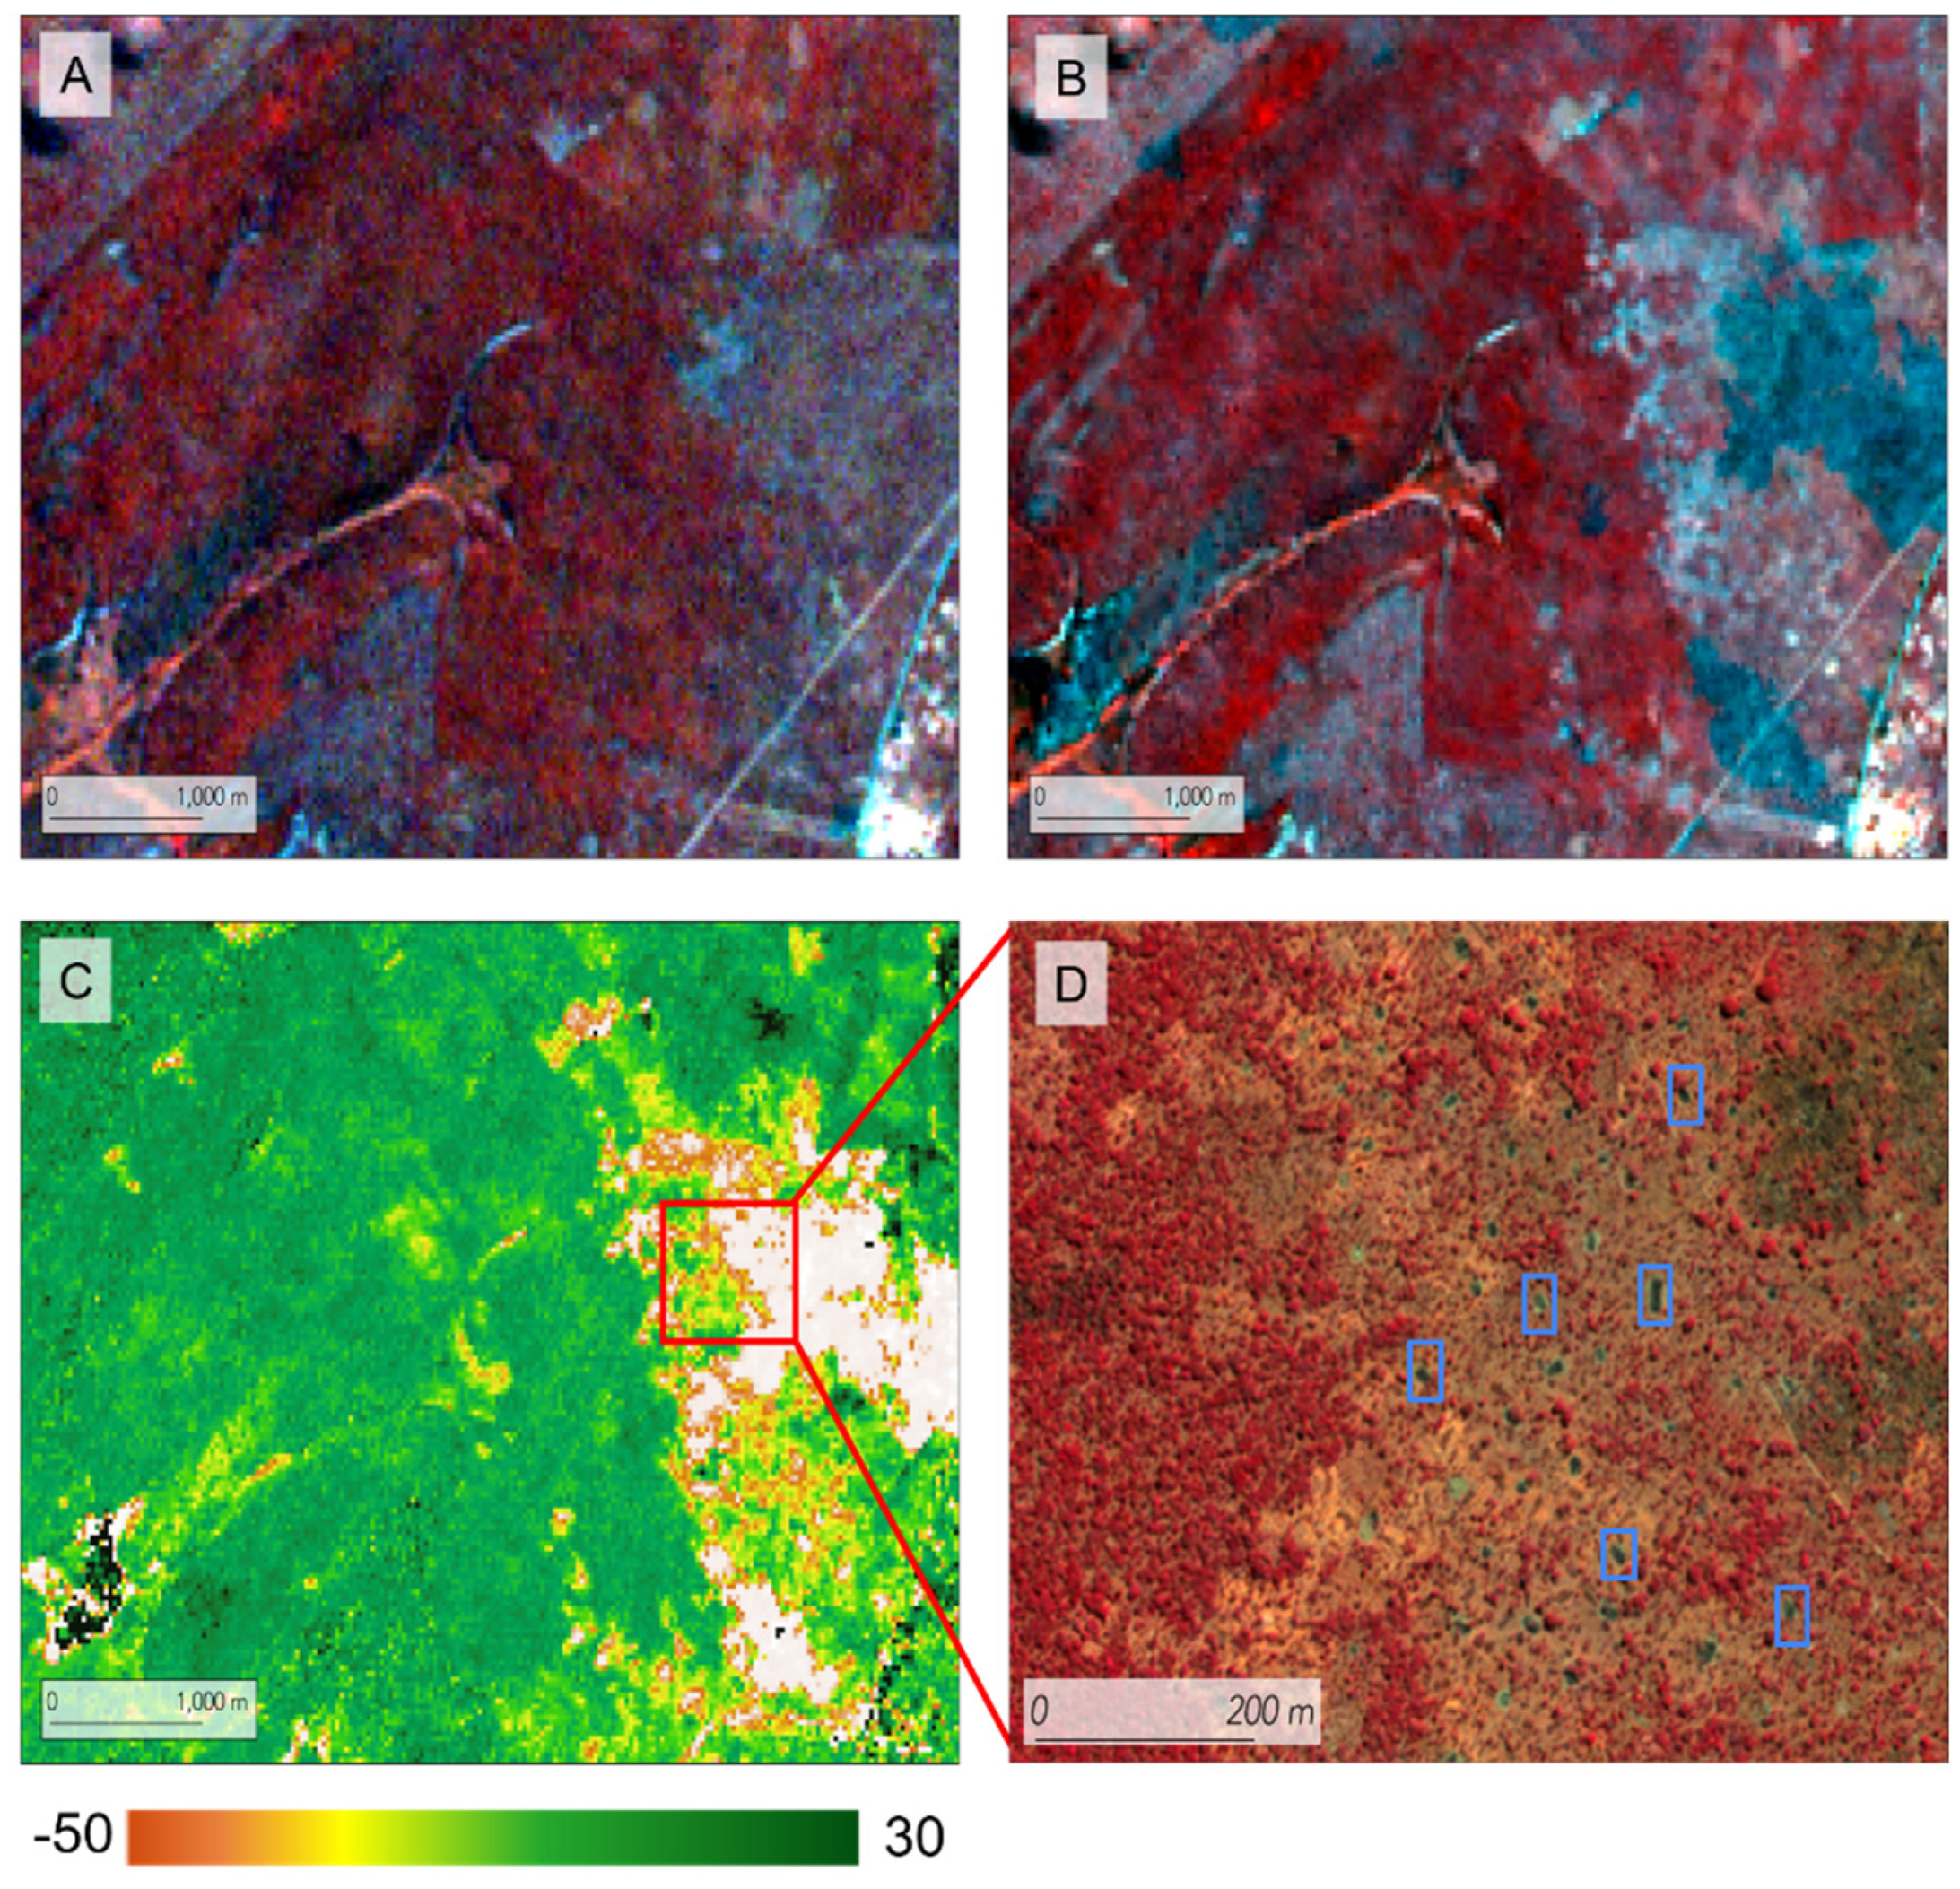
(A) Landsat 8 false-color composition (1,2,5) for the year 2018 in the Mkushi forest reserve; (B) Landsat 8 false-color composition (1,2,5) for the year 2019; (C) normalized difference of NDVI images from consecutive years; (D) detailed false-color composition view (1,2,4) of a WorldView-2 image (2 m spatial resolution) displaying kiln scars. Some kiln scars are marked (blue rectangles) as a visual reference.
Figure 3.
(A) Landsat 8 false-color composition (1,2,5) for the year 2018 in the Mkushi forest reserve; (B) Landsat 8 false-color composition (1,2,5) for the year 2019; (C) normalized difference of NDVI images from consecutive years; (D) detailed false-color composition view (1,2,4) of a WorldView-2 image (2 m spatial resolution) displaying kiln scars. Some kiln scars are marked (blue rectangles) as a visual reference.

Figure 4.
Evolution of annual forest degradation extent in Kapiri Mposhi forest reserve from 2001 to 2020 based on change analysis of multitemporal Landsat 5 and 8 imagery.
Figure 4.
Evolution of annual forest degradation extent in Kapiri Mposhi forest reserve from 2001 to 2020 based on change analysis of multitemporal Landsat 5 and 8 imagery.

Figure 5.
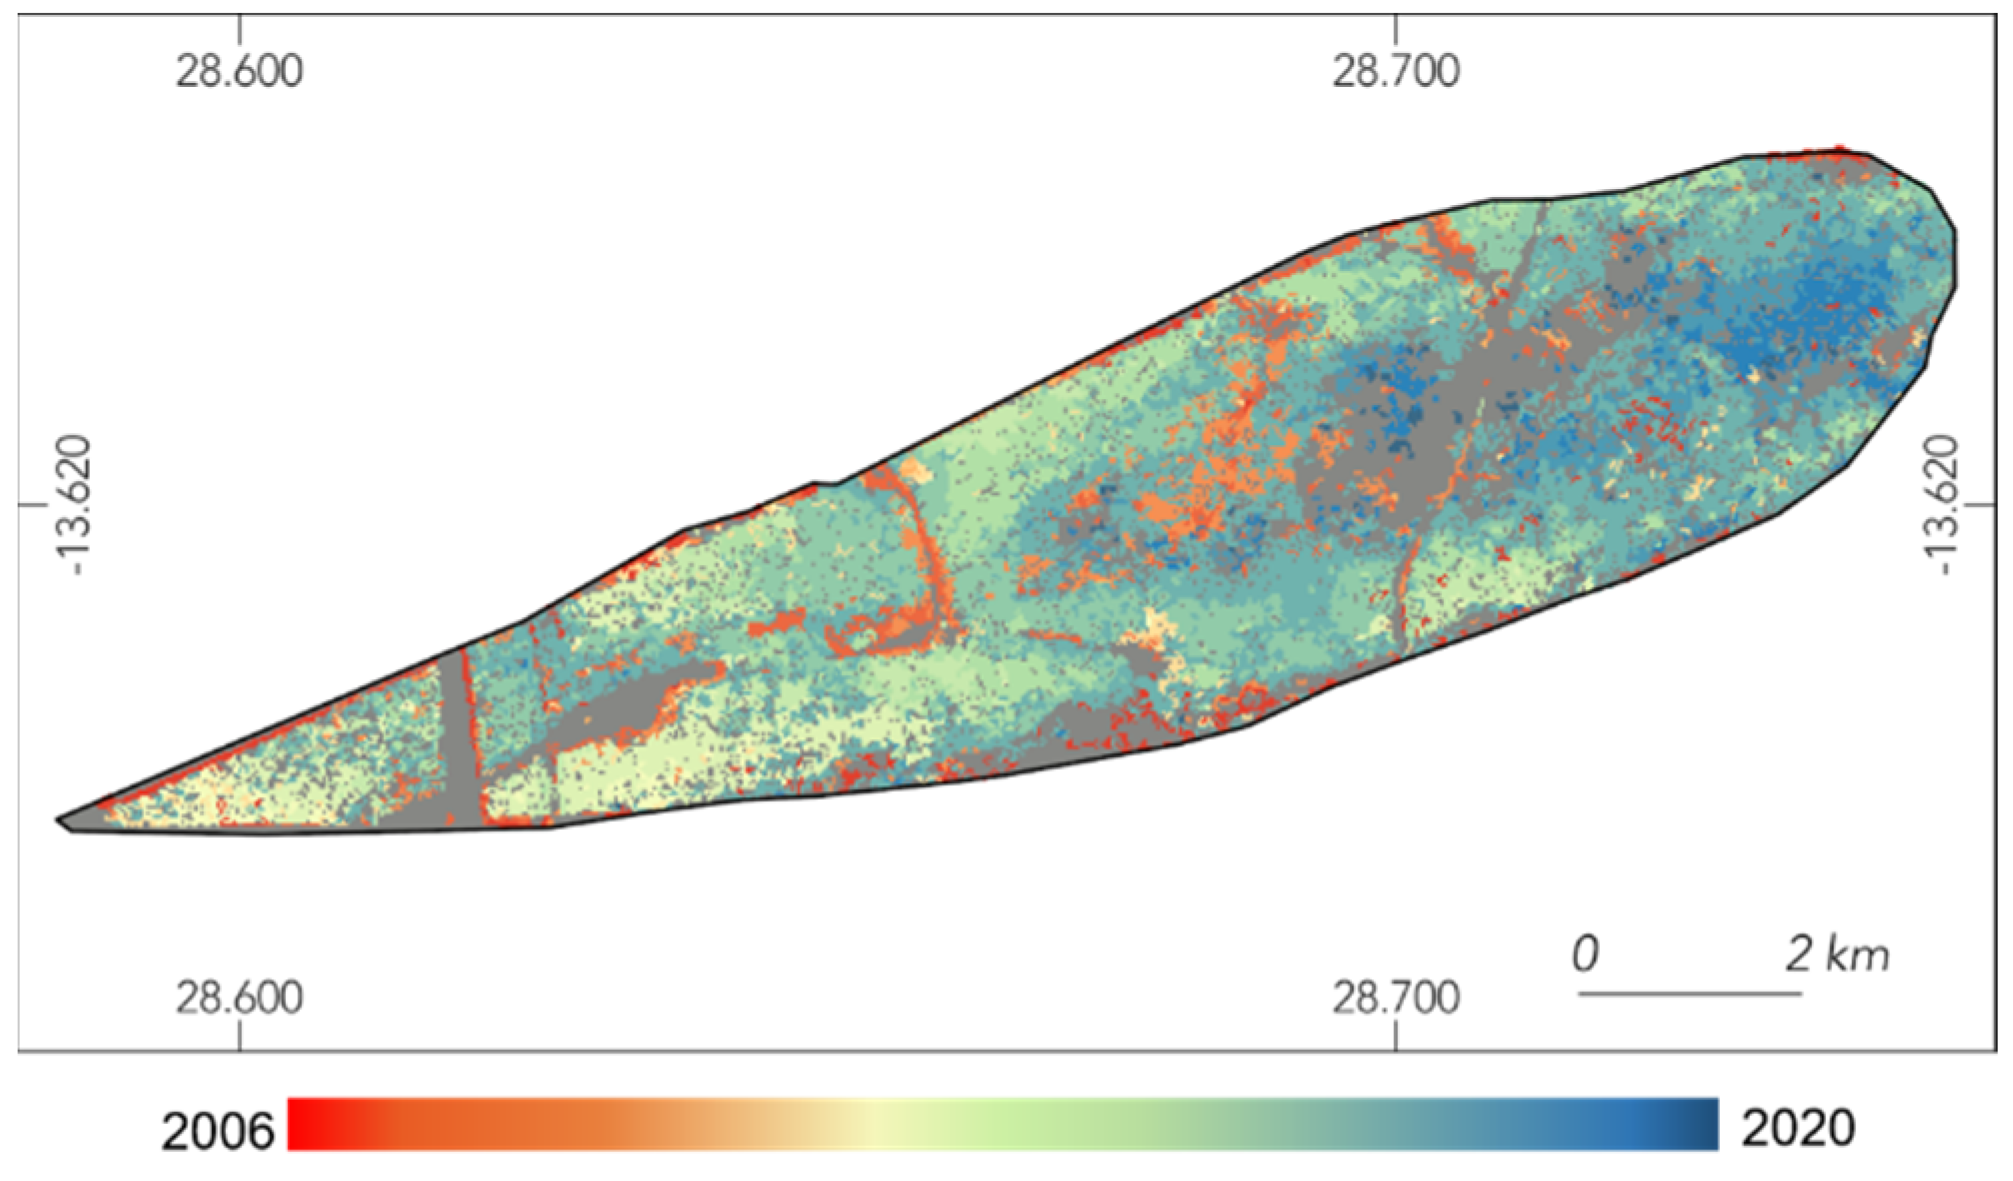
Evolution of annual forest degradation extent in Katarino forest reserve from 2006 to 2020 based on change analysis of multitemporal Landsat 5 and 8 imagery. Grey areas represent remaining tree cover.
Figure 5.
Evolution of annual forest degradation extent in Katarino forest reserve from 2006 to 2020 based on change analysis of multitemporal Landsat 5 and 8 imagery. Grey areas represent remaining tree cover.

Figure 6.
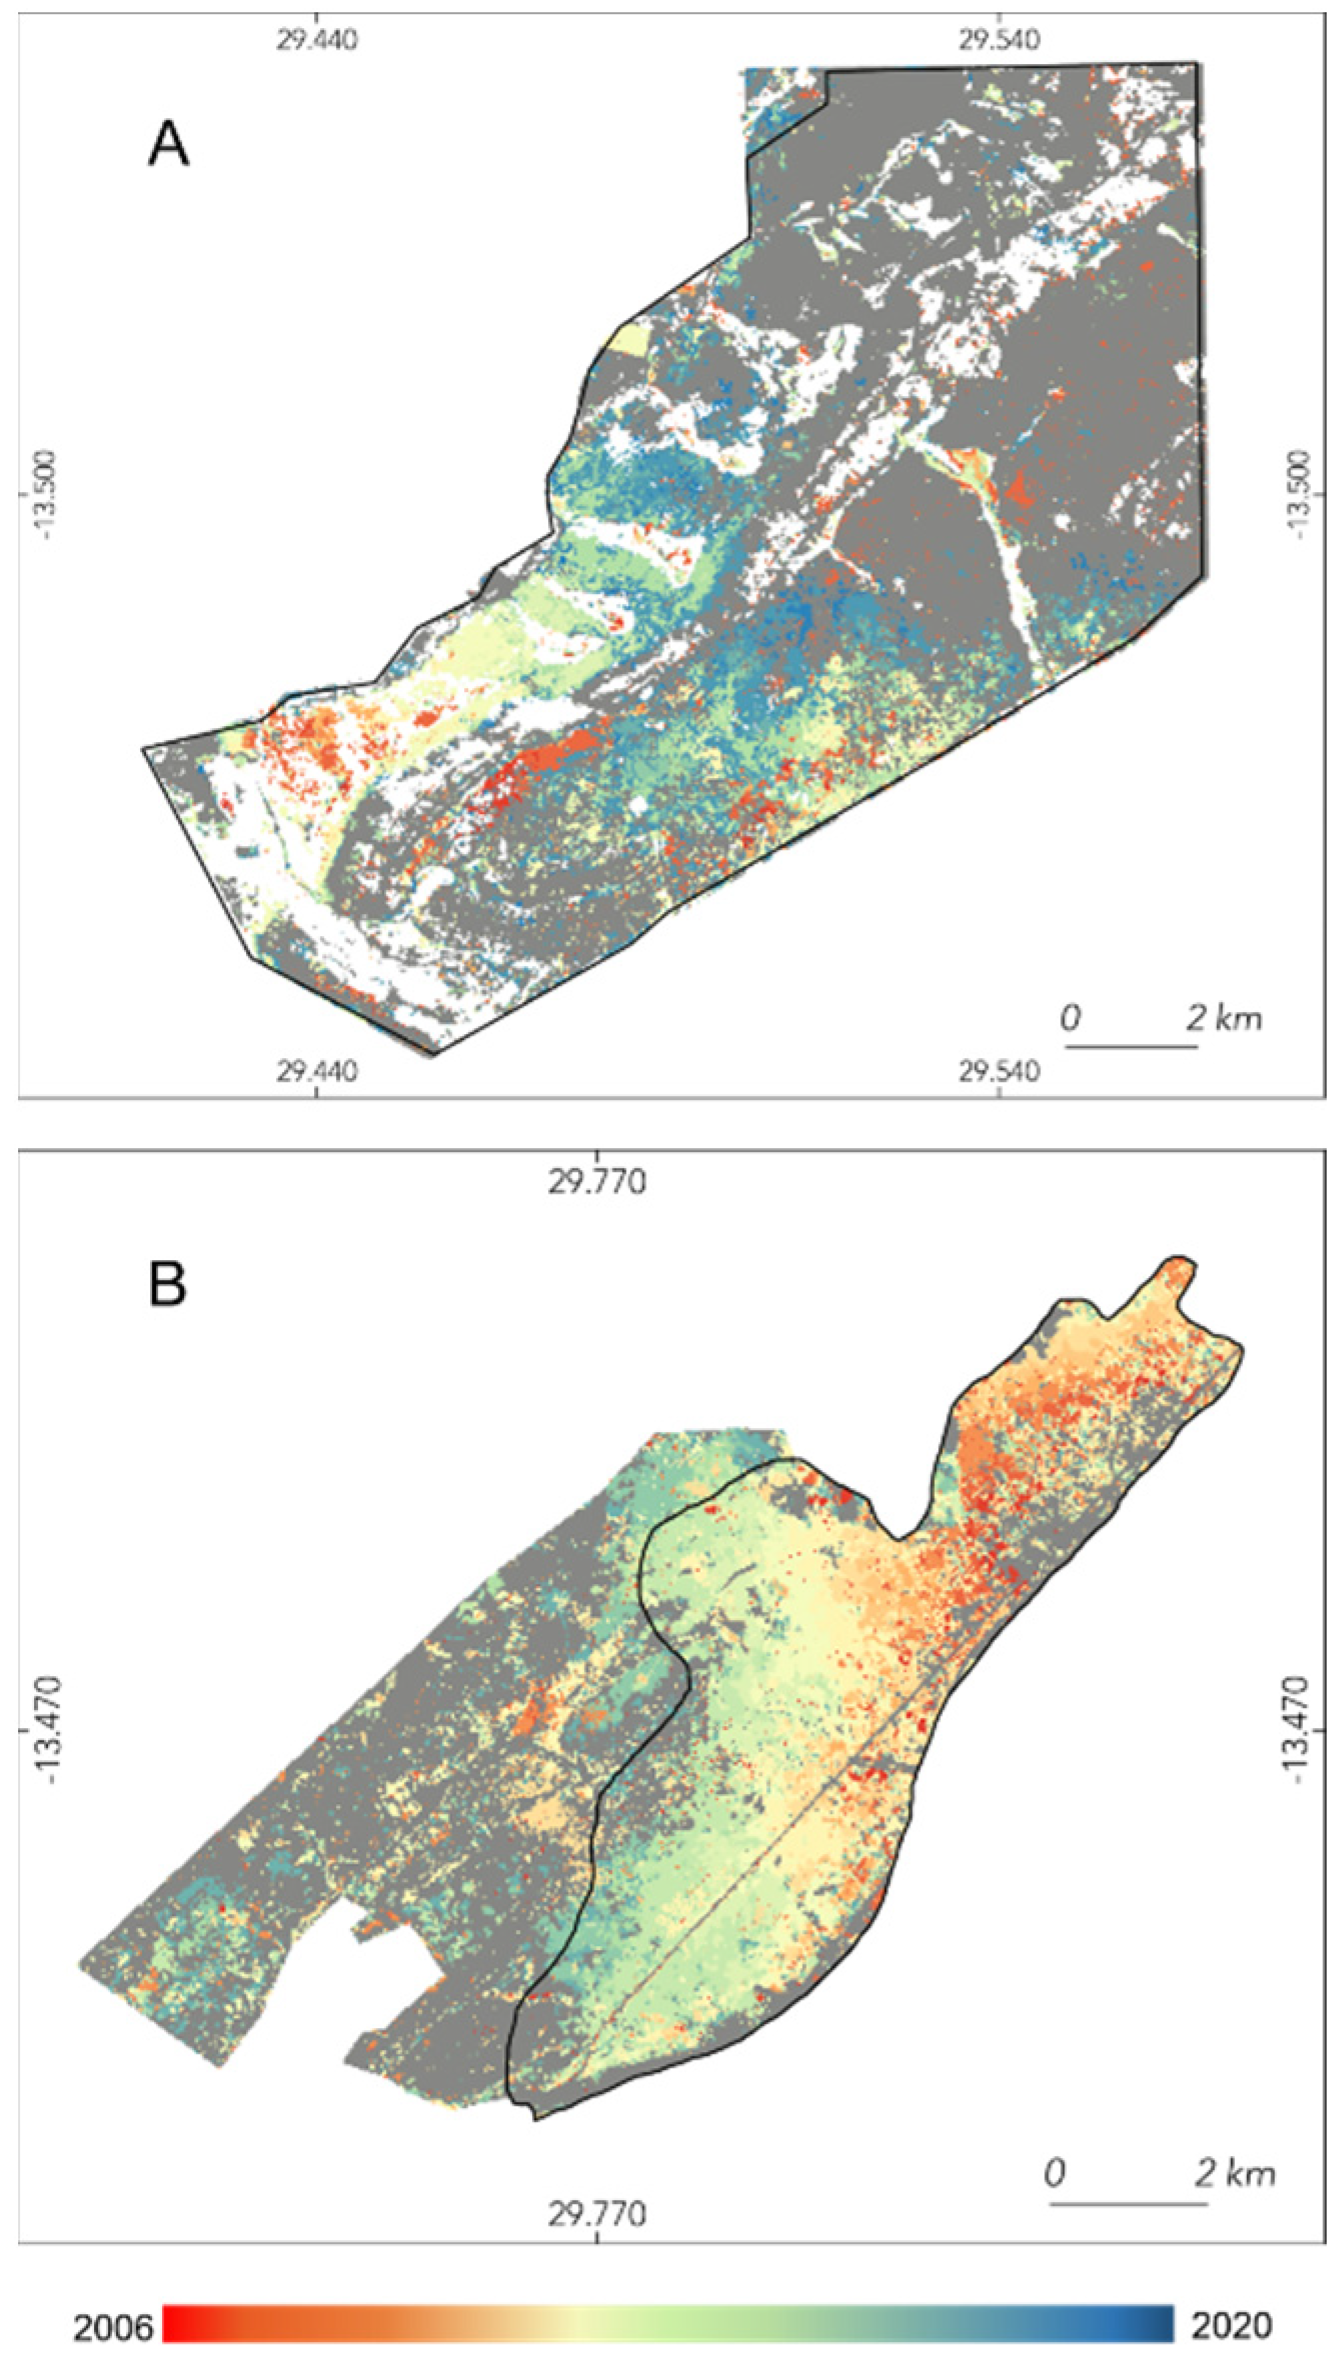
Evolution of annual forest degradation extent in Mkushi forest reserve from 2006 to 2020 based on change analysis of multitemporal Landsat 5 and 8 imagery. (A) Sector 1; (B) Sector 2. Grey areas represent remaining tree cover.
Figure 6.
Evolution of annual forest degradation extent in Mkushi forest reserve from 2006 to 2020 based on change analysis of multitemporal Landsat 5 and 8 imagery. (A) Sector 1; (B) Sector 2. Grey areas represent remaining tree cover.

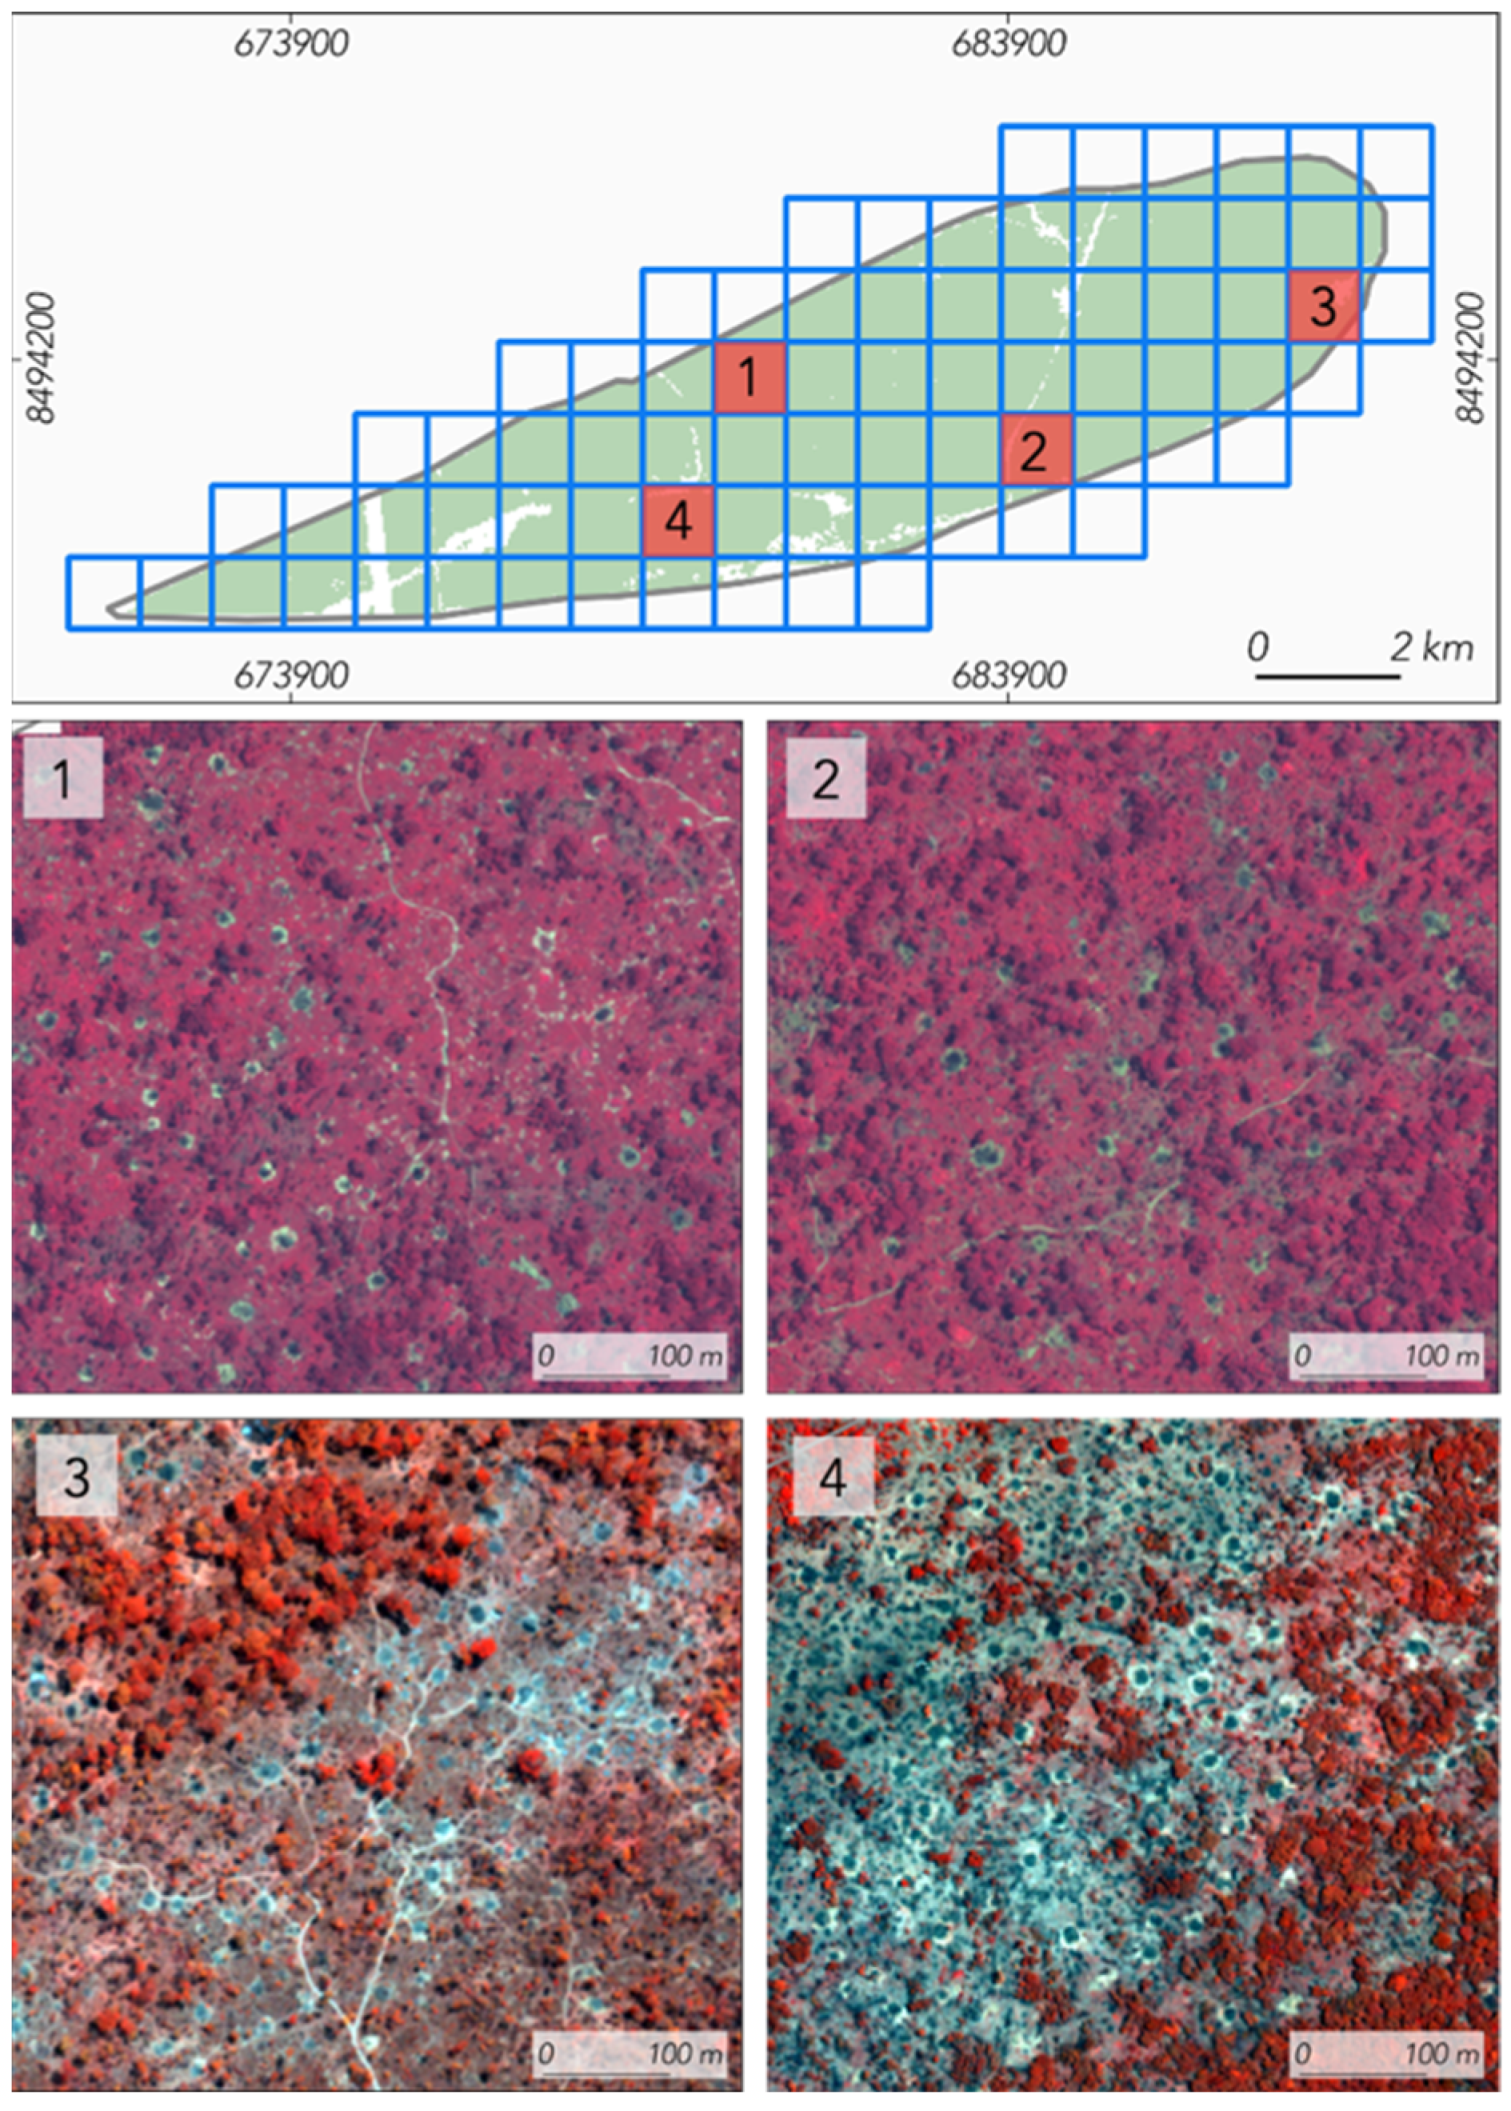
Figure 7.
Forest degradation process in four randomly selected grid cells (1 × 1 km) in the Katarino forest reserve. Evidence of kiln scars in grid cells serves to attribute forest degradation to charcoal production. False-color composition (1,2,4).
Figure 7.
Forest degradation process in four randomly selected grid cells (1 × 1 km) in the Katarino forest reserve. Evidence of kiln scars in grid cells serves to attribute forest degradation to charcoal production. False-color composition (1,2,4).

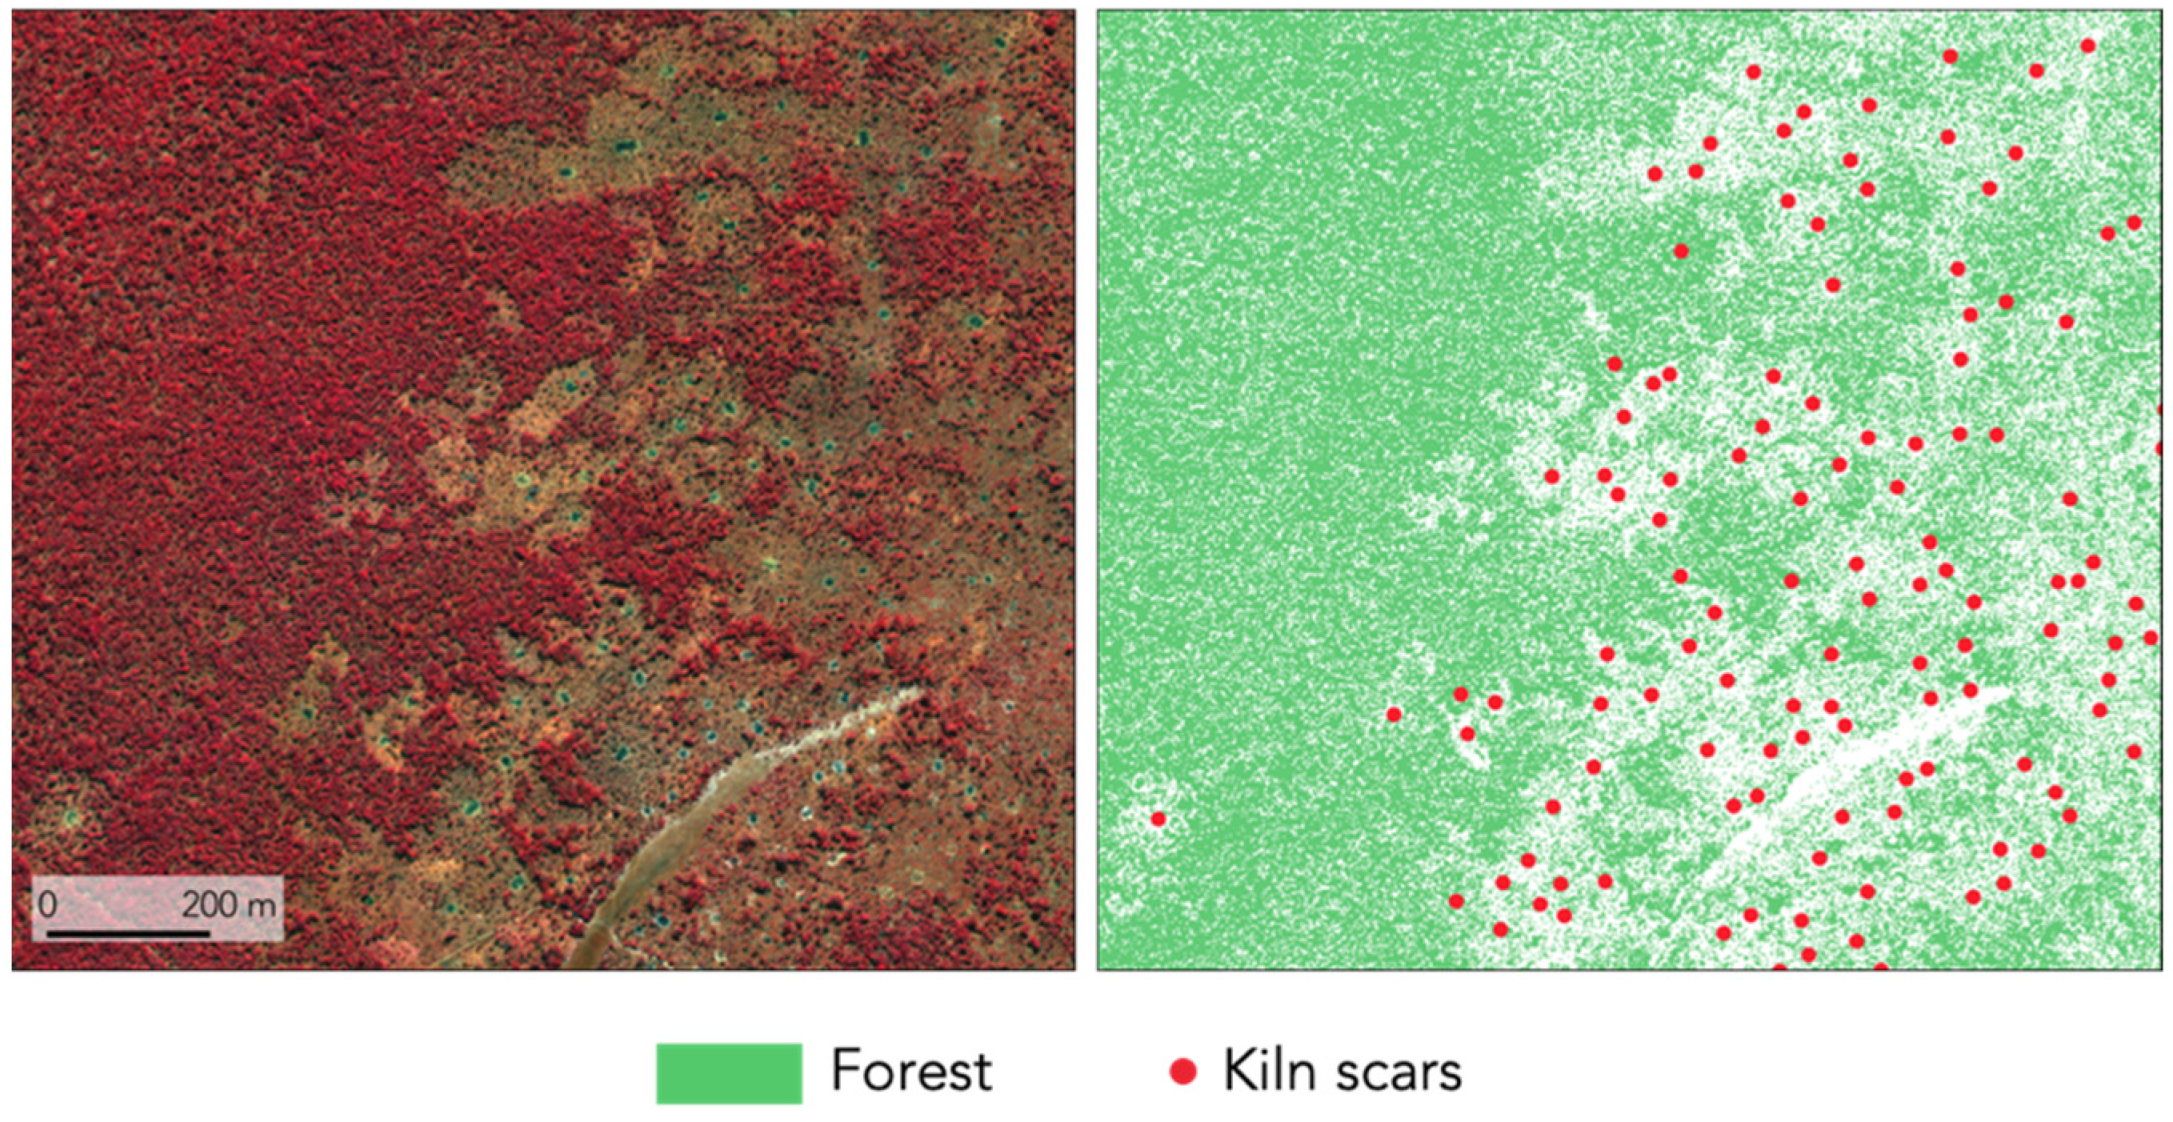
Figure 8.
Kiln scars automatically mapped from high-resolution images in Mkushi forest reserve. Left side panel: False-color composition (1,2,4) of WorldView-2 image (year 2016); right side panel: visualization of tree cover and kiln scars.
Figure 8.
Kiln scars automatically mapped from high-resolution images in Mkushi forest reserve. Left side panel: False-color composition (1,2,4) of WorldView-2 image (year 2016); right side panel: visualization of tree cover and kiln scars.

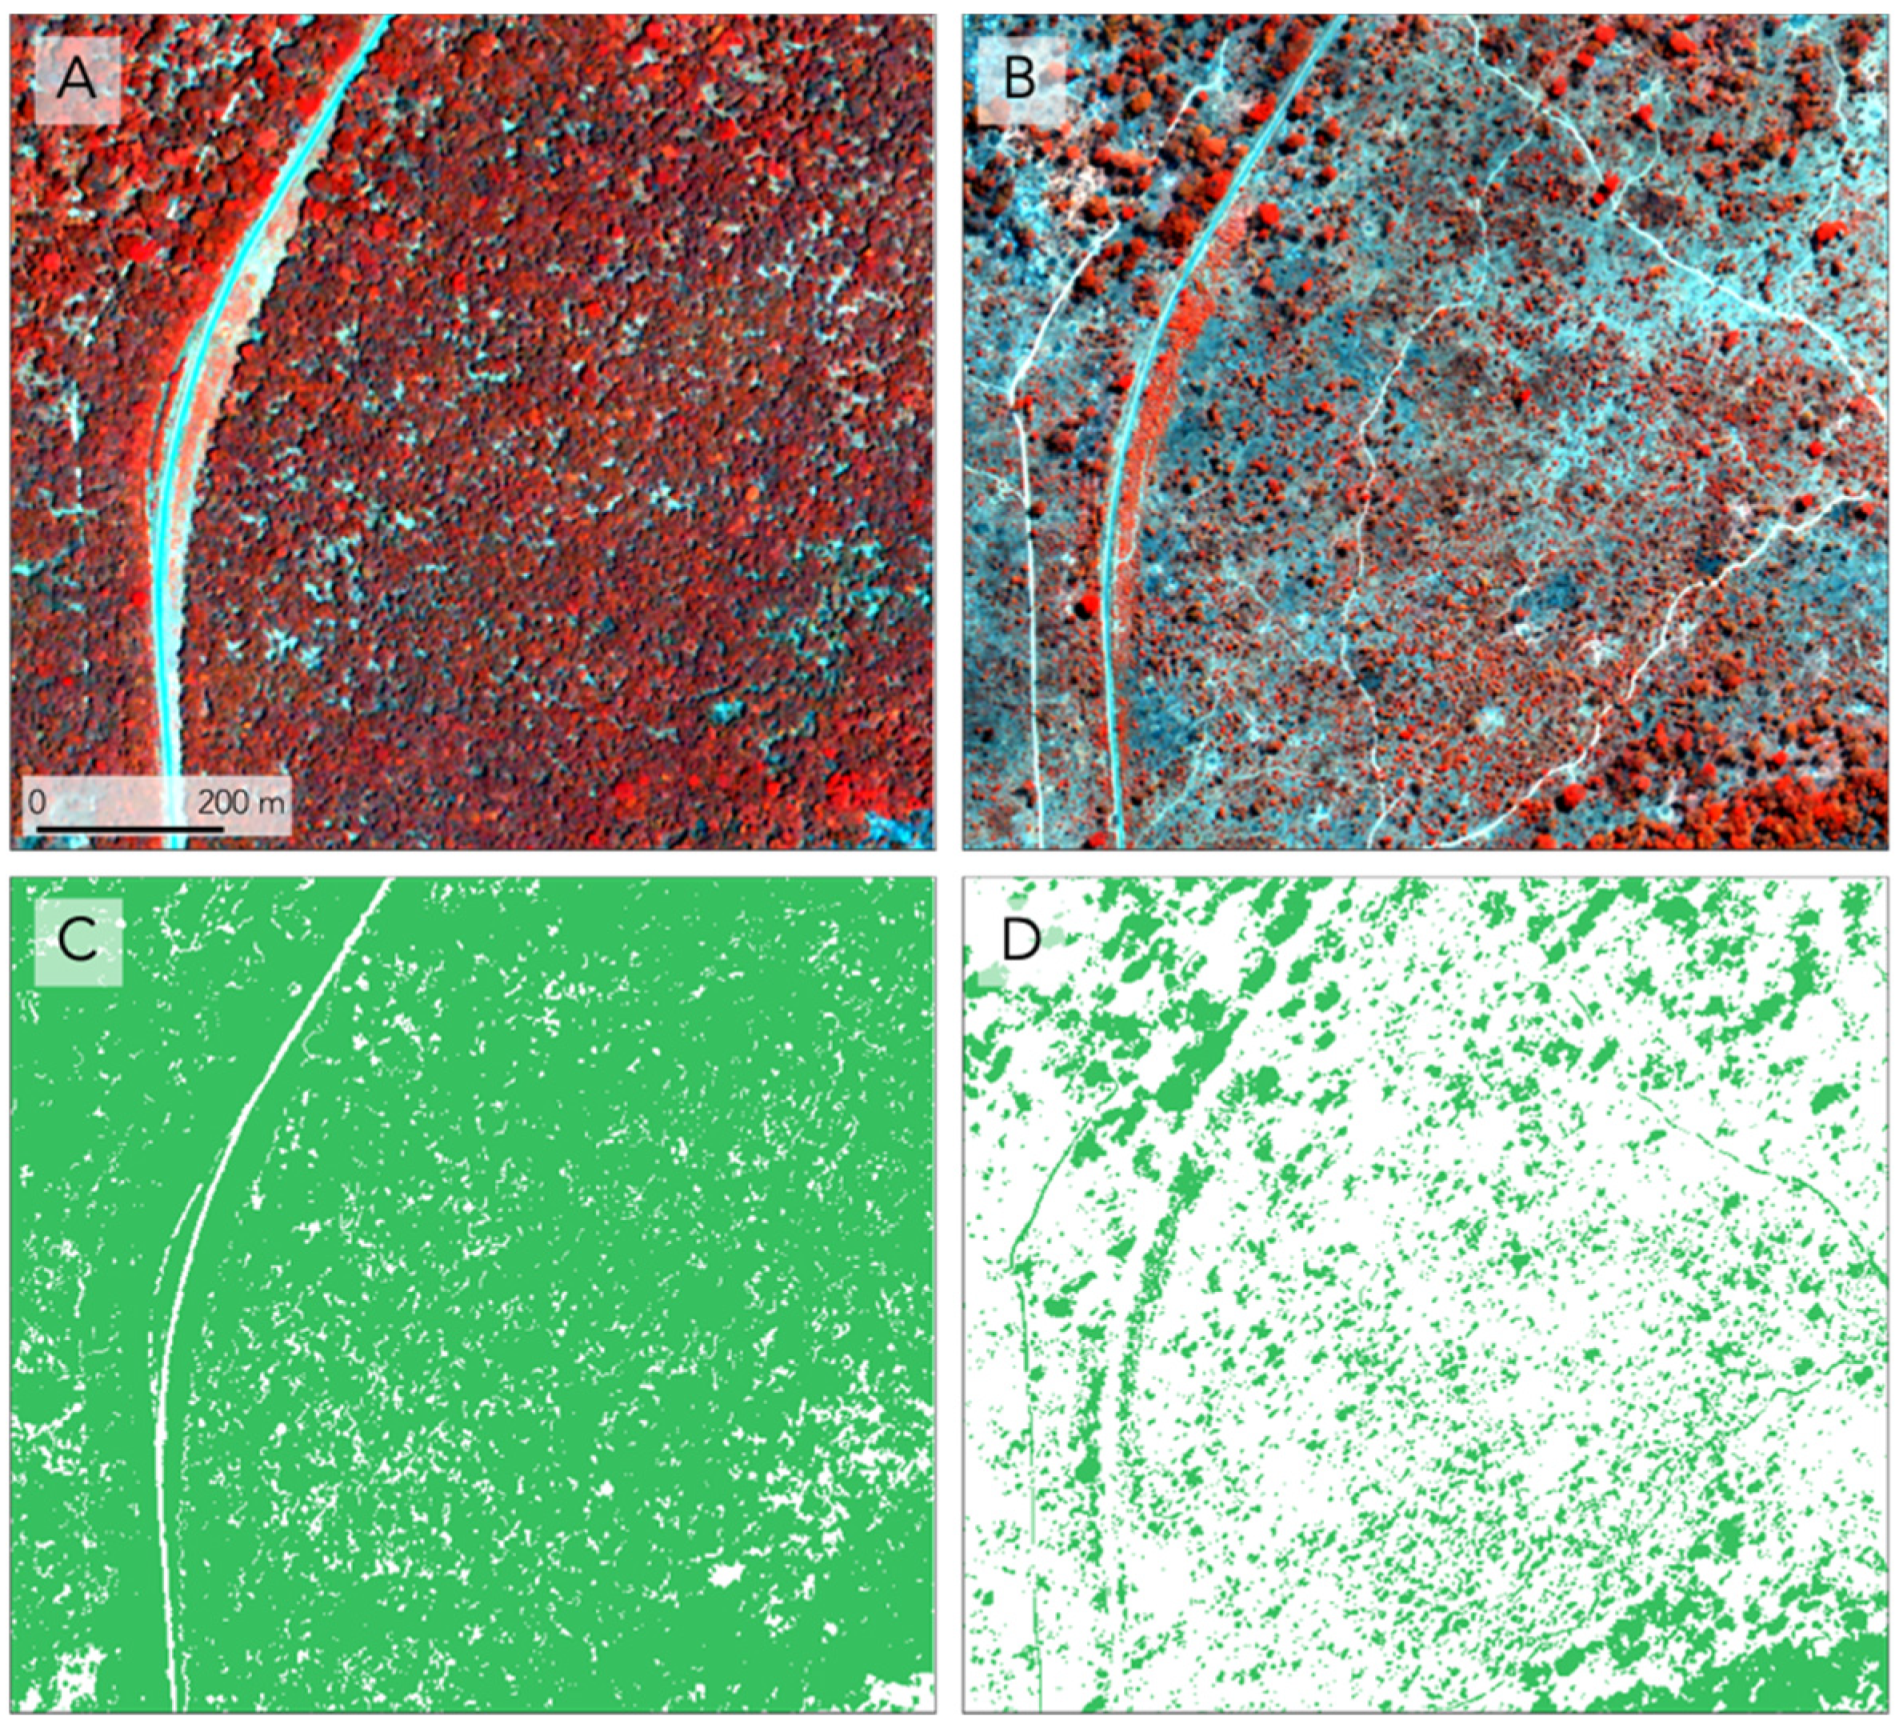
Figure 9.
Detailed view of tree cover changes before and after charcoal production for two grid cells (1 × 1 km) in Katarino forest reserve. (A) Pre-disturbance false-color composition (1,2,4) of WorldView-2 image (2013); (B) post-disturbance false-color composition (1,2,4) of WorldView-2 image (2016); (C) pre-disturbance tree cover; (D) post-disturbance tree cover.

Figure 10.
Map of number of years between charcoal production and cultivation in Kapiri Mposhi forest reserve.
Figure 10.
Map of number of years between charcoal production and cultivation in Kapiri Mposhi forest reserve.

Figure 11.
Number of years between charcoal production and cultivation (percentage of cultivated land from degraded land). (A) Kapiri Mposhi; (B) Katarino; (C) Mkushi.
Figure 11.
Number of years between charcoal production and cultivation (percentage of cultivated land from degraded land). (A) Kapiri Mposhi; (B) Katarino; (C) Mkushi.


Table 1.
Basic information on implemented tasks, imagery used and sites where they were used.
| Task | Imagery | Locations | Temporal Resolution |
|---|---|---|---|
| Detection of charcoal-related tree cover changes | Medium resolution (30 m) | Kapiri Mposhi; Katarino; Mkusi | Single-date cloud-free images (June–September) for each year between 1998 and 2020. |
| Attribution and analysis of charcoal-driven forest degradation | High (2 m) and very high (0.5 m) resolution | Katarino; Mkusi | Cloud-free images: Katarino (2014, 2015, 2017 and 2018); Mkusi (2012, 2013, 2015, 2016, 2017 and 2018) |
| High-resolution maps of tree cover change in charcoal production areas | High (2 m) resolution | Katarino; Mkusi | Cloud-free images: Katarino (2009 and 2018); Mkusi (2012 and 2016). |
| Annual LCLU maps of forest reserves to define LCLU trajectories | Medium resolution (30 m) | Kapiri Mposhi; Katarino; Mkusi | Single-date cloud-free images (June–September) for each year between 1998 and 2020. |
Publisher’s Note: MDPI stays neutral with regard to jurisdictional claims in published maps and institutional affiliations. |
© 2022 by the authors. Licensee MDPI, Basel, Switzerland. This article is an open access article distributed under the terms and conditions of the Creative Commons Attribution (CC BY) license (https://creativecommons.org/licenses/by/4.0/).
Share and Cite
MDPI and ACS Style
Sedano, F.; Mizu-Siampale, A.; Duncanson, L.; Liang, M. Influence of Charcoal Production on Forest Degradation in Zambia: A Remote Sensing Perspective. Remote Sens. 2022, 14, 3352. https://doi.org/10.3390/rs14143352
AMA Style
Sedano F, Mizu-Siampale A, Duncanson L, Liang M. Influence of Charcoal Production on Forest Degradation in Zambia: A Remote Sensing Perspective. Remote Sensing. 2022; 14(14):3352. https://doi.org/10.3390/rs14143352
Chicago/Turabian StyleSedano, Fernando, Abel Mizu-Siampale, Laura Duncanson, and Mengyu Liang. 2022. "Influence of Charcoal Production on Forest Degradation in Zambia: A Remote Sensing Perspective" Remote Sensing 14, no. 14: 3352. https://doi.org/10.3390/rs14143352
Note that from the first issue of 2016, this journal uses article numbers instead of page numbers. See further details here.