Article

Effects of Meteorology Changes on Inter-Annual Variations of Aerosol Optical Depth and Surface PM2.5 in China—Implications for PM2.5 Remote Sensing

1
School of Energy and Environmental Engineering, University of Science and Technology Beijing, Beijing 100083, China
2
State Key Joint Laboratory of Environment Simulation and Pollution Control, School of Environment, Tsinghua University, Beijing 100084, China
3
Institute for Atmospheric and Earth System Research (INAR)/Physics, Faculty of Science, University of Helsinki, 00014 Helsinki, Finland
4
State Environmental Protection Key Laboratory of Sources and Control of Air Pollution Complex, Beijing 100084, China
*
Author to whom correspondence should be addressed.
Remote Sens. 2022, 14(12), 2762; https://doi.org/10.3390/rs14122762
Submission received: 28 April 2022 / Revised: 23 May 2022 / Accepted: 7 June 2022 / Published: 8 June 2022
(This article belongs to the Special Issue Air Quality Research Using Remote Sensing)

Abstract

:
PM2.5 retrieval from satellite-observed aerosol optical depth (AOD) is still challenging due to the strong impact of meteorology. We investigate influences of meteorology changes on the inter-annual variations of AOD and surface PM2.5 in China between 2006 and 2017 using a nested 3D chemical transport model, GEOS-Chem, by fixing emissions at the 2006 level. We then identify major meteorological elements controlling the inter-annual variations of AOD and surface PM2.5 using multiple linear regression. We find larger influences of meteorology changes on trends of AOD than that of surface PM2.5. On the seasonal scale, meteorology changes are beneficial to AOD and surface PM2.5 reduction in spring (1–50%) but show an adverse effect on aerosol reduction in summer. In addition, major meteorological elements influencing variations of AOD and PM2.5 are similar between spring and fall. In winter, meteorology changes are favorable to AOD reduction (−0.007 yr−1, −1.2% yr−1; p < 0.05) but enhanced surface PM2.5 between 2006 and 2017. The difference in winter is mainly attributed to the stable boundary layer that isolates surface PM2.5 from aloft. The significant decrease in AOD over the years is related to the increase in meridional wind speed at 850 hPa in NCP (p < 0.05). The increase of surface PM2.5 in NCP in winter is possibly related to the increased temperature inversion and more stable stratification in the boundary layer. This suggests that previous estimates of wintertime surface PM2.5 using satellite measurements of AOD corrected by meteorological elements should be used with caution. Our findings provide potential meteorological elements that might improve the retrieval of surface PM2.5 from satellite-observed AOD on the seasonal scale.
Keywords:
meteorology; PM2.5; AOD

1. Introduction

Fine particle (PM2.5) lowers visibility [1,2], affects human health [3], modifies cloud properties [4], and exerts radiative forcing on the Earth’s surface and at the top of the atmosphere [5]. Accurate estimates of high spatio-temporal resolution of surface PM2.5 concentrations is critical for assessing its effects. However, national-wide in situ measurements of surface PM2.5 in China were unavailable until 2013. To study the driving forces of long-term variations of surface PM2.5, many studies use long-term measurements of fog–haze days [6], visibilities [7], and conducive weather conditions [8] as approximations. Specifically, Niu et al. showed that in the past three decades, the doubled frequencies of fog events in wintertime over eastern-central China was strongly related to the weakening of the East Asian winter monsoon (EAWM), which showed decreased surface wind speed and number of cold air outbreaks and increased relative humidity and frequency of light wind events [6]. Li et al. found that the number of wintertime fog–haze days correlates with the inter-annual variations of the winter monsoon index, with a correlation coefficient of −0.41 [9]. Shi et al. also found that wind speed change in the lower troposphere explains 81.6% of the visibility variance between 1960 and 2014 in Eastern China [7]. Lower wind speed decreased dust emissions, and this decrease moderated the wintertime land–sea surface air temperature difference and further decreased wind speed [10]. However, these meteorological approximations only partly reflect the aerosol variations, and their in situ observations are sparse.
Many studies use satellite observations of aerosol optical depth (AOD, [11]) to retrieve surface PM2.5. AOD are observed with large spatio-temporal coverage by remote sensing instruments on board satellites. For example, the total Ozone Mapping Spectroradiometer [12], the Cloud-Aerosol Lidar with Orthogonal Polarization (CALIOP, [13]), and the moderate resolution imaging spectrora-diometer [14]. A number of studies [15,16,17] have developed different methods, such as statistical relations [18] and machine learning [15], to derive surface PM2.5 with high spatiotemporal resolution in China to study the long-term exposure of population to surface PM2.5. However, studies showed that AOD–surface PM2.5 relations show large spatial and temporal variations (e.g., r = 0.17–0.57, varying within regions in China [19]). Meteorological elements, such as cloud cover, wind speed, boundary layer height, and relative humidity, are used to correct the AOD–surface PM2.5 relation for better prediction of surface PM2.5 ([11,20,21,22]). However, to the knowledge of the authors, no study has systematically quantified the different responses of AOD and surface PM2.5 to changes in meteorological elements to better understand the AOD–surface PM2.5 relations.
In this study, we systematically quantify the contributions of meteorology changes to the inter-annual variations of AOD and surface PM2.5 in different seasons and regions in China between 2006 and 2017 by fixing emissions at the 2006 level using a nested global 3D chemical transport model, GEOS-Chem. We study the relationship of AOD and surface PM2.5 in different regions and seasons and their relationship with mesoscale weather patterns. We further identify the major meteorological elements that control the inter-annual variations of AOD and surface PM2.5 in key regions during different seasons using multiple linear regressions.

2. Materials and Methods

2.1. Model Description

We used the nested 3D chemical transport model, GEOS-Chem version 11.01, over Asia to simulate surface PM2.5 and AOD. The nested model has a horizontal resolution of 0.5° latitude × 0.667° longitude, with boundary conditions archived from global simulations at 2° latitude × 2.5° longitude. We simulated AOD in Asia between 2006 and 2017 [23] with a model spin-up of one month. The model was driven with Modern-Era Retrospective analysis for Research and Application, Version 2 (MERRA-2) meteorological fields. We ran GEOS-Chem with full gaseous chemistry and online aerosol calculations, including sulphate-nitrate-ammonium particles [24], black carbon (BC, [25,26]), primary [27] and secondary organic carbon (OC, [28]), natural dusts [29,30,31], and sea salts [32]. The model coupled aerosol and gas-phase chemistry through nitrate and ammonium partitioning, sulphur chemistry, secondary organic aerosol formation, and uptake of acidic gases by sea salt and dust [24]. We used monthly Asian anthropogenic emissions of SO2, NOx, BC, OC, NMVOCs, and NH3 from [33]. We developed anthropogenic emission inventories of these gases and aerosols from industrial, transport, residential, and agricultural sectors in China between 2006 and 2017 using a bottom-up approach [34]. We used daily open fire emissions from the Global Fire Emissions Database, Version 4. Dust emissions followed Fairlie et al. [29] with an improved dust size distribution scheme from [31]. Dry deposition of aerosols followed a resistance-in-series method [35] with updates of dry deposition velocity [36]. Wet removal of aerosols in convective updrafts and large-scale precipitation followed Liu et al. [37], with updates of below-cloud and in-cloud scavenging in ice clouds [38,39] and in-cloud scavenging in mixed-phase clouds [40].
Assuming external mixing, AOD at wavelength λ in each layer was estimated as the sum of AODs of each component i
τ λ = i = 1 n 3 4 m i Q λ , i ρ i r e f f , i = i = 1 n m i β λ , i
where τλ is AOD at wavelength λ, n is the number of aerosol components, mi is aerosol mass concentration of component i, Qλ,i is extinction efficiency factor at wavelength λ calculated with Mie theory, ρi is aerosol mass density, reff,i is particle effective radius. We accounted for the hygroscopicity growth of aerosol particles, as all parameters in the above equation are functions of relative humidity for hydrophilic aerosol components. We used the updated aerosol size distribution and refractive index [41] to calculate Qλ,i and reff,i in a Mie code. Uncertainties of the model-simulated AOD stemmed from aerosol vertical profiles and assumptions on aerosol physical and chemical properties, including mixing state, density, refractive index, and hygroscopic growth [42]. Among the aerosol physical and chemical properties, the mixing state is the most important factor, causing an uncertainty of between 30 and 35% on the simulated AOD [42]. Uncertainties caused by other properties were less than 10% [42]. We used in situ station radiometer AOD measurements, AOD measurements from a moderate resolution imaging spectrora-diometer, and surface in situ measurements of PM2.5 to validate model simulations (see details in Supplementary Materials S1 and S2).
We conducted two experiments to quantify the contributions of meteorological changes in AOD and surface PM2.5 in China. In the BASE simulation, we used varying meteorology and emissions from 2006 to 2017. The observed and simulated inter-annual variations and trends of annual mean AOD and surface PM2.5 are discussed in Supplementary Materials S3. To investigate the contribution of meteorology, we kept emissions at the level of 2006 and varying meteorology in simulation FIXEMISS. The inter-annual variations of AOD and surface PM2.5 in this experiment reflect the effects of varying meteorology. Comparing trends of AOD and surface PM2.5 simulated by the two experiments shows the relative contribution of meteorology changes in these variations.

2.2. Multiple Linear Regression

We analysed results in three hot spot key regions, including the North China Plain (NCP: 35–41°N, 110–120°E), the Yangtze River Delta (YRD: 27–35°N, 116–122°E), and the Pearl River Delta (PRD: 22–25°N, 110–117°E) as shown in Figure S1. We built multiple linear regression models for all the target regions during the four seasons to investigate the contribution of meteorological elements to variations of AOD and surface PM2.5. The candidate variables included temperature (T), zonal wind speed (U), meridional wind speed (V), vertical air movement (O), relative humidity (RH), potential vorticity (PV) at surface, 850 hPa and 500 hPa, pressure at surface (PS), sea level pressure (SLP), tropopause pressure (TROPPT), planetary boundary layer height (PBLH), and precipitation (PREC). The list of abbreviations is shown in Table S2. To avoid redundancy, we use adjusted (adj) the R2 criterion to determine the best subset of regressors.
adj   R 2 = 1 ( 1 R 2 ) ( n 1 ) n k 1
where k is the number of model parameters, n is the number of pairs of data in the data set, R2 is the coefficient of determination because the inclusion of the penalty term nk − 1, adj R2 decreases when redundant variables are included. We used a stepwise procedure to select variables. Subsets with the smallest number of variables and largest adj R2 are regarded as the best predictors. GEOS-Chem-simulated and the best multiple linear regression model-fitted AOD and surface PM2.5 are shown in Figure 1 and Figure 2.

3. Results

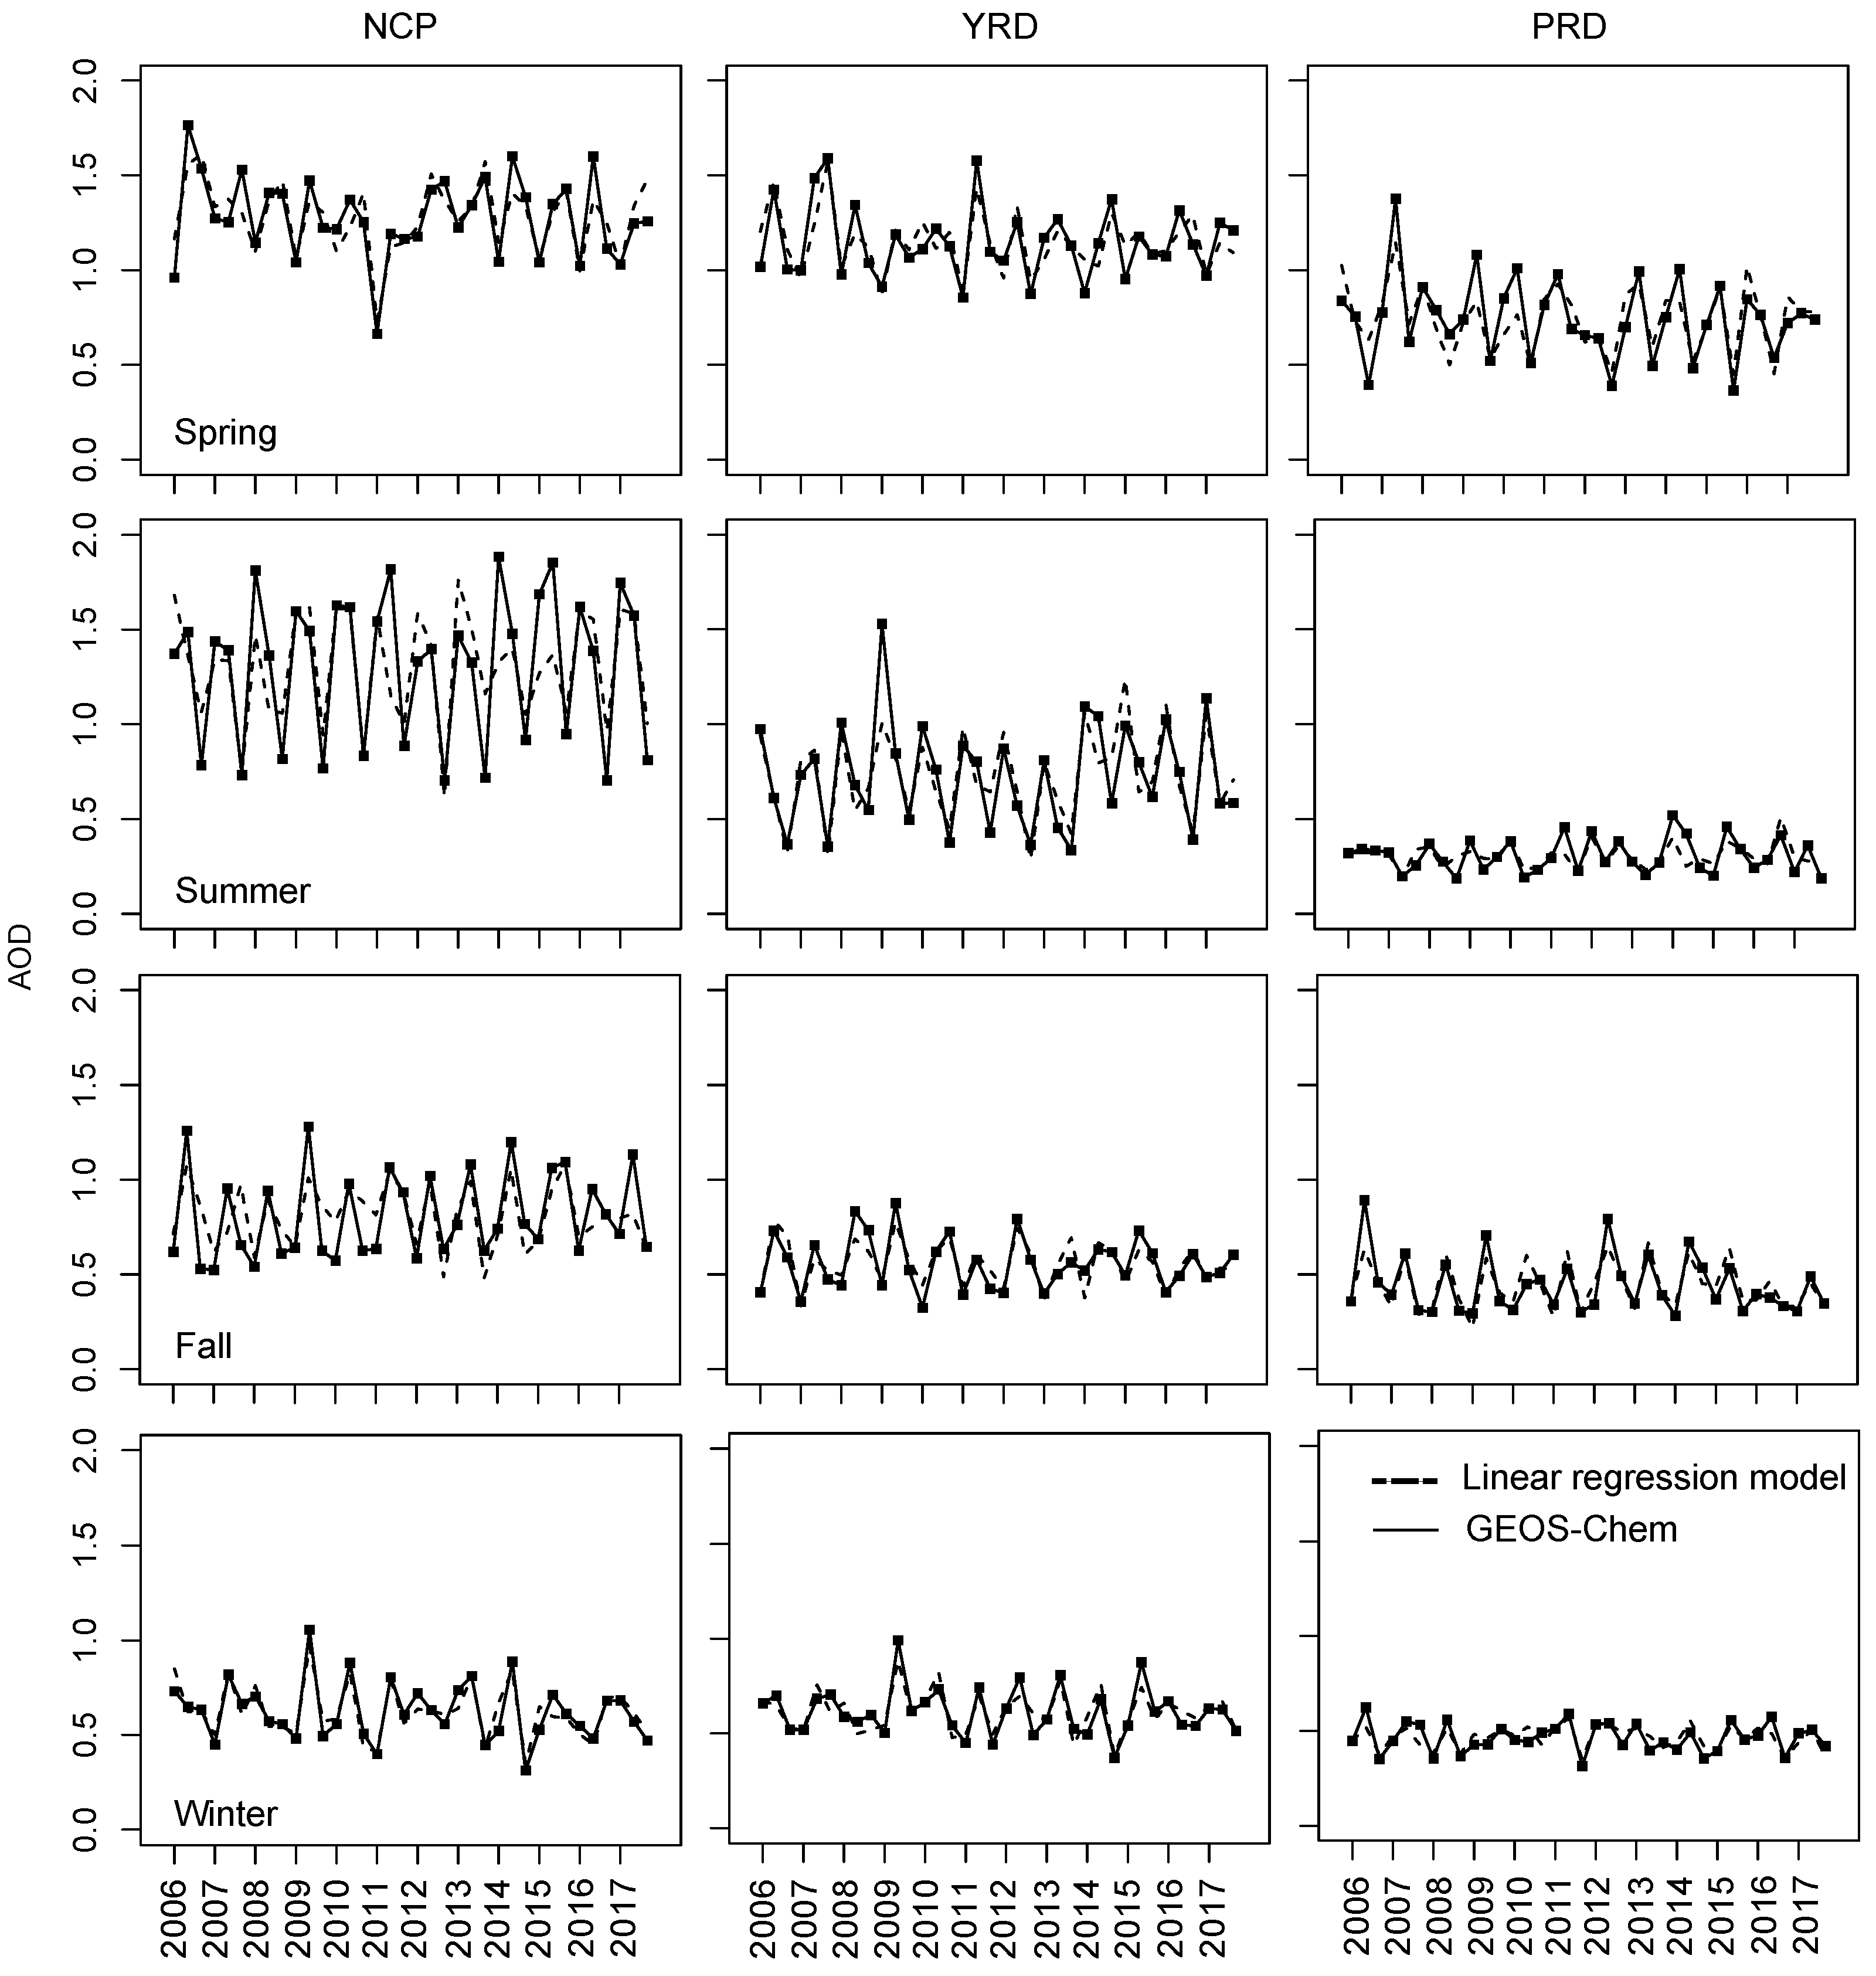
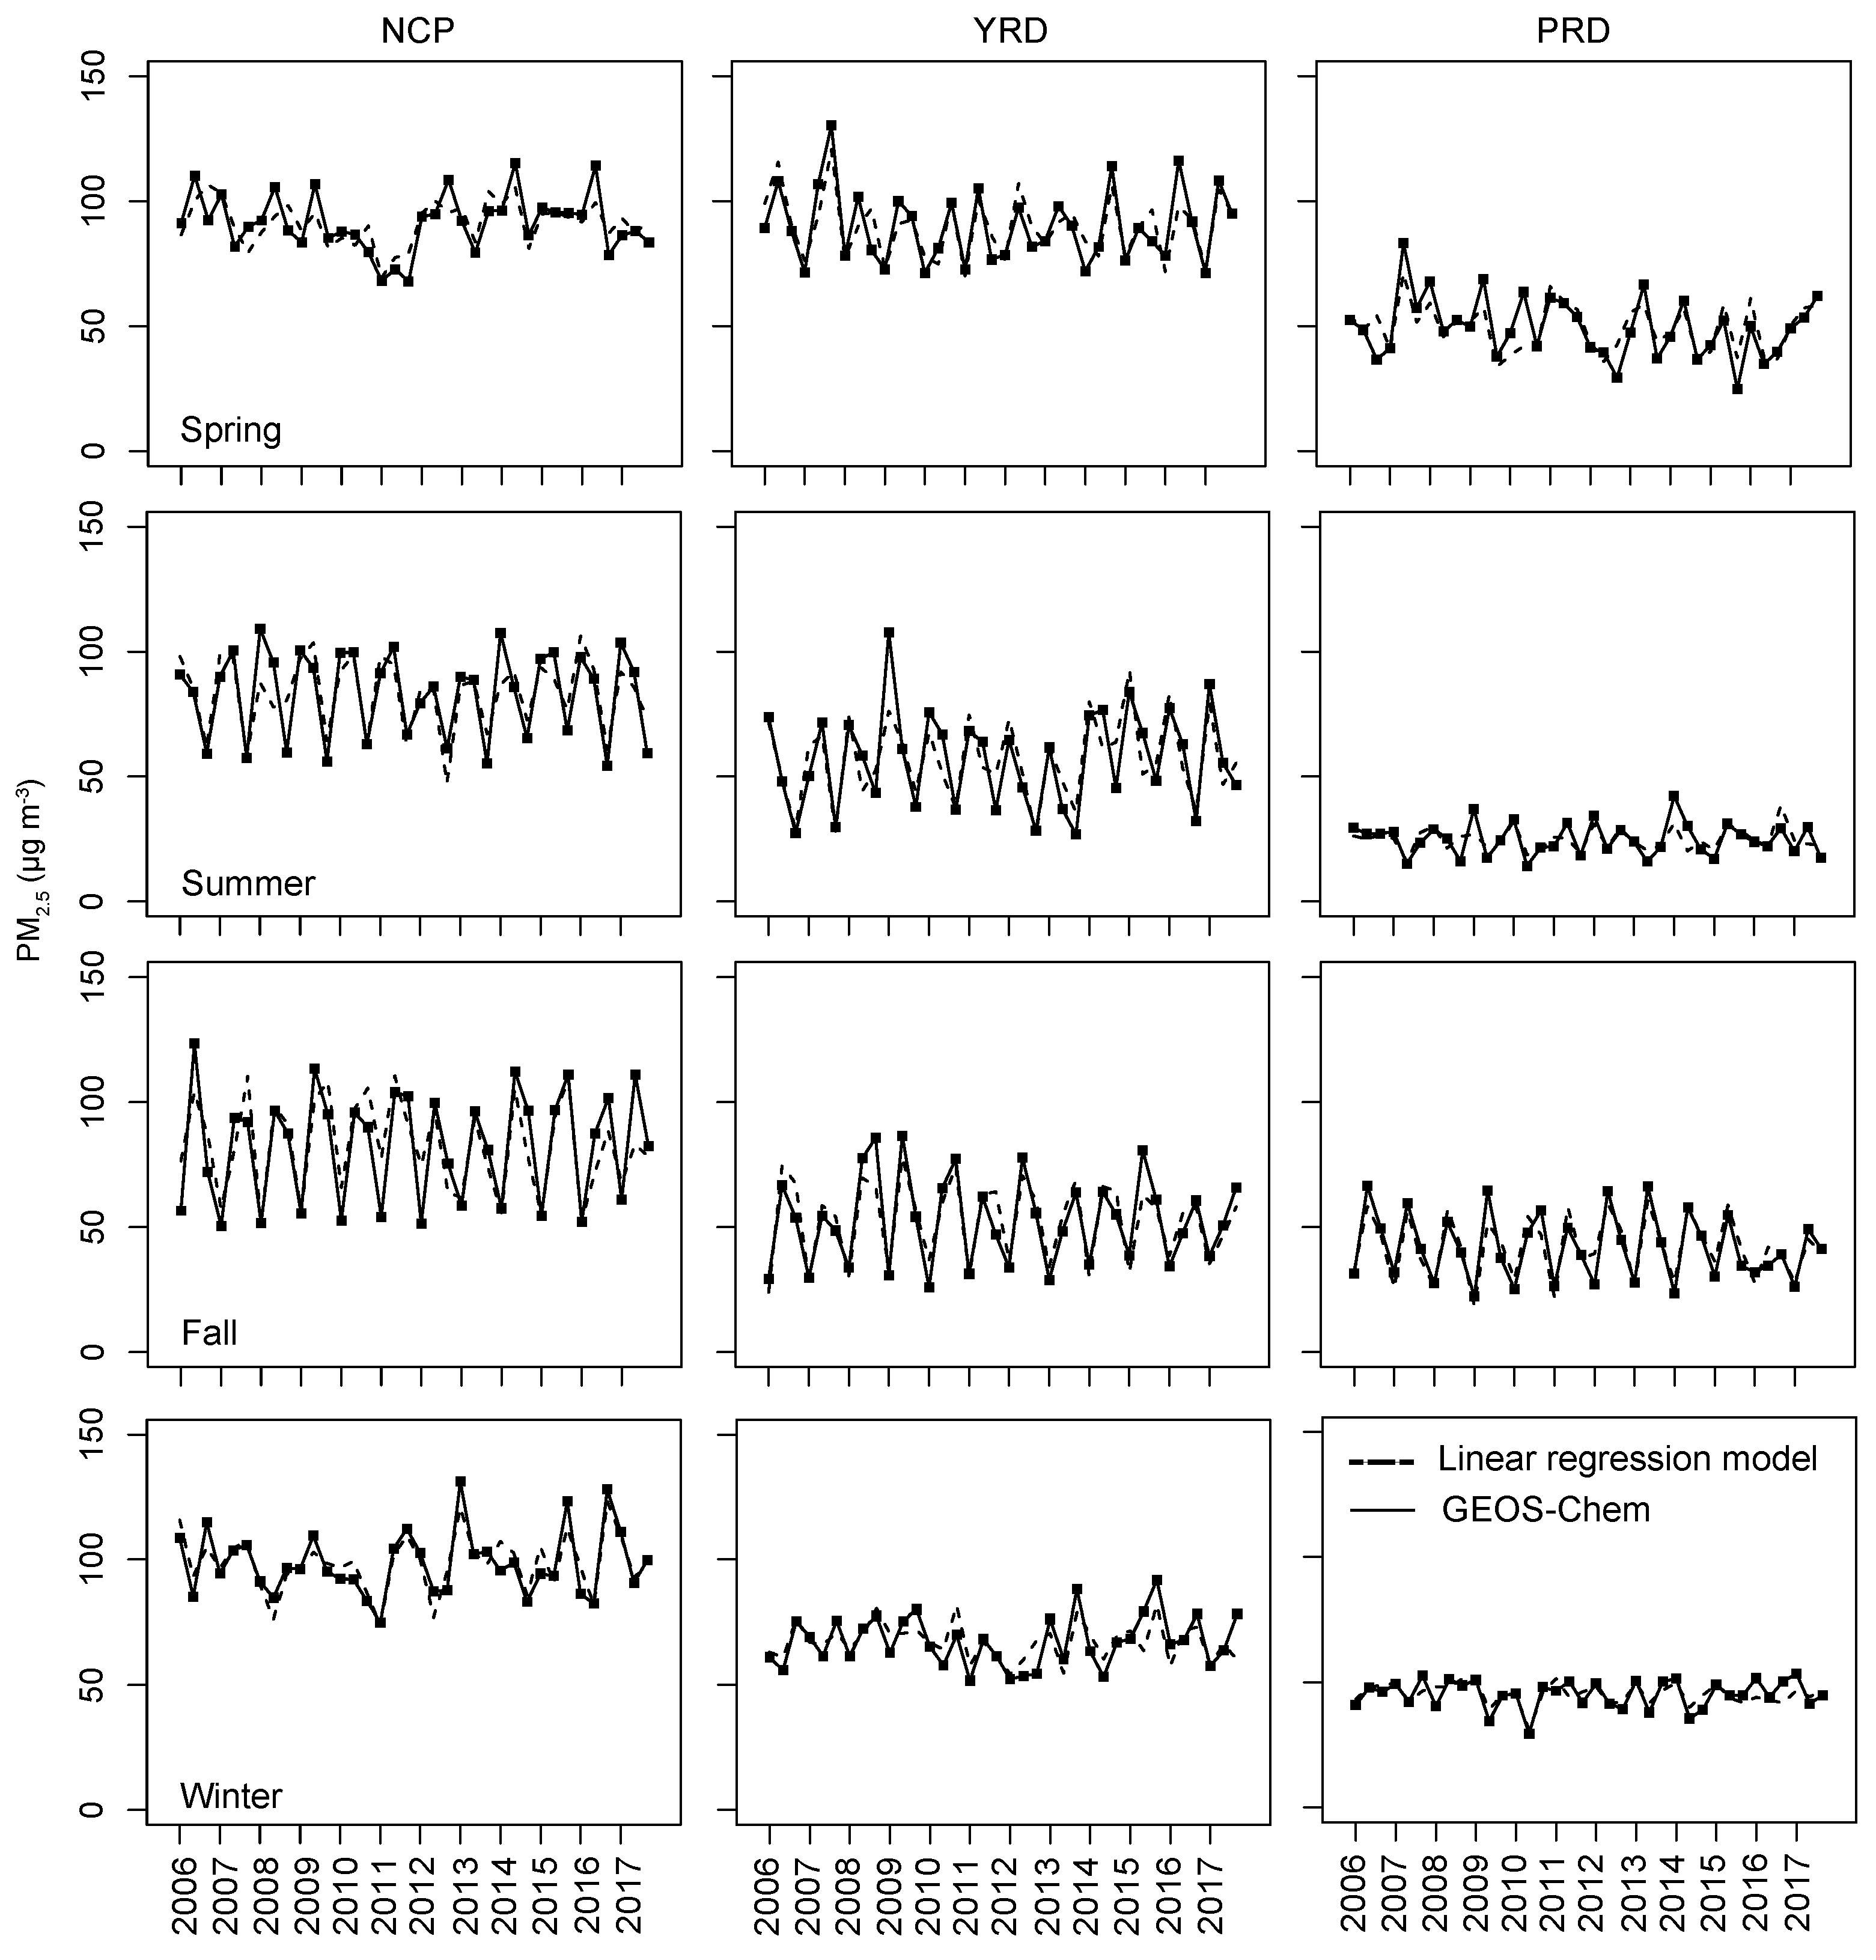
3.1. Meteorology Changes Have Larger Influences on Inter-Annual Variations of AOD than Those of Surface PM2.5

GEOS-Chem shows that the influence of meteorology changes on AOD trends between 2006 and 2017 is relatively larger than their influences on surface PM2.5 (Table 1). Contributions from meteorology changes to downward trends of annual mean AOD are 33% in PRD, larger than that of surface PM2.5 (23%). In YRD, meteorology changes reduce AOD by 10%, but are counter-productive with regard to surface PM2.5 reduction. Meteorology changes show negligible effects on trends of AOD and surface PM2.5 in NCP. In spring, meteorology changes between 2006 and 2017 are favorable to AOD and surface PM2.5 reduction. GEOS-Chem attributes 36%, 22%, and 50% of AOD reduction in NCP, YRD, and PRD, respectively, to meteorology changes during the 12 years. However, for surface PM2.5 reduction, the contributions of meteorology changes are much smaller: 1% in NCP, 12% in YRD, and 40% in PRD. In summer, meteorology changes show adverse effects on aerosol reduction during the 12 years. AOD enhancements due to meteorology change offset 42%, 25%, and 33% of the reduction caused by anthropogenic emission control in NCP, YRD, and PRD, respectively. Influences of meteorology changes on surface PM2.5 are much smaller in NCP (5%) and PRD (10%). In fall, the model suggests a significant adverse effect of meteorology on aerosols in NCP between 2006 and 2017 (+0.011 yr−1 and +0.26 µg m−3 yr−1). These enhancements offset the reduction caused by anthropogenic emission control by 85% for AOD and by 11% for surface PM2.5, respectively. Meteorology changes contribute 25% and 40% to the total reduction in AOD in YRD and PRD (Table 1). Their contributions to surface PM2.5 reductions are much lower, with 8% in NCP and 35% in YRD.
The larger influence of meteorology changes on AOD than surface PM2.5 is attributable to several reasons. First, emissions have larger influence on surface PM2.5 than aloft. Second, PM2.5 concentration decreases with increasing altitude. Mathematically, the same amount of meteorology changes show relatively larger effects on smaller PM2.5 concentrations. Third, observations show that change rates of meteorological elements are amplified with elevation [43,44]. Warming [44] and change of wind speed [43] are more rapid at higher elevations.

3.2. Meteorology Changes in Spring Are Beneficial to Aerosol Reduction

We used multiple linear regression to identify major meteorological elements that possibly have large influences on inter-annual variations of AOD and surface PM2.5. We found that meteorological elements that might influence inter-annual variations of AOD and surface PM2.5 in spring are similar and mainly related to RH and wind speed. In addition, increasing wind speed in spring is, possibly, the main reason for the beneficial effects of meteorology changes in AOD and surface PM2.5 reduction. We found that the inter-annual variations of AOD in NCP is strongly related to the variations of T at 850 hPa, surface RH, and O at 850 hPa, explaining 53% of AOD variations between 2006 and 2017 (Table 2). For surface PM2.5, the latter two elements explain 53% of the inter-annual variations (Table 3). In YRD, wind speeds at different altitudes are important factors controlling the inter-annual variations of both AOD and surface PM2.5. Surface PM2.5 has a stronger correlation with wind speed. Westerly wind at the surface in YRD increases at a rate of 0.07 m s1 yr1 (5.4% yr1, p < 0.05), which possibly contributed to the reduction in AOD and surface PM2.5 in this region. In PRD, the contributions from meteorology (−0.009 yr1, 1.7% of 12-year mean AOD) and emission reduction (−0.010 yr1) are comparable. Multiple linear regression suggests that AOD in PRD is strongly correlated to surface meridional wind velocity and zonal wind velocity difference between the surface and 850 hPa. The former increased at a rate of 0.04 m s1 yr−1 (1.1% of 12-year mean, p = 0.13) between 2006 and 2017, possibly causing decreasing aerosol concentration. The latter increased at a rate of 0.05 m s1 yr−1, indicating that dynamic instability was enhanced over the 12 years, favorable for pollution mitigation.
We estimated the correlation of AOD (surface PM2.5) among different regions to investigate spatial variations of aerosols. We found that AOD in NCP and YRD in spring are highly correlated (r = 0.77, Table 4), but surface PM2.5 in the two regions are not (r = 0.09). This pattern of correlations in the two regions is related to the activity of the West Pacific Sub-Tropical High system (WPSTH, Figure 3). AOD in NCP and YRD show similar correlation with the area (r = 0.29 and 0.31) and strength (r = 0.24 and 0.24) of the WPSTH. Surface PM2.5 in YRD is also related to the two indices (r = 0.33 and 0.25), but surface PM2.5 in NCP is not (r = −0.02 and 0.05). Very few studies have investigated the effects of meteorology on the distribution of aerosols in China in spring. A recent study [45] showed that the activity of the WPSTH and Northeast Asia anticyclone system are important to the distribution of PM2.5 in NCP. They showed that the climatology of the winds at 850 hPa in spring over NCP and YRD is northwesterly. In an anomalous southeasterly wind year, wind speed is reduced and RH increases in Eastern China, resulting in high aerosol concentrations in the region.

3.3. Meteorology Changes in Summer Are Unfavourable to Aerosol Reduction

GEOS-Chem shows that meteorology changes in summer between 2006 and 2017 offset aerosol pollution control efforts in NCP, YRD, and PRD (Table 1). We used two indices to describe the East Asian summer monsoon (EASM) in this study (Figure 4). Index 1 is the mean meridional wind speed at 850 hPa in Eastern Asia (20–40°N, 110–125°E), reflecting activity of the monsoon system in the whole region [46]. Index 2 is the zonal wind speed difference at 200 hPa between Northern (40–50°N, 110–150°E) and Southern (25–35°N, 110–150°E) China, reflecting the different variations between the two regions [47]. We found that AOD and surface PM2.5 in the three regions are moderately to strongly correlated with both EASM Index 1 and Index 2 (Table 5). Both indices show that EASM weakened between 2006 and 2017 (Index 1: −0.023 m s−1 yr−1; Index 2: −0.004 m s−1 yr−1, Figure 4). As a result, AOD in the three target regions increased at rates from 0.006–0.011 yr−1, and surface PM2.5 increased at rates from 0.09–0.67 µg m−3 yr−1 (Table 1). If the enhancement of surface PM2.5 was totally attributed to wind speed changes, the sensitivity is from 0.09–0.67 µg m−3 %−1, in general agreement with a recent estimate (0–0.5 µg m−3 %−1, [48]).
In each region, AOD and surface PM2.5 are strongly correlated (r = 0.93–0.98) because of the strong vertical mixing in summer. AOD in NCP and YRD are strongly correlated in summer (r = 0.78). However, their correlations with AOD in PRD are relatively low (r = 0.30 and 0.27). Similar relationships of surface PM2.5 among the three regions are also shown. In different regions, the correlations of aerosols with EASM indices are different. In NCP, both AOD and surface PM2.5 are strongly positively related to EASM Index 1 (r = 0.57–0.61) and negatively related to Index 2 (r = −0.67). EASM Index 1 and Index 2 together explain from 65–69% of the inter-annual variations of AOD and surface PM2.5, indicating that both the activity of EASM in the whole Eastern China and the difference between the Northern and Southern China are critical to the inter-annual variations of aerosols in NCP. In contrast, AOD and surface PM2.5 in YRD are strongly correlated with EASM Index 2 (r = −0.76−0.82) but weakly correlated with Index 1 (r = 0.27–0.35), indicating that the zonal wind velocity difference at 200 hPa between Northern and Southern China is possibly more important to the inter-annual variations of aerosols in YRD.
We found that EASM Index 2 is strongly correlated with the position of the ridge of the WPSTH system (r = 0.89), indicating that the zonal wind difference between Northern and Southern China is possibly affected by the activity of the WPSTH system. A study [49] showed that, in addition to wind velocity, the ridge position of the WPSTH also strongly affects the distribution of precipitation in China in summer. The climatological pattern of precipitation is more present north of the Yangtze River region and less in Southern China. When the ridge shifts southward, the distribution of precipitation is the opposite. When the ridge shifts northward, two rain-belts show in Southern and Northern China. The humid maritime air mass brought to inland China by EASM shows dual effects on aerosols. The abundant water vapour enhances the hygroscopic growth of sulphate-nitrate-ammonia and, thus, increases aerosol concentrations, while large precipitation removes aerosols from the atmosphere and reduces aerosol concentrations. In NCP, AOD is more affected by RH, while surface PM2.5 is more affected by precipitation [50]. Both EASM Index 1 and Index 2 are weakly correlated with AOD and surface PM2.5 (r = −0.29–0.45) in PRD, indicating that EASM has limited influence on aerosol distribution in this region. Surface PM2.5 shows similar relationships. Regression analysis shows that major meteorological elements in PRD only explains ~40% of the inter-annual variations of aerosols in this region. Meteorology influences on aerosols in PRD need further investigation.

3.4. Meteorology Changes in Fall Show Different Effects on Trends of Aerosols in Different Key Regions

GEOS-Chem suggests adverse effects of meteorology changes on aerosol reduction in NCP, but beneficial effects in YRD and PRD between 2006 and 2017. The significant enhancements of aerosols in NCP (+0.011 yr−1 and +0.26 µg m−3 yr−1) offset the reduction caused by anthropogenic emission control by 85% for AOD and by 11% for surface PM2.5, respectively. We found that PV in NCP decreased at a rate of −0.02 PVU yr−1 (p < 0.05), and RH at 850 hPa increased at a rate of 0.002 yr−1. Both changes favored the enhancement of aerosol concentration in this region. In contrast, meteorology changes contributed from 8–25% and 35–40% to the total reduction in aerosols in YRD and PRD (Table 1). In YRD, PV at 850 hPa became stronger over the years at a rate of +0.01 PVU yr−1 (p = 0.004), likely reducing aerosols in this region. In PRD, meridional wind speed at 500 hPa increased (+0.07 m s−1 yr−1), related to the decline in aerosols in this region.
GEOS-Chem shows that AOD in NCP, YRD, and PRD have strong correlations in fall (r = 0.55–0.69). The surface PM2.5 in the three regions show even larger correlation coefficients (r = 0.76–0.79). In addition, AOD and surface PM2.5 in each region are also highly correlated (r = 0.81–0.94), similar to summer. Major meteorological elements that affect AOD and surface PM2.5 in each region are similar. A recent study [51] showed that in fall, Eastern China is dominated by large-scale stable circulation patterns without frequent disturbances of small-scale weather systems. Vertically, downward motion dominates. Multiple linear regressions suggest that sea level pressure is the major controlling factor that affects the inter-annual variations of AOD and surface PM2.5, particularly for the latter, in each region (Table 2 and Table 3). We found that sea level pressure among the three regions is also moderately to highly correlated (r = 0.50–0.75), which partly explains the correlation of aerosols among the three regions.

3.5. Meteorology Changes in Winter Show Opposite Effects on Trends of AOD and Surface PM2.5

GEOS-Chem suggests that from 8–30% of the downward trends in AOD in NCP (−0.024 yr−1), YRD (−0.021 yr−1), and PRD (−0.013 yr−1) are attributable to meteorology changes. In contrast, meteorology changes show adverse effects on surface PM2.5 reduction over the 12 years, offsetting from 7–9% of the reductions caused by anthropogenic emission control. The opposite effects of meteorology changes on AOD and surface PM2.5 variations are mainly due to the isolation of PM2.5 at the surface and aloft by the stable boundary layer in winter. The boundary layer is more stable and vertical mixing is weaker in winter than in other seasons. Thus, the correlations of surface PM2.5 and AOD in winter in the three regions are much weaker than those during other seasons, with correlation coefficients of 0.44 in NCP, −0.01 in YRD, and 0.21 in PRD. This pattern is possibly partly explained with the dual effects of EAWM on haze–fog variations in Eastern China [52]. Cold wave activity in winter advects aerosol away and cleans up the region. However, the activity of the Siberian High system may reduce the near surface wind speed and enhance the stratification stability, thus, favoring pollution accumulation.
Major meteorological elements controlling the inter-annual variations of AOD and surface PM2.5 are completely different. In NCP, a local northerly wind speed at 850 hPa explains 74% of the inter-annual variations of AOD between 2006 and 2017 (Table 2). This wind speed increases at a rate of +0.15 m s−1 yr−1 (p < 0.1), partly explaining the decrease in AOD in the region (−0.007 yr−1, p < 0.05). The increasing wind speed in NCP is related to the enhanced Siberian High due to the rapid warming of the Barents-Kara Sea region [53]. Different from AOD, inter-annual variations of surface PM2.5 in NCP are mainly affected by surface RH, boundary layer height, and the temperature difference between 850 hPa and 500 hPa. This temperature difference increases over the 12 years, although it is statistically insignificant (+0.1 K yr−1, p = 0.33), favouring aerosol accumulation. These changes are in-line with surface PM2.5 enhancement in NCP during these years (+0.23 µg m−3, p = 0.70).
AOD in YRD is strongly correlated with AOD in NCP (r = 0.77), but surface PM2.5 in the two regions are only weakly correlated (r = 0.43). We used meridional wind speed at 850 hPa in Eastern Asia (25–50°N, 115–145°E) as an indicator of the strength of EAWM ([46], Figure 4). The EAWM index is moderately correlated with AOD in NCP (r = 0.52) and YRD (r = 0.52), but relatively weakly related to surface PM2.5 in NCP (r = 0.42) and YRD (r = 0.31). This correlation pattern suggests that surface PM2.5 in YRD is less affected by the 850 hPa wind speed in Eastern Asia.
Multiple linear regressions suggest that the inter-annual variations of AOD in YRD are mainly affected by RH at 850 hPa, potential vorticity at 500 hPa, and surface meridional wind velocity. We found that RH at 850 hPa decreased (−0.003 yr−1, p = 0.29), but surface wind increased (0.046 m s−1 yr−1, p = 0.29), favouring aerosol accumulation and, thus, possibly enhancing AOD reduction. Meteorological elements determining the variations of surface PM2.5 include surface zonal wind velocity, dynamic instability, tropopause height, and meridional wind speed at 500 hPa in NCP. The former three elements explain 36% of the inter-annual variations of surface PM2.5. Including the last element explains 9% more variations, suggesting that transport from NCP to YRD is likely important to surface PM2.5 in YRD in winter. We found that meridional wind speed at 500 hPa in NCP increases over the years (+0.15 m s−1 yr−1, p = 0.03), indicating that transport from NCP to YRD is possibly increasing. As a result, surface PM2.5 in YRD is increasing.
Similar as in NCP and YRD, meteorological elements that influence the inter-annual variations of AOD and surface PM2.5 are also completely different in PRD. Increasing zonal wind speed at 500 hPa (+0.17 m s−1 yr−1, 0.8% of 12-year mean), and decreasing potential vorticity at 500 hPa (−0.004 PVU yr−1) and PBLH (−2.9 m yr−1), are related to the decrease in AOD in this region. Meteorological elements affecting surface PM2.5 include surface meridional velocity, temperature at 850 hPa, and potential vorticity.

4. Discussion

We showed that the weakening of EASM and the enhancing of AOD and surface PM2.5 between 2006 and 2017 are statistically insignificant, but the trends are still worth notice because they are in-line with the inter-decadal trend as reported by previous studies [54]. Zhu et al. [54] showed that the decadal-scale-weakening of EASM (index: +0.31 between 1948 and 1979 versus −0.32 between 1980 and 2010) within the last thirty years led to increases in aerosol concentration in Northern China by 20%. In addition, the monsoon system also affects the spatial distribution of aerosols. During an active monsoon year, AOD had a positive anomaly in NCP and a negative anomaly in PRD. During a weak monsoon year, the anomalies were the opposite [55,56].
We found that the weakening of EAWM enhances surface PM2.5 in the three key regions, in general agreement with [57], which showed that with fixed emissions, meteorological conditions led to an increase in haze in Beijing during winter between 2002 and 2016. In contrast, Wang et al. [58] found that EAWM was significantly anti-correlated with surface PM2.5 in Beijing between 2005 and 2016, with a correlation coefficient of ~0.75. The difference between the two studies can be attributed to several reasons. First, we analyzed a much larger region, NCP, in this study than in [58], which focused on a city Beijing. Second, we separated the contribution from anthropogenic emissions and meteorology using a chemical transport model, but Wang et al. [58] used surface in situ observations, which do not distinguish the contributions of meteorology changes from anthropogenic emissions control. Thus, their strong correlation is possibly due to the concurrent downward trends of EAWM index and surface PM2.5. Stronger EAWM circulation brings more cold and dry air to NCP and YRD [50] and cleans up the regions. A weaker monsoon barely reaches YRD and even farther north, and favors the accumulation of pollutants [6]. The long-term weakening trend and the inter-annual variations of EAWM were further related to the subtropical Western Pacific Sea surface temperature anomaly [59,60], Arctic sea ice, Eurasian snow [61,62], and El Niño–Southern Oscillation [63]. It is predicted that EAWM would keep the weakening trend in the future (2050–2099), with increased frequency and persistence of conducive weather conditions [8]. This suggests that future meteorology conditions are possibly unfavorable to pollution dissipation.
Very few studies have investigated the influence of meteorology on aerosols in China in spring and fall. PM2.5 in Eastern China is related to the inter-annual variations of Asia Polar Vortex intensity [64], North Atlantic Oscillation, and the North Atlantic Sea surface temperature [45] in spring. The influence of synoptic systems on AOD distribution in fall China was investigated [51] and it was found that heavy pollution events with high AOD (>0.6) in Eastern China is associated with a uniform surface pressure field or a steady westerly in the middle troposphere, while clean episodes (AOD < 0.4) occur when strong northwest cold air advection prevails or air masses are transported from sea to land. Further related, by [65], are the haze days in fall to the abnormally warming sea surface temperature over the North Atlantic subtropical and the Western North Pacific.
Most of the previous studies [15,20,51] use cloud cover, wind speed, PBLH, and RH to correct PM2.5 retrieval. Specifically, ref. [43] found large spatio-temporal diurnal variations of correlation of AOD and PM2.5 in China using measurement data and found that the distribution was strongly affected by cloud fraction, PBLH, and RH. Gong et al. also found that vertical correction by PBLH was important to PM2.5 retrieval in Northwestern China [22]. In other regions, vertical correction via CALIOP ratio is recommended [22]. We also suggest that these elements are important to AOD and surface PM2.5, but we recommend the inclusion sea level pressure and surface pressure in fall.
Our findings have implications for future surface PM2.5 retrieval from satellite-observed AOD. We investigated the controlling meteorological elements of AOD and surface PM2.5 variations over 12 years, including the long-term trends and inter-annual variations. We found that the controlling meteorological elements vary with regions and seasons. Thus, surface PM2.5 retrieval from satellite AOD should probably consider using different meteorological elements in different seasons. In addition, GEOS-Chem simulation with fixed anthropogenic emissions at the 2006 level showed that meteorology changes throughout the 12 years reduces AOD but enhances surface PM2.5 in China during winter, and a multiple linear regression model suggests that the controlling meteorological elements of AOD and surface PM2.5 are completely different. Thus, previous estimates, which used meteorological elements to correct surface PM2.5 retrieval in winter, should be used with caution, as the long-term trend of surface PM2.5 is possibly overestimated. We suggest the use other correction schemes to correct surface PM2.5 retrieval in the future, such as the CALIOP ratio and correlation coefficient of AOD and surface PM2.5.

5. Conclusions

We studied the effects of meteorology changes on trends in AOD and surface PM2.5 in the key regions NCP, YRD, and PRD in China between 2006 and 2017 using a 3D chemical transport model, GEOS-Chem, by fixing emissions at the 2006 level. We further identified major meteorological elements controlling the inter-annual variations of AOD and surface PM2.5 using multiple linear regressions.
We found that meteorology changes made larger contributions to trends in AOD than surface PM2.5 during spring, summer, and fall between 2006 and 2017. Meteorological changes contributed from 22–50% of AOD reduction in spring, larger than their contributions to surface PM2.5 (1–40%). The decrease in aerosols is possibly related to an increase in westerly wind speed (0.07 ms−1 yr−1, 5.4% yr−1, p < 0.05) in YRD and an increase in meridional wind velocity (0.04 ms−1 yr−1, 1.1% of 12-year mean) and dynamic instability (0.05 ms−1 yr−1) in PRD. In summer, meteorological changes offset from 25–42% of AOD reduction caused by anthropogenic emission changes. For surface PM2.5, the contributions were from 5–10%. The adverse effects are possibly related to the weakening of EASM. In fall, meteorology changes offset 85% of AOD reduction and 11% of surface PM2.5 reduction induced by emission changes in NCP. In contrast, from 25–40% of AOD reduction and 8–35% of surface PM2.5 reduction is attributed to meteorology changes. Sea level pressure and surface pressure are critical to aerosol distribution in fall. In winter, meteorology changes were beneficial to AOD decreasing, but were unfavourable to surface PM2.5 reductions in NCP, YRD, and PRD in between 2006 and 2017. The stable boundary layer in winter suppressed vertical mixing, resulting in a weak correlation of AOD and surface PM2.5 in each region. Thus, meteorological elements controlling the inter-annual variations of PM2.5 and AOD in each region were completely different. The northerly wind speed at 850 hPa explained 72% of the inter-annual variations of AOD in NCP. The increase in this wind (−0.045 ms−1 yr−1, p < 0.1) lowered AOD in this region (−0.007 yr−1). In other regions, the trends were statistical insignificant. Thus, previous estimates, which used meteorological elements to correct surface PM2.5 retrieval in winter, should be used with caution. Our study provides possible meteorological elements to correct surface PM2.5 retrieval from satellite AOD measurements on a seasonal scale.

Supplementary Materials

The following supporting information can be downloaded at: https://www.mdpi.com/article/10.3390/rs14122762/s1, Figure S1: SONET sites and key regions in China: North China Plain (NCP, 35–41°N, 110–120°E), the Yangtze River Delta (YRD, 27–35°N, 116–122°E), and the Pearl River Delta (PRD, 22–25°N, 110–117°E); Figure S2: Monthly mean AOD from SONET (blue line) MODIS (red line) and GEOS-Chem (black line) averaged for 2013–2015. Beijing and Songshan are in the NCP region. Shanghai, Zhoushan, Nanjing and Hefei are in the YRD region. Guangzhou is in the PRD region; Figure S3: GEOS-Chem simulated monthly mean AOD components averaged for 2013–2015; Figure S4: Observed (red line) and GEOS-Chem simulated (BASE, black line) monthly mean surface PM2.5 concentrations (µg m-3) in NCP, YRD and PRD in 2013–2017; Figure S5: Observed (red line) and GEOS-Chem simulated (BASE, black line) annual and seasonal mean surface PM2.5 concentrations (µg m−3) in NCP, YRD and PRD in 2013–2017. The vertical lines are standard deviations of daily means in each season in each year; Figure S6: Ratio of annual and seasonal mean AOD relative to their values in 2006 from MODIS (red line) and GEOS-Chem simulations in 2006–2017. Three experiments are shown: varying meteorology and varying emissions (BASE, black line), varying meteorological fields with fixed emissions in 2006 (FIXEMISS, purple line), varying emissions with meteorological fields fixed in 2009 (FIXMET, blue line). See text for details. Figure S7: Similar as Figure S6, but for surface PM2.5. Table S1: Statistics of MODIS observed and GEOS-Chem simulated AOD compared to SONET AOD observations at 16 sites; Table S2: List of abbreviations. References [14,30,31,39,66,67,68,69,70,71,72,73,74,75,76] are cited in the Supplementary Materials.

Author Contributions

Conceptualization, L.Q. and S.W.; methodology, D.Y.; software, L.Q.; formal analysis, L.Q.; data curation, H.Z. and D.D.; writing—original draft preparation, L.Q.; writing—review and editing, L.Q. and S.W.; funding acquisition, L.Q. and S.W.; supervision, S.W. All authors have read and agreed to the published version of the manuscript.

Funding

This work was funded by the National Natural Science Foundation of China (No. 21806088), Beijing Natural Science Foundation (No. 8222066), and Fundamental Research Funds for the Central Universities (No. FRF-TP-20-056A1).

Data Availability Statement

Data is contained within the article or Supplementary Materials.

Acknowledgments

We thank the Samsung Advanced Institute of Technology and National Environmental and Energy Science and Technology International Cooperation Base. Shuxiao Wang acknowledges the support from the Tencent Foundation through the XPLORER PRIZE. The simulations were completed on the “Explorer 100” cluster system of Tsinghua National Laboratory for Information Science and Technology.

Conflicts of Interest

The authors declare no conflict of interest.

References

  1. Noll, K.E.; Mueller, P.K.; Imada, M. Visibility and Aerosol Concentration in Urban Air. Atmos. Environ. 1968, 2, 465–475. [Google Scholar] [CrossRef]
  2. Zhang, Q.; Quan, J.; Tie, X.; Li, X.; Liu, Q.; Gao, Y.; Zhao, D. Effects of meteorology and secondary particle formation on visibility during heavy haze events in Beijing, China. Sci. Total Environ. 2015, 502, 578–584. [Google Scholar] [CrossRef] [PubMed]
  3. Lelieveld, J.; Barlas, C.; Giannadaki, D.; Pozzer, A. Model calculated global, regional and megacity premature mortality due to air pollution. Atmos. Chem. Phys. 2013, 13, 7023–7037. [Google Scholar] [CrossRef] [Green Version]
  4. Ramanathan, V.; Crutzen, P.J.; Kiehl, J.R.; Rosenfeld, D. Aerosols, climate, and the hydrological cycle. Science 2001, 294, 2119–2124. [Google Scholar] [CrossRef] [Green Version]
  5. Andreae, M.O.; Jones, C.D.; Cox, P.M. Strong present-day aerosol cooling implies a hot future. Nature 2005, 435, 1187–1190. [Google Scholar] [CrossRef]
  6. Niu, F.; Li, Z.; Li, C.; Lee, K.-H.; Wang, M. Increase of wintertime fog in China: Potential impacts of weakening of the Eastern Asian monsoon circulation and increasing aerosol loading. J. Geophys. Res. 2010, 115, D00K20. [Google Scholar] [CrossRef]
  7. Shi, P.; Zhang, G.; Kong, F.; Chen, D.; Azorin-Molina, C.; Guijarro, J.A. Variability of winter haze over the Beijing-Tianjin-Hebei region tied to wind speed in the lower troposphere and particulate sources. Atmos. Res. 2019, 215, 1–11. [Google Scholar] [CrossRef]
  8. Cai, W.; Li, K.; Liao, H.; Wang, H.; Wu, L. Weather conditions conducive to Beijing severe haze more frequent under climate change. Nat. Clim. Chang. 2017, 7, 257–262. [Google Scholar] [CrossRef]
  9. Li, Z.; Lau, W.K.M.; Ramanathan, V.; Wu, G.; Ding, Y.; Manoj, M.G.; Liu, J.; Qian, Y.; Li, J.; Zhou, T.; et al. Aerosol and monsoon climate interactions over Asia. Rev. Geophys. 2016, 54, 866–929. [Google Scholar] [CrossRef]
  10. Yang, Y.; Russell, L.M.; Lou, S.; Liao, H.; Guo, J.; Liu, Y.; Singh, B.; Ghan, S.J. Dust-wind interactions can intensify aerosol pollution over eastern China. Nat. Commun. 2017, 8, 15333. [Google Scholar] [CrossRef]
  11. Geng, G.; Zhang, Q.; Martin, R.V.; van Donkelaar, A.; Huo, H.; Che, H.; Lin, J.; He, K. Estimating long-term PM2.5 concentrations in China using satellite-based aerosol optical depth and a chemical transport model. Remote Sens. Environ. 2015, 166, 262–270. [Google Scholar] [CrossRef]
  12. Torres, O.; Bhartia, P.K.; Herman, J.R.; Sinyuk, A.; Ginoux, P.; Holben, B. A long-term record of aerosol optical depth from TOMS observations and comparison to AERONET measurements. J. Atmos. Sci. 2002, 59, 398–413. [Google Scholar] [CrossRef] [Green Version]
  13. Stephens, G.L.; Vane, D.G.; Boain, R.J.; Mace, G.G.; Sassen, K.; Wang, Z.E.; Illingworth, A.J.; O’Connor, E.J.; Rossow, W.B.; Durden, S.L.; et al. The cloudsat mission and the a-train—A new dimension of space-based observations of clouds and precipitation. Bull. Am. Meteorol. Soc. 2002, 83, 1771–1790. [Google Scholar] [CrossRef] [Green Version]
  14. Bilal, M.; Nazeer, M.; Nichol, J.; Qiu, Z.; Wang, L.; Bleiweiss, M.; Shen, X.; Campbell, J.; Lolli, S. Evaluation of Terra-MODIS C6 and C6.1 Aerosol Products against Beijing, XiangHe, and Xinglong AERONET Sites in China during 2004–2014. Remote Sens. 2019, 11, 486. [Google Scholar] [CrossRef] [Green Version]
  15. Xue, T.; Zheng, Y.; Tong, D.; Zheng, B.; Li, X.; Zhu, T.; Zhang, Q. Spatiotemporal continuous estimates of PM2.5 concentrations in China, 2000–2016: A machine learning method with inputs from satellites, chemical transport model, and ground observations. Environ. Int. 2019, 123, 345–357. [Google Scholar] [CrossRef]
  16. Ma, Z.; Hu, X.; Huang, L.; Bi, J.; Liu, Y. Estimating Ground-Level PM2.5 in China Using Satellite Remote Sensing. Environ. Sci. Technol. 2014, 48, 7436–7444. [Google Scholar] [CrossRef]
  17. Peng, J.; Chen, S.; Lü, H.; Liu, Y.; Wu, J. Spatiotemporal patterns of remotely sensed PM2.5 concentration in China from 1999 to 2011. Remote Sens. Environ. 2016, 174, 109–121. [Google Scholar] [CrossRef]
  18. Lin, C.; Li, Y.; Yuan, Z.; Lau, A.K.H.; Li, C.; Fung, J.C.H. Using satellite remote sensing data to estimate the high-resolution distribution of ground-level PM2.5. Remote Sens. Environ. 2015, 156, 117–128. [Google Scholar] [CrossRef]
  19. Guo, X.Y.; Wang, L.; Tian, L.D.; Li, X.P. Elevation-dependent reductions in wind speed over and around the Tibetan Plateau. Int. J. Climatol. 2017, 37, 1117–1126. [Google Scholar] [CrossRef]
  20. Wang, Z.; Chen, L.; Tao, J.; Zhang, Y.; Su, L. Satellite-based estimation of regional particulate matter (PM) in Beijing using vertical-and-RH correcting method. Remote Sens. Environ. 2010, 114, 50–63. [Google Scholar] [CrossRef]
  21. Liu, Y.; Paciorek, C.J.; Koutrakis, P. Estimating Regional Spatial and Temporal Variability of PM2.5 Concentrations Using Satellite Data, Meteorology, and Land Use Information. Environ. Health Perspect. 2009, 117, 886–892. [Google Scholar] [CrossRef] [PubMed] [Green Version]
  22. Gong, W.; Huang, Y.; Zhang, T.; Zhu, Z.; Ji, Y.; Xiang, H. Impact and Suggestion of Column-to-Surface Vertical Correction Scheme on the Relationship between Satellite AOD and Ground-Level PM2.5 in China. Remote Sens. 2017, 9, 1038. [Google Scholar] [CrossRef] [Green Version]
  23. Ma, Z.; Liu, R.; Liu, Y.; Bi, J. Effects of air pollution control policies on PM2.5 pollution improvement in China from 2005 to 2017: A satellite-based perspective. Atmos. Chem. Phys. 2019, 19, 6861–6877. [Google Scholar] [CrossRef] [Green Version]
  24. Park, R.J.; Jacob, D.J.; Field, B.D.; Yantosca, R.M.; Chin, M. Natural and transboundary pollution influences on sulfate-nitrate-ammonium aerosols in the United States: Implications for policy. J. Geophys. Res. Atmos. 2004, 109, D15204. [Google Scholar] [CrossRef]
  25. Qi, L.; Li, Q.; Li, Y.; He, C. Factors controlling black carbon distribution in the Arctic. Atmos. Chem. Phys. 2017, 17, 1037–1059. [Google Scholar] [CrossRef] [Green Version]
  26. van der A, R.J.; Mijling, B.; Ding, J.; Koukouli, M.E.; Liu, F.; Li, Q.; Mao, H.; Theys, N. Cleaning up the air: Effectiveness of air quality policy for SO2 and NOx emissions in China. Atmos. Chem. Phys. 2017, 17, 1775–1789. [Google Scholar] [CrossRef] [Green Version]
  27. Park, R.J.; Jacob, D.J.; Chin, M.; Martin, R.V. Sources of carbonaceous aerosols over the United States and implications for natural visibility. J. Geophys. Res. Atmos. 2003, 108, 4355. [Google Scholar] [CrossRef]
  28. Pye, H.O.T.; Chan, A.W.H.; Barkley, M.P.; Seinfeld, J.H. Global modeling of organic aerosol: The importance of reactive nitrogen (NOx and NO3). Atmos. Chem. Phys. 2010, 10, 11261–11276. [Google Scholar] [CrossRef] [Green Version]
  29. Fairlie, T.D.; Jacob, D.J.; Park, R.J. The impact of transpacific transport of mineral dust in the United States. Atmos. Environ. 2007, 41, 1251–1266. [Google Scholar] [CrossRef]
  30. Fairlie, T.D.; Jacob, D.J.; Dibb, J.E.; Alexander, B.; Avery, M.A.; van Donkelaar, A.; Zhang, L. Impact of mineral dust on nitrate, sulfate, and ozone in transpacific Asian pollution plumes. Atmos. Chem. Phys. 2010, 10, 3999–4012. [Google Scholar] [CrossRef] [Green Version]
  31. Zhang, L.; Kok, J.F.; Henze, D.K.; Li, Q.; Zhao, C. Improving simulations of fine dust surface concentrations over the western United States by optimizing the particle size distribution. Geophys. Res. Lett. 2013, 40, 3270–3275. [Google Scholar] [CrossRef]
  32. Jaeglé, L.; Quinn, P.K.; Bates, T.S.; Alexander, B.; Lin, J.T. Global distribution of sea salt aerosols: New constraints from in situ and remote sensing observations. Atmos. Chem. Phys. 2011, 11, 3137–3157. [Google Scholar] [CrossRef] [Green Version]
  33. Li, M.; Zhang, Q.; Kurokawa, J.-I.; Woo, J.-H.; He, K.; Lu, Z.; Ohara, T.; Song, Y.; Streets, D.G.; Carmichael, G.R.; et al. MIX: A mosaic Asian anthropogenic emission inventory under the international collaboration framework of the MICS-Asia and HTAP. Atmos. Chem. Phys. 2017, 17, 935–963. [Google Scholar] [CrossRef] [Green Version]
  34. Zheng, H.; Zhao, B.; Wang, S.; Wang, T.; Ding, D.; Chang, X.; Liu, K.; Xing, J.; Dong, Z.; Aunan, K.; et al. Transition in source contributions of PM2.5 exposure and associated premature mortality in China during 2005–2015. Environ. Int. 2019, 132, 105111. [Google Scholar] [CrossRef] [PubMed]
  35. Wesely, M.L. Parameterization of surface resistances to gaseous dry deposition in regional-scale numerical models. Atmos. Environ. 1989, 23, 1293–1304. [Google Scholar] [CrossRef]
  36. Zhang, L.; Gong, S.; Padro, J.; Barrie, L. A size-segregated particle dry deposition scheme for an atmospheric aerosol module. Atmos. Environ. 2001, 35, 549–560. [Google Scholar] [CrossRef]
  37. Liu, H.; Jacob, D.J.; Bey, I.; Yantosca, R.M. Constraints from 210Pb and 7Be on wet deposition and transport in a global three-dimensional chemical tracer model driven by assimilated meteorological fields. J. Geophys. Res. Atmos. 2001, 106, 12109–12128. [Google Scholar] [CrossRef] [Green Version]
  38. Wang, Q.; Jacob, D.J.; Fisher, J.A.; Mao, J.; Leibensperger, E.M.; Carouge, C.C.; Le Sager, P.; Kondo, Y.; Jimenez, J.L.; Cubison, M.J.; et al. Sources of carbonaceous aerosols and deposited black carbon in the Arctic in winter-spring: Implications for radiative forcing. Atmos. Chem. Phys. 2011, 11, 12453–12473. [Google Scholar] [CrossRef] [Green Version]
  39. Wang, Q.; Jacob, D.J.; Spackman, J.R.; Perring, A.E.; Schwarz, J.P.; Moteki, N.; Marais, E.A.; Ge, C.; Wang, J.; Barrett, S.R.H. Global budget and radiative forcing of black carbon aerosol: Constraints from pole-to-pole (HIPPO) observations across the Pacific. J. Geophys. Res. Atmos. 2014, 119, 195–206. [Google Scholar] [CrossRef]
  40. Qi, L.; Li, Q.; He, C.; Wang, X.; Huang, J. Effects of the Wegener-Bergeron-Findeisen process on global black carbon distribution. Atmos. Chem. Phys. 2017, 17, 7459–7479. [Google Scholar] [CrossRef] [Green Version]
  41. Drury, E.; Jacob, D.J.; Spurr, R.J.D.; Wang, J.; Shinozuka, Y.; Anderson, B.E.; Clarke, A.D.; Dibb, J.; McNaughton, C.; Weber, R. Synthesis of satellite (MODIS), aircraft (ICARTT), and surface (IMPROVE, EPA-AQS, AERONET) aerosol observations over eastern North America to improve MODIS aerosol retrievals and constrain surface aerosol concentrations and sources. J. Geophys. Res. Atmos. 2010, 115, D14204. [Google Scholar] [CrossRef] [Green Version]
  42. Curci, G.; Hogrefe, C.; Bianconi, R.; Im, U.; Balzarini, A.; Baró, R.; Brunner, D.; Forkel, R.; Giordano, L.; Hirtl, M.; et al. Uncertainties of simulated aerosol optical properties induced by assumptions on aerosol physical and chemical properties: An AQMEII-2 perspective. Atmos. Environ. 2015, 115, 541–552. [Google Scholar] [CrossRef]
  43. Guo, J.; Xia, F.; Zhang, Y.; Liu, H.; Li, J.; Lou, M.; He, J.; Yan, Y.; Wang, F.; Min, M.; et al. Impact of diurnal variability and meteorological factors on the PM2.5—AOD relationship: Implications for PM2.5 remote sensing. Environ. Pollut. 2017, 221, 94–104. [Google Scholar] [CrossRef] [PubMed] [Green Version]
  44. Pepin, N.; Bradley, R.S.; Diaz, H.F.; Baraer, M.; Caceres, E.B.; Forsythe, N.; Fowler, H.; Greenwood, G.; Hashmi, M.Z.; Liu, X.D.; et al. Elevation-dependent warming in mountain regions of the world. Nat. Clim. Chang. 2015, 5, 424–430. [Google Scholar] [CrossRef] [Green Version]
  45. Chen, S.; Guo, J.; Song, L.; Li, J.; Liu, L.; Cohen, J.B. Inter-annual variation of the spring haze pollution over the North China Plain: Roles of atmospheric circulation and sea surface temperature. Int. J. Climatol. 2019, 39, 783–798. [Google Scholar] [CrossRef]
  46. Wang, H.; Jiang, D. A new East Asian winter monsoon intensity index and atmospheric circulation comparison between strong and weak composite. Quat. Sci. 2004, 24, 19–27. (In Chinese) [Google Scholar]
  47. Lau, K.M.; Kim, K.M.; Yang, S. Dynamical and boundary forcing characteristics of regional components of the Asian summer monsoon. J. Clim. 2000, 13, 2461–2482. [Google Scholar] [CrossRef]
  48. Shi, Z.; Huang, L.; Li, J.; Ying, Q.; Zhang, H.; Hu, J. Sensitivity Analysis of the Surface Ozone and Fine Particulate Matter to Meteorological Parameters in China. Atmos. Chem. Phys. 2020, 20, 13455–13466. [Google Scholar] [CrossRef]
  49. Zhao, J.; Feng, G.; Yang, J.; Zhi, R.; Wang, Q. Analysis of the distribution of the large-scale drought/flood of summer in China under different types of the western Pacific sub-tropical high. Acta Meteorol. Sin. 2012, 70, 1021–1031. (In Chinese) [Google Scholar]
  50. Li, Q.; Zhang, R.; Wang, Y. Interannual variation of the wintertime fog-haze days across central and eastern China and its relation with East Asian winter monsoon. Int. J. Climatol. 2016, 36, 346–354. [Google Scholar] [CrossRef]
  51. Zheng, X.Y.; Fu, Y.F.; Yang, Y.J.; Liu, G.S. Impact of atmospheric circulations on aerosol distributions in autumn over eastern China: Observational evidence. Atmos. Chem. Phys. 2015, 15, 12115–12138. [Google Scholar] [CrossRef] [Green Version]
  52. Liu, Q.; Sheng, L.; Cao, Z.; Diao, Y.; Wang, W.; Zhou, Y. Dual effects of the winter monsoon on haze-fog variations in eastern China. J. Geophys. Res. Atmos. 2017, 122, 5857–5869. [Google Scholar] [CrossRef]
  53. Yi, K.; Liu, J.; Wang, X.; Ma, J.; Hu, J.; Wan, Y.; Xu, J.; Yang, H.; Liu, H.; Xiang, S. A combined Arctic-tropical climate pattern controlling the inter-annual climate variability of wintertime PM2.5 over the North China Plain. Environ. Pollut. 2019, 245, 607–615. [Google Scholar] [CrossRef] [PubMed]
  54. Zhu, J.; Liao, H.; Li, J. Increases in aerosol concentrations over eastern China due to the decadal-scale weakening of the East Asian summer monsoon. Geophys. Res. Lett. 2012, 39, L09809. [Google Scholar] [CrossRef] [Green Version]
  55. Liu, X.; Yan, L.; Yang, P.; Yin, Z.-Y.; North, G.R. Influence of Indian Summer Monsoon on Aerosol Loading in East Asia. J. Appl. Meteorol. Climatol. 2011, 50, 523–533. [Google Scholar] [CrossRef] [Green Version]
  56. Yan, L.; Liu, X.; Yang, P.; Yin, Z.-Y.; North, G.R. Study of the Impact of Summer Monsoon Circulation on Spatial Distribution of Aerosols in East Asia Based on Numerical Simulations. J. Appl. Meteorol. Climatol. 2011, 50, 2270–2282. [Google Scholar] [CrossRef]
  57. Gao, M.; Liu, Z.; Zheng, B.; Ji, D.; Sherman, P.; Song, S.; Xin, J.; Liu, C.; Wang, Y.; Zhang, Q. China’s emission control strategies have suppressed unfavorable influences of climate on wintertime PM2.5 concentrations in Beijing since 2002. Atmos. Chem. Phys. 2020, 20, 1497–1505. [Google Scholar] [CrossRef] [Green Version]
  58. Wang, C.; An, X.; Zhang, P.; Sun, Z.; Cui, M.; Ma, L. Comparing the impact of strong and weak East Asian winter monsoon on PM2.5 concentration in Beijing. Atmos. Res. 2019, 215, 165–177. [Google Scholar] [CrossRef]
  59. Yin, Z.; Wang, H. The relationship between the subtopical Western Pacific SST and haze over North-Central North China Plain. Int. J. Climatol. 2016, 36, 3479–3491. [Google Scholar] [CrossRef]
  60. Pei, L.; Yan, Z.; Sun, Z.; Miao, S.; Yao, Y. Increasing persistent haze in Beijing: Potential impacts of weakening East Asian winter monsoons associated with northwestern Pacific sea surface temperature trends. Atmos. Chem. Phys. 2018, 18, 3173–3183. [Google Scholar] [CrossRef] [Green Version]
  61. Zou, Y.; Wang, Y.; Zhang, Y.; Koo, J.-H. Arctic sea ice, Eurasia snow, and extreme winter haze in China. Sci. Adv. 2017, 3, e1602751. [Google Scholar] [CrossRef] [PubMed] [Green Version]
  62. Yin, Z.; Wang, H. The strengthening relationship between Eurasian snow cover and December haze days in central North China after the mid-1990s. Atmos. Chem. Phys. 2018, 18, 4753–4763. [Google Scholar] [CrossRef] [Green Version]
  63. Zhao, S.; Zhang, H.; Xie, B. The effects of El Niño–Southern Oscillation on the winter haze pollution of China. Atmos. Chem. Phys. 2018, 18, 1863–1877. [Google Scholar] [CrossRef] [Green Version]
  64. He, Q.; Geng, F.; Li, C.; Mu, H.; Zhou, G.; Liu, X.; Gao, W.; Wang, Y.; Cheng, T. Long-term variation of satellite-based PM2.5 and influence factors over East China. Sci. Rep. 2018, 8, 11764. [Google Scholar] [CrossRef]
  65. Wang, J.; Zhu, Z.; Qi, L.; Zhao, Q.; He, J.; Wang, J.X.L. Two pathways of how remote SST anomalies drive the interannual variability of autumnal haze days in the Beijing-Tianjin-Hebei region, China. Atmos. Chem. Phys. 2019, 19, 1521–1535. [Google Scholar] [CrossRef] [Green Version]
  66. Li, Z.Q.; Xu, H.; Li, K.T.; Li, D.H.; Xie, Y.S.; Li, L.; Zhang, Y.; Gu, X.F.; Zhao, W.; Tian, Q.J.; et al. Comprehensive Study of Optical, Physical, Chemical, and Radiative Properties of Total Columnar Atmospheric Aerosols over China: An Overview of Sun–Sky Radiometer Observation Network (SONET) Measurements. Bull. Am. Meteorol. Soc. 2018, 99, 739–755. [Google Scholar] [CrossRef]
  67. Eck, T.F.; Holben, B.N.; Reid, J.S.; Dubovik, O.; Smirnov, A.; O’Neill, N.T.; Slutsker, I.; Kinne, S. Wavelength dependence of the optical depth of biomass burning, urban, and desert dust aerosols. J. Geophys. Res. 1999, 104, 31333–31349. [Google Scholar] [CrossRef]
  68. Cheng, T.; Chen, H.; Gu, X.; Yu, T.; Guo, J.; Guo, H. The inter-comparison of MODIS, MISR and GOCART aerosol products against AERONET data over China. J. Quant. Spectrosc. Radiat. Transf. 2012, 113, 2135–2145. [Google Scholar] [CrossRef]
  69. He, Q.; Li, C.; Tang, X.; Li, H.; Geng, F.; Wu, Y. Validation of MODIS derived aerosol optical depth over the Yangtze River Delta in China. Remote Sens. Environ. 2010, 114, 1649–1661. [Google Scholar] [CrossRef]
  70. Li, Z.; Zhao, X.; Kahn, R.; Mishchenko, M.; Remer, L.; Lee, K.; Wang, M.; Laszlo, I.; Nakajima, T.; Maring, H. Uncertainties in satellite remote sensing of aerosols and impact on monitoring its long-term trend: A review and perspective. Ann. Geophys. 2009, 27, 2755–2770. [Google Scholar] [CrossRef]
  71. Harrison, D.; Maggs, R.; Booker, J. UK Equivalence Programme for Monitoring of Particulate Matter; BV/AQ/AD202209/DH/2396; Bureau Veritas: London, UK, 2006. [Google Scholar]
  72. Li, S.; Yu, C.; Chen, L.; Tao, J.; Letu, H.; Ge, W.; Si, Y.; Liu, Y. Inter-comparison of model-simulated and satellite-retrieved componential aerosol optical depths in China. Atmos. Environ. 2016, 141, 320–332. [Google Scholar] [CrossRef] [Green Version]
  73. Li, S.; Zhang, L.; Cai, K.; Ge, W.; Zhang, X. Comparisons of the vertical distributions of aerosols in the CALIPSO and GEOS-Chem datasets in China. Atmos. Environ. X 2019, 3, 100036. [Google Scholar] [CrossRef]
  74. Hammer, M.S.; Martin, R.V.; van Donkelaar, A.; Buchard, V.; Torres, O.; Ridley, D.A.; Spurr, R.J.D. Interpreting the ultraviolet aerosol index observed with the OMI satellite instrument to understand absorption by organic aerosols: Implications for atmospheric oxidation and direct radiative effects. Atmos. Chem. Phys. 2016, 16, 2507–2523. [Google Scholar] [CrossRef] [Green Version]
  75. Li, S.; Chen, L.; Fan, M.; Tao, J.; Wang, Z.; Yu, C.; Si, Y.; Letu, H.; Liu, Y. Estimation of GEOS-Chem and GOCART Simulated Aerosol Profiles Using CALIPSO Observations over the Contiguous United States. Aerosol Air Qual. Res. 2017, 16, 3256–3265. [Google Scholar] [CrossRef] [Green Version]
  76. Sogacheva, L.; Rodriguez, E.; Kolmonen, P.; Virtanen, T.H.; Saponaro, G.; de Leeuw, G.; Georgoulias, A.K.; Alexandri, G.; Kourtidis, K.; van der A, R.J. Spatial and seasonal variations of aerosols over China from two decades of multi-satellite observations-Part 2: AOD time series for 1995–2017 combined from ATSR ADV and MODIS C6.1 and AOD tendency estimations. Atmos. Chem. Phys. 2018, 18, 16631–16652. [Google Scholar] [CrossRef] [Green Version]
Figure 1. GEOS-Chem-simulated (solid line) and multiple linear regression-predicted (dashed line) monthly mean AOD in NCP, YRD, and PRD.
Remotesensing 14 02762 g001
Figure 2. GEOS-Chem-simulated (solid line) and multiple linear regression-predicted (dashed line) monthly mean PM2.5 in NCP, YRD, and PRD.
Remotesensing 14 02762 g002
Figure 3. Correlation coefficients of AOD (a) and surface PM2.5 (b) with area, strength, ridge position, and western extension index of Western Pacific sub-tropical high system in spring.
Remotesensing 14 02762 g003
Figure 4. Monthly mean EASM Index 1, Index 2 and EAWM between 2006 and 2017.
Remotesensing 14 02762 g004
Table 1. GEOS-Chem-simulated inter-annual trends of annual and seasonal mean AOD (yr−1, % yr−1 in parentheses) and surface PM2.5 (µg m−3 yr−1 and % yr−1 in parentheses) in NCP, YRD, and PRD between 2006 and 2017.
NCPYRDPRD
AnnualBASEAOD−0.020 (−2.1) *−0.020 (−2.9) *−0.012 (−2.7) *
PM2.5−2.61 (−3.4) *−2.12 (−2.9) *−1.45 (−2.7) *
FIXEMISSAOD0.001 (0.1)−0.002 (−0.2)−0.004 (−0.8) *
PM2.50.14 (0.2)0.11 (0.2)−0.33 (−0.8) *
SpringBASEAOD−0.028 (−2.3) +−0.027 (−2.6) *−0.015 (−2.1) #
PM2.5−2.57 (−3.1) *−3.13 (−4.0) *−2.01 (−4.5) *
FIXEMISSAOD−0.010 (−0.8)−0.006 (−0.5)−0.009 (−1.2)
PM2.5−0.03 (0.0)−0.38 (−0.4)−0.81 (−1.6)
SummerBASEAOD−0.021 (−1.8) #−0.018 (−2.8) #−0.004 (−1.6)
PM2.5−2.33 (−3.1) *−1.53 (−3.1) +−0.81 (−3.8) *
FIXEMISSAOD0.011 (0.9)0.006 (0.8)0.002 (0.5)
PM2.50.12 (0.1)0.67 (1.2)0.09 (0.0)
FallBASEAOD−0.005 (−0.7)−0.016 (−3.2) *−0.017 (−4.4) +
PM2.5−2.11 (−2.9) *−1.67 (−3.7) *−1.70 (−4.6) *
FIXEMISSAOD0.011 (1.4) #−0.004 (−0.6)−0.007 (−1.7)
PM2.50.26 (0.3)−0.13 (−0.2)−0.60 (−1.3) #
WinterBASEAOD−0.025 (−4.5) *−0.021 (−3.9) *−0.013 (−3.1) *
PM2.5−3.45 (−4.2) *−2.14 (−3.7) *−1.27 (−3.3) *
FIXEMISSAOD−0.007 (−1.2) *−0.004 (−0.6)−0.001 (−0.2)
PM2.50.23 (0.2)0.27 (0.4)0.09 (0.2)
# Significant at 90% level (0.05 < p < 0.1); + significant at 95% level (0.01 < p < 0.05); * significant at 99% level (p < 0.01).
Table 2. Meteorological parameters that explain the AOD variations in NCP, YRD, and PRD in different seasons.
NCPYRDPRD
Variablesadj R2Variablesadj R2Variablesadj R2
SpringT850hPa0.34Vsurface0.18V850hPa0.11
RHsurface0.48Usurface0.36dUsurf-850hPa0.42
O850hPa0.53TROPPT0.42PBLH0.56
dTsurf-850hPa0.59PVsurface0.48PV500hPa0.63
PBLH0.67dV850hPa–500hPa0.53
O500hPa0.62
SummerdVsurf-850hPa0.31U500hPa0.72T500hPa0.21
Vsurface0.64 PREC0.31
O850hPa0.70 V500hPa0.38
RH850hPa0.72 O850hPa0.46
FallO850hPa0.13SLP0.47PS0.12
SLP0.28PV850hPa0.57SLP0.59
PVsurface0.36dV850hPa–500hPa0.72U500hPa0.70
RHsurface0.45
WinterV850hPa0.74RH850hPa0.55RH850hPa0.28
O500hPa0.80PV500hPa0.64PV500hPa0.45
TROPPT0.83Vsurface0.73U500hPa0.52
PBLH0.56
Table 3. Meteorological elements that explain inter-annual variations of surface PM2.5 in NCP, YRD, and PRD between 2006 and 2017 in different seasons.
NCPYRDPRD
Variablesadj R2Variablesadj R2Variablesadj R2
SpringRHsurface0.32Vsurface0.44V850hPa0.40
O850hPa0.53Usurface0.59dUsurf-850hPa0.59
O500hPa0.61
V500hPa0.68
SummerdVsurf-850hPa0.26U500hPa0.70T500hPa0.13
Vsurface0.60 PREC0.24
PREC0.67 V500hPa0.34
O850hPa0.40
FallSLP0.45SLP0.66PS0.46
PVsurface0.48PV850hPa0.72SLP0.76
RHsurface0.61Vsurface0.78U500hPa0.81
O850hPa0.65
WinterRHsurface0.48Usurface0.24Vsurface0.19
PBLH0.66dU850hPa–500hPa0.33T850hPa0.36
dT850hPa–500hPa0.76TROPPT0.36PV850hPa0.49
V500hPa_NCP0.45
Table 4. Correlation coefficients of seasonal mean AOD and surface PM2.5 between 2006 and 2017 among NCP, YRD, and PRD.
NCP~YRDNCP~PRDPRD~YRD
SpringAOD0.50−0.130.31
PM2.50.09−0.290.10
SummerAOD0.780.300.27
PM2.50.830.220.28
FallAOD0.550.690.66
PM2.50.770.790.76
WinterAOD0.770.150.39
PM2.50.430.140.29
Table 5. Correlation coefficients of East Asia monsoon system with AOD and surface PM2.5 in NCP, YRD, and PRD in summer and winter between 2006 and 2017.
NCPYRDPRD
EASM Index1AOD0.610.35−0.29
PM2.50.570.27−0.30
EASM Index2AOD−0.67−0.82−0.33
PM2.5−0.67−0.76−0.45
EAWMAOD0.500.510.15
PM2.50.420.310.18
Publisher’s Note: MDPI stays neutral with regard to jurisdictional claims in published maps and institutional affiliations.

