
How to Account for Changes in Carbon Storage from Coal Mining and Reclamation in Eastern China? Taking Yanzhou Coalfield as an Example to Simulate and Estimate

 , ,
, ,
Abstract
:
1. Introduction
- (1)
- Propose a method to estimate the impact of mining and reclamation measures on carbon storage;
- (2)
- Prediction of land change in mining areas affected by mining by coupling the PLUS model and probability integration method;
- (3)
- Spatial–temporal relationship of carbon storage using the spatial analysis method.
2. Materials and Methods
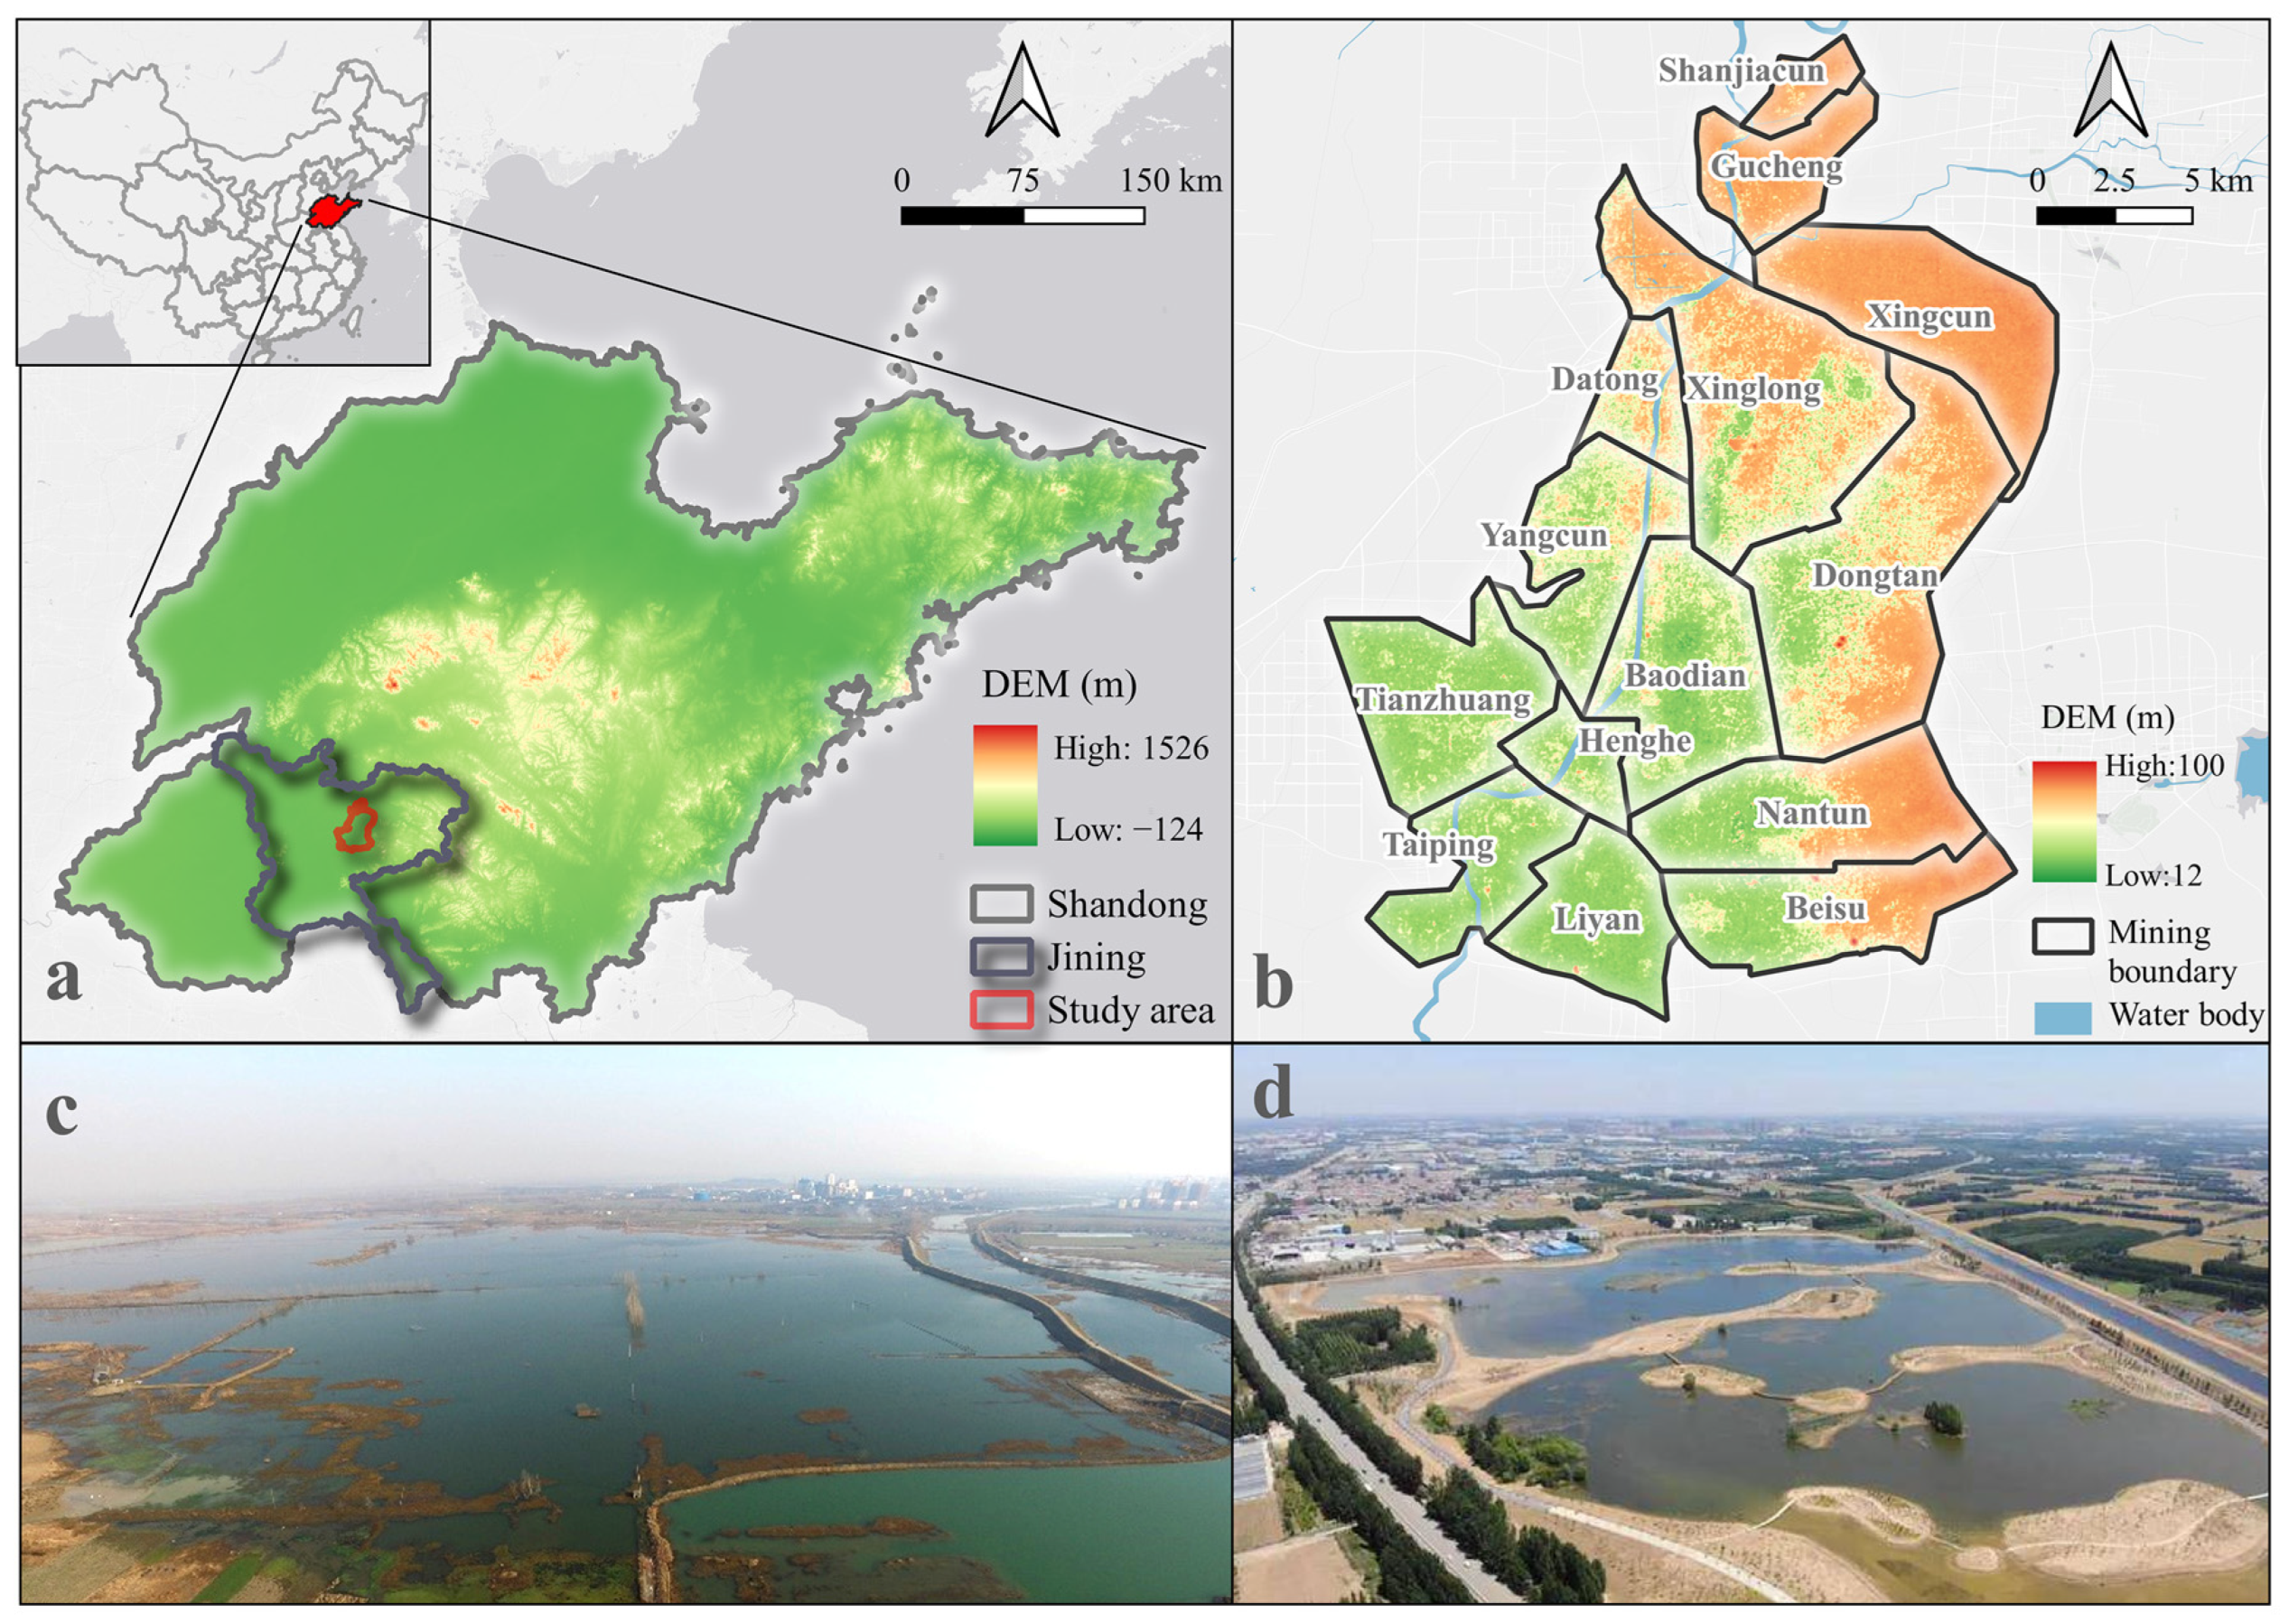
2.1. Study Area
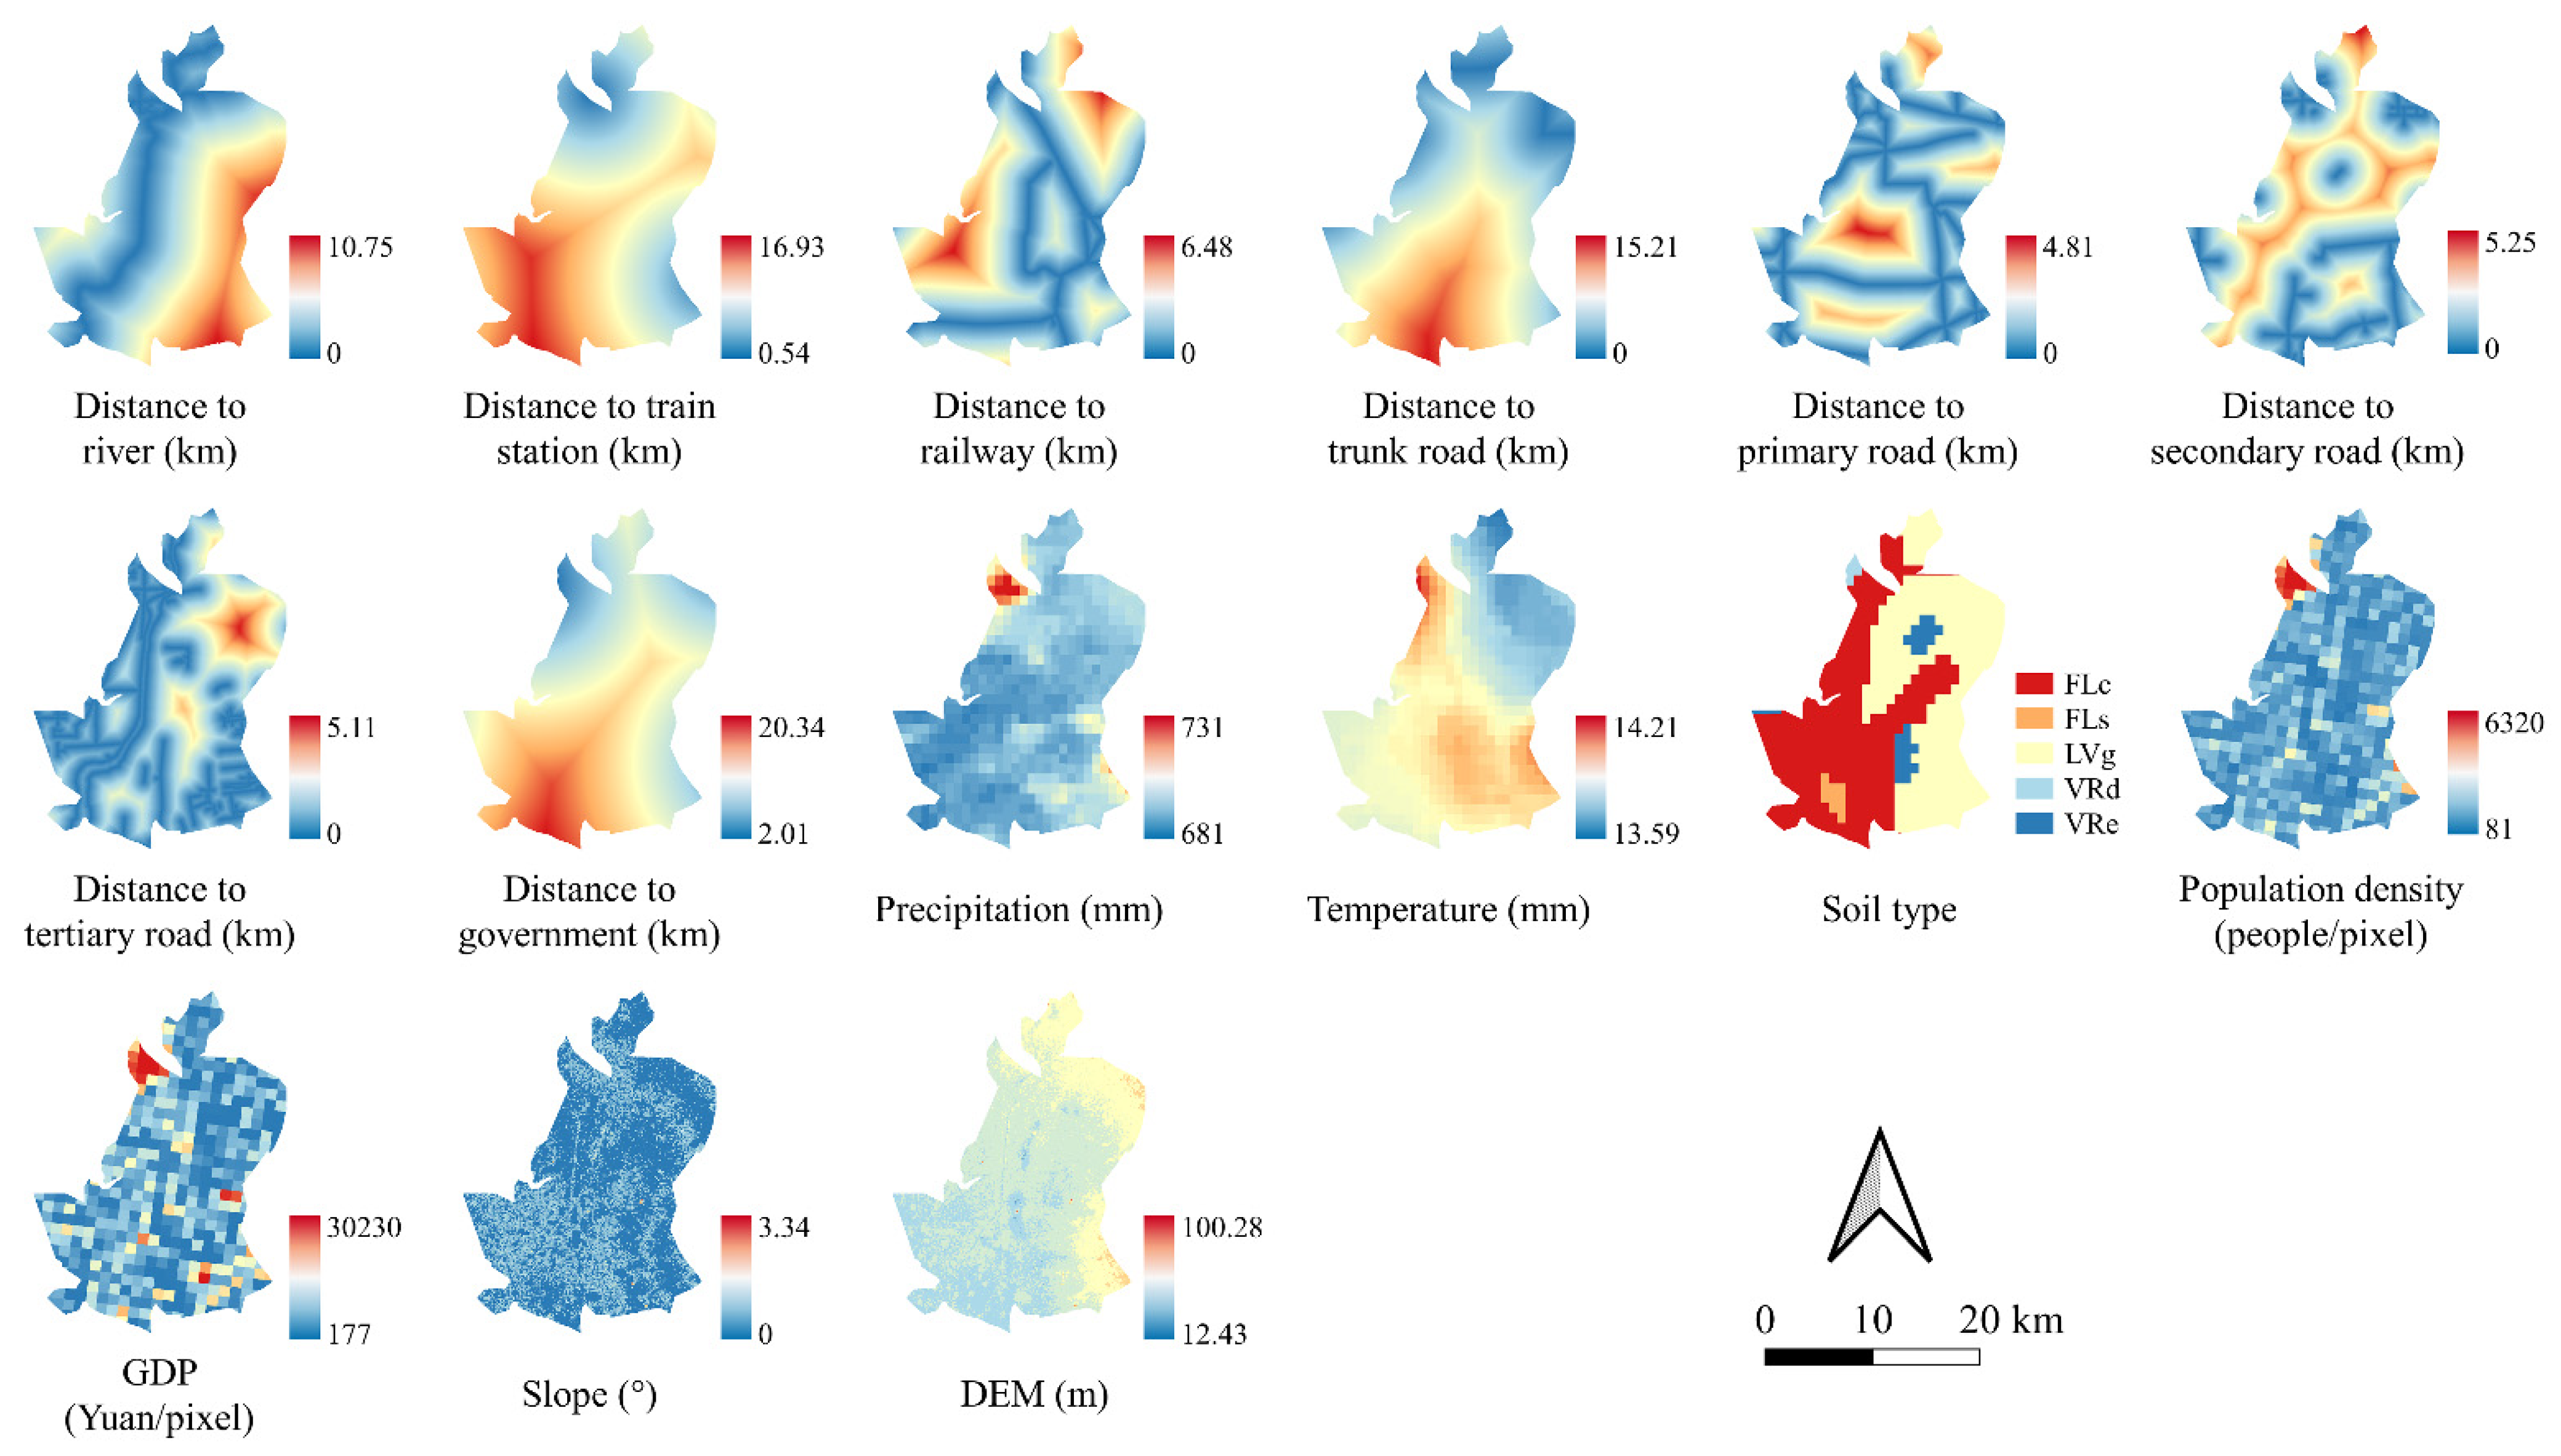
2.2. Data Source
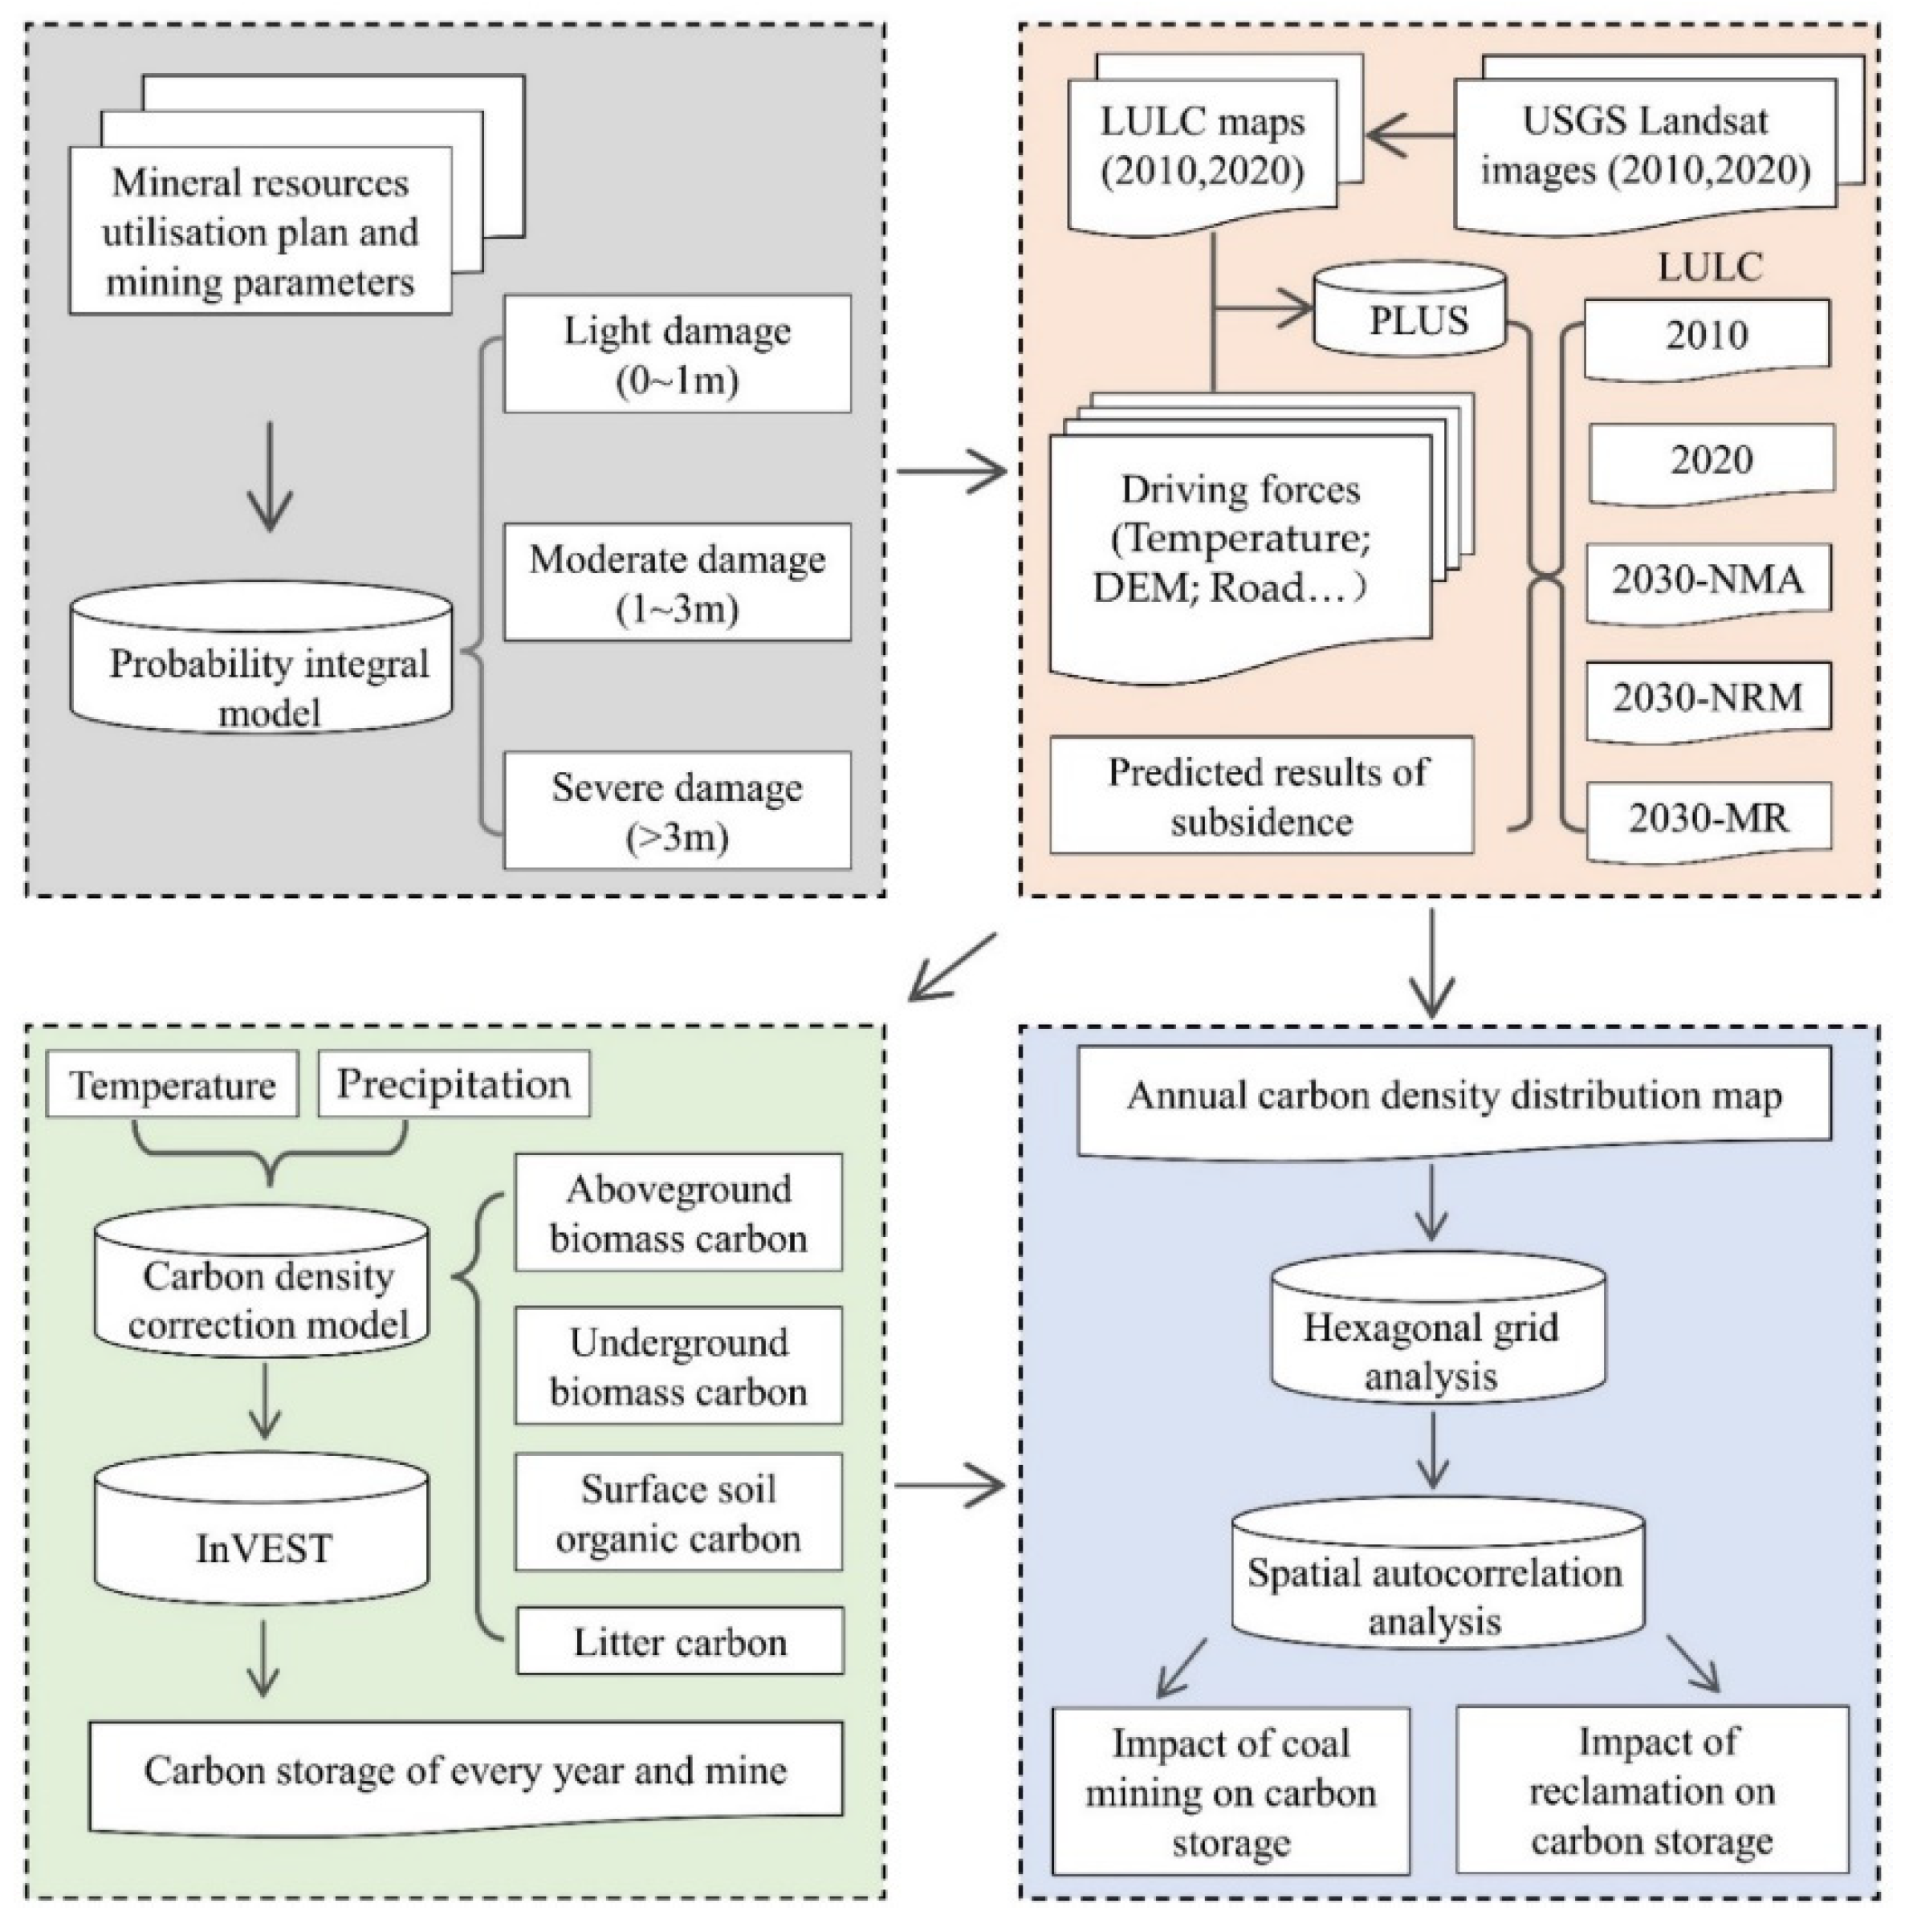
2.3. Method
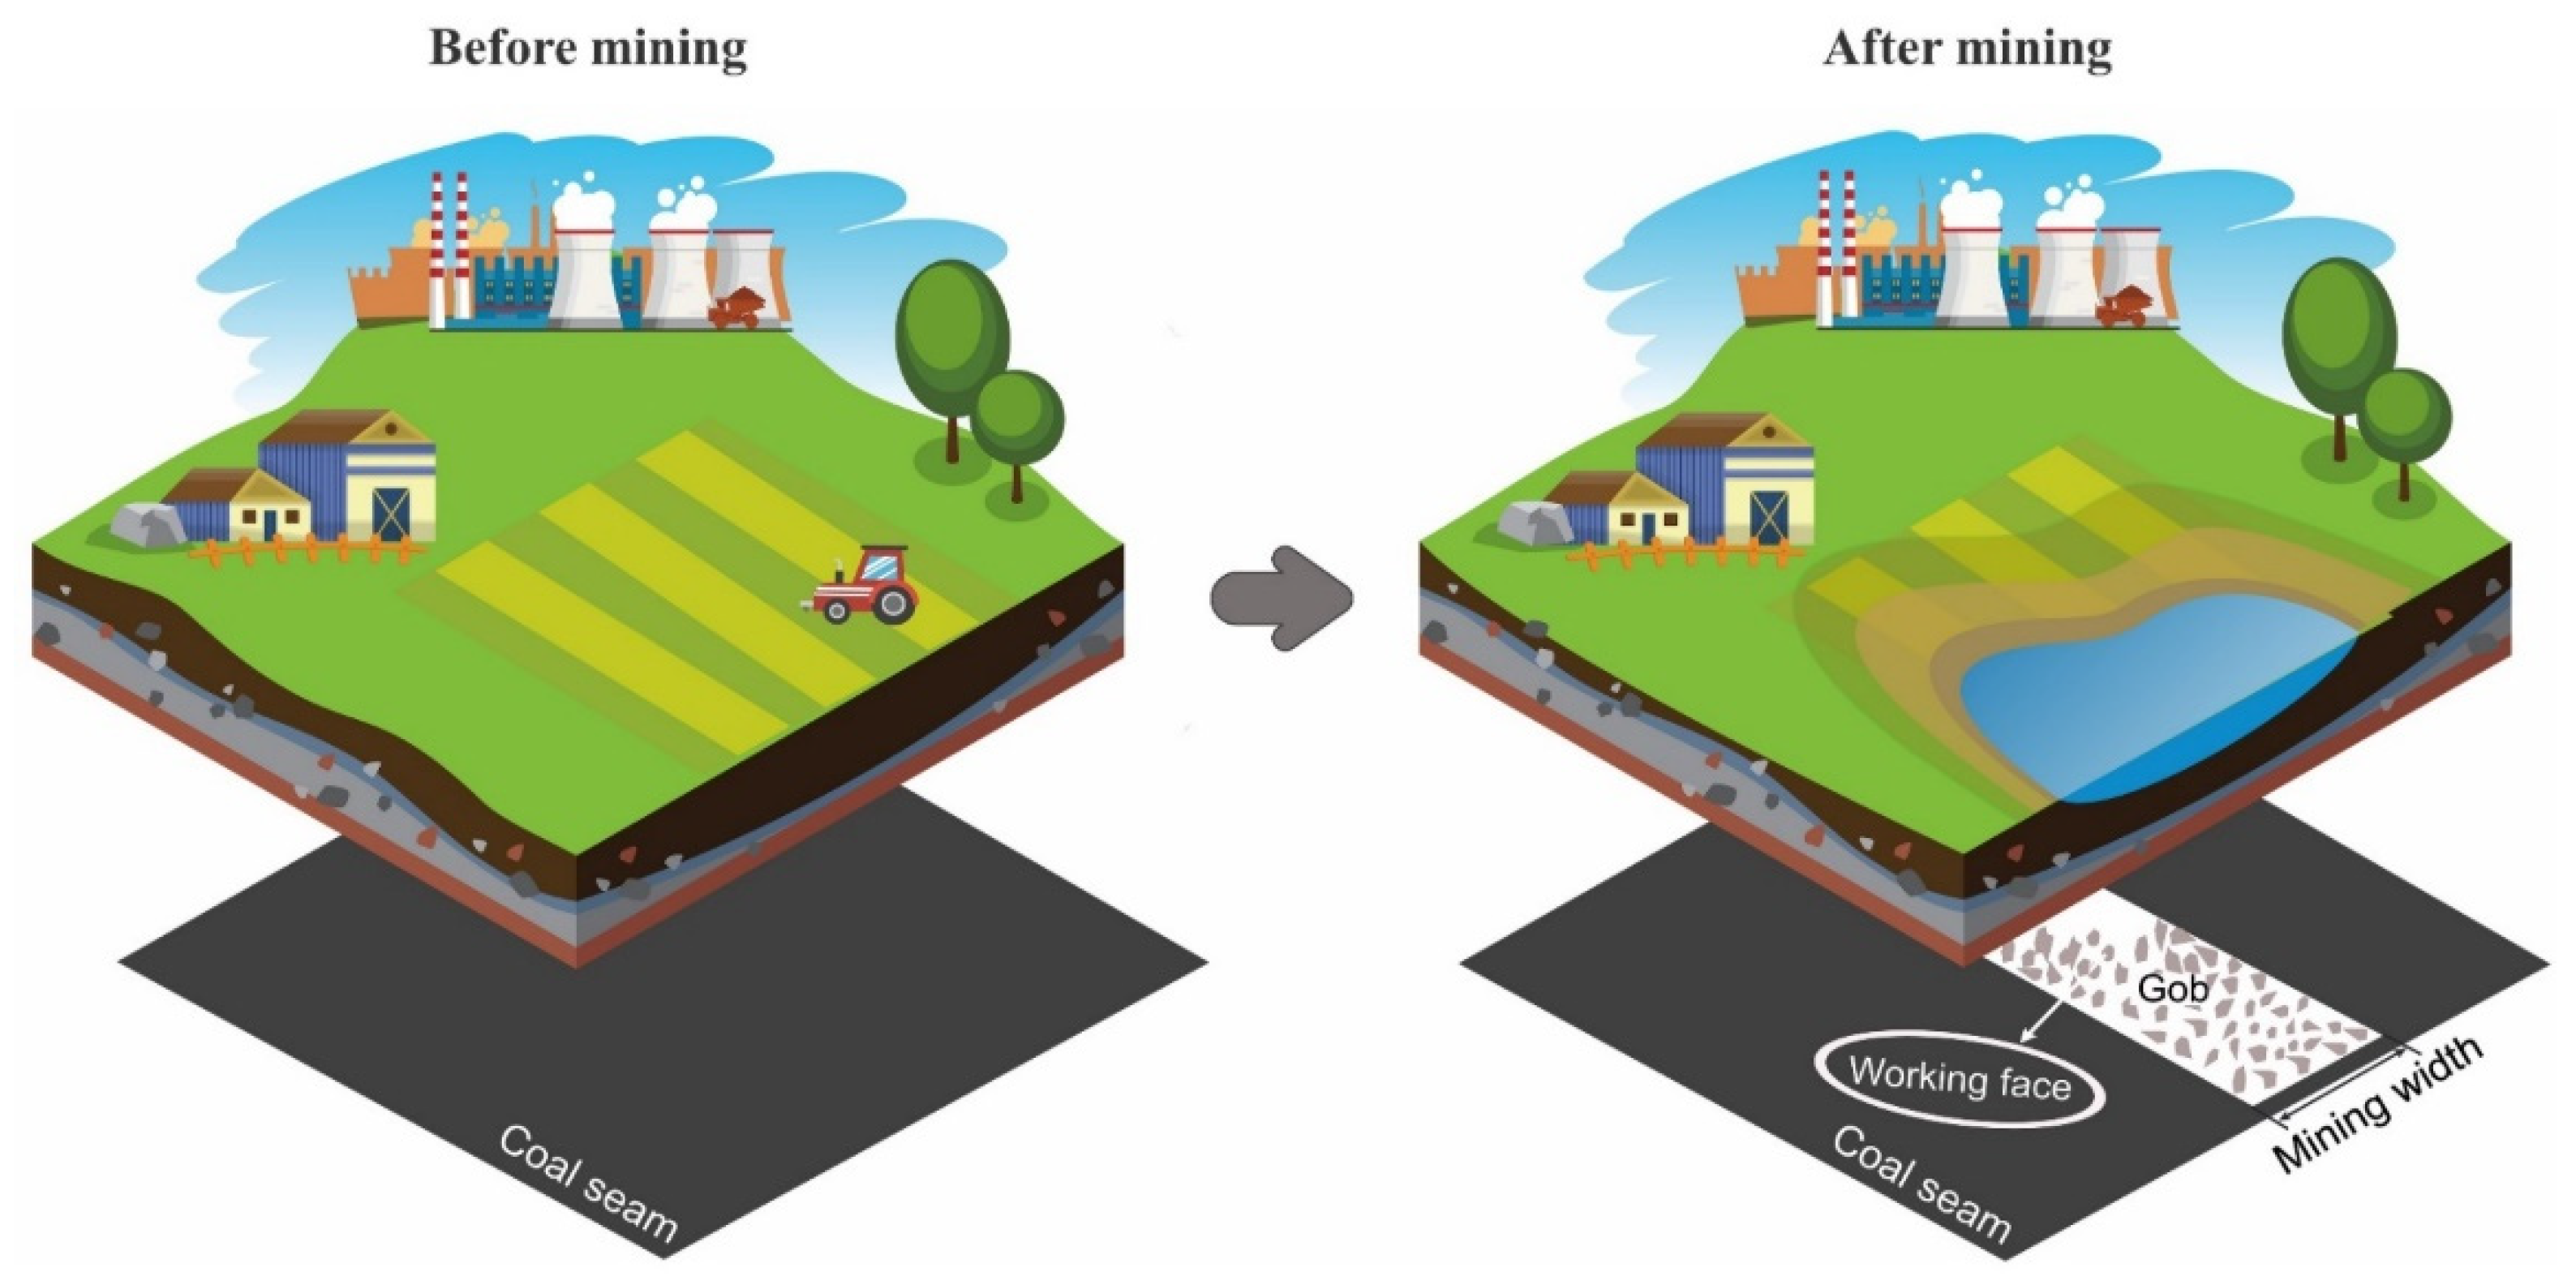
2.3.1. Principle of Predicting Mining Subsidence
2.3.2. Classification and Simulation of LULC
- (1)
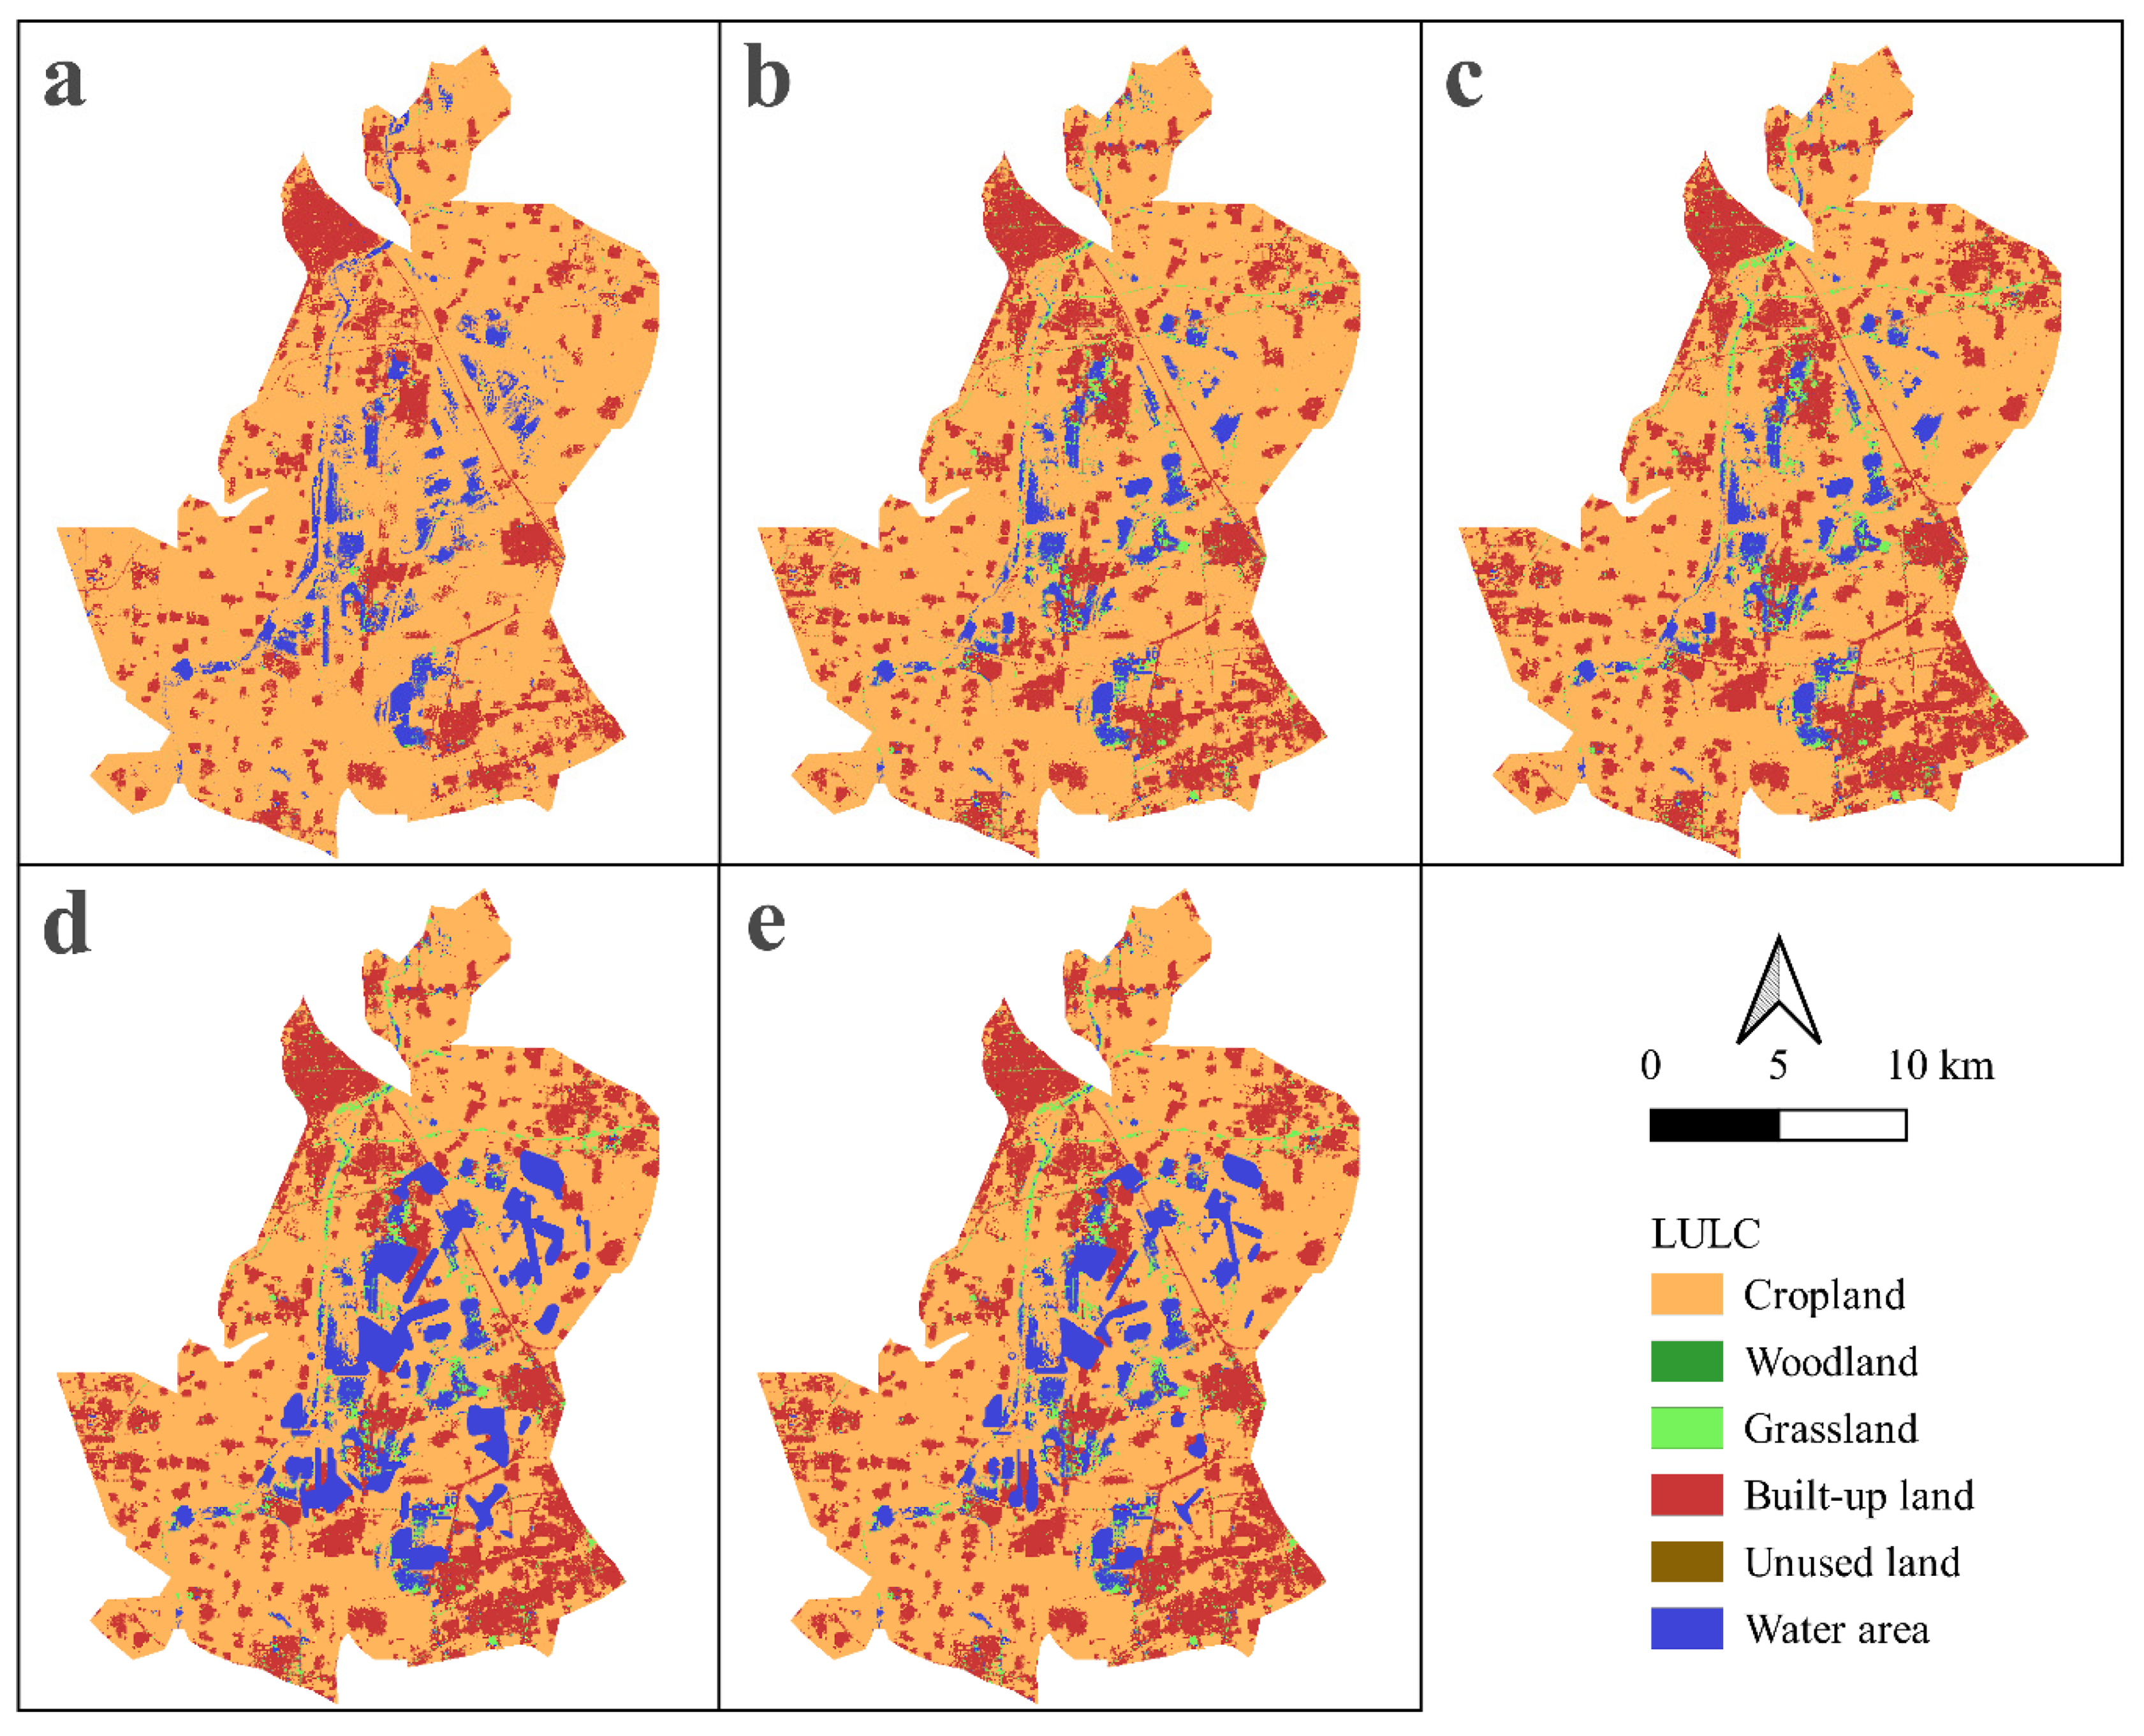
- No mining activities (NMA) scenario: It is assumed that YZC will have no mining activity until the end of 2030. The law of land use conversion is determined by the LEAS module, but the water area is no longer increasing. This scenario serves as a benchmark land use scenario to measure the impact of mining and reclamation activities on the land.
- (2)
- No reclamation after mining (NRM) scenario: Because of the small subsidence extent, the lightly damaged areas are easy to restore to the original type, while the moderately damaged areas are relatively deep in subsidence and are easy to transform from the original type into the water area.
- (3)
- Mining and reclamation (MR) scenario: The lightly damaged area is reclaimed to the original type of land. As the surface of the mining area is mainly cropland, to ensure food security, according to the principle of priority cropland, the scene of land transfer rules is set as follows: the built-up land and water area are restored to the original type of land in the moderately damaged area, other areas are restored to the cropland, the heavily damaged area is not easy to be reclaimed, and the land type is transformed into the water area.
2.3.3. Calculation of Carbon Storage
2.3.4. Spatial Analysis
3. Results
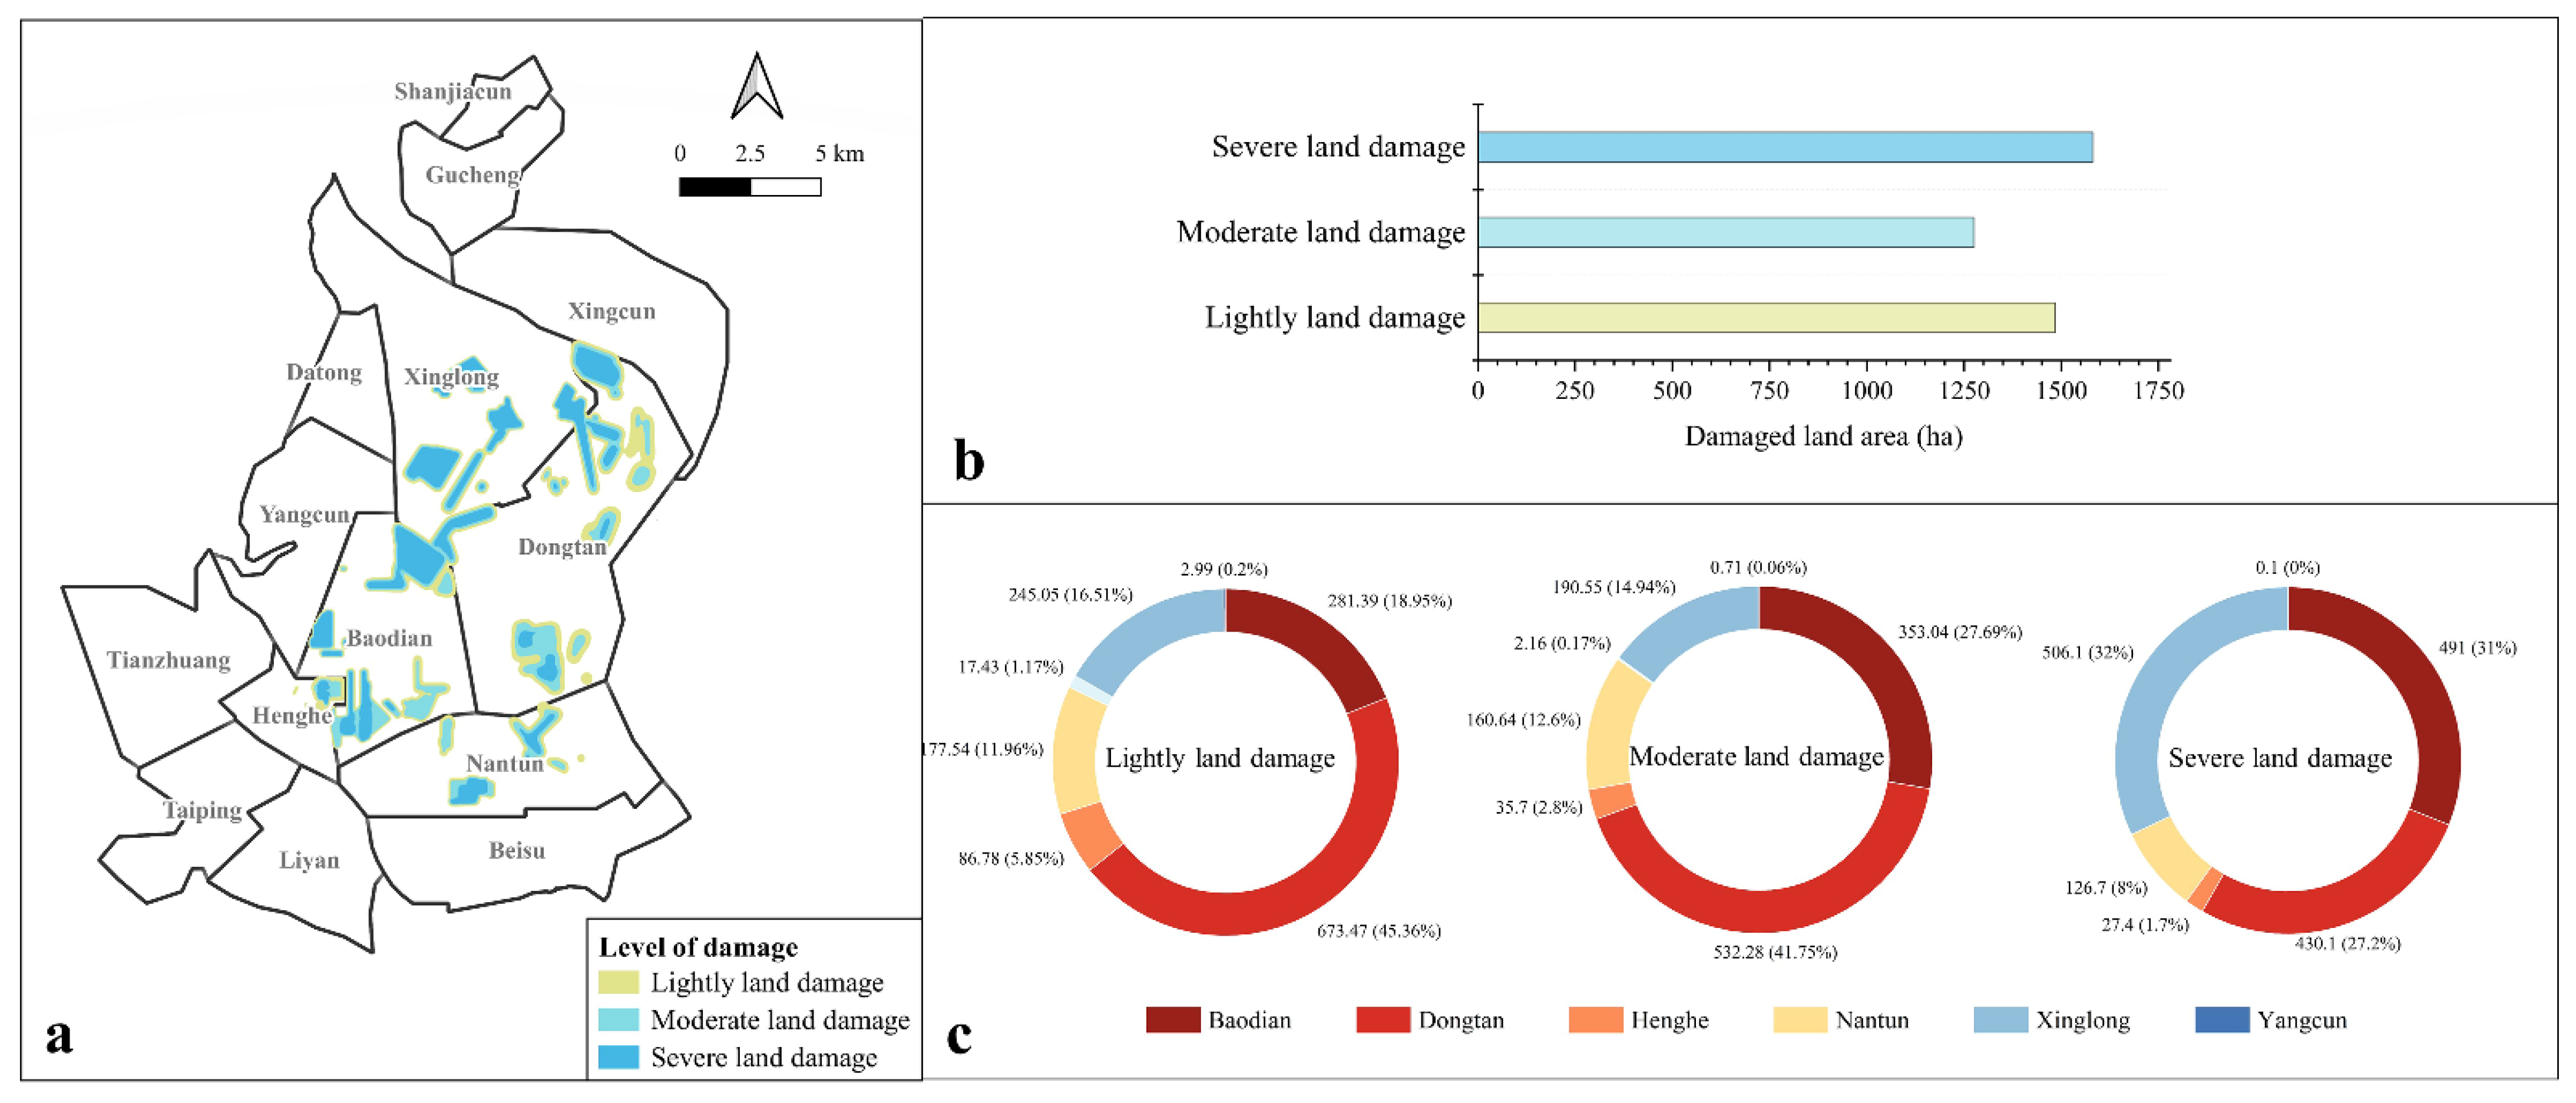
3.1. Area of Land Subsidence Expected
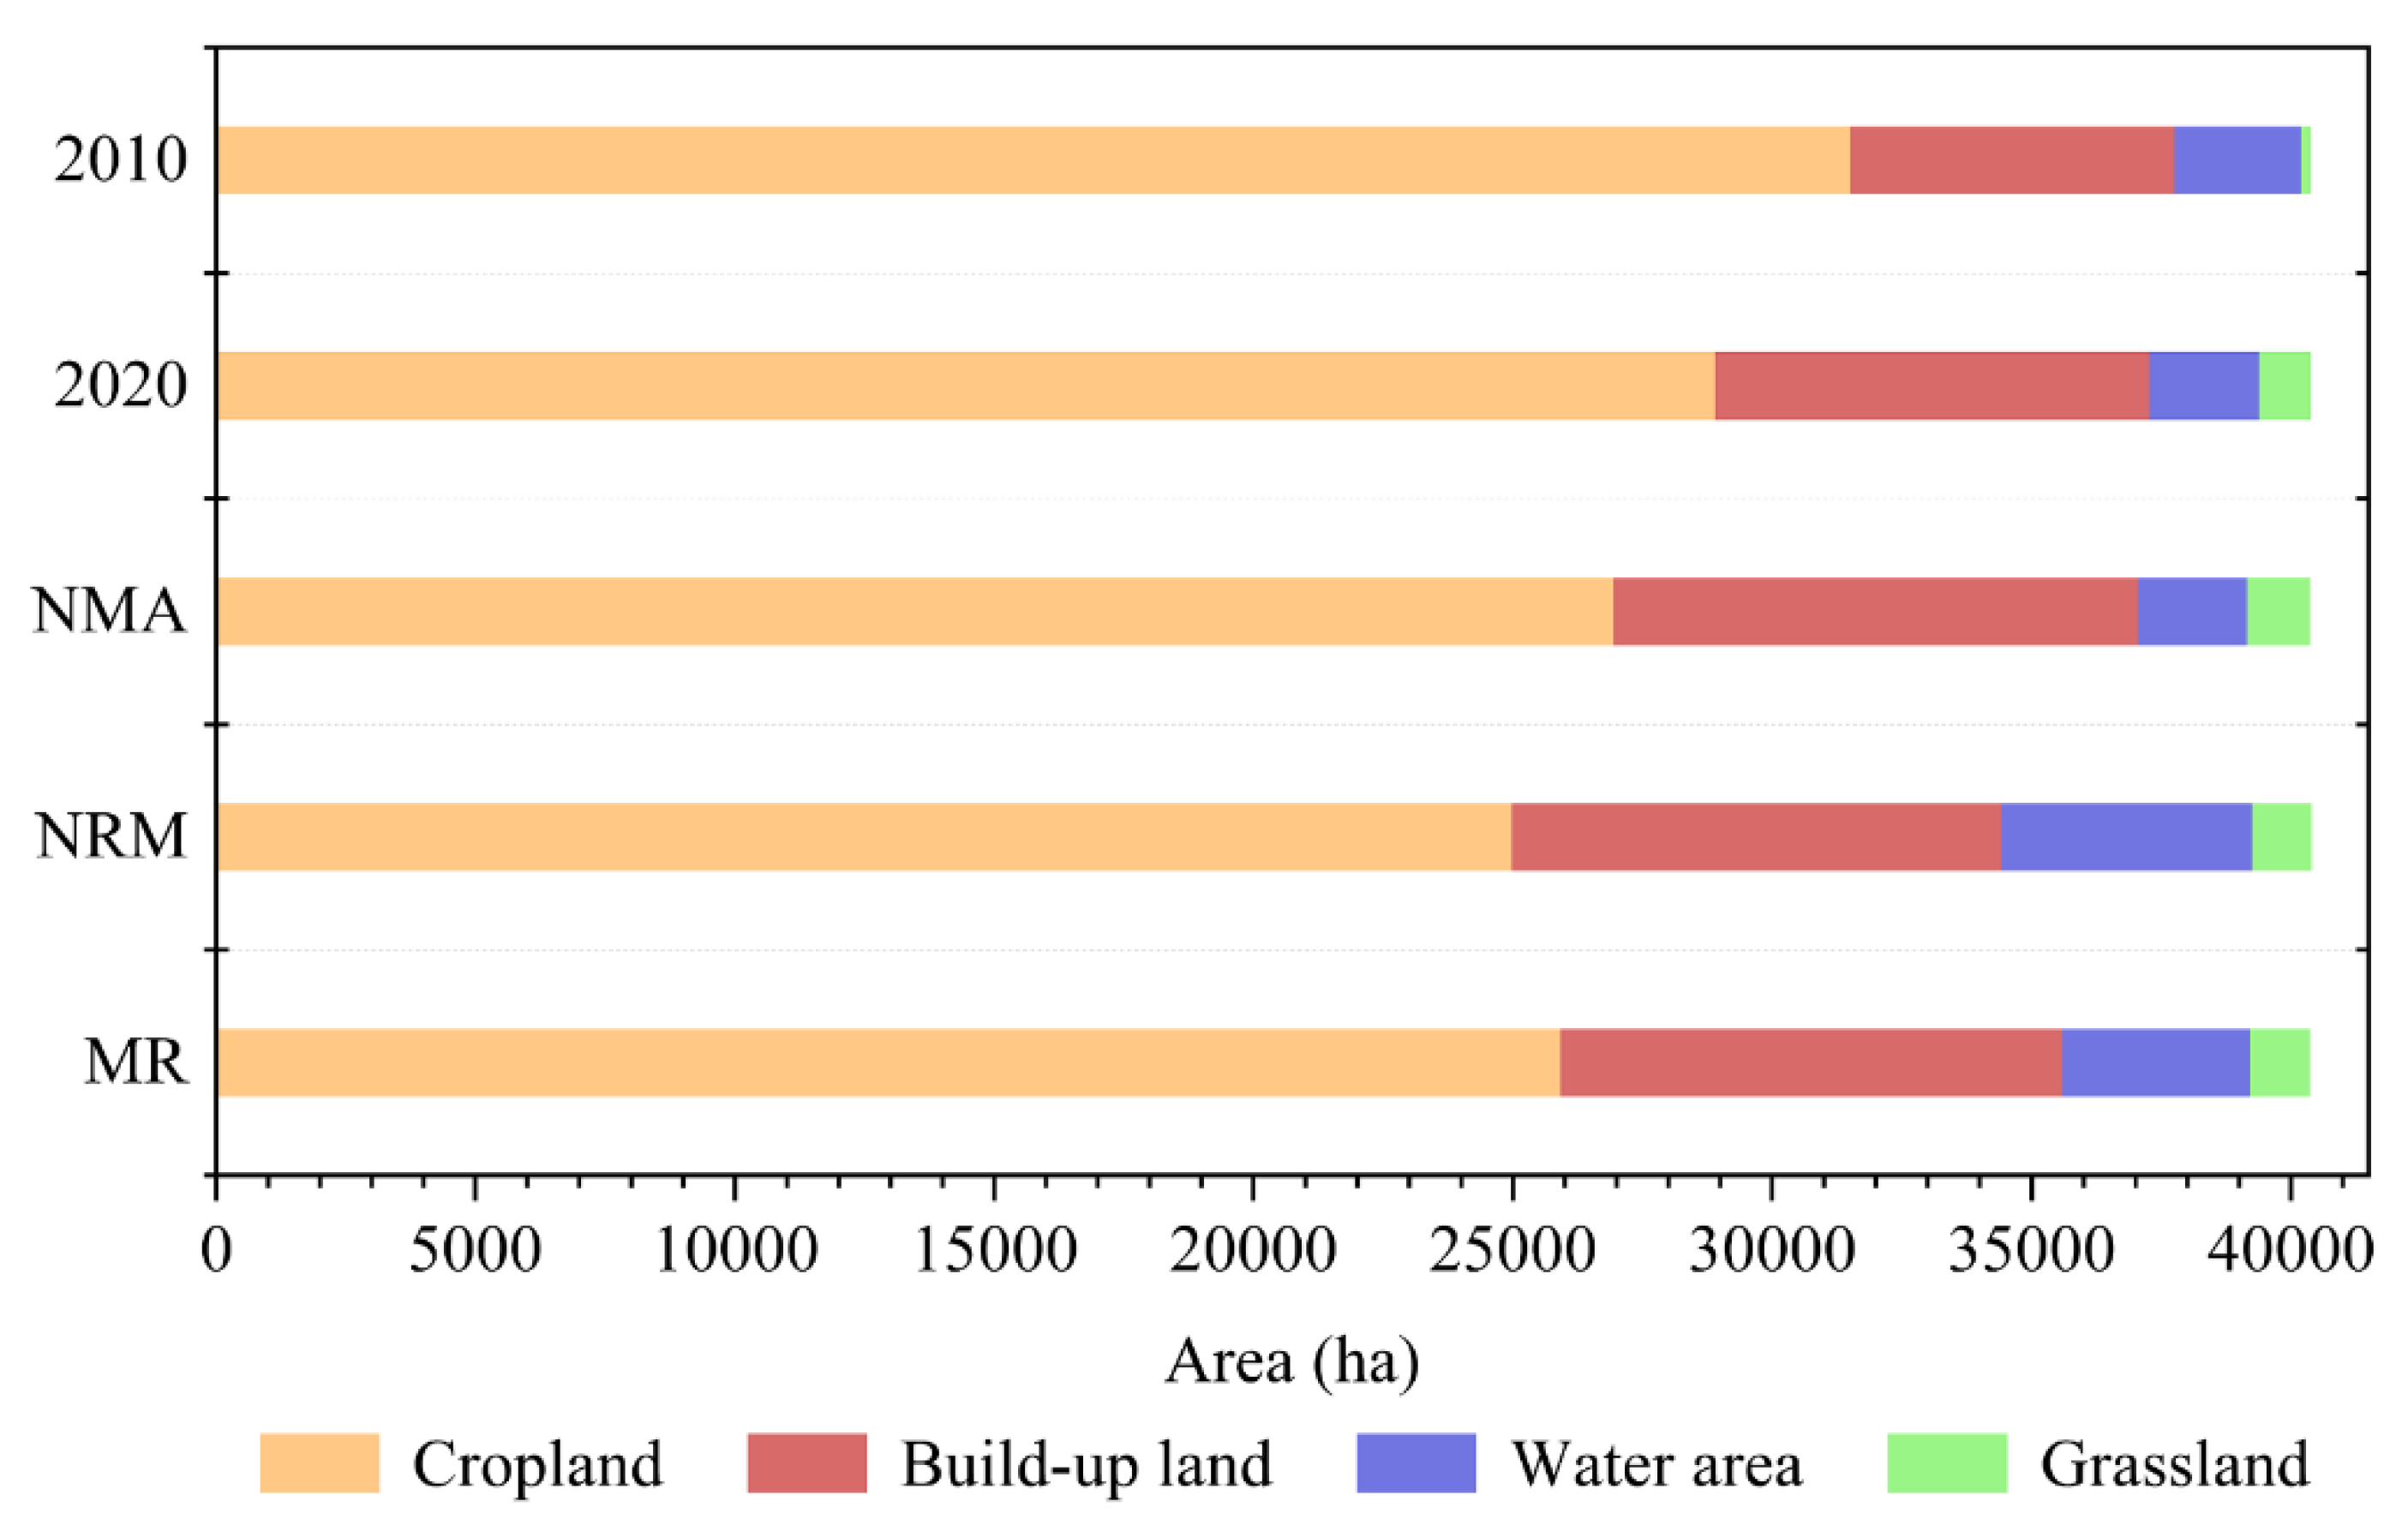
3.2. LULC Changes and Simulations
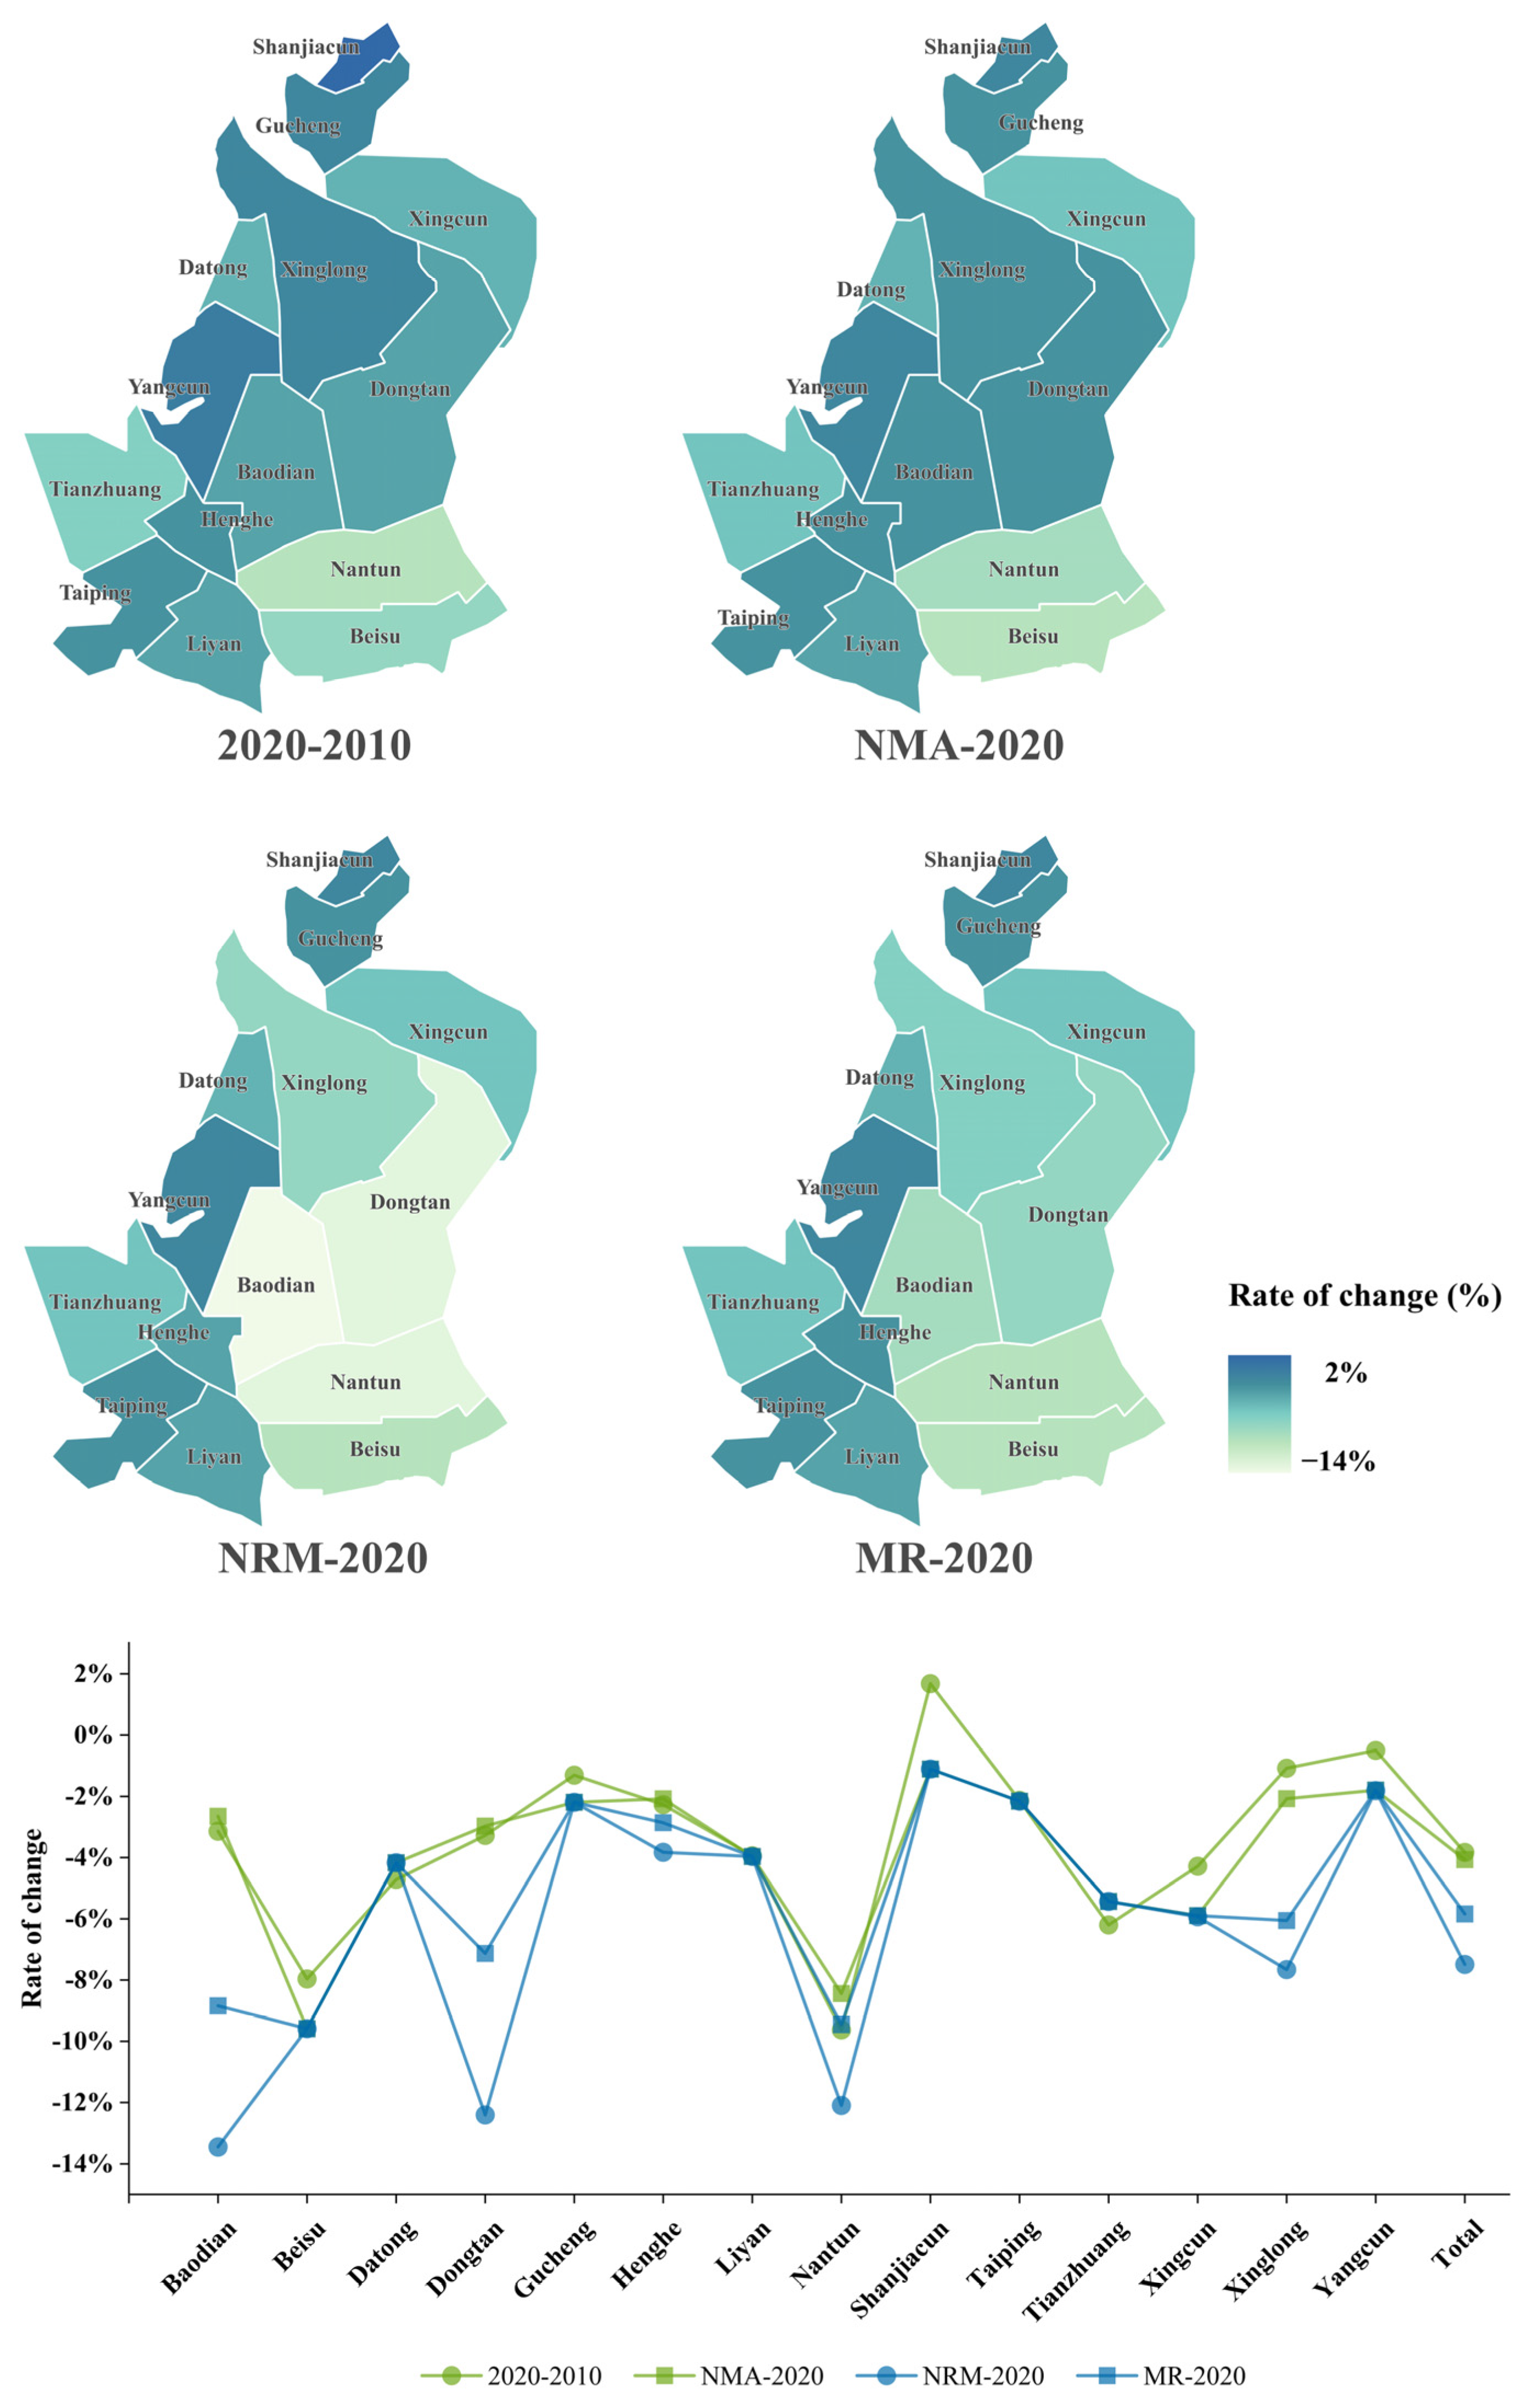
3.3. Results of Carbon Storage Estimation
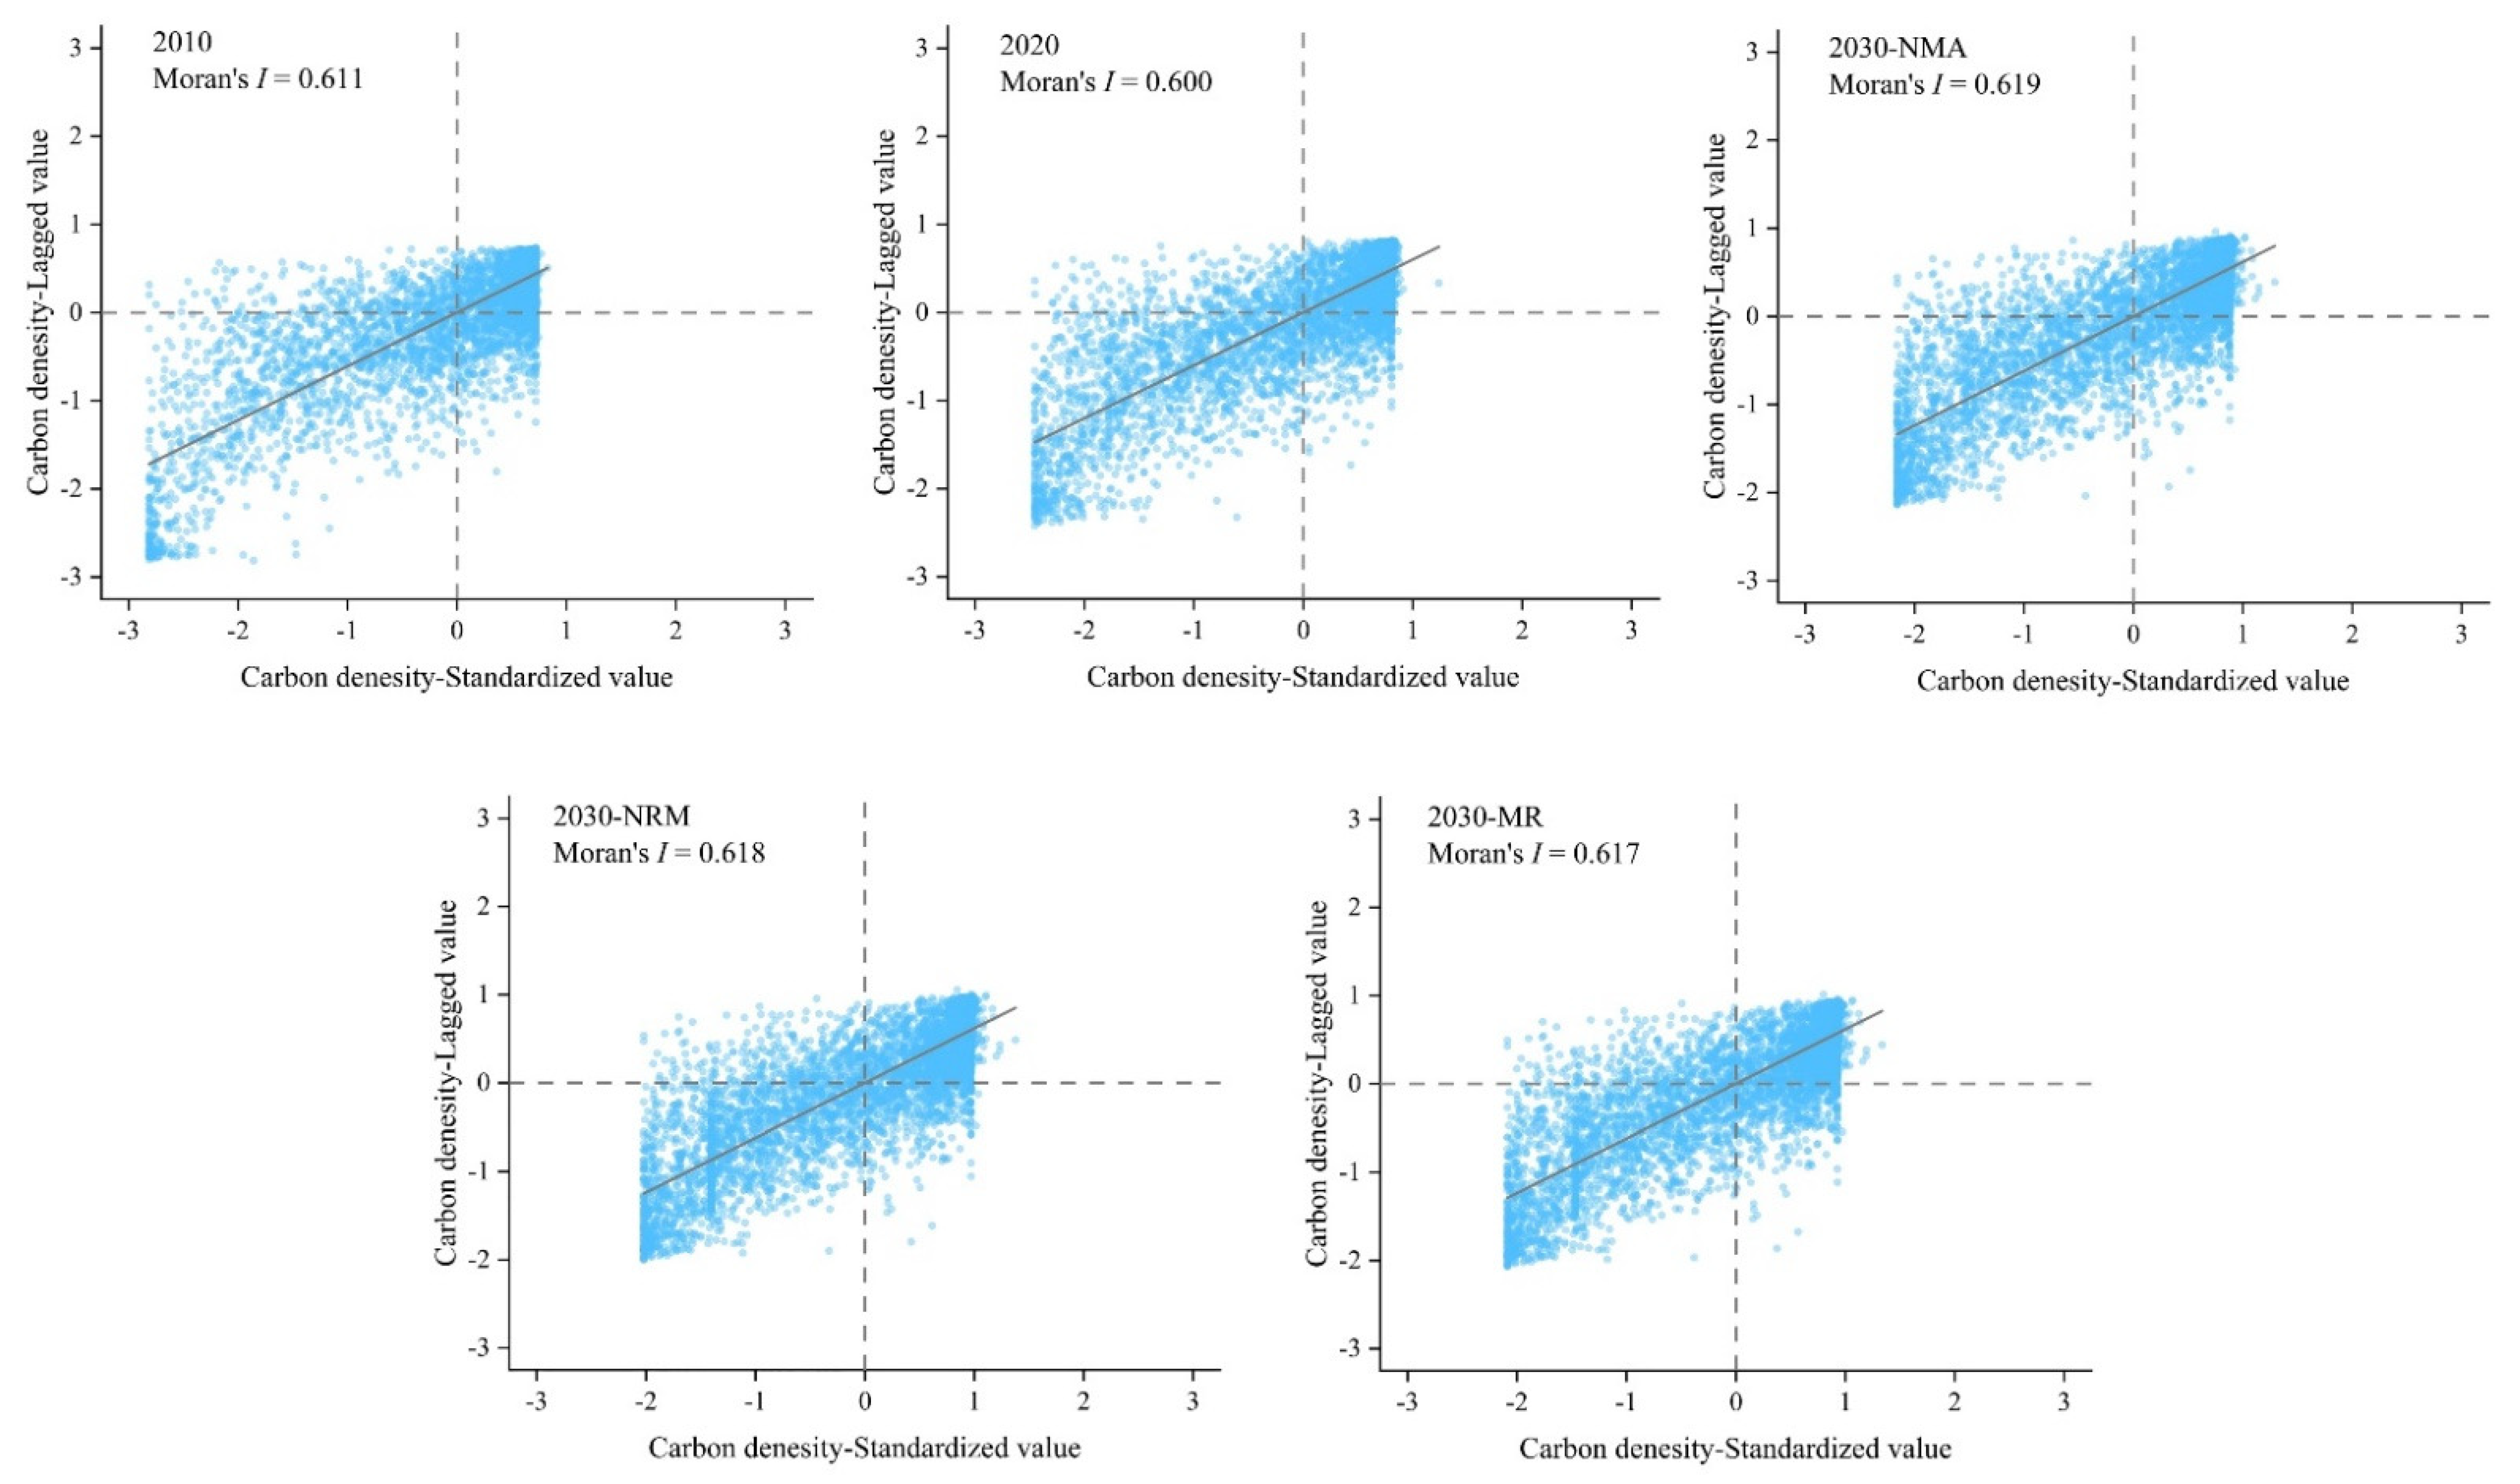
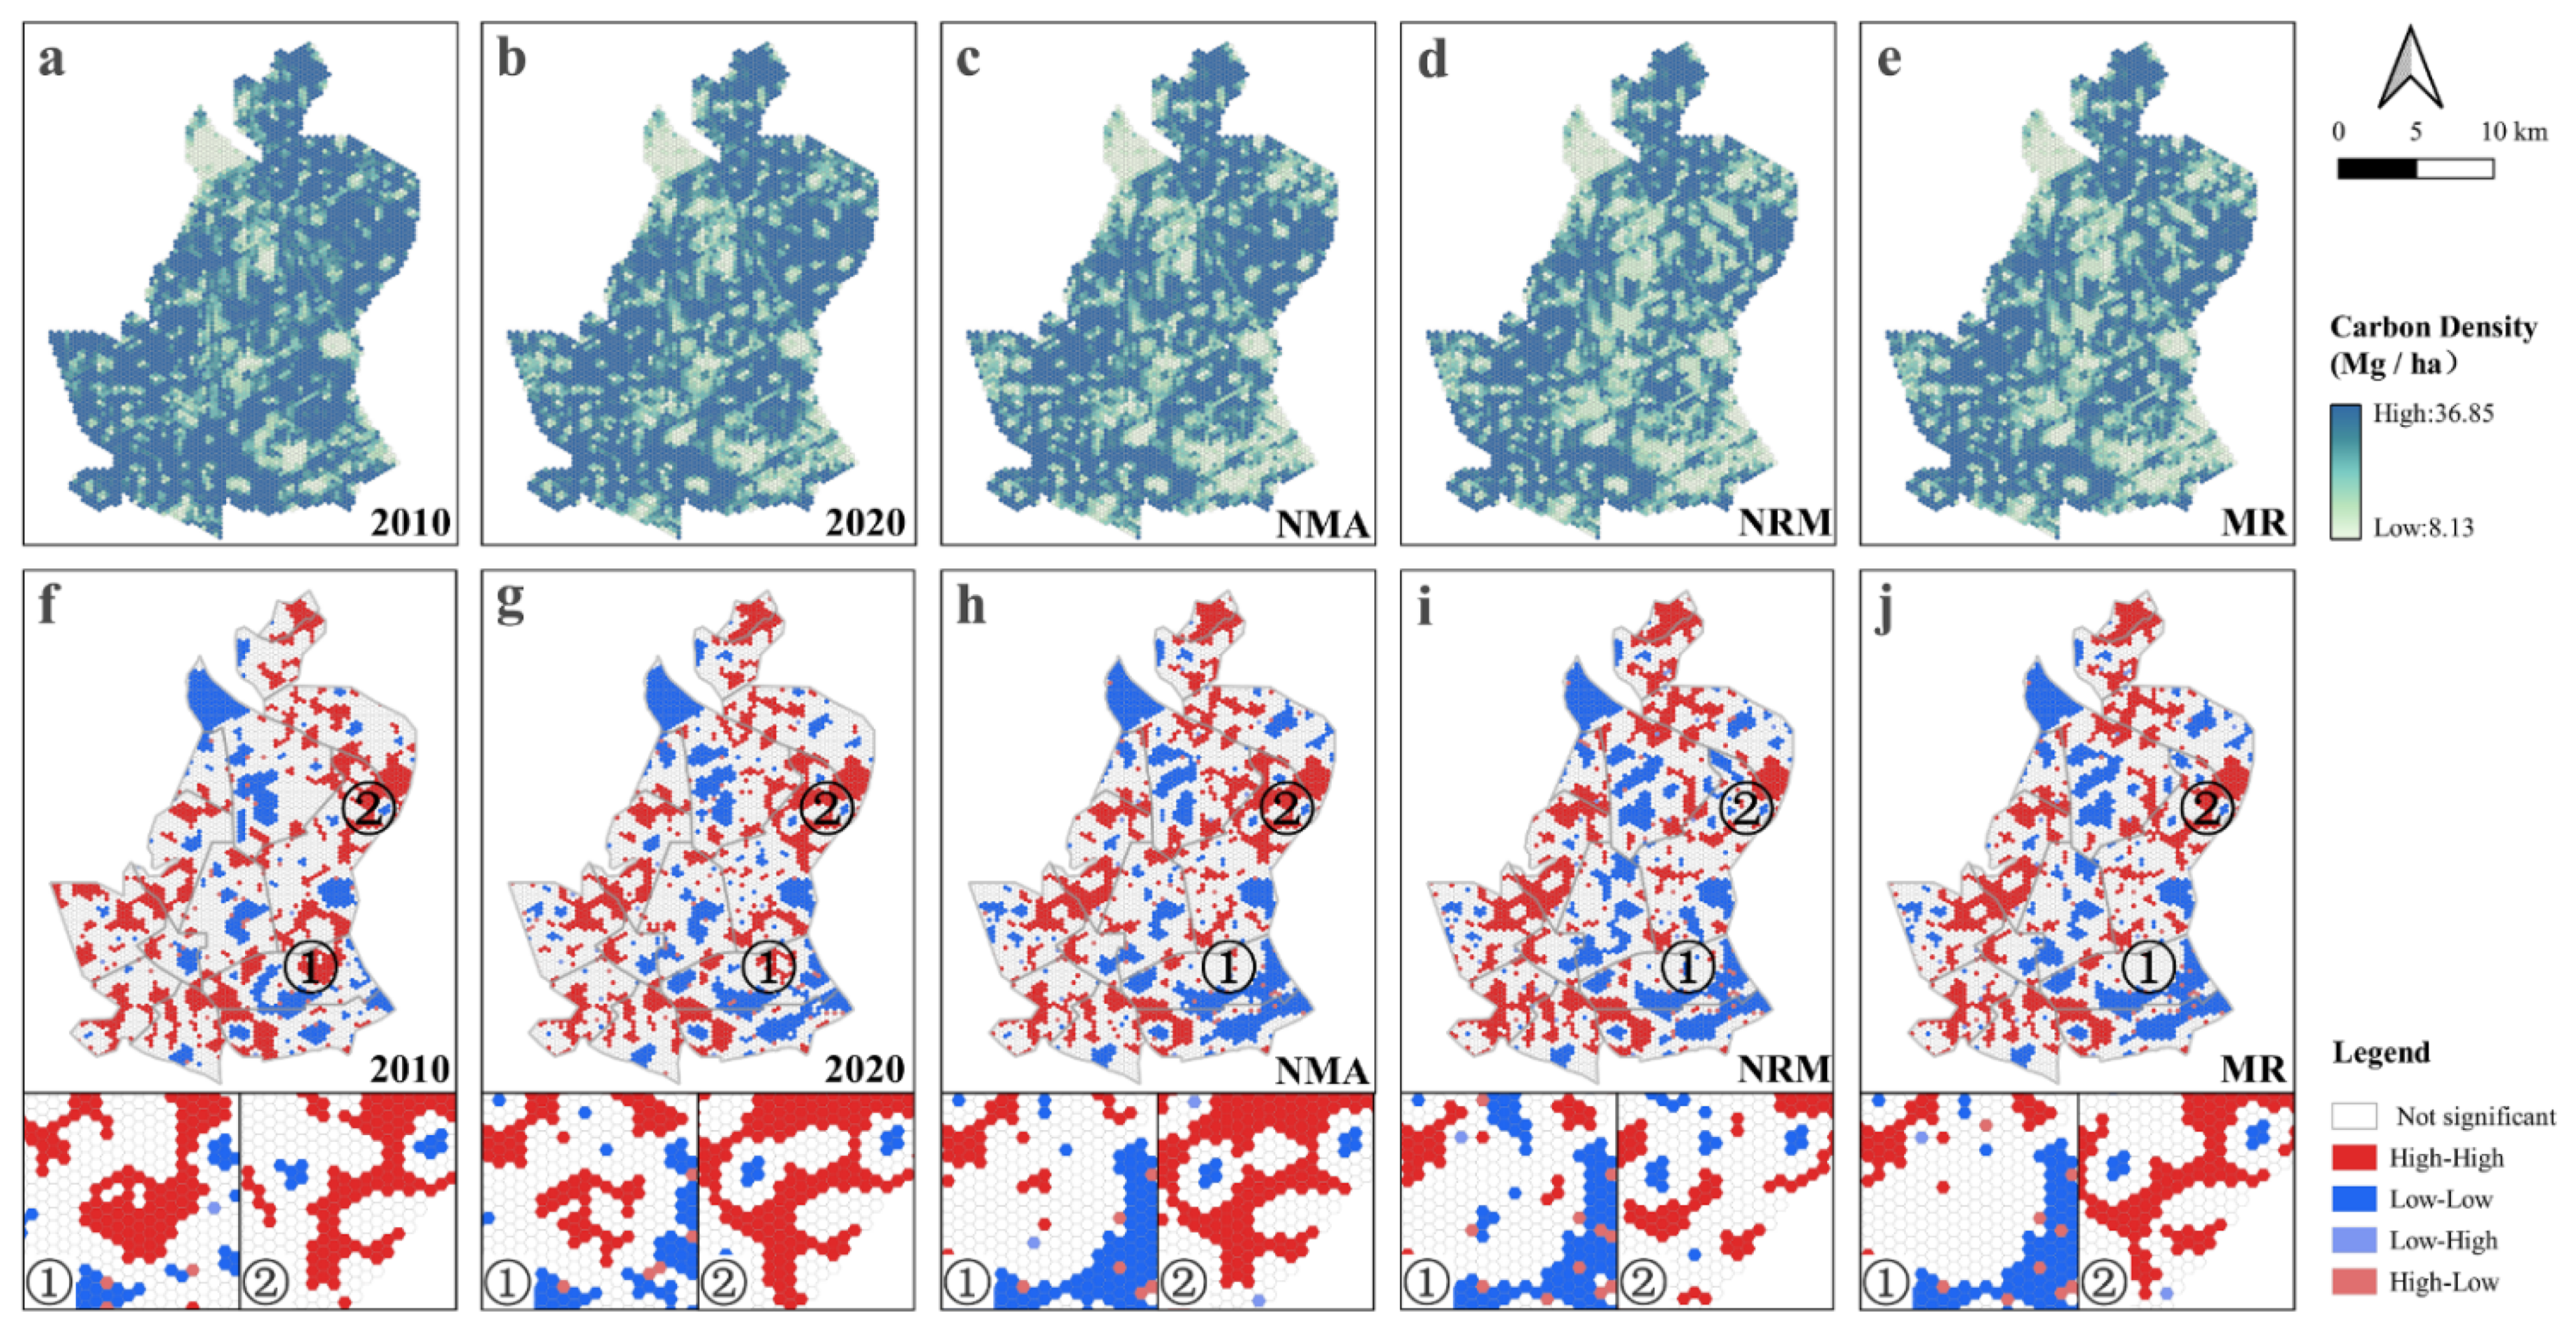
3.4. Spatial Pattern Analysis
4. Discussion
4.1. Ecological Problems in High Submersible Coal Mining Areas in Eastern China
4.2. Land Reclamation Can Effectively Alleviate the Weakening of Carbon Sequestration Function
4.3. Applicability and Limitations
5. Conclusions
Author Contributions
Funding
Institutional Review Board Statement
Informed Consent Statement
Data Availability Statement
Acknowledgments
Conflicts of Interest
References
- Kaufman, D.; McKay, N.; Routson, C.; Erb, M.; Datwyler, C.; Sommer, P.S.; Heiri, O.; Davis, B. Holocene global mean surface temperature, a multi-method reconstruction approach. Sci. Data 2020, 7, 201. [Google Scholar] [CrossRef] [PubMed]
- Nyamari, N.; Cabral, P. Impact of land cover changes on carbon stock trends in Kenya for spatial implementation of REDD plus policy. Appl. Geogr. 2021, 133, 1–12. [Google Scholar] [CrossRef]
- Keenan, T.F.; Prentice, I.C.; Canadell, J.G.; Williams, C.A.; Wang, H.; Raupach, M.; Collatz, G.J. Recent pause in the growth rate of atmospheric CO2 due to enhanced terrestrial carbon uptake. Nat. Commun. 2016, 7, 13428. [Google Scholar] [CrossRef] [PubMed] [Green Version]
- Bello, C.; Galetti, M.; Pizo, M.A.; Magnago, L.F.S.; Rocha, M.F.; Lima, R.A.F.; Peres, C.A.; Ovaskainen, O.; Jordano, P. Defaunation affects carbon storage in tropical forests. Sci. Adv. 2015, 1, e1501105. [Google Scholar] [CrossRef] [Green Version]
- Sun, W.; Liu, X. Review on carbon storage estimation of forest ecosystem and applications in China. For. Ecosyst. 2019, 7, 4. [Google Scholar] [CrossRef] [Green Version]
- Jiang, W.; Deng, Y.; Tang, Z.; Lei, X.; Chen, Z. Modelling the potential impacts of urban ecosystem changes on carbon storage under different scenarios by linking the CLUE-S and the InVEST models. Ecol. Model. 2017, 345, 30–40. [Google Scholar] [CrossRef]
- Chen, Y.; Yue, W.; Liu, X.; Zhang, L.; Chen, Y. Multi-Scenario Simulation for the Consequence of Urban Expansion on Carbon Storage: A Comparative Study in Central Asian Republics. Land 2021, 10, 608. [Google Scholar] [CrossRef]
- Richter, S.; Haase, D.; Thestorf, K.; Makki, M. Carbon Pools of Berlin, Germany: Organic Carbon in Soils and Aboveground in Trees. Urban For. Urban Green. 2020, 54, 126777. [Google Scholar] [CrossRef]
- Davies, R.W.; Morton, O.; Lawson, D.; Mallord, J.W.; Nelson, L.; Boafo, K.; Lamb, I.; Edwards, D.P. Protecting habitats in low-intensity tropical farmland using carbon-based payments for ecosystem services. Environ. Res. Lett. 2021, 16, 114022. [Google Scholar] [CrossRef]
- Tang, L.; Ke, X.; Zhou, Q.; Wang, L.; Koomen, E. Projecting future impacts of cropland reclamation policies on carbon storage. Ecol. Indic. 2020, 119, 106835. [Google Scholar] [CrossRef]
- Liu, Y.N.; Xi, M.; Zhang, X.L.; Yu, Z.D.; Kong, F.L. Carbon storage distribution characteristics of wetlands in China and its influencing factors. Chin. J. Appl. Ecol. 2019, 30, 2481–2489. [Google Scholar] [CrossRef]
- Owers, C.J.; Rogers, K.; Mazumder, D.; Woodroffe, C.D. Temperate coastal wetland near-surface carbon storage: Spatial patterns and variability. Estuar. Coast. Shelf Sci. 2020, 235, 106584. [Google Scholar] [CrossRef]
- Aller-Rojas, O.; Moreno, B.; Aponte, H.; Zavala, J. Carbon storage estimation ofLessonia trabeculatakelp beds in Southern Peru: An analysis from the San Juan de Marcona region. Carbon Manag. 2020, 11, 525–532. [Google Scholar] [CrossRef]
- Lan, T.; Gu, J.; Wen, Z. Spatial distribution characteristics of carbon storage density in typical mixed fir and broadleaf forests. Energy Rep. 2021, 7, 7315–7322. [Google Scholar] [CrossRef]
- Qiu, Z.; Feng, Z.; Song, Y.; Li, M.; Zhang, P. Carbon sequestration potential of forest vegetation in China from 2003 to 2050: Predicting forest vegetation growth based on climate and the environment. J. Clean. Prod. 2020, 252, 119715. [Google Scholar] [CrossRef]
- Zhao, J.; Ma, J.; Hou, M.; Li, S. Spatial-temporal variations of carbon storage of the global forest ecosystem under future climate change. Mitig. Adapt. Strateg. Glob. Chang. 2020, 25, 603–624. [Google Scholar] [CrossRef]
- Smale, D.A.; Pessarrodona, A.; King, N.; Burrows, M.T.; Yunnie, A.; Vance, T.; Moore, P. Environmental factors influencing primary productivity of the forest-forming kelp Laminaria hyperborea in the northeast Atlantic. Sci. Rep. 2020, 10, 12161. [Google Scholar] [CrossRef]
- Schreyer, J.; Tigges, J.; Lakes, T.; Churkina, G. Using Airborne LiDAR and QuickBird Data for Modelling Urban Tree Carbon Storage and Its Distribution-A Case Study of Berlin. Remote Sens. 2014, 6, 10636–10655. [Google Scholar] [CrossRef] [Green Version]
- Wang, Z. Estimating of terrestrial carbon storage and its internal carbon exchange under equilibrium state. Ecol. Model. 2019, 401, 94–110. [Google Scholar] [CrossRef]
- Bandaru, V.; West, T.O.; Ricciuto, D.M.; Izaurralde, R.C. Estimating crop net primary production using national inventory data and MODIS-derived parameters. ISPRS J. Photogramm. 2013, 80, 61–71. [Google Scholar] [CrossRef]
- Smith, W.K.; Reed, S.C.; Cleveland, C.C.; Ballantyne, A.P.; Anderegg, W.R.L.; Wieder, W.R.; Liu, Y.Y.; Running, S.W. Large divergence of satellite and Earth system model estimates of global terrestrial CO2 fertilization. Nat. Clim. Chang. 2016, 6, 306–310. [Google Scholar] [CrossRef]
- Aneseyee, A.B.; Soromessa, T.; Elias, E.; Noszczyk, T.; Hernik, J.; Benti, N.E. Expressing carbon storage in economic terms: The case of the upper Omo Gibe Basin in Ethiopia. Sci. Total Environ. 2021, 808, 152166. [Google Scholar] [CrossRef] [PubMed]
- Beller, E.E.; Kelly, M.; Larsen, L.G. From savanna to suburb: Effects of 160 years of landscape change on carbon storage in Silicon Valley, California. Landsc. Urban Plan. 2020, 195, 103712. [Google Scholar] [CrossRef]
- Li, J.; Gong, J.; Guldmann, J.; Li, S.; Zhu, J. Carbon Dynamics in the Northeastern Qinghai-Tibetan Plateau from 1990 to 2030 Using Landsat Land Use/Cover Change Data. Remote Sens. 2020, 12, 528. [Google Scholar] [CrossRef] [Green Version]
- Zhu, G.; Qiu, D.; Zhang, Z.; Sang, L.; Liu, Y.; Wang, L.; Zhao, K.; Ma, H.; Xu, Y.; Wan, Q. Land-use changes lead to a decrease in carbon storage in arid region, China. Ecol. Indic. 2021, 127, 107770. [Google Scholar] [CrossRef]
- Paegelow, M.; Olmedo, M. Possibilities and limits of prospective GIS land cover modelling—A compared case study: Garrotxes (France) and Alta Alpujarra Granadina (Spain). Int. J. Geogr. Inf. Sci. 2005, 19, 697–722. [Google Scholar] [CrossRef] [Green Version]
- Verburg, P.H.; Overmars, K.P. Combining top-down and bottom-up dynamics in land use modeling: Exploring the future of abandoned farmlands in Europe with the Dyna-CLUE model. Landsc. Ecol. 2009, 24, 1167–1181. [Google Scholar] [CrossRef]
- Liu, X.; Liang, X.; Li, X.; Xu, X.; Ou, J.; Chen, Y.; Li, S.; Wang, S.; Pei, F. A future land use simulation model (FLUS) for simulating multiple land use scenarios by coupling human and natural effects. Landsc. Urban Plan. 2017, 168, 94–116. [Google Scholar] [CrossRef]
- Liang, X.; Guan, Q.; Clarke, K.C.; Liu, S.; Wang, B.; Yao, Y. Understanding the drivers of sustainable land expansion using a patch-generating land use simulation (PLUS) model: A case study in Wuhan, China. Comput. Environ. Urban Syst. 2021, 85, 101569. [Google Scholar] [CrossRef]
- Mukhopadhyay, S.; Masto, R.E. Carbon storage in coal mine spoil by Dalbergia sissoo Roxb. Geoderma 2016, 284, 204–213. [Google Scholar] [CrossRef]
- Campbell, J.E.; Fox, J.F.; Acton, P.M. Terrestrial carbon losses from mountaintop coal mining offset regional forest carbon sequestration in the 21st century. Environ. Res. Lett. 2012, 7, 7. [Google Scholar] [CrossRef]
- Huang, Y.; Tian, F.; Wang, Y.; Wang, M.; Hu, Z. Effect of coal mining on vegetation disturbance and associated carbon loss. Environ. Earth Sci. 2015, 73, 2329–2342. [Google Scholar] [CrossRef]
- Dawen, Q.; Changzhen, Y.; Lina, X.; Kun, F. The impact of mining changes on surrounding lands and ecosystem service value in the Southern Slope of Qilian Mountains. Ecol. Complex. 2018, 36, 138–148. [Google Scholar] [CrossRef]
- Hou, H.; Zhang, S.; Ding, Z.; Huang, A.; Tian, Y. Spatiotemporal dynamics of carbon storage in terrestrial ecosystem vegetation in the Xuzhou coal mining area, China. Environ. Earth Sci. 2015, 74, 1657–1669. [Google Scholar] [CrossRef]
- Yang, B.; Bai, Z.; Cao, Y.; Xie, F.; Zhang, J.; Wang, Y. Dynamic Changes in Carbon Sequestration from Opencast Mining Activities and Land Reclamation in China’s Loess Plateau. Sustainability 2019, 11, 1473. [Google Scholar] [CrossRef] [Green Version]
- Hu, Z.; Yang, G.; Xiao, W.; Li, J.; Yang, Y.; Yu, Y. Farmland damage and its impact on the overlapped areas of cropland and coal resources in the eastern plains of China. Resour. Conserv. Recycl. 2014, 86, 1–8. [Google Scholar] [CrossRef]
- Li, G.; Hu, Z.; Li, P.; Yuan, D.; Wang, W.; Yang, K. The optimal framework and model to balance underground coal mining and cropland protection in Jining, eastern China. Resour. Policy 2021, 74, 102307. [Google Scholar] [CrossRef]
- Xu, Z.; Zhang, Y.; Yang, J.; Liu, F.; Bi, R.; Zhu, H.; Lv, C.; Yu, J. Effect of Underground Coal Mining on the Regional Soil Organic Carbon Pool in Farmland in a Mining Subsidence Area. Sustainability 2019, 11, 4961. [Google Scholar] [CrossRef] [Green Version]
- Li, S.; Zhao, Y.; Xiao, W.; Yellishetty, M.; Yang, D. Identifying ecosystem service bundles and the spatiotemporal characteristics of trade-offs and synergies in coal mining areas with a high groundwater table. Sci. Total Environ. 2022, 807, 151036. [Google Scholar] [CrossRef]
- Xiao, W.; Fu, Y.; Wang, T.; Lv, X. Effects of land use transitions due to underground coal mining on ecosystem services in high groundwater table areas: A case study in the Yanzhou coalfield. Land Use Policy 2018, 71, 213–221. [Google Scholar] [CrossRef]
- Peng, S.; Qin, S.; Wang, M.; Li, G. Mining subsidence prediction for multi-seam and non-rectangular goafs based on probability integral model: A case study from China. Arab. J. Geosci. 2021, 14, 1231. [Google Scholar] [CrossRef]
- Wu, K.; Jin, J. Prediction of dynamic mining subsidence parameters by time series analysis method. J. China Univ. Min. Technol. 2000, 29, 413–415. [Google Scholar]
- Guo, J.; Hu, Z.; Yuan, D.; Liang, Y.; Li, P.; Yang, K.; Fu, Y. Dynamic evolution of cultivated land fragmentation in coal mining subsidence area of the Lower Yellow River Basin: A case study of Jining city, Shandong Province. J. China Coal Soc. 2021, 46, 3039–3055. [Google Scholar]
- Deng, K.; Zhang, D.; Zhang, Z. Study on prediction and control of surface subsidence in deep mining. J. China Univ. Min. Technol. 2000, 29, 52–55. [Google Scholar]
- Li, G.; Hu, Z.; Li, P.; Yuan, D.; Wang, W.; Han, J.; Yang, K. Optimal layout of underground coal mining with ground development or protection: A case study of Jining, China. Resour. Policy 2022, 76, 102639. [Google Scholar] [CrossRef]
- Breiman, L. Random forests. Mach. Learn. 2001, 45, 5–32. [Google Scholar] [CrossRef] [Green Version]
- Talukdar, S.; Singha, P.; Mahato, S.; Shahfahad; Pal, S.; Liou, Y.; Rahman, A. Land-Use Land-Cover Classification by Machine Learning Classifiers for Satellite Observations—A Review. Remote Sens. 2020, 12, 1135. [Google Scholar] [CrossRef] [Green Version]
- Pal, M. Random forest classifier for remote sensing classification. Int. J. Remote Sens. 2005, 26, 217–222. [Google Scholar] [CrossRef]
- Xu, X.; Liu, J.; Zhang, S.; Li, R.; Changzhen, Y.; Wu, S. China’s Multi-Period Land Use Land Cover Remote Sensing Monitoring Dataset (CNLUCC); Resource and Environment Data Cloud Platform: Beijing, China, 2018. (In Chinese) [Google Scholar] [CrossRef]
- Li, C.; Wu, Y.; Gao, B.; Zheng, K.; Wu, Y.; Li, C. Multi-scenario simulation of ecosystem service value for optimization of land use in the Sichuan-Yunnan ecological barrier, China. Ecol. Indic. 2021, 132, 108328. [Google Scholar] [CrossRef]
- Nelson, E.; Mendoza, G.; Regetz, J.; Polasky, S.; Tallis, H.; Cameron, D.R.; Chan, K.M.A.; Daily, G.C.; Goldstein, J.; Kareiva, P.M.; et al. Modeling multiple ecosystem services, biodiversity conservation, commodity production, and tradeoffs at landscape scales. Front. Ecol. Environ. 2009, 7, 4–11. [Google Scholar] [CrossRef]
- Sharps, K.; Masante, D.; Thomas, A.; Jackson, B.; Redhead, J.; May, L.; Prosser, H.; Cosby, B.; Emmett, B.; Jones, L. Comparing strengths and weaknesses of three ecosystem services modelling tools in a diverse UK river catchment. Sci. Total Environ. 2017, 584, 118–130. [Google Scholar] [CrossRef] [PubMed] [Green Version]
- Goldstein, J.H.; Caldarone, G.; Duarte, T.K.; Ennaanay, D.; Hannahs, N.; Mendoza, G.; Polasky, S.; Wolny, S.; Daily, G.C. Integrating ecosystem-service tradeoffs into land-use decisions. Proc. Natl. Acad. Sci. USA 2012, 109, 7565–7570. [Google Scholar] [CrossRef] [PubMed] [Green Version]
- Raymond, P.A.; Oh, N. An empirical study of climatic controls on riverine C export from three major U.S. watersheds. Glob. Biogeochem. Cycles 2007, 21, 21. [Google Scholar] [CrossRef] [Green Version]
- Tan, Q.; Han, W.; Li, X.; Wang, G. Clarifying the response of soil organic carbon storage to increasing temperature through minimizing the precipitation effect. Geoderma 2020, 374, 114398. [Google Scholar] [CrossRef]
- Tang, X.; Zhao, X.; Bai, Y.; Tang, Z.; Wang, W.; Zhao, Y.; Wan, H.; Xie, Z.; Shi, X.; Wu, B.; et al. Carbon pools in China’s terrestrial ecosystems: New estimates based on an intensive field survey. Proc. Natl. Acad. Sci. USA 2018, 115, 4021–4026. [Google Scholar] [CrossRef] [PubMed] [Green Version]
- Alam, S.A.; Starr, M.; Clark, B.J.F. Tree biomass and soil organic carbon densities across the Sudanese woodland savannah: A regional carbon sequestration study. J. Arid Environ. 2013, 89, 67–76. [Google Scholar] [CrossRef]
- Zhou, J.; Zhao, Y.; Huang, P.; Zhao, X.; Feng, W.; Li, Q.; Xue, D.; Dou, J.; Shi, W.; Wei, W.; et al. Impacts of ecological restoration projects on the ecosystem carbon storage of inland river basin in arid area, China. Ecol. Indic. 2020, 118, 106803. [Google Scholar] [CrossRef]
- Ma, T.; Li, X.; Bai, J.; Ding, S.; Zhou, F.; Cui, B. Four decades’ dynamics of coastal blue carbon storage driven by land use/land cover transformation under natural and anthropogenic processes in the Yellow River Delta, China. Sci. Total Environ. 2019, 655, 741–750. [Google Scholar] [CrossRef]
- Shoman, W.; Alganci, U.; Demirel, H. A comparative analysis of gridding systems for point-based land cover/use analysis. Geocarto Int. 2019, 34, 867–886. [Google Scholar] [CrossRef]
- Birch, C.P.D.; Oom, S.P.; Beecham, J.A. Rectangular and hexagonal grids used for observation, experiment and simulation in ecology. Ecol. Model. 2007, 206, 347–359. [Google Scholar] [CrossRef]
- Guan, J.; Yu, P. Does Coal Mining Have Effects on Land Use Changes in a Coal Resource-Based City? Evidence from Huaibei City on the North China Plain. Int. J. Environ. Res. Public Health 2021, 18, 11616. [Google Scholar] [CrossRef] [PubMed]
- Li, Z.; Wu, S.; Zhang, S.; Nie, C.; Li, Y.; Huang, Y. Optimization of Land Reuse Structure in Coal Mining Subsided Areas Considering Regional Economic Development: A Case Study in Pei County, China. Sustainability 2020, 12, 3335. [Google Scholar] [CrossRef] [Green Version]
- He, T.; Xiao, W.; Zhao, Y.; Deng, X.; Hu, Z. Identification of waterlogging in Eastern China induced by mining subsidence: A case study of Google Earth Engine time-series analysis applied to the Huainan coal field. Remote Sens. Environ. 2020, 242, 111742. [Google Scholar] [CrossRef]
- Yang, Y.; Zhang, Y.; Su, X.; Hou, H.; Zhang, S. The spatial distribution and expansion of subsided wetlands induced by underground coal mining in eastern China. Environ. Earth Sci. 2021, 80, 112. [Google Scholar] [CrossRef]
- Jiang, C.; Wang, L.; Yu, X.; Wei, T.; Chi, S.; Guo, Q. Prediction of 3D deformation due to large gradient mining subsidence based on InSAR and constraints of IDPIM model. Int. J. Remote Sens. 2021, 42, 188–219. [Google Scholar] [CrossRef]
- Zhao, Y.; Lyu, X.; Xiao, W.; Tian, S.; Zhang, J.; Hu, Z.; Fu, Y. Evaluation of the soil profile quality of subsided land in a coal mining area backfilled with river sediment based on monitoring wheat growth biomass with UAV systems. Environ. Monit. Assess. 2021, 193, 576. [Google Scholar] [CrossRef]
- Chen, W.; Li, W.; Yang, Z.; Wang, Q. Analysis of mining-induced variation of the water table and potential benefits for ecological vegetation: A case study of Jinjitan coal mine in Yushenfu mining area, China. Hydrogeol. J. 2021, 29, 1629–1645. [Google Scholar] [CrossRef]
- Chugh, Y.P. Concurrent mining and reclamation for underground coal mining subsidence impacts in China. Int. J. Coal Sci. Technol. 2018, 1, 18–35. [Google Scholar] [CrossRef] [Green Version]
- Hu, Z.; Zhang, R.; Chugh, Y.P.; Jia, J. Mitigating mine subsidence dynamically to minimize impacts on farmland and water resources: A case study. Int. J. Environ. Pollut. 2016, 59, 169–186. [Google Scholar] [CrossRef]
- Agus, C.; Putra, P.B.; Faridah, E.; Wulandari, D.; Napitupulu, R.R.P. Organic carbon stock and their dynamics in rehabilitation ecosystem areas of post open coal mining at tropical region. Procedia Eng. 2016, 159, 329–337. [Google Scholar] [CrossRef] [Green Version]
- Jiao, Z.; Wang, J.; Yang, R.; Li, X. Study on soil carbon sequestration in the Heidaigou opencast coal mine. Adv. Environ. Technol. 2013, 726–731, 204–208. [Google Scholar] [CrossRef]
- Park, J.H.; Gan, J.; Park, C. Discrepancies between Global Forest Net Primary Productivity Estimates Derived from MODIS and Forest Inventory Data and Underlying Factors. Remote Sens. 2021, 13, 1441. [Google Scholar] [CrossRef]
- Cleveland, C.C.; Taylor, P.; Chadwick, K.D.; Dahlin, K.; Doughty, C.E.; Malhi, Y.; Smith, W.K.; Sullivan, B.W.; Wieder, W.R.; Townsend, A.R. A comparison of plot-based satellite and Earth system model estimates of tropical forest net primary production. Glob. Biogeochem. Cycles 2015, 29, 626–644. [Google Scholar] [CrossRef] [Green Version]
- Jayathunga, S.; Owari, T.; Tsuyuki, S. The use of fixed-wing UAV photogrammetry with LiDAR DTM to estimate merchantable volume and carbon stock in living biomass over a mixed conifer-broadleaf forest. Int. J. Appl. Earth Obs. Geoinf. 2018, 73, 767–777. [Google Scholar] [CrossRef]
- Frankenberg, C.; O’Dell, C.; Berry, J.; Guanter, L.; Joiner, J.; Koehler, P.; Pollock, R.; Taylor, T.E. Prospects for chlorophyll fluorescence remote sensing from the Orbiting Carbon Observatory-2. Remote Sens. Environ. 2014, 147, 1–12. [Google Scholar] [CrossRef] [Green Version]


| Data Name | Spatial Resolution | Sources |
|---|---|---|
| Soil type | 1 km | HWSD v1.2 |
| Precipitation | 1 km | WorldClimv2.1 |
| Temperature | ||
| DEM | 30 m | SRTM1 v3.0 |
| GDP density | 1 km | http://www.geodoi.ac.cn/ (accessed on 6 December 2021) |
| Population density | ||
| Road network information | - | https://www.openstreetmap.org/ (accessed on 6 December 2021) |
| Distribution of railway stations | - | http://lbsyun.baidu.com/ (accessed on 6 December 2021) |
| Government location | - |
| NRM | MR | |
|---|---|---|
| Light damage | Natural restoration to the original LULC | Natural restoration to the original LULC |
| Moderate damage | All LULC will be converted to the water area | Built-up land and water will be restored to the original land. Other LULC will be reclaimed for cropland |
| Severe damage | All LULC will be converted to the water area | All LULC will be converted to the water area |
| Cropland | 11.71 | 3.19 | 18.08 | 0.43 |
| Woodland | 36.40 | 7.88 | 19.40 | 2.99 |
| Grassland | 13.41 | 5.96 | 16.05 | 1.50 |
| Built-up land | 0.00 | 0.00 | 8.13 | 0.00 |
| Unused areas | 1.06 | 0.00 | 15.24 | 0.00 |
| Water area | 2.13 | 1.06 | 10.16 | 0.00 |
| LULC Type | 2010 | 2020 | ||
|---|---|---|---|---|
| PA (%) | UA (%) | PA (%) | UA (%) | |
| Cropland | 94.18% | 93.17% | 94.73% | 97.02% |
| Woodland | 88.00% | 78.57% | 84.00% | 72.41% |
| Grassland | 91.00% | 79.82% | 89.00% | 83.96% |
| Built-up land | 89.33% | 93.71% | 94.00% | 95.92% |
| Unused areas | 56.00% | 66.67% | 52.00% | 59.09% |
| Water area | 87.33% | 94.93% | 93.33% | 88.05% |
| OA (%) | 91.00% | 92.50% | ||
| kappa | 0.86 | 0.88 | ||
| 2010 | 2020 | NMA | NRM | MR | ||||||
|---|---|---|---|---|---|---|---|---|---|---|
| Mg | Mg/ha | Mg | Mg/ha | Mg | Mg/ha | Mg | Mg/ha | Mg | Mg/ha | |
| Baodian | 95,097.97 | 27.05 | 92,114.36 | 26.20 | 89,675.94 | 25.50 | 79,722.99 | 22.67 | 83,969.50 | 23.88 |
| Beisu | 79,173.56 | 27.09 | 72,867.65 | 24.93 | 65,880.23 | 22.54 | 65,880.23 | 22.54 | 65,880.23 | 22.54 |
| Datong | 33,162.10 | 28.39 | 31,598.83 | 27.05 | 30,282.25 | 25.92 | 30,282.25 | 25.92 | 30,282.25 | 25.92 |
| Dongtan | 176,068.13 | 29.39 | 170,302.82 | 28.42 | 165,247.74 | 27.58 | 149,167.59 | 24.90 | 158,160.24 | 26.40 |
| Gucheng | 48,217.04 | 28.95 | 47,587.00 | 28.57 | 46,544.92 | 27.94 | 46,544.92 | 27.94 | 46,544.92 | 27.94 |
| Henghe | 29,207.00 | 27.50 | 28,543.83 | 26.88 | 27,951.31 | 26.32 | 27,451.27 | 25.85 | 27,726.96 | 26.11 |
| Liyan | 65,943.97 | 29.52 | 63,345.92 | 28.36 | 60,835.32 | 27.23 | 60,835.32 | 27.23 | 60,835.32 | 27.23 |
| Nantun | 97,611.11 | 27.40 | 88,211.17 | 24.77 | 80,763.19 | 22.67 | 77,539.11 | 21.77 | 79,869.75 | 22.42 |
| Shanjiacun | 18,436.03 | 30.75 | 18,746.12 | 31.26 | 18,538.82 | 30.92 | 18,538.82 | 30.92 | 18,538.82 | 30.92 |
| Taiping | 65,574.81 | 30.26 | 64,180.26 | 29.61 | 62,796.85 | 28.98 | 62,796.85 | 28.98 | 62,796.85 | 28.98 |
| Tianzhuang | 97,304.52 | 30.29 | 91,270.22 | 28.42 | 86,311.79 | 26.87 | 86,311.79 | 26.87 | 86,311.79 | 26.87 |
| Xingcun | 113,058.93 | 30.08 | 108,220.02 | 28.79 | 101,840.17 | 27.09 | 101,796.83 | 27.08 | 101,839.59 | 27.09 |
| Xinglong | 141,720.12 | 24.55 | 140,189.05 | 24.29 | 137,284.50 | 23.78 | 129,452.26 | 22.43 | 131,698.73 | 22.82 |
| Yangcun | 82,649.87 | 30.11 | 82,235.22 | 29.95 | 80,759.83 | 29.42 | 80,745.52 | 29.41 | 80,761.82 | 29.42 |
| Total | 1,143,225.16 | 28.31 | 1,099,412.47 | 27.23 | 1,054,712.87 | 26.12 | 1,017,065.75 | 25.19 | 1,035,216.79 | 25.64 |
Publisher’s Note: MDPI stays neutral with regard to jurisdictional claims in published maps and institutional affiliations. |
© 2022 by the authors. Licensee MDPI, Basel, Switzerland. This article is an open access article distributed under the terms and conditions of the Creative Commons Attribution (CC BY) license (https://creativecommons.org/licenses/by/4.0/).
Share and Cite
Han, J.; Hu, Z.; Mao, Z.; Li, G.; Liu, S.; Yuan, D.; Guo, J. How to Account for Changes in Carbon Storage from Coal Mining and Reclamation in Eastern China? Taking Yanzhou Coalfield as an Example to Simulate and Estimate. Remote Sens. 2022, 14, 2014. https://doi.org/10.3390/rs14092014
Han J, Hu Z, Mao Z, Li G, Liu S, Yuan D, Guo J. How to Account for Changes in Carbon Storage from Coal Mining and Reclamation in Eastern China? Taking Yanzhou Coalfield as an Example to Simulate and Estimate. Remote Sensing. 2022; 14(9):2014. https://doi.org/10.3390/rs14092014
Chicago/Turabian StyleHan, Jiazheng, Zhenqi Hu, Zhen Mao, Gensheng Li, Shuguang Liu, Dongzhu Yuan, and Jiaxin Guo. 2022. "How to Account for Changes in Carbon Storage from Coal Mining and Reclamation in Eastern China? Taking Yanzhou Coalfield as an Example to Simulate and Estimate" Remote Sensing 14, no. 9: 2014. https://doi.org/10.3390/rs14092014