1. Introduction
Understanding landscape evolution and human interaction within it is a key task for early Holocene research. As mobile hunter-gatherers leave few traces of structural organization, understanding the prehistoric landscapes is relevant for comprehending these people. Thus, stratigraphy and geomorphology (among other factors) must be taken into account when reconstructing ancient paleolandscapes.
Floodplain margins, lake shorelines, and coasts were preferred settlement areas in the Mesolithic period that provided access to water and hence favorable conditions for human activity and habitats [
1,
2]. Therefore, wetland margins are important zones in archaeological and geoarchaeological research. Investigating the structure and evolution of the lake–land interface and the land–lake areal distribution is the main method for understanding human adaptation in these environments. This is of special relevance, as these techniques grant chances for good preservation conditions and, therefore, the possibility of acquiring deeper insights into prehistoric life than with dry-land sites. Paleoenvironmental reconstruction of wetland development depends critically on knowledge of the peatland stratigraphy and the underlying lake sediments (gyttja), whose understanding permits an evaluation of the preservation conditions of archeologically relevant layers.
In general, the anthropogenic features of a Mesolithic camp are fireplaces and features connected with hazelnut-roasting activities, such as scatters of lithic artefacts. However, no method is yet available that can be used to locate the hearths before excavation. Despite their ephemeral nature, these features are of high scientific value to archaeologists because they are key to understanding hunter-gatherers’ responses to changing environments [
3,
4].
In this study, we present an investigation of a Mesolithic settlement area, Lake Duvensee, which is exemplary for the development of its sites from a lake landscape in the Mesolithic to a bog today.
The overarching goal of our study was to understand the living conditions of Mesolithic people and their use of a changing landscape. For this purpose, archaeological investigations had to be conducted on multiple scales. Theses scales ranged from features on the scale of hectares, such as the previous land –lake distribution that defined the frame of landscape development, to the human artefacts measured in centimeters.
This overarching goal can be broken down into the following concrete objectives, which were reached through multi-scale exploration, and which form the subjects of this paper:
Creating a 3Dmodel of the paleolandscape, including lake-bottom topography and stratigraphy as a general frame of investigations.
Identifying former islands and shorelines to establish likely settlement places and to clarify the landscape transformation during and after human occupation.
Determining the growth rates of islands in the growing bog in order to quantify the change of habitable space.
Identifying small-scale features to find evidence of settlement places.
We approached this multi-scale exploration task by conducting a high-resolution ground radar survey using a GPR antenna array, a 16-channel MALÅ Imaging Radar Array (MIRA). It had all the required capabilities: high mobility for large-scale areal coverage, dense sensor spacing for small-scale detection, and depth-sensitivity (in contrast to magnetic surveying) for reconstructing stratigraphy. We show that it is essential to combine this surveying with targeted excavations and drillings in order to fully develop the potential of this technique.
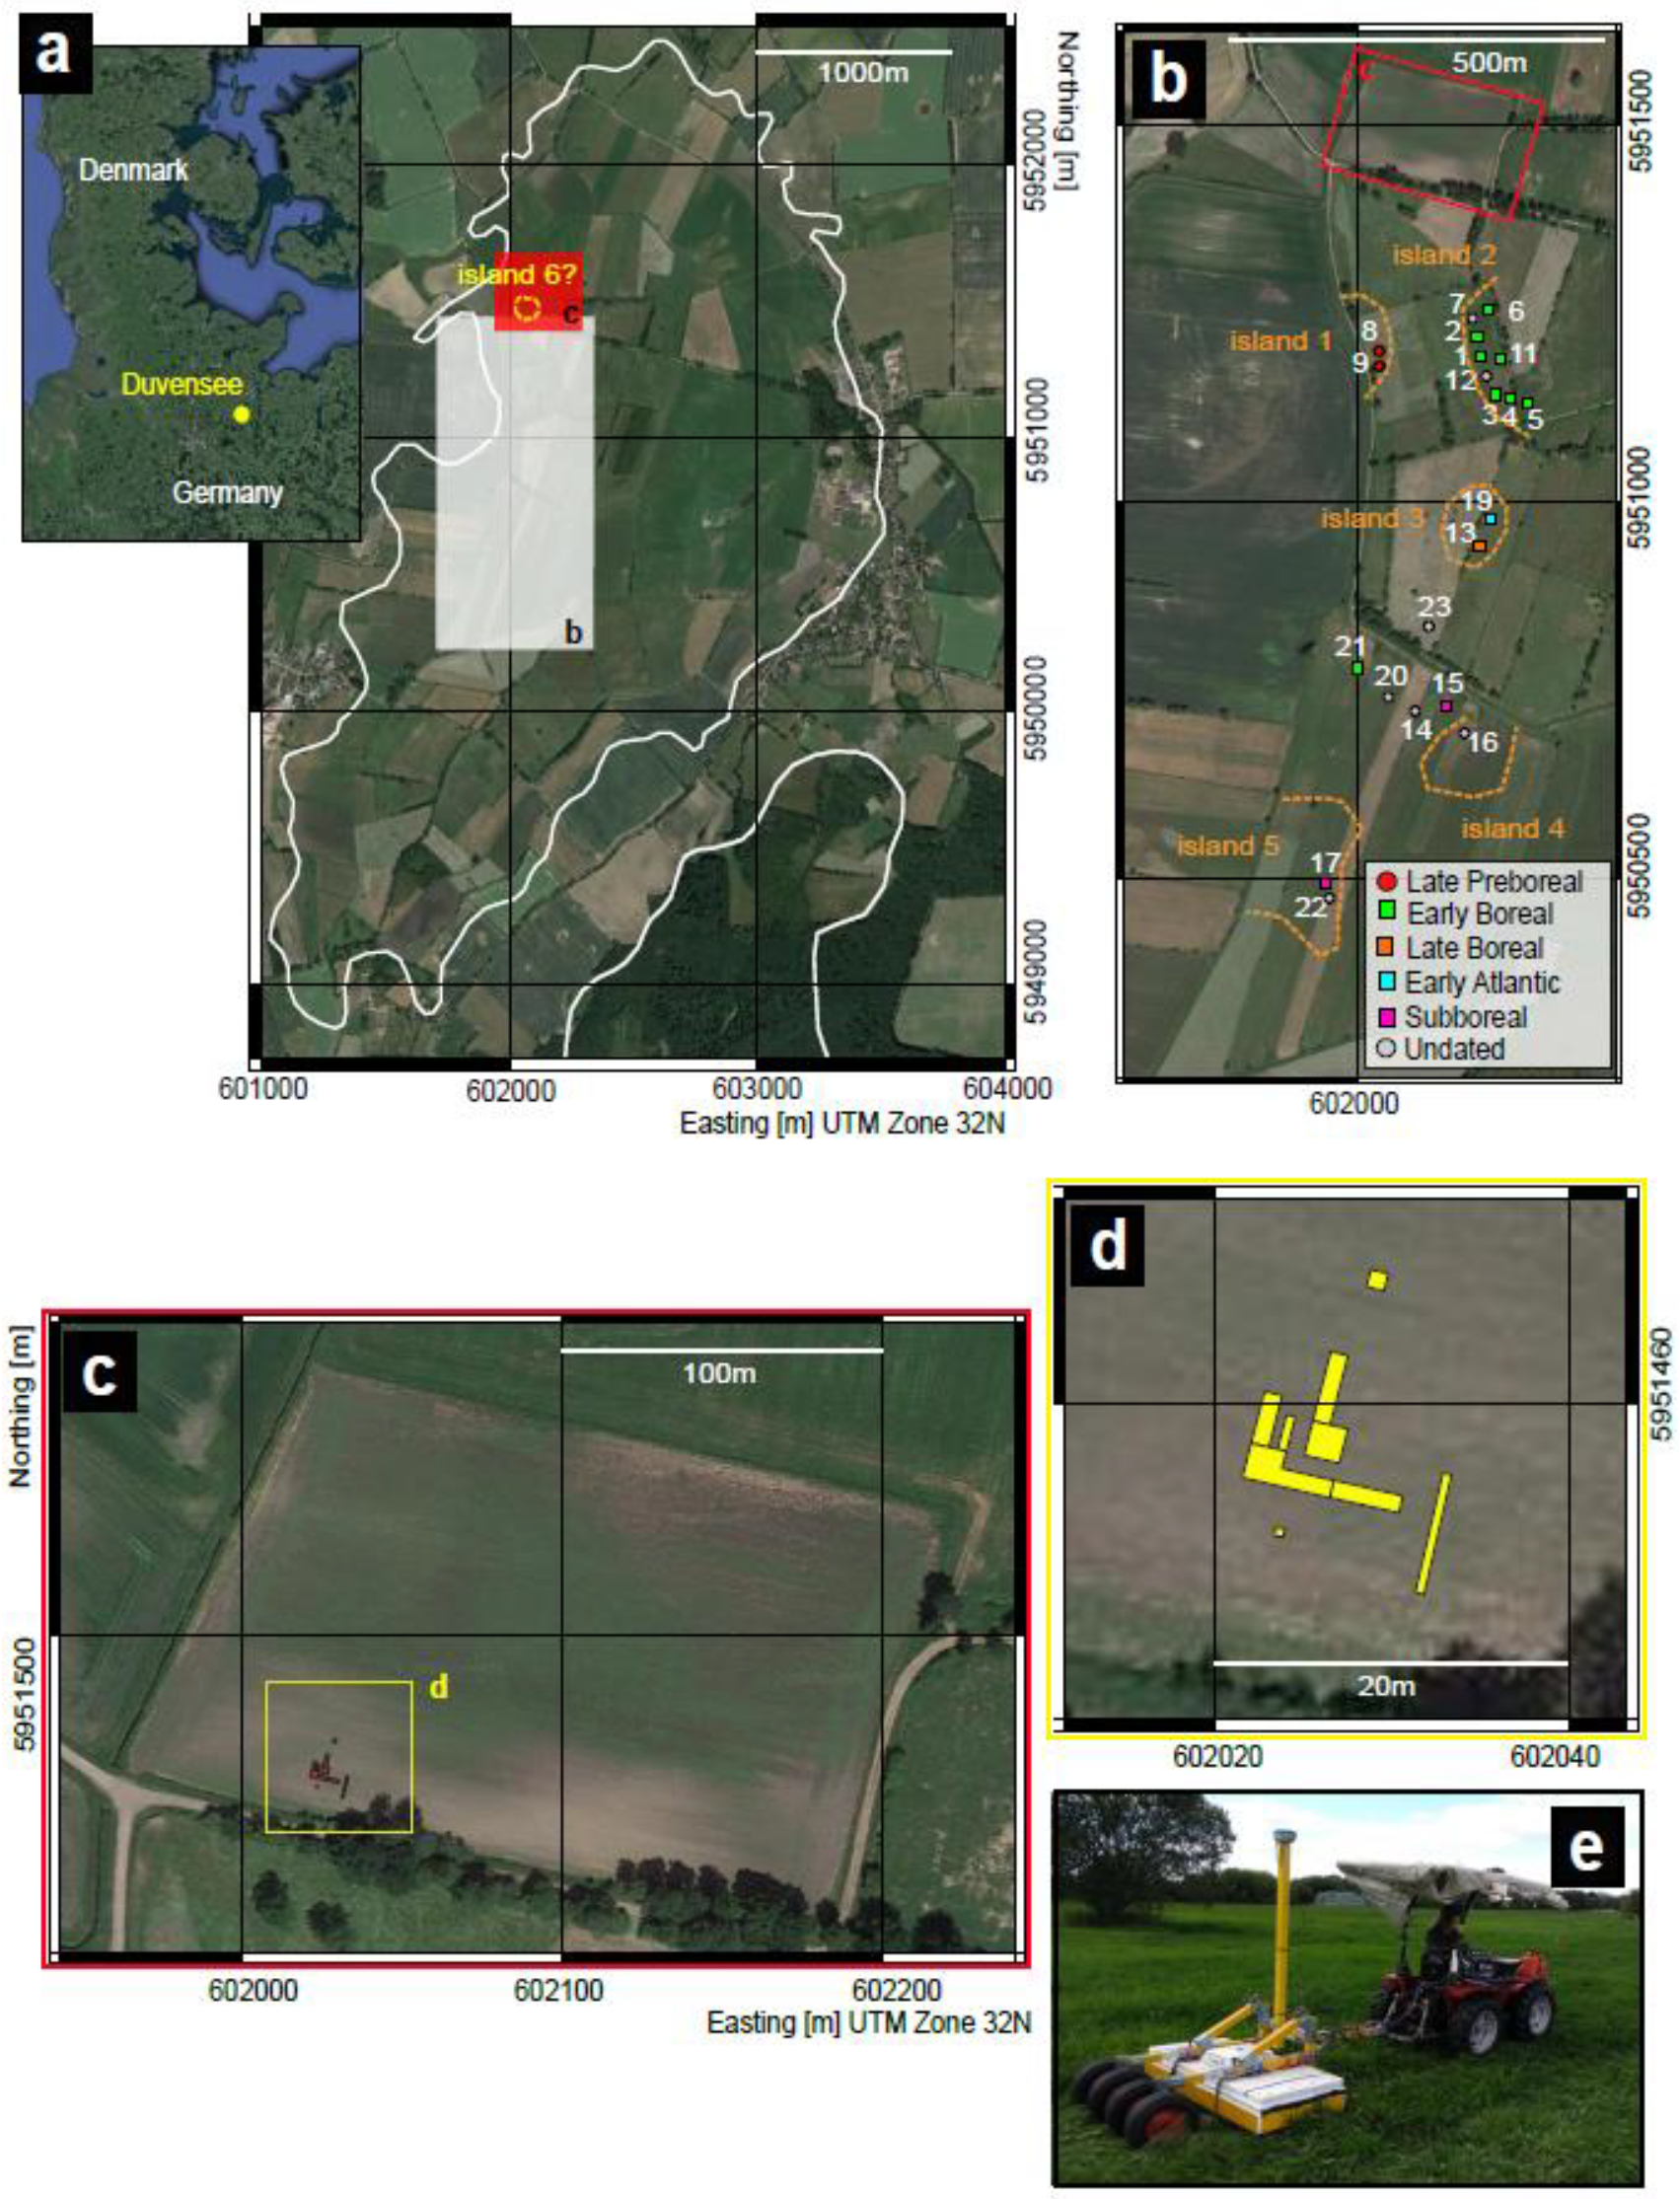
The study area of Duvensee is an ancient lake located in southeastern Schleswig-Holstein, Germany. This area is one of the most relevant micro-regions for early Mesolithic hunter-gatherer archaeology in northern Europe [
5,
6]. The former lake consists of late Pleistocene sandy moraines formed by the retreat of the Fennoscandian ice sheet [
7] during the older Dryas (
Figure 1a). The resulting irregular topography suggests scattered small sand islands that, on the western shore, were used by mobile hunter-gatherer groups as campsites for hunting, fishing, and roasting hazelnuts, which grew abundantly in the area [
8].
While advances in survey methods have been a boon for studying past landscapes, mapping the traces of hunter-gatherers and their environment remains a long-standing challenge. This paper delivers an innovative tool for archaeologists working in a time period with little surface evidence and unstructured settlements, allowing a pinpointed excavation strategy. The outcome even has potential applications in other sectors, such as landscape and architectural design [
9].
After a brief geo-archaeological description of the investigated area, we present the results of the geophysical survey performed using the 16-channel MALÅ Imaging Radar Array (MIRA) and their interpretation together with the new archeological excavations. Moreover, we show an updated overview of the known islands in Duvensee and a 3D landscape reconstruction, suggesting new perspectives for future research.
2. Geo-Archaeological Background and Previous Work
Duvensee has been the subject of archaeological research for almost a century, delivering vivid illustrations of early Mesolithic life [
5,
6,
11,
12,
13,
14,
15].
Geoarchaeological research toward understanding human–environment interaction in the early Holocene has intensified since 2016. While the area currently presents itself as a large fen landscape, during the period under investigation it was a large freshwater lake.
The Duvensee basin itself is the result of melting dead-ice blocks following the retreat of the Weichselian glacier front. Therefore, its topography is characterized by several deeps and ground moraine islands [
16], which were used by hunter-gatherer groups to establish temporary camps. The gradual infilling of the basin was accompanied by a general decrease in the water level over time and land amelioration, such that by the 19th century CE, most of the basin was occupied by a bog. The authors of [
10,
17] suggested a model that reconstructs the lake infilling using the stratigraphy and morphology inferred from the geophysical results. Today, a total of 23 Mesolithic camps, named Wohnplatz (WP), have been found at Duvensee, of which 17 have been partly excavated. Habitation at Duvensee spans a few millennia and has witnessed several landscape transformations, making this location one of the most important for understanding human–environment interaction during the Mesolithic. Archaeological overviews of the research carried out have been given in [
5] and [
6].
Several coring and geophysical campaigns have been performed to clarify and confirm the location and extent of the former islands hosting Mesolithic camps. The work of [
10] and [
17] present the results of a large-scale 200 MHz GPR investigation that confirmed the location of five former islands hosting Mesolithic camps and improved the knowledge of their size and shape (
Figure 1b). Moreover, this survey allowed a 3D reconstruction of the basin’s evolution between the early Boreal and the Subboreal bio-zones. The location of the islands and their estimated emergence times agree with the spatio-temporal pattern of the archaeological finds. The model shows how hunter-gatherer groups settled on one island after another, following the shoreline of the overgrowing lake.
During the years of fieldwork, a further island (island 6) was hypothesized in the northernmost sector (ca. 300 m north of the extensively investigated central area) due to the distribution of surface finds; however, it was assumed that the site (Duvensee WP 10) was completely destroyed by land amelioration and agricultural activity. However, in 2017, a small test trench proved that undisturbed layers are preserved and that the site is partly intact [
18].
As this is the most recently investigated site in the area and is located in a hitherto uninvestigated part of the bog, Duvensee WP 10 was of particular interest for this study. Research at the site was conducted from an interdisciplinary perspective and thus exceeded the previous investigations by incorporating several disciplines (e.g., geophysics, palynology, and aDNA (results still pending)). Archaeological excavations revealed a camp that was dated to the Preboreal/Boreal transition (c. 8700 cal. BP) (
Figure 1c,d) with different features, including a hazelnut roasting facility, a hearth, and a refuse layer with animal bones adjacent to the camp [
18].
A detailed geophysical survey of the area was undertaken to understand the local topography and establish whether the significant archaeological layers and features could be detected remotely.
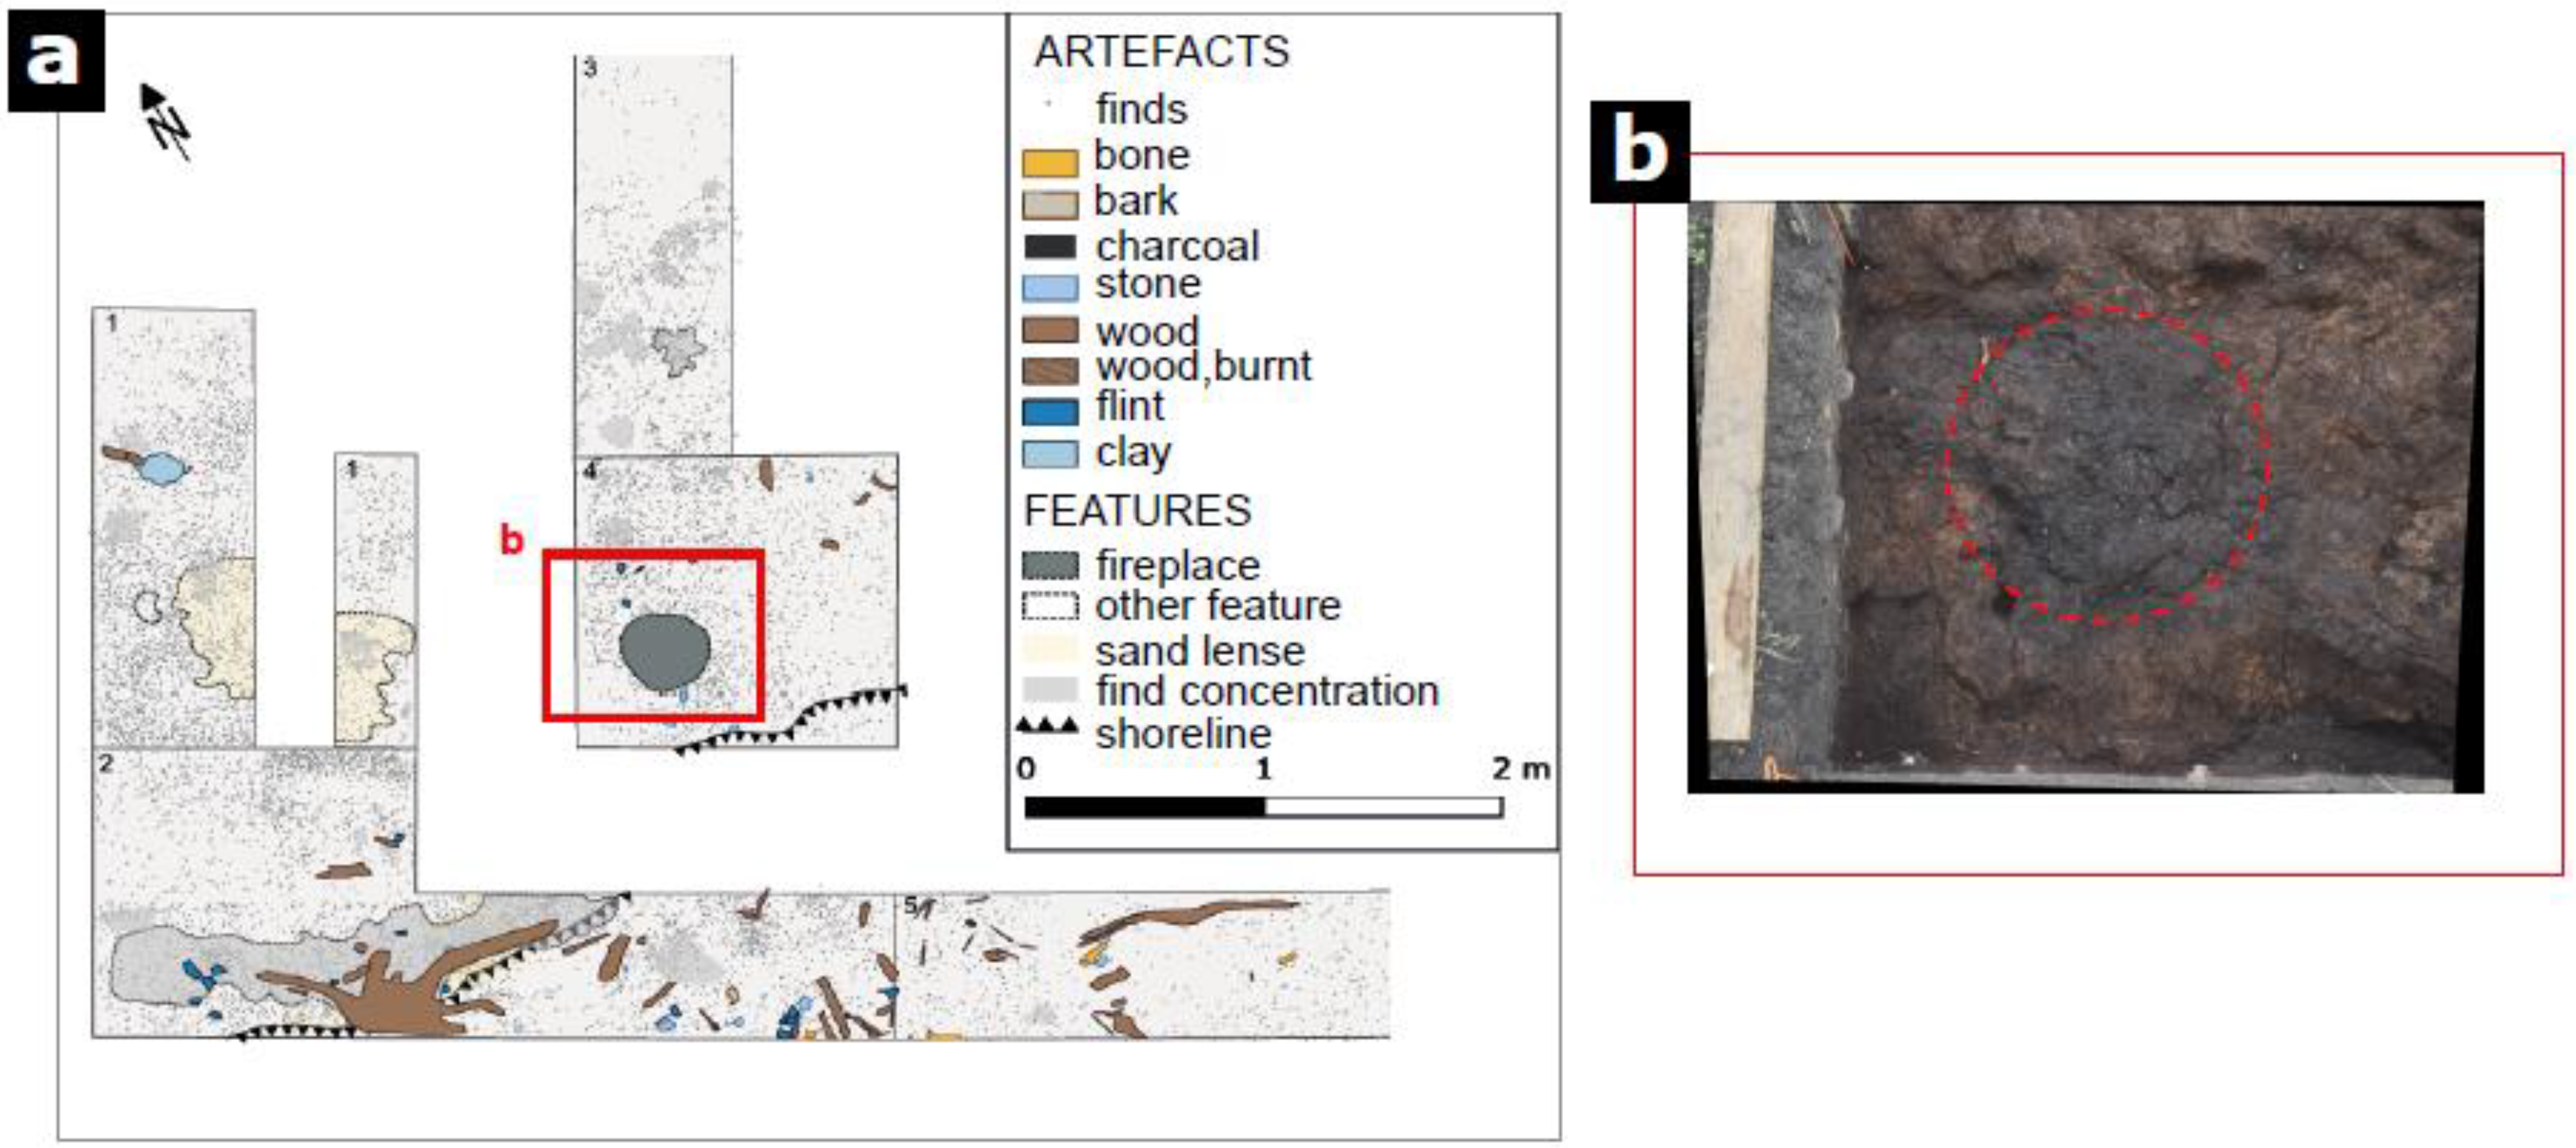
The archaeological excavations carried out between 2018 and 2020 are summarized in
Figure 2a, and were used to elucidate the uppermost stratigraphy of the radargrams. Some trenches (1 and 3) were excavated before the geophysical survey took place; therefore, theywere not considered in the interpretation. For this study, trenches 2 and 5 were of particular interest as they represented a good cross-section from the site into the ancient shoreline, such as trench 4, which is a part of the campsite and includes a shallow and unstructured fireplace (i.e., without a stone setting;
Figure 2b). Trenches 2 and 5 were representative of the shoreline contemporaneous with the occupation of the site and provided hints on the chronological development of the area. During occupation, the site was used for hazelnut roasting, as evidenced by a hazelnut-roasting feature consisting of a sand lens (trench 1, see [
19] for a comparative feature). This feature shows some outwash towards the southeast and probable accumulations of sand in the shore zone. As the soil matrix in connection to the occupations was composed of peat and gyttja in the lower parts, all sand on the site and in its vicinity had to be considered as being brought to the site. Washout from the hazelnut-roasting feature accumulated along the shore as a consequence of water and wave activity. In the eastern and western part of trenches 2 and 5, respectively, several animal bones with anthropogenic traces were found that testified to hunting activity and the disposal of leftovers next to the site. Additional activities were seen in trench 4, where a fireplace was another anthropogenic feature around which intense human activity could be seen, as shown by the remains of flint knapping and discarded tools.
3. Methodology
3.1. Ground-Penetrating Radar as a Tool for Geoarchaeological Prospecting
GPR is an active geophysical technique that propagates electromagnetic waves into the subsurface and records reflections from buried interfaces and objects [
20,
21,
22,
23]. Its application is based on detecting the contrast in dielectric permittivity and on recognizing the different signatures between man-made and natural features [
22,
24,
25,
26]. In particular, after many years of work with single-channel systems, GPR is now becoming common and extensively used for mapping stratigraphic units [
10,
27,
28,
29,
30].
Multi-channel array GPR surveys have been applied increasingly in archaeological prospection in the last decade, showing impressive results [
31,
32,
33,
34,
35,
36]. Collection over large areas can be performed in a very short time, recording the full three-dimensional wave field [
37] and producing energy maps with very high resolution, potentially delivering images of buried features, such as stone agglomerations, or the detailed spatial extent of walls [
38,
39].
Signal penetration is affected by ground moisture and sediment type: dryer sediment types with low conductivity, such as sand, allow the signal to penetrate deeper, in contrast to materials with a higher conductivity (e.g., clay) that can decrease signal depth to less than one meter [
27]. The quality of the result varies as ground moisture can change daily, while sediment characteristics are based on geological morphology that may drastically change across a small area [
22].
Vertical resolution increases with the GPR center frequency used here, enabling the detection of thinner layers. Therefore, the best structural resolution that can be reached is about one quarter of the dominant wavelength [
27] and it can range from 0.04 m for saturated sands to 0.10 m for dry sands with a 400 MHz antenna (e.g., [
20,
40]). If the subsurface presents layers that are thinner than the dominant wavelength, the accuracy of the stratigraphic interpretation of GPR sections can be greatly improved by incorporating information from archaeological excavations and drillings. In this regard, stratigraphic information contributes to the recognition of facies patterns in radargrams, and thus to ground truthing.
Commonly applied approaches for reconstructing paleolandscapes are near-surface geophysical surveys together with a wide range of borehole techniques and archaeological excavations [
41,
42,
43,
44,
45]. Due to the labor intensity of manual coring and its limitation of lateral variation, non-invasive geophysical methods, such as ground-penetrating radar (GPR), allow a more continuous mapping of the subsurface.
3.2. Description of GPR Measurements and Data Processing (Duvensee WP 10 Area)
The GPR survey was conducted using a 16-channel 400 MHz MALÅ Imaging Radar Array (MIRA) with 8 cm inline and cross-line trace spacing. This is a multi-channel GPR system containing nine transmitting and eight receiving antennas with a center frequency of 400 MHz placed in a box mounted in the back of a small tractor (
Figure 1e). Each survey line delivers 16 individual radar reflection profiles. The 16-channel system covers a 128 cm-wide swath for each driven track, making this instrument a highly efficient tool for large-scale archaeological and geophysical surveys. A totalstation and a prism (Leica Geosystems) mounted on top of the MIRA antenna array are used for data positioning. The acquisition settings are reported in
Table 1. Additionally, a calibrated odometer is attached to one wheel of the tractor, providing exact inline distance information.
Under favorable conditions, the instrument can survey several hectares of data per day. In the present study, the entire area (220 m × 135 m = 2.97 ha) was covered in just under 4 days.
The data were subsequently processed using a self-developed program called Multichannel-GPR.
Multichannel-GPR is a collection of MATLAB
®Scripts for processing GPR data and it is available on request [
46]. The steps used for data processing in this study are the following: DC-removal, trace interpolation, time zero correction, k-highpass (kmax = 0.01 m
−1), normalization, band pass filter (200–800 MHz), and a custom gain function (−20, 0, 10, 15, 20 dB). The velocity of the radar wave for the time-to-depth conversion was estimated to be 0.072 ± 0.010 m/ns using a hyperbola fitting function. Lastly, a topographic migration was performed using a semi-circle superposition [
47], a specific tool of the program. Georeferenced depth slices 0.07 m thick were created and imported into QGIS [
48] for archaeological interpretation.
Moreover, picking was performed using both Multichannel-GPR and the Kingdom IHS
®software, which is able to display GPR data together with stratigraphic information. The picked reflectors were interpolated to create contour maps of each interface. Gridding was carried out using Surfer 20
®by Golden Software Inc. Finally, a 3D model of the investigated area was created using Surfer 20
®and interpolated by applying the Kriging method ([
49],
https://support.goldensoftware.com, accessed on 5 December 2020). The interpretation of the GPR record belonging to the archaeological trenches was performed by the visual comparison of the feature locations and selected GPR profiles running through the excavations.
4. Results and Interpretation
This section focuses on the results and their description and interpretation. At the beginning, a short overview of the early results is presented followed by the interpretation of the depth-slices delivered from the Multichannel-GPR survey, with a focus on the excavation trenches. The last part concentrates on a detailed comparison between the GPR profiles and the archaeological excavations.
4.1. Interpretation of GPR Depth-Slices
In the following section, the results of the GPR survey are presented, focusing on the reflectors that represent the transition between organic and non-organic sediment that characterize wetland environments. The main units visible in the stratigraphy were indeed peat, detritus gyttja (coarse, fine, and elastic detritus gyttja), calcareous gyttja, organic mud, minerogenic mud, and sand sediments.
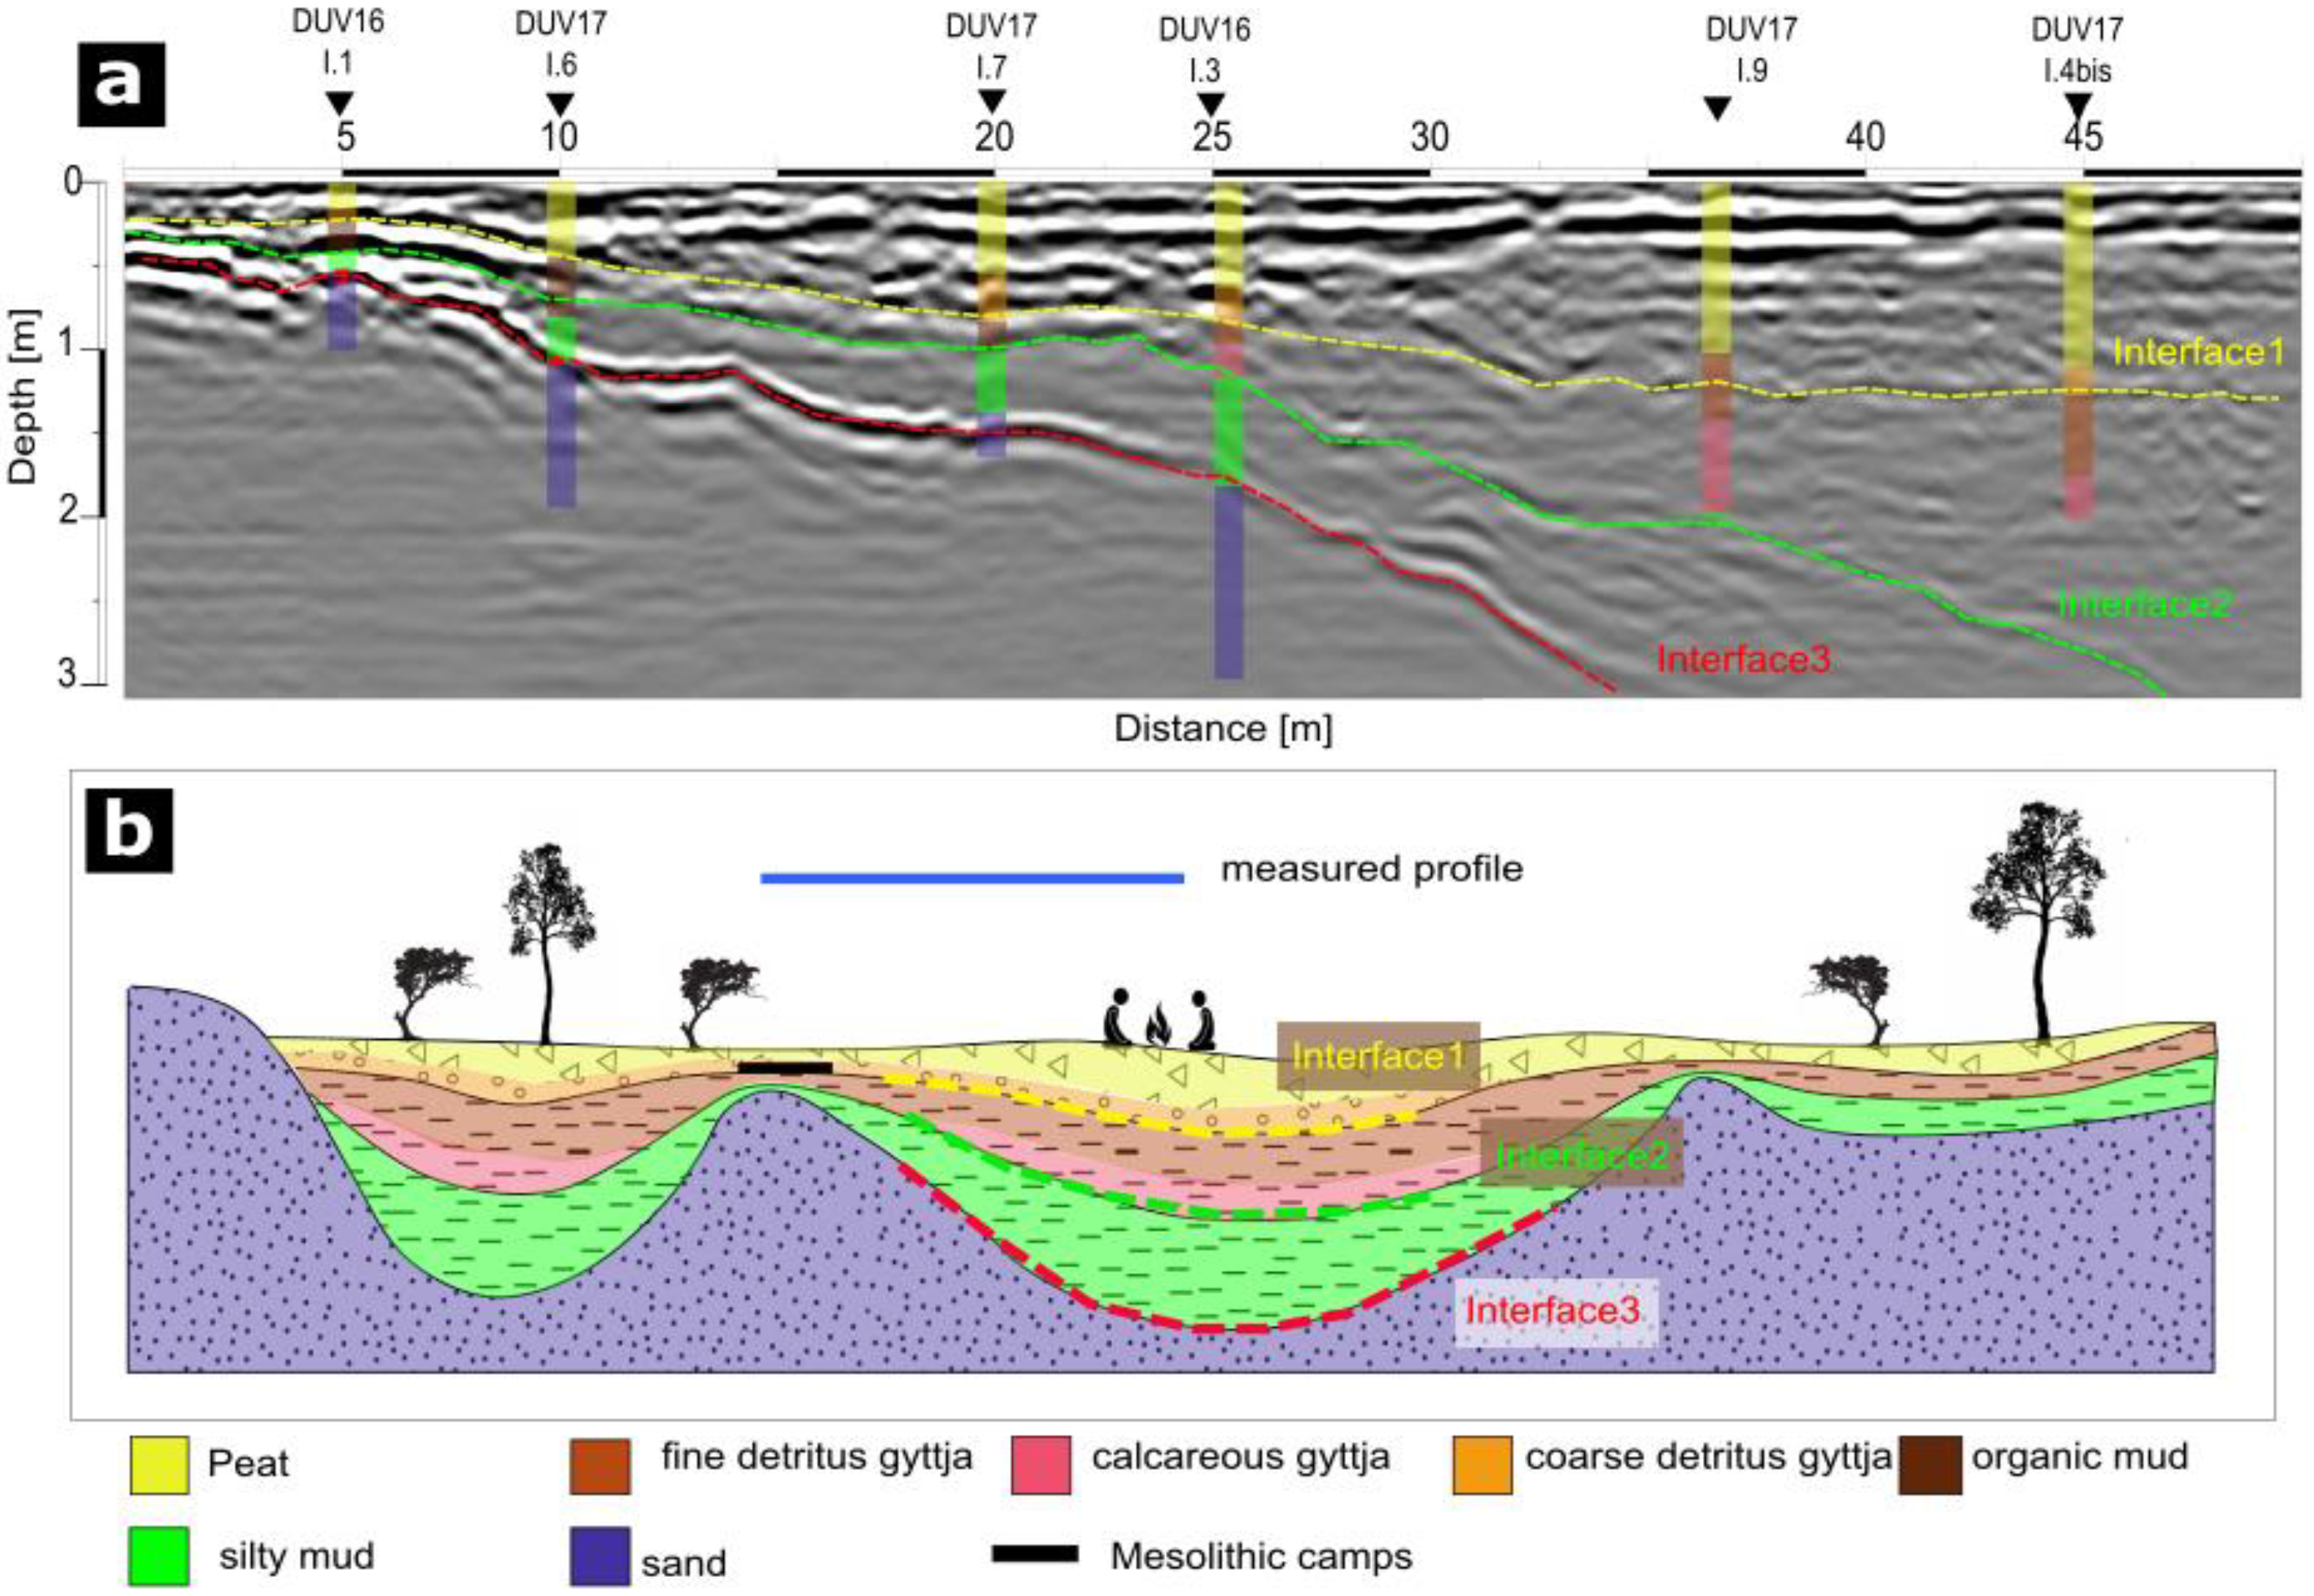
Figure 3a summarizes the main reflectors visible in the GPR record reported in [
10] and [
17], highlighting three main interfaces:
− Interface1 (yellow dashed line) represents the transition between the coarse organic sediments (i.e., peat and coarse detritus gyttja) at the surface and the underlying fine organic sediments (i.e., fine detritus gyttja and calcareous gyttja).
− Interface2 (green dashed line) represents the transition between fine organic sediments and underlying clayish-loamy deposits at the bottom of the previous lake.
− Interface3 (red dashed line) marks the transition between the clayish-loamy layer and the basal sand deposits that indicate the location of former islands.
The reported interfaces were then to be expected in the following GPR dataset, which was collected in the northern sector of the earlier study. The detection of Interface3 will therefore be useful for locating unknown islands delivering future pinpointed excavations. Moreover,
Figure 3b shows a schematic reconstruction of the silted-up lake using the dashed lines as indicators of the detected interfaces, allowing a detailed interpretation of the ancient basin.
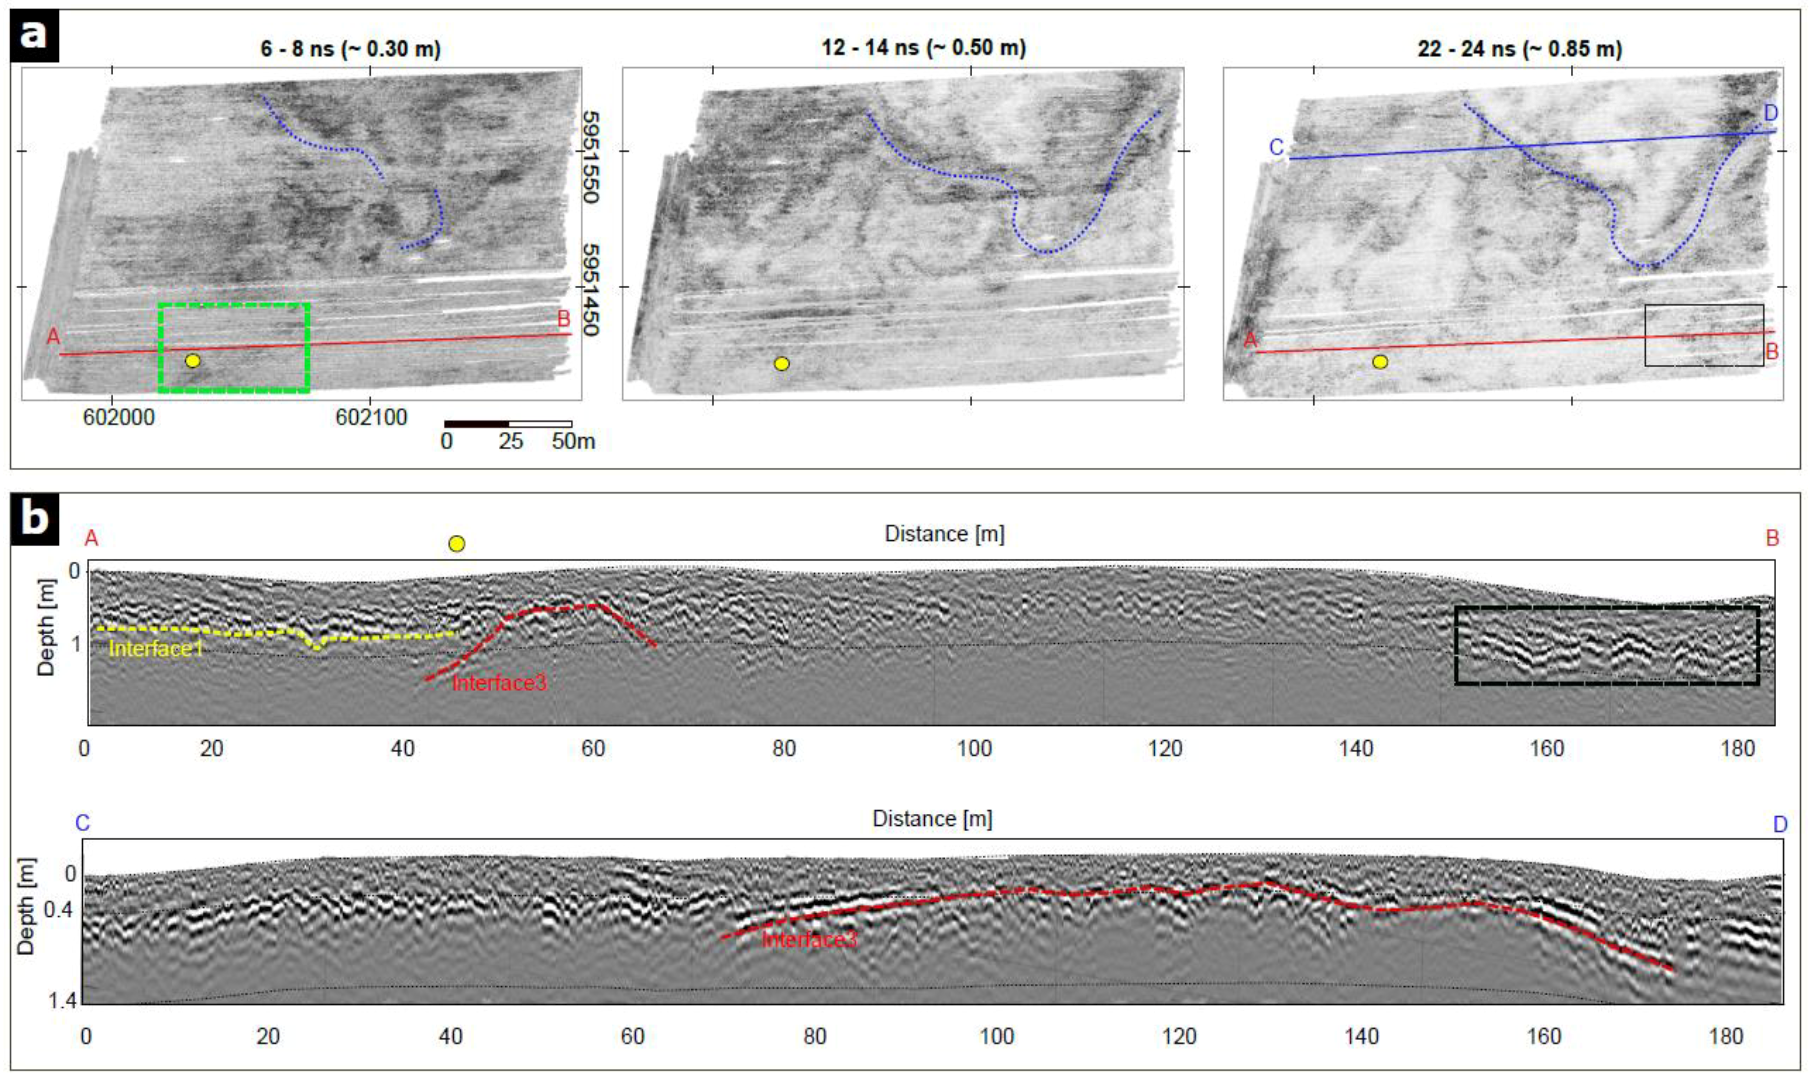
The results of the GPR survey showed the presence of different 10m-scale features (
Figure 4). In the shallow subsurface (6–8 ns, ~−0.30 m) the lowermost sector of the investigated area presented with a linear feature (green box in
Figure 4a) that was located close to the excavation trenches (yellow dot). The interpretation of profile AB suggested that this interface was caused by the presence of a slope, probably associated with the location of a small island (red dashed line). Due to the archeological investigation, we were able to set the horizon associated with the bottom of the peat at about 1 min depth (yellow dashed line). The presence of the Mesolithic camp (Duvensee WP 10, yellow dot) confirmed this suggestion because hunter-gatherers settled on top of hills and close to the shoreline. The refuse layer found during the excavation indicated how those groups used this area for living activities. On the other edge of the same profile, a rounded reflection was present (black square), probably indicating a further sand deposit; however, there is currently no stratigraphic information available in this sector. In comparison with the previous studies [
10] and [
17], the transitions between the sediments were indicated with the same colors: the red dashed line indicates the transition between clayish-loamy layer and the basal sand deposit (Interface3), and the yellow dashed line represents the transition between the coarse organic sediments (peat and coarse detritus gyttja) and the underlying fine organic sediments (fine detritus gyttja and calcareous gyttja) (Interface1).
Moving to the uppermost sector of the investigated area, we noticed some bowed anomalies (blue dashed lines) in the shallow subsurface (6–8 ns) that seemed to become a single feature with increasing depth (12–14 ns; 22–24 ns).The GPR profile CD, which crossed the described body, allowed its interpretation as a big island. A rounded reflection deepening on the sides was clearly visible (dashed red line in profile CD,
Figure 4b) confirming our assessment. Stratigraphic information is not available in this sector; however, as reported in [
10], similar rounded shapes in this area represent the former sand banks deposited by the glacier. This could indeed be a new location for further archaeological investigations. However, currently no surface finds that would indicate a prehistoric presence in the area are known.
4.2. Focus on the Archaeological Excavations: Interpretation of the GPR Record
4.2.1. Interpretation of Depth-Slices
In this subsection, a focus on the GPR depth-slices and the main archaeological features of the excavations are presented. To make the interpretation more clear, the color scale was changed with respect to the depth-slices reported in
Figure 4.
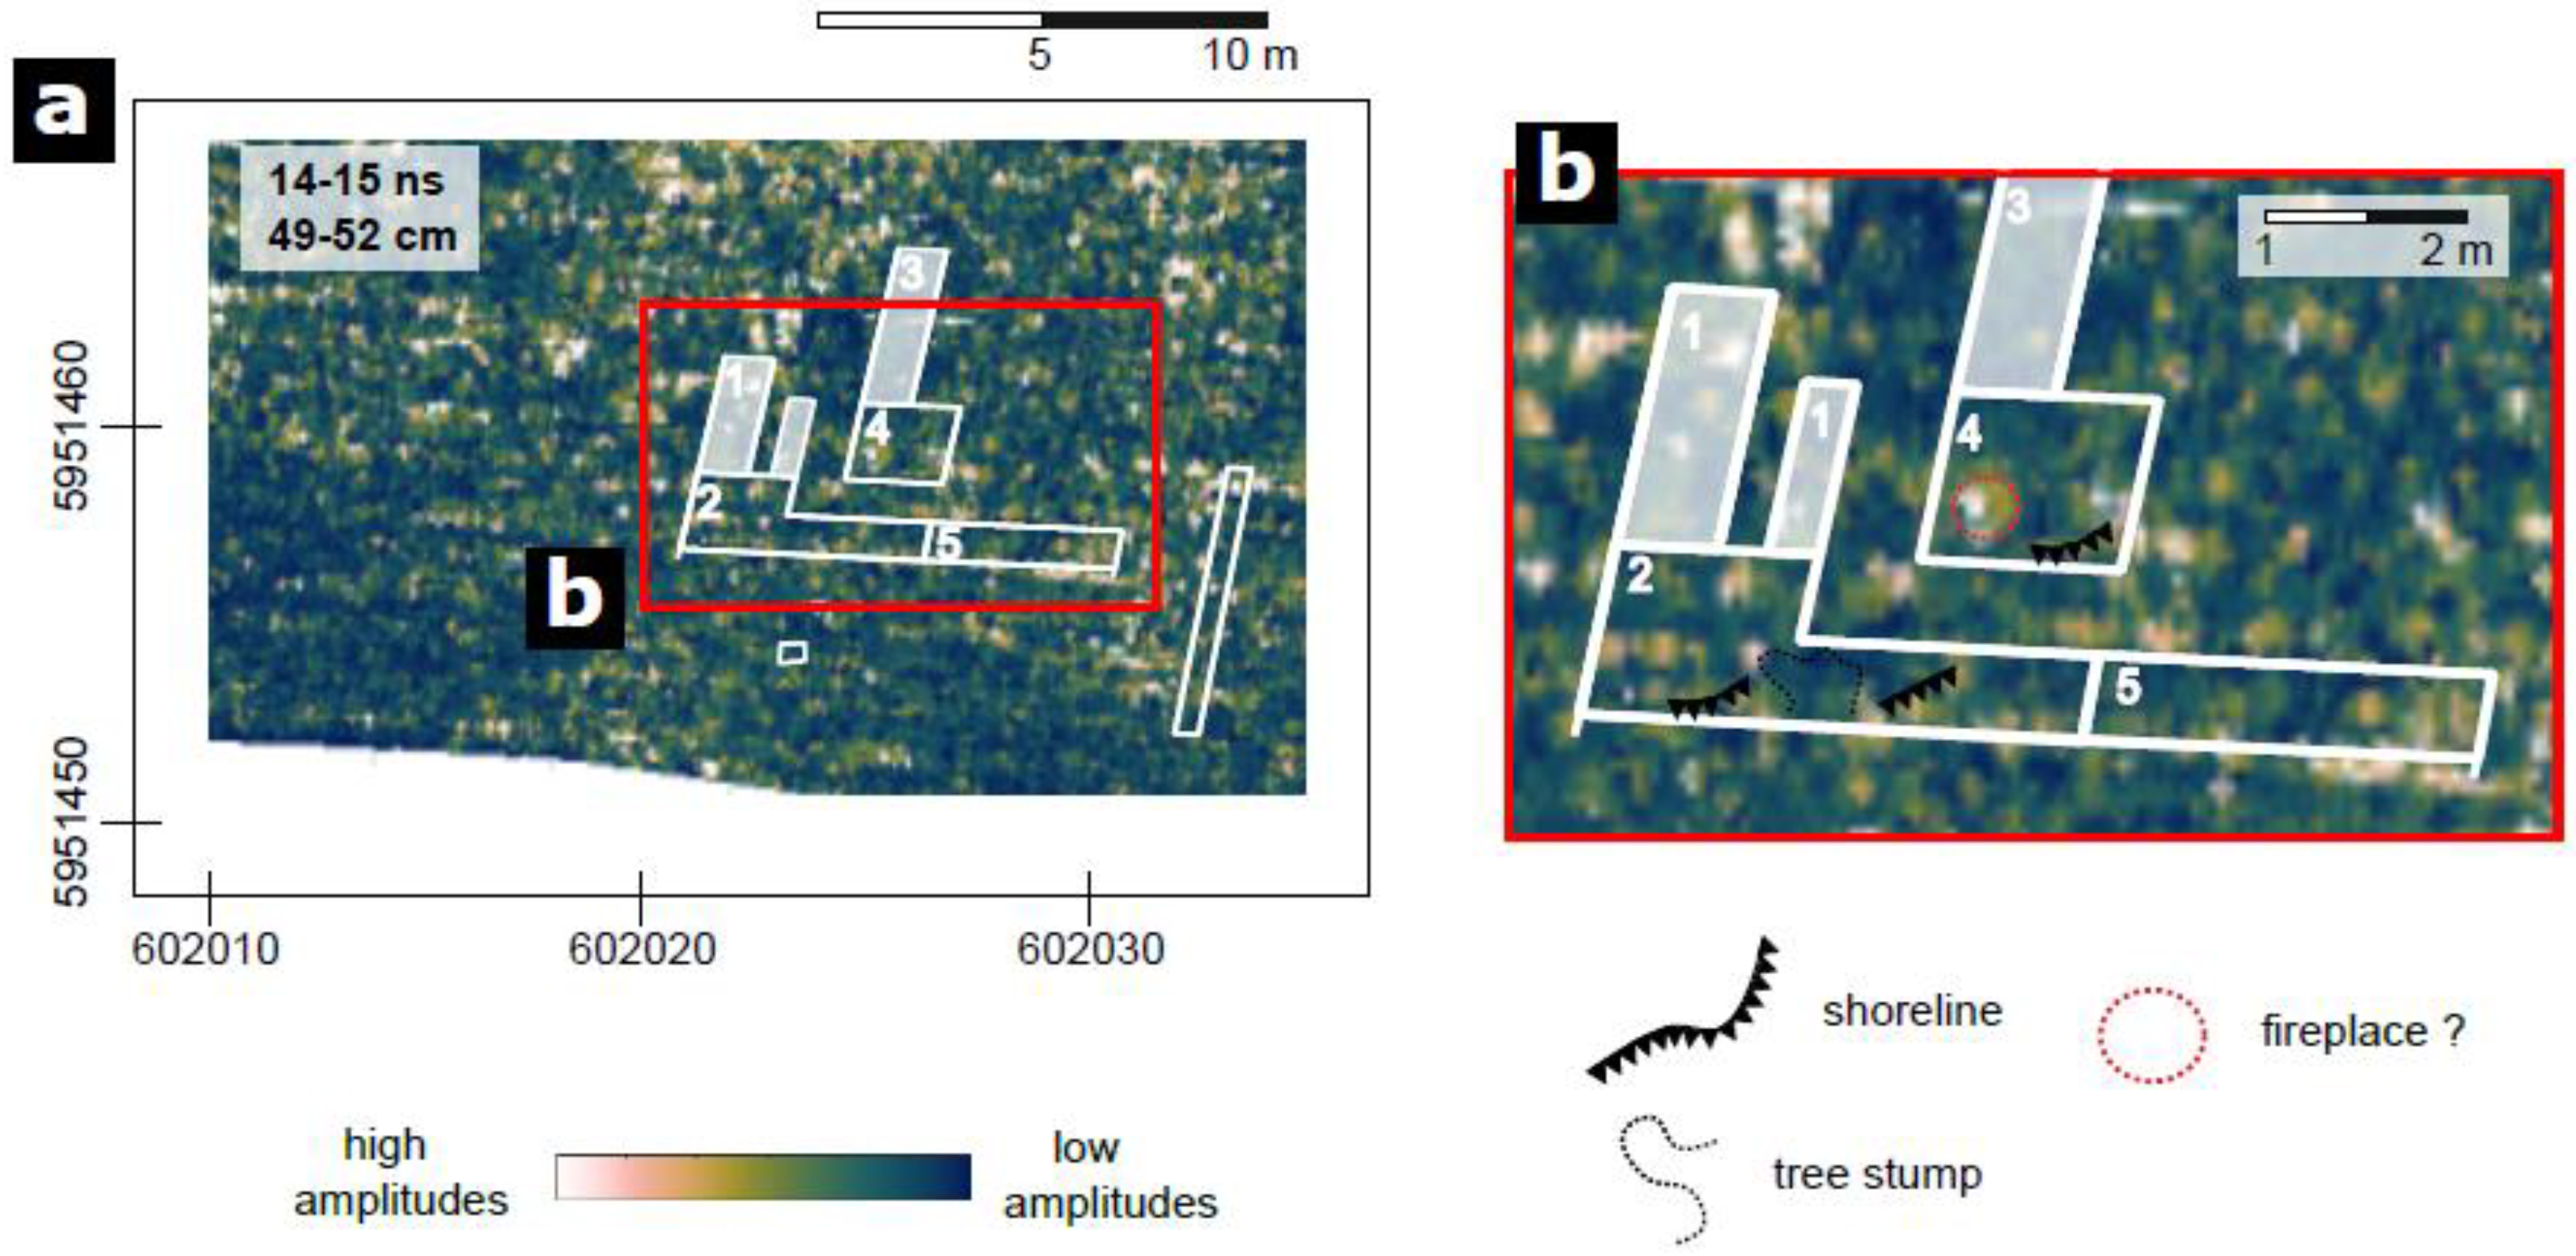
Figure 5a shows the depth slice at approximately 50 cm in depth, which correlates with the archaeological level reported in
Figure 2; the high amplitude values are indicated with bright colors and the lower values with dark blue. No organized anomalies were visible; however, a focus on the trenches (
Figure 5b) allowed a detailed analysis—some high amplitude areas were in line with the sand accumulations that marked the shoreline in trenches 2 and 4. It was not a defined horizon, but rather different scattered sand clusters that could be correlated to wave activity on the shoreline. Another low amplitude area was evident in trench 2 between the scattered high amplitude anomalies. The comparison with the excavations suggested that this was the location of a tree stump. In trench 4, a small fireplace was detected, and we noticed a higher amplitude area at the same position. Note that trenches 1 and 3 were excavated prior to the geophysical survey; thus, anomalies in these areas do not represent the original in situ conditions and are therefore filled in white.
4.2.2. GPR Profiles
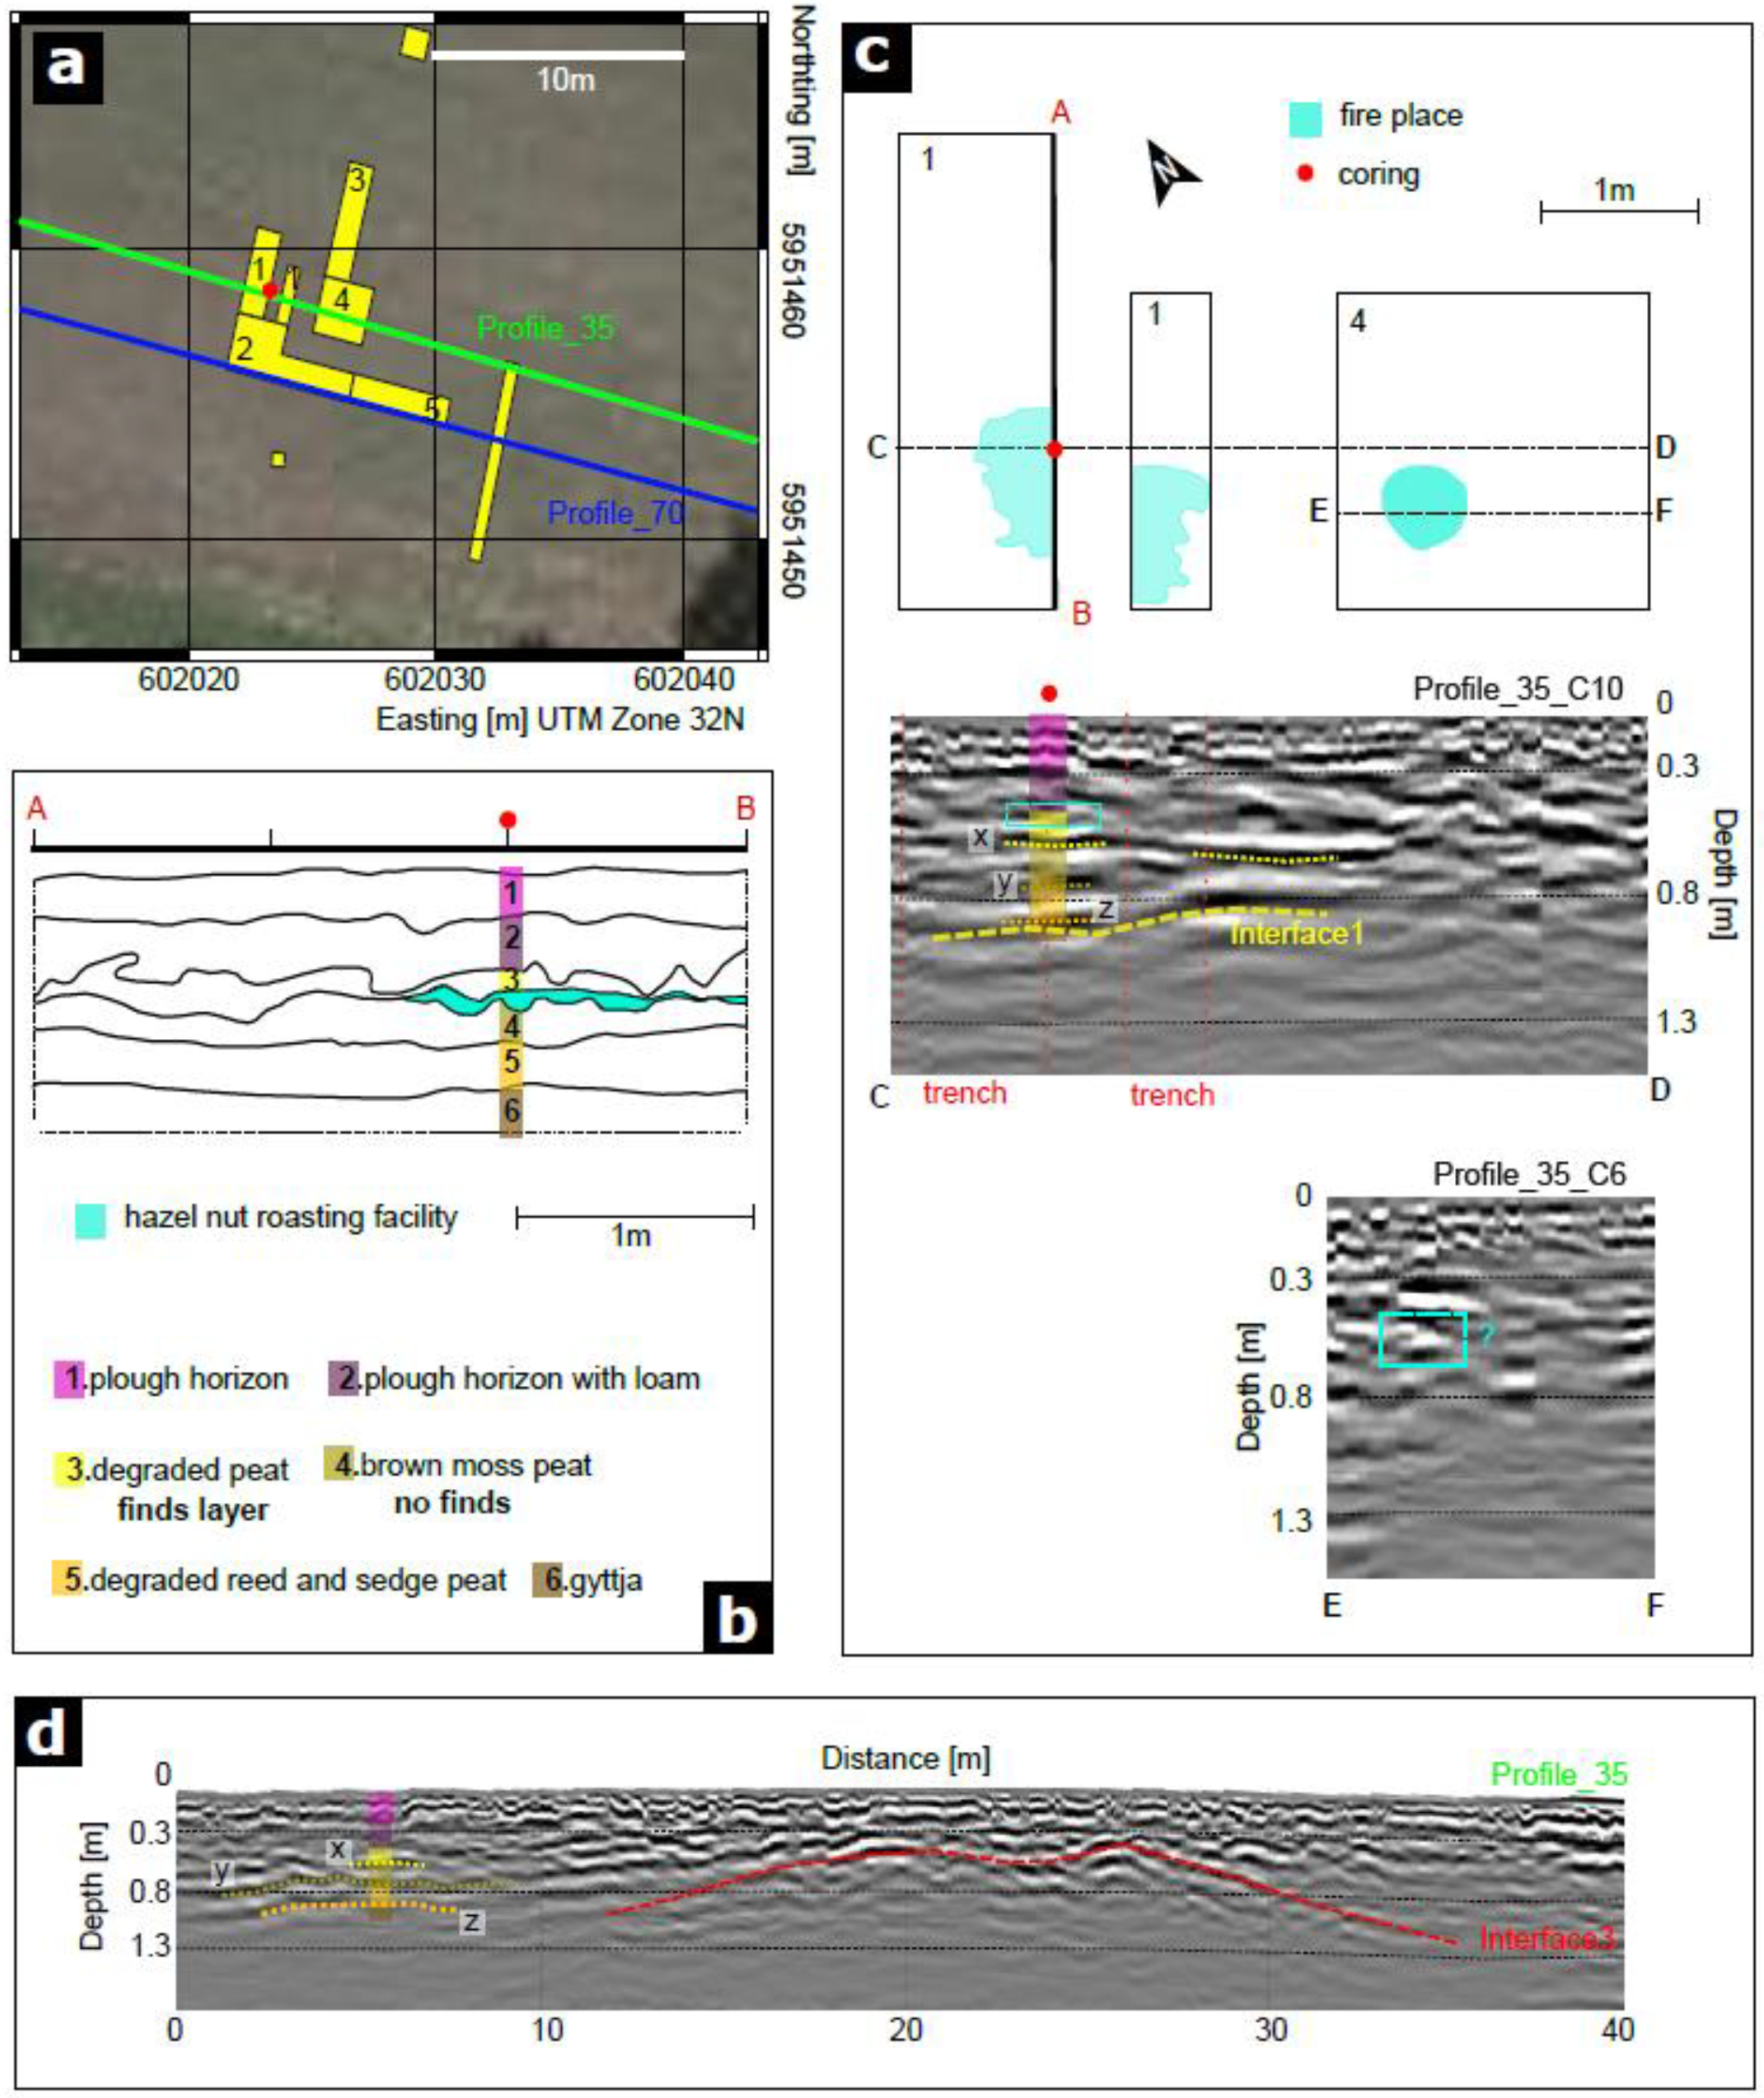
In the following, a focus on trenches 1, 2, and 4 is presented. We compare the GPR profiles intersecting the archaeological excavations, and the shallower stratigraphy provided from the field work. Profile_35 crosses trenches 1 and 4 (green line in
Figure 6a), which yielded the hazelnut-roasting feature and a hearth. Even though trench 1 was excavated before the GPR measurements, the excavation delivered important stratigraphic information. Profile_70 runs at the location of the vertical section in trenches 2 and 5 (blue line in
Figure 6a). We present several GPR profiles from different channels intersecting the relevant archaeological features and their corresponding interpretation. The lines shown in
Figure 6a are the GPS trace right in the middle of the antenna, and the corresponding radargrams of each channel are reported in
Figure 6c.
The archaeological excavation carried out in 2018 at trench 1 provided the location of a hazelnut-roasting feature. The geophysical survey was performed after the fieldwork; thus, the GPR record at this location could only be used in conjunction with the archaeological record for interpreting unexcavated parts of the site. Hence, the stratigraphic information regarding the vertical section of the trench was essential for ground truthing the results and picking the stratigraphic horizons.
Figure 6b shows the archaeological sketch of the eastern profile of trench 1, while
Figure 6c displays the location of the reported fireplaces and the sand accumulations connected to the shoreline in top view. The GPR profiles associated with the channels crossing these features are depicted and reported below as examples. Section CD crosses the former roasting feature, and a detailed stratigraphic interpretation is given. Starting from the top, we recognized the ploughing soil and the peat layer, which consisted of different reflectors: the first seemed to be correlated with the transition between the finds layer in the degraded peat and the no-finds layer in the brown moss peat (x, in
Figure 6c). A second horizon was correlated with the transition between brown moss peat and degraded reed and sedge peat (y, in
Figure 6c) and a further one (z, in
Figure 6c) was associated with the bottom of the peat layer, which corresponded to Interface1 in [
10]. Some reflections in the described radargram seemed to be interrupted at two locations that were comparable with the positions of the former trench 1. The identification of the hazelnut roasting facility was therefore only possible in the corridor in between the two excavations. A weak reflector was partially visible, and its location corresponded to the finds layer at the fireplace position (cyan dashed square in profile CD,
Figure 6c). Moving now to section EF, which crosses the fireplace feature in trench 4, we noticed unorganized small and weak reflectors at about 45–50 cm depth that correlated well with the location of the hearth; but, it did not provide a distinct and recognizable interpretation of the radargram. This confirms that the identification of the fireplace is difficult, not least because the feature was very shallow and not prominently developed. More research is necessary for detecting such features; however, the identification of different peat types is, in any case, very important for understanding the environmental history and eventually detecting Mesolithic campsites in such environments.
Additionally,
Figure 6d focuses on a larger portion of Profile_35, showing its western part and interpretation. The main sediment interfaces yielded by the archeological excavations are depicted with dashed lines and the shape of an island can be discerned. Interface3, the sand deposition, (red dashed line) deepens on the sides, enhancing its rounded shape. The hunter-gatherers indeed settled close to the shoreline, where more water was available and the peat formation process was in underway.
For estimating the vertical resolution of the survey, a combination of stratigraphic column and depth converted radargram was used. Using the quarter-wavelength criterion, the resolution limit was estimated to be 3 to 8.8 cm, which agreed with the visual appearance of the GPR section.
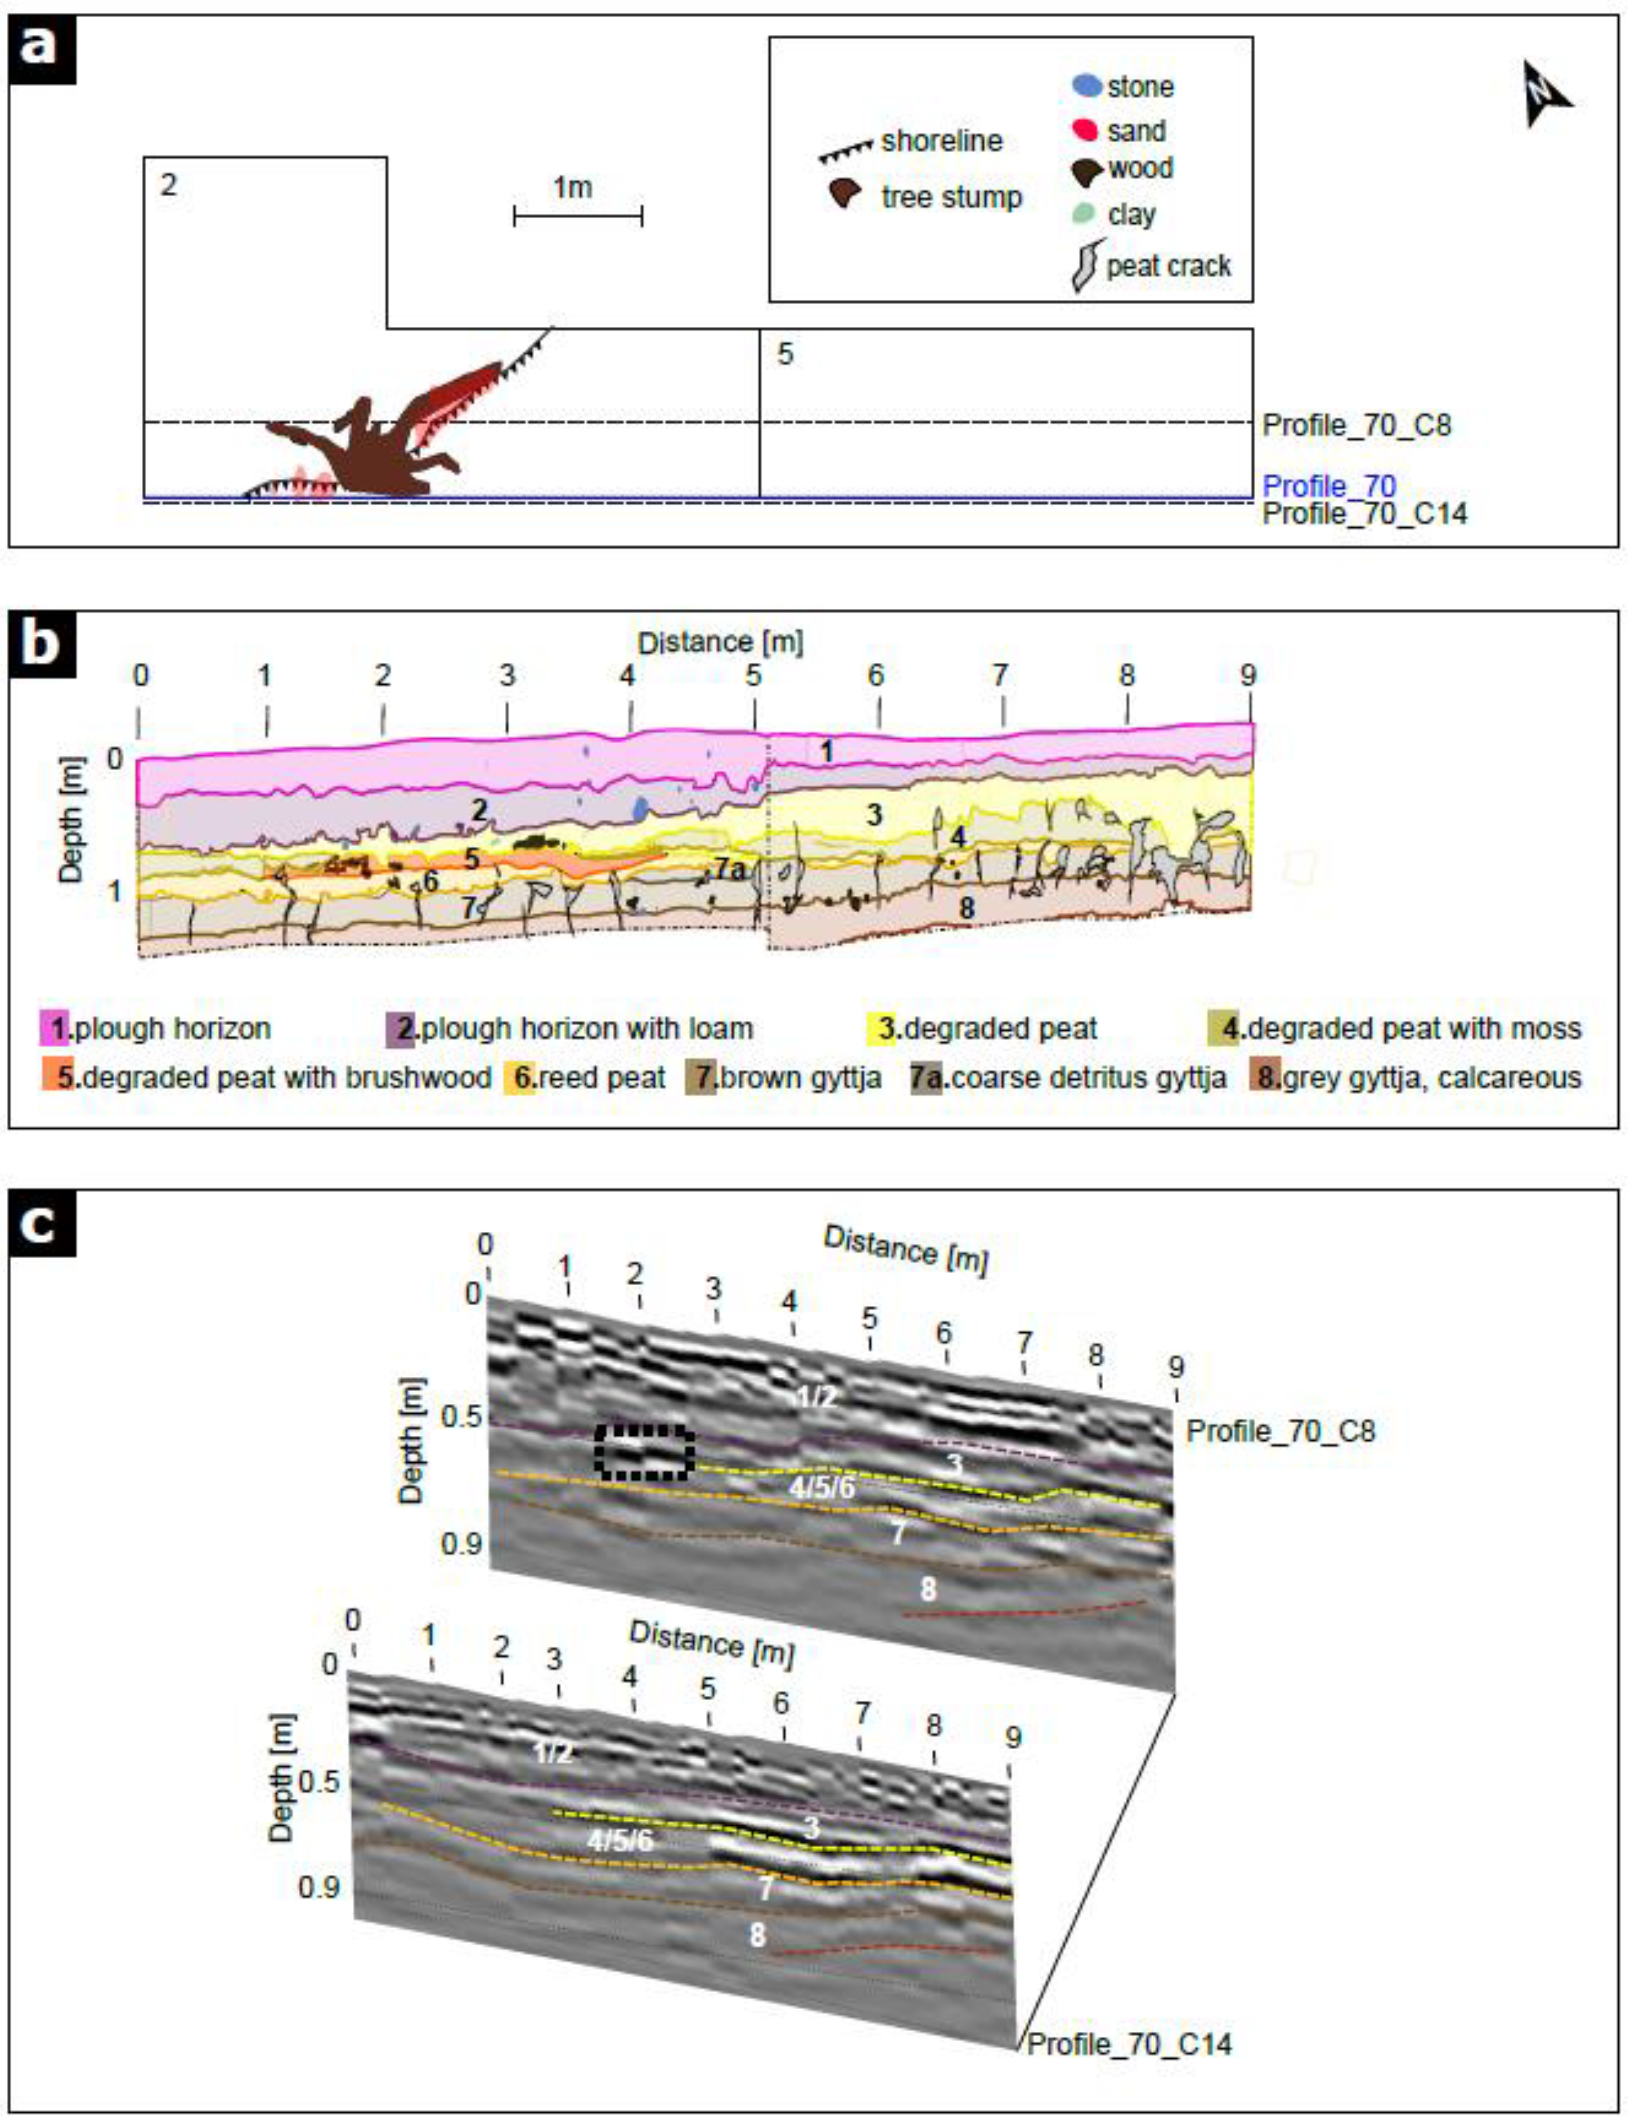
Now we focus on trenches 2 and 5, which are the most recent excavations. The field work revealed sand accumulations representing the shoreline contemporaneous to the occupation of the site. Moreover, several animal bones with anthropogenic traces were found that testified to hunting activity and the disposal of leftovers next to the site. GPR Profile_70 runs along the excavation’s southern sector (blue line in
Figure 6a and
Figure 7a), allowing a detailed comparison with the vertical section (
Figure 7b). The different colors represent the examined sediments. Profile_70_C14 displayed the ploughing soil on the top, which was interconnected with the underlying degraded peat (layer 3), particularly at the beginning of the profile. We noticed that the whole peat layer was made of different depositions: degraded peat (layer 3), degraded peat with moss (layer 4), degraded peat with brushwood (layer 5), and reed peat (layer 6). In the radargram, it was possible to follow a reflector corresponding to layer 3 and layer 6 that was the base of the entire peat layer. Distinguishing between the degraded peat with moss and degraded peat with brushwood was difficult.Profile_70_C8, which runs 40 cm north and crosses the tree stump feature, showed a higher reflectivity area associated with the location of this body (black dashed square in
Figure 7c). Regarding the sand accumulations reported in the section, we found that they were hard to identify; some local amplitude variations were reported, but an organized interface could not be defined.
The differentiation between the brown gyttja and the calcareous gyttja is well documented, and both interfaces are easy to follow along the GPR profiles.
4.3. Landscape Reconstruction as Derived from the GPR Subsurface Model
Using the Kingdom Software, it was possible to visualize and follow the identified interfaces through the GPR dataset. Locally, clear round reflectors were visible and associated with Interface3 (the transition between lake sediments and basal sand was already observed in [
10]), which established the shape of former islands in the ancient landscape. Moreover, it emerged that Interface1 was visible in greater detail than in the previous study; the ploughing soil was an additional layer encountered in this sector and it was removed from the landscape reconstruction model as it did not impact the detection of the ancient islands. Connecting this study with the work of [
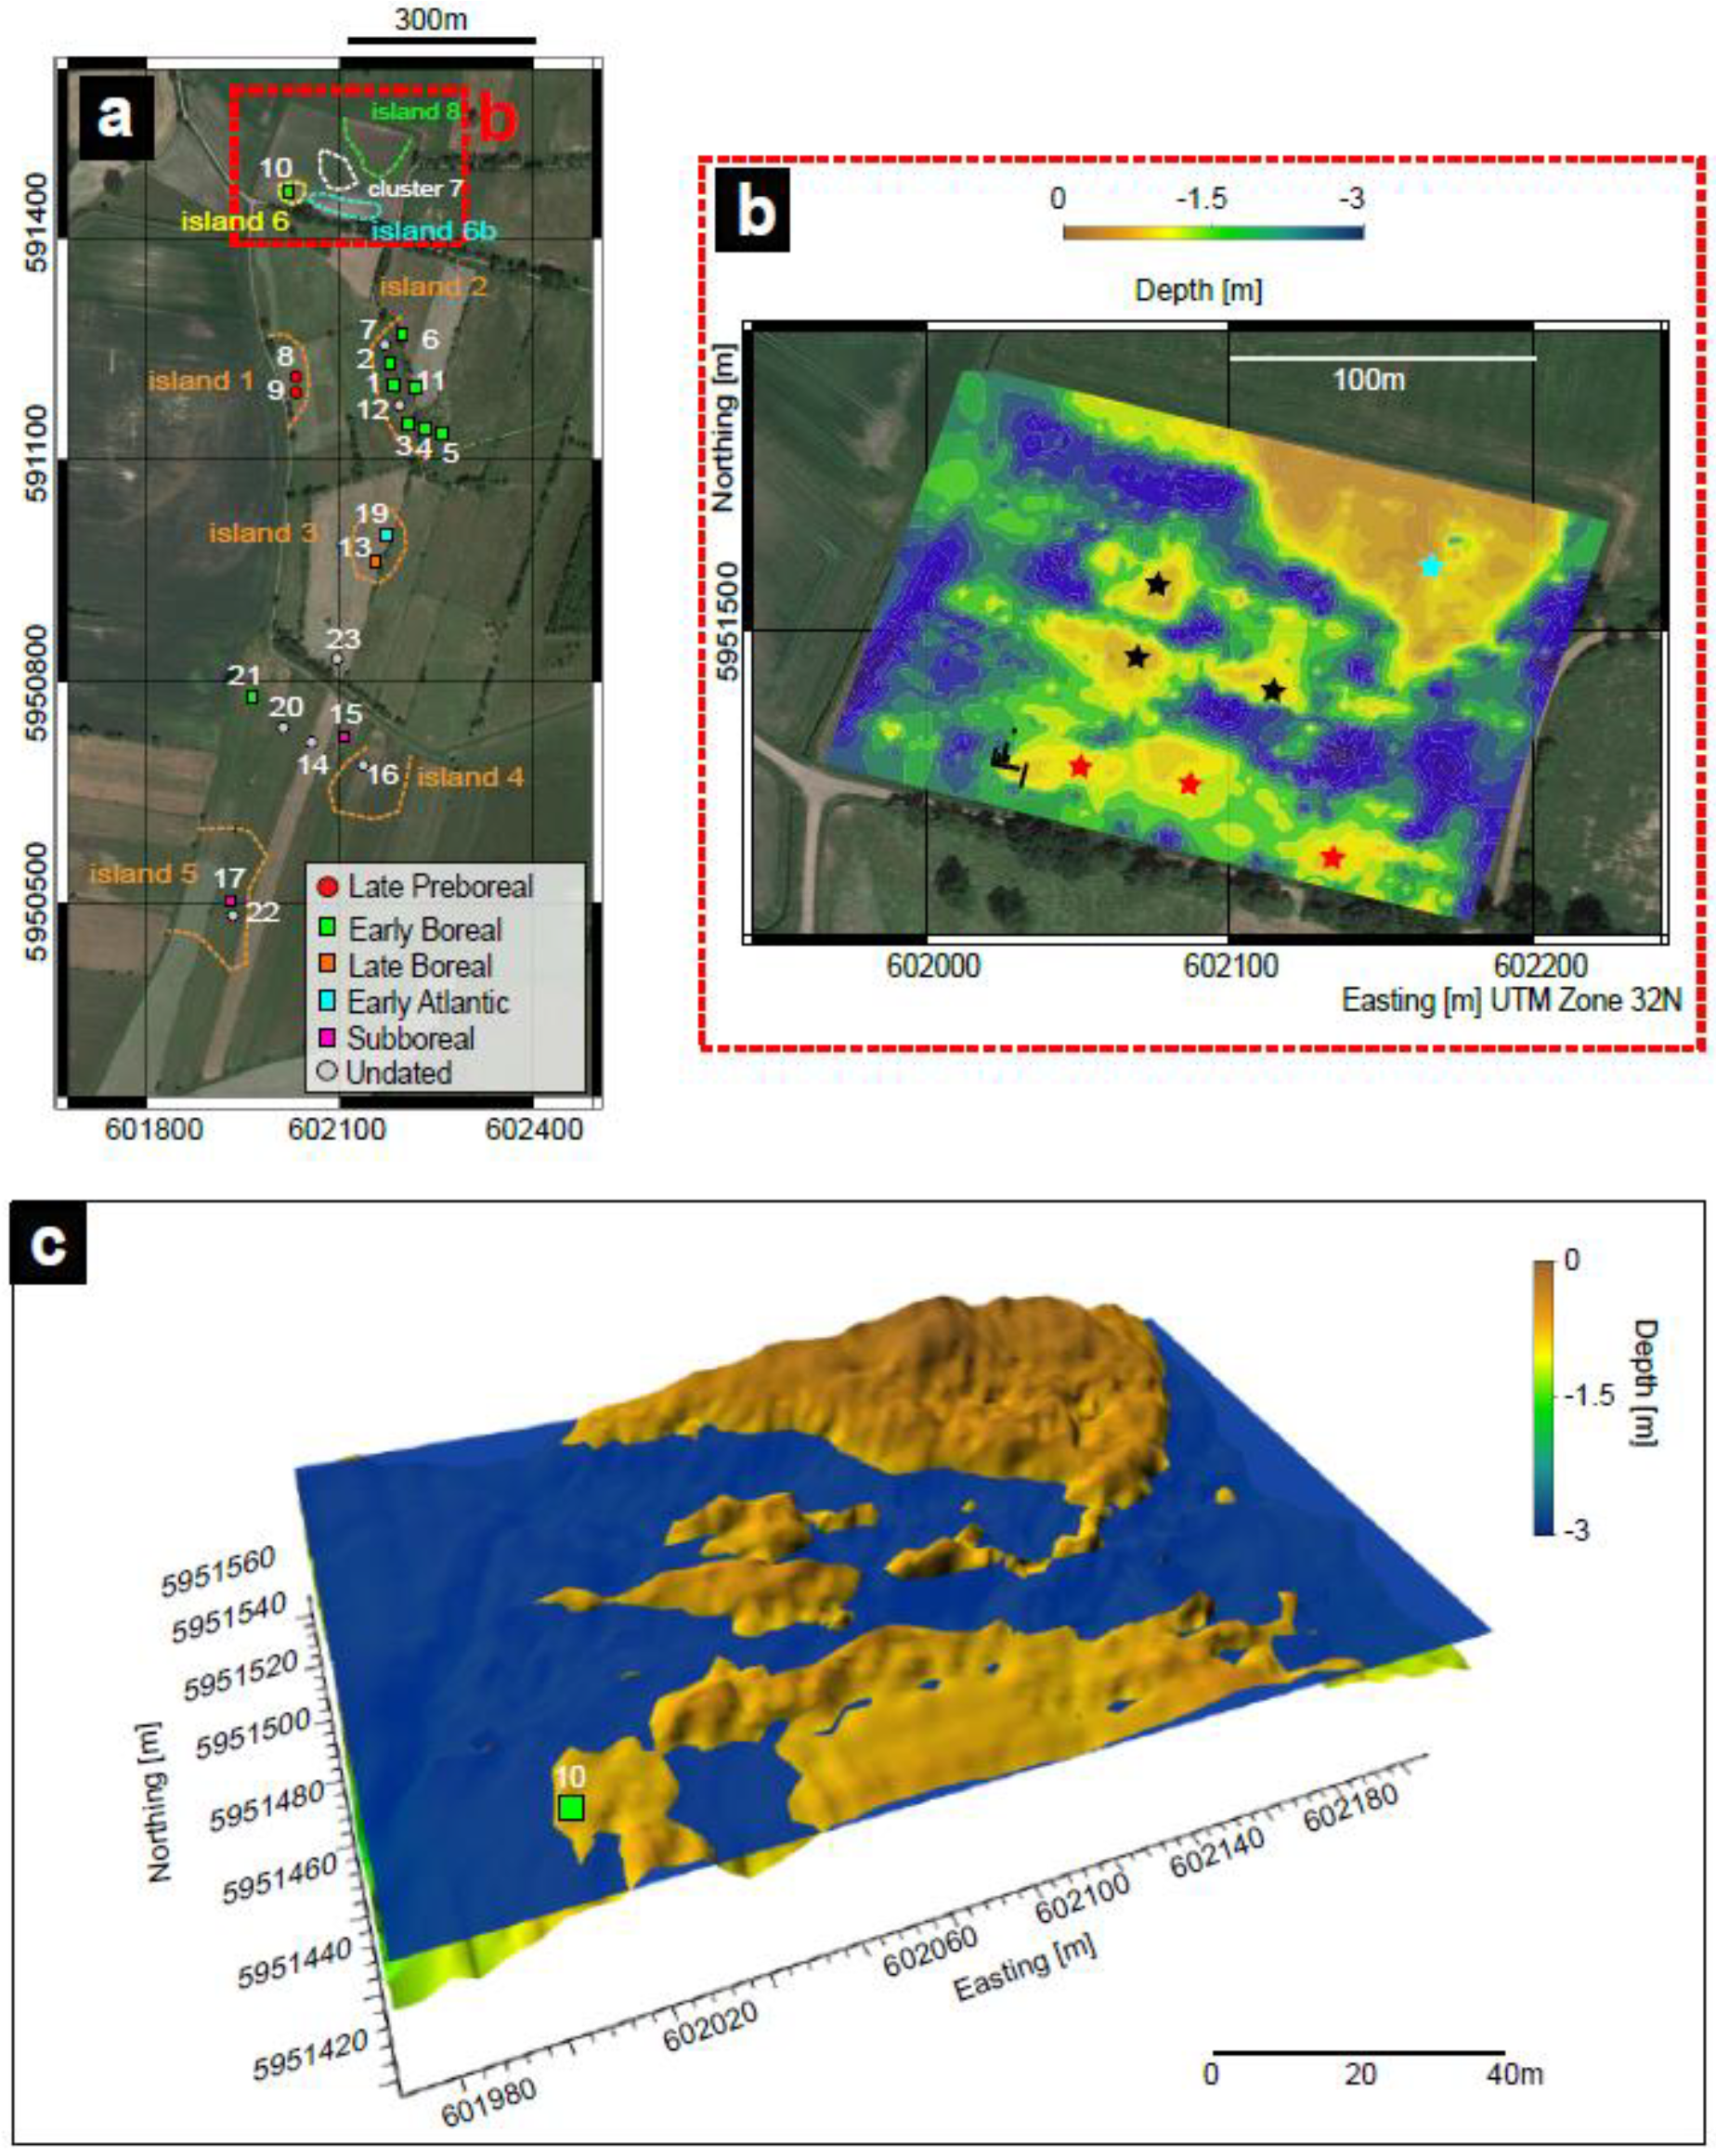
10], an updated map is presented in which the different Mesolithic campsites are displayed in different colors according to the time of occupation (
Figure 8a). We can assert that Duvensee WP10 is among the oldest sites in the northernmost sector. In accordance with the earlier analyses, it can still be seen that the general pattern remains: the younger the site, the more southerly its location within the area under consideration.
The profiles were interpolated to allow for the creation of 2D contour maps for each interface.
Figure 8b shows the contour map of Interface3, which marks the basal sand and is therefore fundamental for the islands’ identification. We recognized several areas where the reflections associated with the basal sands were at shallower depths. Comparing this map with the position of the recent excavations, we noted the correspondence between the location of an island obtained from the GPR survey and the Mesolithic campsite. Based on this data, we can argue that several small islands (at least 6) are visible in the vicinity of Duvensee WP10: three in the southern sector (red stars), of which the one on the western side hosts the Mesolithic camp, and three in the middle of the area (black stars). The southernmost islands present an extension of about 30 m from east to west and 15 m from the north to south direction, while the latter (black) are 25 m long and 20 m wide. The northeastern sector is mostly occupied by a large island (cyan), which is 145 m wide and 75 m long, presenting a uniform and isolated structure.
To visualize the situation, we assumed a changing water level in the area under examination. The early Mesolithic camps were located within the overlying organic sediments and not on the mineral soil forming the islands; therefore, the model shown in
Figure 8c includes Interface3 and Interface1 together with a hypothetical water level taking account of the depth of the sand lenses in the excavations. This was set for understanding the structure and location of the islands.
The model suggests that the southern island cluster presented above must be considered as two islands. The first indeed hosts Duvensee WP10 and the other two small bank hills should be considered as a feature; the second cluster of islands in the middle of the area seems to be composed by three small, interconnected islands (cluster 7 in
Figure 8a). The large island on the north (island 8 in
Figure 8a) presents a higher elevation, and it likely emerged from the water before the others, forming a hypothetical large surface for human occupation.
Considering each layer, an estimation of the occupied volume could be made. The coarse sediments on top (peat and detritus gyttja) occupied a volume of approximately 1.90 × 10
6 m
3, while the fine sediments (fine gyttja and the clayish-loamy deposit) occupied a volume of approximately 2.45 × 10
6 m
3. The basal sand (down to 2.5 m in depth) occupied approximately 4.40 × 10
6 m
3, delivering an estimation of the volume of the bottom of the lake. These results were then used as input for a first estimation of the water reduction in the investigated area. The growth rate of each was estimated as a value between approximately 0.3 m
2/yr and 0.6 m
2/yr, in line with [
10]. It seemed that the larger island (island 8) presented a higher growth rate (0.6 m
2/yr) with respect to islands in the middle of the area.
By simulating the regression of the water and the shrinking of the lake over time, we calculated the growth of the habitable island area, thereby making it possible to the constrain numerical modeling of sedimentation in the bog area, which may be the focus for future investigations.
5. Discussion
5.1. General Assessment
In this paper, we presented the results of a 16-channel MALÅ Imaging Radar Array (MIRA) survey aimed at reconstructing the ancient landscape during Mesolithic occupation, focused on the detection of archeological features. Ground-truthing the geophysical results with archeological excavations allowed for the identification of some archeological remains, thereby laying the groundwork for future investigations.
It became clear that the subsurface in the area examined was a highly diverse landscape that greatly influenced the topographical transformation as the ancient lake became overgrown and silted up. The geophysical investigations showed more clearly how the basin structure was formed and which areas were useful for Mesolithic people. However, a comparison of the results from the excavation and the reconstructions presented in
Figure 8 led to a striking finding: the excavation identified a refuse layer in the eastern parts of trenches 2 and 5, which clearly indicated a section of the site that was submerged in water during the time of occupation. GPR showed that the area was raised to an elevation comparable with that of the settlement area. As can be seen from the profiles, the whole excavated area generally followed a rather shallow slope. Hence, it may be expected that the larger parts of the refuse layers, and thus organic preservation, are to be found further south and west of the trenches. Another striking discovery was the presence of the so far unknown cluster 7 and island 8, promising more archaeological features and insights into prehistoric life in the area. Thus far, however, no surface finds have been recorded that would indicate prehistoric occupation. Nevertheless, the presence of this large island is very interesting with regard to organic preservation along the shoreline and the possibility of an undisturbed site (due to the lack of surface finds). Moreover, its size suggests its ability to support a larger camp, similar, for instance, to the sites in Friesack [
51]. All these statements may be a starting hypothesis for future test excavations and research foci.
Regarding a more precise insight into the features and structures on the sites, our results showed that the detection of features such as hearths and tree stumps is possible; however, it demands a very detailed analysis of the different profiles which, in turn, often requires prior—i.e., archeological—identification. As for the tree stump, we assumed that this body itself influenced the hydrology within the peat, because it was more compact than the surrounding sediments. However, this hypothesis needs to be confirmed with chemical analysis to determine if there are any variations in the chemical composition that can reflect a change shown in the geophysical data. Some studies reported the detection of wooden trackways or waterlogged wood in peat layers, which would support our assumption [
52,
53].
Moving on to hearths, the identification of these ephemeral features is a current challenge. As reported in
Section 4.2.2, the GPR interpretation made it possible to recognize the transition between the find layer on the degraded peat and the archaeologically sterile layers. This is an important result, since locating this interface may help to pinpoint further test excavations on the newly discovered islands.
As hearths are very shallow and without further structures, they are tricky to identify in the GPR record. Nonetheless, the results are promising with respect to small local anomalies if algorithms are developed that compare different local amplitude variations. The object-based image classification (OBIA) of GPR data turned out to be a successful tool for the detection of fireplaces [
54]; however, the investigated features presented fire-cracked rocks and had a diameter and depth > 1 m. For the given conditions, refinements of the OBIA method are necessary before it can be reliably applied.
5.2. Stratigraphic Aspects
Regarding the reconstruction of the landscape, it is important to distinguish between our model and the more complex sedimentary dynamics occurring within the water basin. Several aspects have already been analyzed in [
10], and a focused comparison with the previous study is necessary. The first aspect worth mentioning is the presence of the plough horizon. The GPR depth slices were difficult to interpret in the first 40 cm (until 8 ns) and the radargrams presented some difficulties, particularly in the southern sector. As reported in
Section 4.1, the interpretation of the eastern proportion of profile AB was quite ambiguous because the different layers seemed somehow interconnected. This may have been caused by agricultural activity, in particular at the location of the sand slope. Following this transition was therefore challenging, and we would suggest interpreting island 6b in
Figure 8a with a degree of caution.
The second aspect focuses on GPR wave velocity, which appears to be higher in the presented study compared to [
10]. The reason might be twofold: the different soil typology, which presents a ploughing soil at the top, can play a role as well as the season in which the measurements took place. The campaign was carried out in early December and the surface as well as the upper five centimeters were frozen. As observed in this study, these conditions are favorable for a higher wave velocity. Another aspect connected with GPR velocity is the depth of investigation. The authors of [
10] reported a depth of about 3 m using a 200 MHz antenna. The presented study showed a comparable depth of investigation of about 2.5 m. The higher velocity and a frozen surface enable a higher penetration for a 400 MHz antenna.
The third aspect to consider is the lateral and vertical resolution, which was significantly increased compared to the previous investigation with a single-channel 200 MHz antenna. The multi-channel 400 MHz system delivered a vertical resolution between 3 and 8.8 cm that made it possible to detect each layer reported in the archeological sections (
Figure 6c and
Figure 7c). The different internal peat layering was indeed visible at the top of the GPR profiles. If we focus on the fireplaces, which are more or less 5 cm thick, we can assume that the MIRA system would be able to recognize them, assuming these features show a significant contrast in dielectric permittivity. In addition, the lateral spacing between profiles for the single 200 MHz antenna was 30 m, which is much coarser than the multichannel system with 8 cm.
For a detailed and realistic landscape reconstruction, further aspects need to be incorporated into the analysis. As discussed above, Duvensee became overgrown over the course of the Holocene. Consequently, the landscape has been subject to constant change and can hardly be represented by static images as produced here. Nonetheless, the results produced here help us understand the choice of settlement locations and integrate them into a wider picture, thereby enabling us to better understand the behavior and interaction of early Mesolithic people. Therefore, it is important to understand where and when certain landscapes and areas were used and occupied and what role they played in the perception and lifeways of prehistoric hunter-gatherers. With several well-investigated areas, the picture of early Mesolithic settlement strategies is becoming increasingly rich in detail (e.g., [
55,
56,
57,
58,
59,
60]). Besides pollen analysis and radiocarbon dating, geophysical investigation together with coring allow a detailed landscape investigation, which increases our understanding of the depositional processes that took place during peat formation. The recent study of [
61] provided an alternative ground-based method for capturing large-scale spatial information using airborne methods, allowing the estimation of a bog volume.
In our study, we identified the form and extent of the paleo-island that hosted the Duvensee WP 10 site and showed additional possible settlement areas in the ancient lake. It became clear that the western shoreline of ancient Lake Duvensee bears further potential for discovering more sites that may even be undisturbed. It has been shown that the implementation of remote survey techniques through GPR offers a solid and efficient tool for understanding the prehistoric landscape and makes it possible to gain a very detailed insight into the ground, even enabling the detection of elements such as tree stumps. Currently, the results are not refined enough to even identify shallow archaeological features, such as hearths, with certainty; however, our results indicate that this may be possible in the future. Furthermore, being able to trace the ancient shoreline provides opportunities for pin-pointed archaeological investigations, thereby combining minimal destruction with high scientific gain. Incorporating detailed paleo-ecological studies is necessary to dissect the paleolandscape into chronological units for environmental reconstruction. Nonetheless, the geophysical results create a background against which such studies can be performed to reach a higher level of detail and reliability.
6. Conclusions
In this study, we presented new insights into the landscape formation and occupation at ancient Lake Duvensee, showing how detailed prehistoric landscapes can be reconstructed to provide us with a picture of the ancient topography and its interaction with human settlement in a changing environment. Combining the areal GPR survey with geoarchaeological information from excavations, the main interfaces associated with the characteristic sediments of wetland environments were detected and visualized in a 3D model. A hypothetical water level was set in accordance with the depth of the hearths’ sand lenses, which confirmed the presence of a Mesolithic camp on top of overgrown sand hills close to the shoreline.
Regarding the goals presented in the introduction, we reached the following conclusions:
We were able to identify the form and extent of the paleo-island that hosted the Duvensee WP10 site. Five additional sand hills were recognized that may have hosted settlement areas and represent areas of interest for future investigations. In particular, there was an extended island on the northern sector about 145 m wide and 75 m long that presented the right characteristics for hosting Mesolithic camps; however, no archaeological evidence is available from this area thus far.
The growth rate of the islands due to peat accumulation was in the order of approximately 0.3 m2/yr to 0.7 m2/yr between the late Preboreal and the Subboreal stages, reducing the fish supply of the hunter-gatherers.
Comparing archeological results with the geophysical record, we were able to trace the shoreline and provide new insights into Mesolithic activity and refuse zones. Identifying this area allowed us to make very detailed investigations, offering the best insights currently possible into subsistence strategies and environment use at and around Duvensee WP10 [
18]. The excavations were able to use a highly precise location of areas of interest and thus dig trenches at the most relevant spots on site.
Moreover, the stratigraphy was imaged with a high degree of resolution (3 to 8.8 cm), providing the internal layering of the archaeologically investigated sectors (the peat in particular) and allowing us to locate the interface between archaeological relevant layers and the sterile layers.
Based on the multi-channel GPR survey, we also conclude that this sort of system has the potential to detect small and elusive archeological features, such as fireplaces; however, more detailed analyses of the profiles and the physical parameters are required. The reflections associated with these features are weak and easily confused with other potential features at the local level. Identification is therefore not unique. Working in synergy with open excavations is the key to finding and understanding small cm-scale ephemeral structures in radargrams and to assessing the suspected traces of hunter-gatherer groups.
Integrating non-destructive and high-performance analysis into archaeological landscape reconstruction has proven useful in several cases. However, applying this to elusive archaeological landscapes, such as the ancient Lake Duvensee, where hunter-gatherers left little structural evidence of their activities is significantly improving our understanding of the past.
Apart from being able to cover large areas in a short time, GPR measurements require adequate post-processing and calibration through in situ investigations to reach useful results.
Being able to generate paleomaps of large landscapes presents opportunities to better understand human behavior in prehistoric landscapes and to improve environmental reconstructions. The elusiveness of Mesolithic and Paleolithic sites bears a clear challenge for predictive modeling and surveying, as it is important to understand the former landscape in the first place before a prognosis can be made. With respect to overgrown lakes, this means that it is paramount to ascertain which sites are likely to yield the most information, i.e., undisturbed layers, with a view to identifying former islands.
Author Contributions
E.C. was responsible for the conceptualization of the study, analysis of the data, and measuring on site; D.G. contributed with investigation results; E.C. and D.G. wrote and revised the manuscript; T.W. developed and utilized software; E.E. was responsible for devices and took part in the measurement campaign; W.R., D.W., H.L. and U.S. were responsible for funding acquisition and project supervision. All authors have read and agreed to the published version of the manuscript.
Funding
This research is part of the Collaborative Research Centre 1266 funded by the Deutsche Forschungsgemeinschaft (DFG, German Research Foundation–Grant 2901391021–SFB 1266).
Institutional Review Board Statement
All procedures performed in studies involving human participants were in accordance with the ethical standards of the institutional and/or national research committee and with the 1964 Helsinki declaration and its later amendments or comparable ethical standards.
Informed Consent Statement
Informed consent was obtained from all individual participants included in the study.
Data Availability Statement
Data is available upon request from the corresponding author.
Acknowledgments
We would like to thank the longtime excavator and researcher of the Duvensee bog sites, Klaus Bokelmann, for detailed information. Moreover, we would like to thank Martin Thorwart, Ines Budde, Katharina Rutsch, Detlef Schulte-Kortnack, and Agnes Wansing for their help during the fieldwork. In addition, we would like to thank Joe Paul Kroll for the language revision.
Conflicts of Interest
The authors declare no conflict of interest.
References
- Van de Noort, R.; O’Sullivan, A. Rethinking Wetland Archaeology; Gerald Duckworth and Co. Ltd.: London, UK, 2006. [Google Scholar]
- Menotti, F. Wetland Archaeology and Beyond: Theory and Practice; University Press: Oxford, UK, 2012. [Google Scholar]
- Sergant, J.; Crombé, P.; Perdaen, Y. The ‘invisible’ hearths: A contribution to the discernment of Mesolithic non structured surface hearths. J. Archaeol. Sci. 2006, 33, 999–1007. [Google Scholar] [CrossRef]
- Verhegge, J.; Missiaen, T.; Crombé, P. Exploring Integrated Geophysics and Geotechnics as a Paleolandscape Reconstruction Tool: Archaeological Prospection of (Prehistoric) Sites buried deeply below the Scheldt Polders (NW Belgium). Archaeol. Prospect. 2016, 23, 125–145. [Google Scholar] [CrossRef]
- Bokelmann, K. Spade paddling on a Mesolithic lake—Remarks on Preboreal and Boreal sites from Duvensee (Northern Germany). In A Mind Set on Flint; Studies in Honour of Dick, Stapert; Niekus, M.J.L.T., Barton, R.N.E., Street, M., Eds.; Groningen Archaeological Studies: Groningen, The Netherlands, 2012; pp. 369–380. [Google Scholar]
- Groß, D.; Lübke, H.; Schmölcke, U.; Zanon, M. Early Mesolithic activities at ancient Lake Duvensee, northern Germany. Holocene 2018, 29, 197–208. [Google Scholar] [CrossRef]
- Roessler, L. Erdgeschichte des Herzogtums Lauenburg; Ratzeburg: Albrechts, Germany, 1957. [Google Scholar]
- Groß, D.; Piezonka, H.; Corradini, E.; Schmölcke, U.; Zanon, M.; Dörfler, W.; Dreibrodt, S.; Feeser, I.; Krüger, S.; Lübke, H.; et al. Adaptations and transformations of hunter-gatherers in forest environments: New archaeological and anthropological insights. Holocene 2019, 29, 1531–1544. [Google Scholar] [CrossRef] [Green Version]
- Serraino, M.; Lucchi, E. Energy Efficiency, Heritage Conservation, and Landscape Integration: The Case Study of the San Martino Castle in Parella (Turin, Italy). Energy Procedia 2017, 133, 424–434. [Google Scholar] [CrossRef]
- Corradini, E.; Wilken, D.; Zanon, M.; Groß, D.; Lübke, H.; Panning, D.; Dörfler, W.; Rusch, K.; Mecking, R.; Erkul, E.; et al. Reconstructing the palaeoenvironment at the early Mesolithic site of Lake Duvensee: Ground-penetrating radar and geoarchaeology for 3D facies mapping. Holocene 2020, 30, 820–833. [Google Scholar] [CrossRef]
- Schwantes, G.; Gripp, K.; Beyle, M. Der frühneolithischeWohnplatz von Duvensee. Praehist. Z. 1925, 16, 173–177. [Google Scholar]
- Schwabedissen, H. Grabungen auf dem Moorwohnplatz von Duvensee. Germania 1951, 29, 208. [Google Scholar]
- Bokelmann, K. Duvensee, einWohnplatz des Mesolithikums in Schleswig-Holstein, und die Duvenseegruppe. Offa 1971, 28, 5–26. [Google Scholar]
- Holst, D. Hazelnut economy of early Holocene Hunter–Gatherers: A case study from Mesolithic Duvensee, Northern Germany. J. Archaeol. Sci. 2010, 37, 2871–2880. [Google Scholar] [CrossRef]
- Schwantes, G. Die Vorgeschichte Schleswig-Holsteins (Stein-und Bronzezeit); Wachholtz: Neumünster, Germany, 1939. [Google Scholar]
- Averdieck, F.-R. Palynological investigations in sediments of ancient lake Duvensee, Schleswig-Holstein (North Germany). Hydrobiology 1986, 143, 407–410. [Google Scholar] [CrossRef]
- Corradini, E.; Dreibrodt, S.; Erkul, E.; Groẞ, D.; Lübke, H.; Panning, D.; Pickartz, N.; Thorwart, M.; Vött, A.; Willershäuser, T.; et al. Understanding Wetlands Stratigraphy: Geophysics and Soil Parameters for Investigating Ancient Basin Development at Lake Duvensee. Geociences 2020, 10, 314. [Google Scholar] [CrossRef]
- Groß, D.; Henke, I.S.; Lübke, H.; Meadows, J.; Schmölcke, U. Duvensee WP 10—An early Mesolithic site at ancient Lake Duvensee, Germany. J. Wetl. Archaeol. 2021. [Google Scholar] [CrossRef]
- Bokelmann, K. Duvensee, Wohnplatz 6—Neue BefundezurmesolithischenSammelwirtschaftim 7. vorchristlichenJahrtausend. Die Heim. 1980, 87, 320–330. [Google Scholar]
- Davis, J.L.; Annan, A.P. Ground-penetrating radar for high-resolution mapping of soil and rock stratigraphy. Geophys. Prospect. 1989, 37, 531–551. [Google Scholar] [CrossRef]
- Doolittle, J.A.; Minzenmayer, F.E.; Waltman, S.W.; Benham, E.C.; Tuttle, J.W.; Peaslee, S.D. Ground-penetrating radar soil suitability map of the conterminous United States. Geoderma 2007, 141, 416–421. [Google Scholar] [CrossRef]
- Conyers, L.B. Interpreting Ground-Penetrating Radar for Archaeology; Left Coast Press: Walnut Creek, CA, USA, 2012. [Google Scholar]
- Goodman, D.; Piro, S. GPR Remote Sensing in Archaeology, Geotechnologies and the Environment; Springer: Berlin/Heidelberg, Germany, 2013. [Google Scholar]
- Kvamme, K.L. Geophysical surveys as landscape archaeology. Am. Antiq. 2003, 68, 435–457. [Google Scholar] [CrossRef]
- Gaffney, C.F.; Gater, J. Revealing the Buried Past: Geophysics for Archaeologists; Tempus: Stroud, UK, 2003. [Google Scholar]
- Campana, S.; Piro, S. (Eds.) Seeing the Unseen—Geophysics and Landscape Archaeology; Taylor & Francis: London, UK, 2008. [Google Scholar]
- Neal, A. Ground-penetrating radar and its use in sedimentology: Principles, problems and progress. Earth Surf. Process. Landf. 2004, 27, 261–330. [Google Scholar] [CrossRef]
- Ruffell, A.; Geraghty, L.; Brown, C.; Barton, K. Ground-penetrating radar facies as an aid to sequence stratigraphic analysis: Application to the archaeology of Clonmacnoise Castle, Ireland. Archaeol. Prospect. 2004, 11, 247–262. [Google Scholar] [CrossRef]
- Stern, N. Stratigraphy, depositional environments, and paleolandscape reconstruction in landscape archaeology. In Handbook of Landscape Archaeology; Bruno, D., Thomas, J., Eds.; Left Coast Press: Walnut Creek, CA, USA, 2008; pp. 365–378. [Google Scholar]
- Doolittle, J.A.; Butnor, J.R. Soils, peatlands, and biomonitoring. In Ground Penetrating Radar Theory and Applications; Jol, H.M., Ed.; Elsevier: Amsterdam, The Netherlands, 2009; pp. 179–202. [Google Scholar]
- Leckebusch, J. Use of antenna arrays for GPR surveying in archaeology. Near Surf. Geophys. 2005, 3, 111–115. [Google Scholar] [CrossRef]
- Trinks, I.; Johansson, B.; Gustafsson, J.; Emilsson, J.; Friborg, J.; Gustafsson, C.; Nissen, J.; Hinterleitner, A. Efficient, Large-scale Archaeological Prospection using a True Three-dimensional Ground-penetrating Radar Array System. Archaeol. Prospect. 2010, 17, 175–186. [Google Scholar] [CrossRef]
- Novo, A.; Leckebusch, J.; Goodman, D.; Morelli, G.; Piro, S.; Catanzariti, G. Advances in GPR Imaging with Multi-channel Radar Systems. J. Surv. Mapp. Eng. 2013, 1, 1–6. [Google Scholar]
- Larsson, L.; Trinks, I.; Söderberg, B.; Gabler, M.; Dell’Unto, N.; Neubauer, W.; Ahlström, T. Interdisciplinary archaeological prospection, excavation and 3D documentation exemplified through the investigation of a burial at the Iron Age settlement site of Uppåkra in Sweden. Archaeol. Prospect. 2015, 22, 143–156. [Google Scholar] [CrossRef]
- Trinks, I.; Hinterleitner, A.; Neubauer, W.; Nau, E.; Löcker, K.; Wallner, M.; Gabler, M.; Filzwieser, R.; Wilding, J.; Schiel, H.; et al. Large-area high-resolution ground-penetrating radar measurements for archaeological prospection. Archaeol. Prospect. 2018, 25, 171–195. [Google Scholar] [CrossRef]
- Viberg, A.; Gustafsson, C.; Andrén, A. Multi-Channel Ground-Penetrating Radar ArraySurveys of the Iron Age and Medieval Ringfort Bårby on the Island of Öland, Sweden. Remote Sens. 2020, 12, 227. [Google Scholar] [CrossRef] [Green Version]
- Grasmueck, M.; Weger, R.; Horstmeyer, H. Full-resolution 3D GPR imaging. Geophysics 2005, 70, K12–K19. [Google Scholar] [CrossRef]
- Leckebusch, J. Two- and three-dimensional georadar surveys across a medieval choir: A case study in archaeology. Archaeol. Prospect. 2000, 7, 189–200. [Google Scholar] [CrossRef]
- Neubauer, W.; Eder-Hinterleitner, A.; Seren, S.; Melichar, P. Georadar in the Roman civil town Carnatum, Austria: An approach for archaeological interpretation of GPR data. Archaeol. Prospect. 2002, 9, 135–156. [Google Scholar] [CrossRef]
- Van Dam, R.L.; Schalger, W. Identifying causes of ground-penetrating radar reflections using time-domain reflectometry and sedimentological analyses. Sedimentology 2000, 47, 435–449. [Google Scholar] [CrossRef] [Green Version]
- Conyers, L.B.; Ernenwein, E.G.; Bedal, L.A. Ground penetrating radar (GPR) mapping as a method for planning excavation strategies, Petra. Jordan Antiq. 2002, 76, 339–340. [Google Scholar]
- Bates, M.R.; Bates, C.R.; Whittaker, J.E. Mixed method approaches to the investigation and mapping of buried Quaternary deposits: Examples from southern England. Archaeol. Prospect. 2007, 14, 104–129. [Google Scholar] [CrossRef]
- Corradini, E.; Eriksen, B.V.; Fischer Mortensen, M.; Krog Nielsen, M.; Thorwart, M.; Krüger, S.; Wilken, D.; Pickartz, N.; Panning, D.; Rabbel, W. Investigating lake sediments and peat deposits with geophysical methods—A case study from a kettle hole at the Late Palaeolithic site of Tyrsted, Denmark. Quart. Intern. 2020, 558, 89–106. [Google Scholar] [CrossRef]
- Rabiger-Völlmer, J.; Schmidt, J.; Linzen, S.; Schneider, M.; Werban, U.; Dietrich, P.; Wilken, D.; Wunderlich, T.; Fediuk, A.; Berg, S.; et al. Non-invasive prospection techniques and direct push sensing as high-resolution validation tools in wetland geoarchaeology—Artificial water supply at a Carolingian canal in South Germany. J. Appl. Geophys. 2020, 173, 103928. [Google Scholar] [CrossRef]
- Verhegge, J.; Delvoie, S. Direct push, in situ video imaging of buried prehistoric landscapes in soft soils: First results in the polders, coversands, and loess belt of Belgium. Geomorphology 2021, 373, 107483. [Google Scholar] [CrossRef]
- Wunderlich, T. MultichannelGPR: A New MATLAB-Tool for the processing of GPR Data. Archeosci. Rev. Archéométrie 2021, 45, 279–283. [Google Scholar] [CrossRef]
- Wilken, D.; Wunderlich, T.; Zori, D.; Kalmring, S.; Rabbel, W.; Byock, J. Integrated GPR and archaeologicalinvestigationsreveal internal structureof man-made Skiphóllmound in Leiruvogur, Iceland. J. Arch. Sci. Rep. 2016, 9, 64–72. [Google Scholar]
- QGIS Association. QGIS Geographic Information System. 2020. Available online: http://www.qgis.org (accessed on 1 February 2022).
- Krige, D.G. A statistical approach to some basic mine valuation problems on the Witwatersrand. J. S. Afr. Inst. Min. Metall. 1951, 52, 119–139. [Google Scholar]
- Bokelmann, K. Duvensee, Wohnplatz 9: Ein präboreal-zeitlicherLagerplatz in Schleswig-Holstein. Offa 1991, 48, 75–114. [Google Scholar]
- Gramsch, B. Friesack: LetzteJäger und Sammler in Brandenburg. Jahrb. Römisch-Ger. Zent. Mus. Mainz 2002, 47, 51–96. [Google Scholar]
- Utsi, E. Trial GPR Surveys of Three Sites in the Somerset Levels: Part1—A Section of the Sweet Track 2nd July 2001, Copy accessed at: English Heritage Centre for Archaeology. Unpublished Work.
- Armstrong, K.; Cheetham, P. Locating the Sweet Track: Trialling Archaeological Geophysical Prospection in Peatland Environments. Presented at EIGG Postgraduate Symposium, British Geological Survey, Nottingham, UK; August 2008. [Google Scholar]
- Cornett, R.L.; Ernenwein, E.G. Object-Based Image Analysis of Ground Penetrating radar for archaic Hearths. Remote Sens. 2020, 12, 2539. [Google Scholar] [CrossRef]
- Larsson, L.; Sjöström, A. Bog Sites and Wetland Settlements during the Mesolithic: Research from a Bog in central Scania, Southern Sweden. Archäologisches Korresp. 2011, 41, 457–472. [Google Scholar]
- Jessen, C.A.; Pedersen, K.B.; Christensen, C.; Olsen, J.; Mortensen, M.F.; Hansen, K.M. Early Maglemosian culture in the Preboreal landscape: Archaeology and vegetation from the earliest Mesolithic site in Denmark at LundbyMose, Sjælland. Quatern. Intern. 2015, 378, 73–87. [Google Scholar] [CrossRef] [Green Version]
- Pedersen, K.B.; Mortensen, M.F.; Sørensen, M. TilbagetilHolmegårdMose. Gefjon 2016, 1, 10–37. [Google Scholar]
- Milner, N.; Conneller, C.; Taylor, B. Star Carr: A Persistent Place in a Changing World; White Rose University Press: York, UK, 2018; Volume 1. [Google Scholar]
- Groß, D. Islands in the Swamp. Lakescape-reconstructions of Mesolithic sites in the Rhinluch area (Germany). In Human Behavioural Adaptations to Interglacial Lakeshore Environments; García-Moreno, A., Hutson, J.M., Kindler, L., Smith, G.M., Turner, E., Villaluenga, A., Gaudzinski-Windheuser, S., Eds.; Verlag des Römisch-Germanischen Zentralmuseums: Mainz, Germany, 2020; pp. 31–42. [Google Scholar]
- Nilsson, B.; Hansson, A.; Sjöström, A. Sweden: Submerged Landscapes of the Early Mesolithic. In The Archaeology of Europe’s Drowned Landscapes; Bailey, G., Galanidou, N., Peeters, H., Jöns, H., Mennenga, M., Eds.; Springer: Cham, Switzerland, 2020; pp. 77–94. [Google Scholar]
- Siemon, B.; Seht, M.I.-V.; Steuer, A.; Deus, N.; Wiederhold, H. Airborne Electromagnetic, Magnetic, and Radiometric Surveys at the German North Sea Coast Applied to Groundwater and Soil Investigations. Remote Sens. 2020, 12, 1629. [Google Scholar] [CrossRef]
| Publisher’s Note: MDPI stays neutral with regard to jurisdictional claims in published maps and institutional affiliations. |
© 2022 by the authors. Licensee MDPI, Basel, Switzerland. This article is an open access article distributed under the terms and conditions of the Creative Commons Attribution (CC BY) license (https://creativecommons.org/licenses/by/4.0/).


 ,
, 


