
Morphological and Physiological Screening to Predict Lettuce Biomass Production in Controlled Environment Agriculture


Department of Horticulture, University of Georgia, Athens, GA 30602, USA
*
Author to whom correspondence should be addressed.
Remote Sens. 2022, 14(2), 316; https://doi.org/10.3390/rs14020316
Submission received: 3 December 2021
/
Revised: 29 December 2021
/
Accepted: 8 January 2022
/
Published: 11 January 2022
(This article belongs to the Special Issue Imaging for Plant Phenotyping)
Abstract
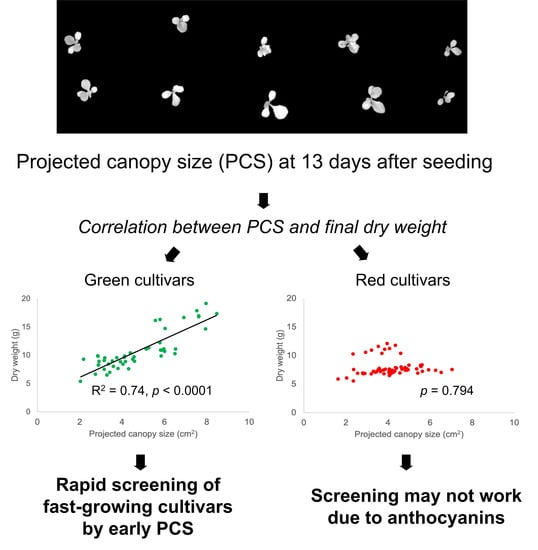
:Fast growth and rapid turnover is an important crop trait in controlled environment agriculture (CEA) due to its high cost. An ideal screening approach for fast-growing cultivars should detect desirable phenotypes non-invasively at an early growth stage, based on morphological and/or physiological traits. Hence, we established a rapid screening protocol based on a simple chlorophyll fluorescence imaging (CFI) technique to quantify the projected canopy size (PCS) of plants, combined with electron transport rate (ETR) measurements using a chlorophyll fluorometer. Eleven lettuce cultivars (Lactuca sativa), selected based on morphological differences, were grown in a greenhouse and imaged twice a week. Shoot dry weight (DW) of green cultivars at harvest 51 days after germination (DAG) was correlated with PCS at 13 DAG (R2 = 0.74), when the first true leaves had just appeared and the PCS was <8.5 cm2. However, early PCS of high anthocyanin (red) cultivars was not predictive of DW. Because light absorption by anthocyanins reduces the amount of photons available for photosynthesis, anthocyanins lower light use efficiency (LUE; DW/total incident light on canopy over the cropping cycle) and reduce growth. Additionally, the total incident light on the canopy throughout the cropping cycle explained 90% and 55% of variability in DW within green and red cultivars, respectively. Estimated leaf level ETR at a photosynthetic photon flux density (PPFD) of 200 or 1000 µmol m−2 s−1 were not correlated with DW in either green or red cultivars. In conclusion, early PCS quantification is a useful tool for the selection of fast-growing green lettuce phenotypes. However, this approach may not work in cultivars with high anthocyanin content because anthocyanins direct excitation energy away from photosynthesis and growth, weakening the correlation between incident light and growth.
1. Introduction
Many greenhouses and all plant factories use electric lighting, such as LED fixtures, to provide suitable light conditions for crop production. However, profitable crop production using electric lighting has inherent challenges due to the high cost, both installation and operating expenses, of electric lighting. Simulations of the light requirements for crop production and the cost of providing that light suggest that few crops have economic feasibility when electric lighting is the only light source [1]. The cost of supplemental or sole-source lighting in CEA can account for 10 to 50% of total operating costs [2,3,4] and, thus, has a great impact on profitability. To overcome the high costs associated with lighting and to maximize profits, researchers have studied different lighting strategies and developed improved cultivars for CEA [5,6]. Given the cost of providing light, efficient light capture and use are important for profitable CEA production.
Fast crop growth and short production cycles are especially important for CEA since they lower the electric cost for lighting per crop produced [6]. There are two properties that determine growth rate: the amount of light that is intercepted by the crop and the efficiency with which that light is used for photosynthesis [7,8,9,10]. Therefore, screening for these properties may be useful for selecting cultivars that are well-suited for CEA production. Crop light interception can be estimated based on canopy size and incident light [8,11,12]. A larger canopy early in the growth cycle will result in greater light interception and can increase crop photosynthesis and growth [11,12,13]. Another trait associated with rapid growth is a high electron transport rate (ETR) in the light reactions of photosynthesis. The light reactions produce ATP and NADPH, which provide the chemical energy required to reduce CO2 and synthesize carbohydrates. Hence, cultivars with a higher ETR would be expected to synthesize more carbohydrates and grow faster. The ETR depends largely on the amount of absorbed light and the quantum yield of photosystem II (ΦPSII); cultivars with a low ΦPSII dissipate a larger fraction of the absorbed light as heat, rather than use it for photosynthetic electron transport [14,15].
To optimize crop production in CEA, it is important to develop new cultivars that grow rapidly under CEA conditions. Such cultivar development can be facilitated by rapid, non-invasive screening of morphological and/or physiological characteristics. Although advances in molecular tools facilitate rapid screening of genetic backgrounds, screening is still one of the most time-consuming and expensive aspects of breeding programs [16]. Phenotypic evaluation of large breeding populations typically results in large data sets; extracting meaningful genotypic data from such phenotypic data sets can be expensive and time-consuming [17]. Imaging can help overcome these limitations through the rapid and non-invasive characterization of phenotypes [16,18]. Imaging can be used to estimate canopy coverage and light interception [19,20]. Parameters extracted from canopy images have been used to simulate biomass accumulation in barley [21]. Simple, rapid imaging approaches can thus be a valuable tool in breeding programs to assess morphological differences among genotypes [22].
To supplement morphological information that can be used to estimate crop light interception, physiological information on how efficiently that light is used for photosynthesis may provide additional valuable information. Pulse-amplitude modulated (PAM) chlorophyll fluorescence measurements can be used to quantify ΦPSII and ETR rapidly and non-destructively and are much faster and easier than the more common leaf CO2 exchange measurements. PAM chlorophyll fluorescence can be used to monitor photosynthetic performance [23,24] and screen for genotypes that have a high ETR [25].
Our objective was to test whether canopy imaging at different times during the production cycle and diurnal PAM chlorophyll fluorescence measurements can be used to screen for fast-growing genotypes. We hypothesized that a fast-growing cultivar would have (1) a larger canopy size early during the growth cycle and/or (2) a higher electron transport rate. To test these hypotheses, morphological and physiological properties of 11 lettuce cultivars with different morphology and leaf pigmentation were compared. Canopy size was imaged twice a week and ETRs were measured in response to diurnal sunlight fluctuations in a greenhouse. Our goal was to determine whether differences in biomass at harvest could be explained based on canopy size and/or ETR.
2. Materials and Methods
2.1. Plant Materials
Eleven lettuce cultivars (‘Aquino’, ‘Crunchita’, ‘Locarno’, ‘Lotus’, ‘Rex’, ‘Barlach’, ‘Carmessi’, ‘Rouxai’, ‘Seurat’, ‘Teodore’, and ‘Xandra’; Rijk Zwaan USA, Salinas, CA, USA) were selected based on their differences in morphology and pigmentation, specifically anthocyanin levels. We grouped these cultivars by their pigmentation: green (‘Aquino’, ‘Crunchita’, ‘Locarno’, ‘Lotus’, and ‘Rex’) and red (‘Barlach’, ‘Carmessi’, ‘Rouxai’, ‘Seurat’, ‘Teodore’, and ‘Xandra’) and shape: romaine (‘Crunchita’ and ‘Lotus’), butterhead (‘Aquino’, ‘Rex’, ‘Seurat’, and ‘Teodore’), oak-leaf (‘Barlach’, ‘Rouxai’, and ‘Xandra’), and loose-leaf (‘Locarno’ and ‘Carmessi’). Seeds were planted into 10-cm square pots containing a soilless substrate (Fafard® 2P Mix; Sun Gro Horticulture, Agawam, MA, USA), with 10 pots per cultivar. Once the seeds had germinated, 3 days after planting (0 day after germination; 0 DAG), seedlings were thinned to one plant per pot. Ten pots of each cultivar were placed on ebb-and-flow-benches, using a completely randomized design. The plants were subirrigated with a water-soluble fertilizer (15N-2.2P-12.5K; Peters Excel 15-5-15 Cal-Mag Special Fertilizer, ICL Fertilizers, Dublin, OH, USA) solution, containing 100 mg L−1 nitrogen, as needed. Plants were subirrigated approximately once a week during the first two weeks, twice a week during the third and the fourth week, and daily from the fifth week until harvest (51 DAG). Plants were spaced widely enough to not shade each other.
2.2. Growing Conditions
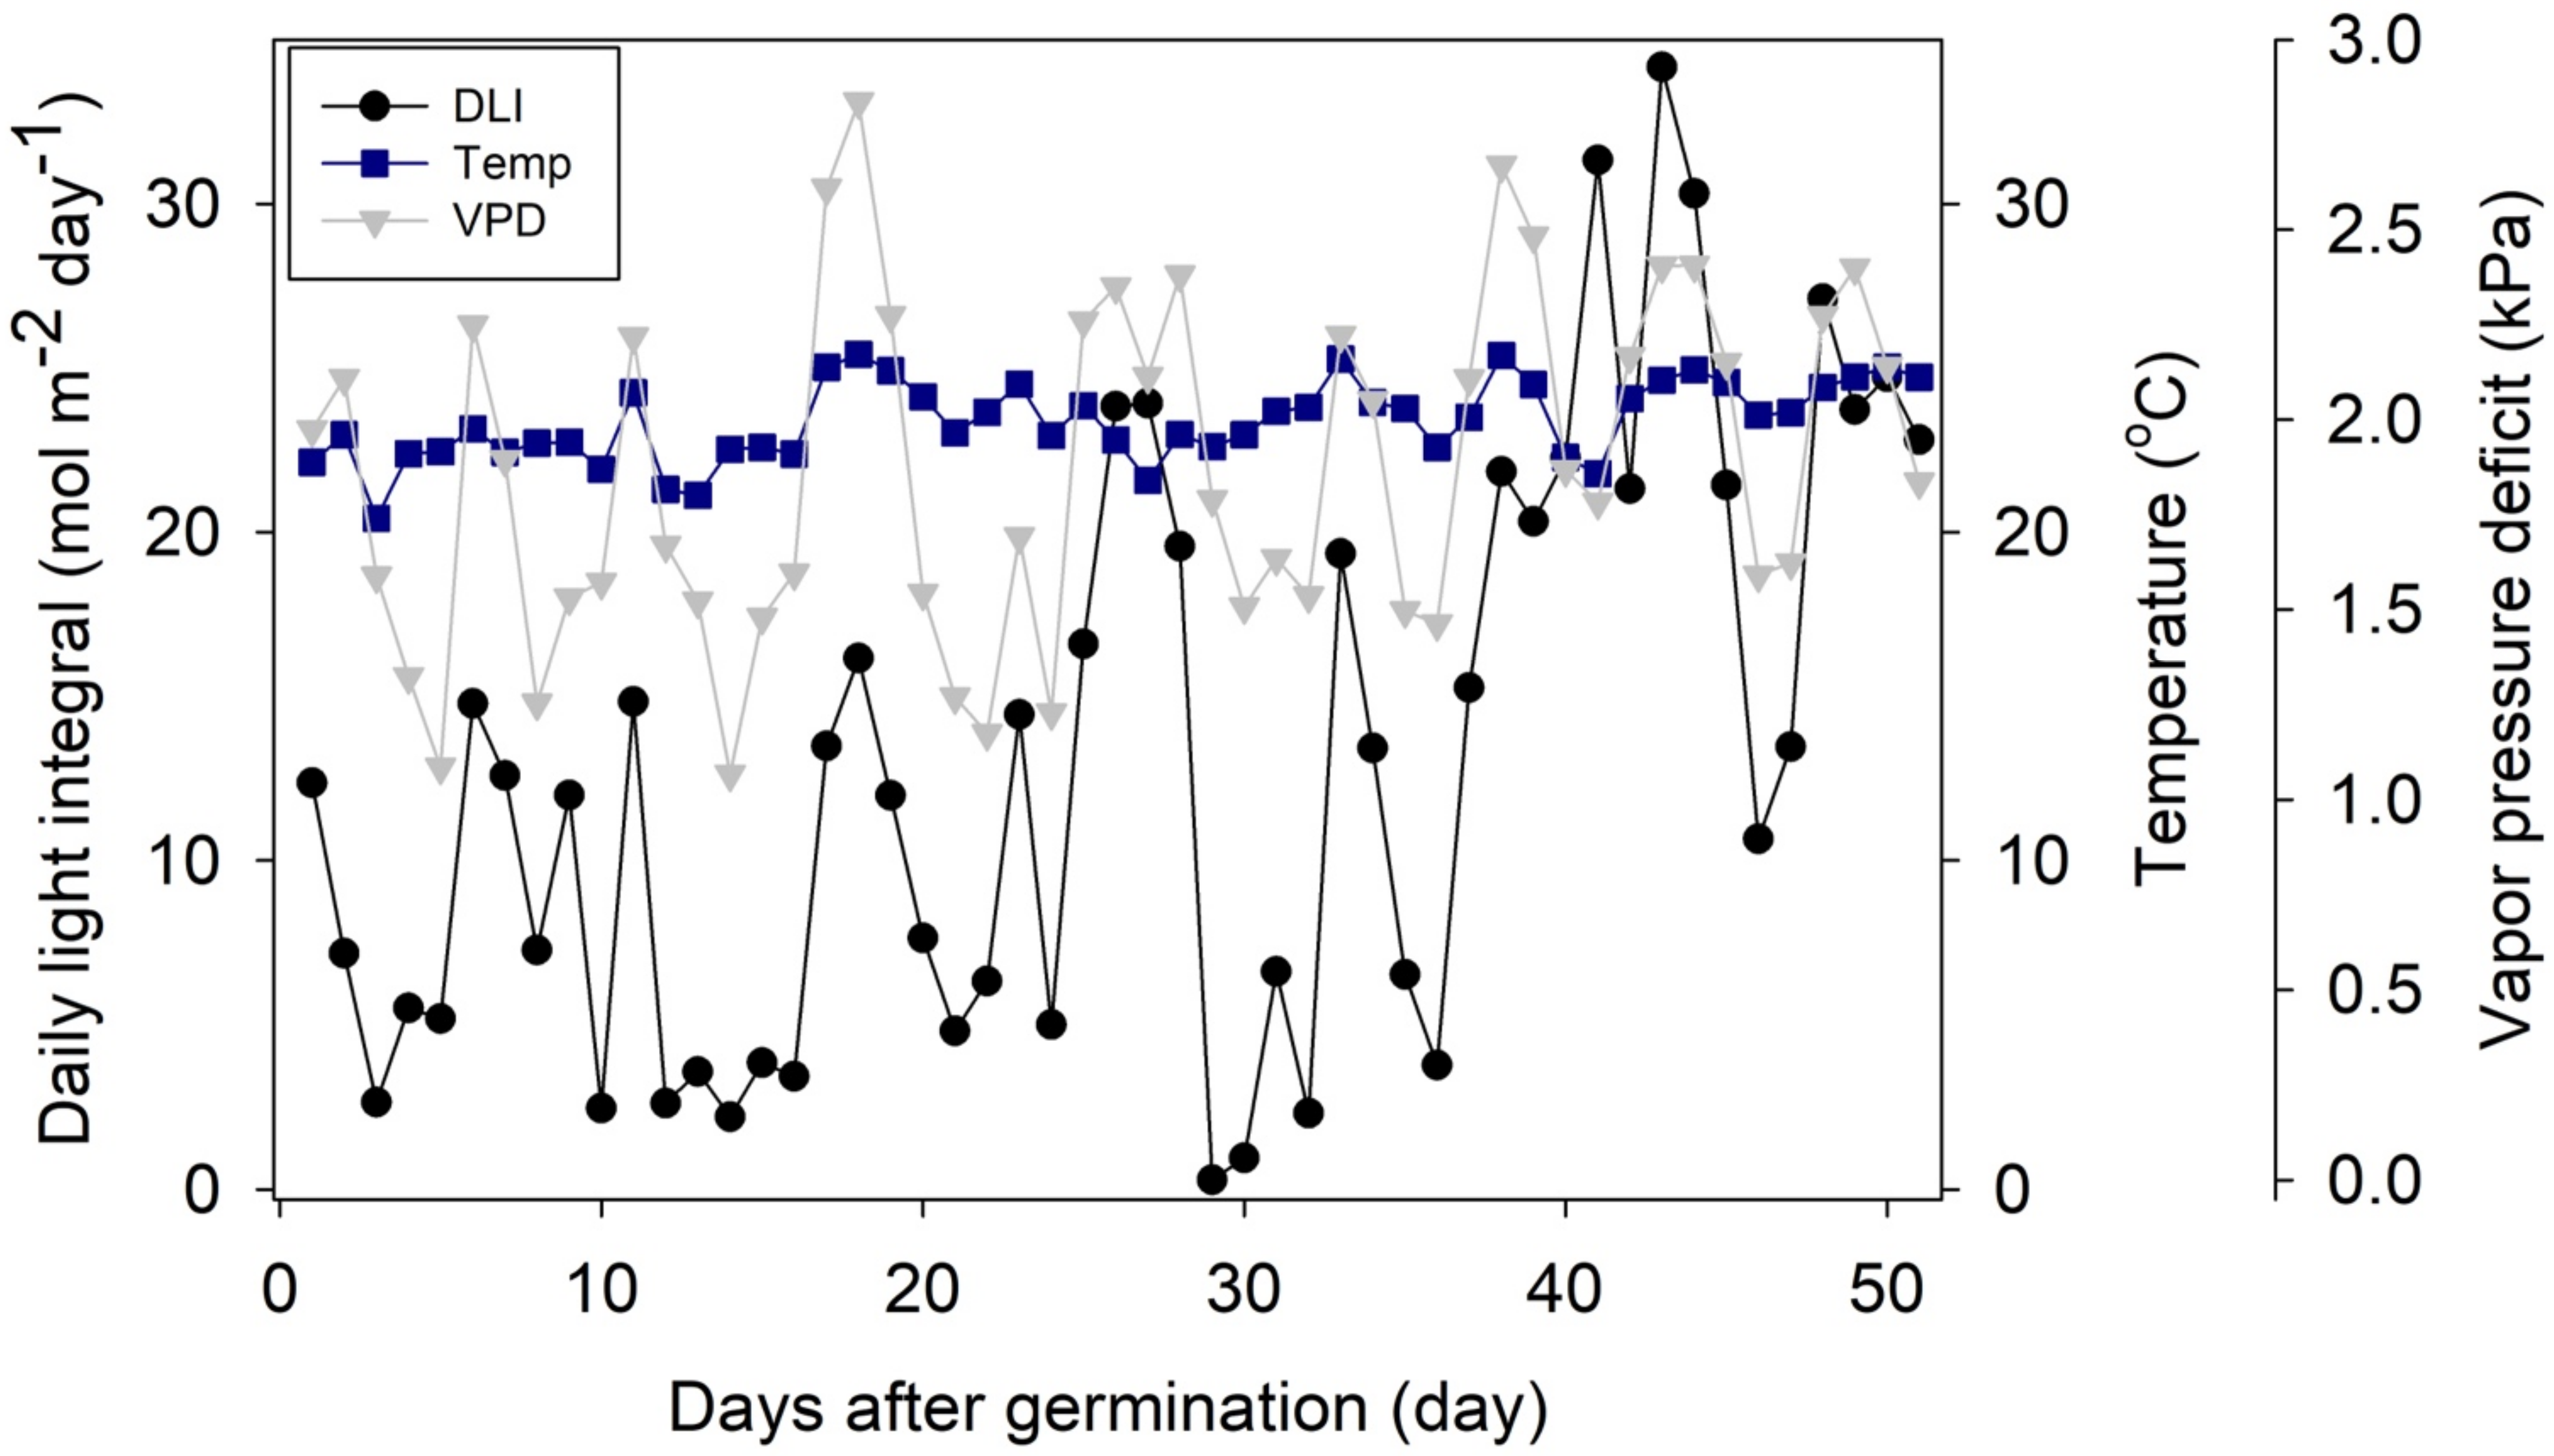
The plants were grown in a glass-covered greenhouse in Athens, Georgia, USA from February 5 to 30 March 2019. Maximum, minimum, and average vapor pressure deficit, temperature, and PPFD were measured at 20-min intervals. From the PPFD readings, the daily light integral (DLI; mol m−2 d−1) was calculated by integrating PPFD readings over each 24-h period. Then, DLI readings from 0 DAG were integrated to calculate the cumulative light integral (CLI; mol of photons) at each DAG. The average greenhouse conditions were a DLI of 12.7 ± 8.8 mol m−2 d−1, a temperature of 23.4 ± 1.2 °C, and a vapor pressure deficit of 1.8 ± 0.5 kPa (mean ± standard deviation) (Figure 1). The daylength was approximately 11.8 h.
2.3. Projected Canopy Size Imaging
The projected canopy size (PCS) of all plants was determined twice a week using chlorophyll fluorescence imaging (CFI). CFI visualizes only plants, not background, by capturing fluorescence emission from chlorophyll. Chlorophyll fluorescence accounts for a small fraction of the absorbed light (1–2%) and occurs at wavelengths of 650 to 730 nm, with a peak near 690 nm [26,27]. Based on this principle, chlorophyll fluorescence imaging provides strong contrast between plants and the non-fluorescing background in an image [28]. Note that our CFI technique does not use PAM and cannot be used to quantify ΦPSII, it simply captures images of fluorescence emitted by chlorophyll.
The imaging system was mounted in a light proof grow tent and consisted of a monochrome camera (Chameleon® 3, FLIR, Wilsonville, OR, USA) and LED lighting system (Pro 650e, LumiGrow, Emeryville, CA, USA). The camera was equipped with a 650 to 740 nm band-pass filter (Edmund Optics Inc., Barrington, NJ, USA) and mounted in the top of the grow tent, facing downward. For canopy imaging, the plants were exposed to blue LED light (450–490 nm) and the camera captured only the fluorescence from the chlorophyll in the plants. Each individual plant was placed in the center of the imaging station for imaging. After image acquisition, all lettuce plants were rerandomized to minimize the effect of any environmental gradients in the greenhouse on the plants.
To quantify PCS, the images were processed using Image J software (NIH, Bethesda, MD, USA) with the ‘threshold’ and ‘Analyze Particles’ functions, which separated plant from background and counted the number of pixels representing the canopy. The imaging system was calibrated by taking a picture of a ruler, which allowed for the conversion of pixels to area. The increase in PCS of each plant as a function of DAG or CLI was fitted using a sigmoidal equation
where a, b, and c are regression parameters and x is DAG or CLI.
PCS = a/(1 + e−(x−c)/b)
2.4. Diurnal Changes in Photochemistry
PAM chlorophyll fluorescence of the 11 lettuce cultivars was monitored from 30 to 48 DAG to determine ΦPSII and ETR. A chlorophyll fluorometer with four measuring heads (MONITORING-PAM; Heinz Walz, Effeltrich, Germany) was used to take diurnal chlorophyll fluorescence measurements on the uppermost fully-expanded leaf of four randomly-selected lettuce plants each day. Chlorophyll fluorescence was measured every 10 min for at least 24 h to collect data across a wide range of PPFDs. The measurements were repeated until each cultivar had at least three replications.
The ΦPSII was calculated as
where F′m and Ft are maximum and steady-state fluorescence in the light, respectively. Electron transport rate (ETR; µmol m−2 s−1) was calculated as
where 0.84 is the assumed leaf absorptance [29] and 0.5 accounts for the fact that two photons are needed to transport one electron through both PSII and PSI. We assumed that leaf age does not influence ΦPSII and ETR [30].
ΦPSII = (F′m − Ft)/F′m
ETR = ΦPSII × PPFD × 0.84 × 0.5
ΦPSII and ETR Light Response Curve
Diurnal ΦPSII and ETR measurements of the multiple plants of each cultivar, collected on different days, were combined to fit light response curves. The relationship between PPFD and ΦPSII was fitted using an exponential decay equation
where a, b, and c are regression parameters. The relationship between PPFD and ETR, also from the combined data for each cultivar, was fitted using a hyperbolic equation with a natural log transformation (Equation (5))
where a, b, c, and d are regression parameters (Figure S1). These equations were used to estimate the ETR at PPFDs of 200 and 1000 µmol m−2 s−1. We chose these PPFD levels to represent low light (ETR under light-limiting conditions) and light-saturating conditions (ETR capacity).
ΦPSII = c + a × e−b×PPFD
ln(ETR) = [a × PPFD/(b + PPFD)] + [c × PPFD/(d + PPFD)]
2.5. Harvest
All plants were harvested at 51 DAG and total leaf area and shoot dry weight (DW) were measured. Total leaf area was measured using a leaf area meter (LI-3100; LI-COR, Lincoln, NE, USA) after separating all individual leaves of a plant. Then, shoots of each plant were dried in a drying oven at 80 °C for 72 h before measuring DW. Total leaf area and DW at the harvest were used to calculate specific leaf area (SLA; total leaf area/DW). Canopy overlap ratio (COR; total leaf area/PCS at DAG48) was also calculated.
2.6. Data Analysis
The correlation of DW with PCS at each DAG and the calculated ETRs was evaluated using linear regression. For the regression analysis, plants were separated into two groups according to their leaf color, i.e., green and red (anthocyanin-rich) plants. The coefficient of determination (R2), p-value, and normality of each linear regression model were determined. Models with significance and good predictive power (R2 > 0.5) were plotted (SigmaPlot 11; Systat Software Inc., San Jose, CA, USA).
Canopy ETR (total ETR of a plant throughout the cropping cycle) was estimated using ETR light response models (Equation (5)) and the PCS models based on CLI (Equation (1)). To calculate canopy ETR (mol of electrons), (1) PCS (cm2) at each 20 min interval was calculated using Equation (1) based on the CLI (mol of photons m−2), (2) ETR (µmol m−2 s−1) was estimated using cultivar-specific ETR–PPFD response curves (Equation (5)) and the PPFD at 20 min intervals. The ETR–PPFD response curves were based on the combined ETR data (three replications of diurnal measurements) of the plants of each cultivar, (3) the estimated PCS (m2) and ETR (µmol m−2 s−1) were multiplied to calculate canopy level ETR (µmol s−1) and multiplied by 1200 s to integrate over the 20 min interval, (4) these values were integrated over the entire cropping cycle to estimate total canopy ETR (mol of electrons). For the calculation of canopy ETR, PPFD, cultivar, and PCS were assumed to be the only factors influencing the ETR of a plant.
Total incident light (mol of photons; integral of PCS × PPFD readings at 20 min intervals) was calculated in a similar approach to the canopy ETR. For calculation of total incident light, we assumed that the amount of light reaching the plant is only determined by PCS and PPFD. The light use efficiency (LUE, g mol−1), a measure of how efficiently plants use incident light to produce biomass, was calculated by dividing DW by total incident light.
DW, total leaf area, SLA, COR, total incident light, LUE, calculated ETR at PPFD of 200 and 1000 µmol m−2 s−1, and PCS at 13 DAG of green versus red cultivars were compared using Welch’s t-test in R software at the 95% confidence level. Differences in DW, total leaf area, SLA, COR, and LUE among 11 cultivars were separated based on Tukey’s HSD test at a 95% confidence level by using ‘agricolae’ package of R software.
3. Results
3.1. Growth Differences among Cultivars
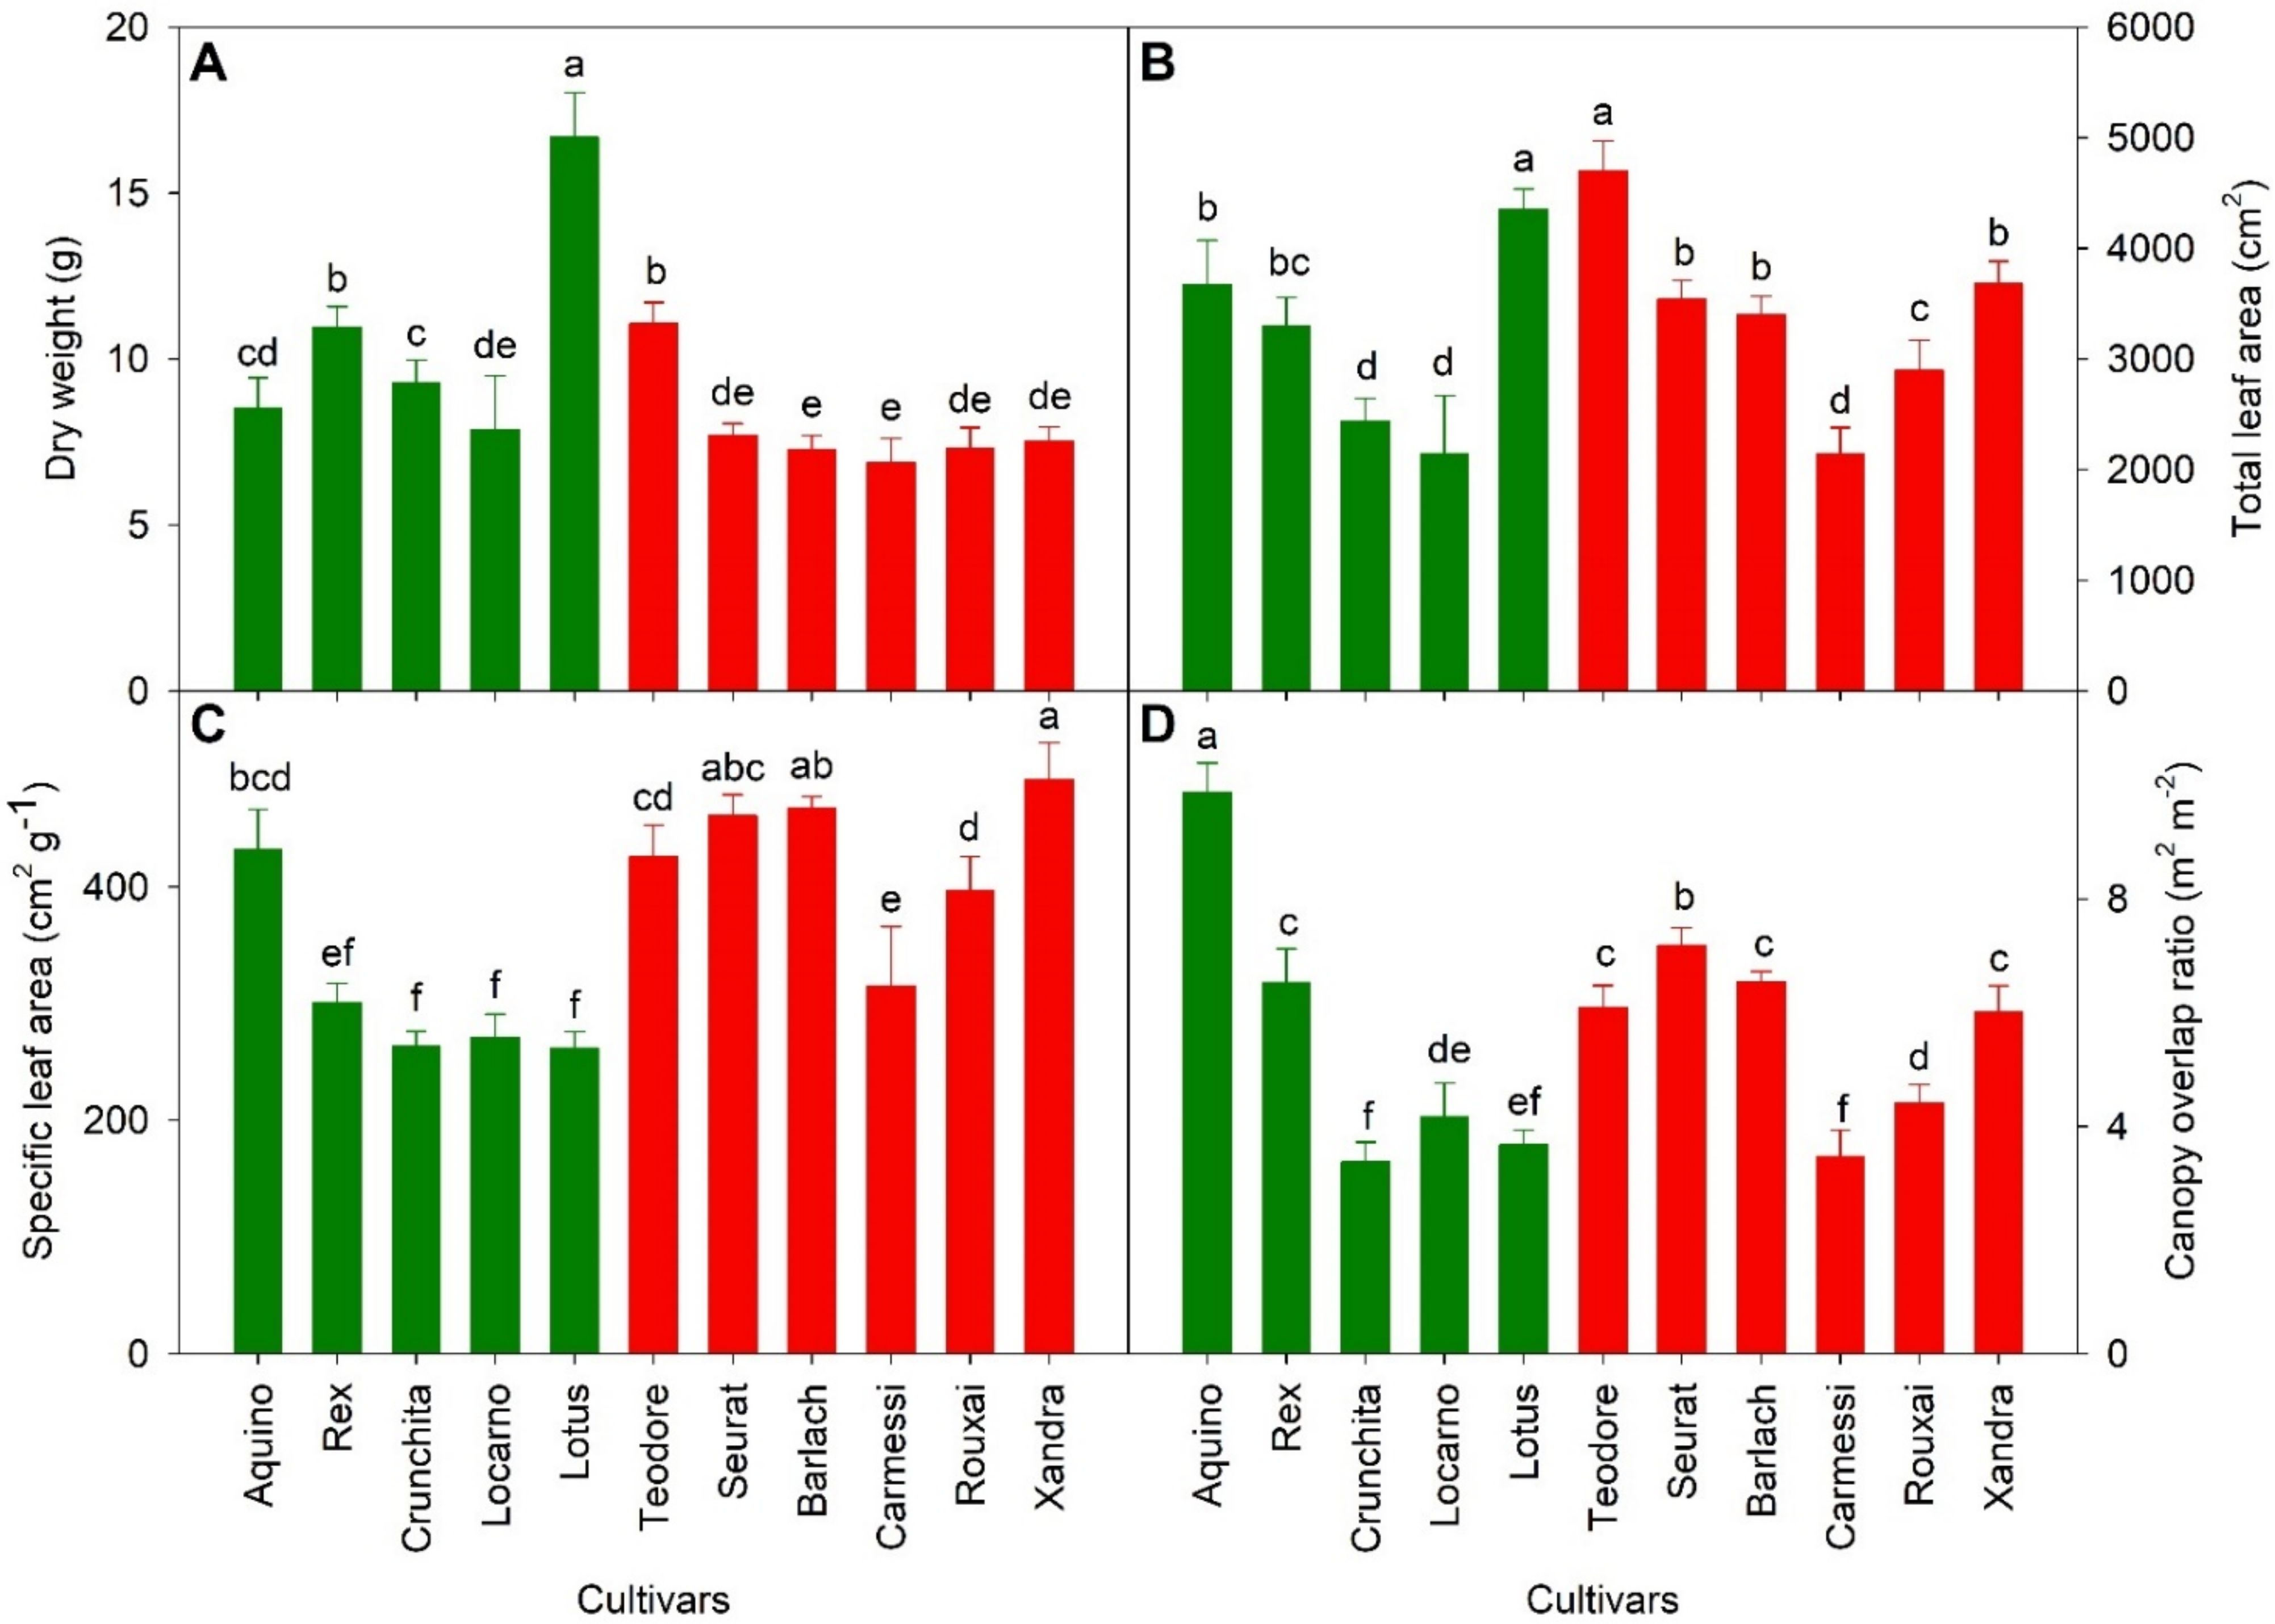
There were growth differences among the cultivars, as well as between green and red cultivars (Table 1 and Figure 2). ‘Lotus’ and ‘Teodore’ had the highest DW, 16.7 ± 1.4 and 11.0 ± 0.6 g/plant, among the green and red cultivars, respectively. (Figure 2a). The green cultivars had a wide range (8.5~16.7 g) of DW, while the red cultivars had a narrower DW range (7.3~7.7 g), except for ‘Teodore’. Total leaf area did not differ significantly between green versus red cultivars, but there were differences among cultivars (Table 1 and Figure 2b). Similar to the DW results, ‘Lotus’ and ‘Teodore’ had the largest total leaf area (4350 and 4700 cm2, respectively). Total leaf area was positively correlated to DW within both green and red cultivars (Figure S2a). However, this correlation differed among the two groups of cultivars; green lettuce had a greater DW than red cultivars at the same total leaf area. The SLA and COR represent morphological differences among the lettuce cultivars (Figure 2c,d). ‘Crunchita’ and ‘Lotus’ had a low SLA because these romaine-type lettuces generally had a thicker leaf. ‘Aquino’, ‘Rex’, ‘Teodore’, and ‘Seurat’, butterhead-type lettuces, not only had high SLA but also high COR. The high COR resulted from head formation later in the growing cycle, increasing the overlap among the leaves of a plant. The SLA of the red cultivars was higher than that of green cultivars (Table 1 and Figure 2c). Red cultivar SLA ranged from 315 to 492 cm2 g−1, while that of green cultivars, except ‘Aquino’, ranged from 262 to 301 cm2 g−1. The high SLA of ‘Aquino’ (431.8 cm g−1) was associated with a high COR (9.9 m2 m−2). SLA and COR in both green (R2 = 0.88, p < 0.0001) and red cultivars were positively correlated (R2 = 0.68, p < 0.0001), but this correlation differed among the two groups of cultivars. At the same COR, red cultivars had a higher SLA than green cultivars (Figure S2b).
3.2. Biomass and Projected Canopy Size Were Correlated
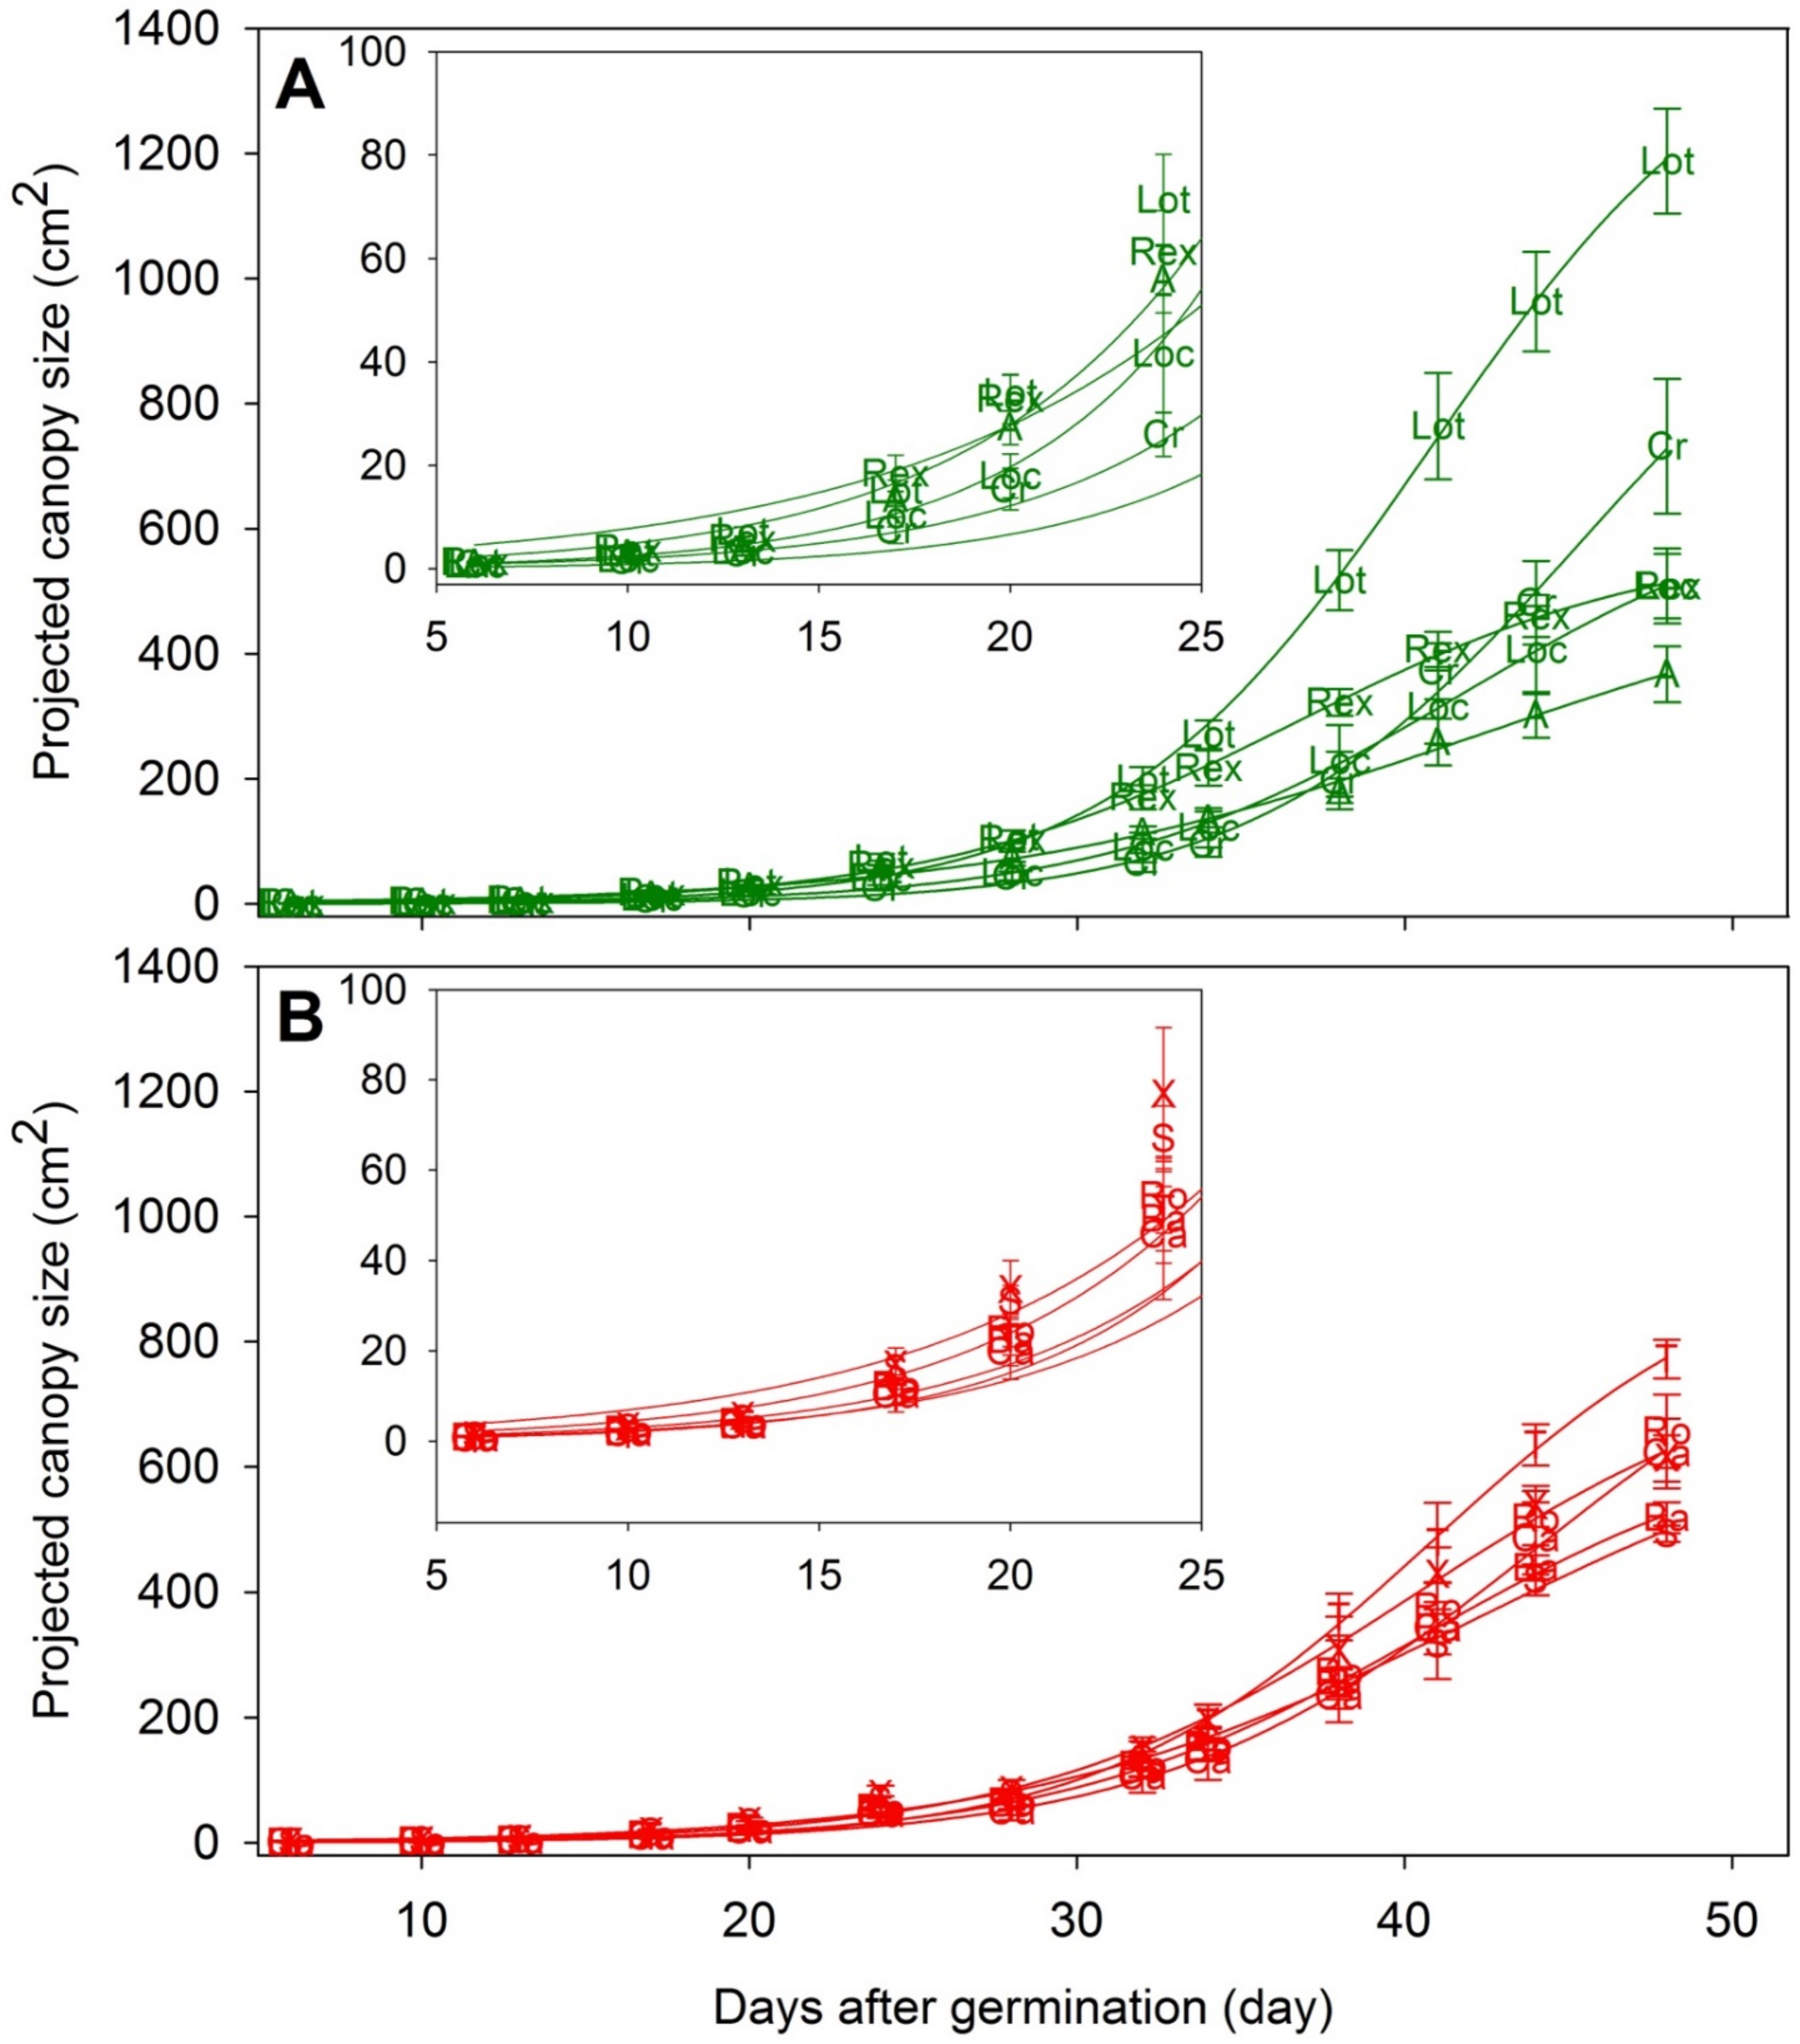
The PCS of the lettuce plants represent canopy size changes throughout the cropping cycle (Figure S3) and was used to characterize variability in canopy size among different cultivars. The PCS of each cultivar throughout the cropping cycle was fitted using a sigmoidal curve using DAG or CLI as the independent variable (Figure 3, R2 > 0.99). Among the green cultivars, ‘Lotus’ had the largest PCS from 28 DAG until the end of the study. ‘Rex’ had a relatively large PCS until 38 DAG, but its increases in PCS slowed down following head formation, resulting in an intermediate PCS on the final measurement day. ‘Aquino’ had the lowest PCS on the final measurement day, likely due to its high COR (Figure 2d); the formation of additional leaves contributed relatively little to PCS of ‘Aquino’. Among the red cultivars, there was no difference in PCS until 41 DAG, after which ‘Teodore’ had the largest PCS.
The PCS at each DAG was positively correlated to DW of the green cultivars (Table 2 and Figure S3). However, the red cultivars had a negative correlation between PCS at 6 and 10 DAG and biomass, no significant correlation from 13 to 28 DAG, and a positive correlation after that (Table 2 and Figure S5). Furthermore, the correlation between PCS and DW was stronger in green than in red cultivars throughout the growing cycle. In green cultivars, there was an especially strong correlation between PCS and DW (R2 = 0.74) at 13 DAG, stronger than that from 17~32 DAG. The R2 was low at 17 DAG, but then gradually increased until 41 DAG, a period of rapid canopy expansion. The strongest correlation between PCS and DW of the red cultivars, at 38 DAG, had an R2 of only 0.53. This correlation was at least partly due to the higher PCS and DW of ‘Teodore’, compared to the other red cultivars.
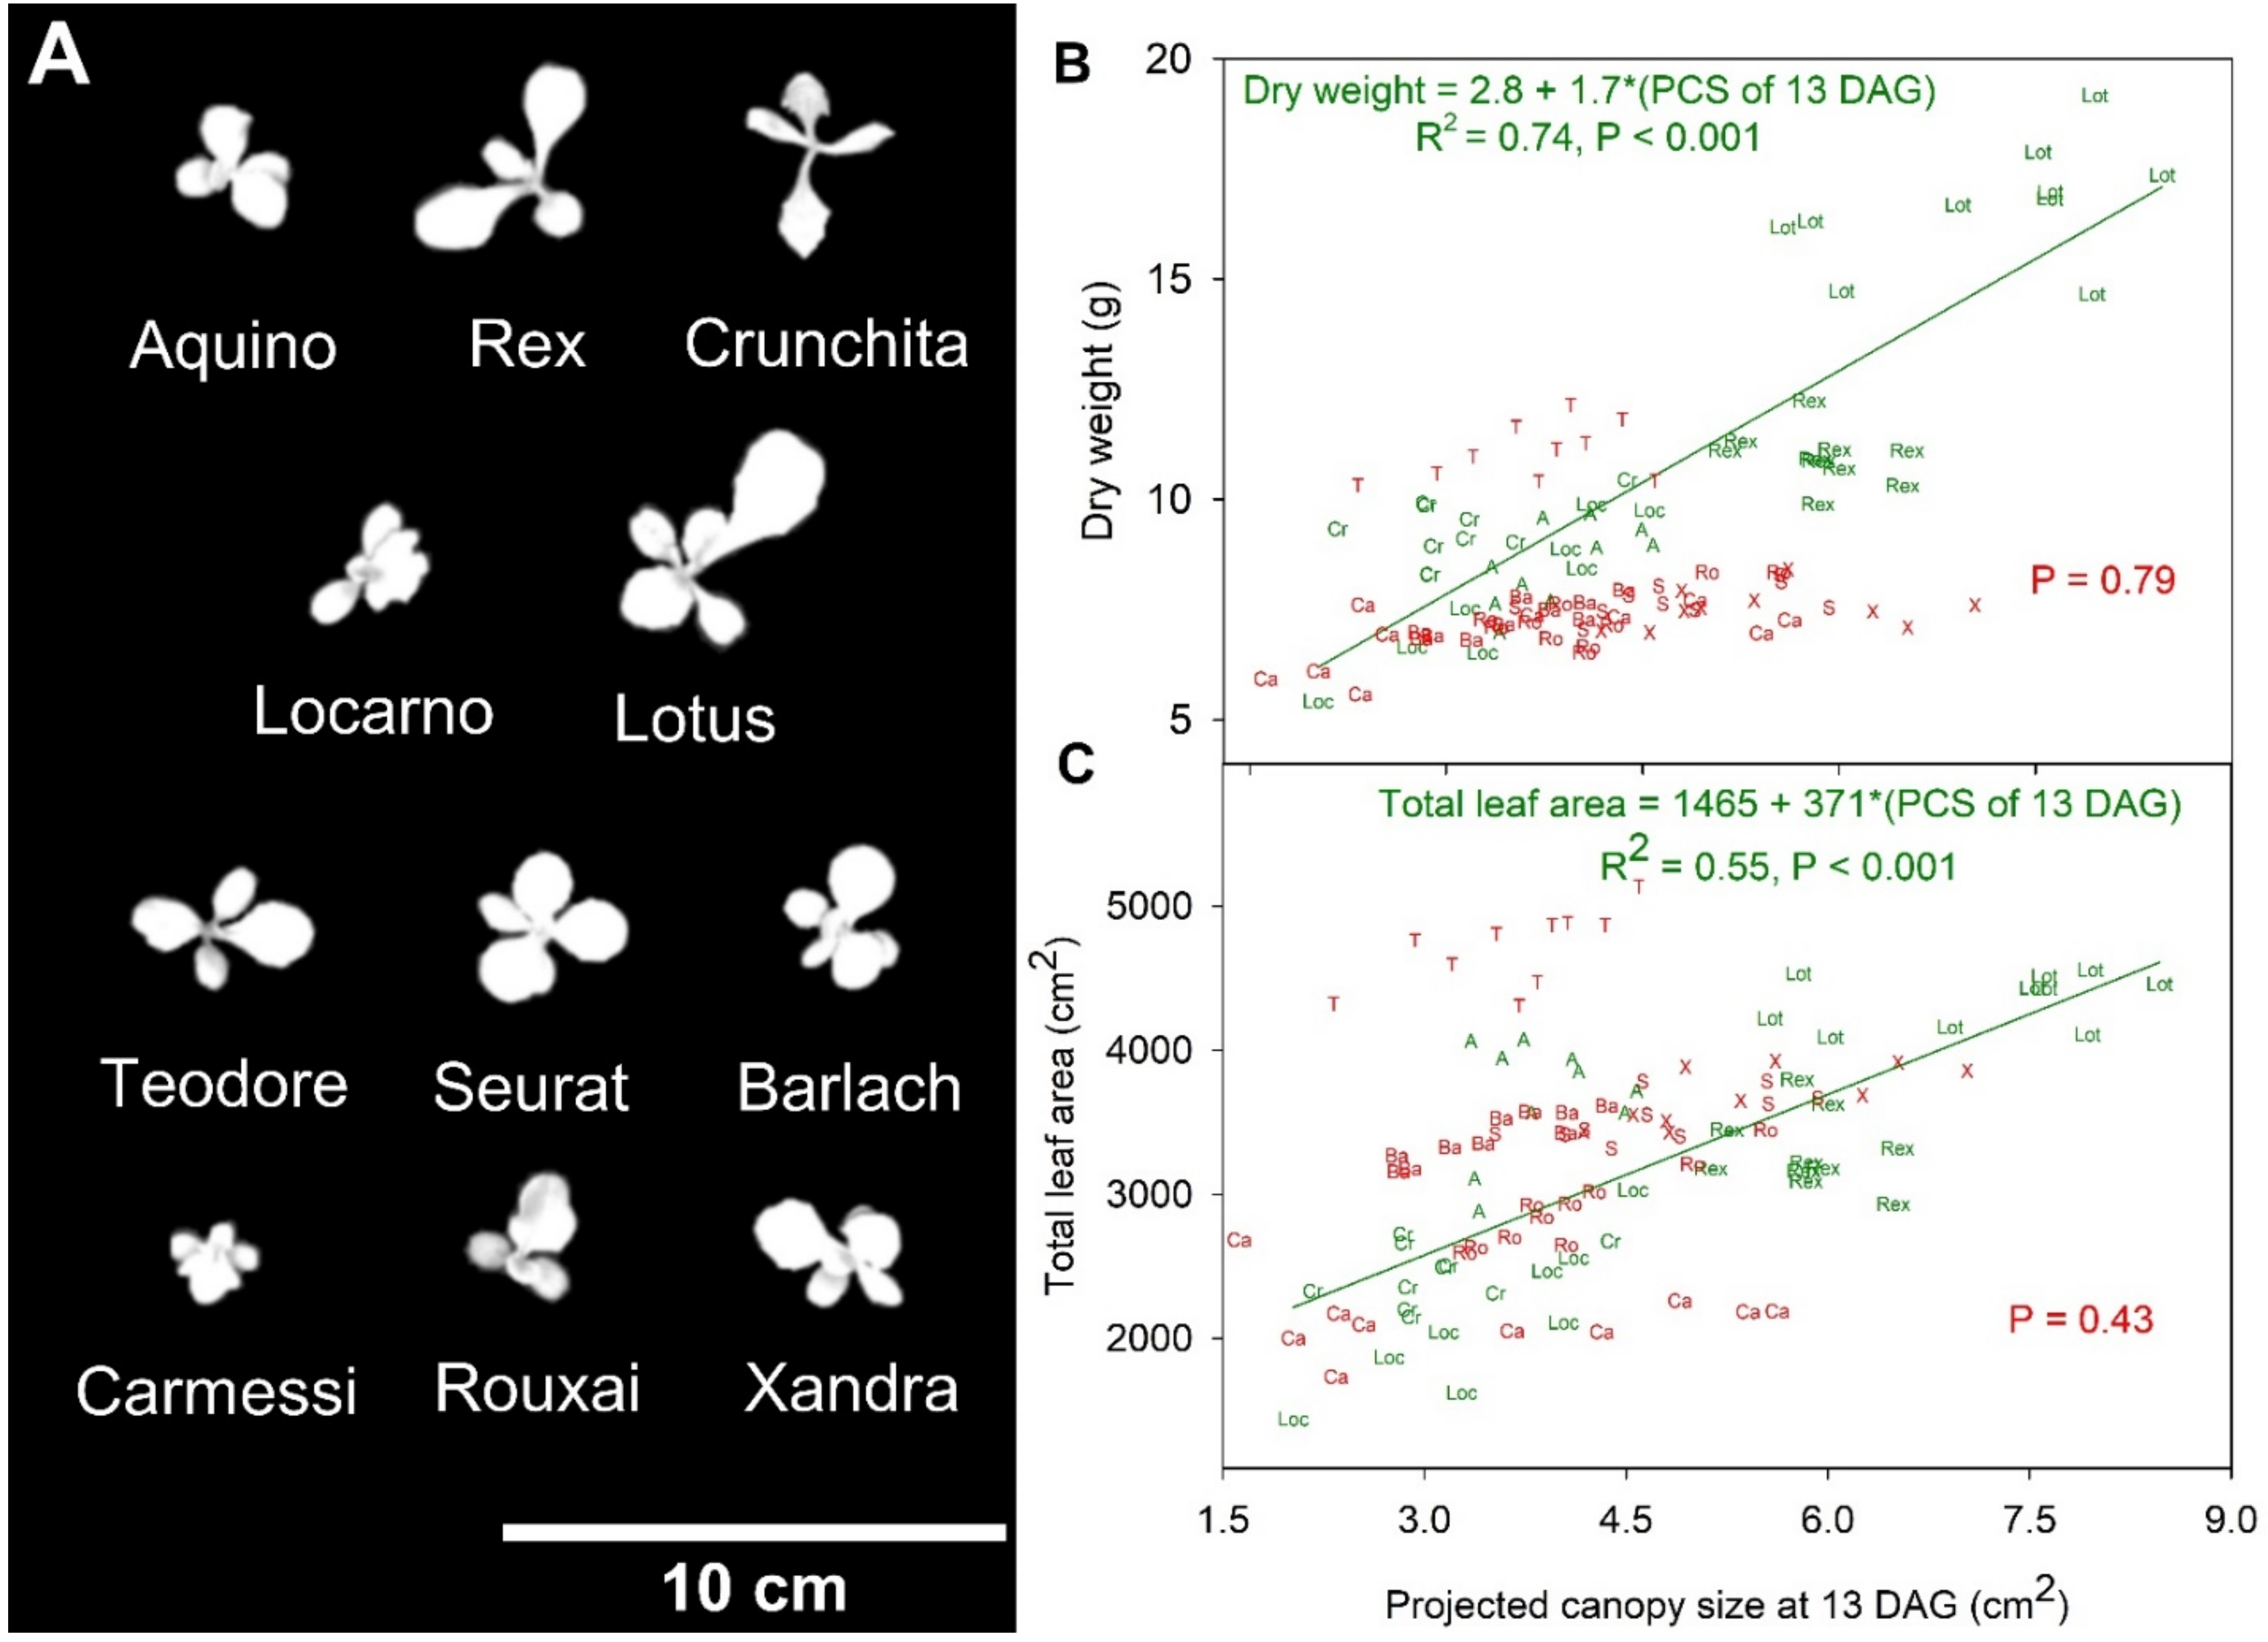
The PCS of the 11 lettuce cultivars at 13 DAG ranged from 1.6 to 8.5 cm2 (Figure 4a) and was positively correlated with both DW and larger total final leaf area within the green but not the red cultivars (Figure 4b,c). The PCS at 13 DAG explained 74 and 55% of the variability in DW and final total leaf area among the green cultivars, respectively (Figure 4b,c).
3.3. ΦPSII and ETR Light Response Curves and Their Relationship to Biomass
The light responses curves of ΦPSII showed decreasing ΦPSII with increasing PPFD (Figure S6a,c) and were fitted using Equation (4). The ΦPSII light response curves of all cultivars resulted in an R2 > 0.4 and p < 0.001. The lowest ΦPSII, at high PPFD, of red and green cultivars ranged from 0.28 to 0.38 and 0.18 to 0.25, respectively.
ETR light response curves followed an asymptotic rise to a maximum (Figure S6b,d, p < 0.001, R2 > 0.97). Red cultivars had higher calculated ETRs than green cultivars at PPFDs of 200 and 1000 µmol m−2 s−1 (Table 1 and Table S2). The calculated ETRs of red cultivars at PPFDs of 200 and 1000 µmol m−2 s−1 ranged from 51.0 to 56.5 and from 134.4 to 315.4 µmol m−2 s−1, respectively (Table S2, Figure S7). In the green cultivars, the calculated ETRs ranged from 45.4 to 53.0 and from 97.5 to 121.3 μmol m−2 s−1, at PPFDs of 200 and 1000 μmol m−2 s−1, respectively (Table S2). There was no significant relationship between the calculated ETR at a PPFD of 200 or 1000 µmol m−2 s−1 and the DW among either the red or green cultivars (Figure S7). For example, ‘Lotus’ had a DW of 16.7 g and an ETR of 98.4 µmol m−2 s−1, while the much smaller ‘Barlach’, with a DW of 7.3 g, had an estimated ETR of 315.4 µmol m−2 s−1 at a PPFD of 1000 µmol m−2 s−1. Therefore, differences in DW could not be explained based on differences in ETR.
3.4. Correlation between Biomass and Canopy ETR or Total Incident Light
Calculated canopy ETR of the green cultivars ranged from 1.38 (‘Locarno’) to 4.26 mol (‘Lotus’). The canopy ETR of the red cultivars ranged from 2.26 (‘Seurat’) to 4.10 mol (‘Barlach’). Consistent with the higher calculated ETRs at PPFDs of 200 and 1000 µmol m−2 s−1 of red cultivars, the canopy ETR of the red cultivars was higher than that of green cultivars (Table 1).
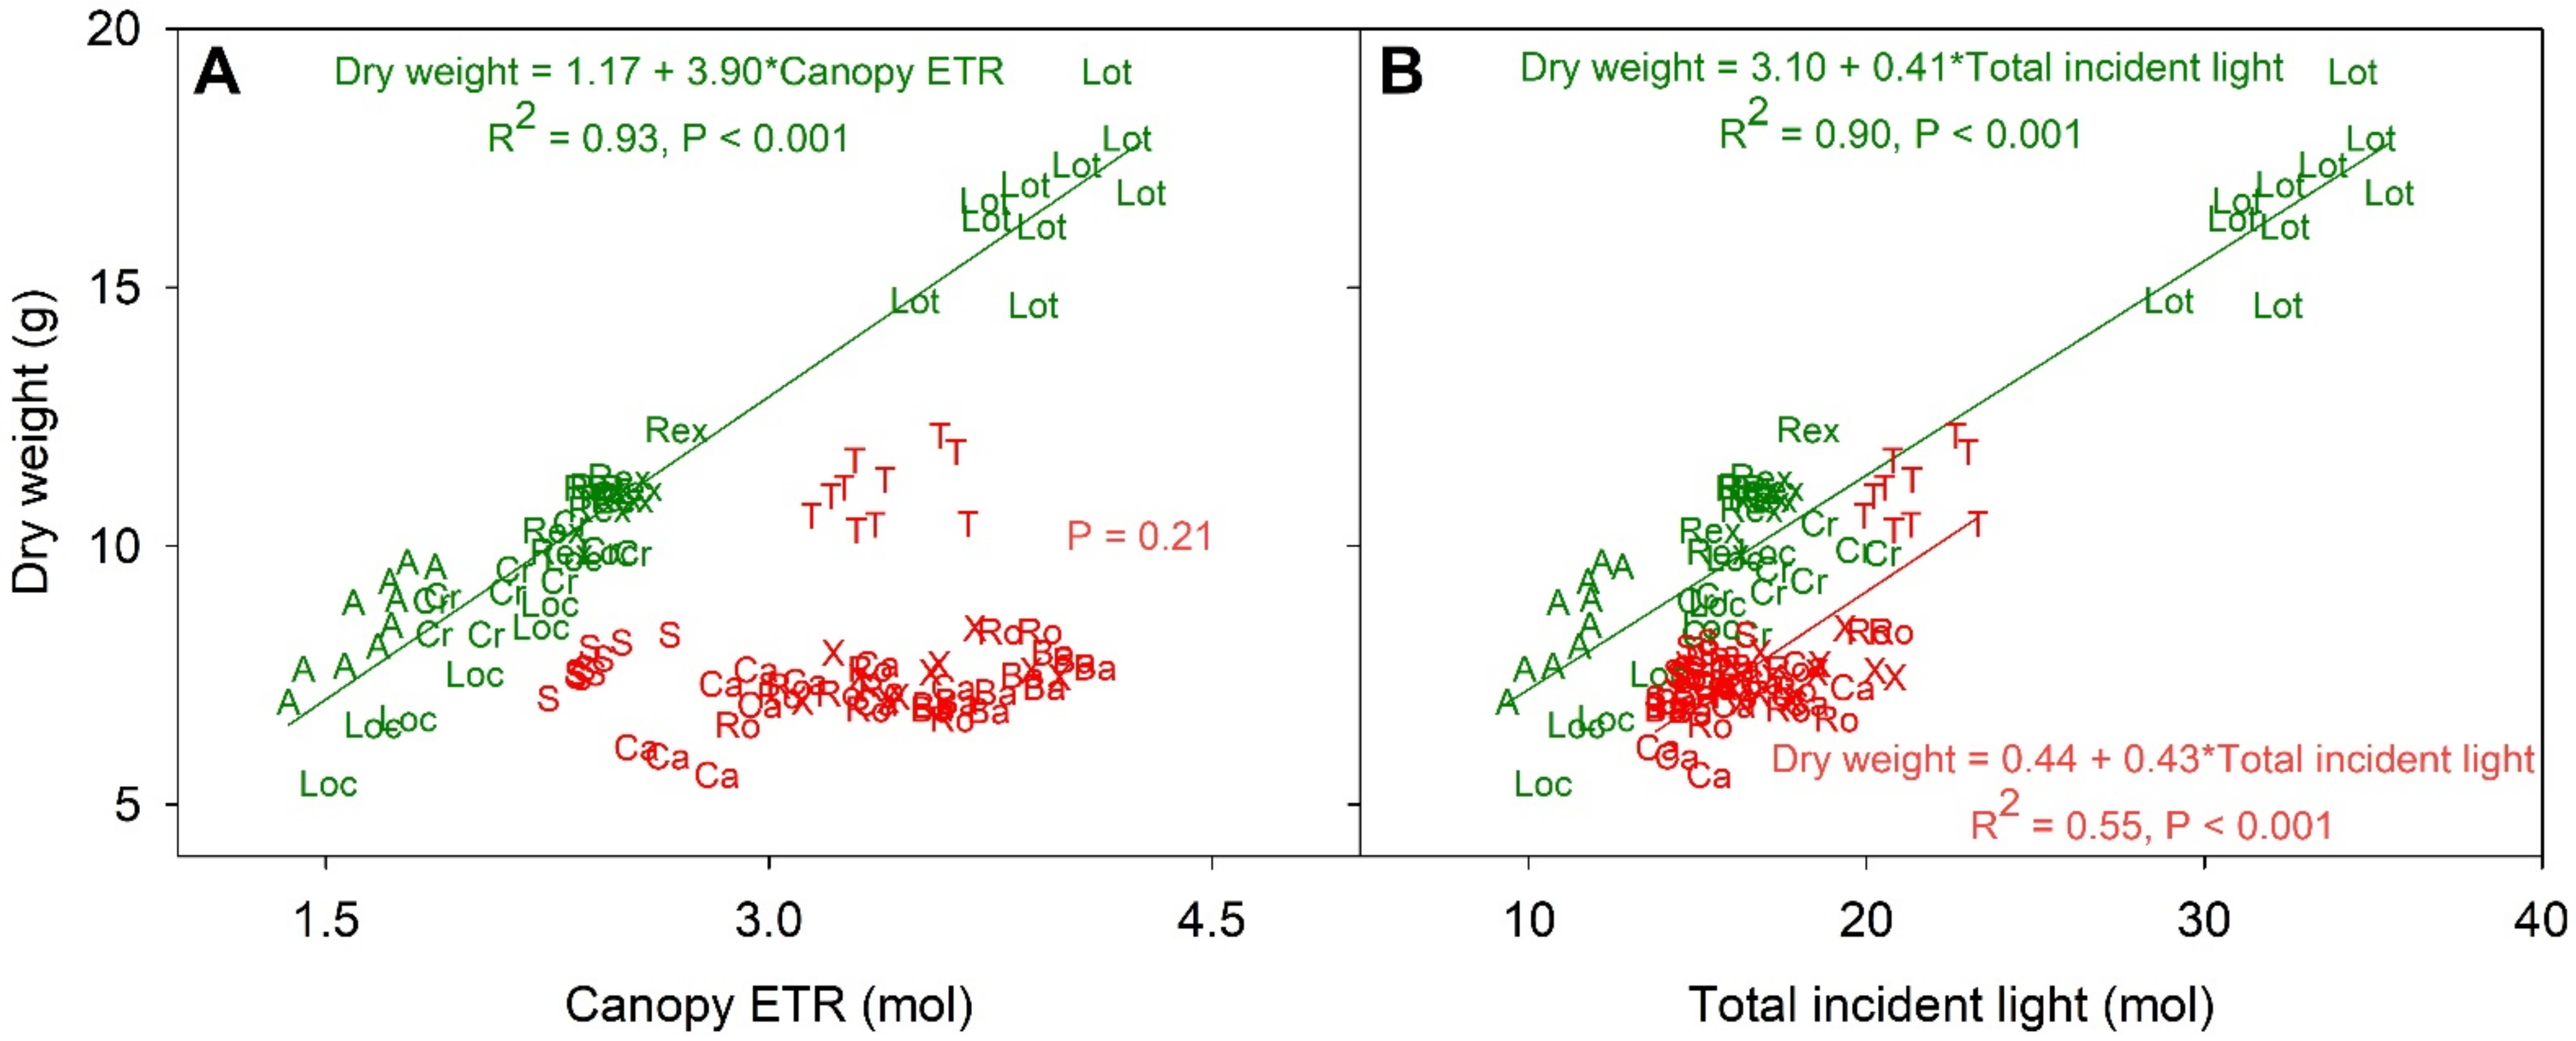
Canopy ETR was strongly and positively correlated with DW in the green cultivars (R2 = 0.93, Figure 5a), while there was no such correlation within the red cultivars. The significant correlation within green cultivars occurred despite a lack of a significant relationship between the calculated ETRs at PPFDs of 200 and 1000 µmol m−2 s−1 and DW (Figure S7). Canopy ETR of red cultivars was not significantly correlated with DW (p = 0.21). For example, ‘Teodore’ had a DW of 11.1 g, the highest DW among the reds, and a canopy ETR of 3.4 mol, while ‘Barlach’ had a lower DW (7.3 g) but a higher canopy ETR (3.8 mol).
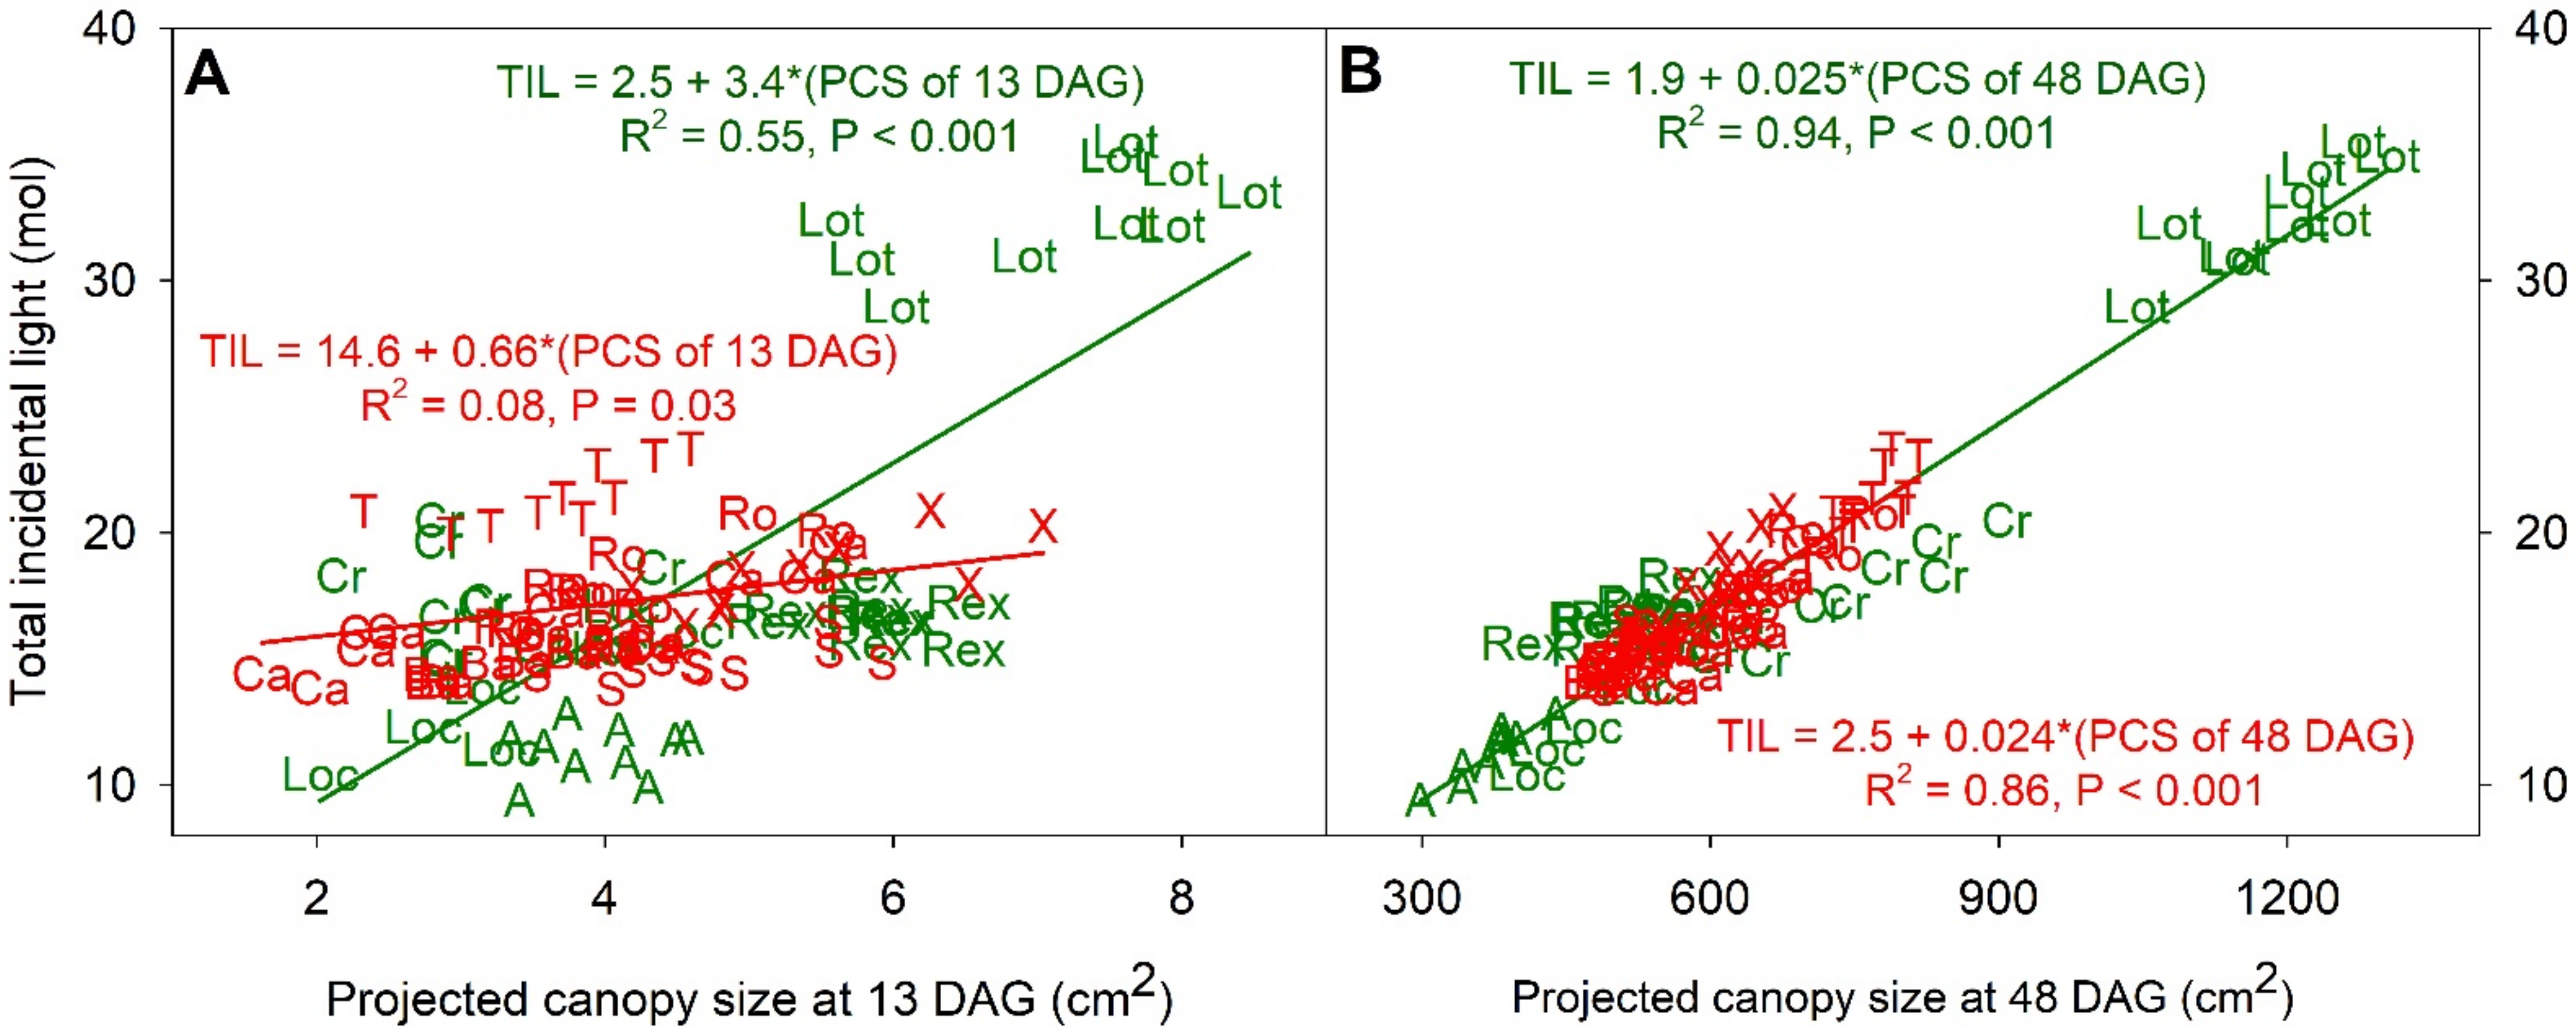
Within both green and red cultivars there was a significant correlation between total incident light and DW, but this correlation was much stronger for green than for red cultivars (Figure 5b). The total incident light of the green cultivars ranged from 11.3 (‘Aquino’) to 32.6 mol (‘Lotus’), and these two cultivars had DWs of 8.5 and 16.7 g, respectively. The variability in total incident light among cultivars was correlated with PCS at both 13 and 48 DAG (Figure 6a,b). Correlation analysis between the total incident light and PCS at 13 and 48 DAG resulted in R2 of 0.55 and 0.94, respectively, in the green lettuces. The PCS at 48 DAG of red cultivars was strongly correlated with total incidental light (R2 = 0.86), but this was not the case at 13 DAG (R2 = 0.08).
There also was a strong positive correlation between total incident light and DW within the green cultivars (R2 = 0.90) and a weaker correlation within the red cultivars (R2 = 0.55) (Figure 5b). The red cultivar ‘Teodore’ had both higher total incident light (21.4 mol) and DW (11.1 g) than the other red cultivars (Figure 2a and Figure 3b). The significant correlation between total incident light and DW within the red cultivars may be due solely to the larger size of ’Teodore’. The slopes of regression equations for the green and red cultivars were similar (0.41 and 0.43 g mol−1, respectively; Figure 5b). However, there are differences in the intercept between the green (3.10 g) and red (0.44 g) cultivars. In other words, with the same amount of total incident light, green cultivars had a DW that was ~2.7 g higher than that of red lettuces.
3.5. Light Use Efficiency
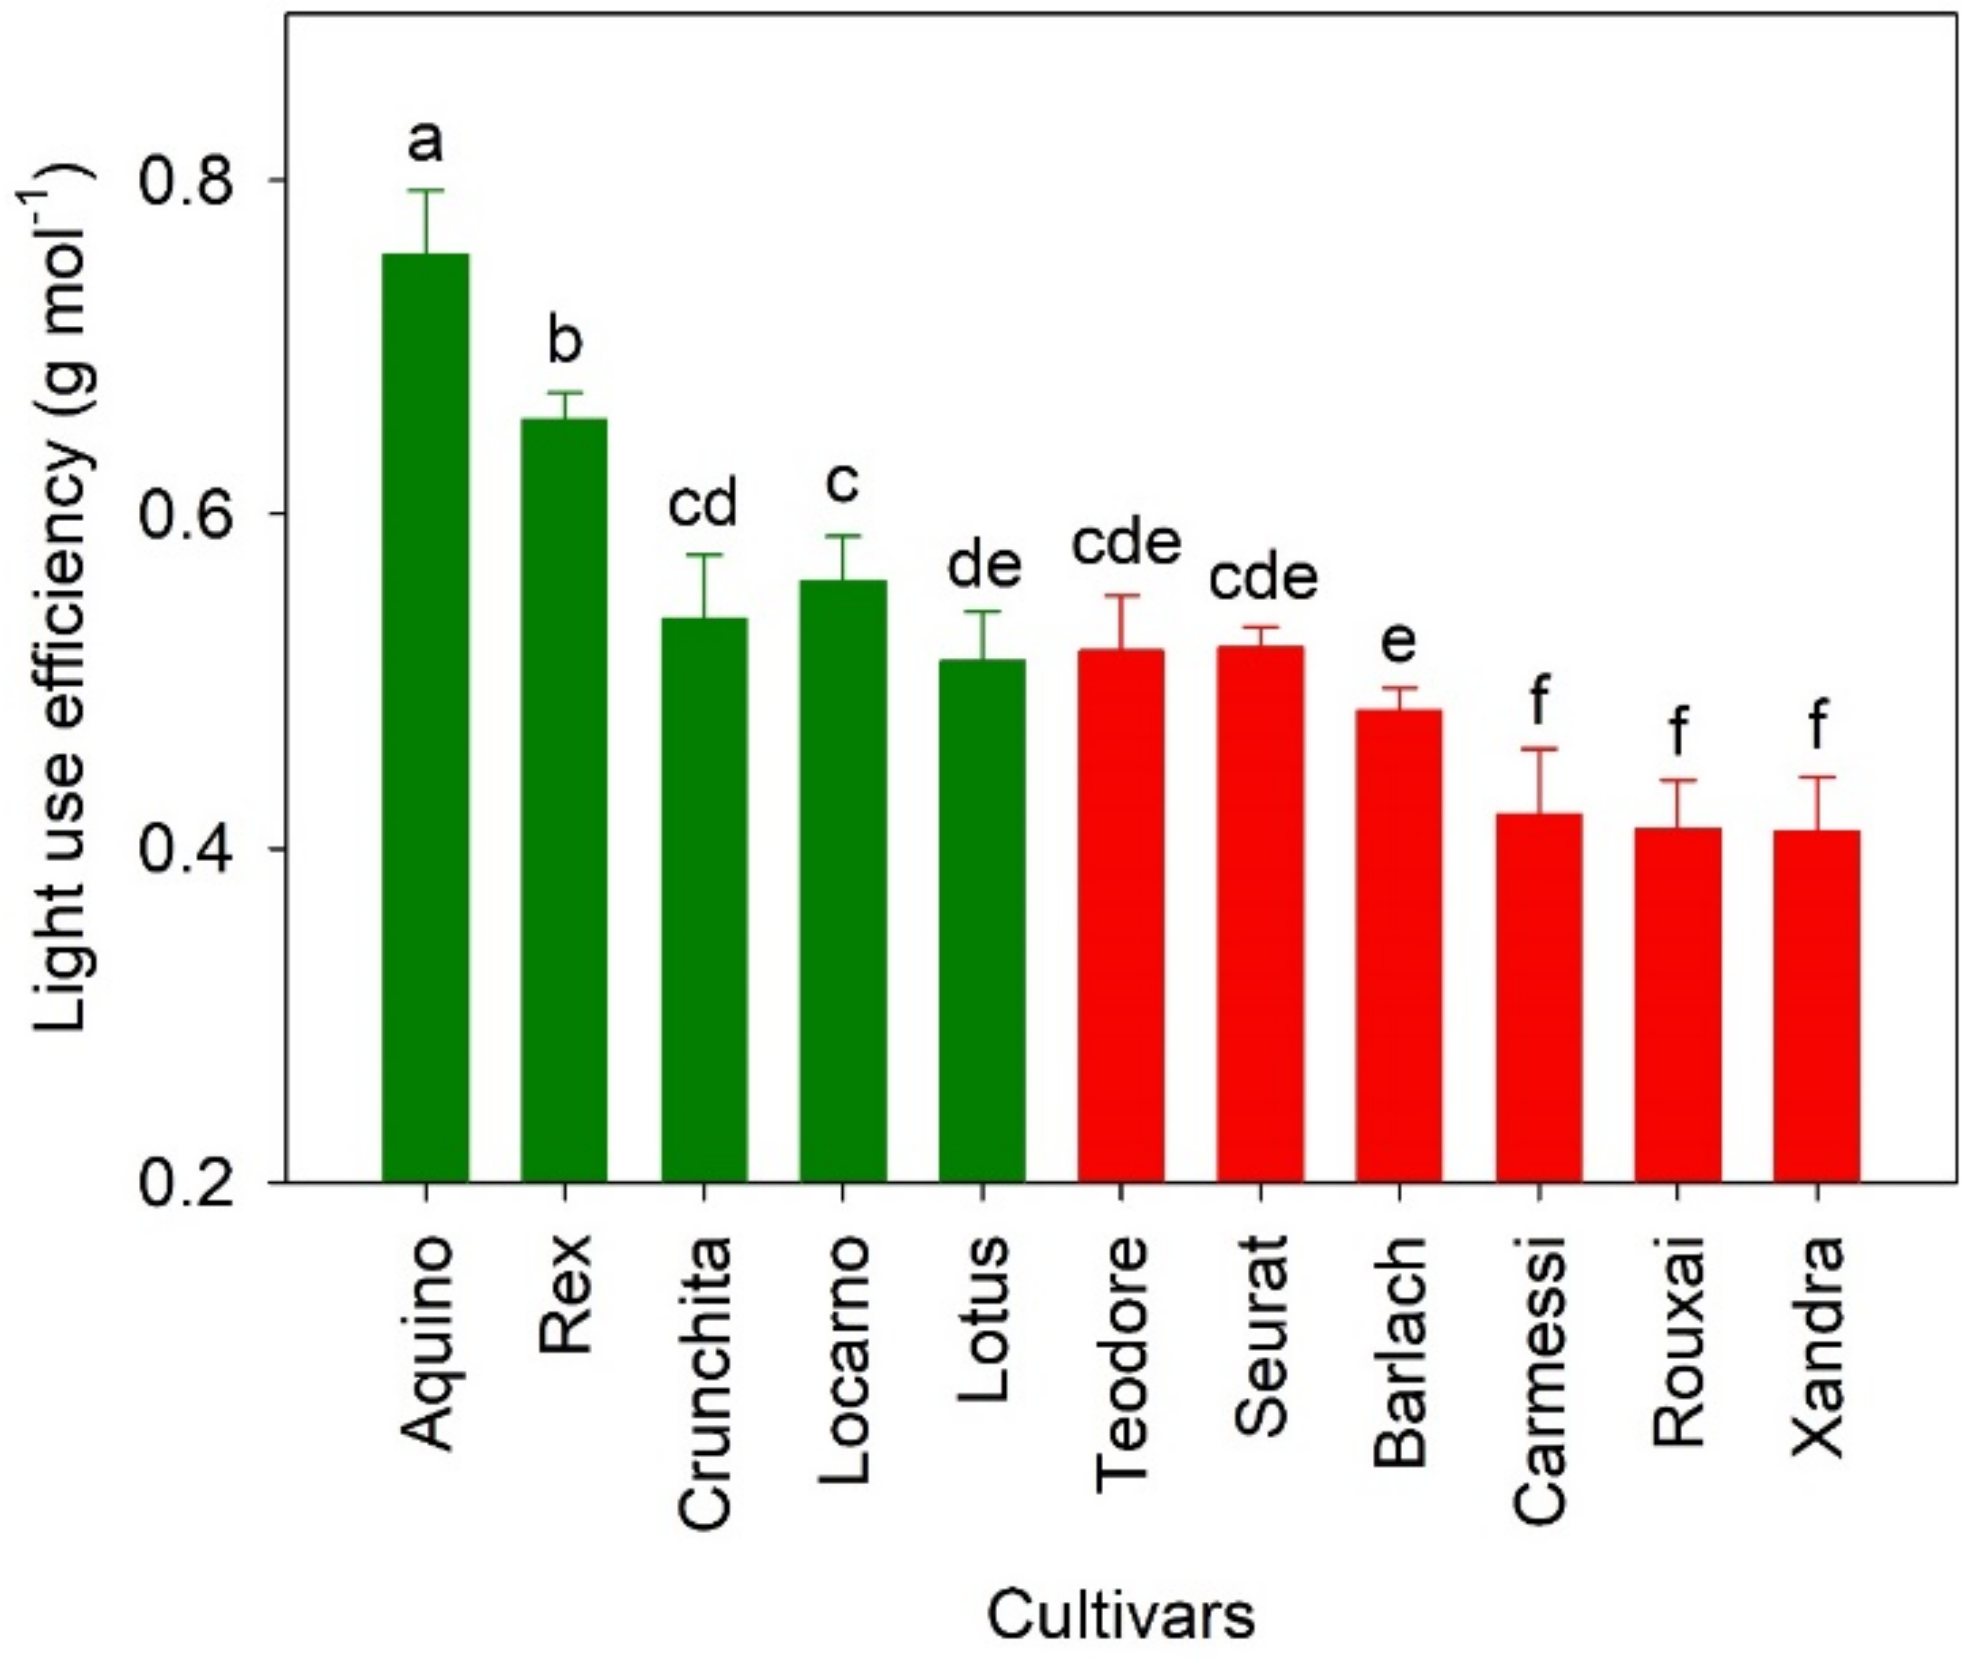
Light use efficiency of the green cultivars was higher than that of the red cultivars (Table 1 and Figure 7). The range of LUE of the green and red cultivars was 0.46~0.82 and 0.35~0.56 g mol−1, respectively. ‘Aquino’ had the highest LUE (0.76 g mol−1) but a relatively low DW and total incident light compared to the other green cultivars (Figure 2c). ‘Lotus’, with the highest DW and total incident light, had the lowest LUE among the green cultivars. This indicates that not all incident light is used for biomass accumulation, and green lettuce plants with a smaller PCS at 48 DAG (Figure 3a) tended to have a higher LUE (R2 = 0.54, and p < 0.001). On the other hand, within the red cultivars, the cultivar with highest LUE (‘Teodore’) also had the greatest total incidental light and DW.
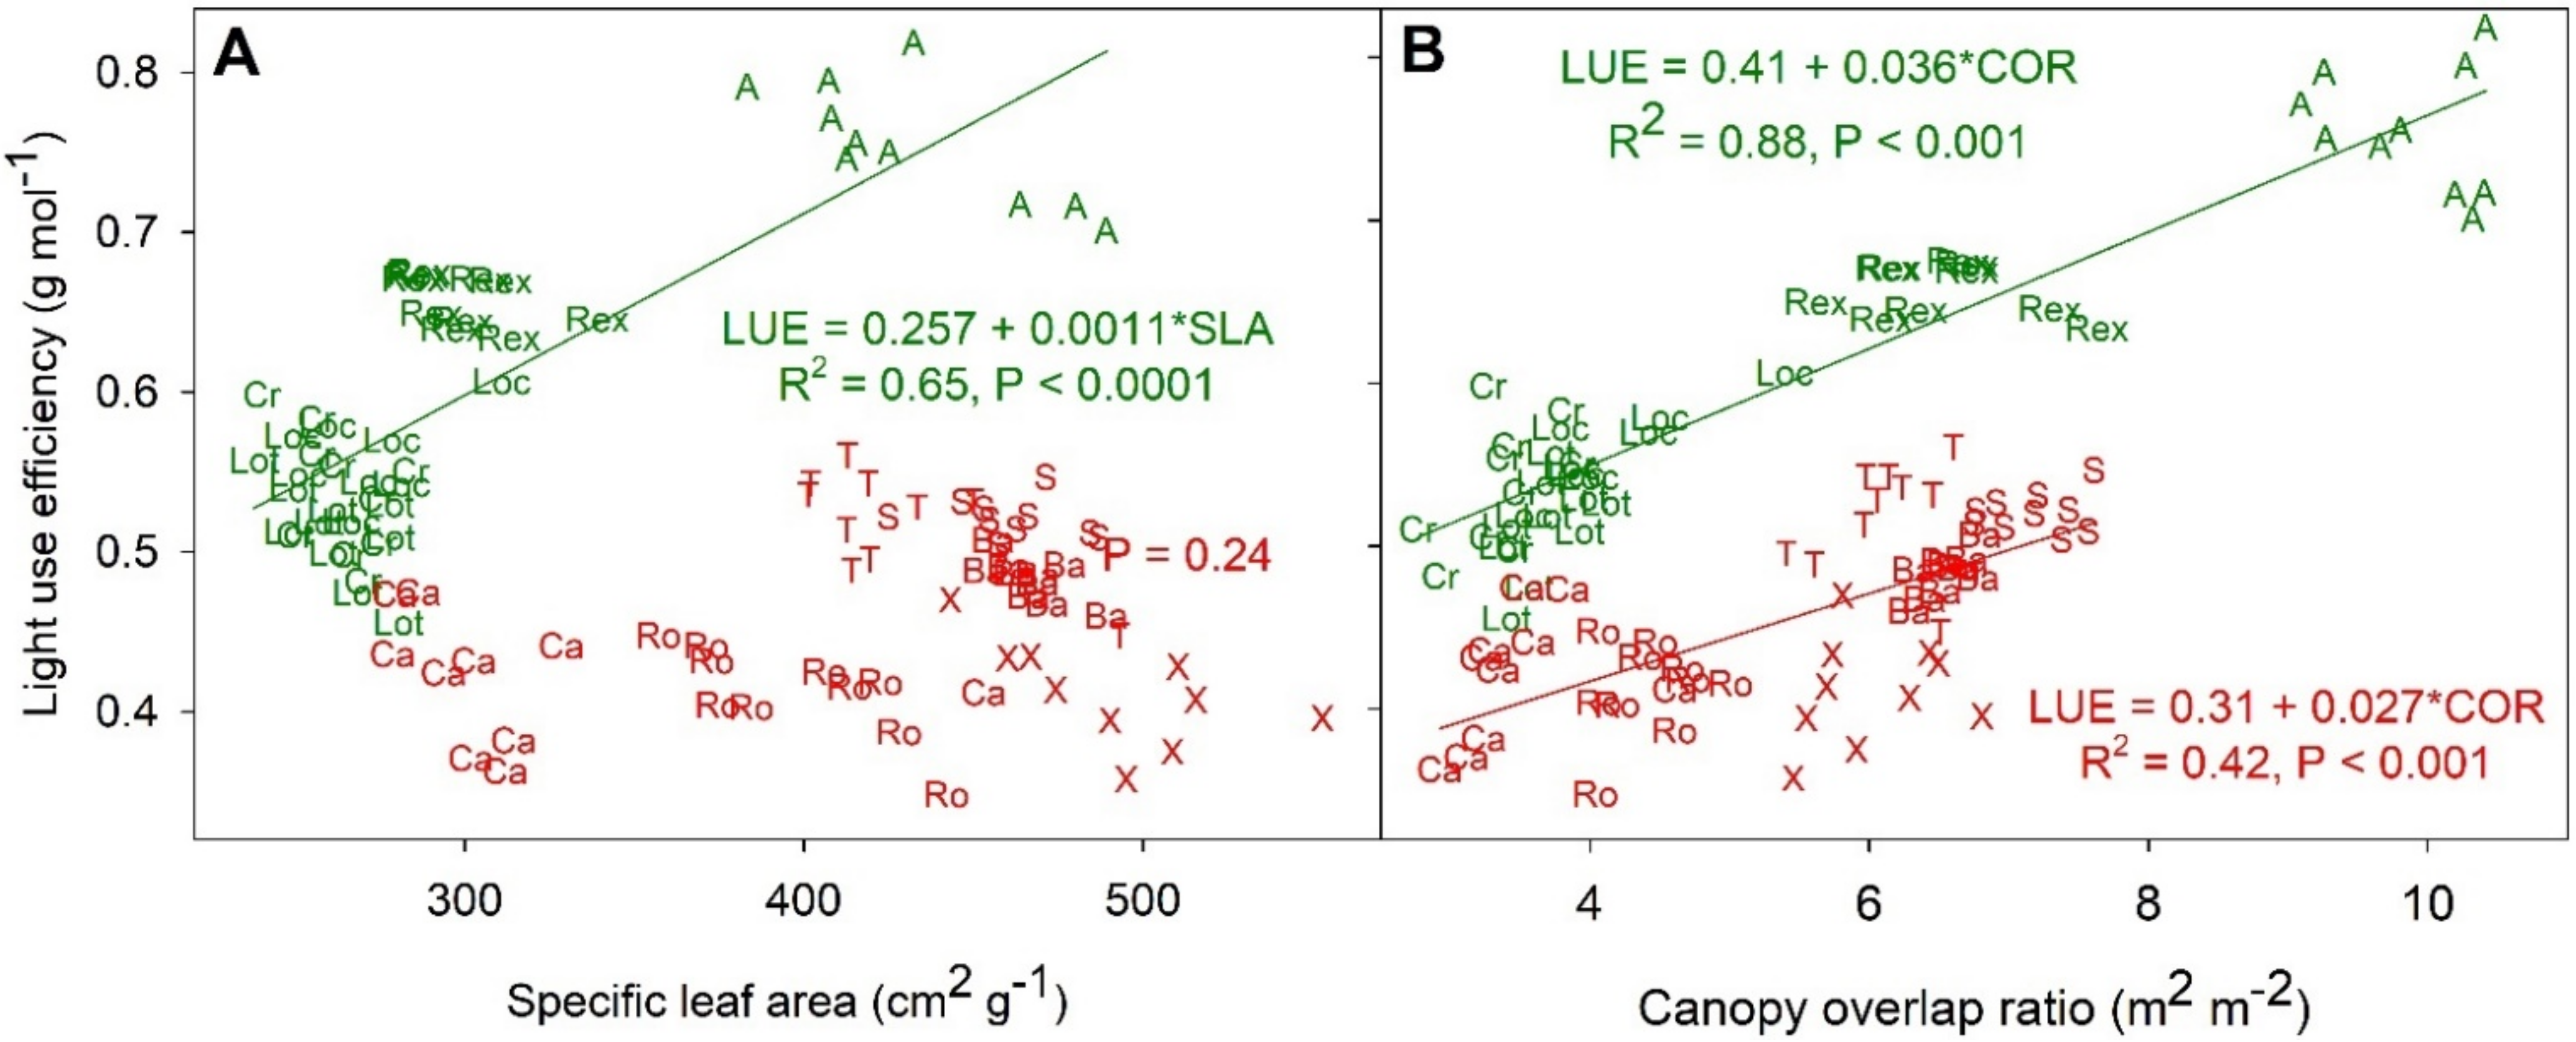
LUE was positively correlated with SLA and COR among the green cultivars (Figure 8). This correlation seemed to be at least partly caused by morphological differences among the lettuce types. The two butterhead lettuce cultivars (‘Aquino’ and ‘Rex’) had a higher LUE, COR, and SLA than the romaine cultivars (‘Crunchita’ and Lotus’). Within the red cultivars there also was a positive correlation between LUE and COR, but this correlation was not as strong as for the green leaf cultivars (R2 = 0.42 vs. 0.88, respectively). However, among the red cultivars, there was no relationship between SLA and LUE. Despite a large variability in SLA, all red cultivars had a similar LUE (0.46 g mol−1).
4. Discussion
4.1. Quantifying Canopy Size Using CFI
Chlorophyll fluorescence imaging (CFI) effectively separated the foliage from the background in the images, regardless of canopy pigmentation, something that can be difficult in canopy imaging. The simplicity of our CFI approach system is that it is based on chlorophyll fluorescence in the 670 to 740 nm waveband upon excitation with a shorter wavelength, blue LED light. Background separation was performed using simple thresholding. A similar, robotized CFI-based system was used to monitor stem elongation of greenhouse-grown tomato [28]. Figure S3 shows the CFI of ‘Rex’ throughout the cropping cycle, showing not only canopy size but also morphological changes over time. A major advantage of chlorophyll fluorescence imaging over traditional RGB imaging is that it is not affected by the presence of pigments other than chlorophyll. This is important with lettuce since many cultivars have high anthocyanin levels (Figure S1), which can make the separation of canopy from the background in RGB images difficult.
Taking 2D images from above the crop has advantages over more complicated 3D imaging systems, such as Light Detection And Ranging (LiDAR) [31,32,33]. Although some information is inevitably lost when imaging a 3D object in 2D, the cost and required computing power are greatly reduced. The projected canopy size (PCS), quantified using top-view images, was positively correlated with the measured light interception in soybean (Glycine max L.), lettuce (Lactuca sativa), and cotton (Gossypium hirsutum) [11,34,35] and with the total leaf area of tomato [20]. In addition, a positive correlation between PCS and biomass accumulation was observed in our study. PCS combined with PPFD measurements can be used to estimate incident light [35,36], which has a positive correlation with carbon gain and, therefore, biomass accumulation [35]. Jung, et al. [37] found that the pixel number in top-view images of green lettuce was positively correlated with fresh weight. Hence, even though 2D imaging is simple, the results are robust enough to be an alternative for light interception and other growth-related parameters.
4.2. PCS Screening for Fast Growth
Among green cultivars, PCS at 13 DAG was strongly and positively correlated with DW at harvest (Table 2, Figure 4b). Larger canopy size is associated with increased incident light and more biomass production [12,38,39]. This suggests that early PCS may be a quantitative trait associated with growth. Higher biomass and/or shorter production cycles have been important breeding targets [6], and a high leaf area index or large canopy size is a good trait for selecting for high biomass production [40]. Phenotyping a large number of accessions is an important challenge in breeding [16]. Breeders may have to grow plants until the end of a cropping cycle or measure phenotypic parameters, such as leaf area, destructively, which can be time-consuming and expensive. In addition, leaf area measurements for a large number of accessions are not only time-consuming but also not a direct estimate of incident light, due to leaf overlap within the canopy [38,41]. On the other hand, monitoring early PCS based on CFI easily quantified projected canopy size, which is an alternative for incidental light and, therefore, biomass production. This method allows for high-throughput, non-invasive screening.
Timing for early PCS screening should be carefully selected since the correlation between early PCS and final biomass changes over time. The R2 at 13 DAG in green cultivars was 0.74, while it was lower both before and for 19 days after 13 DAG (Table 2). This suggest that there is an optimal timing for the use of PCS screening, which may be related to the start of significant leaf overlap within plants (Figure S4). The PCS at 6 and 10 DAG were not strongly correlated with DW, likely because plants at 6 DAG only had cotyledons, while at 10 DAG the first leaves had appeared but were still very small (Figures S4 and S5). Canopy overlap was very low at 13 DAG (Figure 4a) but rapidly increased after this time. The dramatic decrease in R2 to 0.20 at 17 DAG may be due to the leaf overlap within the canopy. The R2 of the correlation between PCS and final DW increased from 0.20 at 17 DAG to 0.91 at 41 DAG and then slightly decreased to 0.76 at 48 DAG. The stronger correlation of final DW with PCS later during the cropping cycle was expected since both are measurements of plant size. When PCS is measured closer to the end of the growing cycle, the correlation between PCS and final DW would be expected to strengthen. The decrease in R2 from 41 to 48 DAG was likely related to morphological differences among the cultivars, which became more pronounced at the end of the growing cycle. Head formation in lettuce results in an increase in DW, with little or no increase in PCS. In summary, optimizing screening protocols using early PCS monitoring requires consideration of the morphological features of the target plants. Our data suggest that PCS measurements before meaningful overlap among the leaves occurs may be the optimal time for lettuce, but this needs to be confirmed for other species.
The PCS data were used to model canopy size throughout the growing cycle (Figure 3) and those models were used to calculate the total incident light throughout the entire cropping cycle (Figure 5b). Positive correlations between total incident light and biomass have been reported in various species [12,38,39]. In our study, the total incident light was positively correlated with DW (R2 = 0.90) in the green cultivars, regardless of differences in lettuce type (Figure 5b). This is not surprising since light provides the energy required for growth. A similar relationship was found in a study quantifying the effects of supplemental far-red light on incident light and biomass [35]. Red cultivars showed a similar but weaker correlation (R2 = 0.55) (Figure 5b). The weaker correlation likely was at least partly due to differences in anthocyanin content among the cultivars, which, in turn, can affect photosynthesis, light use efficiency, and growth (see Section 4.4).
4.3. Light Use Efficiency
Our PCS-based phenotyping was used to quantify LUE, an important physiological parameter affecting biomass accumulation [41,42]. LUE is variable depending on the environmental conditions, growth phase, and genetic background of the crop [35,43]. In a study of LUE-based modeling of the dry matter accumulation of cauliflower (Brassica oleracea L. botrytis), using a constant LUE resulted in relatively poor crop growth predictions [44]. Performance of the model was improved by making LUE a function of the DLI [44]. In addition to being affected by the DLI, LUE may be lower in larger plants because a higher biomass requires that a larger fraction of carbohydrates be allocated to the maintenance of respiration, rather than growth processes (biomass production and associated growth respiration). That, in turn, reduces the carbon use efficiency (ratio between the amount of carbon used for biomass accumulation to the total amount of carbon fixed by photosynthesis) [45,46]. A lower carbon use efficiency likely also results in a lower LUE since a larger fraction of the photosynthates are needed to support the maintenance of respiration, which reduces the efficiency with which photosynthates can be used for biomass accumulation. This suggests that the LUE of plants decreases as they grow larger. Since our LUE calculations estimate the integrated LUE over the entire cropping cycle, it is to be expected that plants with a higher final DW would have a lower LUE. Although counterintuitive, this explains why there is a weak negative correlation between LUE and final DW for the green cultivars (p = 0.006, R2 = 0.15). Further studies with periodic destructive measurements of DW are needed to quantify changes in LUE throughout the cropping cycle. To the best of our knowledge, such studies have not been conducted. Among the red cultivars, there was a positive correlation between LUE and final DW (p < 0.001, R2 = 0.32). We hypothesized that this is caused by the inhibitory effect of anthocyanins on photosynthesis and DW accumulation (see Section 4.4)
LUE was positively correlated with both COR and SLA among the green cultivars (Figure 8a,b). Cultivars with higher COR absorb incident photons more efficiently because photons that are transmitted through the top layer(s) of the canopy can be absorbed by lower leaf layers. Higher canopy absorptance of incident light can contribute to a high LUE. COR and SLA are positively correlated (Figure S2b), possibly because the higher transmittance of leaves with a high SLA (thinner leaves) allows lower leaves to capture enough light to contribute to the overall canopy carbon balance. With a low SLA (thicker leaves), leaves in the upper part of the canopy may not transmit enough light for lower leaves to contribute to plant growth. Higher leaf transmittance results in a uniform light distribution within the canopy, which can increase canopy photosynthesis and thus LUE [47,48,49]. For red cultivars there was a correlation between COR and LUE, but this correlation was weaker than that of the green cultivars.
Our results show that LUE may not be a valuable parameter to screen for rapid growth if LUE is integrated over the entire crop cycle. Counterintuitively, our results suggest that rapid growth is associated with a low LUE throughout the crop cycle. However, screening for short-term or instantaneous LUE may be useful, especially if those results can be corrected for plant size. The latter is important because larger plants are likely to have an inherently lower LUE than smaller plants.
4.4. Inhibitory Effect of Anthocyanins on LUE and Biomass Accumulation
Anthocyanin, pigments resulting in red or purple pigmentation of leaves or flowers, concentrations often increase under high light stress, low temperatures, nutrient deficiency, and drought/salinity conditions [50]. Anthocyanins have a photoprotective function, dissipating a fraction of photons absorbed by a leaf as heat or fluorescence [51]. Since anthocyanins are non-photosynthetic pigments, they reduce the fraction of absorbed photons that can be used in the light reactions of photosynthesis. As a result, the photosynthetic rate is decreased in anthocyanin-rich plants [52,53]. Previous reports suggest that higher anthocyanin levels in lettuce resulted in lower biomass [54,55]. We too found that red cultivars have lower DW than green cultivars (p < 0.001, Table 1). Unfortunately, we did not quantify anthocyanins in this study since the importance of anthocyanins for plant growth did not become clear until well after the end of the study. However, we have subsequently found that the leaf photosynthesis of lettuce is negatively correlated with leaf anthocyanin concentration, with reductions in leaf photosynthesis as large as 69% [56]. We, thus, propose that there is a negative correlation between anthocyanin levels and LUE and/or biomass accumulation. Accounting for anthocyanin concentrations could strengthen models predicting growth based on total incident light.
4.5. No Correlation between Leaf ETR and Biomass
The calculated leaf ETR at PPFDs of 200 and 1000 µmol m−2 s−1 for the different lettuce cultivars was not associated with differences in DW among either red or green cultivars (Figure S7). We observed higher calculated ETRs in the red cultivars compared to the green cultivars, even though red cultivars generally had a lower DW than the green cultivars. This suggests that the presence of anthocyanins results in an overestimation of ETR. Anthocyanins reduce the amount of light that can be absorbed by photosynthetic pigments and anthocyanins lower photosynthetic rates due to this photon-screening effect [57]. McClain and Sharkey [58] reviewed the overestimation of ETR due to the presence of non-photosynthetic pigments, which reduce the effective PPFD in the chloroplasts. Since ΦPSII decreases with increasing PPFD [59], the lower PPFD in the chloroplasts that results from the presence of anthocyanins would be expected to result in an increase in ΦPSII. We did indeed see that the ΦPSII of the red cultivars was higher than that of the green cultivars, although the DW was lower in the red cultivars (Figure S6a,c and Figure 2a). Calculations of ETR are typically based on an estimated leaf absorptance (here 0.84), because it is nearly impossible to estimate the absorptance by photosynthetic pigments only. However, photons absorbed by non-photosynthetic pigments do not contribute to electron transport. As a result, the presence of anthocyanins is likely to result in an overestimation of ETR, and the magnitude of this overestimation is likely dependent on the concentration of the anthocyanins. That hypothesis is consistent with our finding that the quantum requirement for CO2 fixation (the number of photons needed to fix one molecule of CO2) increases with increasing leaf anthocyanin concentration [56].
Unlike leaf level ETR, the canopy ETR showed a strong correlation with DW among the green cultivars (Figure 5a). The result is expected because canopy ETR is strongly dependent on PCS and less so by instantaneous ETR values. The green cultivars had a relatively narrow ETR range at a PPFD of 1000 µmol m−2 s−1 (97 to 121 µmol m−2 s−1), but PCS among the cultivars differed greatly throughout the cropping cycle. As a result, the correlation between DW and canopy ETR or total incident light was similar within the green cultivars. Interestingly, canopy ETR was not correlated with DW among the red cultivars, likely because the ETR values are confounded by different anthocyanin levels. We did indeed see a wide range of calculated, but likely inaccurate, ETR values at a PPFD of 1000 µmol m−2 s−1 among the red cultivars (Table 1, 134 to 315 µmol m−2 s−1) and all of these values are likely overestimates of the true ETR. The inability to correct calculated ETRs for the presence of anthocyanins explains the lack of any correlation between canopy and DW. The physiological relevance of ΦPSII and ETR measurements of plants with significant anthocyanin levels is questionable.
5. Conclusions
The PCS at 13 DAG showed a strong positive correlation with DW among the green lettuces (R2 = 0.76), because larger canopy size resulted in more incident light and, therefore, more biomass accumulation. Our results suggest that the PCS of young plants, before meaningful overlap of leaves within the canopy, is correlated with DW of green cultivars but not red. Similarly, the total incident light was strongly correlated with DW (R2 = 0.90) in green cultivars but less strongly in red cultivars (R2 = 0.55). The results can be used to establish a non-invasive and rapid screening protocol to identify genotypes with higher biomass early during the growing cycle. Leaf level ETR did not explain DW, likely because of relatively small differences within the green cultivars and anomalies introduced by anthocyanins within the red cultivars. PCS-based screening for rapid growth may not be applicable for red cultivars because anthocyanins dissipate a fraction of the photons absorbed by leaves as heat and reduce photon availability for photosynthesis. As a result, anthocyanins reduce crop growth, likely in a manner proportional with the anthocyanin concentration. This weakens the correlation between incident light and DW for red cultivars. The prediction of biomass as a function of PCS or total incident light may be improved by incorporating quantitative information about anthocyanins. LUE calculations based on PCS are useful for determining physiological differences among genotypes; the LUE of red cultivars was lower than that of green cultivars due to an inhibitory effect of anthocyanins on ETR and photosynthesis. However, even within green cultivars a high LUE is not associated with rapid growth, likely because larger plants inherently have a lower LUE. Estimating canopy ETR slightly strengthened the correlation with DW of green cultivars, as compared to total incident light. However, the complexity and time-consuming nature of ETR measurements makes this approach less valuable for genotypic screening.
Supplementary Materials
The following are available online at https://www.mdpi.com/article/10.3390/rs14020316/s1, Figure S1: Comparison between the (left) RGB and (right) chlorophyll fluorescence images of lettuce leaves with different anthocyanin content. CFI easily separates plant objects from background regardless of anthocyanin content, making it an ideal method for determining projected canopy size. Figure S2: The correlation between dry weight (DW) and total leaf area (A) and specific leaf area (SLA) and canopy overlap ratio (COR) (B) in the green and red cultivars. Letters and their colors in the Figures correspond to cultivar names (‘Aquino’ (A), ‘Barlach’ (Ba), ‘Carmessi’ (Ca), ‘Crunchita’ (Cr), ‘Locarno’ (Loc), ‘Lotus’ (Lot), ‘Rex’ (Rex), ‘Rouxai’ (Ro), ‘Seurat’ (S), ‘Teodore’ (T), and ‘Xandra’ (X)) of red and green lettuce cultivars. Summary of the regression analyses are adjacent to the regression lines. Figure S3: Changes in projected canopy size of ‘Rex’ lettuce, as determined from chlorophyll fluorescence images throughout the cropping cycle. The numbers below the plant represent the number of days after germination when the image was taken. Figure S4: The correlation between projected canopy size (PCS) throughout the cropping cycle and dry weight (DW) of the green cultivars. The title of each plot represents the number of days after germination when PCS was measured. Figure S5: The correlation between projected canopy size (PCS) throughout the cropping cycle and dry weight (DW) in the red cultivars. The title of each plot represents the number of days after germination when chlorophyll fluorescence images were taken to measure PCS. Figure S6: Light response curves of quantum yield of photosystem II (ΦPSII) (A and C) and electron transport rate (ETR) (B and D). The light response curves were obtained from diurnal measurements of a minimum of three plants per cultivar, collected from 30 to 48 days after germination. Red and green colored dots and lines are from ‘Carmessi’ and ‘Lotus’ cultivars, respectively. Summary of non-linear regression model is presented in each plot. Figure S7: The result of regression analysis between the dry weight and the calculated electron transport rate (ETR) at PPFDs of 200 (A) and 1000 (B) µmol m−2 s−1, based on data collected from 30 to 48 days after germination. Lettering shows means of each cultivar and error bars (standard deviation, n = 10). Colors of letters in the Figures represent red and green lettuce cultivars. p-values are presented, but none of the correlations are significant. Table S1: Summary of parameters and statistical result of the electron transport rate (ETR) light response curves based on Equation (5). Table S2: Calculated electron transport rate (ETR) at PPFDs of 200 and 1000 µmol m−2 s−1 based on the ETR light response curves of each plant. Video S1: Time-lapse of changes in projected canopy size of ‘Lotus’ (A), ‘Rex’ (B), and ‘Xandra’ (C) cultivars throughout the cropping cycle.
Author Contributions
Conceptualization, C.K. and M.W.v.I.; methodology, C.K. and M.W.v.I.; validation, C.K. and M.W.v.I.; formal analysis, C.K. and M.W.v.I.; investigation, C.K. and M.W.v.I.; resources, M.W.v.I.; data curation, C.K.; writing—original draft preparation, C.K.; writing—review and editing, C.K. and M.W.v.I.; visualization, C.K.; supervision, M.W.v.I.; project administration, M.W.v.I.; funding acquisition, M.W.v.I. All authors have read and agreed to the published version of the manuscript.
Funding
This research was funded by USDA-NIFA-SCRI Award Number 2018-51181-28365, Project ‘Lighting Approaches to Maximize Profits’.
Data Availability Statement
The data presented in this study are available at https://bit.ly/3pA0vnz (Accessed on 29 December 2021).
Conflicts of Interest
The authors declare no conflict of interest.
References
- Pattison, P.M.; Tsao, J.Y.; Brainard, G.C.; Bugbee, B. LEDs for photons, physiology and food. Nature 2018, 563, 493–500. [Google Scholar] [CrossRef] [PubMed]
- Van Iersel, M.W. Optimizing LED lighting in controlled environment agriculture. In Light Emitting Diodes for Agriculture: Smart Lighting; Gupta, S.D., Ed.; Springer: Singapore, 2017; pp. 59–80. [Google Scholar]
- Kozai, T. Smart Plant Factory: The Next Generation Indoor Vertical Farms; Springer: Singapore, 2018. [Google Scholar]
- Watson, R.T.; Boudreau, M.-C.; Van Iersel, M.W. Simulation of greenhouse energy use: An application of energy informatics. Energy Inform. 2018, 1, 1. [Google Scholar] [CrossRef] [Green Version]
- Gómez, C.; Currey, C.J.; Dickson, R.W.; Kim, H.-J.; Hernández, R.; Sabeh, N.C.; Raudales, R.E.; Brumfield, R.G.; Laury-Shaw, A.; Wilke, A.K.; et al. Controlled Environment Food Production for Urban Agriculture. HortScience 2019, 54, 1448–1458. [Google Scholar] [CrossRef]
- Folta, K.M. Breeding new varieties for controlled environments. Plant Biol (Stuttg) 2019, 21 (Suppl. 1), 6–12. [Google Scholar] [CrossRef]
- Goudriaan, J.; Monteith, J.L. A Mathematical Function for Crop Growth Based on Light Interception and Leaf Area Expansion. Ann. Bot. 1990, 66, 695–701. [Google Scholar] [CrossRef] [Green Version]
- Niinemets, Ü. A review of light interception in plant stands from leaf to canopy in different plant functional types and in species with varying shade tolerance. Ecol. Res. 2010, 25, 693–714. [Google Scholar] [CrossRef]
- Weraduwage, S.M.; Chen, J.; Anozie, F.C.; Morales, A.; Weise, S.E.; Sharkey, T.D. The relationship between leaf area growth and biomass accumulation in Arabidopsis thaliana. Front. Plant Sci. 2015, 6, 167. [Google Scholar] [CrossRef] [Green Version]
- McCree, K.J.; Troughton, J.H. Prediction of Growth Rate at Different Light Levels from Measured Photosynthesis and Respiration Rates. Plant Physiol. 1966, 41, 559–566. [Google Scholar] [CrossRef] [Green Version]
- Sun, S.; Li, C.; Paterson, A.H.; Jiang, Y.; Xu, R.; Robertson, J.S.; Snider, J.L.; Chee, P.W. In-field High Throughput Phenotyping and Cotton Plant Growth Analysis Using LiDAR. Front. Plant Sci. 2018, 9, 16. [Google Scholar] [CrossRef] [Green Version]
- Christensen, S.; Goudriaan, J. Deriving light interception and biomass from spectral reflectance ratio. Remote Sens. Environ. 1993, 43, 87–95. [Google Scholar] [CrossRef]
- Rosati, A. Estimating Canopy Light Interception and Absorption Using Leaf Mass Per Unit Leaf Area in Solanum melongena. Ann. Bot. 2001, 88, 101–109. [Google Scholar] [CrossRef]
- Ruban, A.V. Nonphotochemical Chlorophyll Fluorescence Quenching: Mechanism and Effectiveness in Protecting Plants from Photodamage. Plant Physiol. 2016, 170, 1903–1916. [Google Scholar] [CrossRef] [Green Version]
- Müller, P.; Li, X.-P.; Niyogi, K.K. Non-photochemical quenching. A response to excess light energy. Plant Physiol. 2001, 125, 1558–1566. [Google Scholar] [CrossRef] [Green Version]
- Araus, J.L.; Cairns, J.E. Field high-throughput phenotyping: The new crop breeding frontier. Trends Plant Sci. 2014, 19, 52–61. [Google Scholar] [CrossRef]
- Yang, W.; Duan, L.; Chen, G.; Xiong, L.; Liu, Q. Plant phenomics and high-throughput phenotyping: Accelerating rice functional genomics using multidisciplinary technologies. Curr. Opin. Plant Biol. 2013, 16, 180–187. [Google Scholar] [CrossRef]
- Barbagallo, R.P.; Oxborough, K.; Pallett, K.E.; Baker, N.R. Rapid, noninvasive screening for perturbations of metabolism and plant growth using chlorophyll fluorescence imaging. Plant Physiol. 2003, 132, 485–493. [Google Scholar] [CrossRef] [Green Version]
- Purcell, L.C. Soybean Canopy Coverage and Light Interception Measurements Using Digital Imagery. Crop Sci. 2000, 40, 834–837. [Google Scholar] [CrossRef]
- Nyakwende, E.; Paull, C.J.; Atherton, J.G. Non-destructive determination of leaf area in tomato plants using image processing. J. Hortic. Sci. 1997, 72, 255–262. [Google Scholar] [CrossRef]
- Chen, D.; Shi, R.; Pape, J.M.; Neumann, K.; Arend, D.; Graner, A.; Chen, M.; Klukas, C. Predicting plant biomass accumulation from image-derived parameters. Gigascience 2018, 7. [Google Scholar] [CrossRef] [Green Version]
- Makanza, R.; Zaman-Allah, M.; Cairns, J.; Magorokosho, C.; Tarekegne, A.; Olsen, M.; Prasanna, B. High-Throughput Phenotyping of Canopy Cover and Senescence in Maize Field Trials Using Aerial Digital Canopy Imaging. Remote Sens. 2018, 10, 330. [Google Scholar] [CrossRef] [Green Version]
- Strasser, R.J.; Srivastava, A.; Tsimilli-Michael, M. The fluorescence transient as a tool to characterize and screen photosynthetic samples. In Probing Photosynthesis: Mechanisms, Regulation and Adaptation; Yunus, M., Pathre, U., Mohanty, P., Eds.; CRC Press: London, UK, 2000; pp. 445–483. [Google Scholar]
- Baker, N.R. Chlorophyll fluorescence: A probe of photosynthesis in vivo. Annu Rev. Plant Biol 2008, 59, 89–113. [Google Scholar] [CrossRef] [Green Version]
- Murchie, E.H.; Lawson, T. Chlorophyll fluorescence analysis: A guide to good practice and understanding some new applications. J. Exp. Bot. 2013, 64, 3983–3998. [Google Scholar] [CrossRef] [Green Version]
- Fernandez-Jaramillo, A.A.; Duarte-Galvan, C.; Contreras-Medina, L.M.; Torres-Pacheco, I.; Romero-Troncoso, R.D.J.; Guevara-Gonzalez, R.G.; Millan-Almaraz, J.R. Instrumentation in Developing Chlorophyll Fluorescence Biosensing: A Review. Sensors 2012, 12, 11853–11869. [Google Scholar] [CrossRef]
- Pedrós, R.; Moya, I.; Goulas, Y.; Jacquemoud, S. Chlorophyll fluorescence emission spectrum inside a leaf. Photochem. Photobiol. Sci. 2008, 7, 498. [Google Scholar] [CrossRef] [Green Version]
- Toda, S.; Takayam, K.; Kanoh, T.; Fujiuchi, N.; Takahashi, N.; Nishina, H. Measurement of daily stem elongtation with chlorophyll fluorescence imaging robot. Eco-Engineering 2020, 32, 15–21. [Google Scholar] [CrossRef]
- Björkman, O.; Demmig, B. Photon yield of O2 evolution and chlorophyll fluorescence characteristics at 77 K among vascular plants of diverse origins. Planta 1987, 170, 489–504. [Google Scholar] [CrossRef]
- Weaver, G.; Van Iersel, M.W. Photochemical Characterization of Greenhouse-grown Lettuce (Lactuca sativa L. ‘Green Towers’) with Applications for Supplemental Lighting Control. HortScience 2019, 54, 317–322. [Google Scholar] [CrossRef] [Green Version]
- Omasa, K.; Hosoi, F.; Konishi, A. 3D lidar imaging for detecting and understanding plant responses and canopy structure. J. Exp. Bot. 2007, 58, 881–898. [Google Scholar] [CrossRef] [Green Version]
- Gholz, H.L.; Vogel, S.A.; Cropper, W.P., Jr.; McKelvey, K.; Ewel, K.C.; Teskey, R.O.; Curran, P.J. Dynamics of Canopy Structure and Light Interception in Pinus Elliottii Stands, North Florida. Ecol. Monogr. 1991, 61, 33–51. [Google Scholar] [CrossRef] [Green Version]
- Geipel, J.; Link, J.; Claupein, W. Combined Spectral and Spatial Modeling of Corn Yield Based on Aerial Images and Crop Surface Models Acquired with an Unmanned Aircraft System. Remote Sens. 2014, 6, 10335–10355. [Google Scholar] [CrossRef] [Green Version]
- Jayalath, T.C.; Van Iersel, M.W. Canopy Size and Light Use Efficiency Explain Growth Differences between Lettuce and Mizuna in Vertical Farms. Plants 2021, 10, 704. [Google Scholar] [CrossRef] [PubMed]
- Klassen, S.P.; Ritchie, G.; Frantz, J.M.; Pinnock, D.; Bugbee, B. Real-Time Imaging of Ground Cover: Relationships with Radiation Capture, Canopy Photosynthesis, and Daily Growth Rate. In Imaging and Spectral Techniques: Applications to Precision Agriculture and Crop Physiology; ASA-CSSA-SSSA: Baltimore, MD, USA, 2001; pp. 1–14. [Google Scholar]
- Legendre, R.; Van Iersel, M.W. Supplemental Far-Red Light Stimulates Lettuce Growth: Disentangling Morphological and Physiological Effects. Plants 2021, 10, 166. [Google Scholar] [CrossRef] [PubMed]
- Jung, D.-H.; Park, S.H.; Han, X.Z.; Kim, H.-J. Image Processing Methods for Measurement of Lettuce Fresh Weight. J. Biosyst. Eng. 2015, 40, 89–93. [Google Scholar] [CrossRef] [Green Version]
- WüNsche, J.N.; Lakso, A.N. The Relationship Between Leaf Area and Light Interception by Spur and Extension Shoot Leaves and Apple Orchard Productivity. HortScience 2000, 35, 1202–1206. [Google Scholar] [CrossRef] [Green Version]
- Cabrera-Bosquet, L.; Fournier, C.; Brichet, N.; Welcker, C.; Suard, B.; Tardieu, F. High-throughput estimation of incident light, light interception and radiation-use efficiency of thousands of plants in a phenotyping platform. New Phytol 2016, 212, 269–281. [Google Scholar] [CrossRef] [Green Version]
- Horton, P. Prospects for crop improvement through the genetic manipulation of photosynthesis: Morphological and biochemical aspects of light capture. J. Exp. Bot. 2000, 51, 475–485. [Google Scholar] [CrossRef]
- Wells, R. Soybean Growth Response to Plant Density: Relationships among Canopy Photosynthesis, Leaf Area, and Light Interception. Crop Sci. 1991, 31, 755–761. [Google Scholar] [CrossRef]
- Loomis, R.S.; Amthor, J.S. Yield Potential, Plant Assimilatory Capacity, and Metabolic Efficiencies. Crop Sci. 1999, 39, 1584–1596. [Google Scholar] [CrossRef] [Green Version]
- Slattery, R.A.; Ort, D.R. Perspectives on improving light distribution and light use efficiency in crop canopies. Plant Physiol. 2021, 185, 34–48. [Google Scholar] [CrossRef]
- Kage, H.; Stützel, H.; Alt, C. Predicting dry matter production of cauliflower (Brassica oleracea L. botrytis) under unstressed conditions: Part II. Comparison of light use efficiency and photosynthesis–respiration based modules. Sci. Hortic. 2001, 87, 171–190. [Google Scholar] [CrossRef]
- Van Iersel, M. Carbon use efficiency depends on growth respiration, maintenance respiration, and relative growth rate. A case study with lettuce. Plant Cell Environ. 2003, 26, 1441–1449. [Google Scholar] [CrossRef]
- McCree, K.J. Equations for the Rate of Dark Respiration of White Clover and Grain Sorghum, as Functions of Dry Weight, Photosynthetic Rate, and Temperature1. Crop Sci. 1974, 14, 509–514. [Google Scholar] [CrossRef]
- Sarlikioti, V.; De Visser, P.H.; Marcelis, L.F. Exploring the spatial distribution of light interception and photosynthesis of canopies by means of a functional-structural plant model. Ann. Bot 2011, 107, 875–883. [Google Scholar] [CrossRef] [Green Version]
- Niinemets, Ü. Photosynthesis and resource distribution through plant canopies. Plant Cell Environ. 2007, 30, 1052–1071. [Google Scholar] [CrossRef]
- Hikosaka, K. Leaf Canopy as a Dynamic System: Ecophysiology and Optimality in Leaf Turnover. Ann. Bot. 2004, 95, 521–533. [Google Scholar] [CrossRef] [Green Version]
- Boldt, J.K.; Meyer, M.H.; Erwin, J.E. Foliar Anthocyanins: A Horticultural Review. In Horticultural Reviews; Janick, J., Ed.; John Wiley & Sons, Inc.: Hoboken, NJ, USA, 2014; Volume 42, pp. 209–252. [Google Scholar]
- Das, P.K.; Geul, B.; Choi, S.B.; Yoo, S.D.; Park, Y.I. Photosynthesis-dependent anthocyanin pigmentation in Arabidopsis. Plant Signal. Behav. 2011, 6, 23–25. [Google Scholar] [CrossRef] [Green Version]
- Nichelmann, L.; Bilger, W. Quantification of light screening by anthocyanins in leaves of Berberis thunbergii. Planta 2017, 246, 1069–1082. [Google Scholar] [CrossRef]
- Tattini, M.; Sebastiani, F.; Brunetti, C.; Fini, A.; Torre, S.; Gori, A.; Centritto, M.; Ferrini, F.; Landi, M.; Guidi, L. Dissecting molecular and physiological response mechanisms to high solar radiation in cyanic and acyanic leaves: A case study on red and green basil. J. Exp. Bot 2017, 68, 2425–2437. [Google Scholar] [CrossRef]
- Son, K.-H.; Oh, M.-M. Growth, photosynthetic and antioxidant parameters of two lettuce cultivars as affected by red, green, and blue light-emitting diodes. Hortic. Environ. Biotechnol. 2015, 56, 639–653. [Google Scholar] [CrossRef]
- Kang, J.H.; KrishnaKumar, S.; Atulba, S.L.S.; Jeong, B.R.; Hwang, S.J. Light intensity and photoperiod influence the growth and development of hydroponically grown leaf lettuce in a closed-type plant factory system. Hortic. Environ. Biotechnol. 2013, 54, 501–509. [Google Scholar] [CrossRef]
- Kim, C.; Van Iersel, M.W. The Quantum Requirement for CO2 Assimilation Increases with Increasing Photosynthetic Photon Flux Density and Leaf Anthocyanin Concentration in Lettuce. In Proceedings of the 2020 ASHS Annual Conference, Orlando, FL, USA, 1 September 2020; p. S154. [Google Scholar]
- Nielsen, S.L.; Simonsen, A.M. Photosynthesis and photoinhibition in two differently coloured varieties of Oxalis triangularis—the effect of anthocyanin content. Photosynthetica 2011, 49, 346–352. [Google Scholar] [CrossRef]
- McClain, A.M.; Sharkey, T.D. Building a better equation for electron transport estimated from Chl fluorescence: Accounting for nonphotosynthetic light absorption. New Phytol. 2020, 225, 604–608. [Google Scholar] [CrossRef] [PubMed]
- Zhen, S.; Van Iersel, M.W. Photochemical Acclimation of Three Contrasting Species to Different Light Levels: Implications for Optimizing Supplemental Lighting. J. Am. Soc. Hortic. Sci. 2017, 142, 346–354. [Google Scholar] [CrossRef] [Green Version]
Figure 1.
Daily light integral, temperature, and vapor pressure deficit of the greenhouse throughout the experimental period.
Figure 1.
Daily light integral, temperature, and vapor pressure deficit of the greenhouse throughout the experimental period.

Figure 2.
Harvest data of 11 lettuce cultivars collected at 51 days after germination. Green bars indicate cultivars with green leaves, while red bars indicate red cultivars. (A) Dry weight; (B) Total leaf area; (C) Specific leaf area; (D) Canopy overlap ratio. Cultivars with the same letter are not significantly different from each other (p = 0.05, n = 10).

Figure 3.
Sigmoidal regression curves of projected canopy size (PCS, R2 > 0.99) of eleven lettuce cultivars throughout the growing cycle. Green and red colored lines and letters are PCS of green cultivars (A) and red cultivars (B), respectively. Letters on the plots refer to names of the lettuce cultivars (‘Aquino’ (A), ‘Barlach’ (Ba), ‘Carmessi’ (Ca), ‘Crunchita’ (Cr), ‘Locarno’ (Loc), ‘Lotus’ (Lot), ‘Rex’ (Rex), ‘Rouxai’ (Ro), ‘Seurat’ (S), ‘Teodore’ (T), and ‘Xandra’ (X)). Lettering shows the mean and error bars indicate the standard deviation (n = 10). Inserted plots show the magnified PCS during the early part of the cropping cycle.

Figure 4.
(A) Representative canopy images of lettuce cultivars at 13 days after germination (DAG); (B) Regression analysis between projected canopy size (PCS) at 13 DAG and shoot dry weight at harvest; (C) Regression analysis between PCS at 13 DAG and final total leaf area. The plots show summaries of significant regressions or only p-value when there was no significance (p = 0.05). Letters in Figures (B,C) correspond to cultivars names (‘Aquino’ (A), ‘Barlach’ (Ba), ‘Carmessi’ (Ca), ‘Crunchita’ (Cr), ‘Locarno’ (Loc), ‘Lotus’ (Lot), ‘Rex’ (Rex), ‘Rouxai’ (Ro), ‘Seurat’ (S), ‘Teodore’ (T), and ‘Xandra’ (X)), while red and green colors refer to red and green lettuce cultivars and their respective regression results.

Figure 5.
The relationship between estimated canopy electron transport rate (ETR) over the entire crop cycle (A) and total incident light with shoot dry weight at the harvest (DW) (B). Letters and their colors on the figures correspond to the red and green cultivars (‘Aquino’ (A), ‘Barlach’ (Ba), ‘Carmessi’ (Ca), ‘Crunchita’ (Cr), ‘Locarno’ (Loc), ‘Lotus’ (Lot), ‘Rex’ (Rex), ‘Rouxai’ (Ro), ‘Seurat’ (S), ‘Teodore’ (T), and ‘Xandra’ (X)). The regression equation (when significant) and p-value are shown in green and red text for the green and red cultivars.

Figure 6.
The relation between total incidental light and projected canopy size (PCS) at 13 (A) and 48 (B) days after germination (DAG). Letters and their colors on the figures correspond to name of cultivars (‘Aquino’ (A), ‘Barlach’ (Ba), ‘Carmessi’ (Ca), ‘Crunchita’ (Cr), ‘Locarno’ (Loc), ‘Lotus’ (Lot), ‘Rex’ (Rex), ‘Rouxai’ (Ro), ‘Seurat’ (S), ‘Teodore’ (T), and ‘Xandra’ (X)) and red and green lettuce cultivars. The regression summaries were labeled adjacent to the regression lines.

Figure 7.
Variation in light use efficiency among the lettuce cultivars. Green and red colored bars correspond to the color of the lettuce cultivars. The error bars indicate standard deviations and letters above these bars represent the result of the mean separation. Cultivars with the same letter are not significantly different from each other (p = 0.05, n = 10).

Figure 8.
Correlation between light use efficiency and specific leaf area (A) and canopy overlap ratio (B) at harvest 51 days after germination. R2, p-value, and regression equation or only p-value are shown adjacent to a regression line when significant. Letters correspond to cultivars (‘Aquino’ (A), ‘Barlach’ (Ba), ‘Carmessi’ (Ca), ‘Crunchita’ (Cr), ‘Locarno’ (Loc), ‘Lotus’ (Lot), ‘Rex’ (Rex), ‘Rouxai’ (Ro), ‘Seurat’ (S), ‘Teodore’ (T), and ‘Xandra’ (X)), while text color indicates red and green lettuce cultivars.


Table 1.
Comparison of growth parameters between green (n = 48) and red (n = 60) leaf lettuces using Welch’s t-test at 95% confidence level.
Table 1.
Comparison of growth parameters between green (n = 48) and red (n = 60) leaf lettuces using Welch’s t-test at 95% confidence level.
| Growth Parameters | Mean ± Standard Deviation | t | p-Value | |
|---|---|---|---|---|
| Green Cultivars | Red Cultivars | |||
| Dry weight (g) | 10.8 ± 3.4 | 7.9 ± 1.5 | 5.4 | <0.001 |
| Total leaf area (cm2) | 3223 ± 853 | 3393 ± 806 | −1.0 | 0.300 |
| Specific leaf area (cm2 g−1) | 307.2 ± 68.6 | 426.3 ± 65.2 | −9.1 | <0.001 |
| Canopy overlap ratio (m2 m−2) | 5.6 ± 2.5 | 5.6 ± 1.3 | −0.1 | 0.922 |
| Canopy ETR (mol) | 2.5 ± 0.8 | 3.3 ± 0.5 | −5.8 | <0.001 |
| Total incidental light (mol) | 18.6 ± 7.7 | 17.3 ± 2.6 | 1.1 | 0.287 |
| Light use efficiency (g mol−1) | 0.61 ± 0.10 | 0.46 ± 0.06 | 9.3 | <0.001 |
| Calculated ETR at PPFD of 200 (µmol m−2 s−1) | 48.9 ± 2.7 | 53.9 ± 2.4 | −9.9 | <0.001 |
| Calculated ETR at PPFD of 1000 (µmol m−2 s−1) | 110.9 ± 10.6 | 212.9 ± 68.5 | −11.3 | <0.001 |
| Projected canopy size at 13 DAG (cm2) | 4.8 ± 1.7 | 4.1 ± 1.1 | 2.1 | 0.037 |
Table 2.
Summary of the correlation between shoot dry weight at harvest and the projected canopy size (PCS) at different days after germination (DAG). Regression analyses were conducted separately for cultivars with green and red leaves. All significant correlations from green cultivars were positive correlations, but red cultivars had both positive and negative correlations between PCS and dry weight. Significant regression for green and red cultivars are graphed in Figure S4 and Figure S5, respectively.
| DAG | Statistical Summary | Regression Equation | ||||||
|---|---|---|---|---|---|---|---|---|
| Green 1 | Red 2 | Green | Red | |||||
| R2 | p-Value | R2 | p-Value | Intercept (g) | Slope (g cm−2) | Intercept (g) | Slope (g cm−2) | |
| 6 | 0.20 | 0.001 | 0.10 | 0.015 | 5.1 | 5.444 | 9.4 | −1.815 |
| 10 | 0.15 | 0.006 | 0.07 | 0.046 | 7.2 | 1.346 | 9.1 | −0.495 |
| 13 | 0.74 | <0.001 | 0.00 | 0.794 | 2.7 | 1.697 | ns 3 | ns |
| 17 | 0.20 | <0.001 | 0.02 | 0.292 | 6.2 | 0.346 | ns | ns |
| 20 | 0.38 | <0.001 | 0.00 | 0.800 | 4.5 | 0.246 | ns | ns |
| 24 | 0.45 | <0.001 | 0.00 | 0.712 | 4.3 | 0.126 | ns | ns |
| 28 | 0.50 | <0.001 | 0.01 | 0.414 | 4.3 | 0.084 | ns | ns |
| 32 | 0.67 | <0.001 | 0.22 | <0.001 | 4.0 | 0.052 | 4.0 | 0.031 |
| 34 | 0.74 | <0.001 | 0.31 | <0.001 | 3.8 | 0.041 | 3.7 | 0.026 |
| 38 | 0.89 | <0.001 | 0.53 | <0.001 | 3.8 | 0.024 | 2.6 | 0.019 |
| 41 | 0.91 | <0.001 | 0.51 | <0.001 | 3.6 | 0.017 | 1.9 | 0.016 |
| 44 | 0.87 | <0.001 | 0.52 | <0.001 | 3.8 | 0.013 | 1.0 | 0.014 |
| 48 | 0.76 | <0.001 | 0.45 | <0.001 | 4.3 | 0.010 | 1.7 | 0.010 |
1 Green cultivars are ‘Aquino’, ‘Rex’, ‘Crunchita’, ‘Locarno’, and ‘Lotus’. 2 Red cultivars are ‘Barlach’, ‘Carmessi’, ‘Rouxai’, ‘Seurat’, ‘Teodore’, and ‘Xandra’. 3 ns = non-significant.
Publisher’s Note: MDPI stays neutral with regard to jurisdictional claims in published maps and institutional affiliations. |
© 2022 by the authors. Licensee MDPI, Basel, Switzerland. This article is an open access article distributed under the terms and conditions of the Creative Commons Attribution (CC BY) license (https://creativecommons.org/licenses/by/4.0/).
Share and Cite
MDPI and ACS Style
Kim, C.; van Iersel, M.W. Morphological and Physiological Screening to Predict Lettuce Biomass Production in Controlled Environment Agriculture. Remote Sens. 2022, 14, 316. https://doi.org/10.3390/rs14020316
AMA Style
Kim C, van Iersel MW. Morphological and Physiological Screening to Predict Lettuce Biomass Production in Controlled Environment Agriculture. Remote Sensing. 2022; 14(2):316. https://doi.org/10.3390/rs14020316
Chicago/Turabian StyleKim, Changhyeon, and Marc W. van Iersel. 2022. "Morphological and Physiological Screening to Predict Lettuce Biomass Production in Controlled Environment Agriculture" Remote Sensing 14, no. 2: 316. https://doi.org/10.3390/rs14020316
Note that from the first issue of 2016, this journal uses article numbers instead of page numbers. See further details here.