
Investigation of Vegetation Changes in Different Mining Areas in Liaoning Province, China, Using Multisource Remote Sensing Data

1
Institute for Geoinformatics & Digital Mine Research, Northeastern University, Shenyang 110819, China
2
Key Laboratory of Ministry of Education on Safe Mining of Deep Metal Mines, Northeastern University, Shenyang 110819, China
*
Author to whom correspondence should be addressed.
Remote Sens. 2021, 13(24), 5168; https://doi.org/10.3390/rs13245168
Submission received: 31 October 2021
/
Revised: 15 December 2021
/
Accepted: 15 December 2021
/
Published: 20 December 2021
(This article belongs to the Special Issue The Impact of Extreme Climatic and Disturbance Events on Vegetation Using Remote Sensing)
Abstract
:Mining can provide necessary mineral resources for humans. However, mining activities may cause damage to the surrounding ecology and environment. Vegetation change analysis is a key tool for evaluating damage to ecology and the environment. Liaoning is one of the major mining provinces in China, with rich mineral resources and long-term, high-intensity mining activities. Taking Liaoning Province as an example, vegetation change in six mining areas was investigated using multisource remote sensing data to evaluate ecological and environmental changes. Based on MODIS NDVI series data from 2000 to 2019, change trends of vegetation were evaluated using linear regression. According to the results, there are large highly degraded vegetation areas in the Anshan, Benxi, and Yingkou mining areas, which indicates that mining activities have seriously damaged the vegetation in these areas. In contrast, there are considerable areas with improved vegetation in the Anshan, Fushun, and Fuxin mining areas, which indicates that ecological reclamation has played a positive role in these areas. Based on Sentinel-2A data, leaf chlorophyll content was inferred by using the vegetation index MERIS Terrestrial Chlorophyll Index (MTCI) after measurement of leaf spectra and chlorophyll content were carried out on the ground to validate the performance of MTCI. According to the results, the leaf chlorophyll content in the mines is generally lower than in adjacent areas in these mining areas with individual differences. In the Yingkou mining area, the chlorophyll content in adjacent areas is close to the magnesite mines, which means the spillover effect of environmental pollution in mines should be considerable. In the Anshan, Benxi, and Diaobingshan mining areas, the environmental stress on adjacent areas is slight. All in all, iron and magnesite open-pit mines should be monitored closely for vegetation destruction and stress due to the high intensity of mining activities and serious pollution. In contrast, the disturbance to vegetation is limited in resource-exhausted open-pit coal mines and underground coal mines. It is suggested that land reclamation should be enhanced to improve the vegetation in active open-pit mining areas, such as the Anshan, Benxi, and Yingkou mining areas. Additionally, environmental protection measures should be enhanced to relieve vegetation stress in the Yingkou mining area.
1. Introduction
Vegetation is a topic of interest among scientists and researchers because it plays an important role in the interconnected systems of life on Earth. One important function of vegetation is soil stabilization and enrichment [1,2,3]. Vegetation degradation and desertification could contribute to broader environmental and ecological problems, such as loss of topsoil, increase in temperature, and diminished food resources for humans and wildlife [4,5].
Mining is the extraction of valuable minerals or other geological materials from the Earth, particularly from an ore, lode, vein, (coal) seam, or reef, which constitute the mineralized horizon and are the package of economic interest to miners. Mining activities have recently reached a high intensity in China due to the huge demand for mineral resources [6]. Liaoning is one of the major mining provinces in China, with many types of mineral resources, abundant resource reserves, high development intensity, and a large scale. The dominant minerals are iron ore, magnesite, boron, diamond, oil, and natural gas. The mineral resources in Liaoning are mostly centrally distributed with shallow burial and are therefore suitable for open-pit mining. For example, the Anshan and Benxi regions are well-known iron open-pit mining areas, and Yingkou is a well-known magnesite open-pit mining area. In addition, there are several coal-exhausted mining areas such as Fuxin and Fushun. The nature of mining activities creates a negative impact on the surrounding ecology and environment during mining operations, and this negative impact can continue even after a mine is closed [7]. For example, open-pit mining can completely eliminate existing vegetation, destroy the soil ecological profile, and alter land use [8,9,10,11]. Through the movement, storage, and redistribution of soil, the community of microorganisms and nutrient-cycling processes are then disrupted [12]. In addition to direct impacts on vegetation, there are important indirect impacts from stress factors caused by mining activities such as dust pollution, water pollution, and others [13,14]. However, few studies have focused on the change in vegetation in different mining areas.
Effective monitoring is necessary for environmental and ecological protection in mining areas. Remote sensing is the most useful technology in vegetation monitoring at the regional scale because of its sufficient area coverage and frequent temporal coverage [15,16,17]. The spectral properties of vegetation derived from remotely sensed data can provide a range of biophysical and biochemical measurements, such as vegetation cover and chlorophyll content [18]. Thus, remote sensing is widely used in the detection of vegetation change [19,20,21,22]. The most common method to measure biophysical characteristics of vegetation is the vegetation index (VI) [23]. The normalized difference vegetation index (NDVI) is one of the most widely used VIs and is based on the difference in reflectance of the near-infrared and red bands [24]. NDVI has two major advantages: (1) it is highly related to the vegetation coverage and the fraction of photosynthetically active radiation absorbed by vegetation [25,26], and (2) it is more sensitive to sparse vegetation than to dense vegetation [27]. To date, three kinds of sensors have been used to produce NDVI time series data: Advanced Very High Resolution Radiometer (AVHRR), SPOT Vegetation (VGT), and Moderate Resolution Imaging Spectroradiometer (MODIS) [15,28]. MODIS NDVI time series data are usually selected to monitor vegetation change trends at a regional scale due to a relatively high spatial resolution of 250 m.
In addition to vegetation coverage, some biochemical parameters are also important for vegetation monitoring. Among them, chlorophyll is the basis of photosynthesis, and chlorophyll content is an important parameter that reflects vegetation growth and stress conditions [29]. However, the widely used NDVI is not well suited to measure chlorophyll content [30]. With the help of sensors with red-edge bands, chlorophyll can be inferred using some VIs [31,32]. Sentinel-2A can provide images with these effective bands and 10 m spatial resolution to estimate the chlorophyll content of vegetation [33]. Moreover, Sentinel-2A images were also used for monitoring soil pollution [34], identifying acid mine drainage [35], and mapping mine type in some mining areas [36], which showed the potential application of the Sentinel-2A data.
To monitor vegetation changes in six main mining areas in Liaoning Province of China over the last 20 years, a remote sensing approach was employed based on multisource data including MODIS NDVI series data and Sentinel-2A data. Furthermore, the differences between the mining areas were compared and analyzed.
2. Study Area and Data
2.1. Study Area
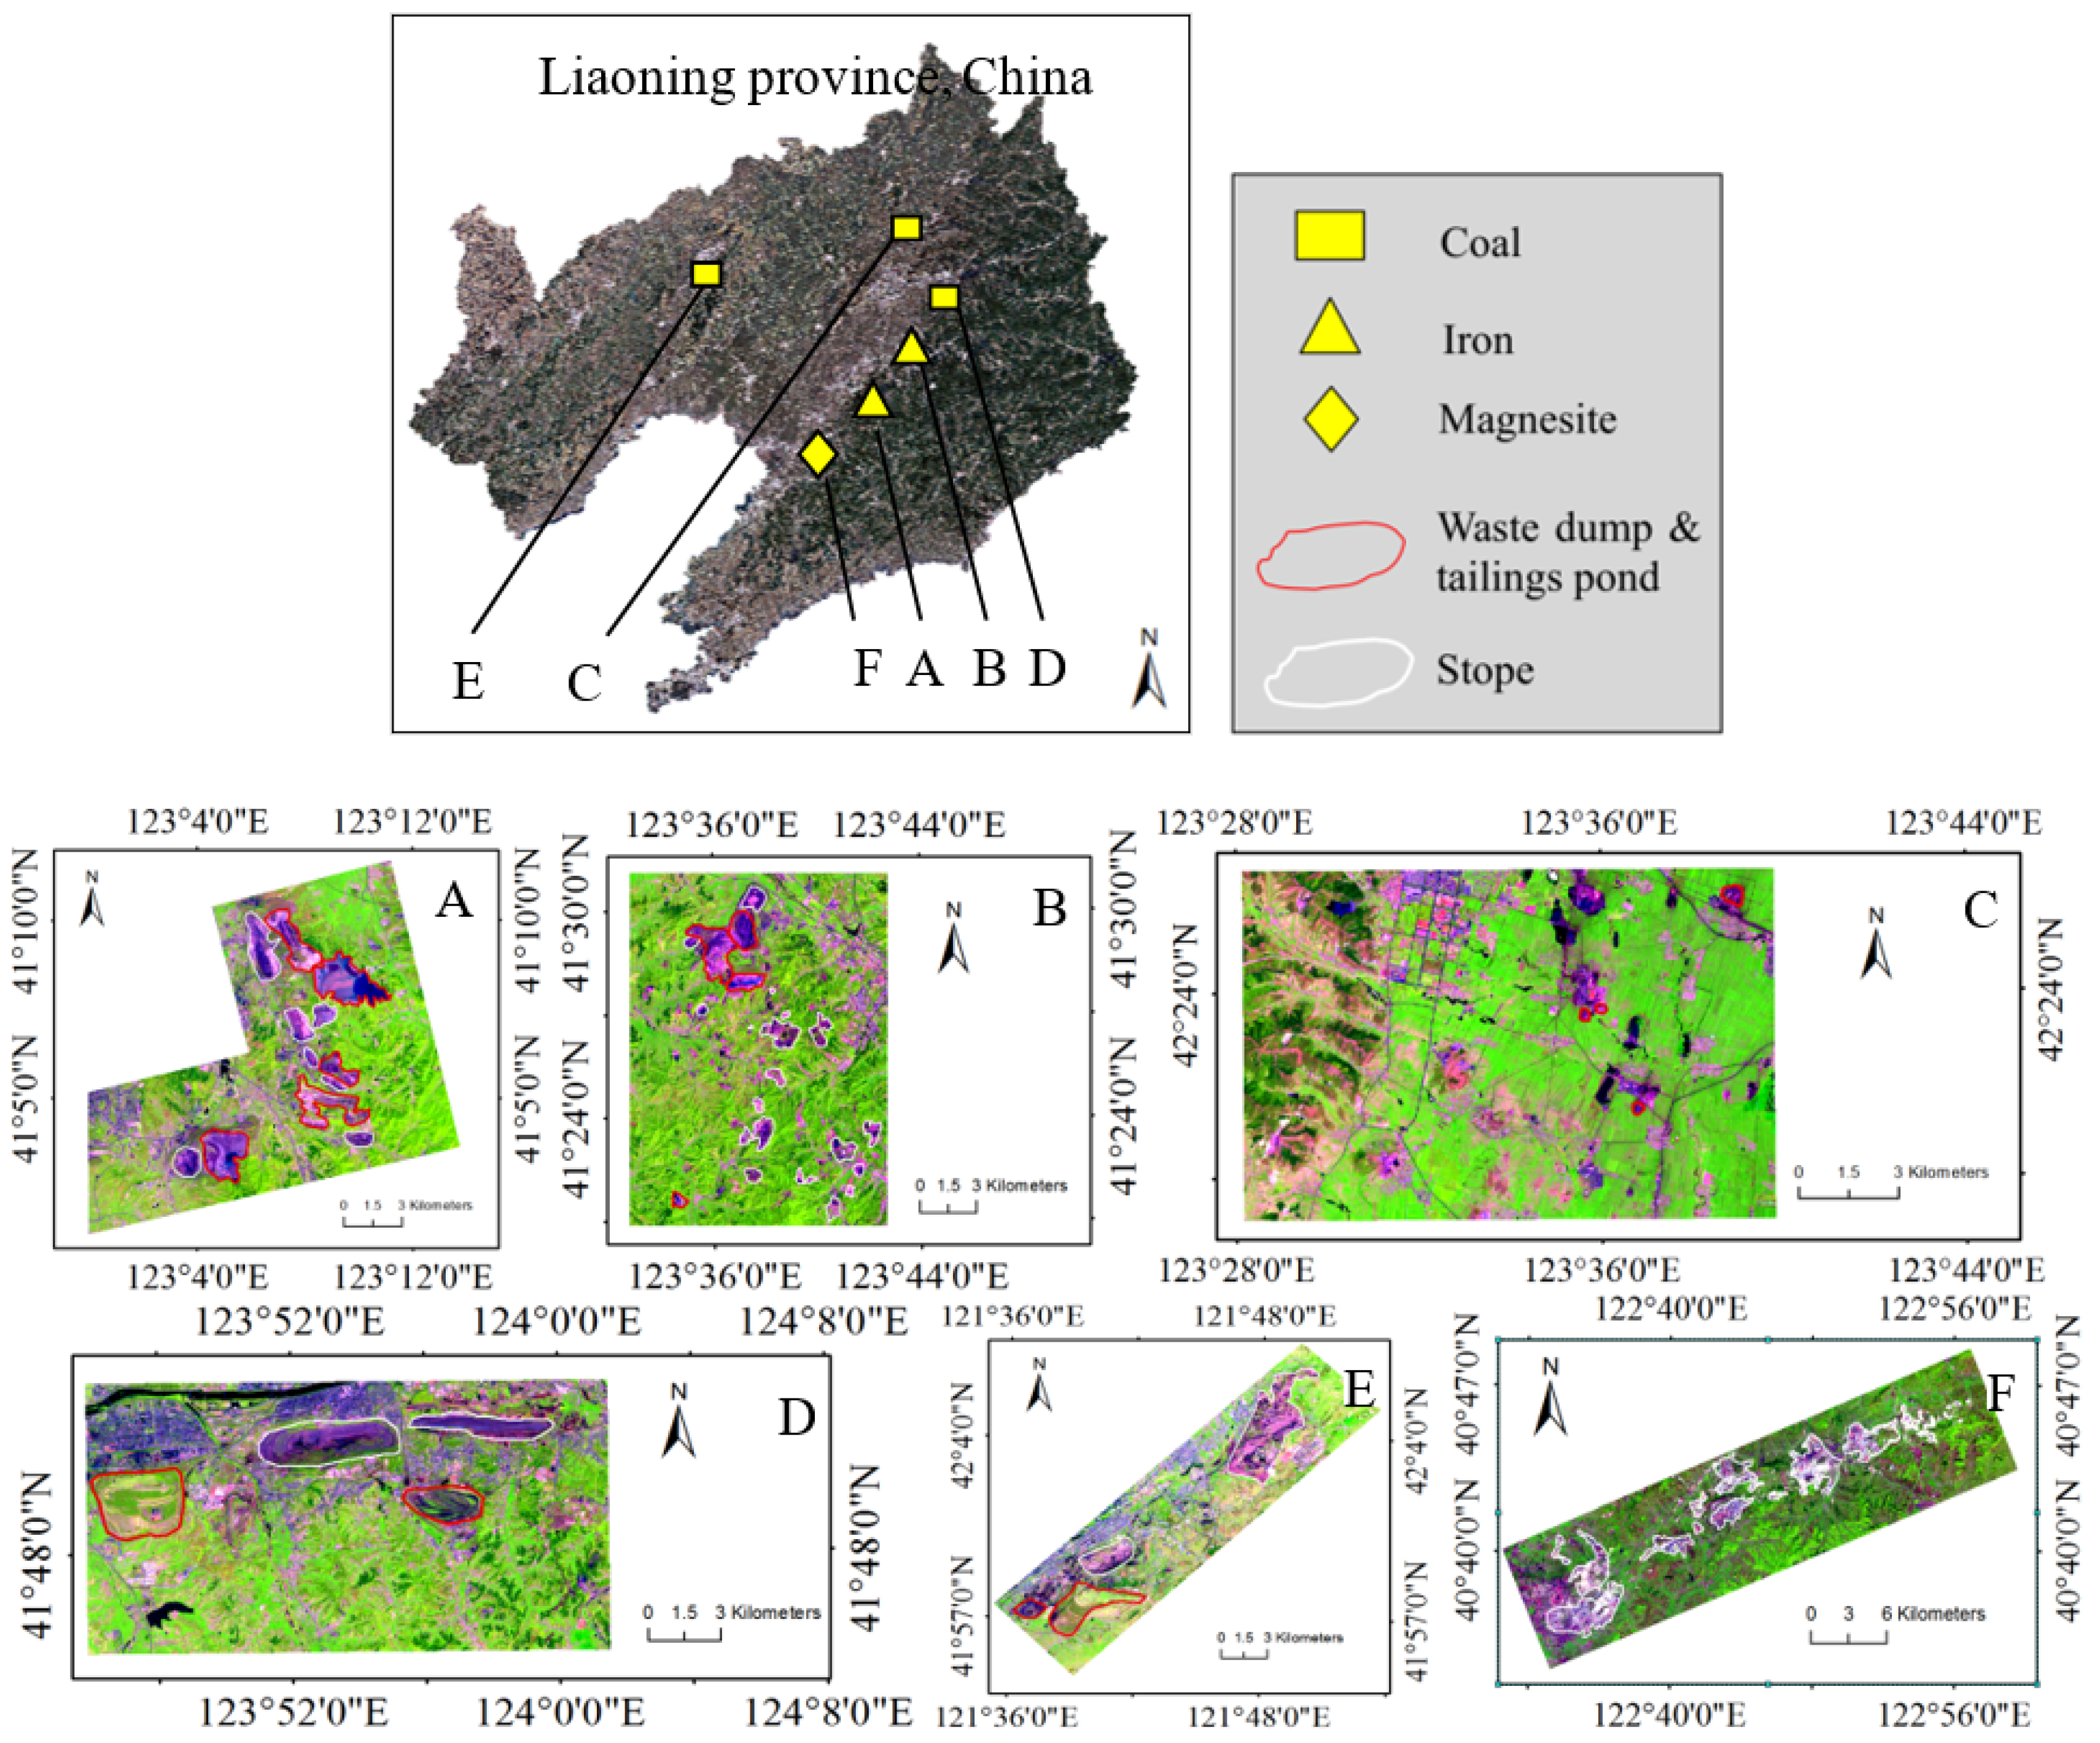
Liaoning Province is located in the south of Northeast China. The climate of Liaoning Province is temperate and monsoonal with annual precipitation between 600 mm and 1100 mm. It is an important mining province in China. By of the end of 2015, 122 types of minerals had been discovered there, and there were 3096 mines with resource reserves. The reserves of iron and magnesite in Liaoning Province rank first in China. Within the province, 93% of iron ore is distributed in Anshan, Benxi, and Liaoyang, and magnesite is mainly in Yingkou and Haicheng. Coal mines were developed more than 100 years ago in the province. However, the coal resources in Fushun and Fuxin were exhausted in the beginning of the 21st century due to high intensity development. Two huge abandoned open pits are located in Fushun and Fuxin. Now, active coal mines are mainly distributed in Diaobingshan as underground mines. In this study, six major mining areas in Liaoning Province, Anshan, Benxi, Diaobingshan, Fushun, Fuxin, and Yingkou, were set as the study areas to investigate vegetation changes using remote sensing (Table 1, Figure 1).
2.2. Remotely Sensed Data
2.2.1. MODIS NDVI Series Data
MODIS is a key instrument aboard the Terra and Aqua satellites, which view the entire surface of the earth every one to two days. In this study, MODIS Terra 16-day composite 250 m time-series NDVI products (MOD13Q1) spanning a 20-year period from 2000 to 2019 were acquired (https://ladsweb.modaps.eosdis.nasa.gov/, accessed on 15 March 2020). The tiled NDVI data were reprojected to the Universal Transverse Mercator (UTM) coordinate system.
2.2.2. Sentinel-2A Data
Sentinel-2A images contain 13 bands with spatial resolution ranging from 10 m to 60 m. The image data acquired on 2 and 10 August 2018, were downloaded (https://earthexplorer.usgs.gov/, accessed on 15 March 2020) and then atmospherically corrected using SNAP software. The images were resampled to 10 m.
2.2.3. High-Resolution Data
GeoEye data were downloaded from Google Earth for validation (http://kh.google.com, accessed on 27 April 2020).
2.3. Other Data
The climate data (monthly averaged temperature and precipitation from 2000 to 2019) were from the corresponding nearest weather stations to these mining sites, provided by National Meteorological Information Center of China. The yearly total precipitation and yearly averaged temperature were derived from these monthly data. Ore production data were also collected for the driving force analysis (http://tjj.ln.gov.cn/tjsj/sjcx/ndsj/, accessed on 27 April 2020).
3. Method
3.1. Composing the Method for Analysis of MODIS NDVI Yearly Data
Considering that the yearly NDVI is a reliable indicator reflecting the state of vegetation cover, the time series made up of the 16-day composite NDVI maps were combined to produce a NDVI map for each year through the maximum value composite (MVC) method [37]. The composition period of yearly NDVI varied covered the vegetation growing period from May to September [38,39,40]. The yearly maximum NDVI was calculated as follows:
where MNDVI is the yearly maximum NDVI in one year, and i is the sequence number of the 10 NDVI maps from May to September in one year, from 1 to 10.
3.2. Changing Trend Analysis Based on Yearly NDVI
Based on the composed yearly MODIS NDVI data, the slope of the linear regression was used to simulate the trend of vegetation in the mining areas. The slope was calculated as follows:
where j is the sequence number of the 20 years, from 1 to 20, and SLOPE refers to the slope of linear regression. For each pixel, the slope of the fitted line shows the trend of vegetation. A positive slope indicates vegetation in good condition, whereas a negative slope indicates damaged vegetation. In this study, the NDVI series data were used to divide the degree of vegetation changes into seven levels according to the slope of the fitted line (Table 2) [41].
3.3. Chlorophyll Content Estimation Based on Sentinel Data and Difference Analysis
Based on Sentinel-2A images, some indices consisting of red-edge bands can be derived, from which the MERIS Terrestrial Chlorophyll Index (MTCI) could estimate leaf chlorophyll content with good performance [42]. Additionally, MTCI is simple to calculate, and its formula is as follows [43]:
where R is the reflectance, and its subscript is the wavelength (nm). To validate the performance of MTCI, measurement of spectra and chlorophyll content were carried out on the ground. Boston ivy leaves in the Anshan and Diaobingshan mining area were selected as the leaf samples for the experiment. Leaf chlorophyll content was measured using SPAD-502 (Minolta Camera, Osaka, Japan). Five to seven points were measured evenly on each leaf, and the mean value SPAD was set as the chlorophyll content of the leaf. The SVC HR-1024 spectrometer (Spectra Vista Corporation, Poughkeepsie, NY, USA) was then used to collect the spectra data of the leaves. The spectral resolution of the SVC HR-1024 spectrometer was 3.5 nm in the range of 350 to 1000 nm, 9.5 nm in the range of 1000 to 1850 nm, and 6.5 nm in the range of 1850 to 2500 nm. The experimental light source was a halogen lamp with 60° elevation angle and 50 cm distance from the target. After the spectral curves of 32 leaf samples were measured, MTCI and NDVI were calculated, respectively, to study their relationship with chlorophyll content.
The MTCI was selected to estimate chlorophyll content of vegetation based on their statistical relationship. The existing relationship for global chlorophyll content estimation was used to estimate the leaf chlorophyll content [44]. The formula is as follows:
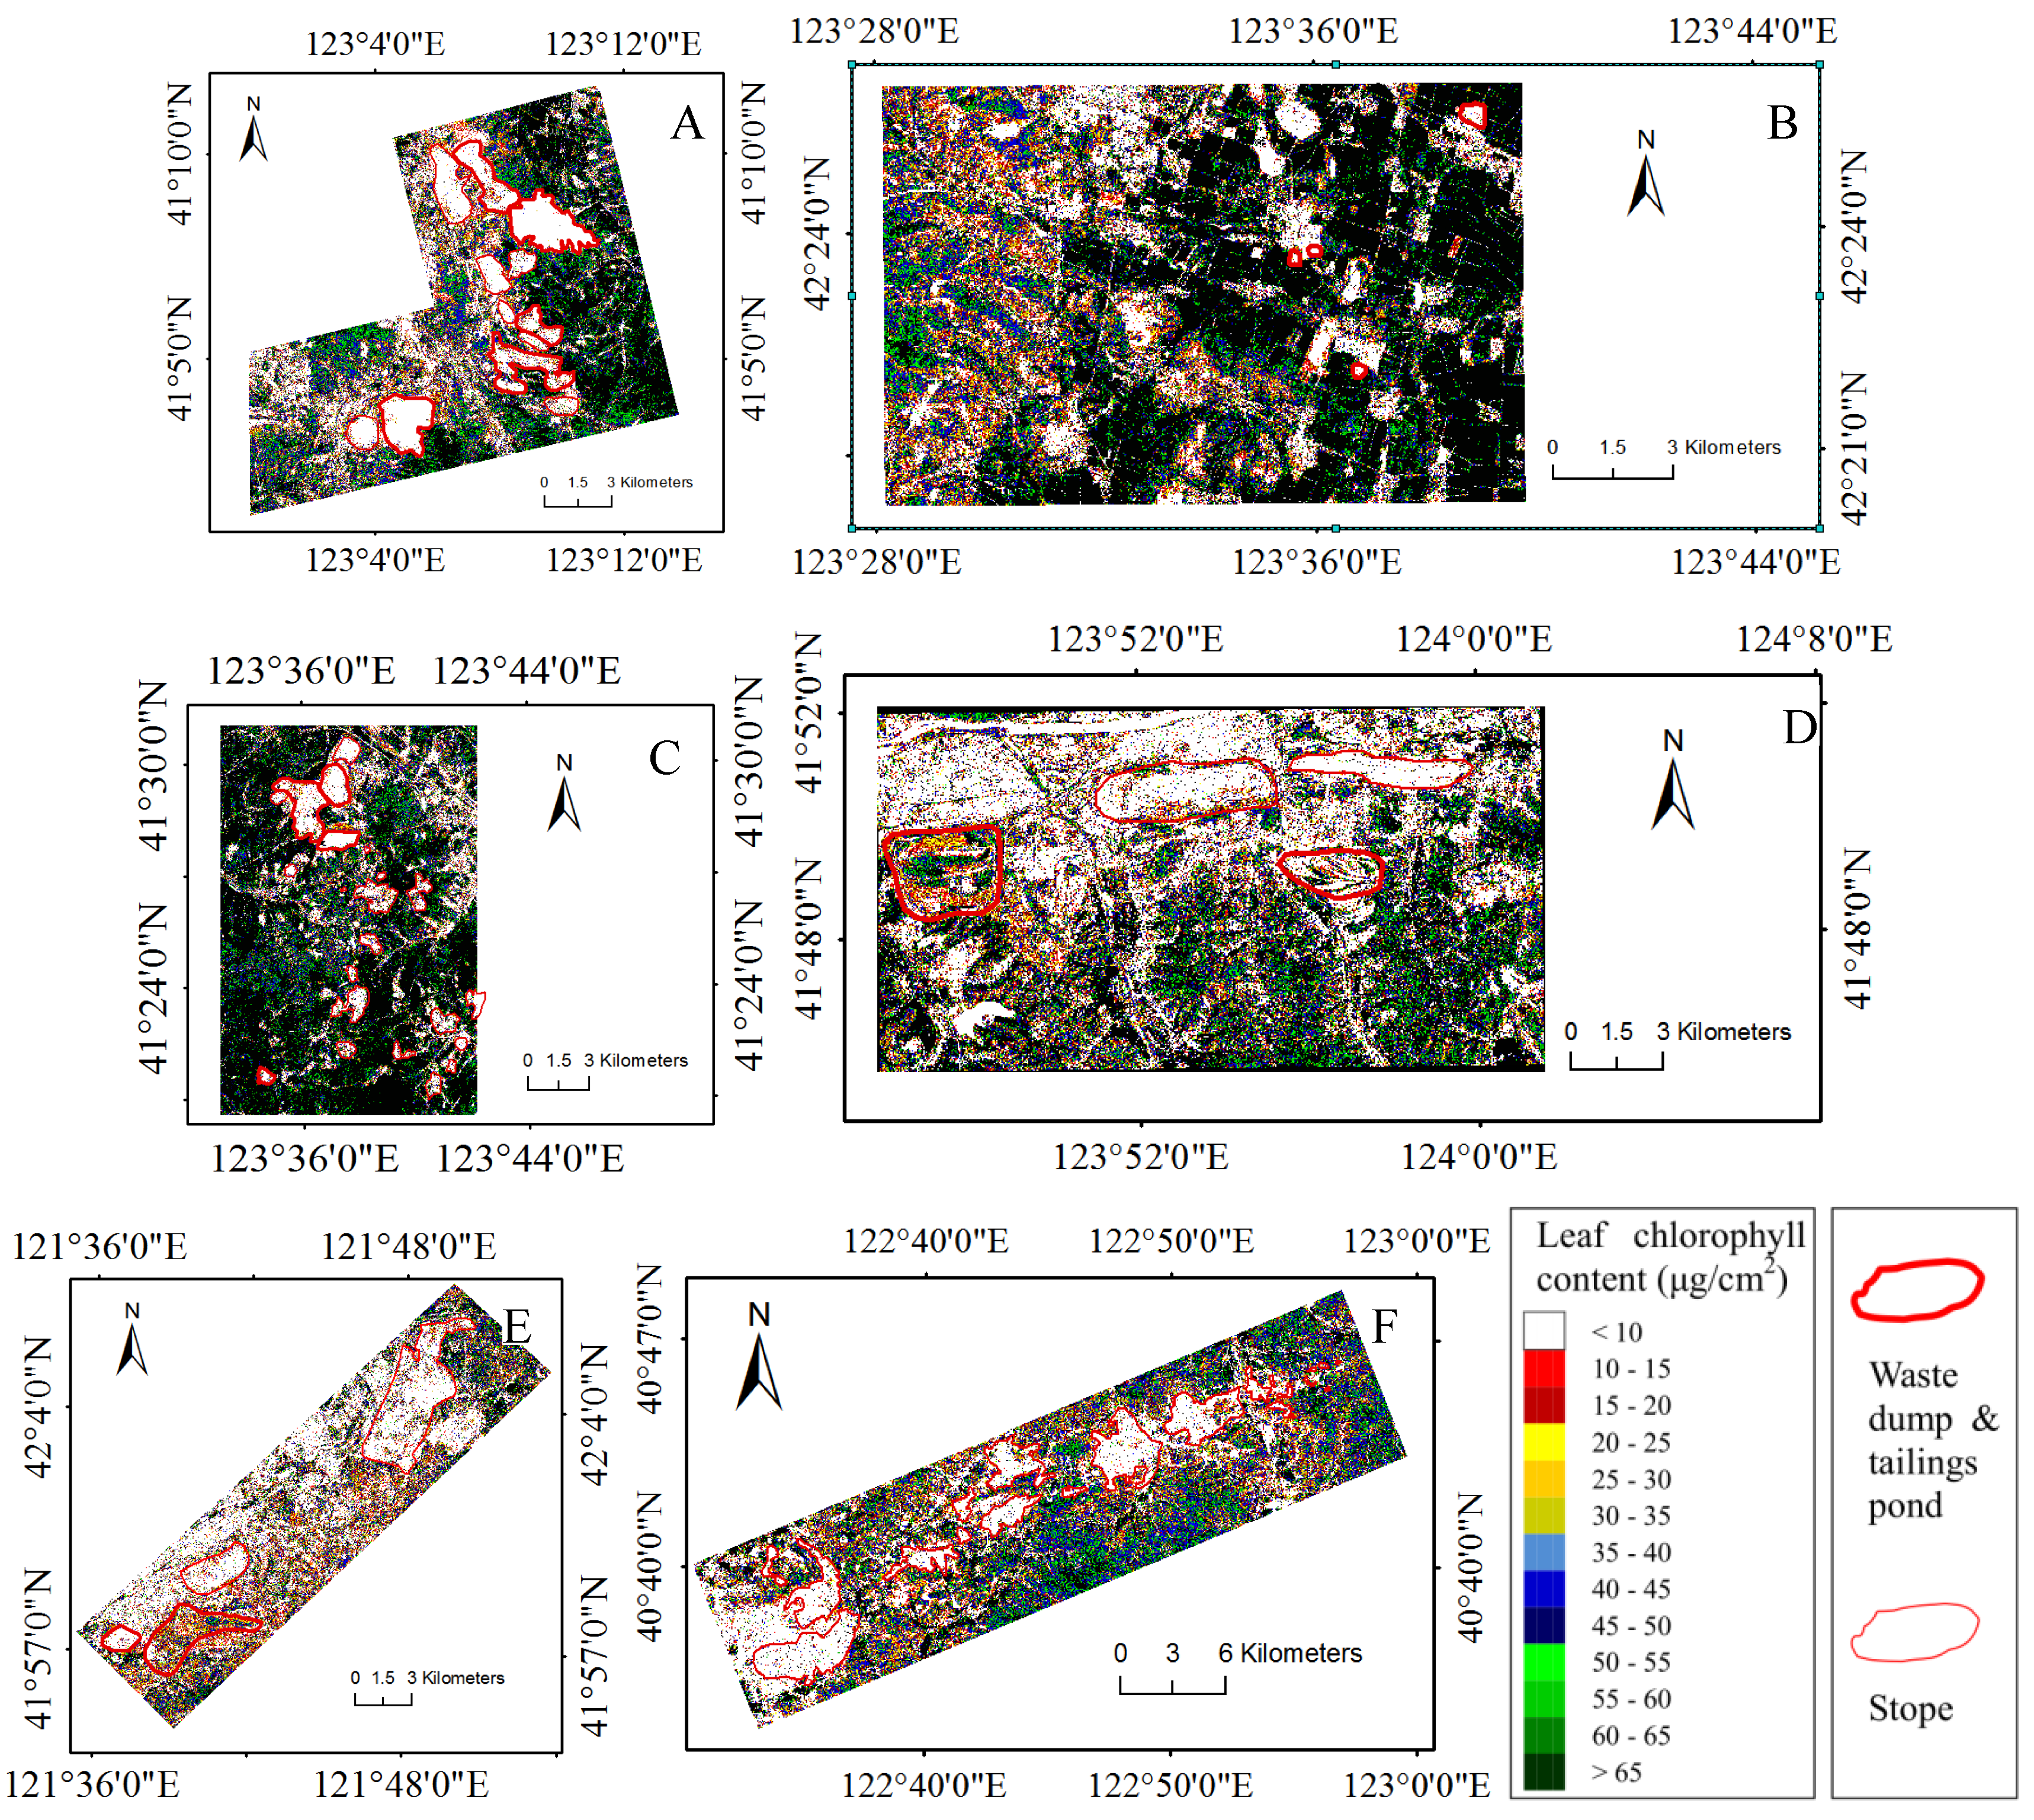
where y is leaf chlorophyll content (μg/cm2), and x is MTCI value in the image. To avoid the interference of non-vegetation pixels, the pixel of chlorophyll content would not be counted when the MTCI was lower than 1.41. To facilitate the analysis of spatial differences of chlorophyll content, each mining area was divided into mine and adjacent area. The chlorophyll content in mines (including stopes, waste dumps, and tailings ponds) was then compared with that in adjacent areas. The difference of chlorophyll content among the mines and adjacent areas was analyzed over the six mining areas.
4. Results
4.1. Change in Trend of Vegetation from 2000 to 2019
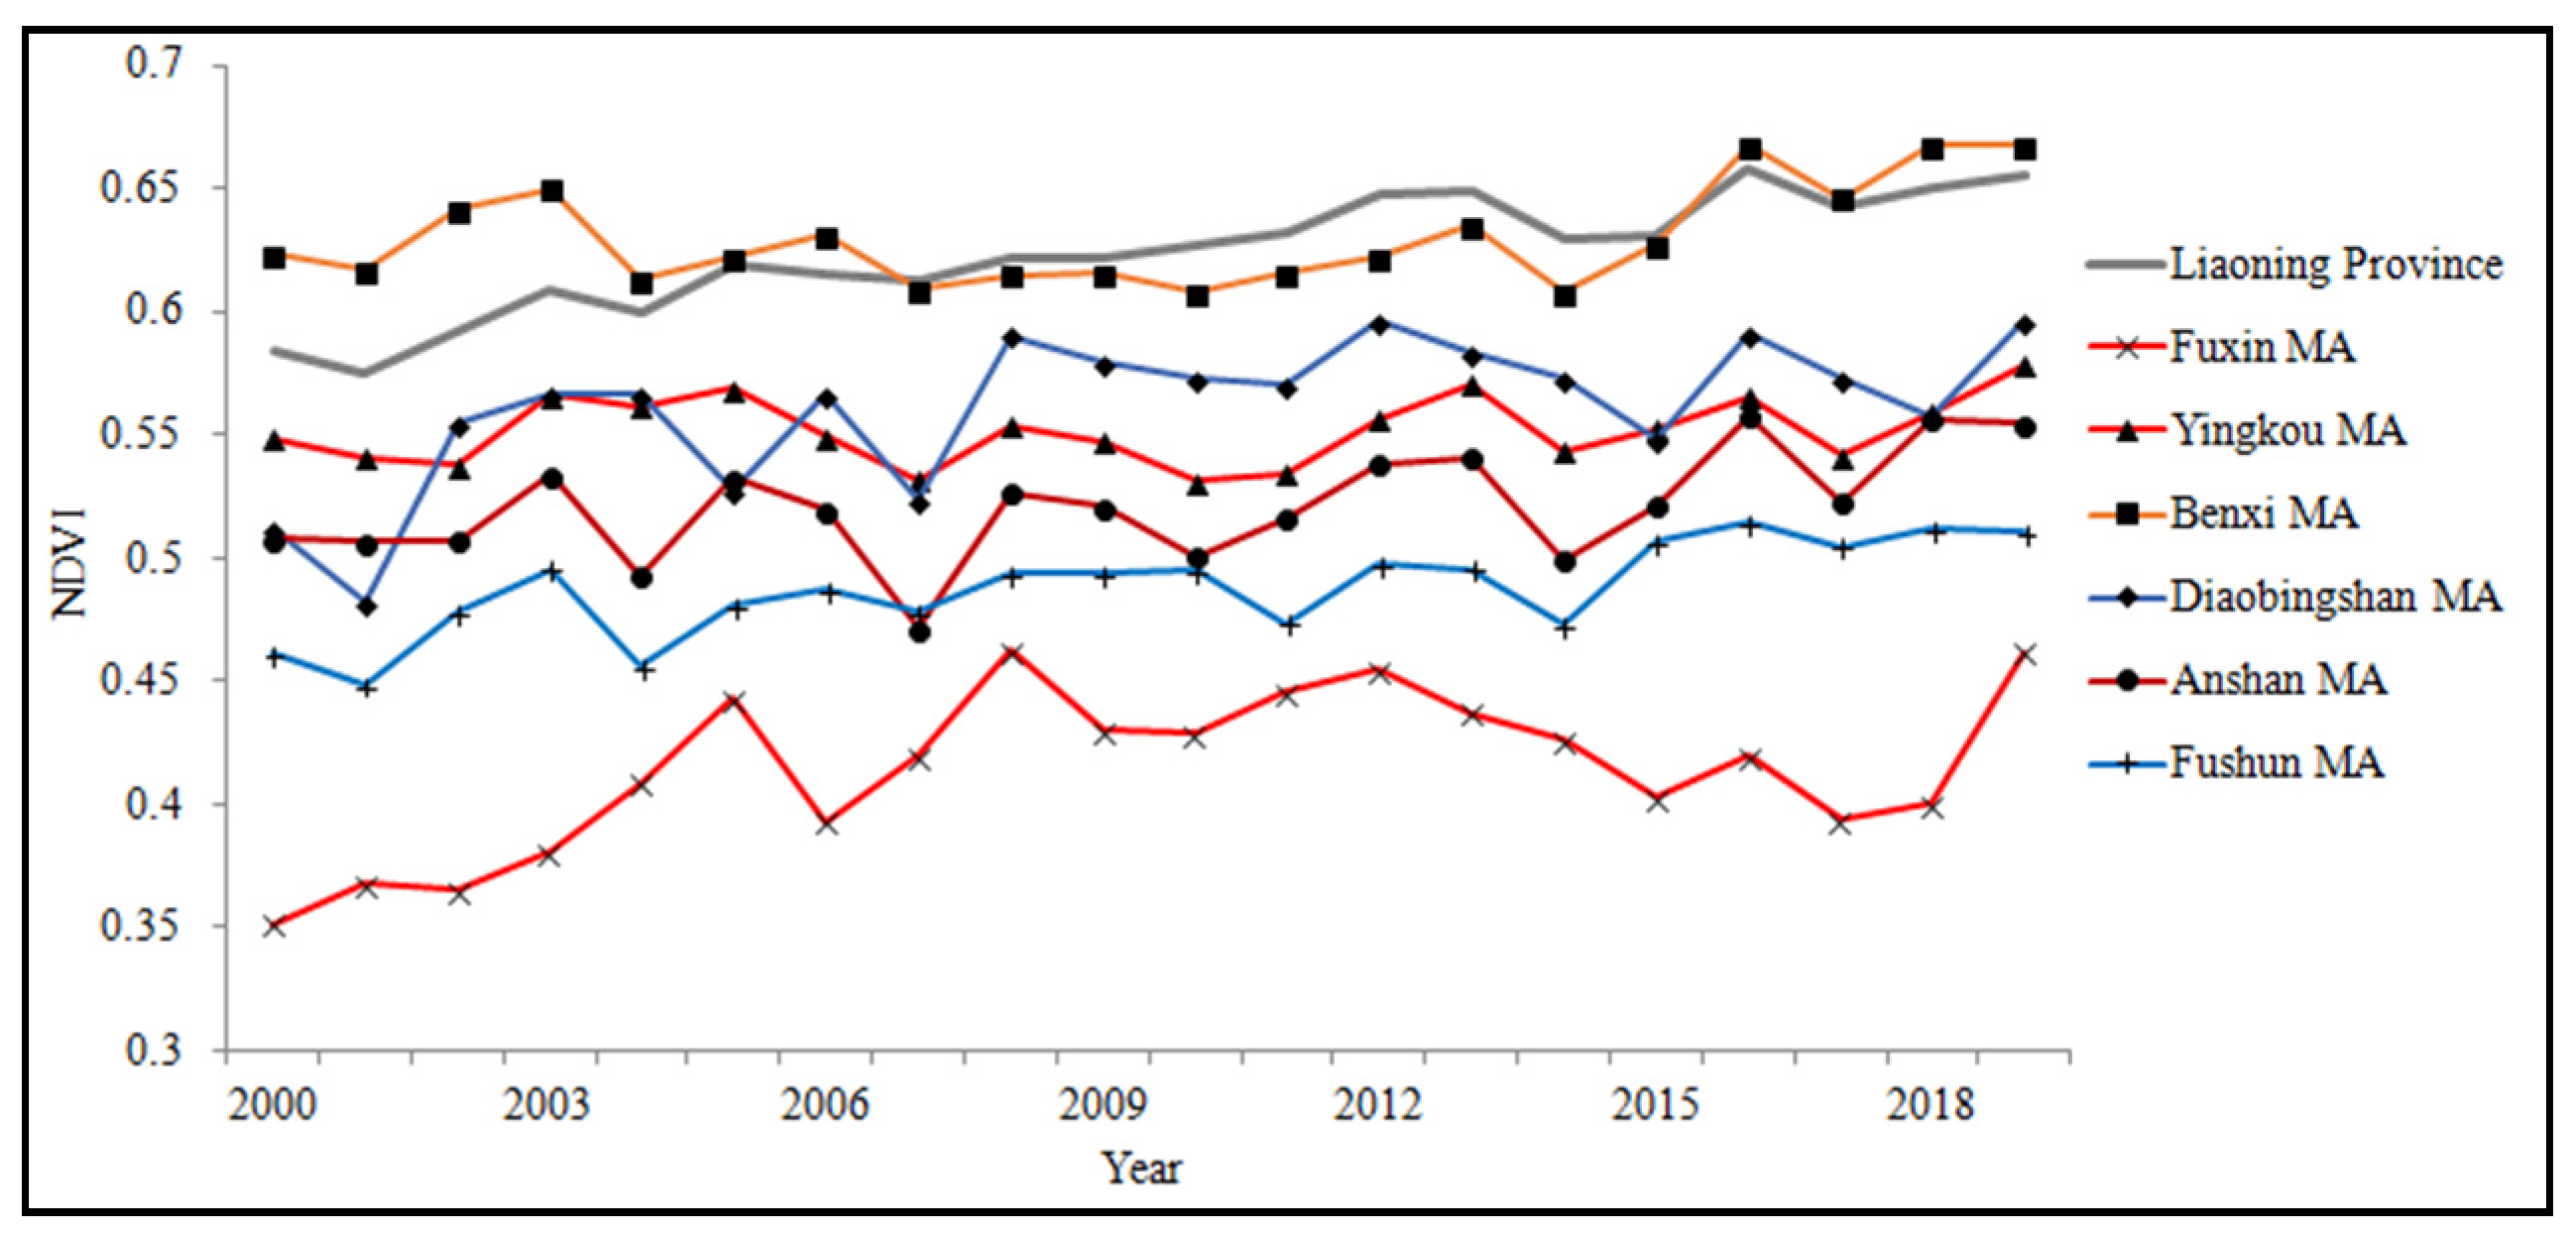
The trend of vegetation indices in each mining area was generated through linear regression analysis based on the mean MNDVI in the whole area (Figure 2, Table 3). The results showed that the fitted change slopes were 0.0021/y, 0.0016/y, 0.0031/y, 0.0024/y, 0.0029/y, and 0.0006/y for the Anshan, Benxi, Diaobingshan, Fushun, Fuxin, and Yingkou mining areas, respectively, over the past 20 years. In the Yingkou, Benxi, and Anshan mining areas, the slope was relatively low, indicating that the increasing trend of vegetation was slight. Furthermore, the coefficient of determination (0.066) was so low that it could not pass the significance test in the Yingkou, which means that the rate of vegetation change fluctuated greatly. However, the fitted slope and determination coefficient of the overall vegetation level in Liaoning Province were 0.0037 and 0.854, which were both larger than those of the six mining areas.
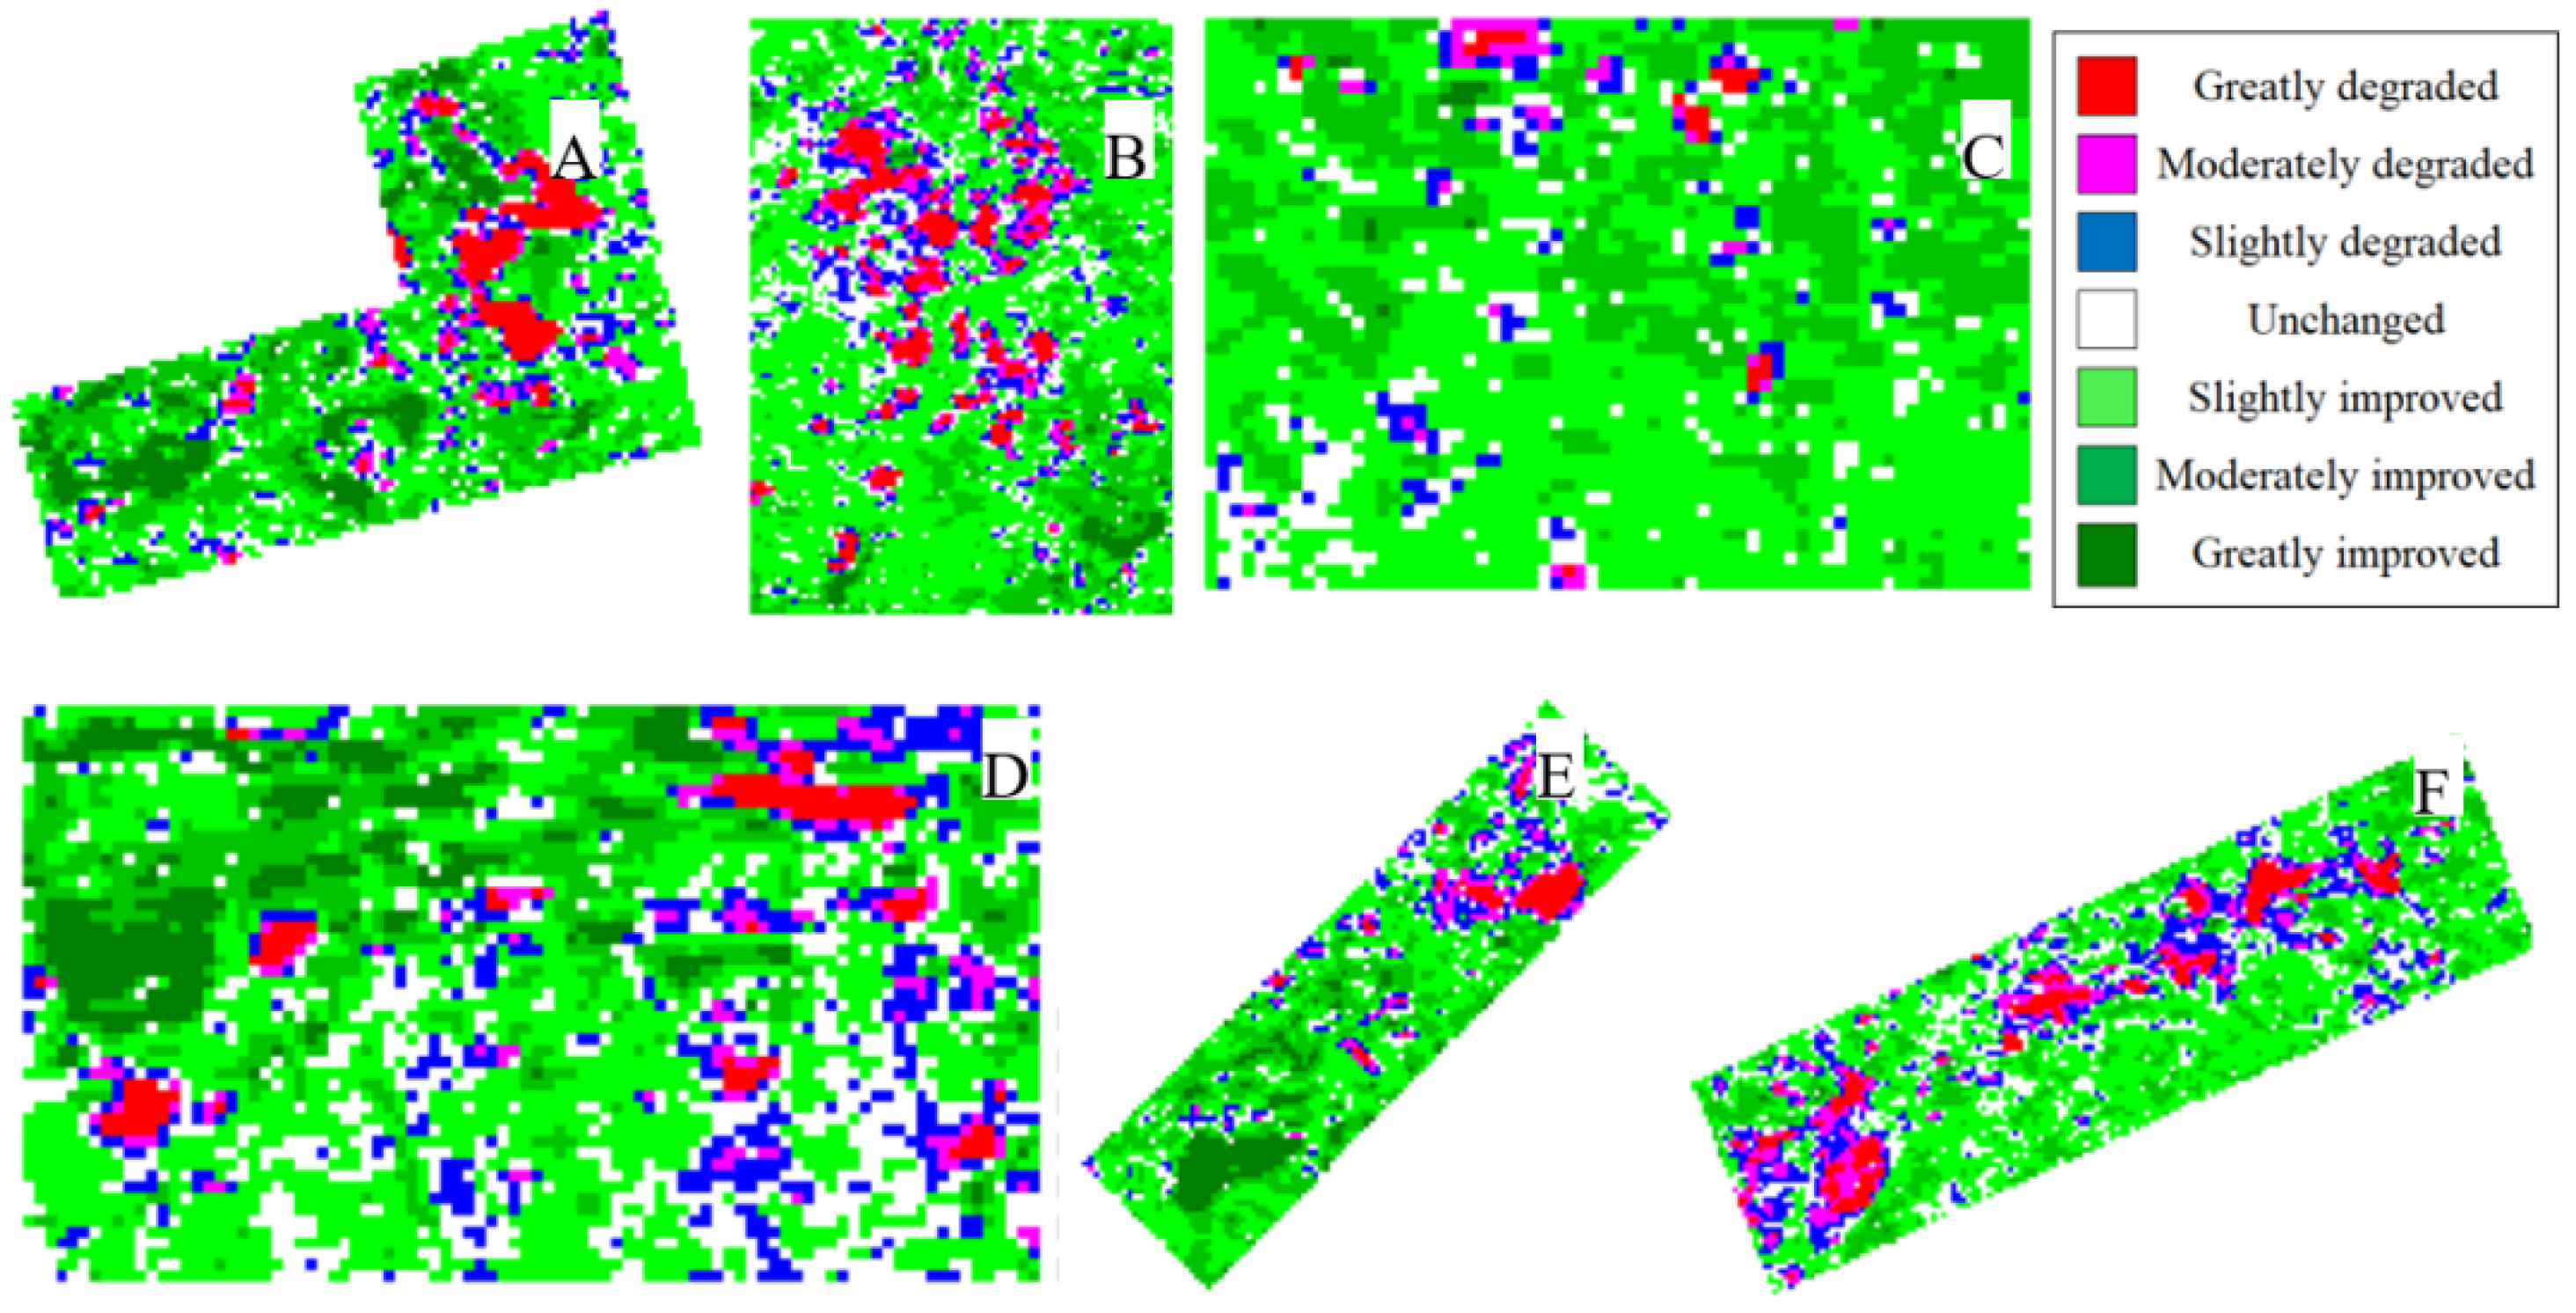
The spatial distribution map of vegetation change showed that the greatly degraded areas were mainly located in stopes, waste dumps, and tailings ponds (Figure 3). However, greatly improved areas were also mainly located in some waste dumps. The greatly degraded area was large in the Benxi, Yingkou, and Anshan mining areas, covering 22.083 km2, 23.203 km2, and 16.783 km2, respectively. In the Diaobingshan, Fuxin, and Fushun mining areas, the greatly degraded area was relatively small. The greatly improved area was large in the Anshan, Fushun, and Fuxin mining areas, covering 21.571 km2, 20.489 km2, and 16.098 km2, respectively. In the Benxi, Diaobingshan, and Yingkou mining areas, the greatly improved area was relatively small (Table 3).
4.2. Chlorophyll Content Distribution in Mining Areas
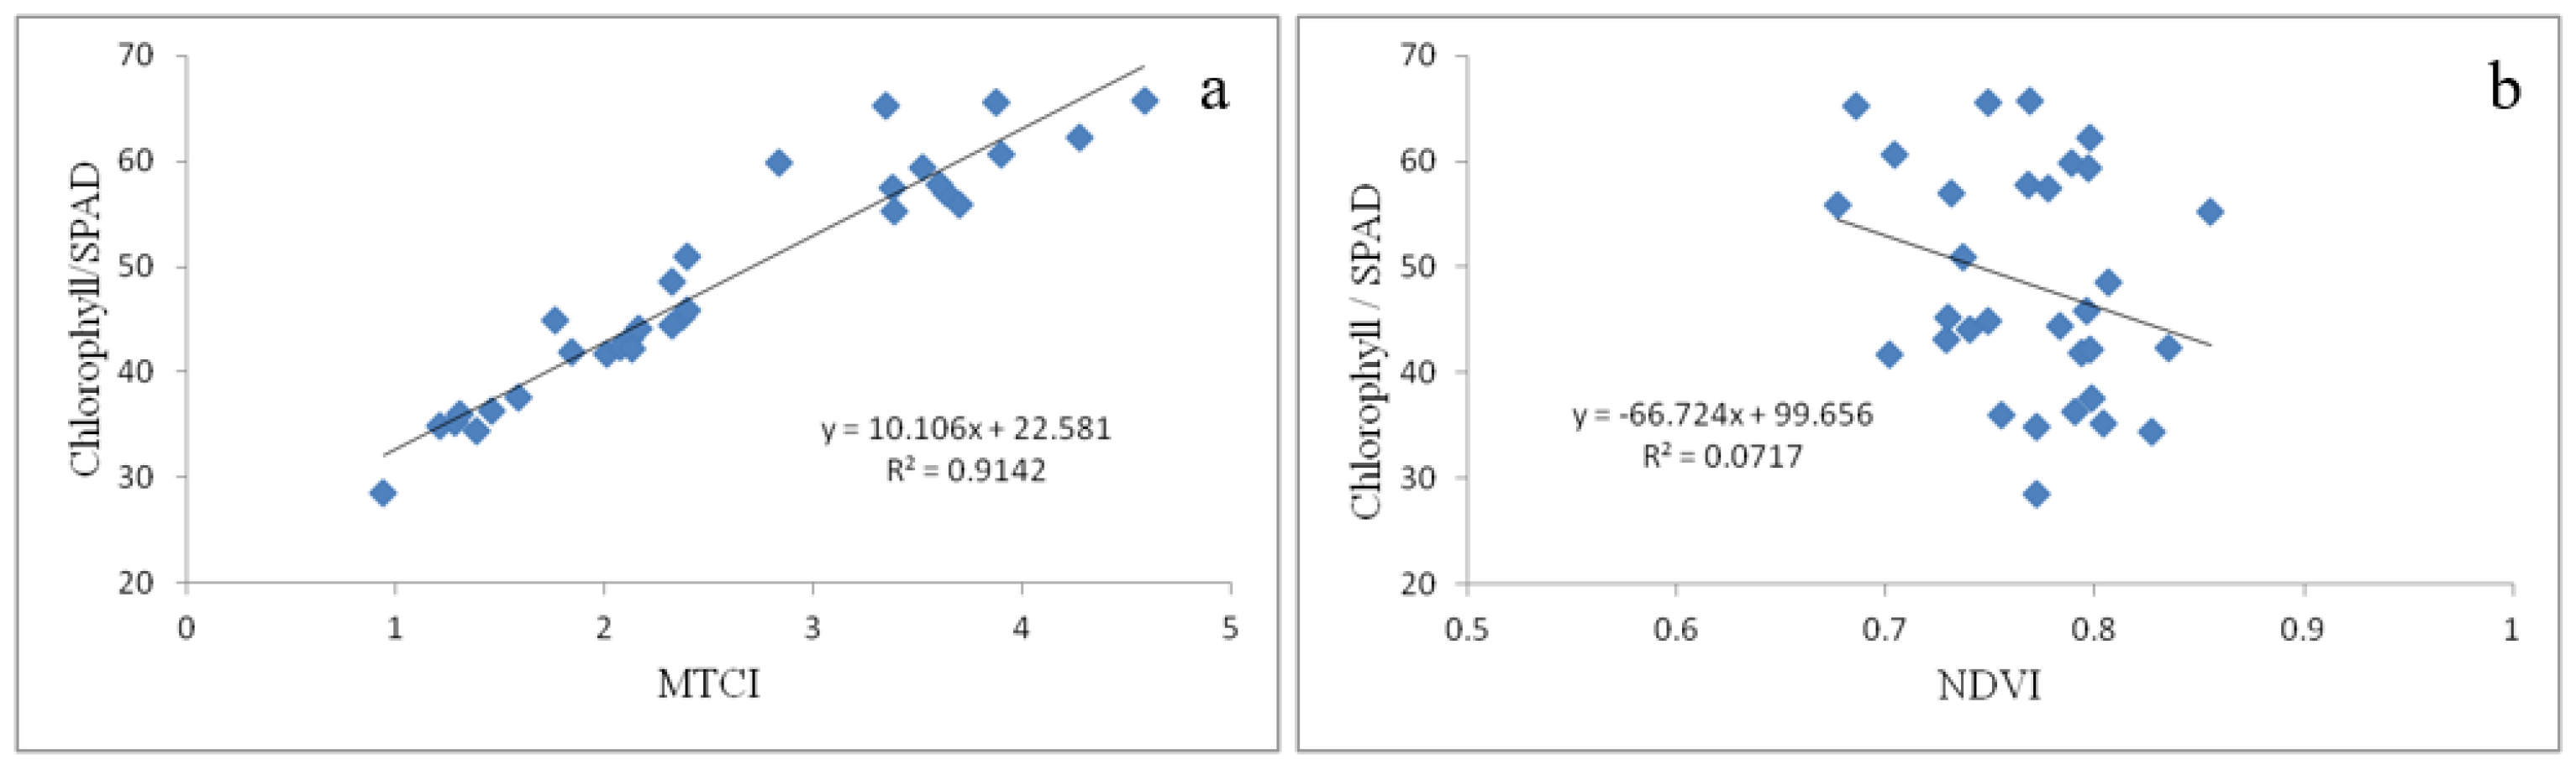
Based on the ground experiment, the relationship between MTCI, NDVI, and leaf chlorophyll content was derived. The correlation coefficient between MTCI and chlorophyll content is 0.956 (p < 0.01). However, the correlation coefficient between NDVI and chlorophyll content is −0.268, and it could not pass the significance test (Figure 4). The performance of MTCI and NDVI was in accordance with the results of the literature [44]. Thus, MTCI could be set as an index for estimating chlorophyll content. The leaf chlorophyll content was then estimated by using MTCI according to Equation (4). The leaf chlorophyll content for each mining area is shown in Figure 5.
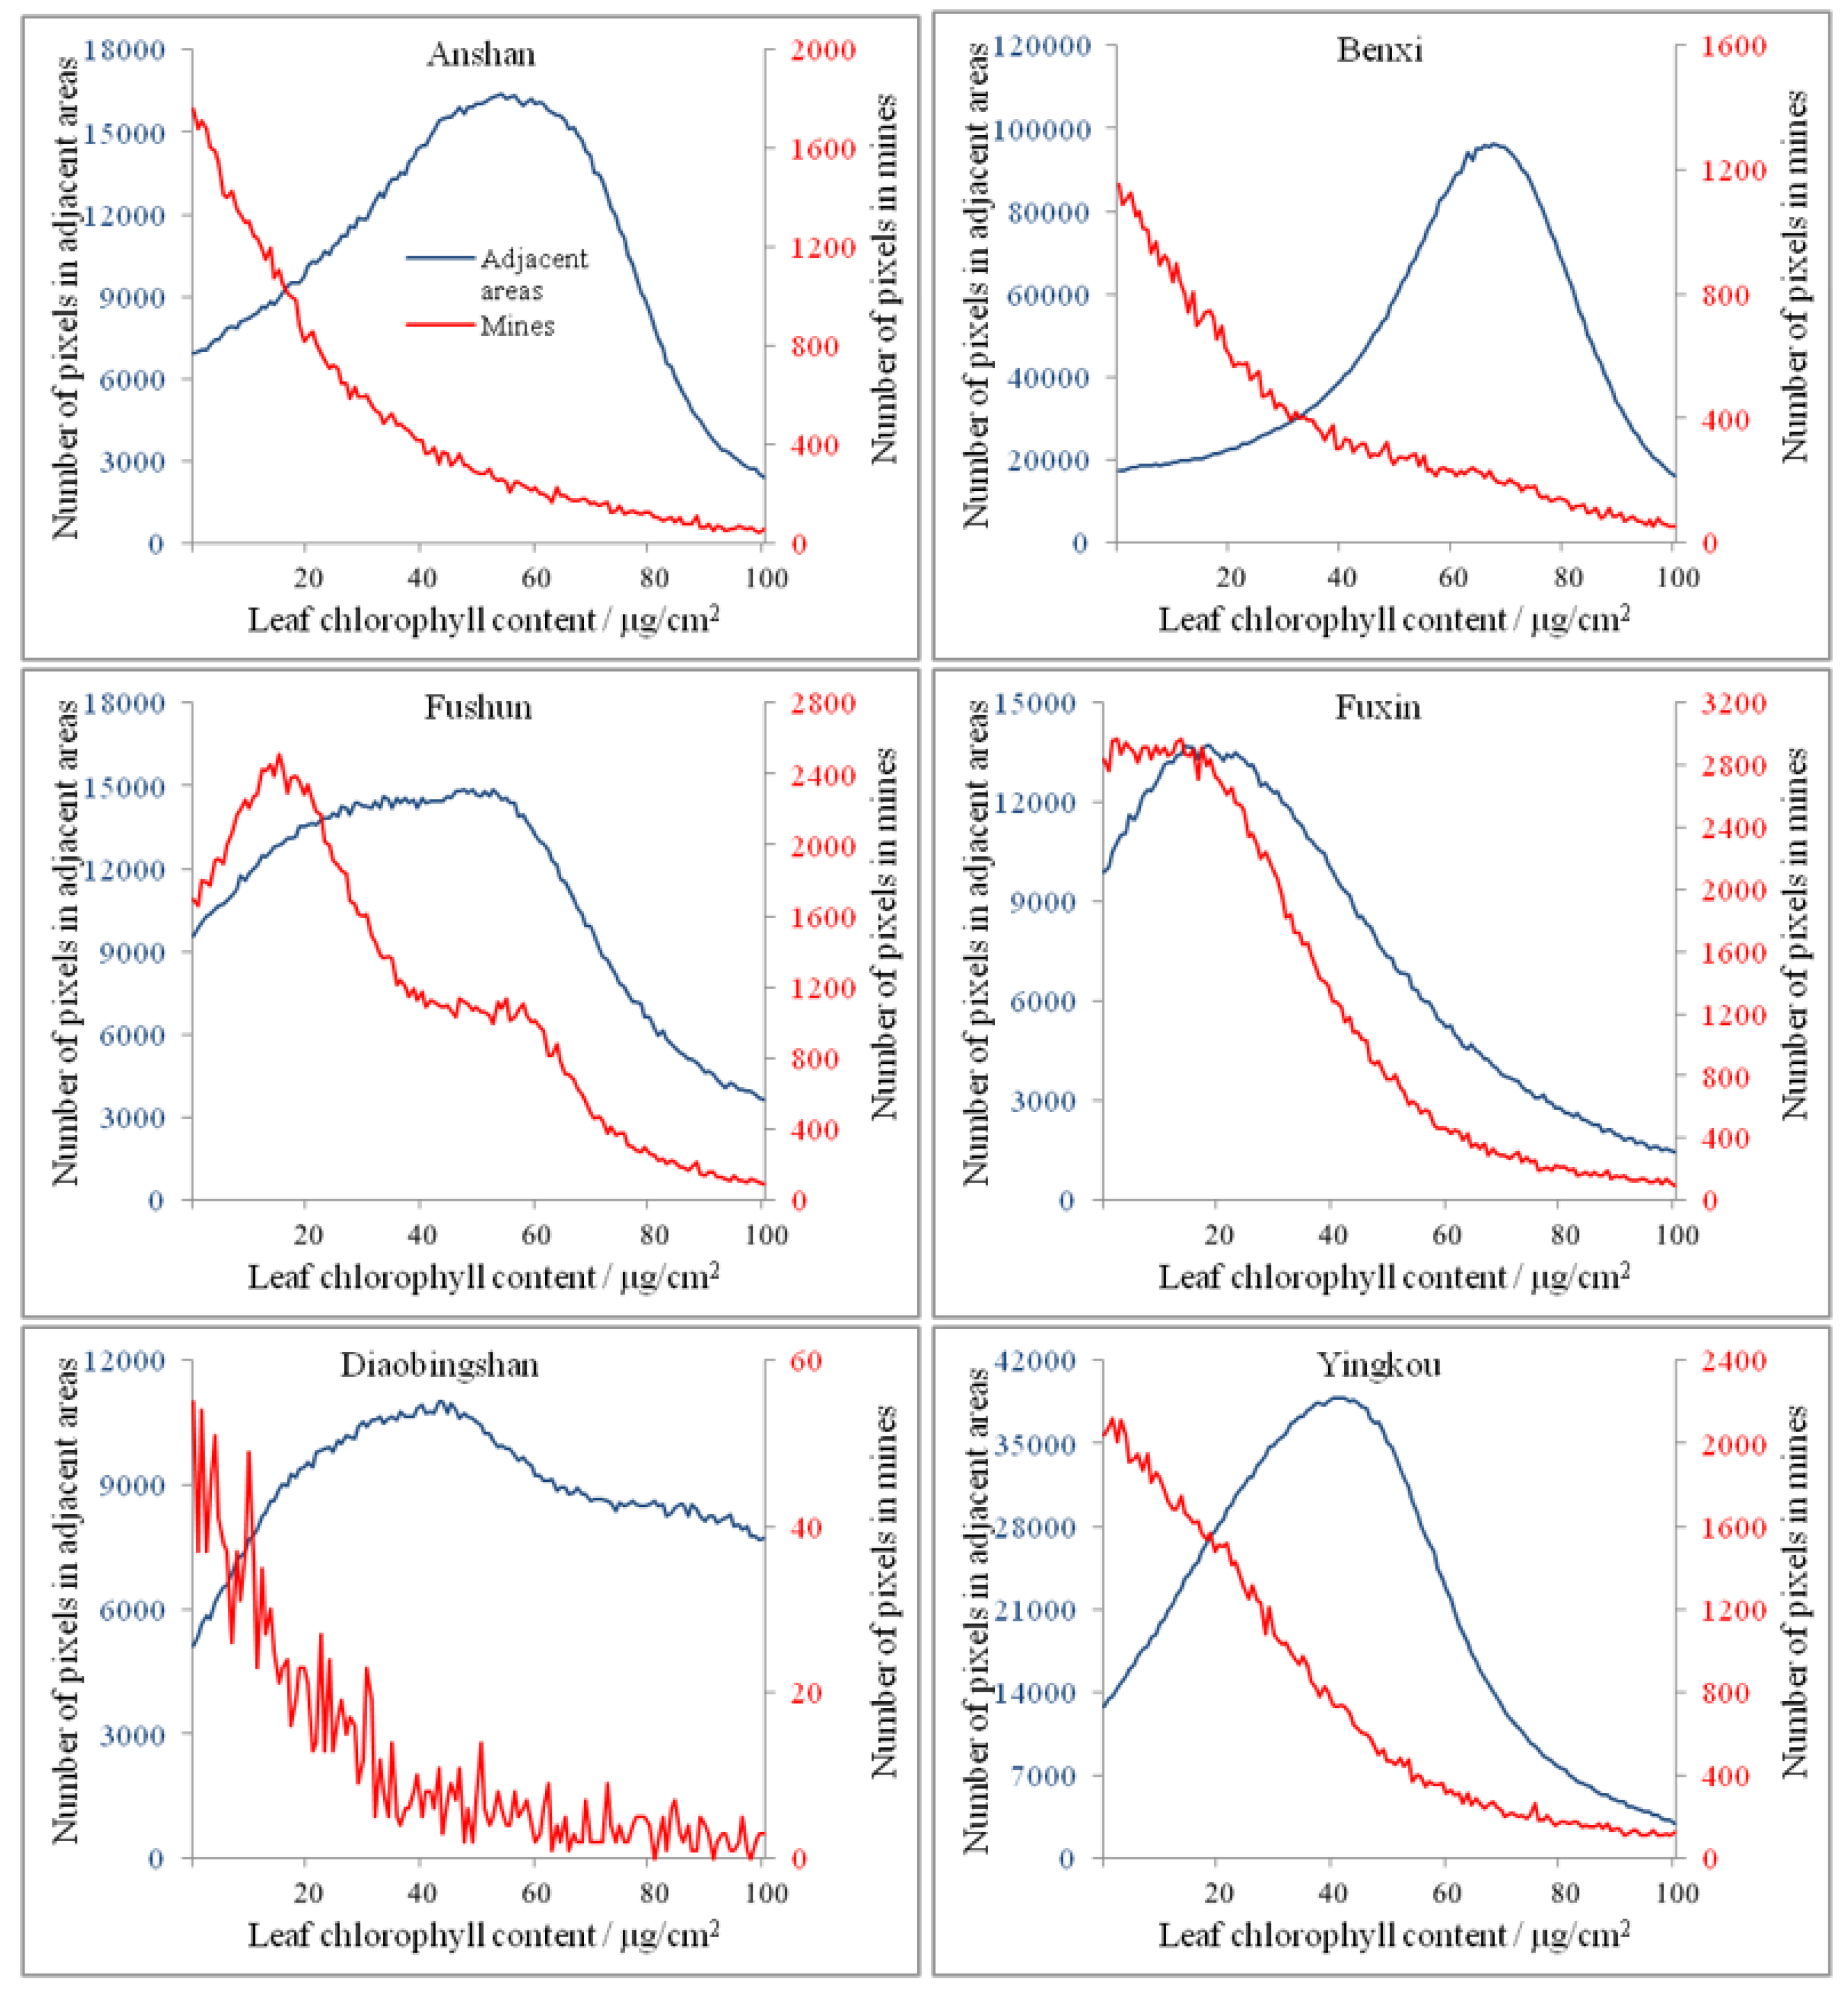
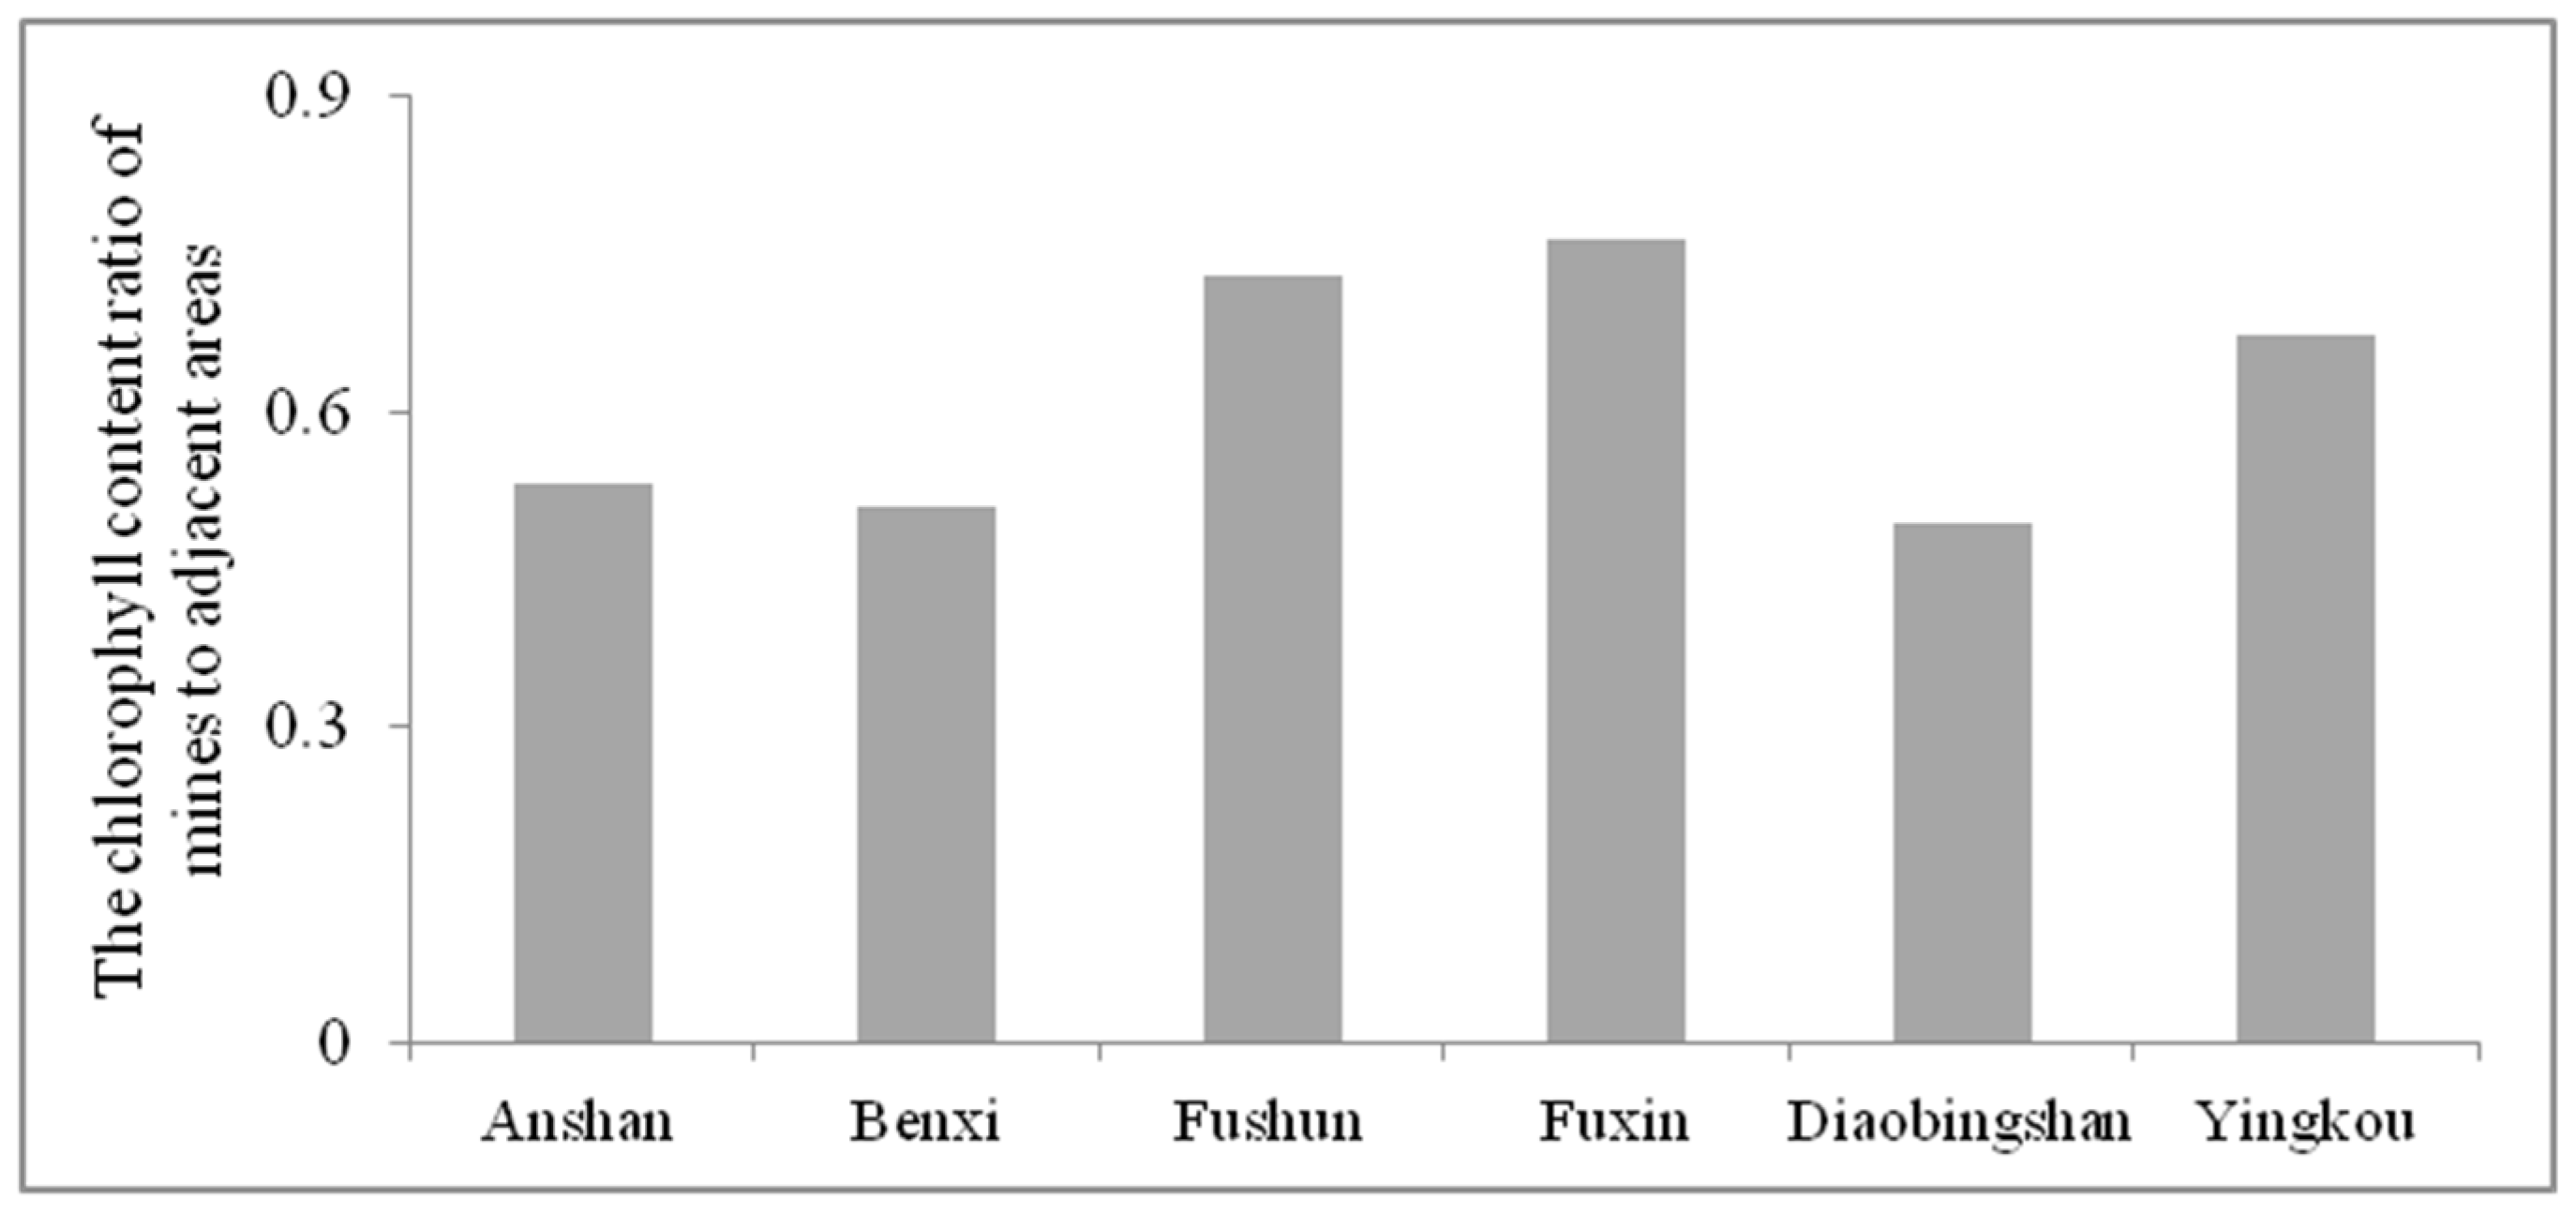
In each mining area, the chlorophyll content in mines (including stope, waste dump, and tailings pond) was compared with that in adjacent areas. The statistical results showed that the chlorophyll value of the pixels in the mines was generally lower than that in adjacent areas, and the histogram of the pixels presented a “left bias” shape (Figure 6). In contrast, the chlorophyll value in adjacent areas was generally higher, and the histogram of the pixels presented an approximate normal distribution. However, there were differences among these mining areas. In Fushun and Fuxin, the peak value of the histogram of mines shifted to right, and the histogram shape was more similar to adjacent areas. It indicated that the chlorophyll content of vegetation in mines was close to adjacent areas. Furthermore, the ratio of average chlorophyll content in mines to adjacent areas was selected to describe the differences (Figure 7). It was found that the ratio in Fushun, Fuxin, and Yingkou was greater than that in the other three mining areas. In Fushun and Fuxin, the ration was consistent with above histogram results. In Yingkou, the ratio was greater because the peak value of the histogram of the adjacent area shifted to the left, which meant that the average chlorophyll content in the adjacent area was relatively low in Yingkou.
5. Discussion
5.1. Natural Factors for Vegetation Change in These Mining Areas
The driving forces that lead to vegetation change include natural and human factors. Precipitation and temperature are considered as the main limiting natural factors for vegetation growth [45]. For Liaoning Province as a whole, the MNDVI change is highly correlated with precipitation (r = 0.420, p < 0.1) but weakly correlated with temperature (r = −0.014) (Table 4). For the six mining areas, the correlation between vegetation change and precipitation is strong in the Fuxin (p < 0.01) and Diaobingshan (p < 0.05) mining areas. This indicates that vegetation is affected by precipitation in those two mining areas. In other words, mining activities have a weak effect on the vegetation there. In the Fuxin mining area, the coal resources are exhausted, and the mining activities are no longer intensive, so the vegetation is not affected by mining activities. In the Diaobingshan mining area, underground mining has a weak effect on vegetation.
The correlation between vegetation change trend and precipitation was weak in the Anshan, Benxi, and Yingkou mining areas, which indicates that precipitation has a slight effect on the vegetation change in those three areas. Moreover, the relationship between vegetation and precipitation is consistent with a greatly degraded vegetation area (Table 3 and Table 4). The smaller the area of degraded vegetation is, the stronger the relationship with precipitation.
5.2. Ecological Restoration for Vegetation Change in These Mining Areas
According to the results of vegetation change, the greatly improved vegetation area is 21.571, 20.489, and 16.098 km2 in Anshan, Fushun, and Fuxin mining areas, respectively. It is mainly due to ecological restoration for these areas. Coal began to be mined approximately one hundred years ago in Fuxin and Fushun. At the end of the last century, coal resources were exhausted in these areas. As a result of long-term, high-intensity, and open-pit mining, huge pits and coal gangue dumps were formed in these areas. For example, the open pit is 4 km long and 2 km wide, and area of the coal gangue dump is 16 km2 in Haizhou Surface Mine in Fuxin; and the open pit is 6.6 km long and 2.2 km wide, and area of the coal gangue dumps is 12.9 km2 in Xilutian Mine in Fushun. Since the beginning of this century, large-scale reclamation activities have been carried out in these areas. After reclamation, the abandoned pits and dumps were covered by woods (such as Ulmus pumila, Robinia pseudoacacia, Amorpha fruticosa) and grass (such as Vitex Chinensis, Ostryopsis davidiana, Imperatacy lindrical, Themeda japonica, Arrndinella hirta).
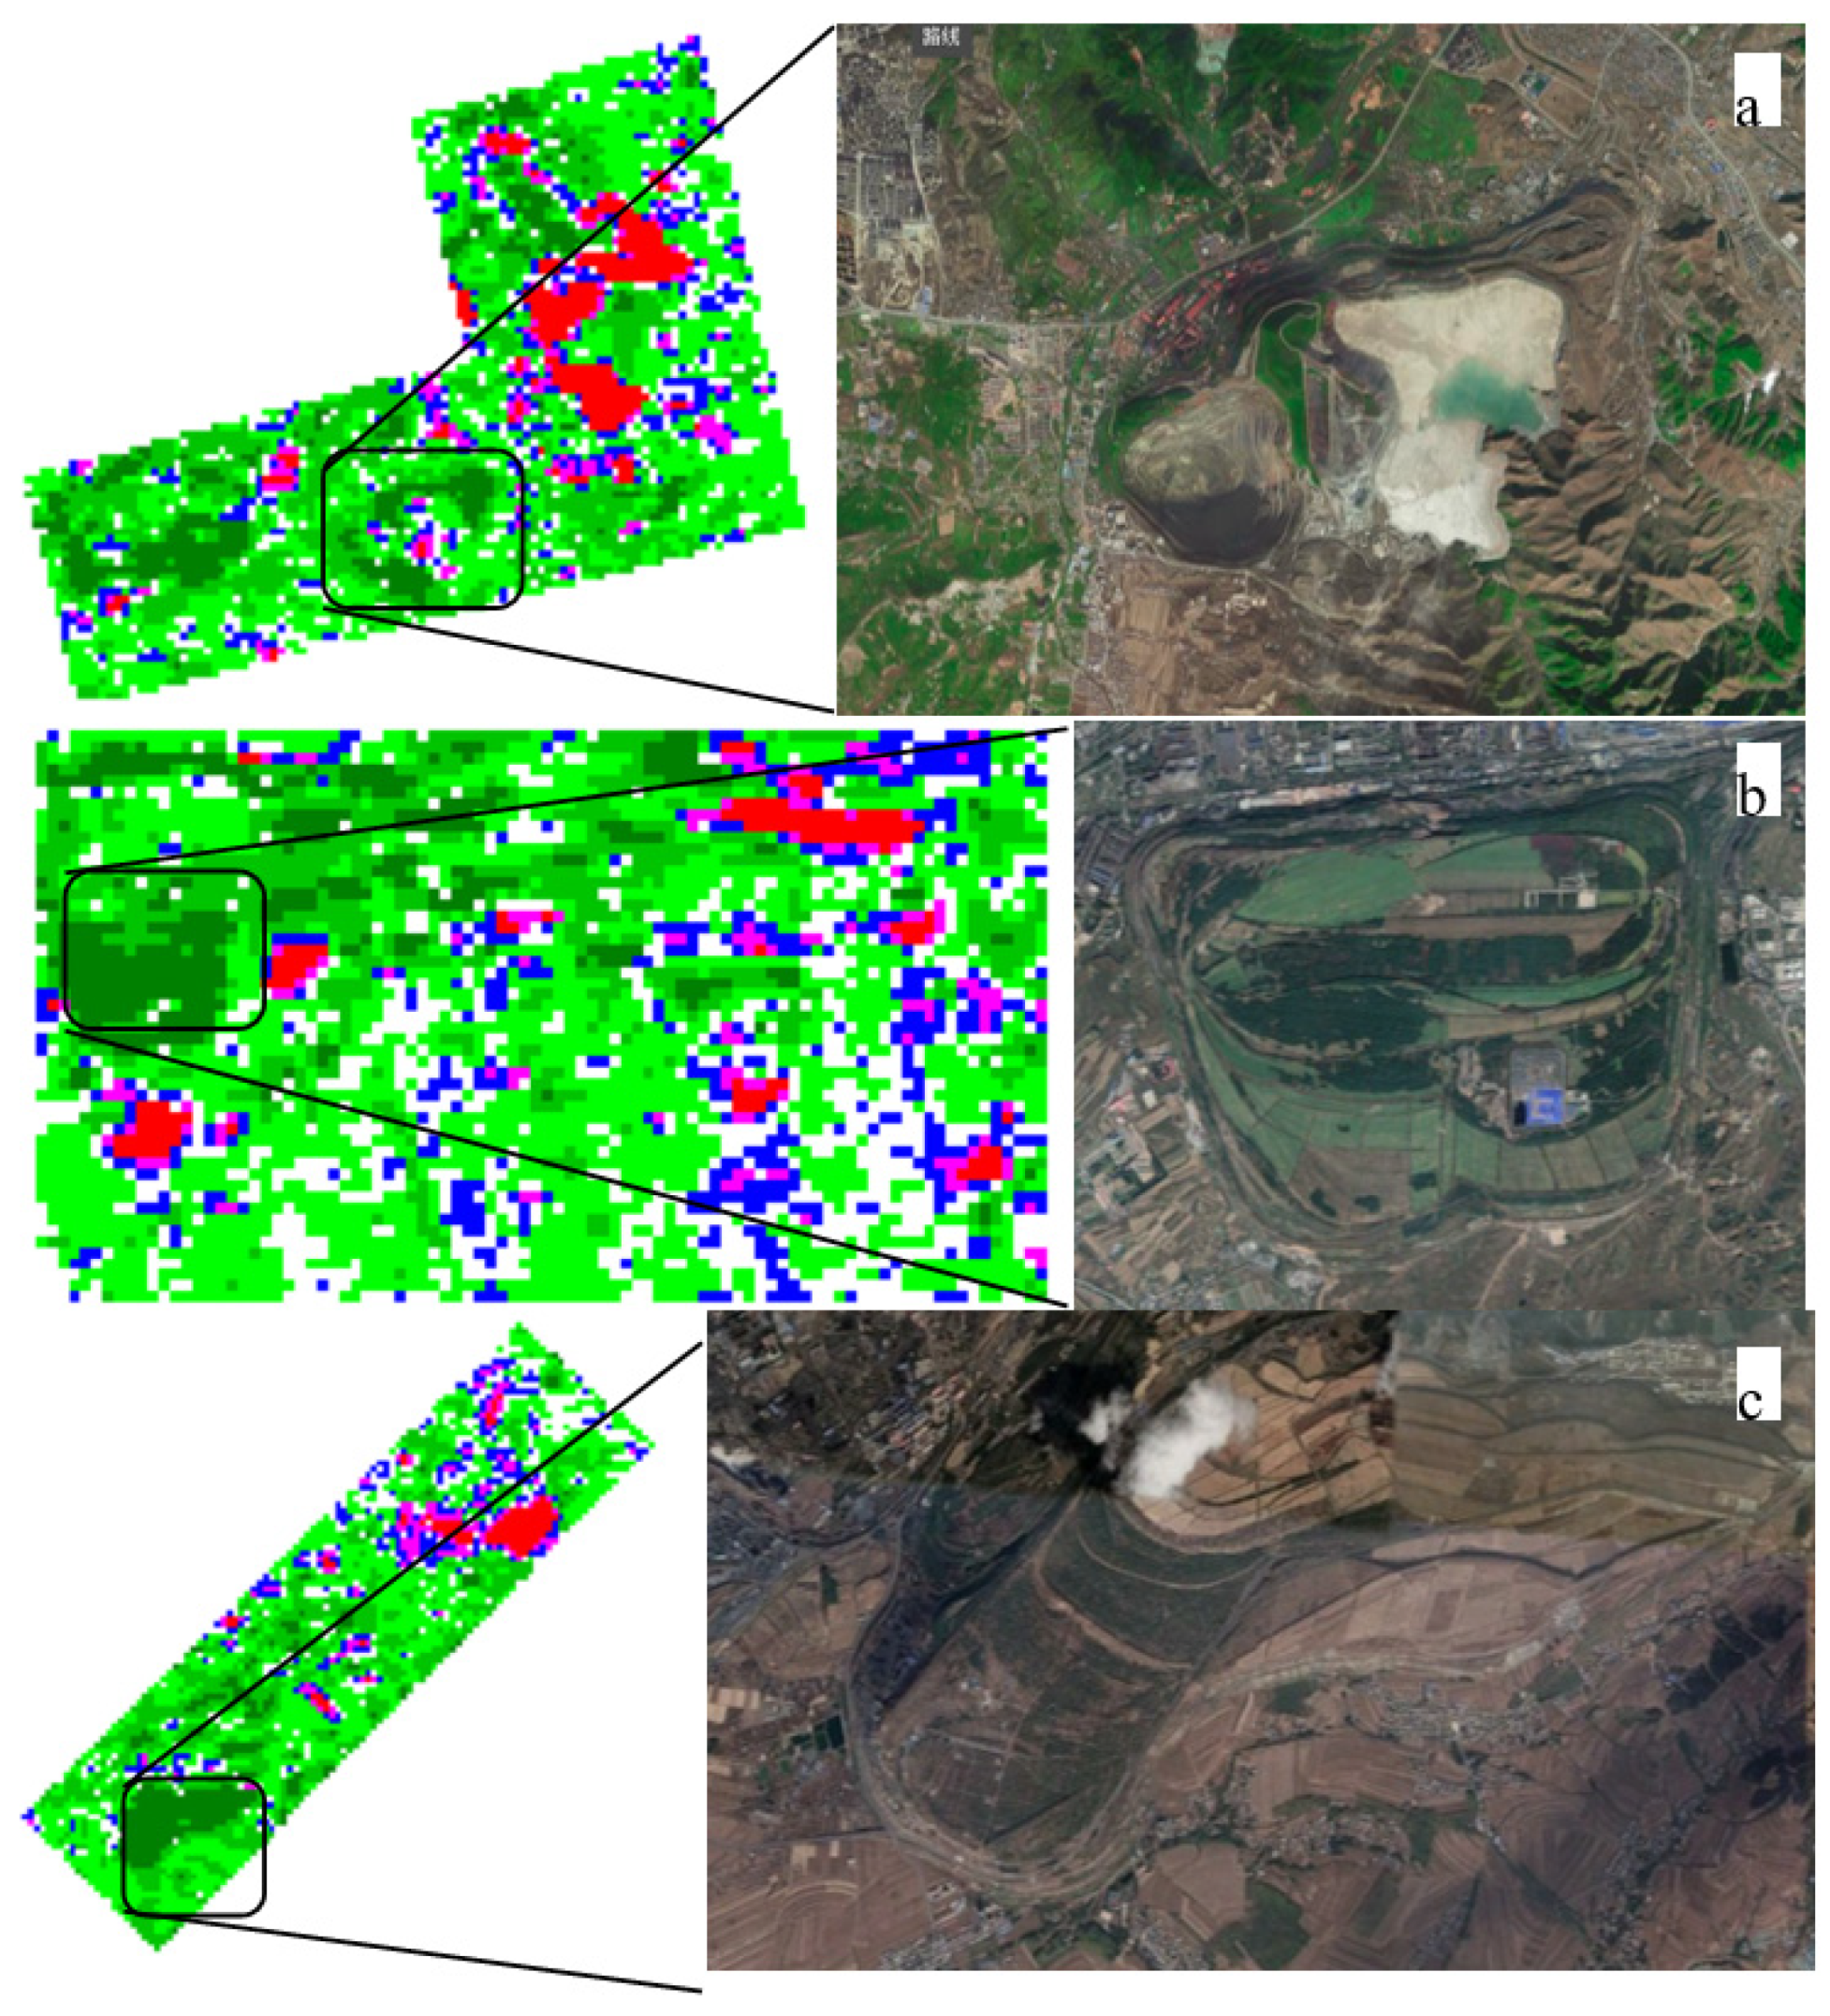
Similar to coal mining in Fuxin and Fushun, iron ore mining has a long history with more than 100 years in Anshan. At present, there are approximately 8.8 km2 pits and 38.9 km2 tailings ponds and dumps around Anshan City. In the last 10 years, some efforts were made to cover these mining sites with vegetation. The Green Mine Programme (GMP), which aims to restore vegetation for mined mountains, was initiated in 2011 in Liaoning Province. From 2012 to 2015, 846 mines were managed with a total area of 48.33 km2. Due to these efforts, in this study, greatly improved vegetation was found in waste dumps (Figure 8). In addition, the greatly improved vegetation area is 2.136, 0.824, and 0.741 km2 in Yingkou, Diaobingshan, and Benxi mining areas, respectively. The mines are in service in these areas and less reclamation activities were carried out.
5.3. Destruction and Pollution of Vegetation by Mining Activities
Mining activities are the main cause of vegetation degradation in these mining areas. In the stopes of open-pit mines, vegetation is destroyed by mining ore. In waste dumps, vegetation is occupied by waste and tailings. Among the six mining areas, Fushun and Fuxin are coal-exhausted. Due to low-intensity mining activities, the greatly degraded vegetation area is 7.126 km2 in Fushun and 5.997 km2 in Fuxin. Diaobingshan is a coal mining area with underground mining, and vegetation there is not obviously affected by mining activities aside from some coal gangues. Thus, the greatly degraded vegetation area is only 1.479 km2 in Diaobingshan. On the contrary, mining activities are high-intensity in Anshan, Benxi, and Yingkou mining areas, where the annual output of iron ore is more than 1.7 × 10⁸ t and magnesite ore is more than 1.3 × 10⁷ t. Thus, the greatly degraded area is larger in these three mining areas, with 16.783 km2 in Anshan, 22.083 km2 in Benxi, and 23.203 km2 in Yingkou.
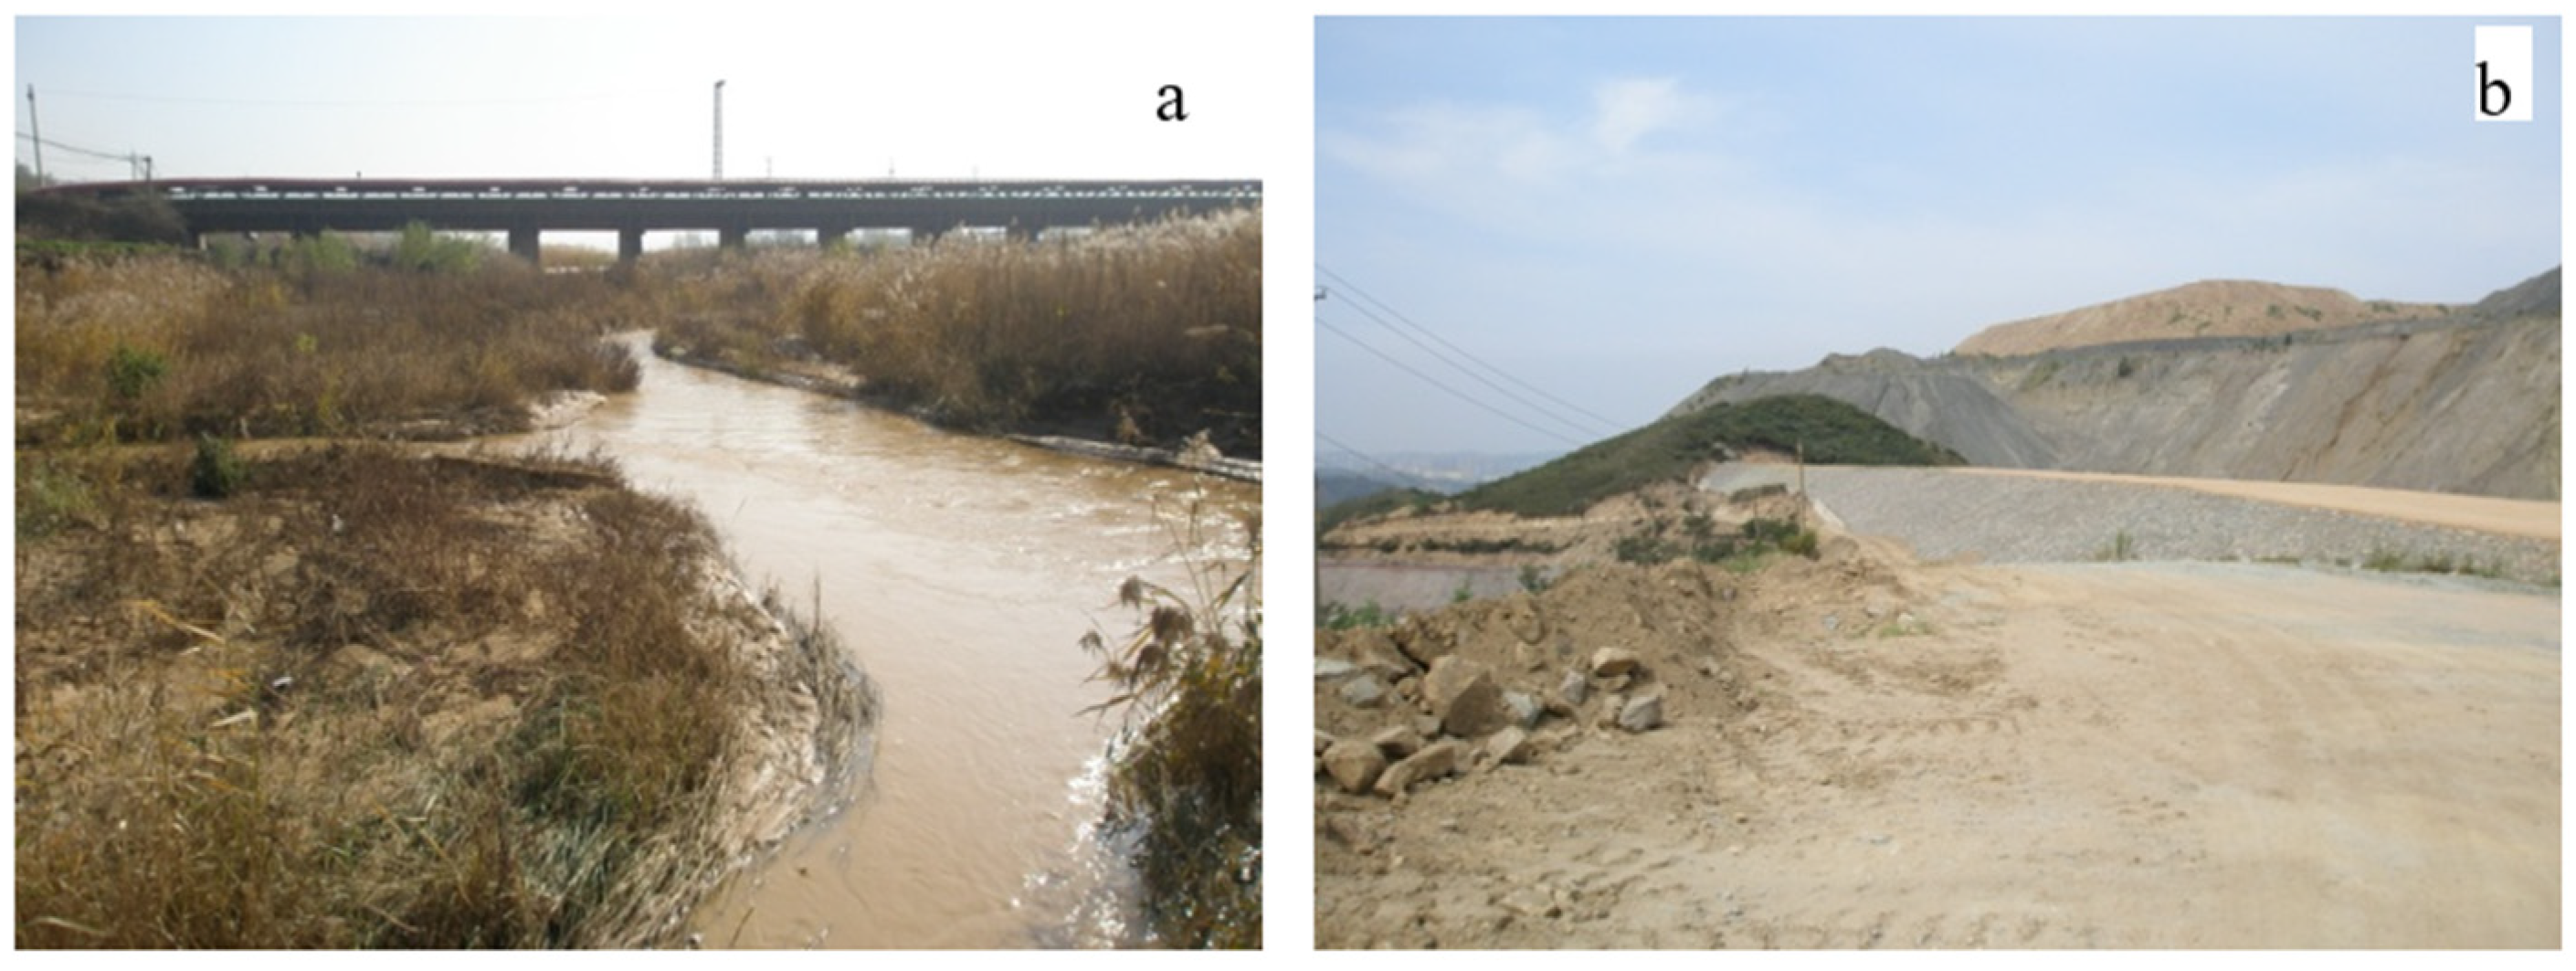
Aside from direct effects of mining, vegetation around mines may be stressed by pollution that enters the environment from mining activities. There are some stress factors in active mining areas, such as dust pollution and water pollution (Figure 9). This phenomenon is obvious in the active, open-pit mining areas, such as Yingkou, Anshan, and Benxi. Deposited dust would cause soil hardening, pollution, and blockage of leaf stomata, and then the leaf chlorophyll content would be reduced for the reclaimed vegetation. Thus, the corresponding histogram of the pixels presented a “left bias” shape in mines in Anshan, Benxi, and Yingkou (Figure 6). Furthermore, the impact would extend to adjacent areas with the spread of pollutants in some mining areas. For example, in Yingkou mining area, 1.4 × 10⁵ t dust is emitted during the mining and sintering process each year, and it contains much magnesium carbonate and magnesium oxide [46]. The vegetation in the adjacent areas would be disturbed by the diffused dust. Compared with Anshan and Benxi, the average chlorophyll content in adjacent area was relatively low in Yingkou for this reason (Figure 6 and Figure 7).
6. Conclusions
Mining activities can affect vegetation directly and indirectly. To quantitatively determine the effect, MODIS NDVI and Sentinel-2A data were used to monitor the vegetation change in six mining areas in Liaoning Province, North China. The conclusions are as follows.
(1) MODIS NDVI time series data were used to monitor the vegetation from 2000 to 2019 using a change trend analysis method. Over the full 20 years, the overall trend of vegetation in mining areas was positive, but it was lower than the average for all of Liaoning Province. Open-pit mining activities have a greater impact on vegetation than underground mining. Vegetation was highly degraded in the Yingkou, Benxi, and Anshan mining areas due to intensive mining activities there. Vegetation degradation was much less notable in the coal-exhausted Fushun and Fuxin mining areas and was not obvious in the Diaobingshan mining area because of underground mining.
(2) Sentinel-2A data were used to infer leaf chlorophyll content by using MTCI in the mining areas. The leaf chlorophyll content in the mines was generally lower than adjacent areas in the six mining areas, but there were individual differences among these mining areas. In the Yingkou mining area, the chlorophyll content in adjacent areas was close to the magnesite mines, which meant the spillover effect of environmental pollution in mines should be considerable. In the Anshan, Benxi, and Diaobingshan mining areas, the environmental stress on adjacent areas was slight.
(3) According to the remote sensing results, the disturbance to vegetation was limited in the resource-exhausted open-pit coal mines and underground coal mines. Land reclamation should be enhanced to improve vegetation in active open-pit mining areas, such as Anshan, Benxi, and Yingkou. Furthermore, environmental protection measures should be enhanced to relieve the vegetation stress around the mines in the Yingkou mining area. Essentially, iron and magnesite open-pit mines should focus on vegetation destruction and stress caused by high-intensity mining activities and pollution.
Author Contributions
Conceptualization, B.M.; Data curation, B.M., X.Y. and Y.Y.; Formal analysis, B.M., X.Y. and Y.Y.; Funding acquisition, Y.S. and D.C.; Investigation, B.M.; Methodology, B.M., Y.S. and D.C.; Software, B.M., Y.S. and D.C.; Supervision, X.Y.; Writing—original draft, B.M. and Y.Y.; Writing—review & editing, B.M. All authors have read and agreed to the published version of the manuscript.
Funding
This work was jointly supported by the Fundamental Research Funds for the Central Universities (N2124005 and N2001020), and the National Natural Science Foundation of China (41871310, 41801249 and 41201359).
Acknowledgments
We would like to acknowledge the anonymous reviewers for their valuable suggestions.
Conflicts of Interest
The authors declare no conflict of interest.
References
- Paniagua, A.; Kammerbauer, J.; Avedillo, M.; Andrews, A.M. Relationship of soil characteristics to vegetation successions on a sequence of degraded and rehabilitated soils in Honduras. Agric. Ecosyst. Environ. 1999, 72, 215–225. [Google Scholar] [CrossRef]
- Zhu, H.H.; He, X.Y.; Wang, K.L.; Su, Y.R.; Wu, J.S. Interactions of vegetation succession, soil bio-chemical properties and microbial communities in a Karst ecosystem. Eur. J. Soil Biol. 2012, 51, 1–7. [Google Scholar] [CrossRef]
- Wan, Q.Z.; Zhu, G.F.; Guo, H.W.; Zhang, Y.; Pan, H.X.; Yong, L.L.; Ma, H.Y. Influence of Vegetation Coverage and Climate Environment on Soil Organic Carbon in the Qilian Mountains. Sci. Rep. 2019, 9, 9. [Google Scholar] [CrossRef] [PubMed]
- Koerner, W.; Dupouey, J.L.; Dambrine, E.; Benoit, M. Influence of past land use on the vegetation and soils of present day forest in the Vosges mountains, France. J. Ecol. 1997, 85, 351–358. [Google Scholar] [CrossRef]
- Zhou, L.M.; Tucker, C.J.; Kaufmann, R.K.; Slayback, D.; Shabanov, N.V.; Myneni, R.B. Variations in northern vegetation activity inferred from satellite data of vegetation index during 1981 to 1999. J. Geophys. Res.-Atmos. 2001, 106, 20069–20083. [Google Scholar] [CrossRef]
- Li, Z.Y.; Ma, Z.W.; van der Kuijp, T.J.; Yuan, Z.W.; Huang, L. A review of soil heavy metal pollution from mines in China: Pollution and health risk assessment. Sci. Total Environ. 2014, 468, 843–853. [Google Scholar] [CrossRef]
- Franks, D.M.; Brereton, D.; Moran, C.J. Managing the cumulative impacts of coal mining on regional communities and environments in Australia. Impact Assess. Proj. Apprais. 2010, 28, 299–312. [Google Scholar] [CrossRef]
- Sinha, S.; Bhattacharya, R.N.; Banerjee, R. Surface iron ore mining in eastern India and local level sustainability. Resour. Policy 2007, 32, 57–68. [Google Scholar] [CrossRef]
- Fan, X.M.; Ren, F.Y.; Xiao, D.; Mao, Y.C. Opencast to underground iron ore mining method. J. Cent. South Univ. 2018, 25, 1813–1824. [Google Scholar] [CrossRef]
- Cheskidov, V.I.; Bobyl’sky, A.S. Technology and Ecology of Dumping at Open Pit Mines in Kuzbass. J. Min. Sci. 2017, 53, 882–889. [Google Scholar] [CrossRef]
- Wu, Z.H.; Lei, S.G.; Lu, Q.Q.; Bian, Z.F. Impacts of Large-Scale Open-Pit Coal Base on the Landscape Ecological Health of Semi-Arid Grasslands. Remote Sens. 2019, 11, 1820. [Google Scholar] [CrossRef] [Green Version]
- Song, J.; Han, C.; Li, P.; Zhang, J.; Liu, D.; Jiang, M.; Zheng, L.; Zhang, J.; Song, J. Quantitative prediction of mining subsidence and its impact on the environment. Int. J. Min. Sci. Technol. 2012, 22, 69–73. [Google Scholar] [CrossRef]
- Olivares, H.G.; Lagos, N.M.; Gutierrez, C.J.; Kittelsen, R.C.; Valenzuela, G.L.; Lillo, M.E.H. Assessment oxidative stress biomarkers and metal bioaccumulation in macroalgae from coastal areas with mining activities in Chile. Environ. Monit. Assess. 2016, 188, 11. [Google Scholar] [CrossRef] [PubMed]
- Kolodziej, B.; Bryk, M.; Otremba, K. Effect of rockwool and lignite dust on physical state of rehabilitated post-mining soil. Soil Tillage Res. 2020, 199, 9. [Google Scholar] [CrossRef]
- Henchiri, M.; Ali, S.; Essifi, B.; Kalisa, W.; Zhang, S.; Bai, Y. Monitoring land cover change detection with NOAA-AVHRR and MODIS remotely sensed data in the North and West of Africa from 1982 to 2015. Environ. Sci. Pollut. Res. 2020, 27, 5873–5889. [Google Scholar] [CrossRef]
- Castillo, J.A.A.; Apan, A.A.; Maraseni, T.N.; Salmo, S.G. Estimation and mapping of above-ground biomass of mangrove forests and their replacement land uses in the Philippines using Sentinel imagery. Isprs J. Photogramm. Remote Sens. 2017, 134, 70–85. [Google Scholar] [CrossRef]
- Lawley, V.; Lewis, M.; Clarke, K.; Ostendorf, B. Site-based and remote sensing methods for monitoring indicators of vegetation condition: An Australian review. Ecol. Indic. 2016, 60, 1273–1283. [Google Scholar] [CrossRef] [Green Version]
- Liang, S. Estimation of land surface biophysical variables. In Quantitative Remote Sensing of Land Surfaces; Kong, J.A., Ed.; John Wiley & Sons: Hoboken, NJ, USA, 2002; pp. 247–264. [Google Scholar]
- Jacquin, A.; Sheeren, D.; Lacombe, J.P. Vegetation cover degradation assessment in Madagascar savanna based on trend analysis of MODIS NDVI time series. Int. J. Appl. Earth Obs. Geoinf. 2010, 12, S3–S10. [Google Scholar] [CrossRef] [Green Version]
- Weiss, J.L.; Gutzler, D.S.; Coonrod, J.E.A.; Dahm, C.N. Long-term vegetation monitoring with NDVI in a diverse semi-arid setting, central New Mexico, USA. J. Arid Environ. 2004, 58, 249–272. [Google Scholar] [CrossRef]
- Hansen, M.C.; Roy, D.P.; Lindquist, E.; Adusei, B.; Justice, C.O.; Altstatt, A. A method for integrating MODIS and Landsat data for systematic monitoring of forest cover and change in the Congo Basin. Remote Sens. Environ. 2008, 112, 2495–2513. [Google Scholar] [CrossRef]
- Wessels, K.J.; Prince, S.D.; Frost, P.E.; van Zyl, D. Assessing the effects of human-induced land degradation in the former homelands of northern South Africa with a 1 km AVHRR NDVI time-series. Remote Sens. Environ. 2004, 91, 47–67. [Google Scholar] [CrossRef]
- Haboudane, D.; Miller, J.R.; Pattey, E.; Zarco-Tejada, P.J.; Strachan, I.B. Hyperspectral vegetation indices and novel algorithms for predicting green LAI of crop canopies: Modeling and validation in the context of precision agriculture. Remote Sens. Environ. 2004, 90, 337–352. [Google Scholar] [CrossRef]
- Bannari, A.; Morin, D.; Bonn, F.; Huete, A.R. A review of vegetation indices. Remote Sens. Rev. 1995, 13, 95–120. [Google Scholar] [CrossRef]
- Fensholt, R.; Sandholt, I.; Rasmussen, M.S. Evaluation of MODIS LAI, fAPAR and the relation between fAPAR and NDVI in a semi-arid environment using in situ measurements. Remote Sens. Environ. 2004, 91, 490–507. [Google Scholar] [CrossRef]
- Olofsson, P.; Eklundh, L. Estimation of absorbed PAR across Scandinavia from satellite measurements. Part II: Modeling and evaluating the fractional absorption. Remote Sens. Environ. 2007, 110, 240–251. [Google Scholar] [CrossRef]
- Huete, A.; Didan, K.; Miura, T.; Rodriguez, E.P.; Gao, X.; Ferreira, L.G. Overview of the radiometric and biophysical performance of the MODIS vegetation indices. Remote Sens. Environ. 2002, 83, 195–213. [Google Scholar] [CrossRef]
- Fensholt, R.; Rasmussen, K.; Nielsen, T.T.; Mbow, C. Evaluation of earth observation based long term vegetation trends—Intercomparing NDVI time series trend analysis consistency of Sahel from AVHRR GIMMS, Terra MODIS and SPOT VGT data. Remote Sens. Environ. 2009, 113, 1886–1898. [Google Scholar] [CrossRef]
- Ma, B.D.; Li, X.X.; Liang, A.M.; Chen, Y.T.; Che, D.F. Experimental and Numerical Investigation of Dustfall Effect on Remote Sensing Retrieval Accuracy of Chlorophyll Content. Sensors 2019, 19, 5530. [Google Scholar] [CrossRef] [PubMed] [Green Version]
- Sun, Y.H.; Ren, H.Z.; Zhang, T.Y.; Zhang, C.Y.; Qin, Q.M. Crop Leaf Area Index Retrieval Based on Inverted Difference Vegetation Index and NDVI. IEEE Geosci. Remote Sens. Lett. 2018, 15, 1662–1666. [Google Scholar] [CrossRef]
- Pinar, A.; Curran, P.J. Grass chlorophyll and the reflectance red edge. Int. J. Remote Sens. 1996, 17, 351–357. [Google Scholar] [CrossRef]
- Jiang, J.B.; Chen, Y.H.; Huang, W.J. Using Hyperspectral Remote Sensing to Estimate Canopy Chlorophyll Density of Wheat under Yellow Rust Stress. Spectrosc. Spectr. Anal. 2010, 30, 2243–2247. [Google Scholar] [CrossRef]
- Zarco-Tejada, P.J.; Hornero, A.; Hernandez-Clemente, R.; Beck, P.S.A. Understanding the temporal dimension of the red-edge spectral region for forest decline detection using high-resolution hyperspectral and Sentinel-2a imagery. Isprs J. Photogramm. Remote Sens. 2018, 137, 134–148. [Google Scholar] [CrossRef] [PubMed]
- Khosravi, V.; Ardejani, F.D.; Gholizadeh, A.; Saberioon, M. Satellite Imagery for Monitoring and Mapping Soil Chromium Pollution in a Mine Waste Dump. Remote Sens. 2021, 13, 1277. [Google Scholar] [CrossRef]
- Seifi, A.; Hosseinjanizadeh, M.; Ranjbar, H.; Honarmand, M. Identification of Acid Mine Drainage Potential Using Sentinel 2a Imagery and Field Data. Mine Water Environ. 2019, 38, 707–717. [Google Scholar] [CrossRef]
- Lobo, F.D.; Souza, P.W.M.; Novo, E.; Carlos, F.M.; Barbosa, C.C.F. Mapping Mining Areas in the Brazilian Amazon Using MSI/Sentinel-2 Imagery (2017). Remote Sens. 2018, 10, 1178. [Google Scholar] [CrossRef] [Green Version]
- Holben, B.N. Characteristics of maximum-value composite images from temporal avhrr data. Int. J. Remote Sens. 1986, 7, 1417–1434. [Google Scholar] [CrossRef]
- Lasaponara, R. On the use of principal component analysis (PCA) for evaluating interannual vegetation anomalies from SPOT/VEGETATION NDVI temporal series. Ecol. Model. 2006, 194, 429–434. [Google Scholar] [CrossRef]
- Liu, S.; Wang, T. Climate change and local adaptation strategies in the middle Inner Mongolia, northern China. Environ. Earth Sci. 2012, 66, 1449–1458. [Google Scholar] [CrossRef]
- Ma, M.; Frank, V. Interannual variability of vegetation cover in the Chinese Heihe river basin and its relation to meteorological parameters. Int. J. Remote Sens. 2006, 27, 3473–3486. [Google Scholar] [CrossRef]
- Song, Y.; Ma, M. Study on vegetation cover Change in Northwest China based on SPOT VEGETATION data. J. Desert Res. 2007, 27, 6. [Google Scholar]
- Su, W.; Zhao, X.F.; Sun, Z.P.; Zhang, M.Z.; Zou, Z.C.; Wang, W.; Shi, Y.L. Estimating the Corn Canopy Chlorophyll Content Using the Sentinel-2A Image. Spectrosc. Spectr. Anal. 2019, 39, 1535–1542. [Google Scholar] [CrossRef]
- Dash, J.; Curran, P.J. The MERIS terrestrial chlorophyll index. Int. J. Remote Sens. 2004, 25, 5403–5413. [Google Scholar] [CrossRef]
- Croft, H.; Chen, J.M.; Wang, R.; Mo, G.; Luo, S.; Luo, X.; He, L.; Gonsamo, A.; Arabian, J.; Zhang, Y.; et al. The global distribution of leaf chlorophyll content. Remote Sens. Environ. 2020, 236, 15. [Google Scholar] [CrossRef]
- du Plessis, W.P. Linear regression relationships between NDVI, vegetation and rainfall in Etosha National Park, Namibia. J. Arid Environ. 1999, 42, 235–260. [Google Scholar] [CrossRef]
- Zhu, J.; Gong, Z.; Li, R.; Wang, Z.; Gao, Q.; Li, P. Study on ecological restoration of magnesite mining area in Liaoning Province. Environ. Prot. Circ. Econ. 2013, 7, 47–51. [Google Scholar]
Figure 1.
The location of six mining areas in Liaoning Province, China: (A) is Anshan mining area, (B) is Benxi mining area, (C) is Diaobingshan mining area, (D) is Fushun mining area, (E) is Fuxin mining area, and (F) is Yingkou mining area. The images are RGB with band 11, 8 and 4 of Sentinel-2A images.

Figure 2.
The trend of vegetation indices over in the entire Liaoning Province and six mining areas from 2000 to 2019.
Figure 2.
The trend of vegetation indices over in the entire Liaoning Province and six mining areas from 2000 to 2019.

Figure 3.
The spatial distribution of pixel-level change trend of vegetation from 2000 to 2019: (A) is Anshan mining area, (B) is Benxi mining area, (C) is Diaobingshan mining area, (D) is Fushun mining area, (E) is Fuxin mining area, and (F) is Yingkou mining area.
Figure 3.
The spatial distribution of pixel-level change trend of vegetation from 2000 to 2019: (A) is Anshan mining area, (B) is Benxi mining area, (C) is Diaobingshan mining area, (D) is Fushun mining area, (E) is Fuxin mining area, and (F) is Yingkou mining area.

Figure 4.
Relationship between VIs and leaf chlorophyll content: (a) is MTCI, and (b) is NDVI.

Figure 5.
Spatial distribution of leaf chlorophyll content in the mining areas: (A) is Anshan mining area, (B) is Diaobingshan mining area, (C) is Benxi mining area, (D) is Fushun mining area, (E) is Fuxin mining area, and (F) is Yingkou mining area.
Figure 5.
Spatial distribution of leaf chlorophyll content in the mining areas: (A) is Anshan mining area, (B) is Diaobingshan mining area, (C) is Benxi mining area, (D) is Fushun mining area, (E) is Fuxin mining area, and (F) is Yingkou mining area.

Figure 6.
Histogram of chlorophyll content pixel for mine and adjacent areas in the mining area.

Figure 7.
Chlorophyll content ratio of mines to adjacent areas in each mining area.

Figure 8.
Vegetation improvement in open-pit mines based on MODIS NDVI and GeoEye image: (a) is in Anshan area, (b) is in Fushun area, and (c) is in Fuxin area.
Figure 8.
Vegetation improvement in open-pit mines based on MODIS NDVI and GeoEye image: (a) is in Anshan area, (b) is in Fushun area, and (c) is in Fuxin area.

Figure 9.
Environmental pollution in mining areas: (a) is water pollution, and (b) is dust pollution.
Figure 9.
Environmental pollution in mining areas: (a) is water pollution, and (b) is dust pollution.


Table 1.
The mine type and mining method used in six mining areas in Liaoning Province.
| Mining Area | Mine Type | Mining Method | Alphabet Code |
|---|---|---|---|
| Anshan | Iron | Open pit | A |
| Benxi | Iron | Open pit | B |
| Diaobingshan | Coal | Underground | C |
| Fushun | Coal | Open pit | D |
| Fuxin | Coal | Open pit | E |
| Yingkou | Magnesite | Open pit | F |
Table 2.
Gradation for the changing trend of NDVI.
| Slope of the Fitted Line of Yearly NDVI | Changing Trend |
|---|---|
| <−0.01 | Greatly degraded |
| −0.01~−0.005 | Moderately degraded |
| −0.005~−0.001 | Slightly degraded |
| −0.001~0.001 | Unchanged |
| 0.001~0.005 | Slightly improved |
| 0.005~0.01 | Moderately improved |
| >0.01 | Greatly improved |
Table 3.
The pixel-level change trend of vegetation from 2000 to 2019.
| Area | Fitted Slope | Coefficient of Determination | NDVImax | NDVImin | Greatly Improved (km2) | Greatly Degraded (km2) |
|---|---|---|---|---|---|---|
| Liaoning province | 0.0037/y | 0.854 *** | 0.6580 | 0.575 | / | / |
| Anshan | 0.0021/y | 0.296 ** | 0.558 | 0.471 | 21.571 | 16.783 |
| Benxi | 0.0016/y | 0.214 ** | 0.667 | 0.608 | 0.741 | 22.083 |
| Diaobingshan | 0.0031/y | 0.364 *** | 0.596 | 0.482 | 0.824 | 1.479 |
| Fushun | 0.0024/y | 0.591 *** | 0.515 | 0.449 | 20.489 | 7.126 |
| Fuxin | 0.0029/y | 0.276 ** | 0.462 | 0.351 | 16.098 | 5.997 |
| Yingkou | 0.0006/y | 0.066 | 0.579 | 0.531 | 2.136 | 23.203 |
* p < 0.1, ** p < 0.05, *** p < 0.01.
Table 4.
Correlation between precipitation and annual maximum NDVI in different mining areas.
| Mining Area | Correlation Coefficient between Precipitation and NDVI | Correlation Coefficient between Temperature and NDVI |
|---|---|---|
| Liaoning province | 0.420 * | −0.014 |
| Anshan | 0.208 | 0.136 |
| Benxi | −0.070 | 0.376 |
| Diaobingshan | 0.464 ** | −0.427 |
| Fushun | 0.320 | 0.042 |
| Fuxin | 0.686 *** | −0.445 |
| Yingkou | −0.186 | 0.118 |
* p < 0.1, ** p < 0.05, *** p < 0.01.
Publisher’s Note: MDPI stays neutral with regard to jurisdictional claims in published maps and institutional affiliations. |
© 2021 by the authors. Licensee MDPI, Basel, Switzerland. This article is an open access article distributed under the terms and conditions of the Creative Commons Attribution (CC BY) license (https://creativecommons.org/licenses/by/4.0/).
Share and Cite
MDPI and ACS Style
Ma, B.; Yang, X.; Yu, Y.; Shu, Y.; Che, D. Investigation of Vegetation Changes in Different Mining Areas in Liaoning Province, China, Using Multisource Remote Sensing Data. Remote Sens. 2021, 13, 5168. https://doi.org/10.3390/rs13245168
AMA Style
Ma B, Yang X, Yu Y, Shu Y, Che D. Investigation of Vegetation Changes in Different Mining Areas in Liaoning Province, China, Using Multisource Remote Sensing Data. Remote Sensing. 2021; 13(24):5168. https://doi.org/10.3390/rs13245168
Chicago/Turabian StyleMa, Baodong, Xiangru Yang, Yajiao Yu, Yang Shu, and Defu Che. 2021. "Investigation of Vegetation Changes in Different Mining Areas in Liaoning Province, China, Using Multisource Remote Sensing Data" Remote Sensing 13, no. 24: 5168. https://doi.org/10.3390/rs13245168
Note that from the first issue of 2016, this journal uses article numbers instead of page numbers. See further details here.